Attached files
| file | filename |
|---|---|
| EX-99.1 - EX-99.1 - REALTY INCOME CORP | a16-20290_1ex99d1.htm |
| 8-K - 8-K - REALTY INCOME CORP | a16-20290_18k.htm |
SUPPLEMENTAL OPERATING & FINANCIAL DATA Q3 2016 an S&P 500 company S&P High Yield Dividend Aristocrats® index member Exhibit 99.2
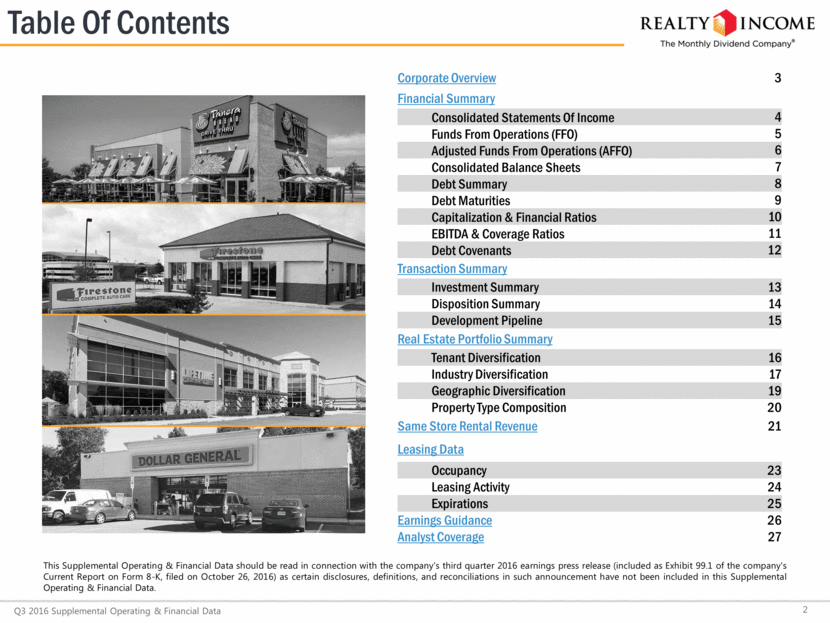
Corporate Overview 3 Financial Summary Consolidated Statements Of Income 4 Funds From Operations (FFO) 5 Adjusted Funds From Operations (AFFO) 6 Consolidated Balance Sheets 7 Debt Summary 8 Debt Maturities 9 Capitalization & Financial Ratios 10 EBITDA & Coverage Ratios 11 Debt Covenants 12 Transaction Summary Investment Summary 13 Disposition Summary 14 Development Pipeline 15 Real Estate Portfolio Summary Tenant Diversification 16 Industry Diversification 17 Geographic Diversification 19 Property Type Composition 20 Same Store Rental Revenue 21 Leasing Data Occupancy 23 Leasing Activity 24 Expirations 25 Earnings Guidance 26 Analyst Coverage 27 Table Of Contents 2 Q3 2016 Supplemental Operating & Financial Data This Supplemental Operating & Financial Data should be read in connection with the company's third quarter 2016 earnings press release (included as Exhibit 99.1 of the company's Current Report on Form 8-K, filed on October 26, 2016) as certain disclosures, definitions, and reconciliations in such announcement have not been included in this Supplemental Operating & Financial Data.
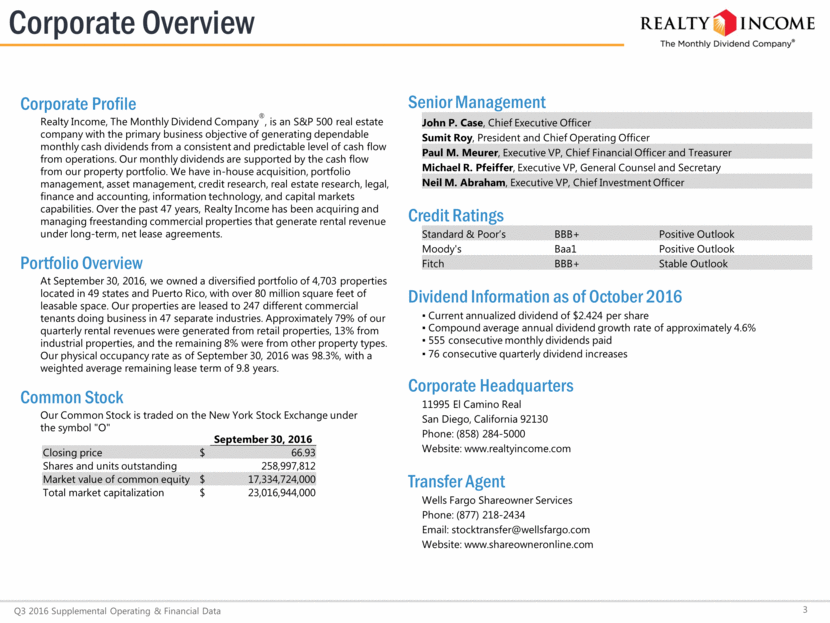
Senior Management John P. Case, Chief Executive Officer Sumit Roy, President and Chief Operating Officer Paul M. Meurer, Executive VP, Chief Financial Officer and Treasurer Michael R. Pfeiffer, Executive VP, General Counsel and Secretary Neil M. Abraham, Executive VP, Chief Investment Officer Credit Ratings Standard & Poor’s BBB+ Positive Outlook Moody's Baa1 Positive Outlook Fitch BBB+ Stable Outlook Dividend Information as of October 2016 · Current annualized dividend of $2.424 per share · Compound average annual dividend growth rate of approximately 4.7% · 555 consecutive monthly dividends paid · 76 consecutive quarterly dividend increases Corporate Headquarters 11995 El Camino Real San Diego, California 92130 Phone: (858) 284-5000 Website: www.realtyincome.com Transfer Agent Wells Fargo Shareowner Services Phone: (877) 218-2434 Email: stocktransfer@wellsfargo.com Website: www.shareowneronline.com Corporate Profile Realty Income, The Monthly Dividend Company®, is an S&P 500 real estate company with the primary business objective of generating dependable monthly cash dividends from a consistent and predictable level of cash flow from operations. Our monthly dividends are supported by the cash flow from our property portfolio. We have in-house acquisition, portfolio management, asset management, credit research, real estate research, legal, finance and accounting, information technology, and capital markets capabilities. Over the past 47 years, Realty Income has been acquiring and managing freestanding commercial properties that generate rental revenue under long-term, net lease agreements. Portfolio Overview At September 30, 2016, we owned a diversified portfolio of 4,703 properties located in 49 states and Puerto Rico, with over 80 million square feet of leasable space. Our properties are leased to 247 different commercial tenants doing business in 47 separate industries. Approximately 79% of our quarterly rental revenues were generated from retail properties, 13% from industrial properties, and the remaining 8% were from other property types. Our physical occupancy rate as of September 30, 2016 was 98.3%, with a weighted average remaining lease term of 9.8 years. Common Stock Our Common Stock is traded on the New York Stock Exchange under the symbol "O" Corporate Overview 3 Q3 2016 Supplemental Operating & Financial Data September 30, 2016 Closing price $ 66.93 Shares and units outstanding 258,997,812 Market value of common equity $ 17,334,724,000 Total market capitalization $ 23,016,944,000
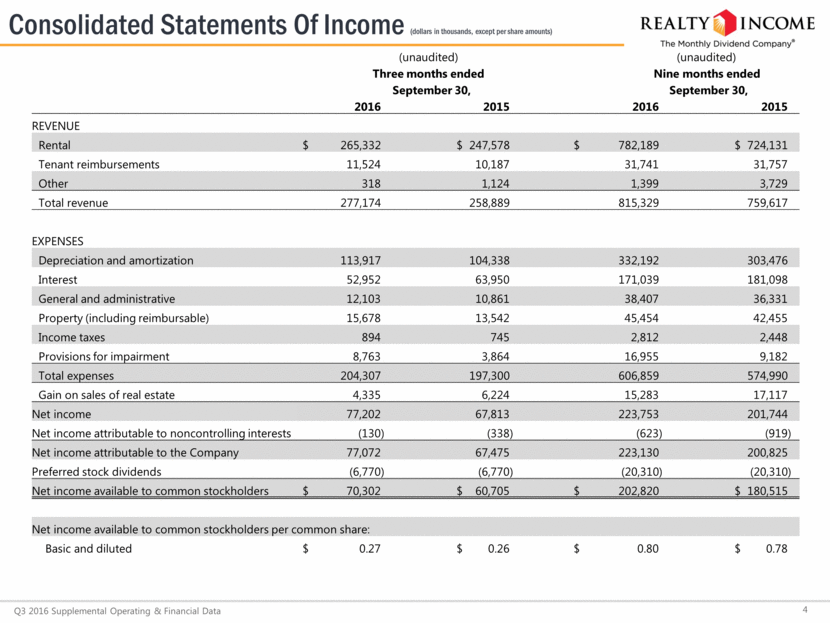
Consolidated Statements Of Income (dollars in thousands, except per share amounts) 4 Q3 2016 Supplemental Operating & Financial Data (unaudited) (unaudited) Three months ended Nine months ended September 30, September 30, 2016 2015 2016 2015 REVENUE Rental $ 265,332 $ 247,578 $ 782,189 $ 724,131 Tenant reimbursements 11,524 10,187 31,741 31,757 Other 318 1,124 1,399 3,729 Total revenue 277,174 258,889 815,329 759,617 EXPENSES Depreciation and amortization 113,917 104,338 332,192 303,476 Interest 52,952 63,950 171,039 181,098 General and administrative 12,103 10,861 38,407 36,331 Property (including reimbursable) 15,678 13,542 45,454 42,455 Income taxes 894 745 2,812 2,448 Provisions for impairment 8,763 3,864 16,955 9,182 Total expenses 204,307 197,300 606,859 574,990 Gain on sales of real estate 4,335 6,224 15,283 17,117 Net income 77,202 67,813 223,753 201,744 Net income attributable to noncontrolling interests (130 ) (338 ) (623 ) (919 ) Net income attributable to the Company 77,072 67,475 223,130 200,825 Preferred stock dividends (6,770 ) (6,770 ) (20,310 ) (20,310 ) Net income available to common stockholders $ 70,302 $ 60,705 $ 202,820 $ 180,515 Net income available to common stockholders per common share: Basic and diluted $ 0.27 $ 0.26 $ 0.80 $ 0.78
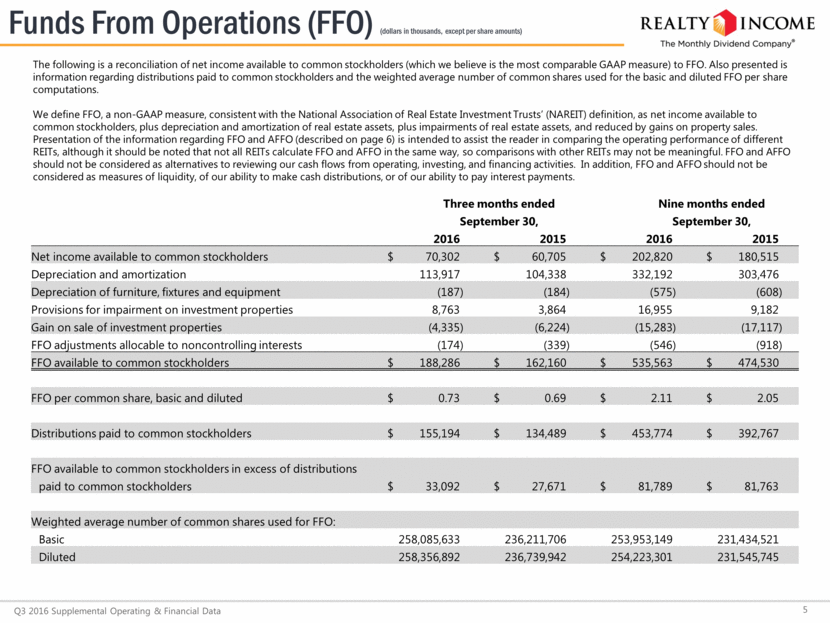
Funds From Operations (FFO) (dollars in thousands, except per share amounts) 5 Q3 2016 Supplemental Operating & Financial Data The following is a reconciliation of net income available to common stockholders (which we believe is the most comparable GAAP measure) to FFO. Also presented is information regarding distributions paid to common stockholders and the weighted average number of common shares used for the basic and diluted FFO per share computations. We define FFO, a non-GAAP measure, consistent with the National Association of Real Estate Investment Trusts’ (NAREIT) definition, as net income available to common stockholders, plus depreciation and amortization of real estate assets, plus impairments of real estate assets, and reduced by gains on property sales. Presentation of the information regarding FFO and AFFO (described on page 6) is intended to assist the reader in comparing the operating performance of different REITs, although it should be noted that not all REITs calculate FFO and AFFO in the same way, so comparisons with other REITs may not be meaningful. FFO and AFFO should not be considered as alternatives to reviewing our cash flows from operating, investing, and financing activities. In addition, FFO and AFFO should not be considered as measures of liquidity, of our ability to make cash distributions, or of our ability to pay interest payments. Three months ended Nine months ended September 30, September 30, 2016 2015 2016 2015 Net income available to common stockholders $ 70,302 $ 60,705 $ 202,820 $ 180,515 Depreciation and amortization 113,917 104,338 332,192 303,476 Depreciation of furniture, fixtures and equipment (187 ) (184 ) (575 ) (608 ) Provisions for impairment on investment properties 8,763 3,864 16,955 9,182 Gain on sale of investment properties (4,335 ) (6,224 ) (15,283 ) (17,117 ) FFO adjustments allocable to noncontrolling interests (174 ) (339 ) (546 ) (918 ) FFO available to common stockholders $ 188,286 $ 162,160 $ 535,563 $ 474,530 FFO per common share, basic and diluted $ 0.73 $ 0.69 $ 2.11 $ 2.05 Distributions paid to common stockholders $ 155,194 $ 134,489 $ 453,774 $ 392,767 FFO available to common stockholders in excess of distributions paid to common stockholders $ 33,092 $ 27,671 $ 81,789 $ 81,763 Weighted average number of common shares used for FFO: Basic 258,085,633 236,211,706 253,953,149 231,434,521 Diluted 258,356,892 236,739,942 254,223,301 231,545,745
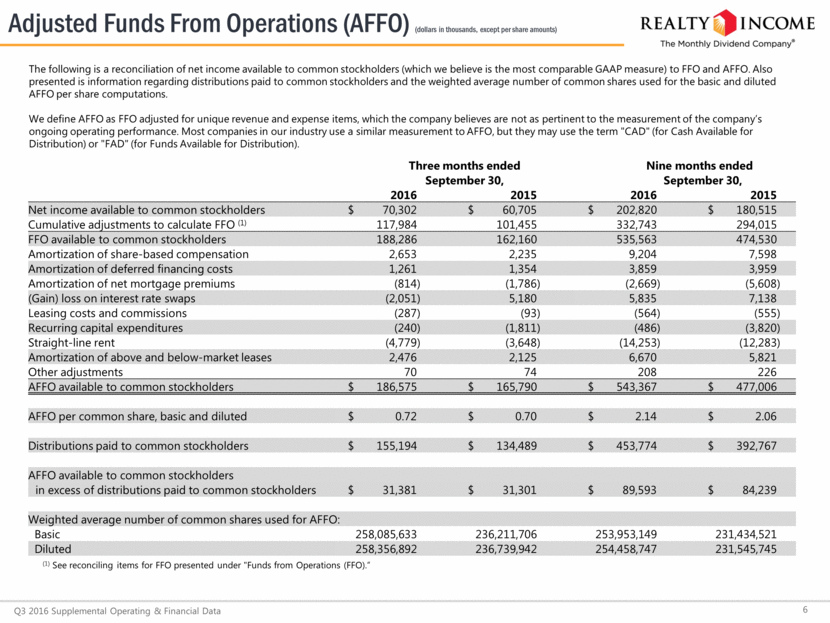
Adjusted Funds From Operations (AFFO) (dollars in thousands, except per share amounts) 6 Q3 2016 Supplemental Operating & Financial Data The following is a reconciliation of net income available to common stockholders (which we believe is the most comparable GAAP measure) to FFO and AFFO. Also presented is information regarding distributions paid to common stockholders and the weighted average number of common shares used for the basic and diluted AFFO per share computations. We define AFFO as FFO adjusted for unique revenue and expense items, which the company believes are not as pertinent to the measurement of the company’s ongoing operating performance. Most companies in our industry use a similar measurement to AFFO, but they may use the term "CAD" (for Cash Available for Distribution) or "FAD" (for Funds Available for Distribution). Three months ended Nine months ended September 30, September 30, 2016 2015 2016 2015 Net income available to common stockholders $ 70,302 $ 60,705 $ 202,820 $ 180,515 Cumulative adjustments to calculate FFO (1) 117,984 101,455 332,743 294,015 FFO available to common stockholders 188,286 162,160 535,563 474,530 Amortization of share-based compensation 2,653 2,235 9,204 7,598 Amortization of deferred financing costs 1,261 1,354 3,859 3,959 Amortization of net mortgage premiums (814 ) (1,786 ) (2,669 ) (5,608 ) (Gain) loss on interest rate swaps (2,051 ) 5,180 5,835 7,138 Leasing costs and commissions (287 ) (93 ) (564 ) (555 ) Recurring capital expenditures (240 ) (1,811 ) (486 ) (3,820 ) Straight-line rent (4,779 ) (3,648 ) (14,253 ) (12,283 ) Amortization of above and below-market leases 2,476 2,125 6,670 5,821 Other adjustments 70 74 208 226 AFFO available to common stockholders $ 186,575 $ 165,790 $ 543,367 $ 477,006 AFFO per common share, basic and diluted $ 0.72 $ 0.70 $ 2.14 $ 2.06 Distributions paid to common stockholders $ 155,194 $ 134,489 $ 453,774 $ 392,767 AFFO available to common stockholders in excess of distributions paid to common stockholders $ 31,381 $ 31,301 $ 89,593 $ 84,239 Weighted average number of common shares used for AFFO: Basic 258,085,633 236,211,706 253,953,149 231,434,521 Diluted 258,356,892 236,739,942 254,458,747 231,545,745 (1) See reconciling items for FFO presented under "Funds from Operations (FFO).”
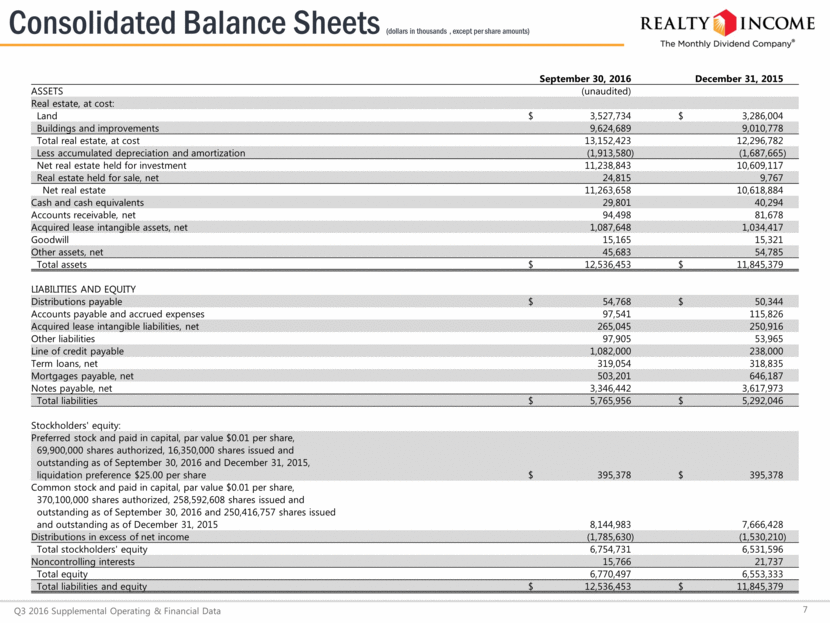
Consolidated Balance Sheets (dollars in thousands , except per share amounts) 7 Q3 2016 Supplemental Operating & Financial Data September 30, 2016 December 31, 2015 ASSETS (unaudited) Real estate, at cost: Land $ 3,527,734 $ 3,286,004 Buildings and improvements 9,624,689 9,010,778 Total real estate, at cost 13,152,423 12,296,782 Less accumulated depreciation and amortization (1,913,580 ) (1,687,665 ) Net real estate held for investment 11,238,843 10,609,117 Real estate held for sale, net 24,815 9,767 Net real estate 11,263,658 10,618,884 Cash and cash equivalents 29,801 40,294 Accounts receivable, net 94,498 81,678 Acquired lease intangible assets, net 1,087,648 1,034,417 Goodwill 15,165 15,321 Other assets, net 45,683 54,785 Total assets $ 12,536,453 $ 11,845,379 LIABILITIES AND EQUITY Distributions payable $ 54,768 $ 50,344 Accounts payable and accrued expenses 97,541 115,826 Acquired lease intangible liabilities, net 265,045 250,916 Other liabilities 97,905 53,965 Line of credit payable 1,082,000 238,000 Term loans, net 319,054 318,835 Mortgages payable, net 503,201 646,187 Notes payable, net 3,346,442 3,617,973 Total liabilities $ 5,765,956 $ 5,292,046 Stockholders' equity: Preferred stock and paid in capital, par value $0.01 per share, 69,900,000 shares authorized, 16,350,000 shares issued and $ 395,378 $ 395,378 outstanding as of September 30, 2016 and December 31, 2015, liquidation preference $25.00 per share Common stock and paid in capital, par value $0.01 per share, 370,100,000 shares authorized, 258,592,608 shares issued and outstanding as of September 30, 2016 and 250,416,757 shares issued and outstanding as of December 31, 2015 8,144,983 7,666,428 Distributions in excess of net income (1,785,630 ) (1,530,210 ) Total stockholders' equity 6,754,731 6,531,596 Noncontrolling interests 15,766 21,737 Total equity 6,770,497 6,553,333 Total liabilities and equity $ 12,536,453 $ 11,845,379
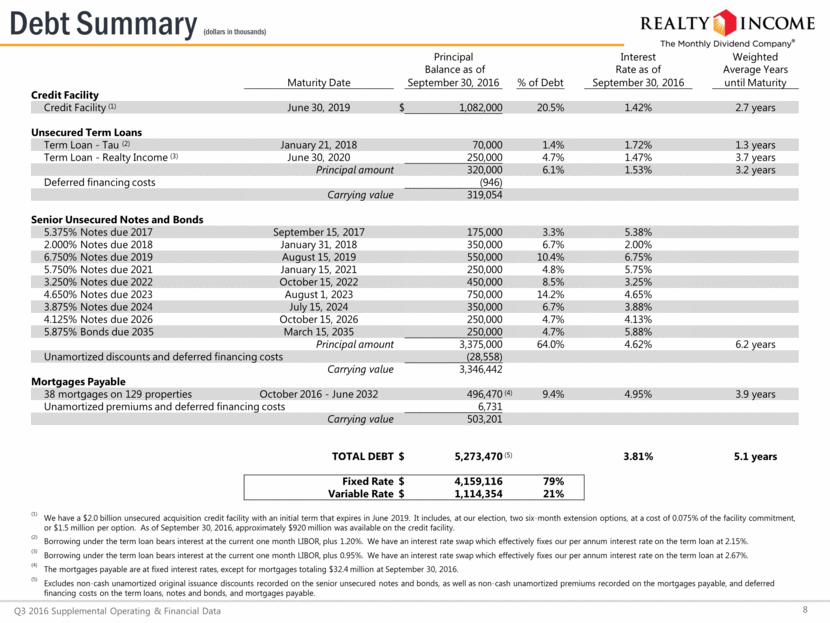
Debt Summary (dollars in thousands) 8 Q3 2016 Supplemental Operating & Financial Data Principal Interest Weighted Balance as of Rate as of Average Years Maturity Date September 30, 2016 % of Debt September 30, 2016 until Maturity Credit Facility Credit Facility (1) June 30, 2019 $ 1,082,000 20.5% 1.42% 2.7 years Unsecured Term Loans Term Loan - Tau (2) January 21, 2018 70,000 1.4% 1.72% 1.3 years Term Loan - Realty Income (3) June 30, 2020 250,000 4.7% 1.47% 3.7 years Principal amount 320,000 6.1% 1.53% 3.2 years Deferred financing costs (946) Carrying value 319,054 Senior Unsecured Notes and Bonds 5.375% Notes due 2017 September 15, 2017 175,000 3.3% 5.38% 2.000% Notes due 2018 January 31, 2018 350,000 6.7% 2.00% 6.750% Notes due 2019 August 15, 2019 550,000 10.4% 6.75% 5.750% Notes due 2021 January 15, 2021 250,000 4.8% 5.75% 3.250% Notes due 2022 October 15, 2022 450,000 8.5% 3.25% 4.650% Notes due 2023 August 1, 2023 750,000 14.2% 4.65% 3.875% Notes due 2024 July 15, 2024 350,000 6.7% 3.88% 4.125% Notes due 2026 October 15, 2026 250,000 4.7% 4.13% 5.875% Bonds due 2035 March 15, 2035 250,000 4.7% 5.88% Principal amount 3,375,000 64.0% 4.62% 6.2 years Unamortized discounts and deferred financing costs (28,558) Carrying value 3,346,442 Mortgages Payable 38 mortgages on 129 properties October 2016 - June 2032 496,470 (4) 9.4% 4.95% 3.9 years Unamortized premiums and deferred financing costs 6,731 Carrying value 503,201 TOTAL DEBT $ 5,273,470 (5) 3.81% 5.1 years Fixed Rate $ 4,159,116 79% Variable Rate $ 1,114,354 21% (1) We have a $2.0 billion unsecured acquisition credit facility with an initial term that expires in June 2019. It includes, at our election, two six-month extension options, at a cost of 0.075% of the facility commitment, or $1.5 million per option. As of September 30, 2016, approximately $0.92 billion was available on the credit facility. (2) Borrowing under the term loan bears interest at the current one month LIBOR, plus 1.20%. We have an interest rate swap which effectively fixes our per annum interest rate on the term loan at 2.15%. (3) Borrowing under the term loan bears interest at the current one month LIBOR, plus 0.95%. We have an interest rate swap which effectively fixes our per annum interest rate on the term loan at 2.67%. (4) The mortgages payable are at fixed interest rates, except for mortgages totaling $32.4 million at September 30, 2016. (5) Excludes non-cash unamortized original issuance discounts recorded on the senior unsecured notes and bonds, as well as non-cash unamortized premiums recorded on the mortgages payable, and deferred financing costs on the term loans, notes and bonds, and mortgages payable.
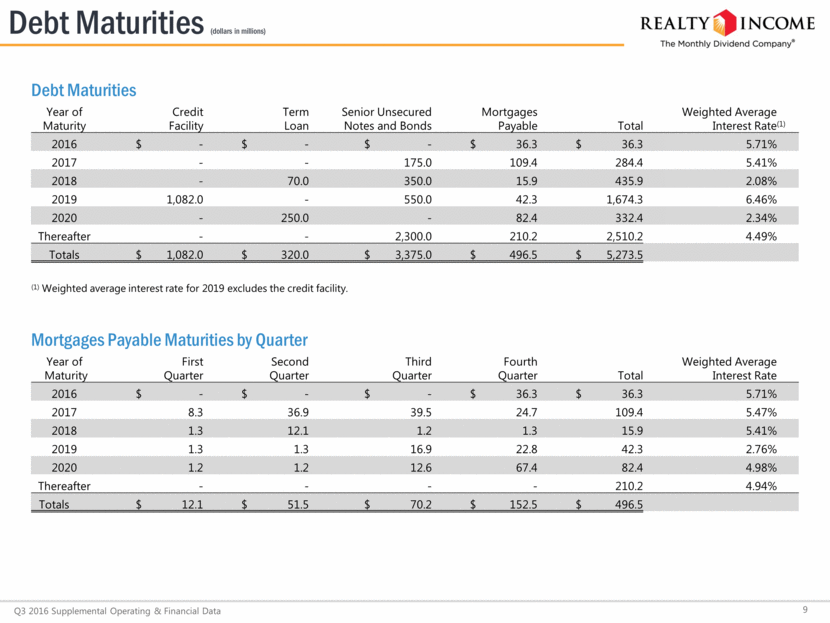
Debt Maturities (dollars in millions) 9 Q3 2016 Supplemental Operating & Financial Data Debt Maturities Year of Credit Term Senior Unsecured Mortgages Weighted Average Maturity Facility Loan Notes and Bonds Payable Total Interest Rate (1) 2016 $ - $ - $ - $ 36.3 $ 36.3 5.71% 2017 - - 175.0 109.4 284.4 5.41% 2018 - 70.0 350.0 15.9 435.9 2.08% 2019 1,082.0 - 550.0 42.3 1,674.3 6.46% 2020 - 250.0 - 82.4 332.4 2.34% Thereafter - - 2,300.0 210.2 2,510.2 4.49% Totals $ 1,082.0 $ 320.0 $ 3,375.0 $ 496.5 $ 5,273.5 (1) Weighted average interest rate for 2019 excludes the credit facility. Mortgages Payable Maturities by Quarter Year of First Second Third Fourth Weighted Average Maturity Quarter Quarter Quarter Quarter Total Interest Rate 2016 $ - $ - $ - $ 36.3 $ 36.3 5.71% 2017 8.3 36.9 39.5 24.7 109.4 5.47% 2018 1.3 12.1 1.3 1.2 15.9 5.41% 2019 1.3 1.3 16.9 22.8 42.3 2.76% 2020 1.2 1.2 12.6 67.4 82.4 4.98% Thereafter - - - - 210.2 4.94% Totals $ 12.1 $ 51.5 $ 70.3 $ 152.4 $ 496.5
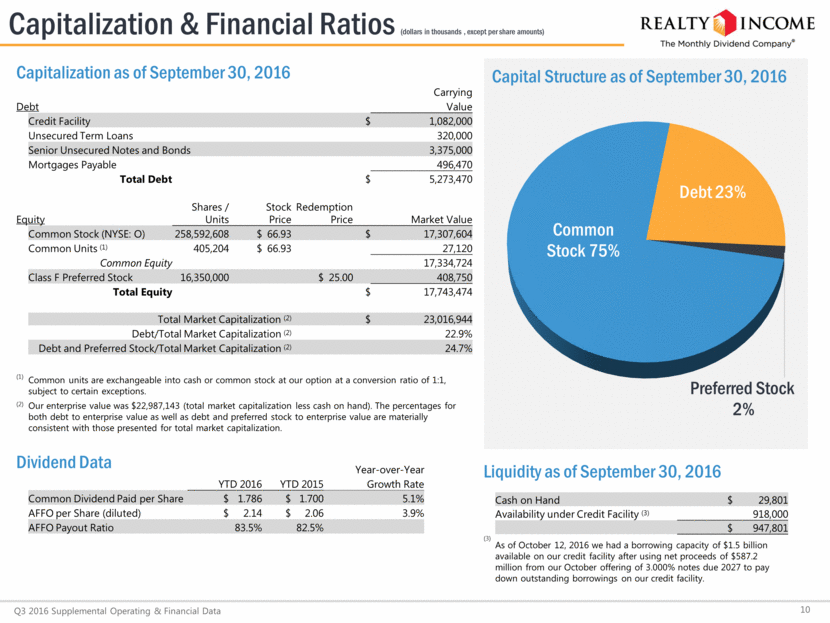
Capital Structure as of September 30, 2016 Capitalization & Financial Ratios (dollars in thousands , except per share amounts) 10 Q3 2016 Supplemental Operating & Financial Data Liquidity as of September 30, 2016 Cash on Hand $ 29,801 Availability under Credit Facility (3) 918,000 $ 947,801 (3) As of October 12, 2016 we had a borrowing capacity of $1.5 billion available on our credit facility after using net proceeds of $587.2 million from our October offering of 3.000% notes due 2027 to pay down outstanding borrowings on our credit facility. Capitalization as of September 30, 2016 Carrying Debt Value Credit Facility $ 1,082,000 Unsecured Term Loans 320,000 Senior Unsecured Notes and Bonds 3,375,000 Mortgages Payable 496,470 Total Debt $ 5,273,470 Equity Shares / Units Stock Price Redemption Price Market Value Common Stock (NYSE: O) 258,592,608 $ 66.93 $ 17,307,604 Common Units (1) 405,204 $ 66.93 27,120 Common Equity 17,334,724 Class F Preferred Stock 16,350,000 $ 25.00 408,750 Total Equity $ 17,743,474 Total Market Capitalization (2) $ 23,016,944 Debt/Total Market Capitalization (2) 22.9% Debt and Preferred Stock/Total Market Capitalization (2) 24.7% (1) Common units are exchangeable into cash or common stock at our option at a conversion ratio of 1:1, subject to certain exceptions. (2) Our enterprise value was $22,987,143 (total market capitalization less cash on hand). The percentages for both debt to enterprise value as well as debt and preferred stock to enterprise value are materially consistent with those presented for total market capitalization. Dividend Data Year-over-Year YTD 2016 YTD 2015 Growth Rate Common Dividend Paid per Share $ 1.786 $ 1.700 5.1% AFFO per Share (diluted) $ 2.14 $ 2.06 3.9% AFFO Payout Ratio 83.5% 82.5% Debt 23% Preferred Stock 2% Common Stock 75%
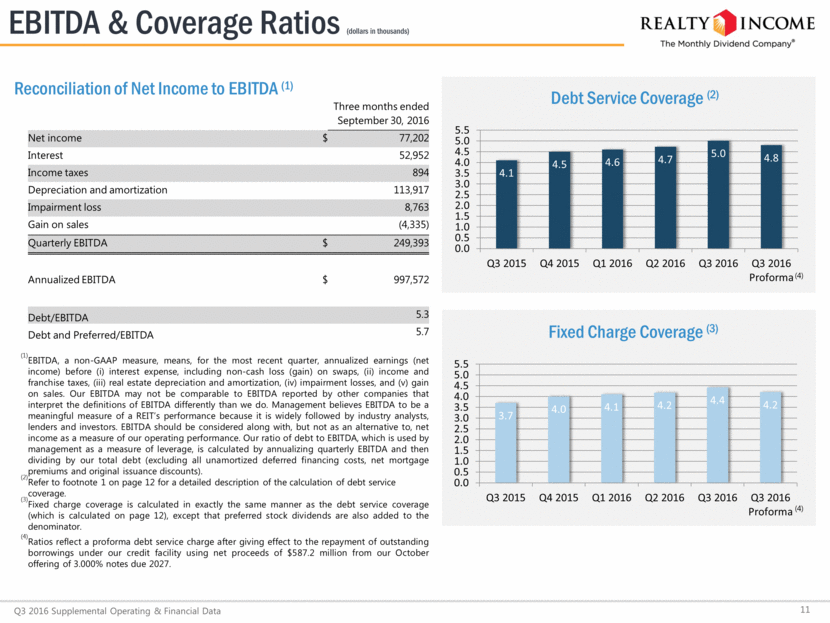
Debt Service Coverage (2) Fixed Charge Coverage (3) EBITDA & Coverage Ratios (dollars in thousands) 11 Q3 2016 Supplemental Operating & Financial Data Reconciliation of Net Income to EBITDA (1) Three months ended September 30, 2016 Net income $ 77,202 Interest 52,952 Income taxes 894 Depreciation and amortization 113,917 Impairment loss 8,763 Gain on sales (4,335) Quarterly EBITDA $ 249,393 Annualized EBITDA $ 997,572 Debt/EBITDA 5.3 Debt and Preferred/EBITDA 5.7 (1) EBITDA, a non-GAAP measure, means, for the most recent quarter, annualized earnings (net income) before (i) interest expense, including non-cash loss (gain) on swaps, (ii) income and franchise taxes, (iii) real estate depreciation and amortization, (iv) impairment losses, and (v) gain on sales. Our EBITDA may not be comparable to EBITDA reported by other companies that interpret the definitions of EBITDA differently than we do. Management believes EBITDA to be a meaningful measure of a REIT’s performance because it is widely followed by industry analysts, lenders and investors. EBITDA should be considered along with, but not as an alternative to, net income as a measure of our operating performance. Our ratio of debt to EBITDA, which is used by management as a measure of leverage, is calculated by annualizing quarterly EBITDA and then dividing by our total debt (excluding all unamortized deferred financing costs, net mortgage premiums and original issuance discounts). (2) Refer to footnote 1 on page 12 for a detailed description of the calculation of debt service coverage. (3) Fixed charge coverage is calculated in exactly the same manner as the debt service coverage (which is calculated on page 12), except that preferred stock dividends are also added to the denominator. (4) Ratios reflect a proforma debt service charge after giving effect to the repayment of outstanding borrowings under our credit facility using net proceeds of $587.2 million from our October offering of 3.000% notes due 2027. (4) (4) 3.7 4.0 4.1 4.2 4.4 4.2 0.0 0.5 1.0 1.5 2.0 2.5 3.0 3.5 4.0 4.5 5.0 5.5 Q3 2015 Q4 2015 Q1 2016 Q2 2016 Q3 2016 Q3 2016 Proforma 4.1 4.5 4.6 4.7 5.0 4.8 0.0 0.5 1.0 1.5 2.0 2.5 3.0 3.5 4.0 4.5 5.0 5.5 Q3 2015 Q4 2015 Q1 2016 Q2 2016 Q3 2016 Q3 2016 Proforma
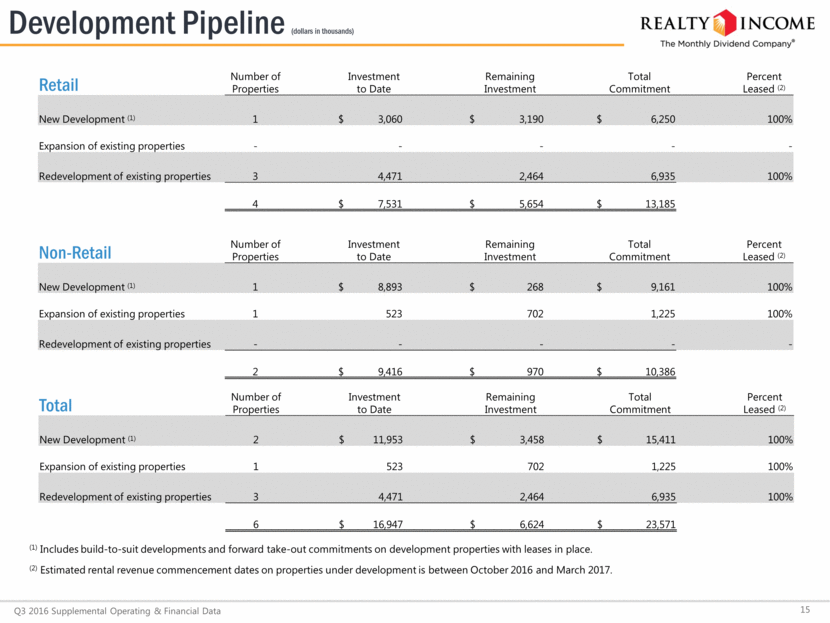
Debt Covenants 12 Q3 2016 Supplemental Operating & Financial Data As of September 30, 2016 The following is a summary of the key financial covenants for our senior unsecured notes and bonds, as defined and calculated per their terms. These calculations, which are not based on U.S. GAAP measurements, are presented to investors to show our ability to incur additional debt under the terms of our senior unsecured notes and bonds as well as to disclose our current compliance with such covenants, and are not measures of our liquidity or performance. Required Actuals Limitation on incurrence of total debt < 60% of adjusted undepreciated assets 39.6% Limitation on incurrence of secured debt < 40% of adjusted undepreciated assets 3.8% Debt service coverage (trailing 12 months) (1) > 1.5 x 5.0x Maintenance of total unencumbered assets > 150% of unsecured debt 260.3% (1) This covenant is calculated on a pro forma basis for the preceding four-quarter period on the assumptions that: (i) the incurrence of any Debt (as defined in the covenants) incurred by us since the first day of such four-quarter period and the application of the proceeds therefrom (including to refinance other Debt since the first day of such four quarter period), (ii) the repayment or retirement of any of our Debt since the first day of such four-quarter period, and (iii) any acquisition or disposition by us of any asset or group since the first day of such four quarters had in each case occurred on October 1, 2015, and subject to certain additional adjustments. Such pro forma ratio has been prepared on the basis required by that debt service covenant, reflects various estimates and assumptions and is subject to other uncertainties, and therefore does not purport to reflect what our actual debt service coverage ratio would have been had transactions referred to in clauses (i), (ii) and (iii) of the preceding sentence occurred as of October 1, 2015, nor does it purport to reflect our debt service coverage ratio for any future period.
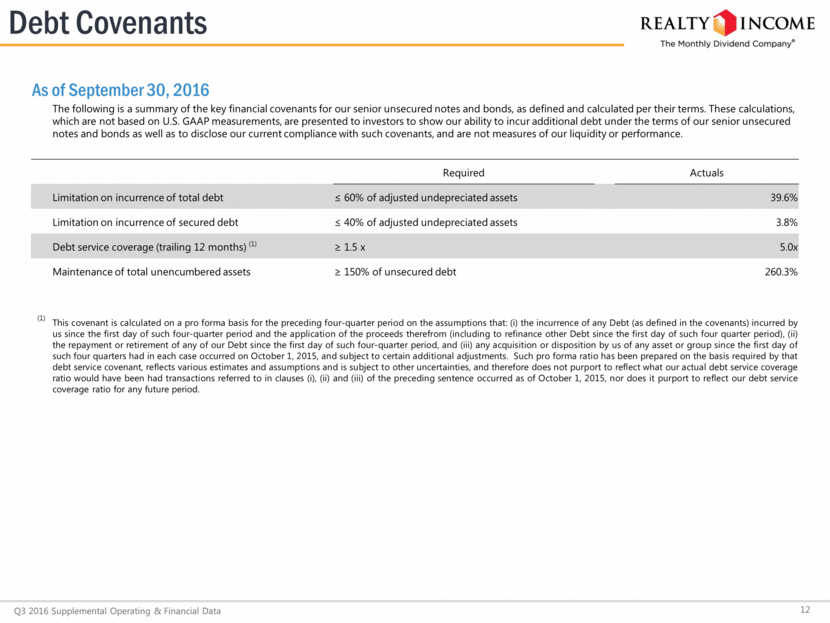
First Quarter 2016 Number of Properties Investment Cash Rents Leasable Square Feet Cash Capitalization Rate (1) Weighted Average Lease Term (Years) New Property Acquisitions (2) 80 $ 300,523 $ 19,708 877,997 6.6% 16.3 Properties under Development (3) 23 52,118 3,547 853,273 6.8% 13.1 Total Real Estate Investments 103 $ 352,641 $ 23,255 1,731,270 6.6% 15.8 Approximately 23% of the annualized revenue generated by these investments is from investment grade tenants(4) (1) Cash capitalization rates are computed as contractual cash net operating income for the first twelve months following the acquisition date, divided by the total cost of the property (including all expenses borne by Realty Income). (2) The new property acquisitions were completed through 19 independent transactions during the first quarter of 2016, 22 independent transactions during the second quarter of 2016, and 20 independent transactions during the third quarter of 2016. (3) Includes investments during the period in new development, expansion of existing properties, and redevelopment of existing properties. Cash rents noted reflect total cash rents to be received on this investment amount upon completion of the properties under development. (4) Refer to footnote 2 on page 16 for our definition of investment grade tenants. Investment Summary (dollars in thousands) 13 Q3 2016 Supplemental Operating & Financial Data Second Quarter 2016 Number of Properties Investment Cash Rents Leasable Square Feet Cash Capitalization Rate (1) Weighted Average Lease Term (Years) New Property Acquisitions (2) 46 $ 300,715 $ 18,804 1,662,248 6.3% 13.5 Properties under Development (3) 11 9,574 840 69,508 8.8% 13.4 Total Real Estate Investments 57 $ 310,289 $ 19,644 1,731,756 6.3% 13.5 Approximately 58% of the annualized revenue generated by these investments is from investment grade tenants(4) Year-to-Date 2016 Number of Properties Investment Cash Rents Leasable Square Feet Cash Capitalization Rate (1) Weighted Average Lease Term (Years) New Property Acquisitions (2) 206 $ 985,420 $ 62,306 3,909,887 6.3% 15.2 Properties under Development (3) 30 87,724 6,254 1,339,227 7.1% 13.6 Total Real Estate Investments 236 $ 1,073,144 $ 68,560 5,249,114 6.4% 15.0 Approximately 51% of the annualized revenue generated by these investments is from investment grade tenants(4) Third Quarter 2016 Number of Properties Investment Cash Rents Leasable Square Feet Cash Capitalization Rate (1) Weighted Average Lease Term (Years) New Property Acquisitions (2) 80 $ 384,182 $ 23,794 1,369,642 6.2% 15.5 Properties under Development (3) 13 26,032 1,867 416,446 7.2% 14.4 Total Real Estate Investments 93 $ 410,214 $ 25,661 1,786,088 6.3% 15.4 Approximately 69% of the annualized revenue generated by these investments is from investment grade tenants(4)
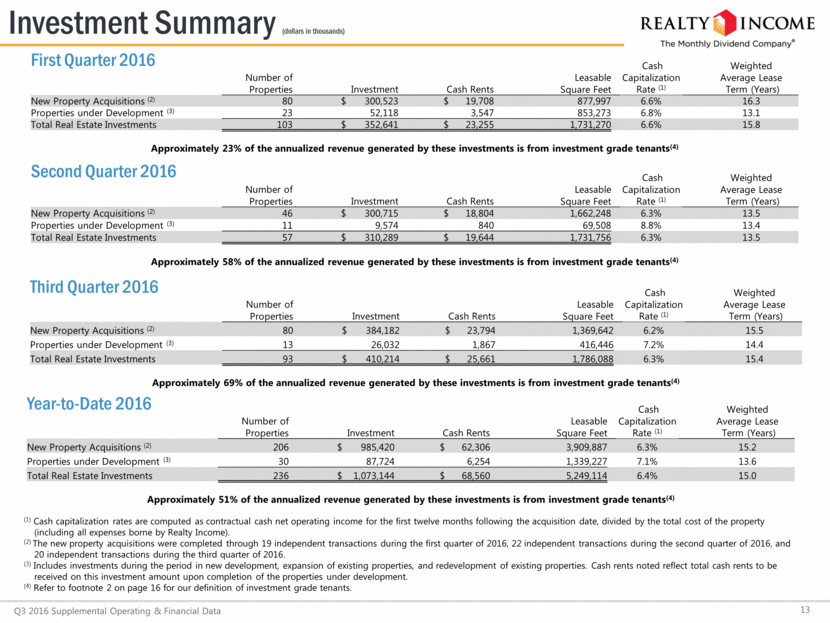
First Quarter 2016 Number of Properties Original Investment Net Book Value Net Proceeds Cash Capitalization Rate (1) Occupied 2 $ 3,455 $ 2,535 $ 3,377 6.9% Vacant 9 12,511 6,148 7,661 - Total Real Estate Dispositions 11 $ 15,966 $ 8,683 $ 11,038 The unlevered internal rate of return on properties sold during the first quarter was 6.6% Disposition Summary (dollars in thousands) 14 Q3 2016 Supplemental Operating & Financial Data Second Quarter 2016 Number of Properties Original Investment Net Book Value Net Proceeds (2) Cash Capitalization Rate (1) Occupied 3 $ 9,652 $ 6,929 $ 13,672 7.5% Vacant 12 16,337 8,256 10,310 - Total Real Estate Dispositions 15 $ 25,989 $ 15,185 $ 23,982 The unlevered internal rate of return on properties sold during the second quarter was 10.5% Year-to-Date 2016 Number of Properties Original Investment Net Book Value Net Proceeds (2) Cash Capitalization Rate (1) Occupied 8 $ 16,161 $ 11,402 $ 20,157 7.7% Vacant 41 60,541 26,921 33,002 - Total Real Estate Dispositions 49 $ 76,702 $ 38,323 $ 53,159 The unlevered internal rate of return on properties sold during the first nine months was 8.6% (1) Cash capitalization rates are computed as annualized current month contractual cash net operating income, divided by the net proceeds received upon sale of the property (including all expenses paid by us). (2) Data excludes properties sold as a result of eminent domain activities. During the second and third quarters of 2016 we were awarded net proceeds of $517,000 and $1,500,000, respectively, related to two eminent domain transactions. Third Quarter 2016 Number of Properties Original Investment Net Book Value Net Proceeds (2) Cash Capitalization Rate (1) Occupied 3 $ 3,054 $ 1,938 $ 3,108 9.5% Vacant 20 31,693 12,517 15,031 - Total Real Estate Dispositions 23 $ 34,747 $ 14,455 $ 18,139 The unlevered internal rate of return on properties sold during the third quarter was 7.4%
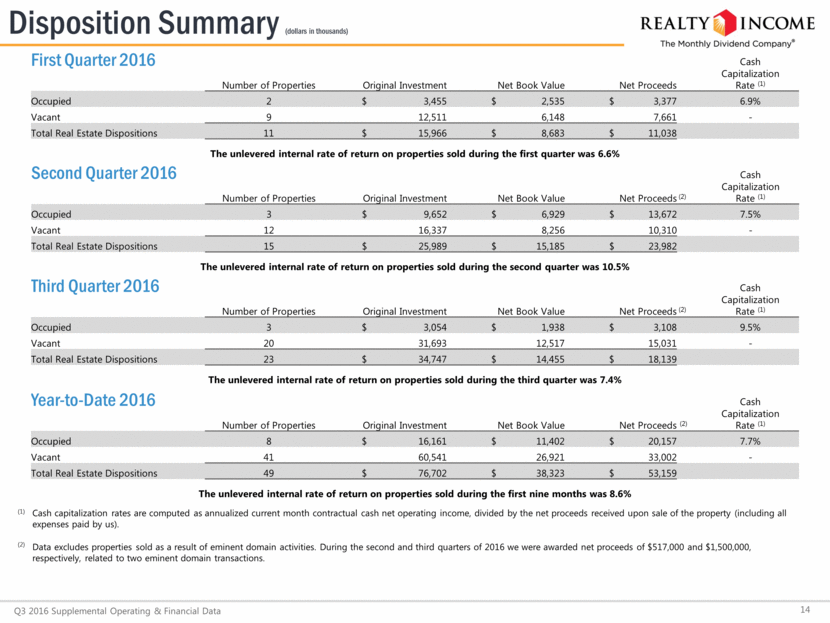
(1) Includes build-to-suit developments and forward take-out commitments on development properties with leases in place. (2) Estimated rental revenue commencement dates on properties under development is between October 2016 and March 2017. Development Pipeline (dollars in thousands) 15 Q3 2016 Supplemental Operating & Financial Data Retail Number of Properties Investment to Date Remaining Investment Total Commitment Percent Leased (2) New Development (1) 1 $ 3,060 $ 3,190 $ 6,250 100% Expansion of existing properties - - - - - Redevelopment of existing properties 3 4,471 2,464 6,935 100% 4 $ 7,531 $ 5,654 $ 13,185 Non-Retail Number of Properties Investment to Date Remaining Investment Total Commitment Percent Leased (2) New Development (1) 1 $ 8,893 $ 268 $ 9,161 100% Expansion of existing properties 1 523 702 1,225 100% Redevelopment of existing properties - - - - - 2 $ 9,416 $ 970 $ 10,386 Total Number of Properties Investment to Date Remaining Investment Total Commitment Percent Leased (2) New Development (1) 2 $ 11,953 $ 3,458 $ 15,411 100% Expansion of existing properties 1 523 702 1,225 100% Redevelopment of existing properties 3 4,471 2,464 6,935 100% 6 $ 16,947 $ 6,624 $ 23,571
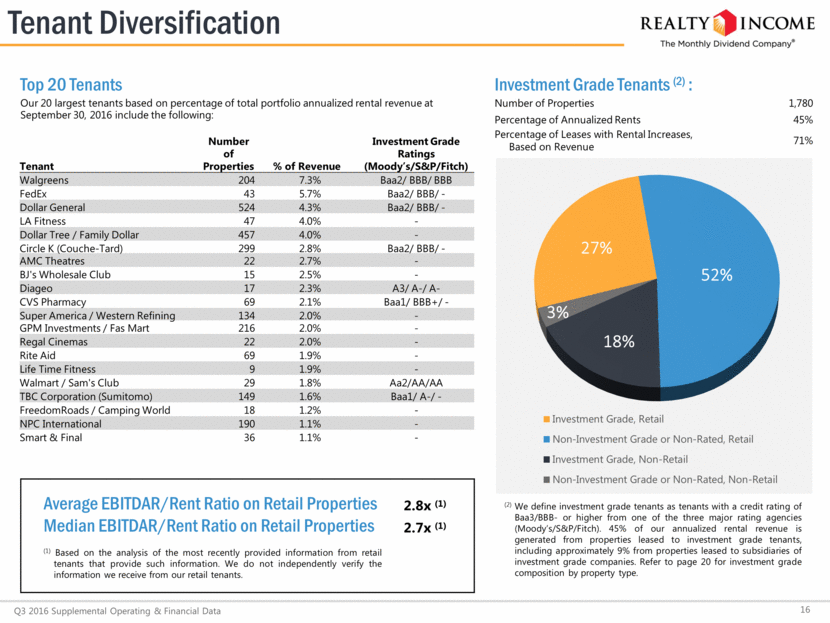
Top 20 Tenants Our 20 largest tenants based on percentage of total portfolio annualized rental revenue at September 30, 2016 include the following: Investment Grade Tenants (2) : Number of Properties 1,780 Percentage of Annualized Rents 45% Percentage of Leases with Rental Increases, Based on Revenue 71% Average EBITDAR/Rent Ratio on Retail Properties 2.8x (1) Median EBITDAR/Rent Ratio on Retail Properties 2.7x (1) (1) Based on the analysis of the most recently provided information from retail tenants that provide such information. We do not independently verify the information we receive from our retail tenants. (2) We define investment grade tenants as tenants with a credit rating of Baa3/BBB- or higher from one of the three major rating agencies (Moody’s/S&P/Fitch). 45% of our annualized rental revenue is generated from properties leased to investment grade tenants, including approximately 9% from properties leased to subsidiaries of investment grade companies. Refer to page 20 for investment grade composition by property type. Tenant Diversification 16 Q3 2016 Supplemental Operating & Financial Data Tenant Number of Properties % of Revenue Investment Grade Ratings (Moody’s/S&P/Fitch) Walgreens 204 7.3 % Baa2/ BBB/ BBB FedEx 43 5.7 % Baa2/ BBB/ - Dollar General 524 4.3 % Baa2/ BBB/ - LA Fitness 47 4.0 % - Dollar Tree / Family Dollar 457 4.0 % - Circle K (Couche-Tard) 299 2.8 % Baa2/ BBB/ - AMC Theatres 22 2.7 % - BJ's Wholesale Club 15 2.5 % - Diageo 17 2.3 % A3/ A-/ A- CVS Pharmacy 69 2.1 % Baa1/ BBB+/ - Super America / Western Refining 134 2.0 % - GPM Investments / Fas Mart 216 2.0 % - Regal Cinemas 22 2.0 % - Rite Aid 69 1.9 % - Life Time Fitness 9 1.9 % - Walmart / Sam's Club 29 1.8 % Aa2/AA/AA TBC Corporation (Sumitomo) 149 1.6 % Baa1/ A-/ - FreedomRoads / Camping World 18 1.2 % - NPC International 190 1.1 % - Smart & Final 36 1.1 % - 27% 52% 18% 3% Investment Grade, Retail Non-Investment Grade or Non-Rated, Retail Investment Grade, Non-Retail Non-Investment Grade or Non-Rated, Non-Retail
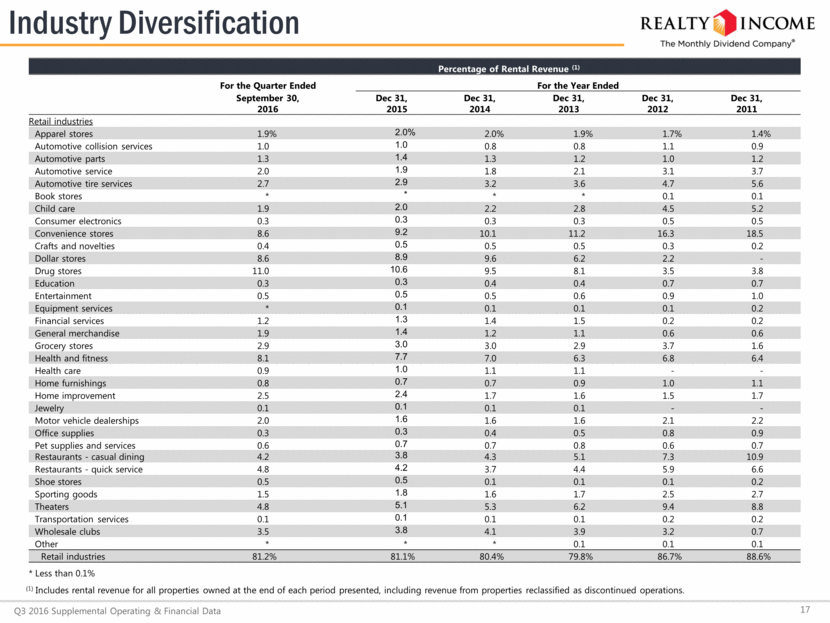
* Less than 0.1% Industry Diversification 17 Q3 2016 Supplemental Operating & Financial Data (1) Includes rental revenue for all properties owned at the end of each period presented, including revenue from properties reclassified as discontinued operations. Percentage of Rental Revenue (1) For the Quarter Ended For the Year Ended September 30, Dec 31, Dec 31, Dec 31, Dec 31, Dec 31, 2016 2015 2014 2013 2012 2011 Retail industries Apparel stores 1.9 % 2.0 % 2.0 % 1.9 % 1.7 % 1.4 % Automotive collision services 1.0 1.0 0.8 0.8 1.1 0.9 Automotive parts 1.3 1.4 1.3 1.2 1.0 1.2 Automotive service 2.0 1.9 1.8 2.1 3.1 3.7 Automotive tire services 2.7 2.9 3.2 3.6 4.7 5.6 Book stores * * * * 0.1 0.1 Child care 1.9 2.0 2.2 2.8 4.5 5.2 Consumer electronics 0.3 0.3 0.3 0.3 0.5 0.5 Convenience stores 8.6 9.2 10.1 11.2 16.3 18.5 Crafts and novelties 0.4 0.5 0.5 0.5 0.3 0.2 Dollar stores 8.6 8.9 9.6 6.2 2.2 - Drug stores 11.0 10.6 9.5 8.1 3.5 3.8 Education 0.3 0.3 0.4 0.4 0.7 0.7 Entertainment 0.5 0.5 0.5 0.6 0.9 1.0 Equipment services * 0.1 0.1 0.1 0.1 0.2 Financial services 1.2 1.3 1.4 1.5 0.2 0.2 General merchandise 1.9 1.4 1.2 1.1 0.6 0.6 Grocery stores 2.9 3.0 3.0 2.9 3.7 1.6 Health and fitness 8.1 7.7 7.0 6.3 6.8 6.4 Health care 0.9 1.0 1.1 1.1 - - Home furnishings 0.8 0.7 0.7 0.9 1.0 1.1 Home improvement 2.5 2.4 1.7 1.6 1.5 1.7 Jewelry 0.1 0.1 0.1 0.1 - - Motor vehicle dealerships 2.0 1.6 1.6 1.6 2.1 2.2 Office supplies 0.3 0.3 0.4 0.5 0.8 0.9 Pet supplies and services 0.6 0.7 0.7 0.8 0.6 0.7 Restaurants - casual dining 4.2 3.8 4.3 5.1 7.3 10.9 Restaurants - quick service 4.8 4.2 3.7 4.4 5.9 6.6 Shoe stores 0.5 0.5 0.1 0.1 0.1 0.2 Sporting goods 1.5 1.8 1.6 1.7 2.5 2.7 Theaters 4.8 5.1 5.3 6.2 9.4 8.8 Transportation services 0.1 0.1 0.1 0.1 0.2 0.2 Wholesale clubs 3.5 3.8 4.1 3.9 3.2 0.7 Other * * * 0.1 0.1 0.1 Retail industries 81.2 % 81.1 % 80.4 % 79.8 % 86.7 % 88.6 %
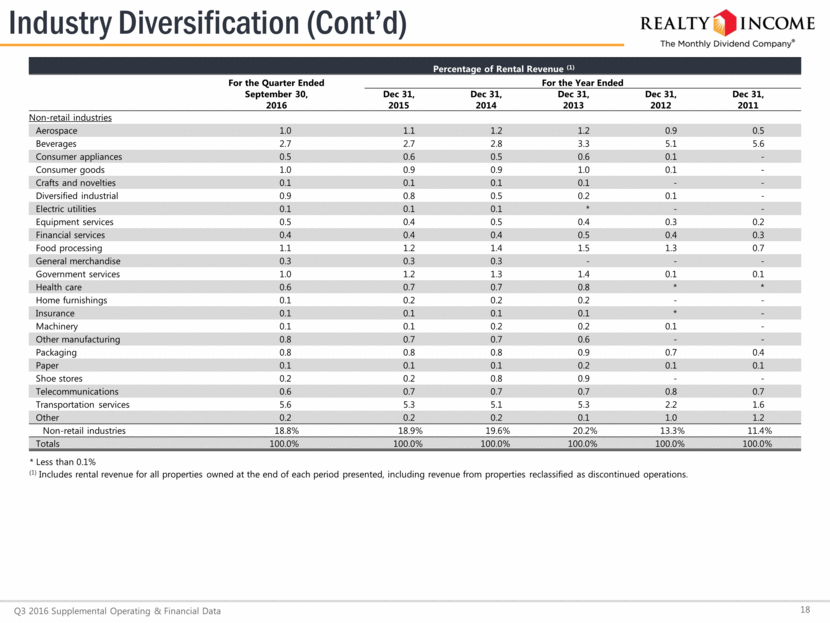
Industry Diversification (Cont’d) 18 Q3 2016 Supplemental Operating & Financial Data * Less than 0.1% (1) Includes rental revenue for all properties owned at the end of each period presented, including revenue from properties reclassified as discontinued operations. Percentage of Rental Revenue (1) For the Quarter Ended For the Year Ended September 30, Dec 31, Dec 31, Dec 31, Dec 31, Dec 31, 2016 2015 2014 2013 2012 2011 Non-retail industries Aerospace 1.0 1.1 1.2 1.2 0.9 0.5 Beverages 2.7 2.7 2.8 3.3 5.1 5.6 Consumer appliances 0.5 0.6 0.5 0.6 0.1 - Consumer goods 1.0 0.9 0.9 1.0 0.1 - Crafts and novelties 0.1 0.1 0.1 0.1 - - Diversified industrial 0.9 0.8 0.5 0.2 0.1 - Electric utilities 0.1 0.1 0.1 * - - Equipment services 0.5 0.4 0.5 0.4 0.3 0.2 Financial services 0.4 0.4 0.4 0.5 0.4 0.3 Food processing 1.1 1.2 1.4 1.5 1.3 0.7 General merchandise 0.3 0.3 0.3 - - - Government services 1.0 1.2 1.3 1.4 0.1 0.1 Health care 0.6 0.7 0.7 0.8 * * Home furnishings 0.1 0.2 0.2 0.2 - - Insurance 0.1 0.1 0.1 0.1 * - Machinery 0.1 0.1 0.2 0.2 0.1 - Other manufacturing 0.8 0.7 0.7 0.6 - - Packaging 0.8 0.8 0.8 0.9 0.7 0.4 Paper 0.1 0.1 0.1 0.2 0.1 0.1 Shoe stores 0.2 0.2 0.8 0.9 - - Telecommunications 0.6 0.7 0.7 0.7 0.8 0.7 Transportation services 5.6 5.3 5.1 5.3 2.2 1.6 Other 0.2 0.2 0.2 0.1 1.0 1.2 Non-retail industries 18.8 % 18.9 % 19.6 % 20.2 % 13.3 % 11.4 % Totals 100.0 % 100.0 % 100.0 % 100.0 % 100.0 % 100.0 %
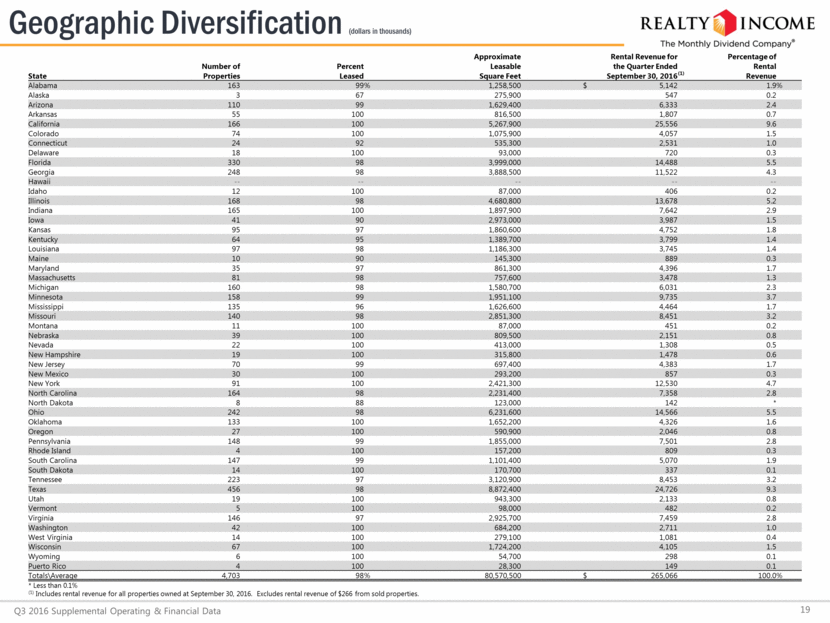
* Less than 0.1% (1) Includes rental revenue for all properties owned at September 30, 2016. Excludes rental revenue of $266 from sold properties. EXPIRATIONS (dollars in thousands) Geographic Diversification (dollars in thousands) 19 Q3 2016 Supplemental Operating & Financial Data Approximate Rental Revenue for Percentage of Number of Percent Leasable the Quarter Ended Rental State Properties Leased Square Feet September 30, 2016 (1) Revenue Alabama 163 99 % 1,258,500 $ 5,142 1.9 % Alaska 3 67 275,900 547 0.2 Arizona 110 99 1,629,400 6,333 2.4 Arkansas 55 100 816,500 1,807 0.7 California 166 100 5,267,900 25,556 9.6 Colorado 74 100 1,075,900 4,057 1.5 Connecticut 24 92 535,300 2,531 1.0 Delaware 18 100 93,000 720 0.3 Florida 330 98 3,999,000 14,488 5.5 Georgia 248 98 3,888,500 11,522 4.3 Hawaii -- -- -- -- -- Idaho 12 100 87,000 406 0.2 Illinois 168 98 4,680,800 13,678 5.2 Indiana 165 100 1,897,900 7,642 2.9 Iowa 41 90 2,973,000 3,987 1.5 Kansas 95 97 1,860,600 4,752 1.8 Kentucky 64 95 1,389,700 3,799 1.4 Louisiana 97 98 1,186,300 3,745 1.4 Maine 10 90 145,300 889 0.3 Maryland 35 97 861,300 4,396 1.7 Massachusetts 81 98 757,600 3,478 1.3 Michigan 160 98 1,580,700 6,031 2.3 Minnesota 158 99 1,951,100 9,735 3.7 Mississippi 135 96 1,626,600 4,464 1.7 Missouri 140 98 2,851,300 8,451 3.2 Montana 11 100 87,000 451 0.2 Nebraska 39 100 809,500 2,151 0.8 Nevada 22 100 413,000 1,308 0.5 New Hampshire 19 100 315,800 1,478 0.6 New Jersey 70 99 697,400 4,383 1.7 New Mexico 30 100 293,200 857 0.3 New York 91 100 2,421,300 12,530 4.7 North Carolina 164 98 2,231,400 7,358 2.8 North Dakota 8 88 123,000 142 * Ohio 242 98 6,231,600 14,566 5.5 Oklahoma 133 100 1,652,200 4,326 1.6 Oregon 27 100 590,900 2,046 0.8 Pennsylvania 148 99 1,855,000 7,501 2.8 Rhode Island 4 100 157,200 809 0.3 South Carolina 147 99 1,101,400 5,070 1.9 South Dakota 14 100 170,700 337 0.1 Tennessee 223 97 3,120,900 8,453 3.2 Texas 456 98 8,872,400 24,726 9.3 Utah 19 100 943,300 2,133 0.8 Vermont 5 100 98,000 482 0.2 Virginia 146 97 2,925,700 7,459 2.8 Washington 42 100 684,200 2,711 1.0 West Virginia 14 100 279,100 1,081 0.4 Wisconsin 67 100 1,724,200 4,105 1.5 Wyoming 6 100 54,700 298 0.1 Puerto Rico 4 100 28,300 149 0.1 Totals\Average 4,703 98 % 80,570,500 $ 265,066 100.0 %
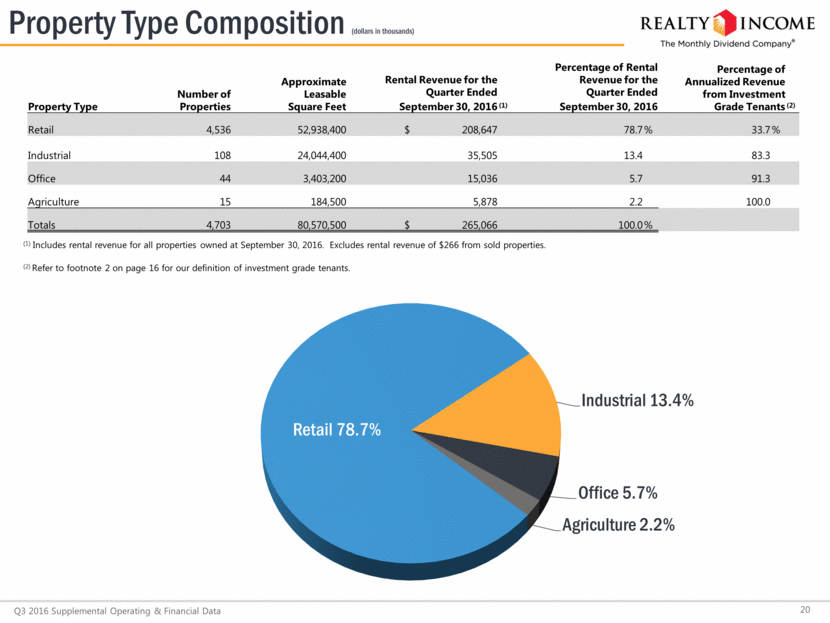
Property Type Composition (dollars in thousands) 20 Q3 2016 Supplemental Operating & Financial Data (1) Includes rental revenue for all properties owned at September 30, 2016. Excludes rental revenue of $266 from sold properties. (2) Refer to footnote 2 on page 16 for our definition of investment grade tenants. Number of Properties Approximate Leasable Square Feet Rental Revenue for the Quarter Ended Percentage of Rental Revenue for the Quarter Ended Percentage of Annualized Revenue from Investment Grade Tenants Property Type September 30, 2016 (1) September 30, 2016 (2) Retail 4,536 52,938,400 $ 208,647 78.7 % 33.7 % Industrial 108 24,044,400 35,505 13.4 83.3 Office 44 3,403,200 15,036 5.7 91.3 Agriculture 15 184,500 5,878 2.2 100.0 Totals 4,703 80,570,500 $ 265,066 100.0 % Retail 78.7% Industrial 13.4% Office 5.7% Agriculture 2.2%
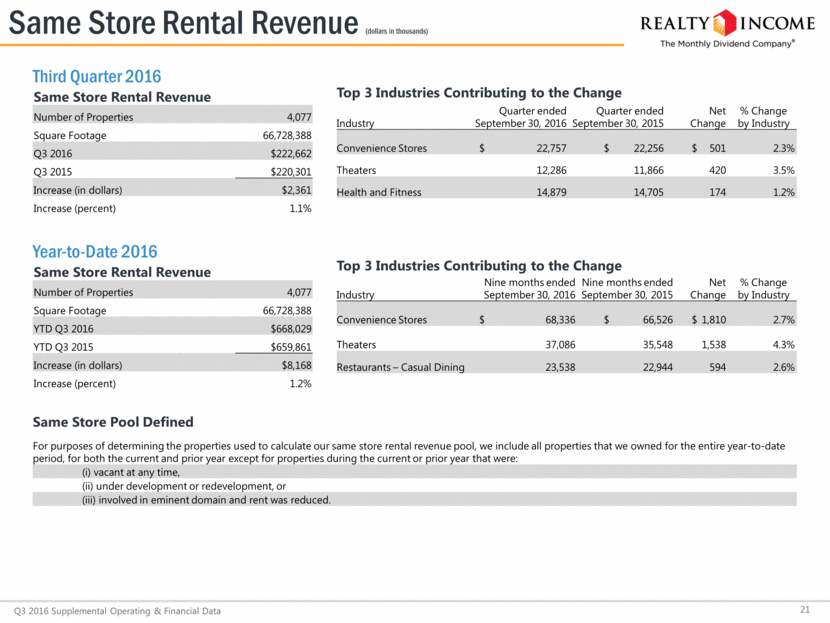
Top 3 Industries Contributing to the Change Quarter ended Quarter ended Net % Change Industry September 30, 2016 September 30, 2015 Change by Industry Convenience Stores $ 22,757 $ 22,256 $ 501 2.3 % Theaters 12,286 11,866 420 3.5 % Health and Fitness 14,879 14,705 174 1.2 % Third Quarter 2016 Same Store Rental Revenue (dollars in thousands) 21 Q3 2016 Supplemental Operating & Financial Data Same Store Pool Defined For purposes of determining the properties used to calculate our same store rental revenue pool, we include all properties that we owned for the entire year-to-date period, for both the current and prior year except for properties during the current or prior year that were: (i) vacant at any time, (ii) under development or redevelopment, or (iii) involved in eminent domain and rent was reduced. Same Store Rental Revenue Number of Properties 4,077 Square Footage 66,728,388 Q3 2016 $222,662 Q3 2015 $220,301 Increase (in dollars) $2,361 Increase (percent) 1.1% Top 3 Industries Contributing to the Change Nine months ended Nine months ended Net % Change Industry September 30, 2016 September 30, 2015 Change by Industry Convenience Stores $ 68,336 $ 66,526 $ 1,810 2.7 % Theaters 37,086 35,548 1,538 4.3 % Restaurants – Casual Dining 23,538 22,944 594 2.6 % Year-to-Date 2016 Same Store Rental Revenue Number of Properties 4,077 Square Footage 66,728,388 YTD Q3 2016 $668,029 YTD Q3 2015 $659,861 Increase (in dollars) $8,168 Increase (percent) 1.2%
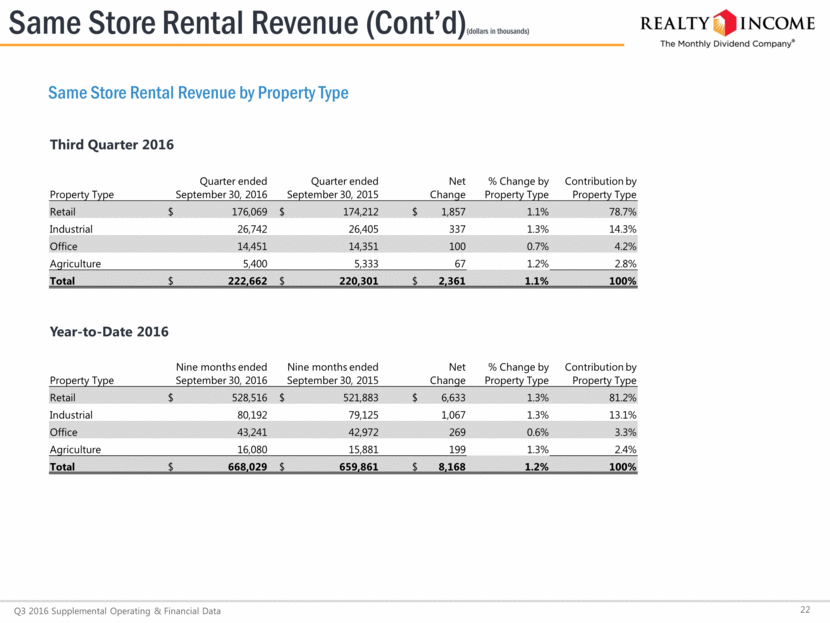
Same Store Rental Revenue (Cont’d)(dollars in thousands) 22 Q3 2016 Supplemental Operating & Financial Data Same Store Rental Revenue by Property Type Third Quarter 2016 Quarter ended Quarter ended Net % Change by Contribution by Property Type September 30, 2016 September 30, 2015 Change Property Type Property Type Retail $ 176,069 $ 174,212 $ 1,857 1.1% 78.7% Industrial 26,742 26,405 337 1.3% 14.3% Office 14,451 14,351 100 0.7% 4.2% Agriculture 5,400 5,333 67 1.2% 2.8% Total $ 222,662 $ 220,301 $ 2,361 1.1% 100% Year-to-Date 2016 Nine months ended Nine months ended Net % Change by Contribution by Property Type September 30, 2016 September 30, 2015 Change Property Type Property Type Retail $ 528,516 $ 521,883 $ 6,633 1.3% 81.2% Industrial 80,192 79,125 1,067 1.3% 13.1% Office 43,241 42,972 269 0.6% 3.3% Agriculture 16,080 15,881 199 1.3% 2.4% Total $ 668,029 $ 659,861 $ 8,168 1.2% 100%
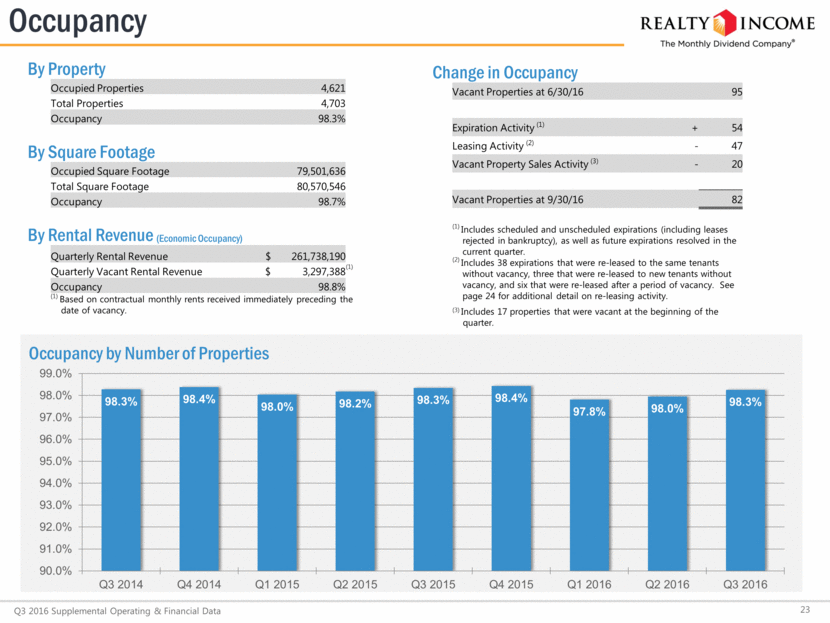
By Property Occupied Properties 4,621 Total Properties 4,703 Occupancy 98.3% By Square Footage Occupied Square Footage 79,501,636 Total Square Footage 80,570,546 Occupancy 98.7% By Rental Revenue (Economic Occupancy) Quarterly Rental Revenue $ 261,738,190 Quarterly Vacant Rental Revenue $ 3,297,388 (1) Occupancy 98.8% (1) Based on contractual monthly rents received immediately preceding the date of vacancy. Change in Occupancy Vacant Properties at 6/30/16 95 Expiration Activity (1) + 54 Leasing Activity (2) - 47 Vacant Property Sales Activity (3) - 20 Vacant Properties at 9/30/16 82 (1) Includes scheduled and unscheduled expirations (including leases rejected in bankruptcy), as well as future expirations resolved in the current quarter. (2) Includes 38 expirations that were re-leased to the same tenants without vacancy, three that were re-leased to new tenants without vacancy, and six that were re-leased after a period of vacancy. See page 24 for additional detail on re-leasing activity. (3) Includes 17 properties that were vacant at the beginning of the quarter. Occupancy 23 Q3 2016 Supplemental Operating & Financial Data Occupancy by Number of Properties 98.3% 98.4% 98.0% 98.2% 98.3% 98.4% 97.8% 98.0% 98.3% 90.0% 91.0% 92.0% 93.0% 94.0% 95.0% 96.0% 97.0% 98.0% 99.0% Q3 2014 Q4 2014 Q1 2015 Q2 2015 Q3 2015 Q4 2015 Q1 2016 Q2 2016 Q3 2016
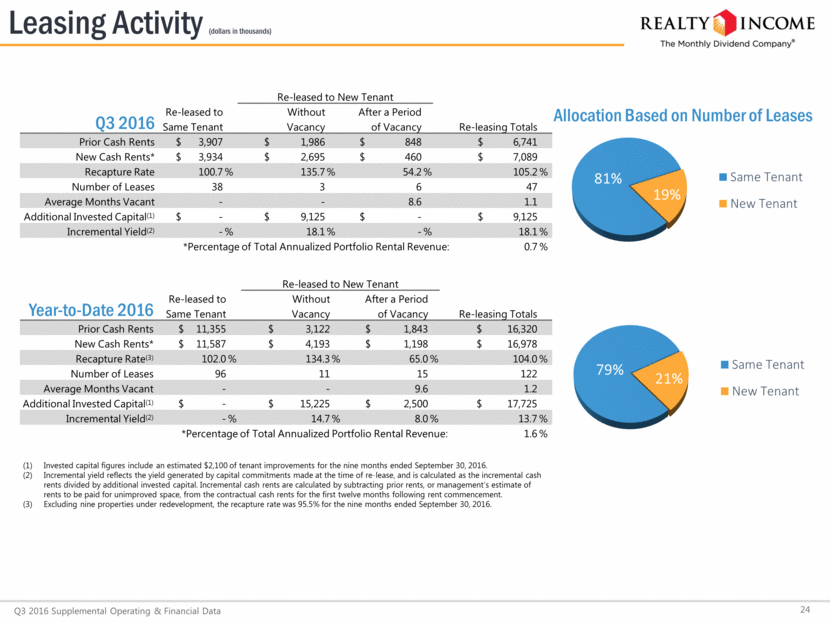
Allocation Based on Number of Leases Leasing Activity (dollars in thousands) 24 Q3 2016 Supplemental Operating & Financial Data Re-leased to New Tenant Q3 2016 Re-leased to Without After a Period Re-leasing Totals Same Tenant Vacancy of Vacancy Prior Cash Rents $ 3,907 $ 1,986 $ 848 $ 6,741 New Cash Rents* $ 3,934 $ 2,695 $ 460 $ 7,089 Recapture Rate 100.7 % 135.7 % 54.2 % 105.2 % Number of Leases 38 3 6 47 Average Months Vacant - - 8.6 1.1 Additional Invested Capital(1) $ - $ 9,125 $ - $ 9,125 Incremental Yield(2) - % 18.1 % - % 18.1 % *Percentage of Total Annualized Portfolio Rental Revenue: 0.7 % Invested capital figures include an estimated $2,100 of tenant improvements for the nine months ended September 30, 2016. Incremental yield reflects the yield generated by capital commitments made at the time of re-lease, and is calculated as the incremental cash rents divided by additional invested capital. Incremental cash rents are calculated by subtracting prior rents, or management’s estimate of rents to be paid for unimproved space, from the contractual cash rents for the first twelve months following rent commencement. Excluding nine properties under redevelopment, the recapture rate was 95.5% for the nine months ended September 30, 2016. Year-to-Date 2016 Re-leased to New Tenant Re-leased to Without After a Period Re-leasing Totals Same Tenant Vacancy of Vacancy Prior Cash Rents $ 11,355 $ 3,122 $ 1,843 $ 16,320 New Cash Rents* $ 11,587 $ 4,193 $ 1,198 $ 16,978 Recapture Rate(3) 102.0 % 134.3 % 65.0 % 104.0 % Number of Leases 96 11 15 122 Average Months Vacant - - 9.6 1.2 Additional Invested Capital(1) $ - $ 15,225 $ 2,500 $ 17,725 Incremental Yield(2) - % 14.7 % 8.0 % 13.7 % *Percentage of Total Annualized Portfolio Rental Revenue: 1.6 % 81% 19% Same Tenant New Tenant 79% 21% Same Tenant New Tenant
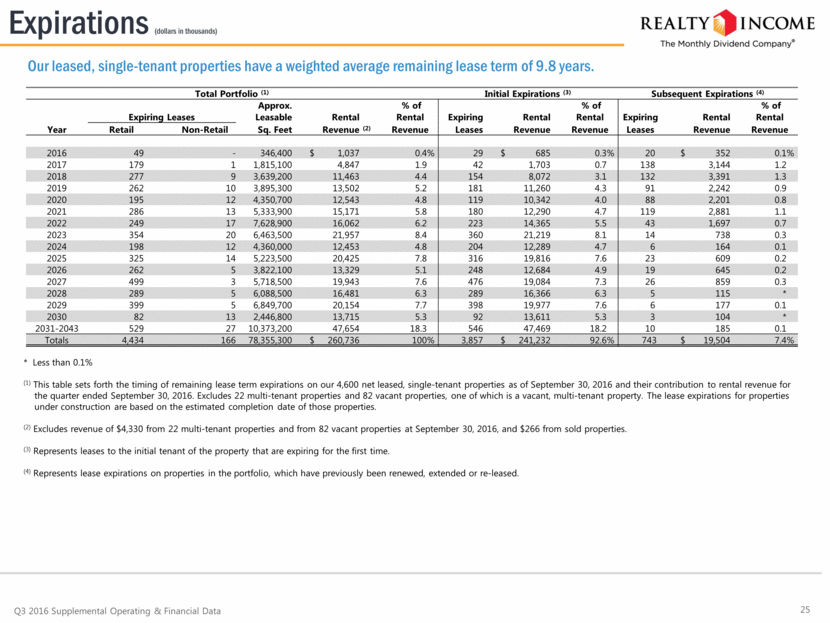
25 * Less than 0.1% (1) This table sets forth the timing of remaining lease term expirations on our 4,600 net leased, single-tenant properties as of September 30, 2016 and their contribution to rental revenue for the quarter ended September 30, 2016. Excludes 22 multi-tenant properties and 82 vacant properties, one of which is a vacant, multi-tenant property. The lease expirations for properties under construction are based on the estimated completion date of those properties. (2) Excludes revenue of $4,330 from 22 multi-tenant properties and from 82 vacant properties at September 30, 2016, and $266 from sold properties. (3) Represents leases to the initial tenant of the property that are expiring for the first time. (4) Represents lease expirations on properties in the portfolio, which have previously been renewed, extended or re-leased. Our leased, single-tenant properties have a weighted average remaining lease term of 9.8 years. Expirations (dollars in thousands) Q3 2016 Supplemental Operating & Financial Data Total Portfolio (1) Initial Expirations (3) Subsequent Expirations (4) Approx. % of % of % of Expiring Leases Leasable Rental Rental Expiring Rental Rental Expiring Rental Rental Year Retail Non-Retail Sq. Feet Revenue (2) Revenue Leases Revenue Revenue Leases Revenue Revenue 2016 49 - 346,400 $ 1,037 0.4 % 29 $ 685 0.3 % 20 $ 352 0.1 % 2017 179 1 1,815,100 4,847 1.9 42 1,703 0.7 138 3,144 1.2 2018 277 9 3,639,200 11,463 4.4 154 8,072 3.1 132 3,391 1.3 2019 262 10 3,895,300 13,502 5.2 181 11,260 4.3 91 2,242 0.9 2020 195 12 4,350,700 12,543 4.8 119 10,342 4.0 88 2,201 0.8 2021 286 13 5,333,900 15,171 5.8 180 12,290 4.7 119 2,881 1.1 2022 249 17 7,628,900 16,062 6.2 223 14,365 5.5 43 1,697 0.7 2023 354 20 6,463,500 21,957 8.4 360 21,219 8.1 14 738 0.3 2024 198 12 4,360,000 12,453 4.8 204 12,289 4.7 6 164 0.1 2025 325 14 5,223,500 20,425 7.8 316 19,816 7.6 23 609 0.2 2026 262 5 3,822,100 13,329 5.1 248 12,684 4.9 19 645 0.2 2027 499 3 5,718,500 19,943 7.6 476 19,084 7.3 26 859 0.3 2028 289 5 6,088,500 16,481 6.3 289 16,366 6.3 5 115 * 2029 399 5 6,849,700 20,154 7.7 398 19,977 7.6 6 177 0.1 2030 82 13 2,446,800 13,715 5.3 92 13,611 5.3 3 104 * 2031-2043 529 27 10,373,200 47,654 18.3 546 47,469 18.2 10 185 0.1 Totals 4,434 166 78,355,300 $ 260,736 100 % 3,857 $ 241,232 92.6 % 743 $ 19,504 7.4 %
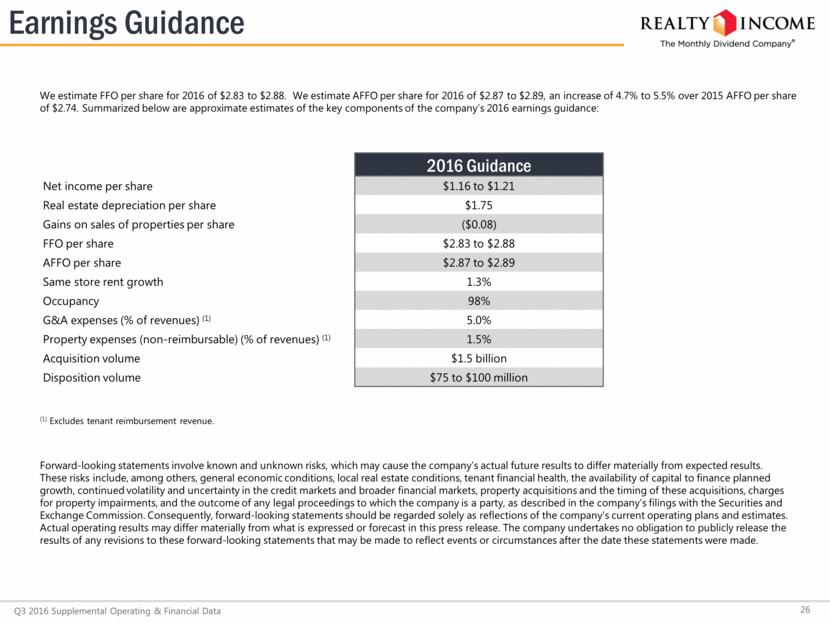
26 We estimate FFO per share for 2016 of $2.83 to $2.88. We estimate AFFO per share for 2016 of $2.87 to $2.89, an increase of 4.7% to 5.5% over 2015 AFFO per share of $2.74. Summarized below are approximate estimates of the key components of the company’s 2016 earnings guidance: Earnings Guidance Q3 2016 Supplemental Operating & Financial Data Forward-looking statements involve known and unknown risks, which may cause the company’s actual future results to differ materially from expected results. These risks include, among others, general economic conditions, local real estate conditions, tenant financial health, the availability of capital to finance planned growth, continued volatility and uncertainty in the credit markets and broader financial markets, property acquisitions and the timing of these acquisitions, charges for property impairments, and the outcome of any legal proceedings to which the company is a party, as described in the company’s filings with the Securities and Exchange Commission. Consequently, forward-looking statements should be regarded solely as reflections of the company’s current operating plans and estimates. Actual operating results may differ materially from what is expressed or forecast in this press release. The company undertakes no obligation to publicly release the results of any revisions to these forward-looking statements that may be made to reflect events or circumstances after the date these statements were made. (1) Excludes tenant reimbursement revenue. 2016 Guidance Net income per share $1.16 to $1.21 Real estate depreciation per share $1.75 Gains on sales of properties per share ($0.08) FFO per share $2.83 to $2.88 AFFO per share $2.87 to $2.89 Same store rent growth 1.3% Occupancy 98% G&A expenses (% of revenues) (1) 5.0% Property expenses (non-reimbursable) (% of revenues) (1) 1.5% Acquisition volume $1.5 billion Disposition volume $75 to $100 million
27 Q3 2016 Supplemental Operating & Financial Data Realty Income Corporation is covered by the analysts at the firms listed above. This list may not be complete and is subject to change. Please note that any opinions, estimates or forecasts regarding Realty Income Corporation's performance made by these analysts are theirs alone and do not represent opinions, estimates or forecasts of Realty Income Corporation or its management. Realty Income Corporation does not by its reference above or distribution imply, and expressly disclaims, any endorsement of or concurrence with any information, estimates, forecasts, opinions, conclusions or recommendations provided by analysts. Analyst Coverage Equity Research Baird RJ Milligan rjmilligan@rwbaird.com (813) 273-8252 William Harman wharman@rwbaird.com (414) 298-2337 Bank of America Merrill Lynch Juan Sanabria juan.sanabria@baml.com (646) 855-1589 Joshua Dennerlein joshua.dennerlein@baml.com (646) 855-1681 Camille Tan camille.tan@baml.com (646) 556-2095 BTIG Michael Gorman mgorman@btig.com (212) 738-6138 James Sullivan jsullivan@btig.com (212) 738-6139 Capital One Chris Lucas christopher.lucas@capitalone.com (571) 633-8151 Vineet Khanna vineet.khanna@capitalone.com (571) 835-7013 Citigroup Michael Bilerman michael.bilerman@citi.com (212) 816-1383 Nicholas Joseph nicholas.joseph@citi.com (212) 816-1909 John Ellwanger john.ellwanger@citi.com (212) 816-5871 D.A. Davidson Barry Oxford boxford@dadco.com (212) 240-9871 James O. Lykins jlykins@dadco.com (212) 576-1845 Edward Jones Roy Shepard royal.shepard@edwardjones.com (314) 515-3510 Goldman Sachs Andrew Rosivach andrew.rosivach@gs.com (212) 902-2796 Caitlin Burrows caitlin.burrows@gs.com (212) 902-4736 Brad Burke brad.burke@gs.com (917) 343-2082 Jeffrey Pehl jeffrey.pehl@gs.com (212) 357-4474 Green Street Cedrik Lachance clachance@greenstreetadvisors.com (949) 640-8780 Tyler Grant tgrant@greenstreetadvisors.com (949) 640-8780 Janney Montgomery Scott Robert Stevenson robstevenson@janney.com (646) 840-3217 Venkat Kommineni vkommineni@janney.com (646) 840-3219 Hersh Shintre hshintre@janney.com (646) 840-3201 J.P. Morgan Anthony Paolone anthony.paolone@jpmorgan.com (212) 622-6682 Gene Nusinzon gene.nusinzon@jpmorgan.com (212) 622-1041 Ladenburg Thalmann Daniel Donlan ddonlan@ladenburg.com (212) 409-2056 John Massocca jmassocca@ladenburg.com (212) 409-2543 Mitsubishi UFJ Securities (USA), Inc. Karin Ford kford@us.sc.mufg.jp (212) 405-7349 Mizuho Securities USA, Inc. Haendel St. Juste haendel.st.juste@us.mizuho-sc.com (212) 205-7860 Jieren Huang jieren.huang@us.mizuho-sc.com (212) 205-7862 Morgan Stanley Vikram Malhotra vikram.malhotra@morganstanley.com (212) 761-7064 Landon Park landon.park@morganstanley.com (212) 761-6368 Morningstar Edward Mui edward.mui@morningstar.com (312) 348-2379 Oppenheimer Steve Manaker stephen.manaker@opco.com (212) 667-5950 Amit Nihalani amit.nihalani@opco.com (212) 667-8204 Raymond James Collin Mings collin.mings@raymondjames.com (727) 567-2585 Paul Puryear paul.puryear@raymondjames.com (727) 567-2253 Daniel Mannix daniel.mannix@raymondjames.com (727) 567-2619 RBC Capital Markets James Bambrick james.bambrick@rbccm.com (440) 715-2654 Stifel Simon Yarmak yarmaks@stifel.com (443) 224-1345 UBS Jeremy Metz jeremy-metz@ubs.com (212) 713-2429 Frank Lee frank-a.lee@ubs.com (415) 352-5679 Wells Fargo Todd Stender todd.stender@wellsfargo.com (562) 637-1371 Philip DeFelice philip.defelice@wellsfargo.com (443) 263-6442 Jason Belcher jason.belcher@wellsfargo.com (443) 462-7354 Wunderlich Craig Kucera ckucera@wundernet.com (540) 277-3366
