Attached files
| file | filename |
|---|---|
| EX-99.1 - EXHIBIT 99-1 - B. Riley Financial, Inc. | s104434_ex99-1.htm |
| 8-K - 8-K - B. Riley Financial, Inc. | s104434_8k.htm |
Exhibit 99.2
January 2013 B. Riley Financial, Inc. Senior Unsecured Notes Offering Roadshow Presentation October 2016
2 FORWARD LOOKING STATEMENTS Statements in this presentation that are not descriptions of historical facts are forward - looking statements that are based on management’s current expectations and assumptions and are subject to risks and uncertainties . If such risks or uncertainties materialize or such assumptions prove incorrect, our business, operating results, financial condition and stock price could be materially negatively affected . In some cases, you can identify forward - looking statements by terminology including “anticipates,” “believes,” “can,” “continue,” “could,” “estimates,” “expects,” “intends,” “may,” “plans,” “potential,” “predicts,” “should,” “will,” “would” or the negative of these terms or other comparable terminology . You should not place undue reliance on such forward - looking statements, which are based on the information currently available to us and speak only as of the date of this presentation . Because these forward - looking statements involve known and unknown risks and uncertainties, there are important factors that could cause actual results, events or developments to differ materially from those expressed or implied by these forward - looking statements, including our plans, objectives, expectations, intentions and other factors set forth in the sections entitled “Risk Factors” in our Annual Report on Form 10 - K for the fiscal year ended December 31 , 2015 and in our Quarterly Report on Form 10 - Q for the fiscal quarter ended June 30 , 2016 . Risk factors that could cause actual results to differ from those contained in the forward - looking statements include but are not limited to risks related to : the ability to achieve expected cost savings or other acquisition benefits, in each case within expected time - frames or at all ; volatility in our revenues and results of operations ; changing conditions in the financial markets ; our ability to generate sufficient revenues to achieve and maintain profitability ; the short term nature of our engagements ; the accuracy of our estimates and valuations of inventory or assets in “guarantee” based engagements ; competition in the asset management business ; potential losses related to our auction or liquidation engagements ; our dependence on communications, information and other systems and third parties ; potential losses related to purchase transactions in our auction and liquidations business ; the potential loss of financial institution clients ; potential losses from or illiquidity of our proprietary investments ; changing economic and market conditions ; potential liability and harm to our reputation if we were to provide an inaccurate appraisal or valuation ; potential mark - downs in inventory in connection with purchase transactions ; failure to successfully compete in any of our segments ; loss of key personnel ; our ability to borrow under our credit facilities as necessary ; failure to comply with the terms of our credit agreements ; and our ability to meet future capital requirements . We undertake no obligation to publicly update or revise any forward - looking statements, whether as a result of new information, future events or otherwise . We have filed a registration statement (including a prospectus) with the SEC for the offering to which this presentation relates . Before you invest in such offering, you should read the prospectus in that registration statement and other documents we have filed with the SEC for more complete information about us and the offering . You may get these documents for free by visiting EDGAR on the SEC Web site at www . sec . gov . Alternatively, we will arrange to send you the prospectus if you request it by calling 1 - 888 - 295 - 0155 . In particular, you should review the preliminary prospectus supplement that we have prepared in connection with the offering and the financial information included or incorporated by reference therein before you invest . Safe Harbor Statement
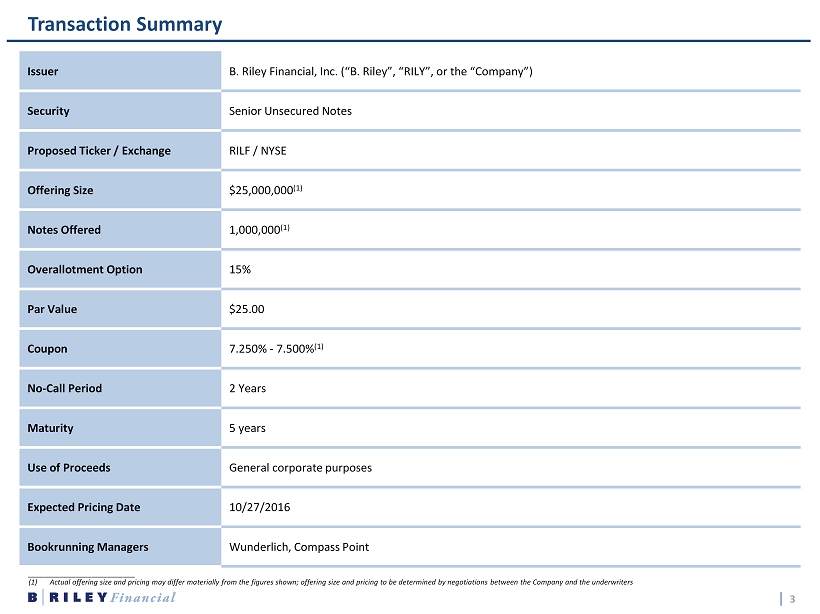
3 Transaction Summary Issuer B. Riley Financial, Inc. (“B. Riley”, “RILY”, or the “Company”) Security Senior Unsecured Notes Proposed Ticker / Exchange RILF / NYSE Offering Size $25,000,000 (1) Notes Offered 1,000,000 (1) Overallotment Option 15% Par Value $25.00 Coupon 7.250% - 7.500% (1) No - Call Period 2 Years Maturity 5 years Use of Proceeds General corporate purposes Expected Pricing Date 10/27/2016 Bookrunning Managers Wunderlich, Compass Point ___________________________ (1) Actual offering size and pricing may differ materially from the figures shown; offering size and pricing to be determined by neg otiations between the Company and the underwriters
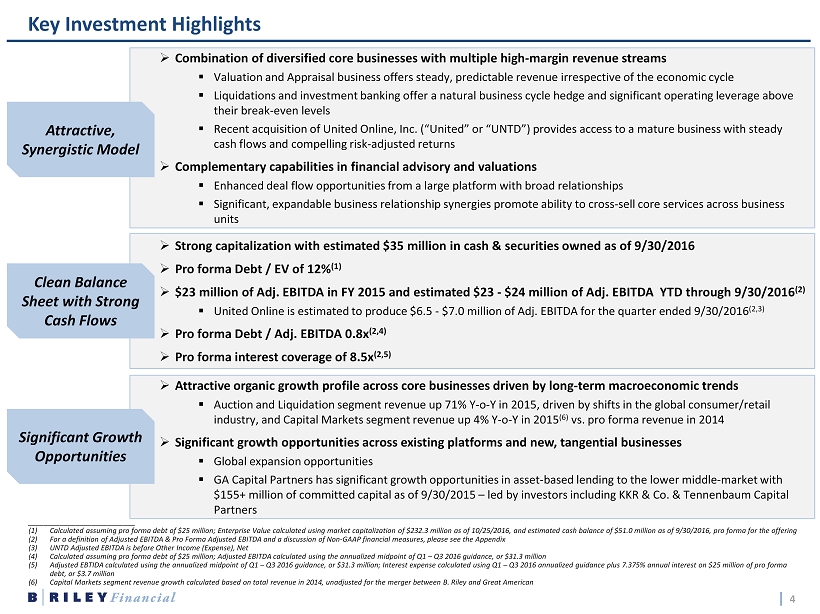
4 Key Investment Highlights ___________________________ (1) Calculated assuming pro forma debt of $25 million; Enterprise Value calculated using market capitalization of $232.3 million as of 10/25/2016, and estimated cash balance of $51.0 million as of 9/30/2016, pro forma for the offering (2) For a definition of Adjusted EBITDA & Pro Forma Adjusted EBITDA and a discussion of Non - GAAP financial measures, please see the Appendix (3) UNTD Adjusted EBITDA is before Other Income (Expense), Net (4) Calculated assuming pro forma debt of $25 million; Adjusted EBITDA calculated using the annualized midpoint of Q1 – Q3 2016 guid ance, or $31.3 million (5) Adjusted EBTIDA calculated using the annualized midpoint of Q1 – Q3 2016 guidance, or $31.3 million; Interest expense calculated using Q1 – Q3 2016 annualized guidance plus 7.375% annual interest on $25 million of pro forma debt, or $3.7 million (6) Capital Markets segment revenue growth calculated based on total revenue in 2014, unadjusted for the merger between B. Riley and Great American » Strong capitalization with estimated $35 million in cash & securities owned as of 9/30/2016 » Pro forma Debt / EV of 12% (1) » $23 million of Adj. EBITDA in FY 2015 and estimated $23 - $24 million of Adj. EBITDA YTD through 9/30/2016 (2) ▪ United Online is estimated to produce $6.5 - $7.0 million of Adj. EBITDA for the quarter ended 9/30/2016 (2,3) » Pro forma Debt / Adj. EBITDA 0.8x (2,4) » Pro forma interest coverage of 8.5x (2,5) Clean Balance Sheet with Strong Cash Flows » Combination of diversified core businesses with multiple high - margin revenue streams ▪ Valuation and Appraisal business offers steady, predictable revenue irrespective of the economic cycle ▪ Liquidations and investment banking offer a natural business cycle hedge and significant operating leverage above their break - even levels ▪ Recent acquisition of United Online, Inc. (“United” or “UNTD”) provides access to a mature business with steady cash flows and compelling risk - adjusted returns » Complementary capabilities in financial advisory and valuations ▪ Enhanced deal flow opportunities from a large platform with broad relationships ▪ Significant, expandable business relationship synergies promote ability to cross - sell core services across business units Attractive, Synergistic Model » Attractive organic growth profile across core businesses driven by long - term macroeconomic trends ▪ Auction and Liquidation segment revenue up 71% Y - o - Y in 2015, driven by shifts in the global consumer/retail industry, and Capital Markets segment revenue up 4% Y - o - Y in 2015 (6) vs. pro forma revenue in 2014 » Significant growth opportunities across existing platforms and new, tangential businesses ▪ Global expansion opportunities ▪ GA Capital Partners has significant growth opportunities in asset - based lending to the lower middle - market with $155+ million of committed capital as of 9/30/2015 – led by investors including KKR & Co. & Tennenbaum Capital Partners Significant Growth Opportunities
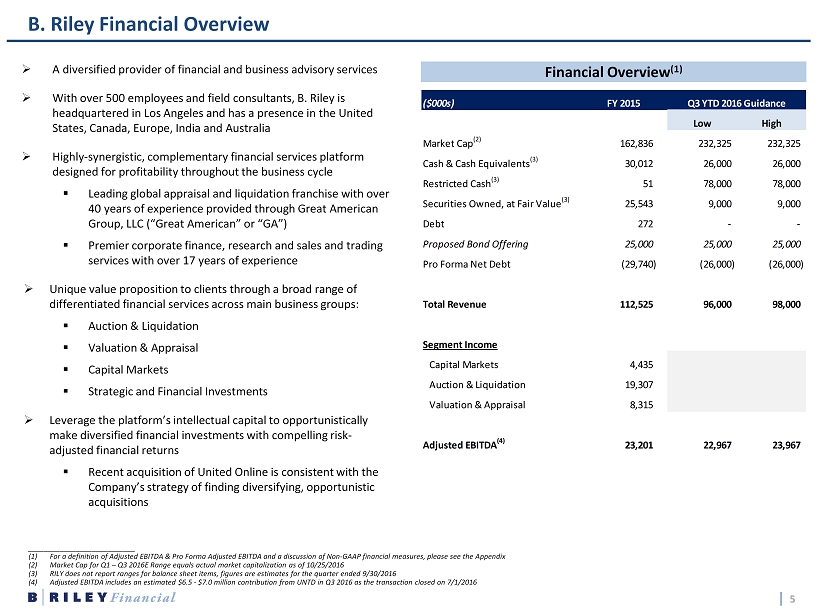
5 B. Riley Financial Overview Financial Overview (1) ___________________________ (1) For a definition of Adjusted EBITDA & Pro Forma Adjusted EBITDA and a discussion of Non - GAAP financial measures, please see the Appendix (2) Market Cap for Q1 – Q3 2016E Range equals actual market capitalization as of 10/25/2016 (3) RILY does not report ranges for balance sheet items, figures are estimates for the quarter ended 9/30/2016 (4) Adjusted EBITDA includes an estimated $6.5 - $7.0 million contribution from UNTD in Q3 2016 as the transaction closed on 7/1/201 6 » A diversified provider of financial and business advisory services » With over 500 employees and field consultants, B. Riley is headquartered in Los Angeles and has a presence in the United States, Canada, Europe, India and Australia » Highly - synergistic, complementary financial services platform designed for profitability throughout the business cycle ▪ Leading global appraisal and liquidation franchise with over 40 years of experience provided through Great American Group, LLC (“Great American” or “GA”) ▪ Premier corporate finance, research and sales and trading services with over 17 years of experience » Unique value proposition to clients through a broad range of differentiated financial services across main business groups: ▪ Auction & Liquidation ▪ Valuation & Appraisal ▪ Capital Markets ▪ Strategic and Financial Investments » Leverage the platform’s intellectual capital to opportunistically make diversified financial investments with compelling risk - adjusted financial returns ▪ Recent acquisition of United Online is consistent with the Company’s strategy of finding diversifying, opportunistic acquisitions ($000s) FY 2015 Low High Market Cap (2) 162,836 232,325 232,325 Cash & Cash Equivalents (3) 30,012 26,000 26,000 Restricted Cash (3) 51 78,000 78,000 Securities Owned, at Fair Value (3) 25,543 9,000 9,000 Debt 272 - - Proposed Bond Offering 25,000 25,000 25,000 Pro Forma Net Debt (29,740) (26,000) (26,000) Total Revenue 112,525 96,000 98,000 Segment Income Capital Markets 4,435 Auction & Liquidation 19,307 Valuation & Appraisal 8,315 Adjusted EBITDA (4) 23,201 22,967 23,967 Q3 YTD 2016 Guidance
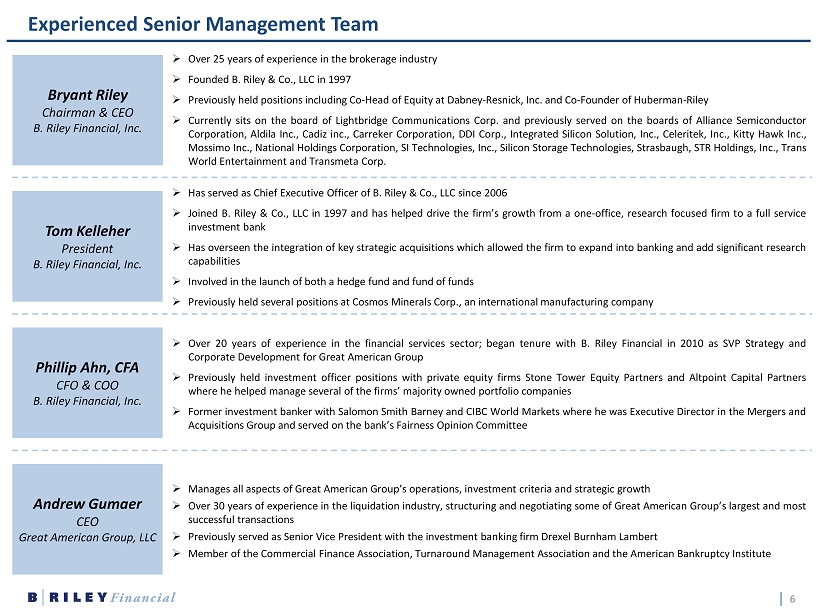
6 Experienced Senior Management Team » Over 25 years of experience in the brokerage industry » Founded B . Riley & Co . , LLC in 1997 » Previously held positions including Co - Head of Equity at Dabney - Resnick, Inc . and Co - Founder of Huberman - Riley » Currently sits on the board of Lightbridge Communications Corp . and previously served on the boards of Alliance Semiconductor Corporation, Aldila Inc . , Cadiz inc . , Carreker Corporation, DDI Corp . , Integrated Silicon Solution, Inc . , Celeritek, Inc . , Kitty Hawk Inc . , Mossimo Inc . , National Holdings Corporation, SI Technologies, Inc . , Silicon Storage Technologies, Strasbaugh, STR Holdings, Inc . , Trans World Entertainment and Transmeta Corp . Bryant Riley Chairman & CEO B. Riley Financial, Inc. Tom Kelleher President B. Riley Financial, Inc. Phillip Ahn, CFA CFO & COO B. Riley Financial, Inc. Andrew Gumaer CEO Great American Group, LLC » Has served as Chief Executive Officer of B . Riley & Co . , LLC since 2006 » Joined B . Riley & Co . , LLC in 1997 and has helped drive the firm’s growth from a one - office, research focused firm to a full service investment bank » Has overseen the integration of key strategic acquisitions which allowed the firm to expand into banking and add significant research capabilities » Involved in the launch of both a hedge fund and fund of funds » Previously held several positions at Cosmos Minerals Corp . , an international manufacturing company » Over 20 years of experience in the financial services sector ; began tenure with B . Riley Financial in 2010 as SVP Strategy and Corporate Development for Great American Group » Previously held investment officer positions with private equity firms Stone Tower Equity Partners and Altpoint Capital Partners where he helped manage several of the firms’ majority owned portfolio companies » Former investment banker with Salomon Smith Barney and CIBC World Markets where he was Executive Director in the Mergers and Acquisitions Group and served on the bank’s Fairness Opinion Committee » Manages all aspects of Great American Group’s operations, investment criteria and strategic growth » Over 30 years of experience in the liquidation industry, structuring and negotiating some of Great American Group’s largest and most successful transactions » Previously served as Senior Vice President with the investment banking firm Drexel Burnham Lambert » Member of the Commercial Finance Association, Turnaround Management Association and the American Bankruptcy Institute

7 B. Riley Financial Business Overview
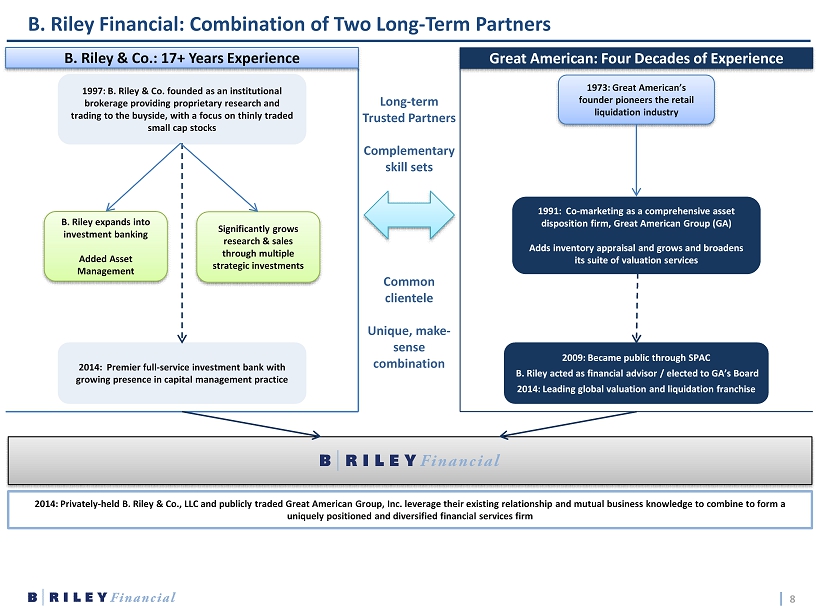
8 B. Riley Financial: Combination of Two Long - Term Partners Long - term Trusted Partners Complementary skill sets Common clientele Unique, make - sense combination 1997: B. Riley & Co. founded as an institutional brokerage providing proprietary research and trading to the buyside, with a focus on thinly traded small cap stocks 2014: Premier full - service investment bank with growing presence in capital management practice B. Riley expands into investment banking Added Asset Management Significantly grows research & sales through multiple strategic investments 2014: Privately - held B. Riley & Co., LLC and publicly traded Great American Group, Inc. leverage their existing relationship and mutual business knowledge to combine to form a uniquely positioned and diversified financial services firm Great American: Four Decades of Experience B. Riley & Co.: 17+ Years Experience 1973: Great American’s founder pioneers the retail liquidation industry 1991: Co - marketing as a comprehensive asset disposition firm, Great American Group (GA) Adds inventory appraisal and grows and broadens its suite of valuation services 2009: Became public through SPAC B. Riley acted as financial advisor / elected to GA’s Board 2014: Leading global valuation and liquidation franchise
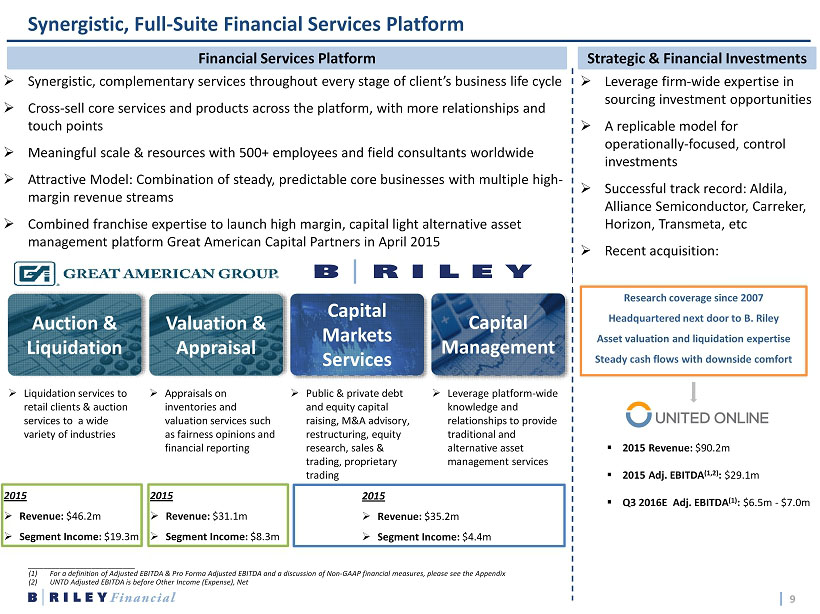
9 Synergistic, Full - Suite Financial Services Platform Financial Services Platform Auction & Liquidation Capital Markets Services » Synergistic, complementary services throughout every stage of client’s business life cycle » Cross - sell core services and products across the platform, with more relationships and touch points » Meaningful scale & resources with 500+ employees and field consultants worldwide » Attractive Model: Combination of steady, predictable core businesses with multiple high - margin revenue streams » Combined franchise expertise to launch high margin, capital light alternative asset management platform Great American Capital Partners in April 2015 Valuation & Appraisal Strategic & Financial Investments » Liquidation services to retail clients & auction services to a wide variety of industries » Appraisals on inventories and valuation services such as fairness opinions and financial reporting » Public & private debt and equity capital raising, M&A advisory, restructuring, equity research, sales & trading, proprietary trading ▪ 2015 Revenue: $90.2m ▪ 2015 Adj. EBITDA (1,2) : $29.1m ▪ Q3 2016E Adj. EBITDA (1) : $6.5m - $7.0m » Leverage firm - wide expertise in sourcing investment opportunities » A replicable model for operationally - focused, control investments » Successful track record: Aldila , Alliance Semiconductor, Carreker, Horizon, Transmeta , etc » Recent acquisition: Capital Management » Leverage platform - wide knowledge and relationships to provide traditional and alternative asset management services 2015 » Revenue: $35.2m » Segment Income: $4.4m 2015 » Revenue: $46.2m » Segment Income: $19.3m 2015 » Revenue: $31.1m » Segment Income: $8.3m Research coverage since 2007 Headquartered next door to B. Riley Asset valuation and liquidation expertise Steady cash flows with downside comfort ___________________________ (1) For a definition of Adjusted EBITDA & Pro Forma Adjusted EBITDA and a discussion of Non - GAAP financial measures, please see the Appendix (2) UNTD Adjusted EBITDA is before Other Income (Expense), Net
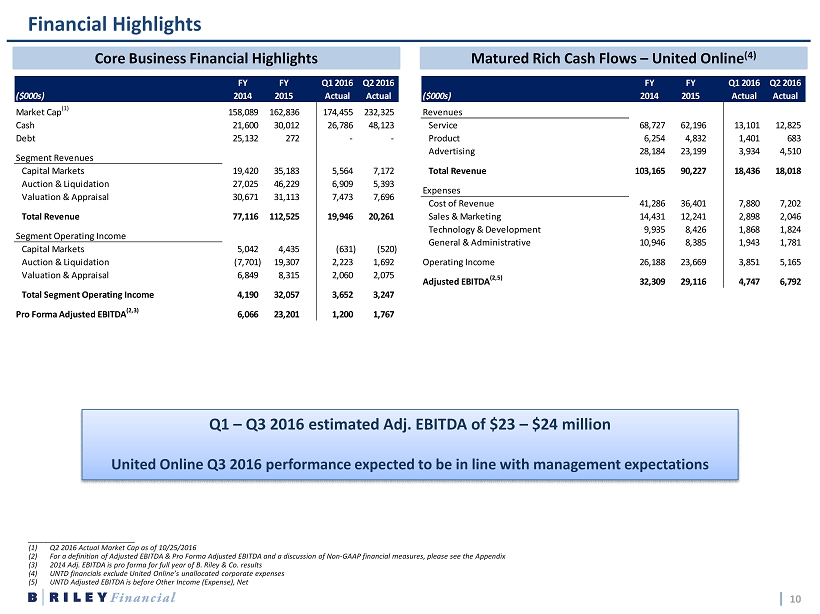
10 Financial Highlights ___________________________ (1) Q2 2016 Actual Market Cap as of 10/25/2016 (2) For a definition of Adjusted EBITDA & Pro Forma Adjusted EBITDA and a discussion of Non - GAAP financial measures, please see the Appendix (3) 2014 Adj. EBITDA is pro forma for full year of B. Riley & Co. results (4) UNTD financials exclude United Online’s unallocated corporate expenses (5) UNTD Adjusted EBITDA is before Other Income (Expense), Net Core Business Financial Highlights Matured Rich Cash Flows – United Online (4) Q1 – Q3 2016 estimated Adj. EBITDA of $23 – $24 million United Online Q3 2016 performance expected to be in line with management expectations ($000s) FY 2014 FY 2015 Q1 2016 Actual Q2 2016 Actual Revenues Service 68,727 62,196 13,101 12,825 Product 6,254 4,832 1,401 683 Advertising 28,184 23,199 3,934 4,510 Total Revenue 103,165 90,227 18,436 18,018 Expenses Cost of Revenue 41,286 36,401 7,880 7,202 Sales & Marketing 14,431 12,241 2,898 2,046 Technology & Development 9,935 8,426 1,868 1,824 General & Administrative 10,946 8,385 1,943 1,781 Operating Income 26,188 23,669 3,851 5,165 Adjusted EBITDA (2,5) 32,309 29,116 4,747 6,792 ($000s) FY 2014 FY 2015 Q1 2016 Actual Q2 2016 Actual Market Cap (1) 158,089 162,836 174,455 232,325 Cash 21,600 30,012 26,786 48,123 Debt 25,132 272 - - Segment Revenues Capital Markets 19,420 35,183 5,564 7,172 Auction & Liquidation 27,025 46,229 6,909 5,393 Valuation & Appraisal 30,671 31,113 7,473 7,696 Total Revenue 77,116 112,525 19,946 20,261 Segment Operating Income Capital Markets 5,042 4,435 (631) (520) Auction & Liquidation (7,701) 19,307 2,223 1,692 Valuation & Appraisal 6,849 8,315 2,060 2,075 Total Segment Operating Income 4,190 32,057 3,652 3,247 Pro Forma Adjusted EBITDA (2,3) 6,066 23,201 1,200 1,767
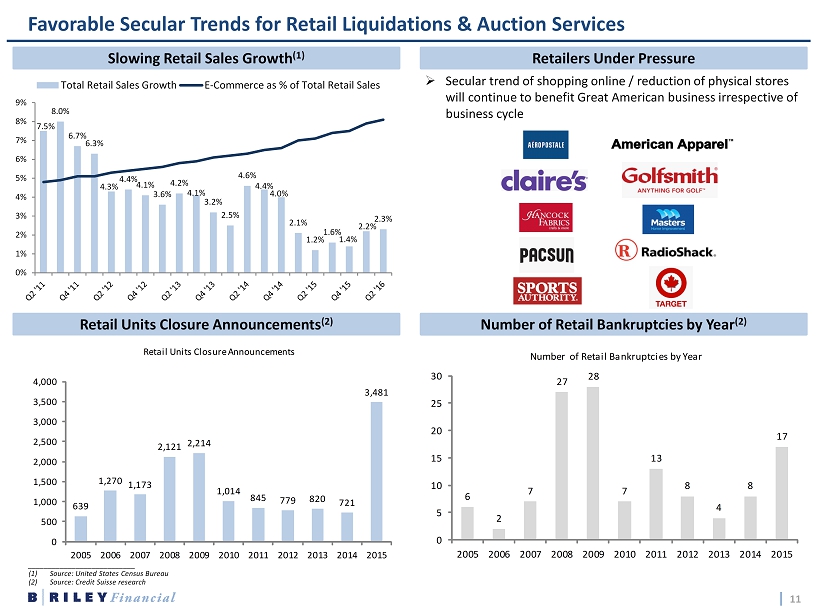
11 » Secular trend of shopping online / reduction of physical stores will continue to benefit Great American business irrespective of business cycle Favorable Secular Trends for Retail Liquidations & Auction Services Slowing Retail Sales Growth (1) Retailers Under Pressure Retail Units Closure Announcements (2) Number of Retail Bankruptcies by Year (2) 639 1,270 1,173 2,121 2,214 1,014 845 779 820 721 3,481 0 500 1,000 1,500 2,000 2,500 3,000 3,500 4,000 2005 2006 2007 2008 2009 2010 2011 2012 2013 2014 2015 Retail Units Closure Announcements 6 2 7 27 28 7 13 8 4 8 17 0 5 10 15 20 25 30 2005 2006 2007 2008 2009 2010 2011 2012 2013 2014 2015 Number of Retail Bankruptcies by Year ___________________________ (1) Source: United States Census Bureau (2) Source: Credit Suisse research 7.5% 8.0% 6.7% 6.3% 4.3% 4.4% 4.1% 3.6% 4.2% 4.1% 3.2% 2.5% 4.6% 4.4% 4.0% 2.1% 1.2% 1.6% 1.4% 2.2% 2.3% 0% 1% 2% 3% 4% 5% 6% 7% 8% 9% Total Retail Sales Growth E-Commerce as % of Total Retail Sales
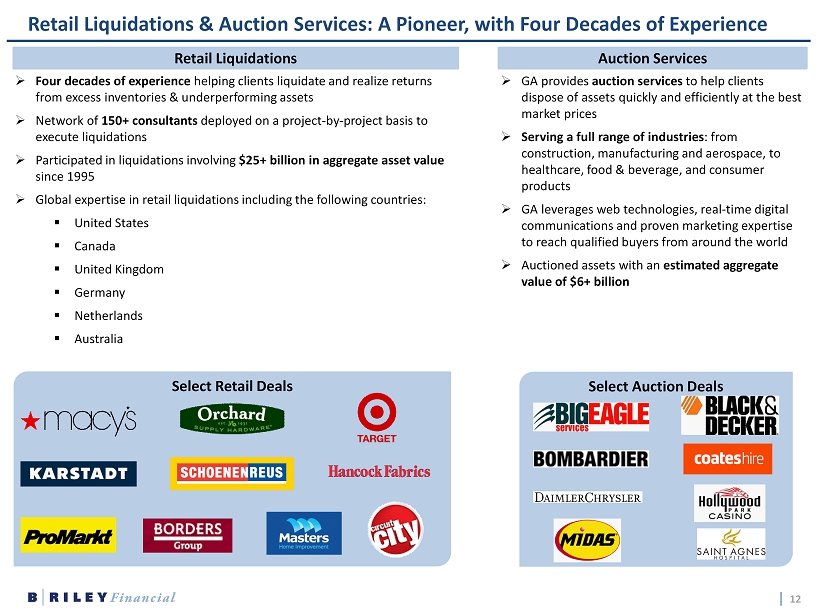
12 Retail Liquidations & Auction Services: A Pioneer, with Four Decades of Experience Retail Liquidations Auction Services » Four decades of experience helping clients liquidate and realize returns from excess inventories & underperforming assets » Network of 150+ consultants deployed on a project - by - project basis to execute liquidations » Participated in liquidations involving $25+ billion in aggregate asset value since 1995 » Global expertise in retail liquidations including the following countries: ▪ United States ▪ Canada ▪ United Kingdom ▪ Germany ▪ Netherlands ▪ Australia » GA provides auction services to help clients dispose of assets quickly and efficiently at the best market prices » Serving a full range of industries : from construction, manufacturing and aerospace, to healthcare, food & beverage, and consumer products » GA leverages web technologies, real - time digital communications and proven marketing expertise to reach qualified buyers from around the world » Auctioned assets with an estimated aggregate value of $6+ billion Select Retail Deals Select Auction Deals
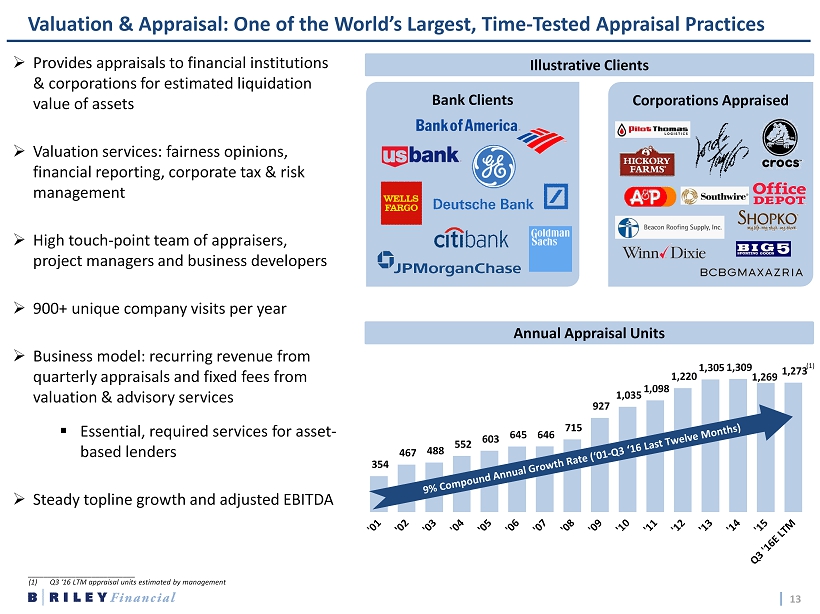
13 Valuation & Appraisal: One of the World’s Largest, Time - Tested Appraisal Practices Bank Clients Corporations Appraised 354 467 488 552 603 645 646 715 927 1,035 1,098 1,220 1,305 1,309 1,269 1,273 Illustrative Clients Annual Appraisal Units » Provides appraisals to financial institutions & corporations for estimated liquidation value of assets » Valuation services: fairness opinions, financial reporting, corporate tax & risk management » High touch - point team of appraisers, project managers and business developers » 900+ unique company visits per year » Business model: recurring revenue from quarterly appraisals and fixed fees from valuation & advisory services ▪ Essential, required services for asset - based lenders » Steady topline growth and adjusted EBITDA (1) ___________________________ (1) Q3 ‘16 LTM appraisal units estimated by management
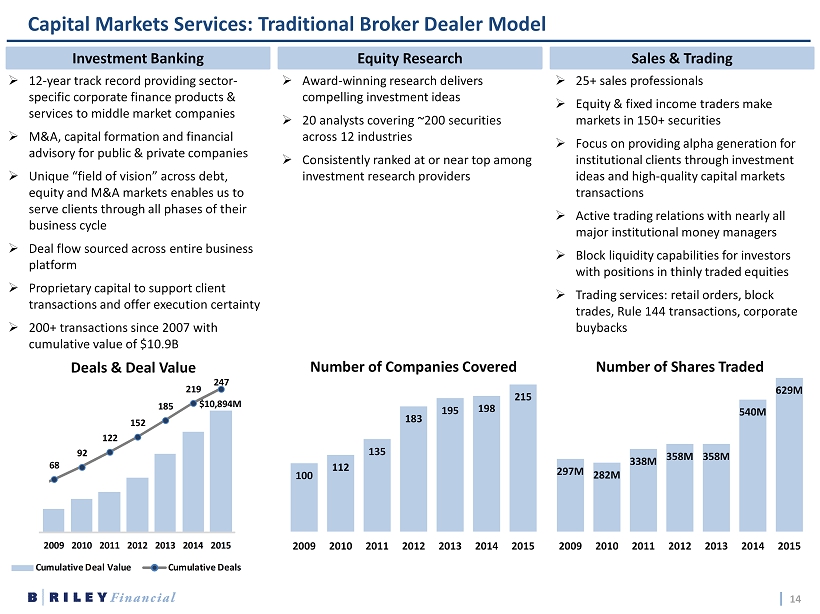
14 Capital Markets Services: Traditional Broker Dealer Model Investment Banking Equity Research Sales & Trading » 12 - year track record providing sector - specific corporate finance products & services to middle market companies » M&A, capital formation and financial advisory for public & private companies » Unique “field of vision” across debt, equity and M&A markets enables us to serve clients through all phases of their business cycle » Deal flow sourced across entire business platform » Proprietary capital to support client transactions and offer execution certainty » 200+ transactions since 2007 with cumulative value of $10.9B » A ward - winning research delivers compelling investment ideas » 20 analysts covering ~200 securities across 12 industries » Consistently ranked at or near top among investment research providers » 25+ sales professionals » Equity & fixed income traders make markets in 150+ securities » Focus on providing alpha generation for institutional clients through investment ideas and high - quality capital markets transactions » Active trading relations with nearly all major institutional money managers » Block liquidity capabilities for investors with positions in thinly traded equities » Trading services: retail orders, block trades, Rule 144 transactions, corporate buybacks Deals & Deal Value 297M 282M 338M 358M 358M 540M 629M 2009 2010 2011 2012 2013 2014 2015 Number of Shares Traded 100 112 135 183 195 198 215 2009 2010 2011 2012 2013 2014 2015 Number of Companies Covered $151M $10,894M 27 46 68 92 122 152 185 219 247 2007 2008 2009 2010 2011 2012 2013 2014 2015 Cumulative Deal Value Cumulative Deals
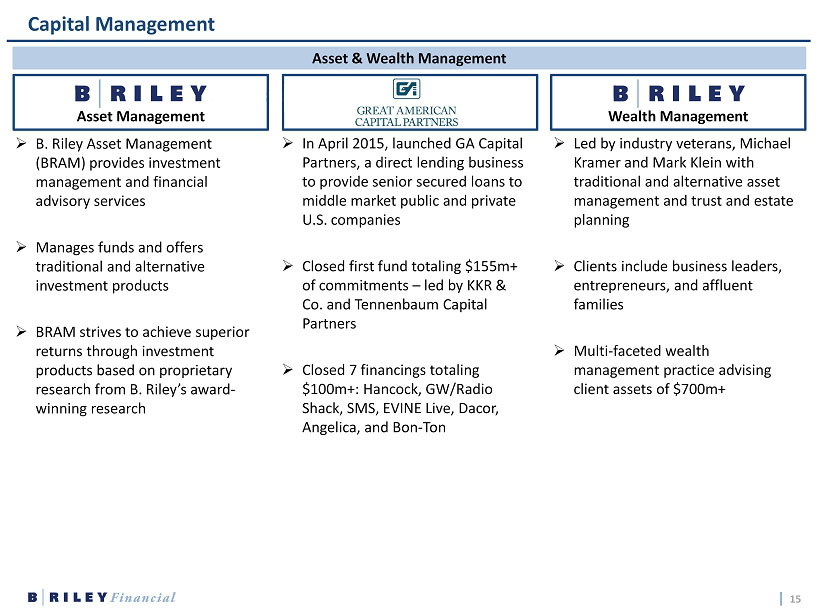
15 Capital Management Asset & Wealth Management Asset Management Wealth Management » B. Riley Asset Management (BRAM) provides investment management and financial advisory services » Manages funds and offers traditional and alternative investment products » BRAM strives to achieve superior returns through investment products based on proprietary research from B. Riley’s award - winning research » In April 2015, launched GA Capital Partners, a direct lending business to provide senior secured loans to middle market public and private U.S. companies » Closed first fund totaling $155m+ of commitments – led by KKR & Co. and Tennenbaum Capital Partners » Closed 7 financings totaling $ 100m +: Hancock, GW/Radio Shack, SMS, EVINE Live, Dacor , Angelica, and Bon - Ton » Led by industry veterans, Michael Kramer and Mark Klein with traditional and alternative asset management and trust and estate planning » Clients include business leaders, entrepreneurs, and affluent families » Multi - faceted wealth management practice advising client assets of $700 m+
16 Proprietary Investment Practice: Acquisition of United Online
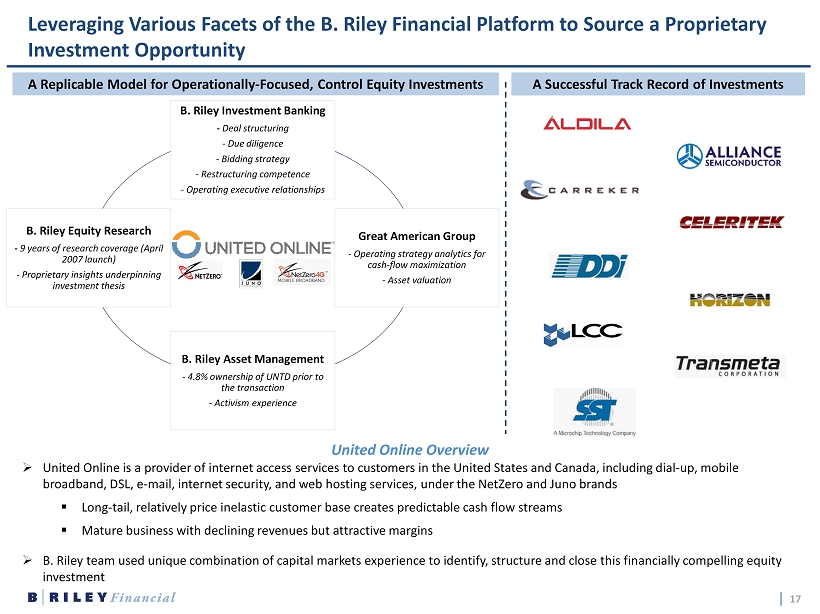
17 B. Riley Investment Banking - Deal structuring - Due diligence - Bidding strategy - Restructuring competence - Operating executive relationships Great American Group - Operating strategy analytics for cash - flow maximization - Asset valuation B. Riley Asset Management - 4.8% ownership of UNTD prior to the transaction - Activism experience B. Riley Equity Research - 9 years of research coverage (April 2007 launch) - Proprietary insights underpinning investment thesis Leveraging Various Facets of the B. Riley Financial Platform to Source a Proprietary Investment Opportunity » United Online is a provider of internet access services to customers in the United States and Canada, including dial - up, mobile broadband, DSL, e - mail, internet security, and web hosting services, under the NetZero and Juno brands ▪ Long - tail, relatively price inelastic customer base creates predictable cash flow streams ▪ Mature business with declining revenues but attractive margins » B. Riley team used unique combination of capital markets experience to identify, structure and close this financially compell ing equity investment United Online Overview A Replicable Model for Operationally - Focused, Control Equity Investments A Successful Track Record of Investments

18 Key Investment Highlights ___________________________ (1) Calculated assuming pro forma debt of $25 million; Enterprise Value calculated using market capitalization of $232.3 million as of 10/25/2016, and estimated cash balance of $51.0 million as of 9/30/2016, pro forma for the offering (2) For a definition of Adjusted EBITDA & Pro Forma Adjusted EBITDA and a discussion of Non - GAAP financial measures, please see the Appendix (3) UNTD Adjusted EBITDA is before Other Income (Expense), Net (4) Calculated assuming pro forma debt of $25 million; Adjusted EBITDA calculated using the annualized midpoint of Q1 – Q3 2016 guid ance, or $31.3 million (5) Adjusted EBTIDA calculated using the annualized midpoint of Q1 – Q3 2016 guidance, or $31.3 million; Interest expense calculated using Q1 – Q3 2016 annualized guidance plus 7.375% annual interest on $25 million of pro forma debt, or $3.7 million (6) Capital Markets segment revenue growth calculated based on total revenue in 2014, unadjusted for the merger between B. Riley and Great American » Strong capitalization with estimated $35 million in cash & securities owned as of 9/30/2016 » Pro forma Debt / EV of 12% (1) » $23 million of Adj. EBITDA in FY 2015 and estimated $23 - $24 million of Adj. EBITDA YTD through 9/30/2016 (2) ▪ United Online is estimated to produce $6.5 - $7.0 million of Adj. EBITDA for the quarter ended 9/30/2016 (2,3) » Pro forma Debt / Adj. EBITDA 0.8x (2,4) » Pro forma interest coverage of 8.5x (2,5) Clean Balance Sheet with Strong Cash Flows » Combination of diversified core businesses with multiple high - margin revenue streams ▪ Valuation and Appraisal business offers steady, predictable revenue irrespective of the economic cycle ▪ Liquidations and investment banking offer a natural business cycle hedge and significant operating leverage above their break - even levels ▪ Recent acquisition of United Online, Inc. (“United” or “UNTD”) provides access to a mature business with steady cash flows and compelling risk - adjusted returns » Complementary capabilities in financial advisory and valuations ▪ Enhanced deal flow opportunities from a large platform with broad relationships ▪ Significant, expandable business relationship synergies promote ability to cross - sell core services across business units Attractive, Synergistic Model » Attractive organic growth profile across core businesses driven by long - term macroeconomic trends ▪ Auction and Liquidation segment revenue up 71% Y - o - Y in 2015, driven by shifts in the global consumer/retail industry, and Capital Markets segment revenue up 4% Y - o - Y in 2015 (6) vs. pro forma revenue in 2014 » Significant growth opportunities across existing platforms and new, tangential businesses ▪ Global expansion opportunities ▪ GA Capital Partners has significant growth opportunities in asset - based lending to the lower middle - market with $155+ million of committed capital as of 9/30/2015 – led by investors including KKR & Co. & Tennenbaum Capital Partners Significant Growth Opportunities

19 Financial Overview
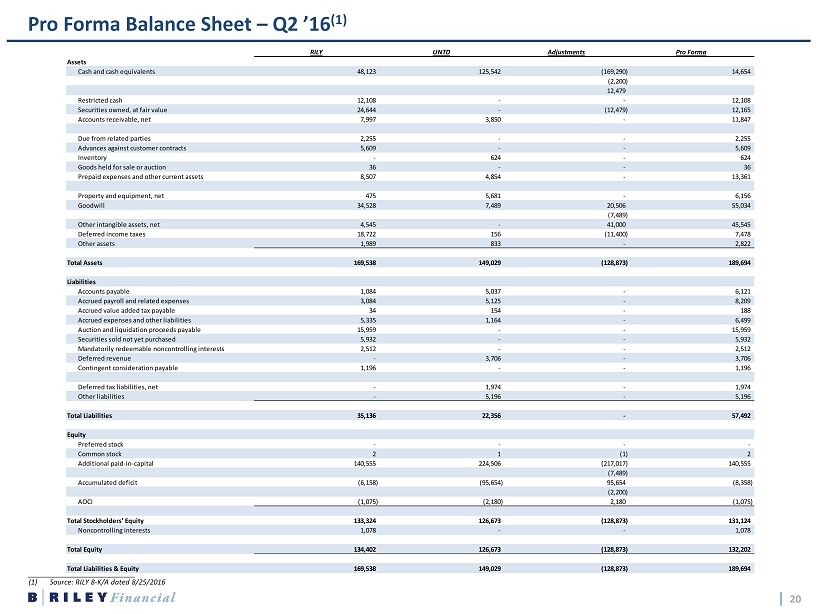
20 1 Pro Forma Balance Sheet – Q2 ’16 (1) ___________________________ (1) Source: RILY 8 - K/A dated 8/25/2016 RILY UNTD Adjustments Pro Forma Assets Cash and cash equivalents 48,123 125,542 (169,290) 14,654 (2,200) 12,479 Restricted cash 12,108 - - 12,108 Securities owned, at fair value 24,644 - (12,479) 12,165 Accounts receivable, net 7,997 3,850 - 11,847 Due from related parties 2,255 - - 2,255 Advances against customer contracts 5,609 - - 5,609 Inventory - 624 - 624 Goods held for sale or auction 36 - - 36 Prepaid expenses and other current assets 8,507 4,854 - 13,361 Property and equipment, net 475 5,681 - 6,156 Goodwill 34,528 7,489 20,506 55,034 (7,489) Other intangible assets, net 4,545 - 41,000 45,545 Deferred income taxes 18,722 156 (11,400) 7,478 Other assets 1,989 833 - 2,822 Total Assets 169,538 149,029 (128,873) 189,694 Liabilities Accounts payable 1,084 5,037 - 6,121 Accrued payroll and related expenses 3,084 5,125 - 8,209 Accrued value added tax payable 34 154 - 188 Accrued expenses and other liabilities 5,335 1,164 - 6,499 Auction and liquidation proceeds payable 15,959 - - 15,959 Securities sold not yet purchased 5,932 - - 5,932 Mandatorily redeemable noncontrolling interests 2,512 - - 2,512 Deferred revenue - 3,706 - 3,706 Contingent consideration payable 1,196 - - 1,196 Deferred tax liabilities, net - 1,974 - 1,974 Other liabilities - 5,196 - 5,196 Total Liabilities 35,136 22,356 - 57,492 Equity Preferred stock - - - - Common stock 2 1 (1) 2 Additional paid-in-capital 140,555 224,506 (217,017) 140,555 (7,489) Accumulated deficit (6,158) (95,654) 95,654 (8,358) (2,200) AOCI (1,075) (2,180) 2,180 (1,075) Total Stockholders' Equity 133,324 126,673 (128,873) 131,124 Noncontrolling interests 1,078 - - 1,078 Total Equity 134,402 126,673 (128,873) 132,202 Total Liabilities & Equity 169,538 149,029 (128,873) 189,694
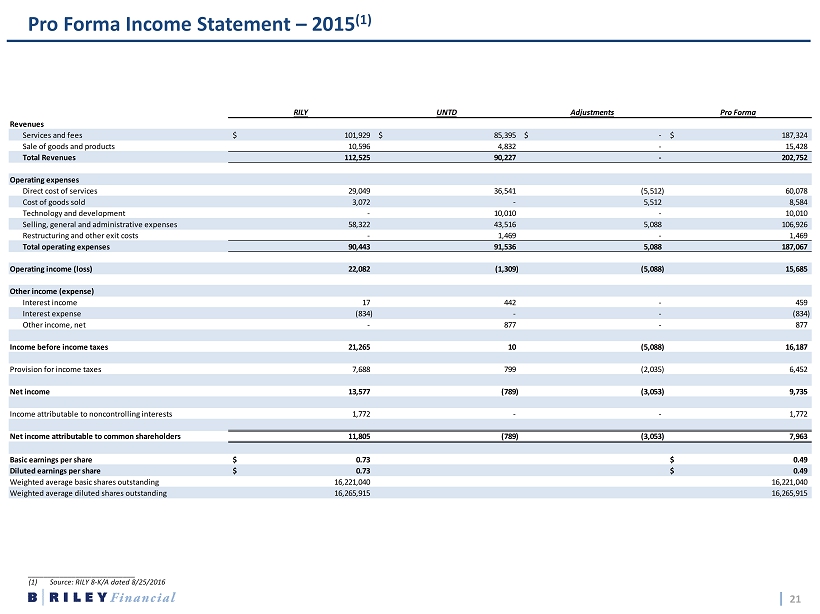
21 1 Pro Forma Income Statement – 2015 (1) ___________________________ (1) Source: RILY 8 - K/A dated 8/25/2016 RILY UNTD Adjustments Pro Forma Revenues Services and fees 101,929$ 85,395$ -$ 187,324$ Sale of goods and products 10,596 4,832 - 15,428 Total Revenues 112,525 90,227 - 202,752 Operating expenses Direct cost of services 29,049 36,541 (5,512) 60,078 Cost of goods sold 3,072 - 5,512 8,584 Technology and development - 10,010 - 10,010 Selling, general and administrative expenses 58,322 43,516 5,088 106,926 Restructuring and other exit costs - 1,469 - 1,469 Total operating expenses 90,443 91,536 5,088 187,067 Operating income (loss) 22,082 (1,309) (5,088) 15,685 Other income (expense) Interest income 17 442 - 459 Interest expense (834) - - (834) Other income, net - 877 - 877 Income before income taxes 21,265 10 (5,088) 16,187 Provision for income taxes 7,688 799 (2,035) 6,452 Net income 13,577 (789) (3,053) 9,735 Income attributable to noncontrolling interests 1,772 - - 1,772 Net income attributable to common shareholders 11,805 (789) (3,053) 7,963 Basic earnings per share 0.73$ 0.49$ Diluted earnings per share 0.73$ 0.49$ Weighted average basic shares outstanding 16,221,040 16,221,040 Weighted average diluted shares outstanding 16,265,915 16,265,915
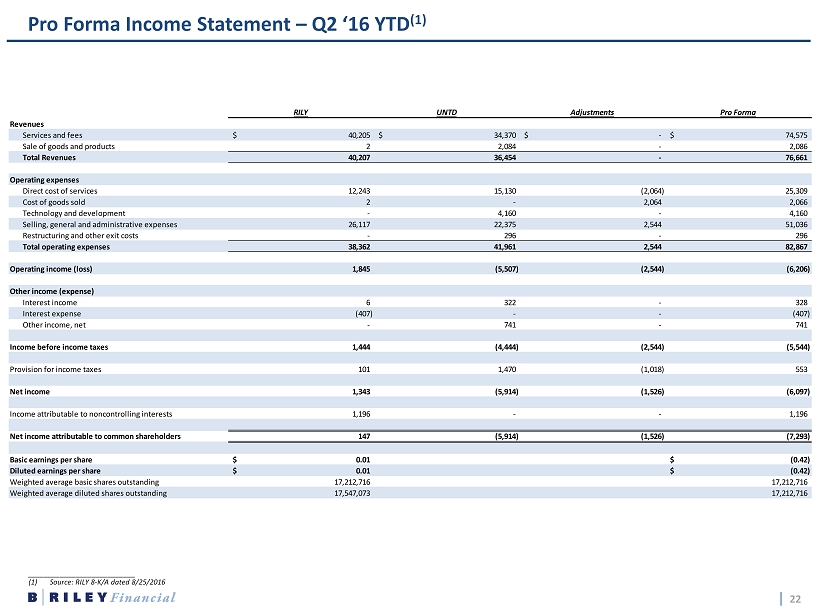
22 1 Pro Forma Income Statement – Q2 ‘16 YTD (1) ___________________________ (1) Source: RILY 8 - K/A dated 8/25/2016 RILY UNTD Adjustments Pro Forma Revenues Services and fees 40,205$ 34,370$ -$ 74,575$ Sale of goods and products 2 2,084 - 2,086 Total Revenues 40,207 36,454 - 76,661 Operating expenses Direct cost of services 12,243 15,130 (2,064) 25,309 Cost of goods sold 2 - 2,064 2,066 Technology and development - 4,160 - 4,160 Selling, general and administrative expenses 26,117 22,375 2,544 51,036 Restructuring and other exit costs - 296 - 296 Total operating expenses 38,362 41,961 2,544 82,867 Operating income (loss) 1,845 (5,507) (2,544) (6,206) Other income (expense) Interest income 6 322 - 328 Interest expense (407) - - (407) Other income, net - 741 - 741 Income before income taxes 1,444 (4,444) (2,544) (5,544) Provision for income taxes 101 1,470 (1,018) 553 Net income 1,343 (5,914) (1,526) (6,097) Income attributable to noncontrolling interests 1,196 - - 1,196 Net income attributable to common shareholders 147 (5,914) (1,526) (7,293) Basic earnings per share 0.01$ (0.42)$ Diluted earnings per share 0.01$ (0.42)$ Weighted average basic shares outstanding 17,212,716 17,212,716 Weighted average diluted shares outstanding 17,547,073 17,212,716

23 Appendix
24 1 Non - GAAP Measures Certain of the information set forth herein, including adjusted EBITDA, pro forma financial information and pro forma adjusted EBITDA, may be considered non - GAAP financial measures . B . Riley Financial believes this information is useful to investors because it provides a basis for measuring the company's available capital resources, the operating performance of its business and its cash flow, excluding net interest expense, provisions for income taxes, depreciation, amortization, transaction expenses, stock - based compensation, restructuring costs and insurance dispute recoveries that would normally be included in the most directly comparable measures calculated and presented in accordance with Generally Accepted Accounting Principles ("GAAP") . In addition, the company's management uses these non - GAAP financial measures along with the most directly comparable GAAP financial measures in evaluating the company's operating performance, capital resources and cash flow . Non - GAAP financial measures should not be considered in isolation from, or as a substitute for, financial information presented in compliance with GAAP, and non - GAAP financial measures as reported by the company may not be comparable to similarly titled amounts reported by other companies . The non - GAAP measures are described above and are reconciled to the corresponding GAAP measure on the following page .
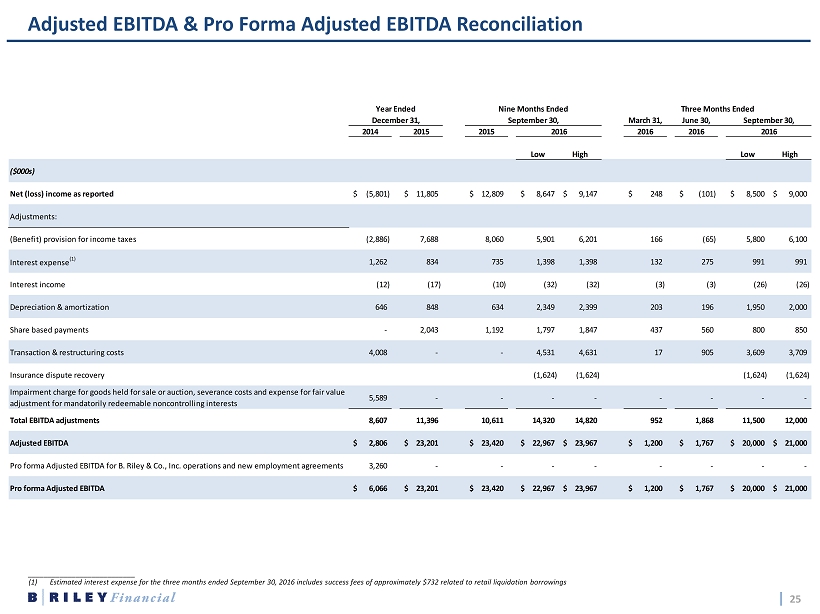
25 1 Adjusted EBITDA & Pro Forma Adjusted EBITDA Reconciliation ___________________________ (1) Estimated interest expense for the three months ended September 30, 2016 includes success fees of approximately $732 related to retail liquidation borrowings March 31, June 30, 2014 2015 2015 2016 2016 Low High Low High ($000s) Net (loss) income as reported (5,801)$ 11,805$ 12,809$ 8,647$ 9,147$ 248$ (101)$ 8,500$ 9,000$ Adjustments: (Benefit) provision for income taxes (2,886) 7,688 8,060 5,901 6,201 166 (65) 5,800 6,100 Interest expense (1) 1,262 834 735 1,398 1,398 132 275 991 991 Interest income (12) (17) (10) (32) (32) (3) (3) (26) (26) Depreciation & amortization 646 848 634 2,349 2,399 203 196 1,950 2,000 Share based payments - 2,043 1,192 1,797 1,847 437 560 800 850 Transaction & restructuring costs 4,008 - - 4,531 4,631 17 905 3,609 3,709 Insurance dispute recovery (1,624) (1,624) (1,624) (1,624) Impairment charge for goods held for sale or auction, severance costs and expense for fair value adjustment for mandatorily redeemable noncontrolling interests 5,589 - - - - - - - - Total EBITDA adjustments 8,607 11,396 10,611 14,320 14,820 952 1,868 11,500 12,000 Adjusted EBITDA 2,806$ 23,201$ 23,420$ 22,967$ 23,967$ 1,200$ 1,767$ 20,000$ 21,000$ Pro forma Adjusted EBITDA for B. Riley & Co., Inc. operations and new employment agreements 3,260 - - - - - - - - Pro forma Adjusted EBITDA 6,066$ 23,201$ 23,420$ 22,967$ 23,967$ 1,200$ 1,767$ 20,000$ 21,000$ 20162016 Year Ended December 31, September 30, Three Months EndedNine Months Ended September 30,