Attached files
| file | filename |
|---|---|
| EX-99.3 - EXHIBIT 99.3 - Ally Financial Inc. | v451225_ex99-3.htm |
| EX-99.1 - EXHIBIT 99.1 - Ally Financial Inc. | v451225_ex99-1.htm |
| 8-K - FORM 8-K - Ally Financial Inc. | v451225_8k.htm |
Exhibit 99.2

Ally Financial Inc. 3Q 2016 Earnings Review Contact Ally Investor Relations at (866) 710 - 4623 or investor.relations@ally.com October 26, 2016

2 3Q 2016 Preliminary Results Forward - Looking Statements and Additional Information The following should be read in conjunction with the financial statements, notes and other information contained in the Compa ny’ s Annual Reports on Form 10 - K, Quarterly Reports on Form 10 - Q, and Current Reports on Form 8 - K . This information is preliminary and based on company and third party data available at the time of the presentation In the presentation that follows and related comments by Ally Financial Inc. (“Ally”) management, the use of the words “expec t,” “anticipate,” “estimate,” “forecast,” “initiative,” “objective,” “plan,” “goal,” “project,” “outlook,” “priorities,” “target,” “explore,” “ pos itions,” “intend,” “evaluate,” “pursue,” “seek,” “may,” “would, ” “could, ” “should, ” “believe, ” “potential, ” “continue,” or the negative of these words, or similar expressions is intended to identify forward - looking statements. All statements herein and in related management comments, other than statements of historical fact, including without limitation, statements about future events and financial performance, are forward - looking statements tha t involve certain risks and uncertainties. While these statements represent our current judgment on what the future may hold, and we believe th ese judgments are reasonable, these statements are not guarantees of any events or financial results, and Ally’s actual results may differ mate ria lly due to numerous important factors that are described in the most recent reports on SEC Forms 10 - K and 10 - Q for Ally, each of which may be revise d or supplemented in subsequent reports filed with the SEC. Such factors include, among others, the following: maintaining the mut ual ly beneficial relationship between Ally and General Motors, and Ally and Chrysler and our ability to further diversify our business; our ability to maintain relationships with automotive dealers; the significant regulation and restrictions that we are subject to as a bank holding company and financial holding company; the potential for deterioration in the residual value of off - lease vehicles; disruptions in the market in which we fund our operations, with resulting negative impact on our liquidity; changes in our accounting assumptions that may require or that r esu lt from changes in the accounting rules or their application, which could result in an impact on earnings; changes in our credit ratings; changes in economic conditions, currency exchange rates or political stability in the markets in which we operate; and changes in the existing or th e adoption of new laws, regulations, policies or other activities of governments, agencies and similar organizations (including as a result of the Dodd - Frank Act and Basel III). Investors are cautioned not to place undue reliance on forward - looking statements. Ally undertakes no obligation to update publi cly or otherwise revise any forward - looking statements, whether as a result of new information, future events or other such factors that affect t he subject of these statements, except where expressly required by law. Certain non - GAAP measures are provided in this presentation which are important to the reader of the Consolidated Financial Statements but should be supplemental and not a substitute for to primary U.S. GAAP measures. Reconciliation of non - GAAP financial measures are included within this presentation. Use of the term “loans” describes products associated with direct and indirect lending activities of Ally’s operations. The s pec ific products include retail installment sales contracts, lines of credit, leases or other financing products. The term “originate” refers to Ally’ s p urchase, acquisition or direct origination of various “loan” products.
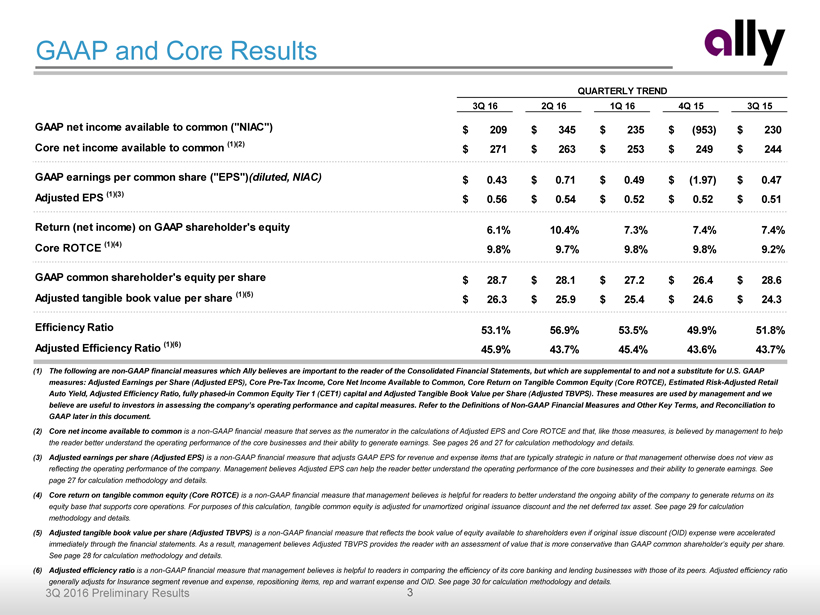
3 3Q 2016 Preliminary Results GAAP and Core Results (1) The following are non - GAAP financial measures which Ally believes are important to the reader of the Consolidated Financial Statemen ts, but which are supplemental to and not a substitute for U.S. GAAP measures: Adjusted Earnings per Share (Adjusted EPS), Core Pre - Tax Income, Core Net Income Available to Common, Core Return on T angible Common Equity (Core ROTCE), Estimated Risk - Adjusted Retail Auto Yield, Adjusted Efficiency Ratio, fully phased - in Common Equity Tier 1 (CET1) capital and Adjusted Tangible Book Value per Share (Adjusted TBVPS). These measures are used by management and we believe are useful to investors in assessing the company’s operating performance and capital measures. Refer to the Definitions of Non - GAAP Financial Measures and Other Key Term s, and Reconciliation to GAAP later in this document. (2) Core net income available to common is a non - GAAP financial measure that serves as the numerator in the calculations of Adjusted EPS and Core ROTCE and that, like those measures, is believed by management to help the reader better understand the operating performance of the core businesses and their ability to generate earnings. See pages 26 and 27 for calculation methodology and details. (3) Adjusted earnings per share (Adjusted EPS) is a non - GAAP financial measure that adjusts GAAP EPS for revenue and expense items that are typically strategic in nature or that management otherwise does not view as reflecting the operating performance of the company. Management believes Adjusted EPS can help the reader better understand t he operating performance of the core businesses and their ability to generate earnings. See page 27 for calculation methodology and details. (4) Core return on tangible common equity (Core ROTCE) is a non - GAAP financial measure that management believes is helpful for readers to better understand the ongoing ability of the company to generate returns on its equity base that supports core operations. For purposes of this calculation, tangible common equity is adjusted for unamortized original issuance discount a nd the net deferred tax asset. See page 29 for calculation methodology and details. (5) Adjusted tangible book value per share (Adjusted TBVPS) is a non - GAAP financial measure that reflects the book value of equity available to shareholders even if original issue discoun t (OID) expense were accelerated immediately through the financial statements. As a result, management believes Adjusted TBVPS provides the reader with an ass ess ment of value that is more conservative than GAAP common shareholder’s equity per share. See page 28 for calculation methodology and details . (6) Adjusted efficiency ratio is a non - GAAP financial measure that management believes is helpful to readers in comparing the efficiency of its core banking and lending businesses with those of its peers. Adjusted efficiency ratio generally adjusts for Insurance segment revenue and expense, repositioning items, rep and warrant expense and OID. See page 3 0 f or calculation methodology and details. 3Q 16 2Q 16 1Q 16 4Q 15 3Q 15 GAAP net income available to common ("NIAC") 209$ 345$ 235$ (953)$ 230$ Core net income available to common (1)(2) 271$ 263$ 253$ 249$ 244$ GAAP earnings per common share ("EPS")(diluted, NIAC) 0.43$ 0.71$ 0.49$ (1.97)$ 0.47$ Adjusted EPS (1)(3) 0.56$ 0.54$ 0.52$ 0.52$ 0.51$ Return (net income) on GAAP shareholder's equity 6.1% 10.4% 7.3% 7.4% 7.4% Core ROTCE (1)(4) 9.8% 9.7% 9.8% 9.8% 9.2% GAAP common shareholder's equity per share 28.7$ 28.1$ 27.2$ 26.4$ 28.6$ Adjusted tangible book value per share (1)(5) 26.3$ 25.9$ 25.4$ 24.6$ 24.3$ Efficiency Ratio 53.1% 56.9% 53.5% 49.9% 51.8% Adjusted Efficiency Ratio (1)(6) 45.9% 43.7% 45.4% 43.6% 43.7% QUARTERLY TREND
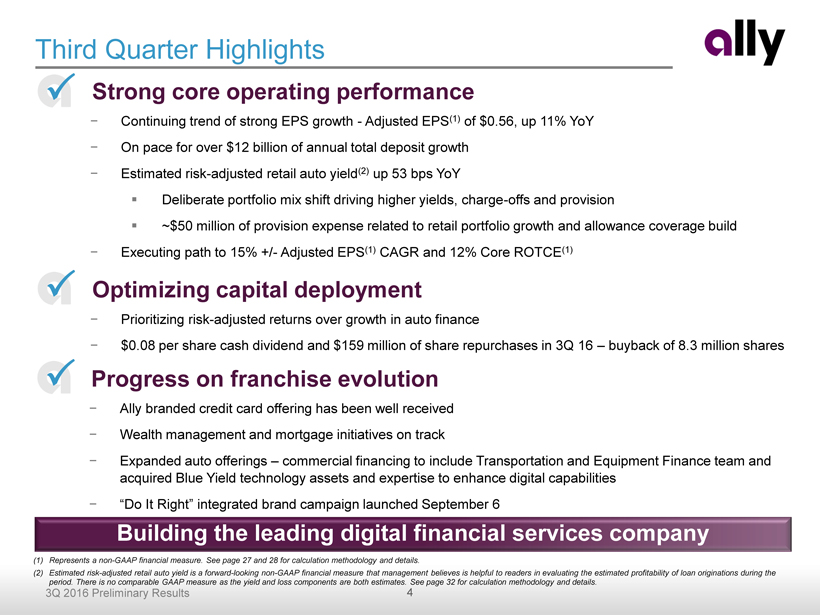
4 3Q 2016 Preliminary Results • Progress on franchise evolution − Ally branded credit card offering has been well received − Wealth management and mortgage initiatives on track − Expanded auto offerings – commercial financing to include Transportation and Equipment Finance team and acquired Blue Yield technology assets and expertise to enhance digital capabilities − “ Do It Right” integrated brand campaign launched September 6 • Strong core operating performance − Continuing trend of strong EPS growth - Adjusted EPS (1) of $0.56, up 11% YoY − On pace for over $12 billion of annual total deposit growth − Estimated risk - adjusted retail auto yield (2) up 53 bps YoY ▪ Deliberate portfolio mix shift driving higher yields, charge - offs and provision ▪ ~$50 million of provision expense related to retail portfolio growth and allowance coverage build − Executing path to 15% +/ - Adjusted EPS (1) CAGR and 12% Core ROTCE (1) Third Quarter Highlights (1) Represents a non - GAAP financial measure. See page 27 and 28 for calculation methodology and details . (2) Estimated risk - adjusted retail auto yield is a forward - looking non - GAAP financial measure that management believes is helpful to readers in evaluating t he estimated profitability of loan originations during the period. There is no comparable GAAP measure as the yield and loss components are both estimates. See page 32 for calculation methodology and details. Building the leading digital financial services company P • Optimizing capital deployment − Prioritizing risk - adjusted returns over growth in auto finance − $0.08 per share cash dividend and $159 million of share repurchases in 3Q 16 – buyback of 8.3 million shares P P

5 3Q 2016 Preliminary Results Third Quarter Financial Results (1) Represents a non - GAAP financial measure. Excludes OID . See page 32 for calculation methodology and details. (2) Repositioning items are primarily related to the extinguishment of high - cost legacy debt and strategic activities. Other primarily includes certain discrete tax items. See page 27 for details . (3) Represents a non - GAAP financial measure. See pages 27, 29 and 30 for calculation methodology and details. (4) 2Q16 effective tax rate was impacted by a $ 98 million tax benefit from a tax reserve release related to a prior year federal tax return ($ millions except per share data) 3Q 16 2Q 16 3Q 15 2Q 16 3Q 15 Net financing revenue (excld OID) (1) 1,011$ 998$ 981$ 13$ 29$ OID expense (15) (14) (11) (1) (3) Net financing revenue (as reported) 996 984 970 12 26 Total other revenue 388 374 332 14 56 Provision for loan losses 258 172 211 86 47 Controllable expenses 479 463 452 16 27 Other noninterest expenses 256 310 222 (54) 34 Pre-tax income from continuing operations 391$ 413$ 417$ (22)$ (26)$ Income tax expense 130 56 144 74 (14) (Loss) income from discontinued operations, net of tax (52) 3 (5) (55) (47) Net income 209$ 360$ 268$ (151)$ (59)$ Preferred dividends - 15 38 (15) (38) Net income available to common 209$ 345$ 230$ (136)$ (21)$ 3Q 16 2Q 16 3Q 15 2Q 16 3Q 15 GAAP EPS (diluted) $0.43 $0.71 $0.47 (0.28)$ (0.04)$ Discontinued operations, net of tax 0.11 (0.01) 0.01 0.11 0.10 OID expense 0.02 0.02 0.02 0.00 0.00 Repositioning / other (2) - (0.18) 0.00 0.18 (0.00) Adjusted EPS (3) $0.56 $0.54 $0.51 0.02$ 0.05$ Core ROTCE (3) 9.8% 9.7% 9.2% Adjusted Efficiency Ratio (3) 45.9% 43.7% 43.7% Effective Tax Rate (4) 33.2% 13.7% 34.5% Increase / (Decrease) vs.

6 3Q 2016 Preliminary Results Net Interest Margin • Net Interest Margin (“NIM”) of 2.69% up 5 bps YoY driven by higher retail auto yields • NIM (excluding OID) (1) of 2.73% up 6 bps YoY • Increased asset sensitivity during 3Q (see page 24 for details) (1) Represents a non - GAAP financial measure. Excludes OID. See page 32 for calculation methodology and details. (2) Includes brokered deposits. Includes average noninterest - bearing deposits of $97 million in 3Q16, $91 million in 2Q16, and $91 million in 3Q15 (3) Includes Demand Notes, FHLB, and Repurchase Agreements (4) Excludes dividend income from equity investments Net Interest Margin Variance ($ millions) Average Balance Yield Average Balance Yield Average Balance Yield Retail Auto Loan 64,223$ 5.58% 63,621$ 5.47% 62,115$ 5.24% Auto Lease (net of dep) 13,232 7.25% 14,392 7.46% 17,519 6.84% Commercial Auto 34,905 3.03% 34,800 3.03% 31,726 2.85% Corporate Finance 3,115 6.39% 2,973 6.36% 2,309 6.19% Mortgage 11,052 3.24% 10,764 3.36% 9,564 3.36% Cash, Securities and Other 20,080 1.98% 20,269 1.94% 21,413 1.83% Total Earning Assets 146,607$ 4.47% 146,819$ 4.47% 144,646$ 4.30% Interest Revenue 1,648$ 1,630$ 1,567$ LT Unsecured Debt 21,714$ 4.87% 22,698$ 4.80% 20,884$ 4.96% Secured Debt 32,343 1.62% 34,019 1.56% 42,150 1.19% Deposits (2) 74,263 1.14% 71,570 1.14% 62,882 1.14% Other Borrowings (3) 10,834 1.14% 10,862 1.15% 11,890 0.83% Total Funding Sources (1) 139,154$ 1.83% 139,149$ 1.84% 137,806$ 1.71% Interest Expense 641$ 637$ 593$ Net Financing Revenue (4) 1,007$ 993$ 974$ NIM (excluding OID) (1) 2.73% 2.72% 2.67% NIM (as reported) 2.69% 2.68% 2.64% 3Q 16 2Q 16 3Q 15

7 3Q 2016 Preliminary Results ($ billions) $4.4 $3.7 $1.7 $2.2 $9.1 2017 2018 2019 2020 2021+ Unsecured Long - Term Debt Maturities • Significant amount of unsecured long - term debt maturities over the next several years • Expect significant decline in unsecured debt footprint as maturities roll off and are replaced with deposit funding Significant Savings as Unsecured Debt Declines Weighted Average Coupon (1) 4.5% 4.3% 3.6% 6.5% 6.2% (1) Weighted average coupon based on notional value and corresponding coupon for all unsecured bonds within the given year (2) ‘2021+’ includes ~$2.7 billion of t rust preferred securities (TruPS) which qualify for tier 1 regulatory capital Attractive uses of $12+ billion of annual deposit growth expected to drive higher net interest income $12 billion of maturities with weighted - average cost of 4.7% (2)

8 3Q 2016 Preliminary Results Illustrative View of Potential Deposit Growth Value $ 40+ billion Deposit Growth next 3 - 4 years » Retail » Sweep » Brokered 2.0 % + Attractive Uses » Retire Unsecured Debt » Reduce Secured Debt » Capital Efficient Asset Growth − Mortgage − Securities Portfolio − Corporate Finance − Alternative Auto $ 800+ million Incremental Profits Contribution Margin on average Incremental Revenue » ~$1.20 - $1.40 of incremental annual EPS » Does not include: − Higher asset yields − Wealth Management fee growth − Mortgage Origination fee growth − Other drivers Customer growth also important strategically with product expansion initiatives

9 3Q 2016 Preliminary Results ($ billions; average customer balance $ thousands) 12% 13% 26% 88% 87% 74% $5.0 $6.8 $10.4 $52.8k $52.1k $53.7k 3Q 14 3Q 15 3Q 16 Exisiting Customers New Customers Average Customer Balance Ally Bank Deposit Levels (EOP) ($ billions) $53.5 $55.4 $59.0 $61.2 $63.9 $10.2 $10.7 $11.0 $11.3 $11.6 $63.7 $66.2 $70.0 $72.5 $75.4 3Q 15 4Q 15 1Q 16 2Q 16 3Q 16 Ally Bank Retail Ally Bank Brokered Deposits • Continued strong retail deposit growth in 3Q 16 – $2.6 billion of retail deposit growth QoQ and $10.4 billion YoY • Total deposits up $11.7 billion YoY • Average retail deposit rate down 4 bps YoY • Strategically important to grow customers and deposits – Expanded product offerings – Reduce capital markets funding and minimize deposit beta Stable, consistent growth of retail deposits Deposit Mix Last 12 Months Retail Deposit Growth Ally Bank Deposit Composition (EOP) and Average Retail Portfolio Interest Rate 16% 16% 16% 16% 15% 34% 32% 30% 29% 28% 50% 52% 54% 55% 57% 1.14% 1.12% 1.11% 1.11% 1.10% 3Q 15 4Q 15 1Q 16 2Q 16 3Q 16 Brokered Retail CD MMA/OSA/Checking Average Retail Portfolio Interest Rate

10 3Q 2016 Preliminary Results Capital • Preliminary fully phased - in Basel III CET1 ratio of 9.3% • Risk - weighted assets relatively flat while net financing revenue has steadily increased • Initiated $0.08 per share dividend in 3Q 16; Board approved $0.08 per share 4Q 16 dividend • 3Q 16 share repurchases equated to ~1.7% reduction of total shares outstanding (1) All capital ratios represent fully phased - in Basel III which are non - GAAP financial measures; See page 31 for details Capital Ratios (1) and Risk - Weighted Assets Deferred Tax Asset Utilization Note: reflects Basel III fully phased - in disallowed DTA. Disallowed DTA is phased in to CET1 during transition period. See page 31 for more details 3Q 16 Share Buyback Summary Shares Repurchased (MM) 8.3 Dollars ($MM) $159 Average Price Paid Per Share $19.2 Shares Outstanding Decrease (net) -1.7% $135 $136 $134 $134 $136 12.9% 12.5% 13.0% 12.8% 12.7% 11.9% 11.1% 11.5% 11.1% 11.1% 9.6% 8.7% 9.2% 9.3% 9.3% 3Q 15 4Q 15 1Q 16 2Q 16 3Q 16 Risk-Weighted Assets ($B) Total Capital Ratio Tier 1 Ratio CET1 ($ millions) $1,449 $1,359 $1,130 $1,065 $948 $952 $980 $826 $777 $667 3Q 15 4Q 15 1Q 16 2Q 16 3Q 16 Net GAAP DTA Balance Disallowed DTA

11 3Q 2016 Preliminary Results $160 $132 $96 $156 $194 $173 $148 $219 1.10% 0.93% 0.65% 1.01% 1.21% 1.08% 0.94% 1.37% 0.99% 1.18% 1.04% 0.88% 1.28% $0 $20 $40 $60 $80 $100 $120 $140 $160 $180 $200 $220 $240 $260 $280 $300 $320 $340 $360 $380 $400 4Q 14 1Q 15 2Q 15 3Q 15 4Q 15 1Q 16 2Q 16 3Q 16 Net Charge-Offs ($M) Annualized NCO Rate Annualized NCO% (excld Asset Sales) 0.98% Coverage Rate 0.93% 0.99%0.93% 0.94% 0.94% 0.97% 0.97% 144% 155% 244% 158% 133% 150% 179% 133% 0.68% 0.61% 0.39% 0.61% 0.72% 0.64% 0.54% 0.75% 50% 4Q 14 1Q 15 2Q 15 3Q 15 4Q 15 1Q 16 2Q 16 3Q 16 ALLL as % of Annualized NCOs Annualized NCO Rate (30+ DPD) $1,543 $1,076 $1,389 $1,656 $1,886 $1,387 $1,643 $1,823 2.73% 1.87% 2.29% 2.60% 2.93% 2.20% 2.60% 2.81% 4Q 14 1Q 15 2Q 15 3Q 15 4Q 15 1Q 16 2Q 16 3Q 16 Delinquent Contracts ($M) Delinquency Rate Consolidated Net Charge - Offs Provision Expense Asset Quality U.S. Retail Auto Net Charge - Offs U.S. Retail Auto Delinquencies Note: Above loans are classified as held - for - investment and recorded at gross carrying value Note: Includes accruing contracts only Note: See page 26 for definition ( 1) Annualized NCO% ( excluding Asset Sales) removes asset sales from 3Q15 – 3Q16 ; approximately $ 6.8 billion of gross assets sold (1) Note: Retail auto loans exclude fair value adjustments for loans in hedge accounting relationship ($ millions) Provision Expense 2Q 15 3Q 15 4Q 15 1Q 16 2Q 16 3Q 16 Retail Auto 152$ 200$ 229$ 207$ 168$ 269$ Commercial Auto (20) 1 7 2 2 1 Mortgage Finance 4 3 (2) 3 - 1 Corporate Finance 4 4 6 6 3 3 Corp/Other - 3 - 2 (1) (16) Total 140$ 211$ 240$ 220$ 172$ 258$ Retail Auto Coverage Ratio 1.26% 1.27% 1.30% 1.35% 1.36% 1.41% Retail Auto Loan Bal (EOP, $ billions) 60.7$ 63.5$ 64.2$ 62.9$ 63.2$ 64.8$

12 3Q 2016 Preliminary Results Prime, Secured Balance Sheet • Portfolio consists of predominately prime , short duration, secured consumer and commercial loans Asset Class Portfolio (9/30/16) 3Q 2016 NCO% 3Q 2016 NCO $ Primary Drivers Retail Auto $65B 137 bps $219MM Credit mix, used vehicle prices, employment and consumer health Commercial Auto $36B 0 bps $0MM Dealer health, collateral strength Mortgage $11B (22) bps ($6)MM Credit mix, home prices, employment and consumer health Corporate Finance $3B 0 bps $0MM Economy and collateral position Total Loan Portfolio $115B 75 bps $213MM Memo: Lease $13B n/a (1) Residual setting and used vehicle prices Note: Net Charge - Off(“NCO”); Portfolio is end - of - period balances as of 9/30/16 Note: Retail auto loans exclude fair value adjustments for loans in hedge accounting relationship (1) Lease residual impact and net - charge off activity is included within depreciation expense

13 3Q 2016 Preliminary Results Key Financials ($ millions) 3Q 16 2Q 16 3Q 15 Net financing revenue 933$ 4$ 63$ Total other revenue 74 (3) 11 Total net revenue 1,007 1 74 Provision for loan losses 270 100 69 Noninterest expense 418 8 9 Pre-tax income from continuing ops 319$ (107)$ (4)$ U.S. auto earning assets (EOP) 113,475$ 1,276$ 358$ Net lease revenue Operating lease revenue 649$ (52)$ (181)$ Depreciation expense 470 (50) (163) Remarketing gains 62 (24) (43) Total depreciation expense 408 (26) (120) Net lease revenue 241$ (26)$ (61)$ Increase/(Decrease) vs. • Auto Finance reported pre - tax income of $319 million in 3Q, down $4 million YoY and down $107 million QoQ – Net financing revenue higher YoY due to portfolio mix and strategic pricing actions – Provision higher YoY primarily driven by mix shift and higher retail portfolio offsetting lease decline ▪ Provision up QoQ driven by seasonally higher retail charge - offs ▪ Newer vintages seasoning into peak loss period ▪ Increased allowance balance and coverage ratio • Used vehicle prices down ~5 - 6% YoY • Earning assets up $0.4 billion YoY and up $1.3 billion QoQ – Commercial balances up $3.7 billion YoY • $9.3 billion of consumer originations in 3Q 16 – Expanding estimated retail auto risk - adjusted yields (1) – 84% bank funded in 3Q 16, up from 76% in the PYQ – Nonprime (<620 FICO) retail originations down 36% YoY Auto Finance – Results (1) Estimated originated retail auto yield and estimated net average annualized loss rate at time of booking are forward - looking non - GAAP financial measures. See page 32 for calculation methodology and details. Retail Originations Total Average Originated Yield and NAALR (1) % Nonprime (<620 FICO) Retail Originations 14.4% 13.7% 12.6% 11.4% 11.1% 5.27% 5.53% 5.85% 5.83% 5.91% 1.09% 1.17% 1.17% 1.24% 1.20% 3Q 15 4Q 15 1Q 16 2Q 16 3Q 16 Total Originated Yield NAALR +64 bps +11 bps
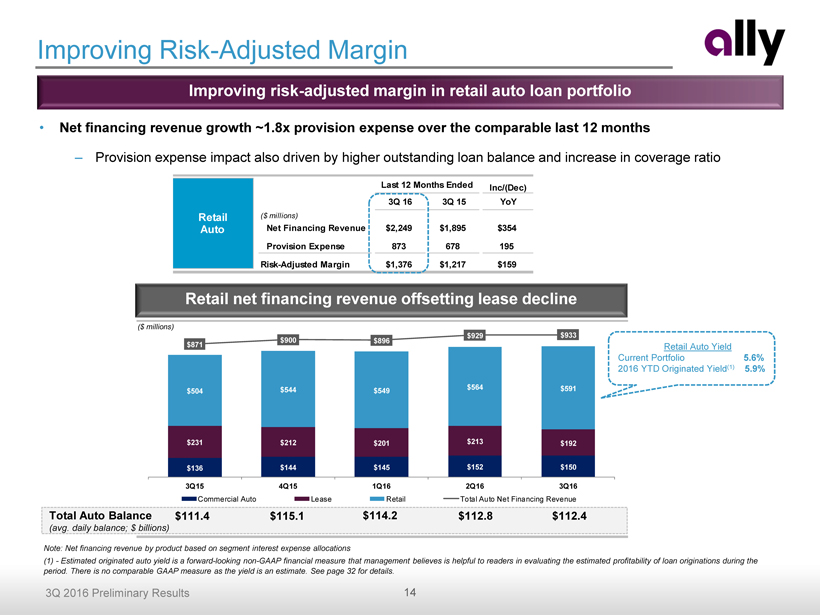
14 3Q 2016 Preliminary Results Last 12 Months Ended Inc/(Dec) 3Q 16 3Q 15 YoY ($ millions) Net Financing Revenue $2,249 $1,895 $354 Provision Expense 873 678 195 Risk-Adjusted Margin $1,376 $1,217 $159 Retail Auto • Net financing revenue growth ~1.8x provision expense over the comparable last 12 months – Provision expense impact also driven by higher outstanding loan balance and increase in coverage ratio Improving Risk - Adjusted Margin Improving risk - adjusted margin in retail auto loan portfolio Note: Net financing revenue by product based on segment interest expense allocations (1) - Estimated originated auto yield is a forward - looking non - GAAP financial measure that management believes is helpful to readers in evaluating the estimated profitability of loan originations during the period. There is no comparable GAAP measure as the yield is an estimate. See page 32 for details . Retail Auto Yield Current Portfolio 5.6% 2016 YTD Originated Yield (1) 5.9% Total Auto Balance (avg . daily balance; $ billions) $111.4 $115.1 $114.2 $112.8 $112.4 Retail net financing revenue offsetting lease decline ($ millions) $136 $144 $145 $152 $150 $231 $212 $201 $213 $192 $504 $544 $549 $564 $591 $871 $900 $896 $929 $933 3Q15 4Q15 1Q16 2Q16 3Q16 Commercial Auto Lease Retail Total Auto Net Financing Revenue

15 3Q 2016 Preliminary Results (EOP $ billions) $62.1 $63.5 $64.2 $62.9 $63.2 $64.8 $17.9 $17.3 $16.3 $15.0 $13.8 $12.7 $83.6 $85.7 $85.3 $84.6 $84.3 $83.8 2Q 15 3Q 15 4Q 15 1Q 16 2Q 16 3Q 16 On Balance Sheet Retail Serviced for Others Lease ($ billions) $32.5 $31.7 $34.1 $34.0 $34.8 $34.9 2Q 15 3Q 15 4Q 15 1Q 16 2Q 16 3Q 16 (% of $ originations) 6% 7% 3% 1% 1% 1% 48% 49% 49% 45% 46% 48% 9% 9% 11% 9% 9% 11% 37% 35% 37% 45% 43% 40% 2Q 15 3Q 15 4Q 15 1Q 16 2Q 16 3Q 16 New Retail Subvented New Retail Standard Lease Used ($ billions; % of $ originations) 45% 45% 40% 37% 35% 35% 24% 24% 26% 26% 28% 29% 32% 32% 33% 37% 37% 36% $10.8 $11.1 $9.3 $9.0 $9.4 $9.3 2Q 15 3Q 15 4Q 15 1Q 16 2Q 16 3Q 16 GM Chrysler Growth Auto Finance – Key Metrics See page 26 for definitions Consumer Assets Commercial Assets Consumer Originations Origination Mix Note: Asset balances reflect the average daily balance for the quarter See page 26 for definitions

16 3Q 2016 Preliminary Results Key Financials ($ millions) 3Q 16 2Q 16 3Q 15 Premiums, service revenue earned and other 242$ 1$ 2$ Losses and loss adjustment expenses 69 (76) 8 Acquisition and underwriting expenses 153 5 5 Total underwriting income 20 72 (11) Investment income and other 36 2 27 Pre-tax income from continuing ops 56$ 74$ 16$ Total assets 7,259$ 66$ 262$ Key Statistics 3Q 16 2Q 16 3Q 15 Insurance ratios Loss ratio 28.8% 60.9% 25.7% Underwriting expense ratio 63.8% 61.9% 62.0% Combined ratio 92.5% 122.8% 87.7% Increase/(Decrease) vs. Insurance Losses ($ millions) $42 $39 $34 $33 $34 $34 $67 $9 $8 $26 $96 $22 $123 $62 $54 $73 $145 $69 2Q 15 3Q 15 4Q 15 1Q 16 2Q 16 3Q 16 VSC Losses Weather Losses Other Losses Dealer Products & Services Written Premiums ($ millions) $265 $248 $239 $263 $254 $222 $222 $237 $252 3Q 14 4Q 14 1Q 15 2Q 15 3Q 15 4Q 15 1Q 16 2Q 16 3Q 16 Insurance • Pre - tax income of $56 million, up $16 million YoY and $74 million QoQ – Higher investment gains YoY – W eather losses down $74 million QoQ and up $13 million YoY but in line with 7 year seasonal average • Lowest 3Q VSC loss ratio in 6 years • Written premiums of $252 million in 3Q up $15 million QoQ and down $2 million YoY – Higher VSC and Dealer P&C volume QoQ Note: Excludes Canadian Personal Lines business, which is in runoff Note: Excludes the benefit of weather - related loss reinsurance and Canadian Personal Lines losses
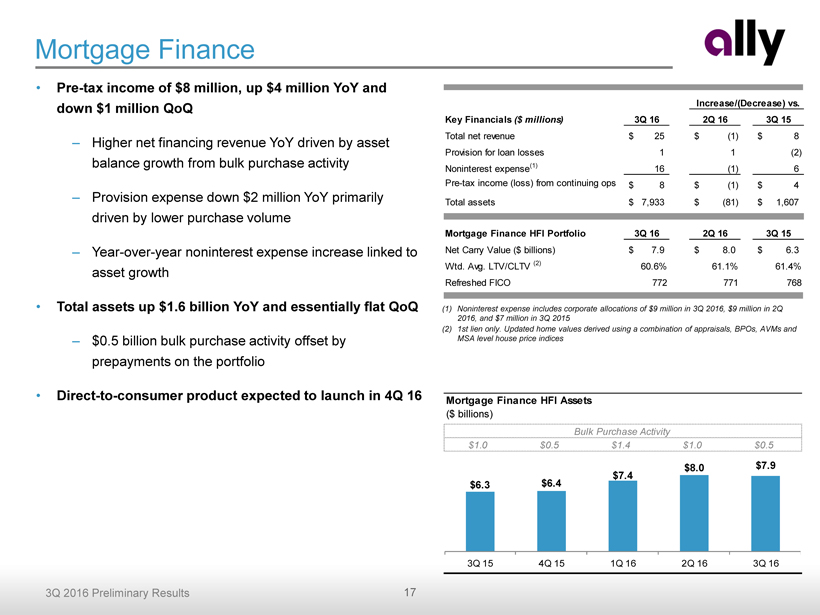
17 3Q 2016 Preliminary Results Mortgage Finance (1) Noninterest expense includes corporate allocations of $9 million in 3Q 2016, $9 million in 2Q 2016, and $7 million in 3Q 2015 (2) 1st lien only. Updated home values derived using a combination of appraisals, BPOs, AVMs and MSA level house price indices • Pre - tax income of $8 million, up $4 million YoY and down $1 million QoQ – Higher net financing revenue YoY driven by asset balance growth from bulk purchase activity – Provision expense down $2 million YoY primarily driven by lower purchase volume – Year - over - year noninterest expense increase linked to asset growth • Total assets up $1.6 billion YoY and essentially flat QoQ – $0.5 billion bulk purchase activity offset by prepayments on the portfolio • Direct - to - consumer product expected to launch in 4Q 16 Mortgage Finance HFI Assets ($ billions) $1.0 $0.5 $1.4 $1.0 $0.5 Bulk Purchase Activity $6.3 $6.4 $7.4 $8.0 $7.9 3Q 15 4Q 15 1Q 16 2Q 16 3Q 16 Key Financials ($ millions) 3Q 16 2Q 16 3Q 15 Total net revenue 25$ (1)$ 8$ Provision for loan losses 1 1 (2) Noninterest expense (1) 16 (1) 6 Pre-tax income (loss) from continuing ops 8$ (1)$ 4$ Total assets 7,933$ (81)$ 1,607$ Mortgage Finance HFI Portfolio 3Q 16 2Q 16 3Q 15 Net Carry Value ($ billions) 7.9$ 8.0$ 6.3$ Wtd. Avg. LTV/CLTV (2) 60.6% 61.1% 61.4% Refreshed FICO 772 771 768 Increase/(Decrease) vs.

18 3Q 2016 Preliminary Results Key Financials ($ millions) 3Q 16 2Q 16 3Q 15 Net financing revenue 30$ 1$ 8$ Total other revenue 4 - (6) Total net revenue 34 1 2 Provision for loan losses 3 - (1) Noninterest expense (1) 16 - 2 Pre-tax income from continuing ops 15$ 1$ 1$ Total assets (EOP) 3,232$ 243$ 963$ Increase/(Decrease) vs. • Pre - tax income of $15 million up $1 million YoY and QoQ – Net financing revenue up YoY driven by continued strong originations driving asset growth – Total other revenue flat QoQ and down YoY driven by a large deal closing and an investment gain in 3Q 15 – Provision expense flat QoQ and down YoY despite continued loan growth • Total assets up $1.0 billion YoY and up $0.2 billion QoQ – Technology vertical launched in 4Q 15 contributed ~20% of the YoY growth Corporate Finance (1) Noninterest expense includes corporate allocations of $6 million in 3Q 2016 $ 5 million in 2Q 2016 and $4 million in 3Q 2015 Corporate Finance Outstandings Loan Portfolio by Industry - 9/30/2016 Food And Beverages 4% Health Services 10% Other Services 26% Auto & Transportation 13% Machinery. Equip. Elect. 7% Other Manufactured Prod. 11% Retail Trade 4% Wholesale 9% Chemicals & Metals 8% Other 4% Paper Printing & Publishing 4% Services Manufacturing Other Corporate Finance Outstandings and Unfunded Commitments (EOP $ billions) $2.3 $2.7 $2.9 $3.0 $3.2 $1.2 $1.1 $1.1 $1.1 $1.3 3Q 15 4Q 15 1Q 16 2Q 16 3Q 16 Outstandings Unfunded Commitments
19 3Q 2016 Preliminary Results Conclusion Ally continues progress on strategic plan and is achieving improved financial results x Generating strong EPS growth with a long runway x Deposit and customer growth remain important drivers x Dedicated to efficient capital deployment and significant common distributions x Successfully optimizing returns in auto finance business as lease portfolio declines x Positioned to drive more value from established brand and growing customer base − Leveraged to trends in digital financial services − Revenue diversification from additional products − Grow fee income − Ensure growing and stable deposit base − Minimize risk, expense and capital utilization
Supplemental Charts
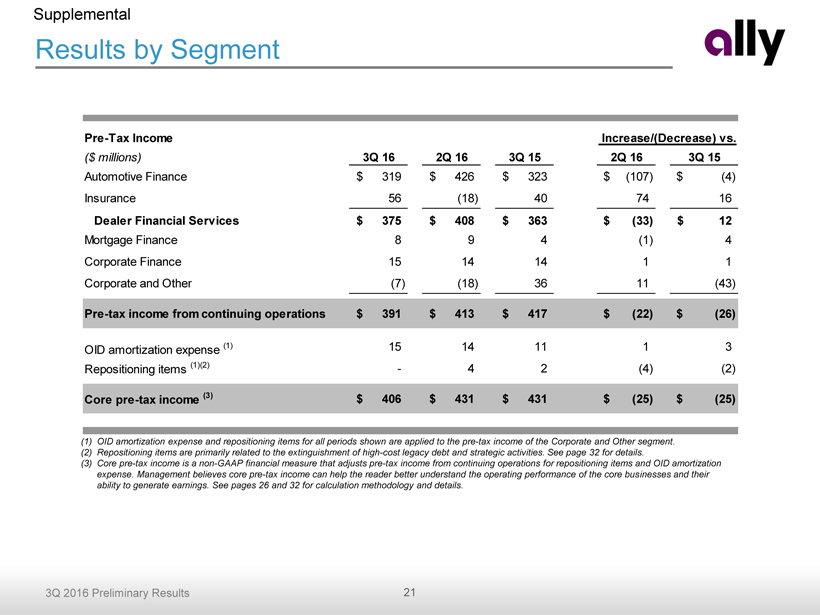
21 3Q 2016 Preliminary Results Results by Segment (1) OID amortization expense and repositioning items for all periods shown are applied to the pre - tax income of the Corporate and Other segment . (2) Repositioning items are primarily related to the extinguishment of high - cost legacy debt and strategic activities. See page 32 for details. (3) Core pre - tax income is a non - GAAP financial measure that adjusts pre - tax income from continuing operations for repositioning items an d OID amortization expense. Management believes core pre - tax income can help the reader better understand the operating performance of the core bus inesses and their ability to generate earnings. See pages 26 and 32 for calculation methodology and details. Supplemental Pre-Tax Income ($ millions) 3Q 16 2Q 16 3Q 15 2Q 16 3Q 15 Automotive Finance 319$ 426$ 323$ (107)$ (4)$ Insurance 56 (18) 40 74 16 Dealer Financial Services 375$ 408$ 363$ (33)$ 12$ Mortgage Finance 8 9 4 (1) 4 Corporate Finance 15 14 14 1 1 Corporate and Other (7) (18) 36 11 (43) Pre-tax income from continuing operations 391$ 413$ 417$ (22)$ (26)$ OID amortization expense (1) 15 14 11 1 3 Repositioning items (1)(2) - 4 2 (4) (2) Core pre-tax income (3) 406$ 431$ 431$ (25)$ (25)$ Increase/(Decrease) vs.

22 3Q 2016 Preliminary Results ($ billions) $0.5 $1.4 $4.4 $3.7 $1.7 $2.2 $9.1 $14.8 $14.9 $15.6 $17.6 $17.1 3Q 15 4Q 15 1Q 16 2Q 16 3Q 16 4Q 16 2017 2018 2019 2020 2021+ Matured Remaining Total Liquidity • Bank funding at 73% up 4% YoY • Deposits now represent 54% of total funding – Reduced secured debt footprint by 7% YoY – Unsecured issuance used to refinance preferred stock • $1.5 billion retail auto securitizations executed in 3Q 16 • Strong total liquidity levels at $17.1 billion in 3Q 16 Funding and Liquidity As of 9/30/16. Total maturities for 2021 and beyond do not exceed $3.0 billion in any given year. Current period does not include early debt redemptions. Note: Total Liquidity includes cash & cash equivalents, highly liquid securities and current committed unused capacity. See page 18 of the Financial Supplement for more details. Unsecured Long - Term Debt Maturities Growth in Bank Funded Assets Funding Profile Secured Debt 31% Unsecured Debt 17% Deposits 47% FHLB 5% Secured Debt 24% Unsecured Debt 17% Deposits 54% FHLB 5% 3Q 2015 3Q 2016 ($ billions) 69% 70% 71% 73% 73% $155.9 $158.6 $156.5 $157.9 $157.4 3Q 15 4Q 15 1Q 16 2Q 16 3Q 16 Ally Bank Assets Non-Bank Assets Supplemental
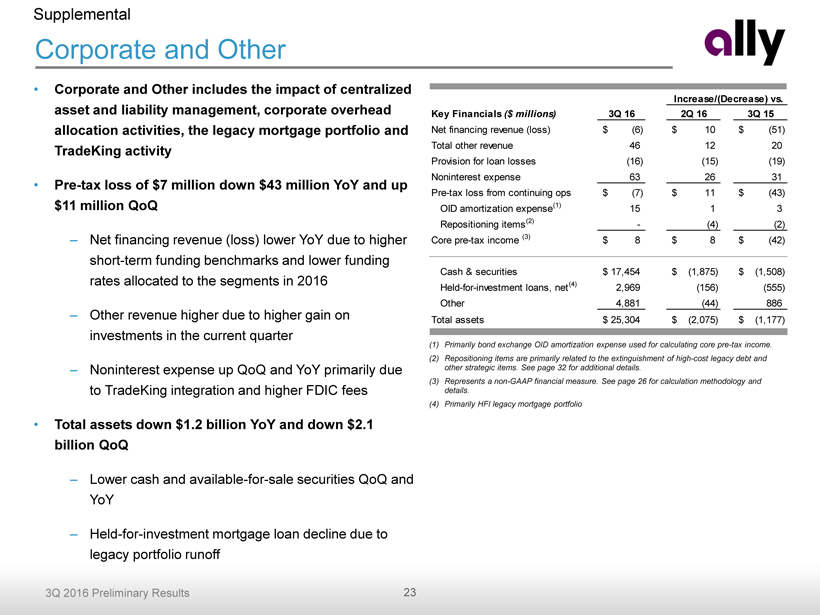
23 3Q 2016 Preliminary Results (1) Primarily bond exchange OID amortization expense used for calculating core pre - tax income. (2) Repositioning items are primarily related to the extinguishment of high - cost legacy debt and other strategic items. See page 32 for additional details. (3) Represents a non - GAAP financial measure. See page 26 for calculation methodology and details . (4) Primarily HFI legacy mortgage portfolio Corporate and Other Supplemental • Corporate and Other includes the impact of centralized asset and liability management, corporate overhead allocation activities, the legacy mortgage portfolio and TradeKing activity • P re - tax loss of $7 million down $43 million YoY and up $11 million QoQ – Net financing revenue (loss) lower YoY due to higher short - term funding benchmarks and lower funding rates allocated to the segments in 2016 – Other revenue higher due to higher gain on investments in the current quarter – Noninterest expense up QoQ and YoY primarily due to TradeKing integration and higher FDIC fees • Total assets down $1.2 billion YoY and down $2.1 billion QoQ – Lower cash and available - for - sale securities QoQ and YoY – Held - for - investment mortgage loan decline due to legacy portfolio runoff Key Financials ($ millions) 3Q 16 2Q 16 3Q 15 Net financing revenue (loss) (6)$ 10$ (51)$ Total other revenue 46 12 20 Provision for loan losses (16) (15) (19) Noninterest expense 63 26 31 Pre-tax loss from continuing ops (7)$ 11$ (43)$ OID amortization expense (1) 15 1 3 Repositioning items (2) - (4) (2) Core pre-tax income (3) 8$ 8$ (42)$ Cash & securities 17,454$ (1,875)$ (1,508)$ Held-for-investment loans, net (4) 2,969 (156) (555) Other 4,881 (44) 886 Total assets 25,304$ (2,075)$ (1,177)$ Increase/(Decrease) vs.

24 3Q 2016 Preliminary Results Interest Rate Sensitivity (1) Net financing revenue impacts reflect a rolling 12 - month view (2) Results in greater than 75% pass - through rate over time. See page 26 for additional details Supplemental Net Financing Revenue Impact (1) vs. Forward Curve $ million Ally Modeled Scenario (2) 50% Deposit Pass-Through Ally Modeled Scenario (2) 50% Deposit Pass-Through +100 bp Instantaneous 17$ 133$ (18)$ 89$ +100 bp Gradual (over 12 months) 30$ 73$ 0$ 40$ Stable rate environment (27)$ (23)$ 8$ (8)$ 3Q16 2Q16

25 3Q 2016 Preliminary Results Deferred Tax Asset Supplemental (1) U.S. GAAP does not prescribe a method for calculating individual elements of deferred taxes for interim periods; therefore , these balances are estimated (2) Primarily book / tax timing differences Deferred Tax Asset 2Q 16 (1) ($ millions) Gross DTA/(DTL) Balance Valuation Allowance Net DTA/(DTL) Balance Net DTA/(DTL) Balance Net Operating Loss (Federal) 806$ -$ 806$ 892$ Capital Loss (Federal) 42 (42) - - Tax Credit Carryforwards 1,989 (494) 1,495 1,488 State/Local Tax Carryforwards 197 (119) 78 73 Other Deferred Tax Liabilities, net (2) (1,438) 7 (1,431) (1,388) Net Deferred Tax Assets 1,596$ (648)$ 948$ 1,065$ 3Q 16 (1)

26 3Q 2016 Preliminary Results Notes on non - GAAP and other financial measures Supplemental 1) Core pre - tax income is a non - GAAP financial measure that adjusts pre - tax income from continuing operations by excluding (1) original issue discount (OID) amortization expense and (2) repositioning items primarily related to the extinguishment of high - cost legacy debt and strategic activities. Management believes core pre - tax income can help the reader better understand the operating performance of the core businesses and their ability to gener ate earnings. See page 32 for calculation methodology and details . 2) Core net income available to common is a non - GAAP financial measure that serves as the numerator in the calculations of Adjusted EPS and Core ROTCE and that, like those measures, is believed by management to help the reader better understand the operating performance of the core bus ine sses and their ability to generate earnings. Core net income available to common adjusts GAAP net income available to common for discontinued operations net of tax, tax - effected OID expense, tax - effected repositioning items primarily related to the extinguishment of high - cost legacy debt and strategic activities, certain discrete tax items and preferred stock capital actions. See page 27 for calculation methodology and details. 3) Controllable expenses primarily includes employee related costs, consulting and legal fees, marketing, information technology, facility, portfolio ser vicing and restructuring expenses. 4) U.S. consumer auto originations ▪ New Retail Subvented – subvented rate new vehicle loans ▪ New Retail Standard – standard rate new vehicle loans ▪ Lease – new vehicle lease originations ▪ Used – used vehicle loans ▪ Growth – total originations from non - GM/Chrysler dealers 5) Net charge - off ratios are calculated as annualized net charge - offs divided by average outstanding finance receivables and loans excluding loans measur ed at fair value and loans held - for - sale. 6) Interest rate risk modeling – Ally’s interest rate risk models use dynamic assumptions driven by a number of factors, including the overall level of intere s t rates and the spread between short - term and long - term interest rates to project changes in Ally’s retail deposit offered rates. Ally’s int erest rate risk metrics currently assume a long - term retail deposit beta greater than 75%. We believe our deposits may ultimately be less sensitive to interest rate changes, which will reduce our overall exposure to rising rates. Assuming a long - term retail deposit beta of 50% (vs. current assumption of greater than 75 %) would increase the current consolidated asset sensitive interest rate risk position. Please see the 10 - Q for more details. 7) Tangible Common Equity is defined as common stockholders’ equity less goodwill and identifiable intangible assets (other than mortgage servicing rig ht s), net of deferred tax liabilities. Ally considers various measures when evaluating capital adequacy, including tangible common equity. Tangible common equity is not formally defined by GAAP or codified in the federal banking regulations and, therefore, is considered to be a non - GAAP financial measure. Ally believes that tangible common equity is important because we believe readers may assess our capital adequacy using this measure. Additionally, presentation of this measure allows readers to compare certain aspects of our capital adequacy on the same basis to other companies in the industry . For purposes of calculating Core return on tangible common equity (Core ROTCE), tangible common equity is further adjusted for unamortized original issuance discount and net deferred t ax asset. See page 29 for more details. The following are non - GAAP financial measures which Ally believes are important to the reader of the Consolidated Financial Statemen ts, but which are supplemental to and not a substitute for U.S. GAAP measures: Adjusted Earnings per Share (Adjusted EPS), Core P re - Tax Income, Core Net Income Available to Common, Core Return on Tangible Common Equity (Core ROTCE), Estimated Risk - Adjusted Retail Auto Yield, Adjusted Efficiency Ratio, fully phased - in Common Equity Tier 1 (CET1) capital and Adjusted Tangible Book Value per Share (Adjusted TBVPS). These measures are used by management and we believe are useful to investors in assessing the company’s ope rat ing performance and capital measures. Refer to the Definitions of Non - GAAP Financial Measures and Other Key Terms, and Reconciliatio n to GAAP later in this document .

27 3Q 2016 Preliminary Results GAAP to Core Results Supplemental Adjusted earnings per share (Adjusted EPS) is a non - GAAP financial measure that adjusts GAAP EPS for revenue and expense items that are typically strategic in nature or that management otherwise does not view as reflecting the operating performance of the company. Management believes Ad justed EPS can help the reader better understand the operating performance of the core businesses and their ability to generate earnings. In the numerator of Adjus ted EPS, GAAP net income available to common is adjusted for the following items: (1) excludes discontinued operations, net of tax, as Ally is primarily a domestic co mpany and sales of international businesses and other discontinued operations in the past have significantly impacted GAAP EPS, (2) adds back the tax - effected non - cash expense bond exchange original issue discount (OID), (3) adds back tax - effected repositioning items primarily related to the extinguishment of high - cost legacy debt and strategic activities, (4) excludes certain discrete tax items that do not relate to the operating performance of the core businesses, and (5) adjusts for preferred stock capital ac tions (e.g., Series A and Series G) that have been taken by the company to normalize its capital structure . Adjusted Earnings per Share ("Adjusted EPS") 3Q 16 2Q 16 1Q 16 4Q 15 3Q 15 Numerator ($ millions) GAAP net income available to common shareholders 209$ 345$ 235$ (953)$ 230$ less: Disc Ops, net of tax 52 (3) (3) 13 5 add back: Original issue discount expense ("OID expense") 15 14 15 12 11 add back: Repositioning Items - 4 7 3 2 less: OID & Repo. Tax (35% in '16, 34% in '15) (5) (6) (8) (5) (5) Significant Discrete Tax Items - (91) 7 - - Series G Actions - - - 1,179 - Series A Actions - 1 - - - Core net income available to common shareholders [a] 271$ 263$ 253$ 249$ 244$ Denominator Weighted-Average Shares Outstanding - (Diluted, thousands) [b] 483,575 486,074 484,654 484,845 484,399 Adjusted EPS [a] / [b] 0.56$ 0.54$ 0.52$ 0.52$ 0.51$ QUARTERLY TREND

28 3Q 2016 Preliminary Results GAAP to Core Results Supplemental Adjusted tangible book value per share (Adjusted TBVPS) is a non - GAAP financial measure that reflects the book value of equity available to shareholders even if original issue discount (OID) expense were accelerated immediately through the financial statements. As a result, management bel ieves Adjusted TBVPS provides the reader with an assessment of value that is more conservative than GAAP common shareholder’s equity per share. Adjusted TBVPS gen erally adjusts common equity for (1) goodwill and identifiable intangibles, net of DTLs , (2) tax - effected bond OID to reduce tangible common equity in the event the corresponding discounted bonds are redeemed/tendered and (3) Series G discount which reduces tangible common equity as the company has normalized its capital structure . Adjusted Tangible Book Value per Share ("Adjusted TBVPS") 3Q 16 2Q 16 1Q 16 4Q 15 3Q 15 Numerator ($ billions) GAAP shareholder's equity 13.6$ 13.6$ 13.8$ 13.4$ 14.6$ less: Preferred equity - - (0.7) (0.7) (0.8) GAAP Common shareholder's equity 13.6$ 13.6$ 13.1$ 12.7$ 13.8$ less: Goodwill and identifiable intangibles, net of DTLs (0.3) (0.3) (0.0) (0.0) (0.0) Tangible common equity 13.3 13.3 13.1 12.7 13.8 less: Tax-effected bond OID (35% tax rate in 2016; 34% tax rate in 2015 and prior) (0.8) (0.8) (0.8) (0.9) (0.9) less: Series G discount - - - - (1.2) Adjusted tangible book value [a] 12.5$ 12.5$ 12.3$ 11.9$ 11.7$ Denominator Issued shares outstanding (period-end, thousands) [b] 475,470 483,753 483,475 481,980 481,750 Metric GAAP shareholder's equity per share 28.7$ 28.1$ 28.6$ 27.9$ 30.3$ less: Preferred equity per share - - (1.4) (1.4) (1.7) GAAP Common shareholder's equity per share 28.7$ 28.1$ 27.2$ 26.4$ 28.6$ less: Goodwill and identifiable intangibles, net of DTLs per share (0.6) (0.6) (0.1) (0.1) (0.1) Tangible common equity per share 28.0 27.6 27.1 26.4 28.6 less: Tax-effected bond OID (35% tax rate in 2016; 34% tax rate in 2015 and prior) per share (1.7) (1.7) (1.7) (1.8) (1.8) less: Series G discount per share - - - - (2.4) Adjusted tangible book value per share [a] / [b] 26.3$ 25.9$ 25.4$ 24.6$ 24.3$ QUARTERLY TREND
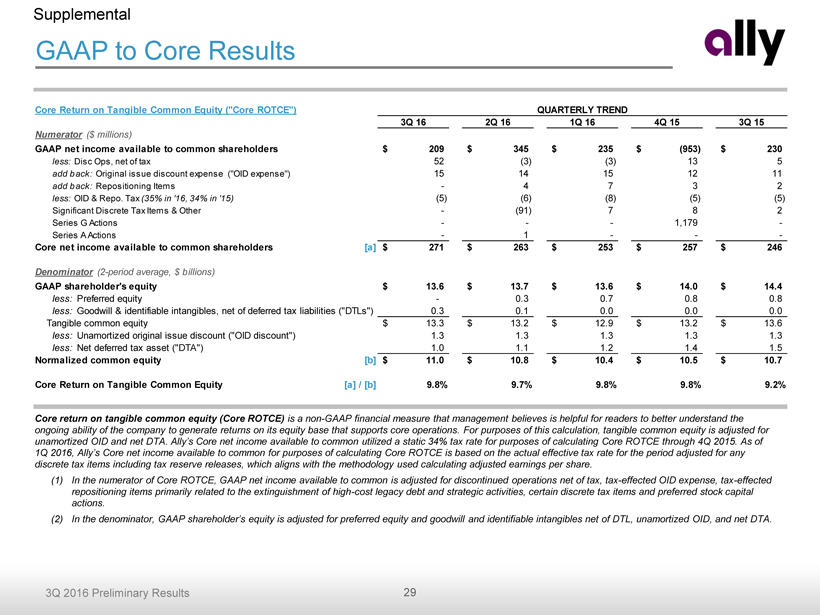
29 3Q 2016 Preliminary Results GAAP to Core Results Supplemental Core return on tangible common equity (Core ROTCE) is a non - GAAP financial measure that management believes is helpful for readers to better understand the ongoing ability of the company to generate returns on its equity base that supports core operations. For purposes of this calculation, tangible common equity is adjusted for unamortized OID and net DTA. Ally’s Core net income available to common utilized a static 34% tax rate for purposes of calculating Core ROTCE through 4Q 2015. As of 1Q 2016, Ally’s Core net income available to common for purposes of calculating Core ROTCE is based on the actual effective tax rate for the period adjusted for any discrete tax items including tax reserve releases, which aligns with the methodology used calculating adjusted earnings per share. (1) In the numerator of Core ROTCE, GAAP net income available to common is adjusted for discontinued operations net of tax, tax - effected OID expense, tax - effected repositioning items primarily related to the extinguishment of high - cost legacy debt and strategic activities, certain discrete tax items and preferred stock capital actions. (2) In the denominator, GAAP shareholder’s equity is adjusted for preferred equity and goodwill and identifiable intangibles net of DTL, unamortized OID , and net DTA. Core Return on Tangible Common Equity ("Core ROTCE") 3Q 16 2Q 16 1Q 16 4Q 15 3Q 15 Numerator ($ millions) GAAP net income available to common shareholders 209$ 345$ 235$ (953)$ 230$ less: Disc Ops, net of tax 52 (3) (3) 13 5 add back: Original issue discount expense ("OID expense") 15 14 15 12 11 add back: Repositioning Items - 4 7 3 2 less: OID & Repo. Tax (35% in '16, 34% in '15) (5) (6) (8) (5) (5) Significant Discrete Tax Items & Other - (91) 7 8 2 Series G Actions - - - 1,179 - Series A Actions - 1 - - - Core net income available to common shareholders [a] 271$ 263$ 253$ 257$ 246$ Denominator (2-period average, $ billions) GAAP shareholder's equity 13.6$ 13.7$ 13.6$ 14.0$ 14.4$ less: Preferred equity - 0.3 0.7 0.8 0.8 less: Goodwill & identifiable intangibles, net of deferred tax liabilities ("DTLs") 0.3 0.1 0.0 0.0 0.0 Tangible common equity 13.3$ 13.2$ 12.9$ 13.2$ 13.6$ less: Unamortized original issue discount ("OID discount") 1.3 1.3 1.3 1.3 1.3 less: Net deferred tax asset ("DTA") 1.0 1.1 1.2 1.4 1.5 Normalized common equity [b] 11.0$ 10.8$ 10.4$ 10.5$ 10.7$ Core Return on Tangible Common Equity [a] / [b] 9.8% 9.7% 9.8% 9.8% 9.2% QUARTERLY TREND

30 3Q 2016 Preliminary Results GAAP to Core Results Supplemental Adjusted efficiency ratio is a non - GAAP financial measure that management believes is helpful to readers in comparing the efficiency of its core banking and lending businesses with those of its peers. In the numerator of Adjusted efficiency ratio, total noninterest expense is adjusted for Ins urance segment expense, repositioning items primarily related to strategic activities and rep and warrant expense. In the denominator, total net revenue is adjusted for Insurance segment revenue, repo sit ioning items primarily related to the extinguishment of high - cost legacy debt and original issue discount (OID). See page 16 for the combined ratio for the Insurance segment which management uses as a primary measure of underwriting profitability for the Insurance business. Adjusted Efficiency Ratio 3Q 16 2Q 16 1Q 16 4Q 15 3Q 15 Numerator ($ millions) Total noninterest expense 735$ 773$ 710$ 668$ 674$ less: Rep and warrant expense (2) (3) (1) (2) (3) less: Insurance expense 222 293 218 201 209 less: Repositioning items - 4 4 1 2 Adjusted noninterest expense [a] 515$ 479$ 488$ 468$ 465$ Denominator ($ millions) Total net revenue 1,384$ 1,358$ 1,327$ 1,339$ 1,302$ add: Original issue discount 15 14 15 12 11 add: Repositioning items - - 3 2 - less: Insurance revenue 278 275 268 279 249 Adjusted net revenue [b] 1,121$ 1,097$ 1,076$ 1,074$ 1,064$ Adjusted Efficiency Ratio [a] / [b] 45.9% 43.7% 45.4% 43.6% 43.7% QUARTERLY TREND

31 3Q 2016 Preliminary Results Notes on non - GAAP and other financial measures Supplemental Common Equity Tier 1 (“ CET1”) capital fully phased - in: Under the Basel III regulatory framework as adopted in the United States, banking organizations like the company are required to comply with a minimum ratio of common equity tier 1 capital to risk - weighted assets (CET1 Capital Ratio). Common equity tier 1 capital generally consists of common stock (plus any related surplus and net of any treasury stock), retained earnings, accumulated other comprehensive inc ome , and minority interests in the common equity of consolidated subsidiaries, subject to specified conditions and adjustments. The obligation to comply with the minim um CET1 Capital Ratio is subject to ongoing transition periods and other provisions under Basel III. Management believes that both the transitional CET1 Capital Ratio an d t he fully phased - in CET1 Capital Ratio are helpful to readers in evaluating the company’s capital utilization and adequacy in absolute terms and relative to its peers. The fully phased - in CET1 Capital Ratio is a non - GAAP financial measure that is reconciled to the transitional CET1 Capital Ratio above. Regulatory Capital - Basel III transition to fully phased-in ($ billions) 3Q 16 2Q 16 1Q 16 4Q 15 3Q 15 Numerator Common equity tier 1 capital (transition) 12.9$ 12.8$ 12.7$ 12.5$ 13.4$ DTAs arising from NOL and tax credit carryforwards phased-in during transition (0.3) (0.3) (0.3) (0.6) (0.6) Intangibles phased-in during transition (0.0) (0.0) - - - Common equity tier 1 capital (fully phased-in) 12.6$ 12.5$ 12.3$ 11.9$ 12.9$ Denominator Risk-weighted assets (transition) 135.5$ 133.8$ 133.6$ 135.8$ 133.8$ DTAs arising from temporary differences that could not be realized through NOL , net of VA and net of DTLs phased-in during transition 0.5 0.5 0.4 0.5 0.7 Intangibles phased in during transition 0.0 0.0 - - - Risk-weighted assets (fully phased-in) 136.0$ 134.2$ 134.0$ 136.4$ 134.5$ Metric Common equity tier 1 (transition) 9.5% 9.6% 9.5% 9.2% 10.0% Common equity tier 1 (fully phased-in) 9.3% 9.3% 9.2% 8.7% 9.6%

32 3Q 2016 Preliminary Results Notes on non - GAAP and other financial measures Supplemental (1) Represents core pre - tax income. See page 26 for definitions Estimated risk - adjusted retail auto yield is a forward - looking non - GAAP financial measure that management believes is helpful to readers in evaluating the estimated profitability of loan originations during the period. Estimated risk - adjusted retail auto yield is determined by calculating the estimated average annualized yield less the estimated net average annualized loss rate (NAALR) for loans originated during the period, using yield and loss expectations at origination. We believe this metric, and the changes to this metric, are also useful to investors in assessing the pricing of loans originated during the period and in co mpa ring the profitability of loan originations across periods and against the overall current portfolio of loans . Estimated risk-adjusted retail auto yield 3Q 16 2Q 16 1Q 16 4Q 15 3Q 15 Estimated originated yield 5.91% 5.83% 5.85% 5.53% 5.27% Estimated net annualized average loss rate ("NAALR") -1.20% -1.24% -1.17% -1.17% -1.09% Estimated risk-adjusted retail auto yield 4.71% 4.60% 4.68% 4.36% 4.18% $ in millions GAAP OID & Repositioning Items Non-GAAP (1) GAAP OID & Repositioning Items Non-GAAP (1) GAAP OID & Repositioning Items Non-GAAP (1) Consolidated Ally Net financing revenue 996$ 15$ 1,011$ 984$ 14$ 998$ 970$ 11$ 981$ Total other revenue 388 - 388 374 - 374 332 - 332 Provision for loan losses 258 - 258 172 - 172 211 - 211 Controllable expenses 479 - 479 463 (4) 459 452 (2) 449 Other noninterest expenses 256 - 256 310 (0) 310 222 - 222 Pre-tax income from continuing ops 391$ 15$ 406$ 413$ 18$ 431$ 417$ 14$ 431$ Corporate / Other (incl. Legacy & Wealth) Net financing revenue (6)$ 15$ 9$ (16)$ 14$ (2)$ 45$ 11$ 56$ Total other revenue (loss) 46 - 46 34 - 34 26 - 26 Provision for loan losses (16) - (16) (1) - (1) 3 - 3 Noninterest expense 63 - 63 37 (4) 33 32 (2) 30 Pre-tax income (loss) from continuing ops (7)$ 15$ 8$ (18)$ 18$ (0)$ 36$ 14$ 50$ 3Q 16 2Q 16 3Q 15