Attached files
| file | filename |
|---|---|
| EX-23.1 - EX-23.1 - Smart Sand, Inc. | d219314dex231.htm |
| EX-10.12 - EX-10.12 - Smart Sand, Inc. | d219314dex1012.htm |
| EX-5.1 - EX-5.1 - Smart Sand, Inc. | d219314dex51.htm |
| EX-1.1 - EX-1.1 - Smart Sand, Inc. | d219314dex11.htm |
Table of Contents
As filed with the Securities and Exchange Commission on October 25, 2016
Registration No. 333-213692
UNITED STATES
SECURITIES AND EXCHANGE COMMISSION
Washington, D.C. 20549
Amendment No. 3 to
FORM S-1
REGISTRATION STATEMENT
UNDER
THE SECURITIES ACT OF 1933
Smart Sand, Inc.
(Exact name of registrant as specified in its charter)
| Delaware | 1400 | 45-2809926 | ||
| (State or other jurisdiction of incorporation or organization) |
(Primary Standard Industrial Classification Code Number) |
(I.R.S. Employer Identification Number) |
24 Waterway Avenue, Suite 350
The Woodlands, Texas 77380
(281) 231-2660
(Address, including zip code, and telephone number, including area code, of registrant’s principal executive offices)
Charles E. Young
Chief Executive Officer
24 Waterway Avenue, Suite 350
The Woodlands, Texas 77380
(281) 231-2660
(Name, address, including zip code, and telephone number, including area code, of agent for service)
Copies to:
| Ryan J. Maierson Latham & Watkins LLP 811 Main Street, Suite 3700 Houston, Texas 77002 (713) 546-5400 |
Alan Beck Julian J. Seiguer Vinson & Elkins L.L.P. 1001 Fannin Street, Suite 2500 Houston, Texas 77002 (713) 758-2222 |
Approximate date of commencement of proposed sale to the public: As soon as practicable after this Registration Statement becomes effective.
If any of the securities being registered on this form are to be offered on a delayed or continuous basis pursuant to Rule 415 under the Securities Act of 1933, check the following box. ¨
If this Form is filed to register additional securities for an offering pursuant to Rule 462(b) under the Securities Act, check the following box and list the Securities Act registration statement number of the earlier effective registration statement for the same offering. ¨
If this Form is a post-effective amendment filed pursuant to Rule 462(c) under the Securities Act, check the following box and list the Securities Act registration statement number of the earlier effective registration statement for the same offering. ¨
If this Form is a post-effective amendment filed pursuant to Rule 462(d) under the Securities Act, check the following box and list the Securities Act registration statement number of the earlier effective registration statement for the same offering. ¨
Indicate by check mark whether the registrant is a large accelerated filer, an accelerated filer, a non-accelerated filer, or a smaller reporting company. See the definitions of “large accelerated filer,” “accelerated filer” and “smaller reporting company” in Rule 12b-2 of the Exchange Act.
| Large accelerated filer | ¨ | Accelerated filer | ¨ | |||
| Non-accelerated filer | x (Do not check if a smaller reporting company) | Smaller reporting company | ¨ |
CALCULATION OF REGISTRATION FEE
|
| ||||||||
| Title of Each Class of Securities to be Registered |
Amount to be Registered(1) |
Proposed Maximum Offering Price Per Share(2) |
Proposed Maximum Aggregate Offering Price(1)(2) |
Amount of Registration Fee(3) | ||||
| Common Stock, par value $0.001 per share |
12,207,425 | $18.00 | $219,733,650 | $23,948 | ||||
|
| ||||||||
|
| ||||||||
| (1) | Includes 1,592,273 shares of common stock that the underwriters have the option to purchase. |
| (2) | Estimated solely for the purpose of calculating the amount of the registration fee in accordance with Rule 457(a) under the Securities Act of 1933, as amended. |
| (3) | The Registrant previously paid $10,070 of the total registration fee in connection with a previous filing of this Registration Statement. |
The Registrant hereby amends this Registration Statement on such date or dates as may be necessary to delay its effective date until the Registrant shall file a further amendment which specifically states that this Registration Statement shall thereafter become effective in accordance with Section 8(a) of the Securities Act of 1933 or until the Registration Statement shall become effective on such date as the Securities and Exchange Commission, acting pursuant to said Section 8(a), may determine.
Table of Contents
The information in this preliminary prospectus is not complete and may be changed. These securities may not be sold until the registration statement filed with the Securities and Exchange Commission is effective. This preliminary prospectus is not an offer to sell nor does it seek an offer to buy these securities in any jurisdiction where the offer or sale is not permitted.
SUBJECT TO COMPLETION, DATED OCTOBER 25, 2016
PROSPECTUS
10,615,152 Shares

Smart Sand, Inc.
Common Stock
This is our initial public offering. We are offering 9,100,000 shares of common stock and the selling stockholders are offering 1,515,152 shares of common stock.
Prior to this offering, there has been no public market for our common stock. It is currently estimated that the initial public offering price will be between $15.00 and $18.00 per share. We have applied to list our common stock on the NASDAQ Global Select Market under the symbol “SND.” We are an “emerging growth company” as that term is used in the Jumpstart Our Business Startups Act of 2012, or JOBS Act.
You should consider the risks we have described in “Risk Factors” beginning on page 16.
Neither the Securities and Exchange Commission nor any state securities commission has approved or disapproved of these securities or determined if this prospectus is truthful or complete. Any representation to the contrary is a criminal offense.
|
Per Share |
Total | |||
| Initial public offering price |
$ | $ | ||
| Underwriting discounts and commissions(1) |
$ | $ | ||
| Proceeds, before expenses, to Smart Sand, Inc. |
$ | $ | ||
| Proceeds, before expenses, to the selling stockholders |
$ | $ |
| (1) | We refer you to “Underwriting” beginning on page 127 of this prospectus for additional information regarding underwriting compensation. |
The selling stockholders have granted the underwriters the option to purchase up to an additional 1,592,273 shares of common stock on the same terms and conditions if the underwriters sell more than 10,615,152 shares of common stock in this offering. We will not receive any proceeds from the sale of shares held by the selling stockholders.
The underwriters expect to deliver the common stock on or about , .
| Credit Suisse |
Goldman, Sachs & Co. |
| Jefferies |
| Simmons & Company International Energy Specialists of Piper Jaffray |
Tudor, Pickering, Holt & Co. | Deutsche Bank Securities | ||
The date of this prospectus is , .
Table of Contents

Table of Contents
| 1 | ||||
| 1 | ||||
| 1 | ||||
| 2 | ||||
| 4 | ||||
| 5 | ||||
| 7 | ||||
| 7 | ||||
| 10 | ||||
| 10 | ||||
| 10 | ||||
| 11 | ||||
| 12 | ||||
| 14 | ||||
| 16 | ||||
| 16 | ||||
| 27 | ||||
| Risks Related to This Offering and Ownership of Our Common Stock |
30 | |||
| 37 | ||||
| 38 | ||||
| 38 | ||||
| 39 | ||||
| 41 | ||||
| 42 | ||||
| 44 | ||||
| MANAGEMENT’S DISCUSSION AND ANALYSIS OF FINANCIAL CONDITION AND RESULTS OF OPERATIONS |
46 | |||
| 46 | ||||
| 46 | ||||
| 47 | ||||
| 50 | ||||
| 51 | ||||
| 52 | ||||
| 53 | ||||
| 54 | ||||
| Six Months Ended June 30, 2016 Compared to Six Months Ended June 30, 2015 |
54 | |||
| Year Ended December 31, 2015 Compared to the Year Ended December 31, 2014 |
56 | |||
| 58 | ||||
| 60 | ||||
| 61 | ||||
| 61 | ||||
| 61 | ||||
| 62 | ||||
| 62 | ||||
| 64 | ||||
| 65 | ||||
| 65 | ||||
| 66 | ||||
| 67 | ||||
| 68 |
i
Table of Contents
| 68 | ||||
| 71 | ||||
| 72 | ||||
| 72 | ||||
| 72 | ||||
| 73 | ||||
| 74 | ||||
| 75 | ||||
| 77 | ||||
| 77 | ||||
| 78 | ||||
| 78 | ||||
| 80 | ||||
| 82 | ||||
| 83 | ||||
| 87 | ||||
| 88 | ||||
| 89 | ||||
| 90 | ||||
| 90 | ||||
| 90 | ||||
| 90 | ||||
| Environmental and Occupational Health and Safety Regulations |
91 | |||
| 95 | ||||
| 95 | ||||
| 96 | ||||
| 96 | ||||
| 99 | ||||
| 100 | ||||
| 100 | ||||
| 101 | ||||
| 104 | ||||
| 110 | ||||
| 111 | ||||
| 113 | ||||
| 113 | ||||
| 113 | ||||
| 115 | ||||
| Procedures for Review, Approval and Ratification of Related Person Transactions |
115 | |||
| 115 | ||||
| 115 | ||||
| 116 | ||||
| 116 | ||||
| 116 | ||||
| 116 | ||||
| 118 | ||||
| 118 | ||||
| 120 | ||||
| 120 | ||||
| 120 |
ii
Table of Contents
| 121 | ||||
| 121 | ||||
| 121 | ||||
| 121 | ||||
| 123 | ||||
| 123 | ||||
| 123 | ||||
| 123 | ||||
| 124 | ||||
| 124 | ||||
| 124 | ||||
| 124 | ||||
| MATERIAL U.S. FEDERAL INCOME TAX CONSEQUENCES TO NON-U.S. HOLDERS |
125 | |||
| 126 | ||||
| 126 | ||||
| 127 | ||||
| 128 | ||||
| Additional Withholding Tax on Payments Made to Foreign Accounts |
128 | |||
| 129 | ||||
| 135 | ||||
| 135 | ||||
| 135 | ||||
| 136 | ||||
| F-1 | ||||
| A-1 |
You should rely only on the information contained in this prospectus or in any free writing prospectus prepared by us or on behalf of us or to which we have referred you. Neither we, the selling stockholders, nor the underwriters have authorized any other person to provide you with information different from that contained in this prospectus and any free writing prospectus. If anyone provides you with different or inconsistent information, you should not rely on it. Neither we, the selling stockholders, nor the underwriters are making an offer to sell these securities in any jurisdiction where an offer or sale is not permitted. The information in this prospectus is accurate only as of the date of this prospectus, regardless of the time of delivery of this prospectus or any sale of our common stock. Our business, financial condition, results of operations and prospects may have changed since that date.
This prospectus contains forward-looking statements that are subject to a number of risks and uncertainties, many of which are beyond our control. Please read “Risk Factors” and “Forward-Looking Statements.”
Industry and Market Data
The data included in this prospectus regarding the industry in which we operate, including descriptions of trends in the market and our position and the position of our competitors within our industries, is based on a variety of sources, including independent publications, government publications, information obtained from customers, distributors, suppliers and trade and business organizations and publicly available information, as well as our good faith estimates, which have been derived from management’s knowledge and experience in the industry in which we operate. The industry data sourced from The Freedonia Group is from its Industry Study #3302, “Proppants in North America,” published in September 2015. The industry data sourced from Spears & Associates is from its “Hydraulic Fracturing Market 2005-2017” published in the second quarter 2016 and its “Drilling and Production Outlook” published in June 2016. The industry data sourced from PropTester, Inc. and Kelrik, LLC is from its “2015 Proppant Market Report” published in March 2016. The industry data sourced from Baker Hughes is from its “North America Rotary Rig Count” published in July 2016. We believe that the third-party sources are reliable and that the third-party information included in this prospectus or in our estimates is accurate and complete.
iii
Table of Contents
This summary provides a brief overview of information contained elsewhere in this prospectus. This summary does not contain all of the information that you should consider before investing in our common stock. You should read the entire prospectus carefully, including the financial statements and the notes to those financial statements included in this prospectus. Unless indicated otherwise, the information presented in this prospectus assumes an initial public offering price of $16.50 per share (the midpoint of the price range set forth on the cover page of this prospectus) and that the underwriters do not exercise their option to purchase additional shares. You should read “Risk Factors” for more information about important risks that you should consider carefully before buying our common stock.
Unless the context otherwise requires, references in this prospectus to “Smart Sand, Inc.,” “our company,” “we,” “our” and “us,” or like terms, refer to Smart Sand, Inc. and its subsidiaries. References to the “selling stockholders” refer to the selling stockholders that are offering shares of common stock in this offering and have granted the underwriters an option to purchase additional shares to cover any over-allotments. Unless otherwise indicated, and other than the consolidated financial statements and the related notes included elsewhere in this prospectus, information presented in this prospectus is adjusted to reflect our 2,200 for 1 stock split that we will effect after the effective date of the registration statement of which this prospectus forms a part and prior to the completion of this offering. We have provided definitions for some of the terms we use to describe our business and industry and other terms used in this prospectus in the “Glossary of Terms” beginning on page A-1 of this prospectus.
We are a pure-play, low-cost producer of high-quality Northern White raw frac sand, which is a preferred proppant used to enhance hydrocarbon recovery rates in the hydraulic fracturing of oil and natural gas wells. We sell our products primarily to oil and natural gas exploration and production companies, such as EOG Resources, and oilfield service companies, such as Weatherford, under a combination of long-term take-or-pay contracts and spot sales in the open market. We believe that the size and favorable geologic characteristics of our sand reserves, the strategic location and logistical advantages of our facilities and the industry experience of our senior management team have positioned us as a highly attractive source of raw frac sand to the oil and natural gas industry.
We own and operate a raw frac sand mine and related processing facility near Oakdale, Wisconsin, at which we have approximately 244 million tons of proven recoverable sand reserves and approximately 92 million tons of probable recoverable sand reserves as of June 30, 2016, respectively. We began operations with 1.1 million tons of processing capacity in July 2012 and expanded to 2.2 million tons capacity in August 2014 with an additional expansion to 3.3 million tons in September 2015. Our integrated Oakdale facility, with on-site rail infrastructure and wet and dry sand processing facilities, has access to two Class I rail lines and enables us to process and cost-effectively deliver up to approximately 3.3 million tons of raw frac sand per year. We believe that with further development and permitting the Oakdale facility could ultimately be expanded to allow production of up to 9 million tons of raw frac sand per year.
In addition to the Oakdale facility, we own a second property in Jackson County, Wisconsin, which we call the Hixton site. The Hixton site is also located adjacent to a Class I rail line and is fully permitted to initiate operations and is available for future development. As of August 2014, our Hixton site had approximately 100 million tons of proven recoverable sand reserves.
For the year ended December 31, 2015 and six months ended June 30, 2016, we generated net income (loss) of approximately $5.0 million and $(2.0) million, respectively, and Adjusted EBITDA of approximately
1
Table of Contents
$23.9 million and $6.4 million, respectively. For the definition of Adjusted EBITDA and a reconciliation to its most directly comparable financial measure calculated and presented in accordance with Generally Accepted Accounting Principles (“GAAP”), please read “Selected Historical Consolidated Financial Data—Non-GAAP Financial Measures.”
Over the past decade, exploration and production companies have increasingly focused on exploiting the vast hydrocarbon reserves contained in North America’s unconventional oil and natural gas reservoirs by utilizing advanced techniques, such as horizontal drilling and hydraulic fracturing. In recent years, this focus has resulted in exploration and production companies drilling more and longer horizontal wells, completing more hydraulic fracturing stages per well and utilizing more proppant per stage in an attempt to maximize the volume of hydrocarbon recoveries per wellbore. From 2010 to 2015 frac sand demand experienced strong growth, growing at an average annual rate of 25%. In addition, raw frac sand’s share of the total proppant market continues to increase, growing from approximately 78% in 2010 to approximately 92% in 2015 as exploration and production companies continue to look closely at overall well cost, completion efficiency and design optimization, which has led to a greater use of raw frac sand in comparison to resin-coated sand and manufactured ceramic proppants.
Northern White raw frac sand, which is found predominantly in Wisconsin and limited portions of Minnesota and Illinois, is highly valued by oil and natural gas producers as a preferred proppant due to its favorable physical characteristics. We believe that the market for high-quality raw frac sand, like the Northern White raw frac sand we produce, particularly finer mesh sizes, will grow based on the potential recovery in the development of North America’s unconventional oil and natural gas reservoirs as well as the increased proppant volume usage per well. According to Kelrik, a notable driver impacting demand for fine mesh sand is increased proppant loadings, specifically, larger volumes of proppant placed per frac stage. Kelrik expects the trend of using larger volumes of finer mesh materials, such as 100 mesh sand and 40/70 sand, to continue.
We believe that we will be able to successfully execute our business strategies because of the following competitive strengths:
| • | Long-lived, strategically located, high-quality reserve base. We believe our Oakdale facility is one of the few raw frac sand mine and production facilities that has the unique combination of a large high-quality reserve base of primarily fine mesh sand that is contiguous to its production and primary rail loading facilities. Our Oakdale facility is situated on 1,196 acres in a rural area of Monroe County, Wisconsin, on a Class I rail line, and contains approximately 244 million tons of proven recoverable reserves and approximately 92 million tons of probable recoverable reserves as of June 30, 2016. We have an implied current proven reserve life of approximately 73 years based on our current annual processing capacity of 3.3 million tons per year. As of July 31, 2016, we have utilized 135 acres for facilities and mining operations, or only 11.3% of this location’s acreage. We believe that with further development and permitting, the Oakdale facility ultimately could be expanded to allow production of up to 9 million tons of raw frac sand per year. |
We believe our reserve base positions us well to take advantage of current market trends of increasing demand for finer mesh raw frac sand. Approximately 80% of our reserve mix today is 40/70 mesh substrate and 100 mesh substrate, considered to be the finer mesh substrates of raw frac sand. We believe that if oil and natural gas exploration and production companies continue recent trends in drilling and completion techniques to increase lateral lengths per well, the number of frac stages per well, the amount of proppant used per stage and the utilization of slickwater completions, that the demand for the finer grades of raw frac sand will continue to increase, which we can take advantage of due to the high percentage of high-quality, fine mesh sand in our reserve base.
2
Table of Contents
We also believe that having our mine, processing facilities and primary rail loading facilities at our Oakdale facility provides us with an overall low-cost structure, which enables us to compete effectively for sales of raw frac sand and to achieve attractive operating margins. The proximity of our mine, processing plants and primary rail loading facilities at one location eliminates the need for us to truck sand on public roads between the mine and the production facility or between wet and drying processing facilities, eliminating additional costs to produce and ship our sand.
In addition to the Oakdale facility, we own the Hixton site in Jackson County, Wisconsin. The Hixton site is a second fully permitted location adjacent to a Class I rail line that is fully permitted to initiate operations and is available for future development. As of August 2014, our Hixton site had approximately 100 million tons of proven recoverable sand reserves.
| • | Intrinsic logistics advantage. We believe that we are one of the few raw frac sand producers with a facility custom-designed for the specific purpose of delivering raw frac sand to all of the major U.S. oil and natural gas producing basins by an on-site rail facility that can simultaneously accommodate multiple unit trains. Our on-site transportation assets at Oakdale include approximately seven miles of rail track in a double-loop configuration and three rail car loading facilities that are connected to a Class I rail line owned by Canadian Pacific. We believe our customized on-site logistical configuration typically yields lower operating and transportation costs compared to manifest train or single-unit train facilities as a result of our higher rail car utilization, more efficient use of locomotive power and more predictable movement of product between mine and destination. In addition, we have recently constructed a transload facility on a Class I rail line owned by Union Pacific in Byron Township, Wisconsin, approximately 3.5 miles from the Oakdale facility. This transload facility allows us to ship sand directly to our customers on more than one Class I rail carrier. This facility commenced operations in June 2016 and provides increased delivery options for our customers, greater competition among our rail carriers and potentially lower freight costs. With the addition of this transload facility, we believe we are the only mine in Wisconsin with dual served railroad shipment capabilities on the Canadian Pacific and Union Pacific rail networks. Our Hixton site is also located adjacent to a Class I rail line. |
| • | Significant organic growth potential. We believe that we have a significant pipeline of attractive opportunities to expand our sales volumes and our production capacity at our Oakdale facility, which commenced commercial operations in July 2012 and was expanded to 3.3 million tons of annual processing capacity in September 2015. We currently have one wet plant and one dryer in storage at Oakdale that would allow us to increase our annual processing capacity to approximately 4.4 million tons should market demand increase sufficiently to warrant capacity expansion. We believe these units could be installed and operational in approximately six to nine months from commencement of construction. We believe, under current regulations and permitting requirements, that we can ultimately expand our annual production capacity at Oakdale to as much as 9 million tons. Other growth opportunities include the ability to expand our Byron Township transload facility to handle multiple unit trains simultaneously and to invest in transload facilities located in the shale operating basins. Investments in additional rail loading facilities should enable us to provide more competitive transportation costs and allow us to offer additional pricing and delivery options to our customers. We also have opportunities to expand our sales into the industrial sand market which would provide us the opportunity to diversify our customer base and sales product mix. |
Additionally, as of July 31, 2016, we have approximately 2.1 million tons of washed raw frac sand inventory at our Oakdale facility available to be processed through our dryers and sold in the market. This inventory of available washed raw frac sand provides us with the ability to quickly meet changing market demand and strategically sell sand on a spot basis to expand our market share of raw frac sand sales if market conditions are favorable.
| • | Strong balance sheet and financial flexibility. We believe that as a public company we will have a strong balance sheet and ample liquidity to pursue our growth initiatives. At the closing of this offering, |
3
Table of Contents
| we expect to have approximately $45 million in liquidity from cash on hand. In addition, in connection with the repayment in full and retirement of our existing credit facility with a portion of the proceeds of this offering, we are in the process of negotiating a new $40 to 50 million revolving credit facility, which we expect will be effective at or shortly after the completion of this offering. Additionally, unlike some of our peers, we have minimal exposure to unutilized rail cars. We currently have 855 rail cars under long-term leases, of which 710 are currently rented to our customers, which minimizes our exposure to storage and leasing expense for rail cars that are currently not being utilized for sand shipment and provides us greater flexibility in managing our transportation costs prospectively. |
| • | Focus on safety and environmental stewardship. We are committed to maintaining a culture that prioritizes safety, the environment and our relationship with the communities in which we operate. In August 2014, we were accepted as a “Tier 1” participant in Wisconsin’s voluntary “Green Tier” program, which encourages, recognizes and rewards companies for voluntarily exceeding environmental, health and safety legal requirements. In addition, we committed to certification under ISO standards and, in April 2016, we received ISO 9001 and ISO 14001 registrations for our quality management system and environmental management system programs, respectively. We believe that our commitment to safety, the environment and the communities in which we operate is critical to the success of our business. We are one of a select group of companies who are members of the Wisconsin Industrial Sand Association, which promotes safe and environmentally responsible sand mining standards. |
| • | Experienced management team. The members of our senior management team bring significant experience to the market environment in which we operate. Their expertise covers a range of disciplines, including industry-specific operating and technical knowledge as well as experience managing high-growth businesses. |
Our principal business objective is to be a pure-play, low-cost producer of high-quality raw frac sand and to increase stockholder value. We expect to achieve this objective through the following business strategies:
| • | Focusing on organic growth by increasing our capacity utilization and processing capacity. We intend to continue to position ourselves as a pure-play producer of high-quality Northern White raw frac sand, as we believe the proppant market offers attractive long-term growth fundamentals. While demand for proppant has declined since late 2014 in connection with the downturn in commodity prices and the corresponding decline in oil and natural gas drilling and production activity, we believe that the demand for proppant will increase over the medium and long term as commodity prices rise from their recent lows, which will lead producers to resume completion of their inventory of drilled but uncompleted wells and undertake new drilling activities. We expect this demand growth for raw frac sand will be driven by increased horizontal drilling, increased proppant loadings per well (as operators increase lateral length and increase proppant per lateral foot above current levels), increased wells drilled per rig and the cost advantages of raw frac sand over resin-coated sand and manufactured ceramics. As market dynamics improve, we will continue to evaluate economically attractive facility enhancement opportunities to increase our capacity utilization and processing capacity. For example, our current annual processing capacity is approximately 3.3 million tons per year, and we believe that with further development and permitting the Oakdale facility could ultimately be expanded to allow production to as much as 9 million tons of raw frac sand per year. |
| • | Optimizing our logistics infrastructure and developing additional origination and destination points. We intend to further optimize our logistics infrastructure and develop additional origination and destination points. We expect to capitalize on our Oakdale facility’s ability to simultaneously accommodate multiple unit trains to maximize our product shipment rates, increase rail car utilization and lower transportation costs. With our recently developed transloading facility located on the Union Pacific rail network approximately 3.5 miles from our Oakdale facility, we have the ability to ship our raw frac |
4
Table of Contents
| sand directly to our customers on more than one Class I rail carrier. This facility provides increased delivery options for our customers, greater competition among our rail carriers and potentially lower freight costs. In addition, we intend to continue evaluating ways to reduce the landed cost of our products at the basin for our customers, such as investing in transload and storage facilities and assets in our target shale basins to increase our customized service offerings and provide our customers with additional delivery and pricing alternatives, including selling product on an “as-delivered” basis at our target shale basins. |
| • | Focusing on being a low-cost producer and continuing to make process improvements. We will focus on being a low-cost producer, which we believe will permit us to compete effectively for sales of raw frac sand and to achieve attractive operating margins. Our low-cost structure results from a number of key attributes, including, among others, our (i) relatively low royalty rates compared to other industry participants, (ii) balance of coarse and fine mineral reserve deposits and corresponding contractual demand that minimizes yield loss and (iii) Oakdale facility’s proximity to two Class I rail lines and other sand logistics infrastructure, which helps reduce transportation costs, fuel costs and headcount needs. We have strategically designed our operations to provide low per-ton production costs. For example, we completed the construction of a natural gas connection to our Oakdale facility in October 2015 that provides us the optionality to source lower cost natural gas (as compared to propane under current commodity pricing) as a fuel source for our drying operations. In addition, we seek to maximize our mining yields on an ongoing basis by targeting sales volumes that more closely match our reserve gradation in order to minimize mining and processing of superfluous tonnage and continue to evaluate the potential of mining by dredge to reduce the overall cost of our mining operations. |
| • | Pursuing accretive acquisitions and greenfield opportunities. At the closing of this offering, we expect to have approximately $45 million of liquidity in the form of cash on hand and anticipate entering into a new $40 to 50 million revolving credit facility with third-party lenders at or shortly after the completion of this offering. We believe this level of liquidity will position us to pursue strategic acquisitions to increase our scale of operations and our logistical capabilities as well as to potentially diversify our mining and production operations into locations other than our current Oakdale and Hixton locations. We may also grow by developing low-cost greenfield projects, where we can capitalize on our technical knowledge of geology, mining and processing. |
| • | Maintaining financial strength and flexibility. We plan to pursue a disciplined financial policy to maintain financial strength and flexibility. We believe that our cash on hand, expected borrowing capacity and ability to access debt and equity capital markets after this offering will provide us with the financial flexibility necessary to achieve our organic expansion and acquisition strategy. |
Our Oakdale facility is purpose-built to exploit the reserve profile in place and produce high-quality raw frac sand. Unlike some of our competitors, our mine, processing plants and primary rail loading facilities are in one location, which eliminates the need for us to truck sand on public roads between the mine and the production facility or between wet and dry processing facilities. Our on-site transportation assets include approximately seven miles of rail track in a double-loop configuration and three rail car loading facilities that are connected to a Class I rail line owned by Canadian Pacific, which enables us to simultaneously accommodate multiple unit trains and significantly increases our efficiency in meeting our customers’ raw frac sand transportation needs. We ship a substantial portion of our sand volumes (approximately 56% from April 1, 2016 to July 31, 2016) in unit train shipments through rail cars that our customers own or lease and deliver to our facility. We believe that we are one of the few raw frac sand producers with a facility custom-designed for the specific purpose of delivering raw frac sand to all of the major U.S. oil and natural gas producing basins by an on-site rail facility that can simultaneously accommodate multiple unit trains. Our ability to handle multiple rail car sets allows for the efficient transition of locomotives from empty inbound trains to fully loaded outbound trains at our facility.
5
Table of Contents
We believe our customized on-site logistical configuration yields lower overall operating and transportation costs compared to manifest train or single-unit train facilities as a result of our higher rail car utilization, more efficient use of locomotive power and more predictable movement of product between mine and destination. Unit train operations such as ours can double or triple the average number of loads that a rail car carries per year, reducing the number of rail cars needed to support our operations and thus limiting our exposure to unutilized rail cars and the corresponding storage and lease expense. We believe that our Oakdale facility’s connection to the Canadian Pacific rail network, combined with our unit train logistics capabilities, will provide us enhanced flexibility to serve customers located in shale plays throughout North America. In addition, we have invested in a transloading facility on the Union Pacific rail network in Byron Township, Wisconsin, approximately 3.5 miles from our Oakdale facility. This facility is operational and provides us with the ability to ship directly on the Union Pacific network to locations in the major operating basins in the Western and Southwestern United States, which should facilitate more competitive pricing among our rail carriers. With the addition of this transload facility, we believe we are the only raw frac sand mine in Wisconsin with dual served railroad shipment capabilities on the Canadian Pacific and Union Pacific, which should provide us more competitive logistics options to the market relative to other Wisconsin based sand mining and production facilities.
In addition to the Oakdale facility, our Hixton site consists of approximately 959 acres in Jackson County, Wisconsin. The Hixton site is fully permitted to initiate operations and is available for future development. As of August 2014, our Hixton site had approximately 100 million tons of proven recoverable sand reserves. This location is located on a Class I rail line, the Canadian National.
The following tables provide key characteristics of our Oakdale facility and Hixton site (as of June 30, 2016, unless otherwise stated):
Our Oakdale Facility
| Facility Characteristic |
Description | |
| Site geography |
Situated on 1,196 contiguous acres, with on-site processing and rail loading facilities. | |
| Proven recoverable reserves |
244 million tons. | |
| Probable recoverable reserves |
92 million tons. | |
| Deposits |
Sand reserves of up to 200 feet; grade mesh sizes 20/40, 30/50, 40/70 and 100 mesh. | |
| Proven reserve mix |
Approximately 19% of 20/40 and coarser substrate, 41% of 40/70 mesh substrate and approximately 40% of 100 mesh substrate. Our 30/50 gradation is a derivative of the 20/40 and 40/70 blends. | |
| Excavation technique |
Generally shallow overburden allowing for surface excavation. | |
| Annual processing capacity |
3.3 million tons with the ability to increase to 4.4 million tons within approximately six to nine months. | |
| Logistics capabilities |
Dual served rail line logistics capabilities. On-site transportation infrastructure capable of simultaneously accommodating multiple unit trains and connected to the Canadian Pacific rail network. Additional transload facility located approximately 3.5 miles from the Oakdale facility in Byron Township that provides access to the Union Pacific network. | |
| Royalties |
$0.50 per ton sold of 70 mesh or coarser substrate. | |
| Expansion Capabilities |
We believe that with further development and permitting the Oakdale facility could ultimately be expanded to allow production of up to 9 million tons of raw frac sand per year. |
6
Table of Contents
Our Hixton Site
| Facility Characteristic |
Description | |
| Site geography |
Situated on 959 contiguous acres with access to a Canadian National Class I rail line. | |
| Proven recoverable reserves |
100 million tons. | |
| Deposits |
Sand reserves with an average thickness of 120 feet; grade mesh sizes 20/40, 30/50, 40/70 and 100 mesh. | |
| Proven reserve mix |
Approximately 72% of 70 mesh and coarser substrate and approximately 28% of 100 mesh substrate. | |
| Logistics capabilities |
Planned on-site transportation infrastructure capable of simultaneously accommodating multiple unit trains and connected to the Canadian National rail network. | |
| Royalties |
$0.50 per ton sold of 70 mesh or coarser substrate. |
Our Customers and Contracts
We sell raw frac sand under long-term take-or-pay contracts as well as in the spot market if we have excess production and the spot market conditions are favorable. Beginning January 1, 2017, we will have approximately 1.0 million tons of average annual production (or approximately 30.6% of our current annual production capacity) contracted under long-term take-or-pay contracts, with a volume-weighted average remaining term of approximately 3.7 years. For the year ended December 31, 2015 and the six months ended June 30, 2016, we generated approximately 96.4% and 99.6%, respectively, of our revenues from raw frac sand delivered under long-term take-or-pay contracts.
Demand for proppants in 2015 and through the first half of 2016 has dropped due to the downturn in commodity prices since late 2014 and the corresponding reduction in oil and natural gas drilling, completion and production activity. This change in demand has impacted contract discussions and negotiated terms with our customers as existing contracts have been adjusted resulting in a combination of reduced average selling prices per ton, adjustments to take-or-pay volumes and length of contract. We believe we have mitigated the short-term negative impact on revenues of some of these adjustments through contractual shortfall and reservation payments. In the current market environment, customers have begun to purchase more volumes on a spot basis as compared to committing to term contracts, and we expect this trend to continue in the near term until oil and natural gas drilling and completion activity begins to increase. However, should drilling and completion activity return to higher levels, we believe customers would more actively consider contracting proppant volumes under term contracts rather than continuing to rely on buying proppant on a spot basis in the market.
Third Quarter 2016 Sales Volumes
We sold approximately 229,000 tons of sand in the three months ended September 30, 2016, compared to approximately 193,000 tons of sand sold in the three months ended June 30, 2016, a quarter-over-quarter increase of approximately 19%. During the three months ended September 30, 2016, the average selling price per ton was $40.66 as compared to $35.53 for the three months ended June 30, 2016. We are currently in the process of finalizing our financial results for the third quarter 2016.
Industry Trends Impacting Our Business
Unless otherwise indicated, the information set forth under “—Industry Trends Impacting Our Business,” including all statistical data and related forecasts, is derived from The Freedonia Group’s Industry Study #3302, “Proppants in North America,” published in September 2015, Spears & Associates’ “Hydraulic Fracturing
7
Table of Contents
Market 2005-2017” published in the second quarter 2016, PropTester, Inc. and Kelrik, LLC’s “2015 Proppant Market Report” published in March 2016 and Baker Hughes’ “North America Rotary Rig Count” published in July 2016. While we are not aware of any misstatements regarding the proppant industry data presented herein, estimates involve risks and uncertainties and are subject to change based on various factors, including those discussed under the heading “Risk Factors.”
Demand Trends
According to Spears, the U.S. proppant market, including raw frac sand, ceramic and resin-coated proppant, was approximately 52.5 million tons in 2015. Kelrik estimates that the total raw frac sand market in 2015 represented approximately 92.3% of the total proppant market by weight. Market demand in 2015 dropped by approximately 28% from 2014 record demand levels (and a further estimated decrease of 43% in 2016 from 2015) due to the downturn in commodity prices since late 2014, which led to a corresponding decline in oil and natural gas drilling and production activity. According to the Freedonia Group, during the period from 2009 to 2014, proppant demand by weight increased by 42% annually. Spears estimates from 2016 through 2020 proppant demand is projected to grow by 23.2% per year, from 30 million tons per year to 85 million tons per year, representing an increase of approximately 55 million tons in annual proppant demand over that time period.
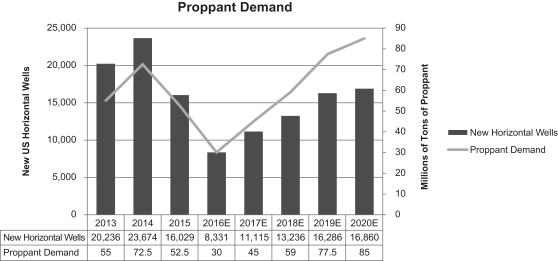
Demand growth for raw frac sand and other proppants is primarily driven by advancements in oil and natural gas drilling and well completion technology and techniques, such as horizontal drilling and hydraulic fracturing. These advancements have made the extraction of oil and natural gas increasingly cost-effective in formations that historically would have been uneconomic to develop. While current horizontal rig counts have fallen significantly from their peak of approximately 1,370 in 2014, rig count grew at an annual rate of 18.7% from 2009 to 2014. Additionally, the percentage of active drilling rigs used to drill horizontal wells, which require greater volumes of proppant than vertical wells, has increased from 42.2% in 2009 to 68.4% in 2014, and as of July 2016 the percentage of rigs drilling horizontal wells is 77% according to the Baker Hughes Rig Count. Moreover, the increase of pad drilling has led to a more efficient use of rigs, allowing more wells to be drilled per rig. As a result of these factors, well count, and hence proppant demand, has grown at a greater rate than overall rig count. Spears estimates that in 2019, proppant demand will exceed the 2014 peak (of approximately 72.5 million tons) and reach 77.5 millions tons even though the projection assumes approximately 10,000 fewer wells will be drilled. Spears estimates that average proppant usage per well will be approximately 5,000 tons per well by 2020. Kelrik notes that current sand-based slickwater completions use in excess of 7,500 tons per well of proppant.
8
Table of Contents
While demand for proppant has declined since late 2014 in connection with the downturn in commodity prices and the corresponding decline in oil and natural gas drilling and production activity, we believe that the demand for proppant will increase over the medium and long term as commodity prices rise from their recent lows, which will lead producers to resume completion of their inventory of drilled but uncompleted wells and undertake new drilling activities. Further, we believe that demand for proppant will be amplified by the following factors:
| • | improved drilling rig productivity, resulting in more wells drilled per rig per year; |
| • | completion of exploration and production companies’ inventory of drilled but uncompleted wells; |
| • | increases in the percentage of rigs that are drilling horizontal wells; |
| • | increases in the length of the typical horizontal wellbore; |
| • | increases in the number of fracture stages per foot in the typical completed horizontal wellbore; |
| • | increases in the volume of proppant used per fracturing stage; |
| • | renewed focus of exploration and production companies to maximize ultimate recovery in active reservoirs through downspacing; and |
| • | increasing secondary hydraulic fracturing of existing wells as early shale wells age. |
Recent growth in demand for raw frac sand has outpaced growth in demand for other proppants, and industry analysts predict that this trend will continue. As well completion costs have increased as a proportion of total well costs, operators have increasingly looked for ways to improve per well economics by lowering costs without sacrificing production performance. To this end, the oil and natural gas industry is shifting away from the use of higher-cost proppants towards more cost-effective proppants, such as raw frac sand. Evolution of completion techniques and the substantial increase in activity in U.S. oil and liquids-rich resource plays has further accelerated the demand growth for raw frac sand.
In general, oil and liquids-rich wells use a higher proportion of coarser proppant while dry gas wells typically use finer grades of sand. In the past, with the majority of U.S. exploration and production spending focused on oil and liquids-rich plays, demand for coarser grades of sand exceeded demand for finer grades; however, due to innovations in completion techniques, demand for finer grade sands has also shown a considerable resurgence. According to Kelrik, a notable driver impacting demand for fine mesh sand is increased proppant loadings, specifically, larger volumes of proppant placed per frac stage. Kelrik expects the trend of using larger volumes of finer mesh materials such as 100 mesh sand and 40/70 sand, to continue.
Supply Trends
In recent years, through the fall of 2014, customer demand for high-quality raw frac sand outpaced supply. Several factors contributed to this supply shortage, including:
| • | the difficulty of finding raw frac sand reserves that meet API specifications and satisfy the demands of customers who increasingly favor high-quality Northern White raw frac sand; |
| • | the difficulty of securing contiguous raw frac sand reserves large enough to justify the capital investment required to develop a processing facility; |
| • | the challenges of identifying reserves with the above characteristics that have rail access needed for low-cost transportation to major shale basins; |
| • | the hurdles to securing mining, production, water, air, refuse and other federal, state and local operating permits from the proper authorities; |
9
Table of Contents
| • | local opposition to development of certain facilities, especially those that require the use of on-road transportation, including moratoria on raw frac sand facilities in multiple counties in Wisconsin and Minnesota that hold potential sand reserves; and |
| • | the long lead time required to design and construct sand processing facilities that can efficiently process large quantities of high-quality raw frac sand. |
Supplies of high-quality Northern White raw frac sand are limited to select areas, predominantly in western Wisconsin and limited areas of Minnesota and Illinois. The ability to obtain large contiguous reserves in these areas is a key constraint and can be an important supply consideration when assessing the economic viability of a potential raw frac sand facility. Further constraining the supply and throughput of Northern White raw frac sand, is that not all of the large reserve mines have onsite excavation and processing capability. Additionally, much of the recent capital investment in Northern White raw frac sand mines was used to develop coarser deposits in western Wisconsin. With the shift to finer sands in the liquid and oil plays, many mines may not be economically viable as their ability to produce finer grades of sand may be limited.
Our Relationship with Our Sponsor
Our sponsor is a fund managed by Clearlake Capital Group, L.P., which, together with its affiliates and related persons, we refer to as Clearlake. Clearlake is a private investment firm with a sector-focused approach. The firm seeks to partner with world-class management teams by providing patient, long-term capital to dynamic businesses that can benefit from Clearlake’s operational and strategic expertise. The firm’s core target sectors include technology, communications and business services; industrials, energy and power; and consumer products and services. Clearlake currently has over $3.0 billion of assets under management. We believe our relationship with Clearlake provides us with a unique resource to effectively compete for acquisitions within the industry by being able to take advantage of their experience in acquiring businesses to assist us in seeking out, evaluating and closing attractive acquisition opportunities over time.
An investment in our common stock involves risks that include the demand for sand-based proppants and other risks. You should carefully consider the risks described under “Risk Factors” and the other information in this prospectus before investing in our common stock.
Principal Executive Offices and Internet Address
Our principal executive offices are located at 24 Waterway Avenue, Suite 350, The Woodlands, Texas 77380, and our telephone number is (281) 231-2660. Following the closing of this offering, our website will be located at www.smartsand.com. We expect to make our periodic reports and other information filed with or furnished to the Securities and Exchange Commission, or the SEC, available, free of charge, through our website, as soon as reasonably practicable after those reports and other information are electronically filed with or furnished to the SEC. Information on our website or any other website is not incorporated by reference into this prospectus and does not constitute a part of this prospectus.
10
Table of Contents
Our Emerging Growth Company Status
As a company with less than $1.0 billion in revenue during our last fiscal year, we qualify as an “emerging growth company” as defined in the Jumpstart Our Business Startups Act of 2012, or the JOBS Act. As an emerging growth company, we may, for up to five years, take advantage of specified exemptions from reporting and other regulatory requirements that are otherwise applicable generally to public companies. These exemptions include:
| • | the presentation of only two years of audited financial statements and only two years of related Management’s Discussion and Analysis of Financial Condition and Results of Operations in this prospectus; |
| • | deferral of the auditor attestation requirement on the effectiveness of our system of internal control over financial reporting; |
| • | exemption from the adoption of new or revised financial accounting standards until they would apply to private companies; |
| • | exemption from compliance with any new requirements adopted by the Public Company Accounting Oversight Board requiring mandatory audit firm rotation or a supplement to the auditor’s report in which the auditor would be required to provide additional information about the audit and the financial statements of the issuer; and |
| • | reduced disclosure about executive compensation arrangements. |
We may take advantage of these provisions until we are no longer an emerging growth company, which will occur on the earliest of (i) the last day of the fiscal year following the fifth anniversary of this offering, (ii) the last day of the fiscal year in which we have more than $1.0 billion in annual revenue, (iii) the date on which we issue more than $1.0 billion of non-convertible debt over a three-year period and (iv) the date on which we are deemed to be a “large accelerated filer,” as defined in Rule 12b-2 promulgated under the Securities Exchange Act of 1934, as amended, or the Exchange Act.
We have elected to take advantage of all of the applicable JOBS Act provisions, except that we will elect to opt out of the exemption that allows emerging growth companies to extend the transition period for complying with new or revised financial accounting standards (this election is irrevocable).
Accordingly, the information that we provide you may be different than what you may receive from other public companies in which you hold equity interests.
11
Table of Contents
| Issuer |
Smart Sand, Inc. |
| Common stock offered by us |
9,100,000 shares. |
| Common stock offered by the selling stockholders |
1,515,152 shares. |
| Common stock outstanding after this offering |
31,638,712 shares. |
| Option to purchase additional shares |
The selling stockholders have granted the underwriters a 30-day option to purchase up to an aggregate of 1,592,273 additional shares of our common stock held by the selling stockholders to cover over-allotments. |
| Shares held by our selling stockholders after this offering |
21,009,979 shares (or 19,417,707 shares, if the underwriters exercise in full their option to purchase additional shares). |
| Use of proceeds |
We expect to receive approximately $138.6 million of net proceeds, based upon the assumed initial public offering price of $16.50 per share (the midpoint of the price range set forth on the cover page of this prospectus), after deducting underwriting discounts and estimated offering expenses payable by us. |
| We intend to use a portion of the net proceeds from this offering to redeem all of the outstanding shares of our Redeemable Series A Preferred Stock (“Preferred Stock”), to repay in full the outstanding indebtedness under our existing revolving credit facility, which will be terminated, and the remaining net proceeds for general corporate purposes. Please read “Use of Proceeds.” |
| We will not receive any of the proceeds from the sale of shares of our common stock by the selling stockholders in this offering, including pursuant to any exercise by the underwriters of their option to purchase additional shares of our common stock from the selling stockholders. |
| Registration rights agreement |
Pursuant to a registration rights agreement, we will, subject to the terms and conditions thereof, agree to register the shares of our common stock owned by certain stockholders, including the selling stockholders, following the closing of this offering. See “Certain Relationships and Related Party Transactions—Registration Rights Agreement.” |
| Dividend policy |
We do not anticipate paying any cash dividends on our common stock. In addition, we expect the new revolving credit facility that we are in the process of negotiating will place certain restrictions on our ability to pay cash dividends. Please read “Dividend Policy.” |
12
Table of Contents
| Listing and trading symbol |
We have applied to list our common stock on the NASDAQ Global Select Market (the “NASDAQ”) under the symbol “SND.” |
| Risk factors |
You should carefully read and consider the information set forth under the heading “Risk Factors” and all other information set forth in this prospectus before deciding to invest in our common stock. |
The information above includes 350,167 shares of voting, but unvested, restricted stock. The information above does not include shares of common stock reserved for issuance pursuant to the 2016 Plan (as defined in “Executive Compensation—Equity Compensation Plans—2016 Incentive Award Plan”). Additionally, the information above does not include 3,998,896 shares of common stock that are issuable upon the exercise of outstanding warrants held by certain of our existing stockholders that we expect to be exercisable shortly after the completion of this offering. Assuming all warrants are exercised, we will have 35,637,609 shares of common stock outstanding and our selling stockholders will hold 25,008,876 shares of our common stock (or 23,416,603 shares, if the underwriters exercise in full their option to purchase additional shares).
13
Table of Contents
SUMMARY HISTORICAL CONSOLIDATED FINANCIAL DATA
The following table presents summary historical consolidated financial data of Smart Sand, Inc. as of the dates and for the periods indicated. The summary historical consolidated financial data as of and for the years ended December 31, 2015 and 2014 are derived from the audited financial statements appearing elsewhere in this prospectus. The summary historical consolidated interim financial data as of June 30, 2016 and for the six months ended June 30, 2016 and 2015 are derived from the unaudited interim financial statements appearing elsewhere in this prospectus. The unaudited condensed financial statements have been prepared on the same basis as our unaudited financial statements and, in our opinion, include all adjustments, consisting of normal recurring adjustments, that are considered necessary for a fair presentation of the financial position, results of operations and cash flows for such periods. Historical results are not necessarily indicative of future results.
The summary historical consolidated data presented below should be read in conjunction with “Risk Factors,” “Management’s Discussion and Analysis of Financial Condition and Results of Operations” and our consolidated financial statements and the related notes and other financial data included elsewhere in this prospectus.
| Year Ended December 31, |
Six Months Ended June 30, |
|||||||||||||||
| 2015 | 2014 | 2016 | 2015 | |||||||||||||
| (unaudited) | (unaudited) | |||||||||||||||
| (in thousands, except per share data) | ||||||||||||||||
| Statement of Operations Data: |
||||||||||||||||
| Revenues |
$ | 47,698 | $ | 68,170 | $ | 18,853 | $ | 23,525 | ||||||||
| Cost of goods sold |
21,003 | 29,934 | 11,869 | 12,288 | ||||||||||||
|
|
|
|
|
|
|
|
|
|||||||||
| Gross profit |
26,695 | 38,236 | 6,984 | 11,237 | ||||||||||||
| Operating expenses |
||||||||||||||||
| Salaries, benefits and payroll taxes |
5,055 | 5,088 | 2,295 | 2,828 | ||||||||||||
| Depreciation and amortization |
388 | 160 | 181 | 169 | ||||||||||||
| Selling, general and administrative |
4,669 | 7,222 | 1,926 | 2,547 | ||||||||||||
|
|
|
|
|
|
|
|
|
|||||||||
| Total operating expenses |
10,112 | 12,470 | 4,402 | 5,544 | ||||||||||||
|
|
|
|
|
|
|
|
|
|||||||||
| Operating income |
16,583 | 25,766 | 2,582 | 5,693 | ||||||||||||
| Other (expenses) income: |
||||||||||||||||
| Preferred stock interest expense(1) |
(5,078 | ) | (5,601 | ) | (3,123 | ) | (2,434 | ) | ||||||||
| Other interest expense |
(2,748 | ) | (2,231 | ) | (1,671 | ) | (1,048 | ) | ||||||||
| Other income |
362 | 370 | 189 | 351 | ||||||||||||
|
|
|
|
|
|
|
|
|
|||||||||
| Total other (expense) income(1) |
(7,464 | ) | (7,462 | ) | (4,605 | ) | (3,131 | ) | ||||||||
| Loss on extinguishment of debt |
— | (1,230 | ) | — | — | |||||||||||
|
|
|
|
|
|
|
|
|
|||||||||
| Income (loss) before income tax expense (benefit)(1) |
9,119 | 17,074 | (2,023 | ) | 2,562 | |||||||||||
| Income tax expense (benefit) |
4,129 | 9,518 | (56 | ) | 1,633 | |||||||||||
|
|
|
|
|
|
|
|
|
|||||||||
| Net and comprehensive income (loss)(1) |
$ | 4,990 | $ | 7,556 | ($ | 1,967 | ) | $ | 929 | |||||||
|
|
|
|
|
|
|
|
|
|||||||||
| Per share information: |
||||||||||||||||
| Net income (loss) per common share(1): |
||||||||||||||||
| Basic(2) |
$ | 496.42 | $ | 754.23 | $ | (195.20 | ) | $ | 92.51 | |||||||
| Diluted(3) |
$ | 415.83 | $ | 633.44 | $ | (195.20 | ) | $ | 77.39 | |||||||
| Weighted-average number of common shares: |
||||||||||||||||
| Basic |
10,052 | 10,018 | 10,077 | 10,042 | ||||||||||||
| Diluted |
12,000 | 11,929 | 12,016 | 12,004 | ||||||||||||
14
Table of Contents
| Year Ended December 31, |
Six Months Ended June 30, |
|||||||||||||||
| 2015 | 2014 | 2016 | 2015 | |||||||||||||
| (unaudited) | (unaudited) | |||||||||||||||
| (in thousands, except per share data) | ||||||||||||||||
| Balance Sheet Data (at period end): |
||||||||||||||||
| Property, plant and equipment, net |
$ | 108,928 | $ | 85,815 | $ | 106,451 | $ | 107,398 | ||||||||
| Total assets |
133,050 | 109,629 | 123,963 | 125,948 | ||||||||||||
| Total stockholders’ equity (deficit)(1) |
3,729 | (1,957 | ) | 2,103 | (694 | ) | ||||||||||
| Cash Flow Statement Data: |
||||||||||||||||
| Net cash provided by operating activities |
$ | 30,703 | $ | 22,137 | $ | 6,070 | $ | 11,446 | ||||||||
| Net cash used in investing activities |
(29,375 | ) | (30,888 | ) | (690 | ) | (21,806 | ) | ||||||||
| Net cash provided by (used in) financing activities |
1,766 | 7,434 | (7,408 | ) | 9,983 | |||||||||||
| Other Data: |
||||||||||||||||
| Capital expenditures(4) |
$ | 28,102 | $ | 34,719 | $ | (1,365 | ) | $ | 22,624 | |||||||
| Adjusted EBITDA(5) |
23,881 | 33,330 | 6,391 | 9,418 | ||||||||||||
| Production costs(5) |
10,114 | 20,690 | 5,654 | 6,040 | ||||||||||||
| (1) | Amounts previously reported have been updated to reflect the impact of the immaterial correction disclosed in Note 1 to the unaudited interim financial statements as of and for the six months ended June 30, 2016 and 2015 and in Note 1 to the audited financial statements as of and for the years ended December 31, 2015 and 2014. |
| (2) | Pro forma basic net income (loss) per share of common stock, after giving effect to the 2,200 for 1 stock split to be effected prior to the completion of this offering, would have been $0.23 and $0.34 for the years ended December 31, 2015 and 2014 and $(0.09) and $0.04 for the six months ended June 30, 2016 and 2015. |
| (3) | Pro forma diluted net income (loss) per share of common stock, after giving effect to the 2,200 for 1 stock split to be effected prior to the completion of this offering, would have been $0.19 and $0.29 for the years ended December 31, 2015 and 2014 and $(0.09) and $0.04 for the six months ended June 30, 2016 and 2015. |
| (4) | Negative capital expenditures for the six months ended June 30, 2016 resulted from various deposits received for projects included in construction-in-progress. |
| (5) | For our definitions of the non-GAAP financial measures of Adjusted EBITDA and production costs and reconciliations of Adjusted EBITDA and production costs to our most directly comparable financial measures calculated and presented in accordance with GAAP, please read “Selected Historical Consolidated Financial Data—Non-GAAP Financial Measures.” |
15
Table of Contents
Investing in shares of our common stock involves a high degree of risk. You should carefully consider the risks described below with all of the other information included in this prospectus before deciding to invest in shares of our common stock. If any of the following risks were to occur, our business, financial condition, results of operations, and cash flows could be materially adversely affected. In that case, the trading price of our common stock could decline and you could lose all or part of your investment.
Risks Inherent in Our Business
Our business and financial performance depend on the level of activity in the oil and natural gas industry.
Substantially all of our revenues are derived from sales to companies in the oil and natural gas industry. As a result, our operations are dependent on the levels of activity in oil and natural gas exploration, development and production. More specifically, the demand for the proppants we produce is closely related to the number of oil and natural gas wells completed in geological formations where sand-based proppants are used in fracturing activities. These activity levels are affected by both short- and long-term trends in oil and natural gas prices, among other factors.
In recent years, oil and natural gas prices and, therefore, the level of exploration, development and production activity, have experienced a sustained decline from the highs in the latter half of 2014. Beginning in September 2014 and continuing through early 2016, increasing global supply of oil, including a decision by the Organization of the Petroleum Exporting Countries (“OPEC”) to sustain its production levels in spite of the decline in oil prices, in conjunction with weakened demand from slowing economic growth in the Eurozone and China, has created downward pressure on crude oil prices resulting in reduced demand for our products and pressure to reduce our product prices. If these conditions persist, this will adversely impact our operations. Furthermore, the availability of key resources that impact drilling activity has experienced significant fluctuations and could impact product demand.
A prolonged reduction in oil and natural gas prices would generally depress the level of oil and natural gas exploration, development, production and well completion activity and would result in a corresponding decline in the demand for the proppants we produce. Such a decline would have a material adverse effect on our business, results of operation and financial condition. The commercial development of economically-viable alternative energy sources (such as wind, solar, geothermal, tidal, fuel cells and biofuels) could have a similar effect. In addition, certain U.S. federal income tax deductions currently available with respect to oil and natural gas exploration and development, including the repeal of the percentage depletion allowance for oil and natural gas properties, may be eliminated as a result of proposed legislation. Any future decreases in the rate at which oil and natural gas reserves are discovered or developed, whether due to the passage of legislation, increased governmental regulation leading to limitations, or prohibitions on exploration and drilling activity, including hydraulic fracturing, or other factors, could have a material adverse effect on our business and financial condition, even in a stronger oil and natural gas price environment.
We have had difficulty maintaining compliance with the covenants and ratios required under our existing revolving credit facility. We may have similar difficulties with the new revolving credit facility that we are in the process of negotiating. Failure to maintain compliance with these financial covenants or ratios could adversely affect our business, financial condition, results of operations and cash flows.
We have historically relied on our existing revolving credit facility and, following the closing of this offering, will expect to rely on the new revolving credit facility that we are in the process of negotiating to provide liquidity and support for our operations and growth objectives, as necessary. We expect that the new revolving credit facility will require, us to comply with certain financial covenants and ratios. Our ability to comply with these restrictions and covenants in the future is uncertain and will be affected by the levels of cash flow from our operations and events or circumstances beyond our control, including events and circumstances that may stem from the condition of financial markets and commodity price levels. For example, as of
16
Table of Contents
September 30, 2015, our total leverage ratio exceeded the threshold of 3.00 to 1.00 under our existing revolving credit facility. We were in compliance with all other covenants at that time. On December 18, 2015, we entered into the fourth amendment to our existing revolving credit facility which, among other things, waived the event of default related to the September 30, 2015 leverage ratio. At June 30, 2016, we were in compliance with the covenants contained in our existing revolving credit facility.
In the event that we are unable to access sufficient capital to fund our business and planned capital expenditures, we may be required to curtail potential acquisitions, strategic growth projects, portions of our current operations and other activities. A lack of capital could result in a decrease in our operations, subject us to claims of breach under customer and supplier contracts and may force us to sell some of our assets or issue additional equity on an untimely or unfavorable basis, each of which could adversely affect our business, financial condition, results of operations and cash flows.
We may not have a credit facility at the closing of this offering and may be unable to obtain financing or enter into a credit facility on acceptable terms or at all in the future.
We are currently in the process of negotiating a new revolving credit facility with unaffiliated third-party lenders. However, at the closing of this offering, we may not have the revolving credit facility in place or commitments from any lenders to enter into future financing agreements. Depending on the impact of then-prevailing economic conditions and financial, business, regulatory and other factors, some of which are beyond our control, there can be no assurances that we will be able to enter into the revolving credit facility or any other debt agreements in the future. Additionally, entering into the revolving credit facility will require (i) execution and delivery of the credit agreement and all related documents and legal opinions; (ii) delivery of officers’ certificates, financial information and organizational documents; (iii) satisfaction of conditions related to perfection of liens; (iv) obtaining all required consents and (v) payment of all fees and other amounts due to the lenders under the credit agreement, none of which are assured. As such, we may be unable to obtain financing or enter into a credit facility on acceptable terms or at all.
A substantial majority of our revenues have been generated under contracts with a limited number of customers, and the loss of, material nonpayment or nonperformance by or significant reduction in purchases by any of them could adversely affect our business, results of operations and financial condition.
As of July 31, 2016, we were contracted to sell raw frac sand produced from our Oakdale facility under four long-term take-or-pay contracts with a weighted average remaining life of approximately 2.1 years. Beginning January 1, 2017, the volume-weighted average remaining term pursuant to these take-or-pay contracts is 3.7 years. Because we have a small number of customers contracted under long-term take-or-pay contracts, these contracts subject us to counterparty risk. The ability or willingness of each of our customers to perform its obligations under a contract with us will depend on a number of factors that are beyond our control and may include, among other things, the overall financial condition of the counterparty, the condition of the U.S. oil and natural gas exploration and production industry, continuing use of raw frac sand in hydraulic fracturing operations and general economic conditions. In addition, in depressed market conditions, our customers may no longer need the amount of raw frac sand for which they have contracted or may be able to obtain comparable products at a lower price. If our customers experience a significant downturn in their business or financial condition, they may attempt to renegotiate or declare force majeure under our contracts. For example, a number of our existing contracts have recently been adjusted resulting in a combination of reduced average selling prices per ton, adjustments to take-or-pay volumes and length of contract, and one of our customers recently initiated negotiations to extend the commencement date of their contract. In the current market environment, customers have begun to purchase more volumes on a spot basis as compared to committing to term contracts, and we expect this trend to continue in the near term until oil and natural gas drilling and completion activity begins to increase. If any of our major customers substantially reduces or altogether ceases purchasing our raw frac sand and we are not able to generate replacement sales of raw frac sand into the market, our business, financial condition and results of operations could be adversely affected until such time as we generate replacement sales in the market. In addition, as contracts expire, depending on market conditions at the time, our customers may
17
Table of Contents
choose not to extend these contracts which could lead to a significant reduction of sales volumes and corresponding revenues cash flows and financial condition if we are not able to replace these contracts with new sales volumes. Additionally, even if we were to replace any lost contract volumes, under current market conditions, lower prices for our product could materially reduce our revenues, cash flow and financial condition. Currently we have one contract of 1.1 million tons per year that matures in November 2016, and we have no assurances that this contract will be renewed beyond its current term.
We are exposed to the credit risk of our customers, and any material nonpayment or nonperformance by our customers could adversely affect our business, results of operations and financial condition.
We are subject to the risk of loss resulting from nonpayment or nonperformance by our customers. Our credit procedures and policies may not be adequate to fully eliminate customer credit risk. If we fail to adequately assess the creditworthiness of existing or future customers or unanticipated deterioration in their creditworthiness, any resulting increase in nonpayment or nonperformance by them and our inability to re-market or otherwise use the production could have a material adverse effect on our business, results of operations and financial condition. The decline and volatility in natural gas and crude oil prices over the last two years has negatively impacted the financial condition of our customers and further declines, sustained lower prices, or continued volatility could impact their ability to meet their financial obligations to us. Further, our contract counterparties may not perform or adhere to our existing or future contractual arrangements. To the extent one or more of our contract counterparties is in financial distress or commences bankruptcy proceedings, contracts with these counterparties may be subject to renegotiation or rejection under applicable provisions of the United States Bankruptcy Code. Any material nonpayment or nonperformance by our contract counterparties due to inability or unwillingness to perform or adhere to contractual arrangements could adversely affect our business and results of operations. For example, in July 2016, one of our contracted customers, C&J Energy Services, filed for bankruptcy and rejected our contract, which had 2.3 years and 0.7 million tons contracted remaining under its term. We are pursuing a claim for damages through the bankruptcy courts at this time, but it is uncertain as to what, if any, recoveries we will be granted by the courts. There is no guarantee that we will be able to find new customers for these contracted volumes, if needed, and even if we are able to find new customers for such volumes, we may be forced to sell at a price lower than what was agreed to with C&J Energy Services. C&J Energy Services has also demanded a refund of the remaining balance of prepayments it claimed to have made pursuant to its contract with us. As of June 30, 2016, the balance of this prepayment was approximately $5 million and was presented as deferred revenue in the consolidated balance sheet. If resolved unfavorably, this threatened claim may have a material impact to the Company’s financial position.
Our proppant sales are subject to fluctuations in market pricing.
A majority of our supply agreements involving the sale of raw frac sand have market-based pricing mechanisms. Accordingly, in periods with decreasing prices, our results of operations may be lower than if our agreements had fixed prices. During these periods our customers may also elect to reduce their purchases from us and seek to find alternative, cheaper sources of supply. In periods with increasing prices, these agreements permit us to increase prices; however these increases are generally calculated on a quarterly basis and do not increase on a dollar-for-dollar basis with increases in spot market pricing. Furthermore, certain volume-based supply agreements may influence the ability to fully capture current market pricing. These pricing provisions may result in significant variability in our results of operations and cash flows from period to period.
Changes in supply and demand dynamics could also impact market pricing for proppants. A number of existing proppant providers and new market entrants have recently announced reserve acquisitions, processing capacity expansions and greenfield projects. In periods where sources of supply of raw frac sand exceed market demand, market prices for raw frac sand may decline and our results of operations and cash flows may continue to decline, be volatile, or otherwise be adversely affected. For example, beginning in September 2014 and continuing through 2016, increasing global supply of oil, in conjunction with weakened demand from slowing economic growth in the Eurozone and China, created downward pressure on crude oil prices resulting in reduced
18
Table of Contents
demand for hydraulic fracturing services leading to a corresponding reduced demand for our products and pressure to reduce our product prices. From September 2014 through June 2016, raw frac sand prices have decreased by approximately 27% per the Frac Sand Index compiled by the Department of Labor Statistics.
We face significant competition that may cause us to lose market share.
The proppant industry is highly competitive. The proppant market is characterized by a small number of large, national producers and a larger number of small, regional or local producers. Competition in this industry is based on price, consistency and quality of product, site location, distribution capability, customer service, reliability of supply, breadth of product offering and technical support.
Some of our competitors have greater financial and other resources than we do. In addition, our larger competitors may develop technology superior to ours or may have production facilities that offer lower-cost transportation to certain customer locations than we do. When the demand for hydraulic fracturing services decreases or the supply of proppant available in the market increases, prices in the raw frac sand market can materially decrease. Furthermore, oil and natural gas exploration and production companies and other providers of hydraulic fracturing services have acquired and in the future may acquire their own raw frac sand reserves to fulfill their proppant requirements, and these other market participants may expand their existing raw frac sand production capacity, all of which would negatively impact demand for our raw frac sand. In addition, increased competition in the proppant industry could have an adverse impact on our ability to enter into long-term contracts or to enter into contracts on favorable terms.
We may be required to make substantial capital expenditures to maintain, develop and increase our asset base. The inability to obtain needed capital or financing on satisfactory terms, or at all, could have an adverse effect on our business, results of operations and financial condition.
Although we currently use a significant amount of our cash generated from our operations to fund the maintenance and development of our asset base, we may depend on the availability of credit to fund future capital expenditures. Our ability to obtain bank financing or to access the capital markets for future equity or debt offerings may be limited by our financial condition at the time of any such financing or offering, the covenants we expect to be contained in the new revolving credit facility that we are in the process of negotiating or other future debt agreements, adverse market conditions or other contingencies and uncertainties that are beyond our control. Our failure to obtain the funds necessary to maintain, develop and increase our asset base could adversely impact our business, results of operations and financial condition.
Even if we are able to obtain financing or access the capital markets, incurring additional debt may significantly increase our interest expense and financial leverage, and our level of indebtedness could restrict our ability to fund future development and acquisition activities. In addition, the issuance of additional equity interests may result in significant dilution to our existing common stockholders.
Inaccuracies in estimates of volumes and qualities of our sand reserves could result in lower than expected sales and higher than expected production costs.
John T. Boyd, our independent reserve engineers, prepared estimates of our reserves based on engineering, economic and geological data assembled and analyzed by our engineers and geologists. However, raw frac sand reserve estimates are by nature imprecise and depend to some extent on statistical inferences drawn from available data, which may prove unreliable. There are numerous uncertainties inherent in estimating quantities and qualities of reserves and non-reserve raw frac sand deposits and costs to mine recoverable reserves, including many factors beyond our control. Estimates of economically recoverable raw frac sand reserves necessarily depend on a number of factors and assumptions, all of which may vary considerably from actual results, such as:
| • | geological and mining conditions and/or effects from prior mining that may not be fully identified by available data or that may differ from experience; |
19
Table of Contents
| • | assumptions concerning future prices of raw frac sand, operating costs, mining technology improvements, development costs and reclamation costs; and |
| • | assumptions concerning future effects of regulation, including the issuance of required permits and the assessment of taxes by governmental agencies. |
Any inaccuracy in John T. Boyd’s estimates related to our raw frac sand reserves or non-reserve raw frac sand deposits could result in lower than expected sales or higher than expected costs. For example, John T. Boyd’s estimates of our proven recoverable sand reserves assume that our revenue and cost structure will remain relatively constant over the life of our reserves. If these assumptions prove to be inaccurate, some or all of our reserves may not be economically mineable, which could have a material adverse effect on our results of operations and cash flows. In addition, our current customer contracts require us to deliver raw frac sand that meets certain API and ISO specifications. If John T. Boyd’s estimates of the quality of our reserves, including the volumes of the various specifications of those reserves, prove to be inaccurate, we may incur significantly higher excavation costs without corresponding increases in revenues, we may not be able to meet our contractual obligations, or our facilities may have a shorter than expected reserve life, any of which could have a material adverse effect on our results of operations and cash flows.
All of our sales are generated at one facility, and that facility is primarily served by one rail line. Any adverse developments at that facility or on the rail line could have a material adverse effect on our business, financial condition and results of operations.
All of our sales are currently derived from our Oakdale facility located in Oakdale, Wisconsin, which is served primarily by a single Class I rail line owned by Canadian Pacific. Any adverse development at this facility or on the rail line due to catastrophic events or weather, or any other event that would cause us to curtail, suspend or terminate operations at our Oakdale facility, could result in us being unable to meet our contracted sand deliveries. Although we maintain insurance coverage to cover a portion of these types of risks, there are potential risks associated with our operations not covered by insurance. There also may be certain risks covered by insurance where the policy does not reimburse us for all of the costs related to a loss. Downtime or other delays or interruptions to our operations that are not covered by insurance could have a material adverse effect on our business, results of operations and financial condition. In addition, under our long-term take-or-pay contracts, if we are unable to deliver contracted volumes and a customer arranges for delivery from a third party at a higher price, we may be required to pay that customer the difference between our contract price and the price of the third-party product.
If we are unable to make acquisitions on economically acceptable terms, our future growth would be limited.
A portion of our strategy to grow our business is dependent on our ability to make acquisitions. If we are unable to make acquisitions from third parties because we are unable to identify attractive acquisition candidates or negotiate acceptable purchase contracts, we are unable to obtain financing for these acquisitions on economically acceptable terms or we are outbid by competitors, our future growth may be limited. Any acquisition involves potential risks, some of which are beyond our control, including, among other things:
| • | mistaken assumptions about revenues and costs, including synergies; |
| • | inability to integrate successfully the businesses we acquire; |
| • | inability to hire, train or retain qualified personnel to manage and operate our business and newly acquired assets; |
| • | the assumption of unknown liabilities; |
| • | limitations on rights to indemnity from the seller; |
| • | mistaken assumptions about the overall costs of equity or debt; |
| • | diversion of management’s attention from other business concerns; |
20
Table of Contents
| • | unforeseen difficulties operating in new product areas or new geographic areas; and |
| • | customer or key employee losses at the acquired businesses. |
If we consummate any future acquisitions, our capitalization and results of operations may change significantly, and common stockholders will not have the opportunity to evaluate the economic, financial and other relevant information that we will consider in determining the application of these funds and other resources.
We may not be able to complete greenfield development or expansion projects or, if we do, we may not realize the expected benefits.
Any greenfield development or expansion project requires us to raise substantial capital and obtain numerous state and local permits. A decision by any governmental agency not to issue a required permit or substantial delays in the permitting process could prevent us from pursuing the development or expansion project. In addition, if the demand for our products declines during a period in which we experience delays in raising capital or completing the permitting process, we may not realize the expected benefits from our greenfield facility or expansion project. Furthermore, our new or modified facilities may not operate at designed capacity or may cost more to operate than we expect. The inability to complete greenfield development or expansion projects or to complete them on a timely basis and in turn grow our business could adversely affect our business and results of operations.
Restrictions in the new revolving credit facility that we are in the process of negotiating may limit our ability to capitalize on potential acquisition and other business opportunities.
The operating and financial restrictions and covenants in the new revolving credit facility that we are in the process of negotiating and any future financing agreements could restrict our ability to finance future operations or capital needs or to expand or pursue our business activities. For example, we expect the new revolving credit facility to restrict or limit our ability to:
| • | grant liens; |
| • | incur additional indebtedness; |
| • | engage in a merger, consolidation or dissolution; |
| • | enter into transactions with affiliates; |
| • | sell or otherwise dispose of assets, businesses and operations; |
| • | materially alter the character of our business as conducted at the closing of this offering; and |
| • | make acquisitions, investments and capital expenditures. |
Furthermore, we expect the new revolving credit facility to contain certain operating and financial covenants. Our ability to comply with such covenants and restrictions contained in the new credit facility may be affected by events beyond our control, including prevailing economic, financial and industry conditions. If market or other economic conditions deteriorate, our ability to comply with these covenants may be impaired. If we violate any of the restrictions, covenants, ratios or tests in the new revolving credit facility, a significant portion of our indebtedness may become immediately due and payable, and any lenders’ commitment to make further loans to us may terminate. We might not have, or be able to obtain, sufficient funds to make these accelerated payments. Any subsequent replacement of the new revolving credit facility or any new indebtedness could have similar or greater restrictions. Please read “Management’s Discussion and Analysis of Financial Condition and Results of Operations—Credit Facilities—Our Credit Facility and Other Arrangements.”
We face distribution and logistical challenges in our business.
Transportation and logistical operating expenses comprise a significant portion of the costs incurred by our customers to deliver raw frac sand to the wellhead, which could favor suppliers located in close proximity to the customer. As oil and natural gas prices fluctuate, our customers may shift their focus to different resource plays,
21
Table of Contents
some of which may be located in geographic areas that do not have well-developed transportation and distribution infrastructure systems, or seek contracts with additional delivery and pricing alternatives including contracts that sell product on an “as-delivered” basis at the target shale basin. Serving our customers in these less-developed areas presents distribution and other operational challenges that may affect our sales and negatively impact our operating costs and any delays we experience in optimizing our logistics infrastructure or developing additional origination and destination points may adversely affect our ability to renew existing contracts with customers seeking additional delivery and pricing alternatives. Disruptions in transportation services, including shortages of rail cars, lack of developed infrastructure, weather-related problems, flooding, drought, accidents, mechanical difficulties, strikes, lockouts, bottlenecks or other events could affect our ability to timely and cost effectively deliver to our customers and could temporarily impair the ability of our customers to take delivery and, in certain circumstances, constitute a force majeure event under our customer contracts, permitting our customers to suspend taking delivery of and paying for our raw frac sand. Additionally, increases in the price of transportation costs, including freight charges, fuel surcharges, transloading fees, terminal switch fees and demurrage costs, could negatively impact operating costs if we are unable to pass those increased costs along to our customers. Accordingly, because we are so dependent on rail infrastructure, if there are disruptions of the rail transportation services utilized by us or our customers, and we or our customers are unable to find alternative transportation providers to transport our products, our business and results of operations could be adversely affected. Further, declining volumes could result in additional rail car over-capacity, which would lead to rail car storage fees while, at the same time, we would continue to incur lease costs for those rail cars in storage. Failure to find long-term solutions to these logistical challenges could adversely affect our ability to respond quickly to the needs of our customers or result in additional increased costs, and thus could negatively impact our business, results of operations and financial condition.
We may be adversely affected by decreased demand for raw frac sand due to the development of effective alternative proppants or new processes to replace hydraulic fracturing.
Raw frac sand is a proppant used in the completion and re-completion of oil and natural gas wells to stimulate and maintain oil and natural gas production through the process of hydraulic fracturing. Raw frac sand is the most commonly used proppant and is less expensive than other proppants, such as resin-coated sand and manufactured ceramics. A significant shift in demand from raw frac sand to other proppants, or the development of new processes to make hydraulic fracturing more efficient could replace it altogether, could cause a decline in the demand for the raw frac sand we produce and result in a material adverse effect on our business, results of operations and financial condition.
An increase in the supply of raw frac sand having similar characteristics as the raw frac sand we produce could make it more difficult for us to renew or replace our existing contracts on favorable terms, or at all.
If significant new reserves of raw frac sand are discovered and developed, and those raw frac sands have similar characteristics to the raw frac sand we produce, we may be unable to renew or replace our existing contracts on favorable terms, or at all. Specifically, if high-quality raw frac sand becomes more readily available, our customers may not be willing to enter into long-term take-or-pay contracts, may demand lower prices or both, which could have a material adverse effect on our business, results of operations and financial condition.
Federal, state and local legislative and regulatory initiatives relating to hydraulic fracturing and the potential for related litigation could result in increased costs, additional operating restrictions or delays for our customers, which could cause a decline in the demand for our raw frac sand and negatively impact our business, results of operations and financial condition.
We supply raw frac sand to hydraulic fracturing operators in the oil and natural gas industry. Hydraulic fracturing is an important practice that is used to stimulate production of natural gas and oil from low permeability hydrocarbon bearing subsurface rock formations. The hydraulic fracturing process involves the injection of water, proppants, and chemicals under pressure into the formation to fracture the surrounding rock, increase permeability and stimulate production.
22
Table of Contents
Although we do not directly engage in hydraulic fracturing activities, our customers purchase our raw frac sand for use in their hydraulic fracturing activities. Hydraulic fracturing is typically regulated by state oil and natural gas commissions and similar agencies. Some states have adopted, and other states are considering adopting, regulations that could impose new or more stringent permitting, disclosure or well construction requirements on hydraulic fracturing operations. Aside from state laws, local land use restrictions may restrict drilling in general or hydraulic fracturing in particular. Municipalities may adopt local ordinances attempting to prohibit hydraulic fracturing altogether or, at a minimum, allow such fracturing processes within their jurisdictions to proceed but regulating the time, place and manner of those processes. In addition, federal agencies have started to assert regulatory authority over the process and various studies have been conducted or are currently underway by the U.S. Environmental Protection Agency (“EPA”), and other federal agencies concerning the potential environmental impacts of hydraulic fracturing activities. At the same time, certain environmental groups have suggested that additional laws may be needed and, in some instances, have pursued voter ballot initiatives to more closely and uniformly limit or otherwise regulate the hydraulic fracturing process, and legislation has been proposed by some members of Congress to provide for such regulation.
The adoption of new laws or regulations at the federal, state or local levels imposing reporting obligations on, or otherwise limiting or delaying, the hydraulic fracturing process could make it more difficult to complete natural gas wells, increase our customers’ costs of compliance and doing business, and otherwise adversely affect the hydraulic fracturing services they perform, which could negatively impact demand for our raw frac sand. In addition, heightened political, regulatory, and public scrutiny of hydraulic fracturing practices could expose us or our customers to increased legal and regulatory proceedings, which could be time-consuming, costly, or result in substantial legal liability or significant reputational harm. We could be directly affected by adverse litigation involving us, or indirectly affected if the cost of compliance limits the ability of our customers to operate. Such costs and scrutiny could directly or indirectly, through reduced demand for our raw frac sand, have a material adverse effect on our business, financial condition and results of operations.
Our long-term take-or-pay contracts may preclude us from taking advantage of increasing prices for raw frac sand or mitigating the effect of increased operational costs during the term of those contracts.
The long-term take-or-pay contracts we have may negatively impact our results of operations. Our long-term take-or-pay contracts require our customers to pay a specified price for a specified volume of raw frac sand each month. Although most of our long-term take-or-pay contracts provide for price increases based on crude oil prices, such increases are generally calculated on a quarterly basis and do not increase dollar-for-dollar with increases in spot market prices. As a result, in periods with increasing prices our sales will not keep pace with market prices.
Additionally, if our operational costs increase during the terms of our long-term take-or-pay contracts, we will not be able to pass some of those increased costs to our customers. If we are unable to otherwise mitigate these increased operational costs, our net income could decline.
Our operations are subject to operational hazards and unforeseen interruptions for which we may not be adequately insured.
Our operations are exposed to potential natural disasters, including blizzards, tornadoes, storms, floods, other adverse weather conditions and earthquakes. If any of these events were to occur, we could incur substantial losses because of personal injury or loss of life, severe damage to and destruction of property and equipment, and pollution or other environmental damage resulting in curtailment or suspension of our operations.
We are not fully insured against all risks incident to our business, including the risk of our operations being interrupted due to severe weather and natural disasters. Furthermore, we may be unable to maintain or obtain insurance of the type and amount we desire at reasonable rates. As a result of market conditions, premiums and deductibles for certain of our insurance policies have increased and could escalate further. In addition sub-limits
23
Table of Contents
have been imposed for certain risks. In some instances, certain insurance could become unavailable or available only for reduced amounts of coverage. If we were to incur a significant liability for which we are not fully insured, it could have a material adverse effect on our business, results of operations and financial condition.
Our production process consumes large amounts of natural gas and electricity. An increase in the price or a significant interruption in the supply of these or any other energy sources could have a material adverse effect on our business, results of operations and financial condition.
Energy costs, primarily natural gas and electricity, represented approximately 7.8% of our total cost of goods sold for the six months ended June 30, 2016. Natural gas is currently the primary fuel source used for drying in our raw frac sand production process. As a result, our profitability will be impacted by the price and availability of natural gas we purchase from third parties. Because we have not contracted for the provision of natural gas on a fixed-price basis, our costs and profitability will be impacted by fluctuations in prices for natural gas. The price and supply of natural gas is unpredictable and can fluctuate significantly based on international, political and economic circumstances, as well as other events outside our control, such as changes in supply and demand due to weather conditions, actions by OPEC and other oil and natural gas producers, regional production patterns, security threats and environmental concerns. In addition, potential climate change regulations or carbon or emissions taxes could result in higher production costs for energy, which may be passed on to us in whole or in part. The price of natural gas has been extremely volatile over the last two years, from a high of $4.12 per million British Thermal Units (“BTUs”) in November 2014 to a low of $1.73 per million BTUs in March 2016, and this volatility may continue. In order to manage this risk, we may hedge natural gas prices through the use of derivative financial instruments, such as forwards, swaps and futures. However, these measures carry risk (including nonperformance by counterparties) and do not in any event entirely eliminate the risk of decreased margins as a result of propane or natural gas price increases. We further attempt to mitigate these risks by including in our sales contracts fuel surcharges based on natural gas prices exceeding certain benchmarks. A significant increase in the price of energy that is not recovered through an increase in the price of our products or covered through our hedging arrangements or an extended interruption in the supply of natural gas or electricity to our production facilities could have a material adverse effect on our business, results of operations and financial condition.
Increases in the price of diesel fuel may adversely affect our business, results of operations and financial condition.
Diesel fuel costs generally fluctuate with increasing and decreasing world crude oil prices and, accordingly, are subject to political, economic and market factors that are outside of our control. Our operations are dependent on earthmoving equipment, locomotives and tractor trailers, and diesel fuel costs are a significant component of the operating expense of these vehicles. Accordingly, increased diesel fuel costs could have an adverse effect on our business, results of operations and financial condition.
A facility closure entails substantial costs, and if we close our facility sooner than anticipated, our results of operations may be adversely affected.
We base our assumptions regarding the life of our Oakdale facility on detailed studies that we perform from time to time, but our studies and assumptions may not prove to be accurate. If we close our Oakdale facility sooner than expected, sales will decline unless we are able to acquire and develop additional facilities, which may not be possible. The closure of our Oakdale facility would involve significant fixed closure costs, including accelerated employment legacy costs, severance-related obligations, reclamation and other environmental costs and the costs of terminating long-term obligations, including energy contracts and equipment leases. We accrue for the costs of reclaiming open pits, stockpiles, non-saleable sand, ponds, roads and other mining support areas over the estimated mining life of our property. If we were to reduce the estimated life of our Oakdale facility, the fixed facility closure costs would be applied to a shorter period of production, which would increase production costs per ton produced and could materially and adversely affect our business, results of operations and financial condition.
24
Table of Contents
Applicable statutes and regulations require that mining property be reclaimed following a mine closure in accordance with specified standards and an approved reclamation plan. The plan addresses matters such as removal of facilities and equipment, regrading, prevention of erosion and other forms of water pollution, re-vegetation and post-mining land use. We may be required to post a surety bond or other form of financial assurance equal to the cost of reclamation as set forth in the approved reclamation plan. The establishment of the final mine closure reclamation liability is based on permit requirements and requires various estimates and assumptions, principally associated with reclamation costs and production levels. If our accruals for expected reclamation and other costs associated with facility closures for which we will be responsible were later determined to be insufficient, our business, results of operations and financial condition may be adversely affected.
Our operations are dependent on our rights and ability to mine our properties and on our having renewed or received the required permits and approvals from governmental authorities and other third parties.
We hold numerous governmental, environmental, mining and other permits, water rights and approvals authorizing operations at our Oakdale facility. For our extraction and processing in Wisconsin, the permitting process is subject to federal, state and local authority. For example, on the federal level, a Mine Identification Request (MSHA Form 7000-51) must be filed and obtained before mining commences. If wetlands are impacted, a U.S. Army Corps of Engineers Wetland Permit is required. At the state level, a series of permits are required related to air quality, wetlands, water quality (waste water, storm water), grading permits, endangered species, archeological assessments and high capacity wells in addition to others depending upon site specific factors and operational detail. At the local level, zoning, building, storm water, erosion control, wellhead protection, road usage and access are all regulated and require permitting to some degree. A non-metallic mining reclamation permit is required. A decision by a governmental agency or other third party to deny or delay issuing a new or renewed permit or approval, or to revoke or substantially modify an existing permit or approval, could have a material adverse effect on our business, results of operations and financial condition.
Title to, and the area of, mineral properties and water rights may also be disputed. Mineral properties sometimes contain claims or transfer histories that examiners cannot verify. A successful claim that we do not have title to our property or lack appropriate water rights could cause us to lose any rights to explore, develop and extract minerals, without compensation for our prior expenditures relating to such property. Our business may suffer a material adverse effect in the event we have title deficiencies.
A shortage of skilled labor together with rising labor costs in the excavation industry may further increase operating costs, which could adversely affect our business, results of operations and financial condition.
Efficient sand excavation using modern techniques and equipment requires skilled laborers, preferably with several years of experience and proficiency in multiple tasks, including processing of mined minerals. If there is a shortage of experienced labor in Wisconsin, we may find it difficult to hire or train the necessary number of skilled laborers to perform our own operations which could have an adverse impact on our business, results of operations and financial condition.
Our business may suffer if we lose, or are unable to attract and retain, key personnel.
We depend to a large extent on the services of our senior management team and other key personnel. Members of our senior management and other key employees bring significant experience to the market environment in which we operate. Competition for management and key personnel is intense, and the pool of qualified candidates is limited. The loss of any of these individuals or the failure to attract additional personnel, as needed, could have a material adverse effect on our operations and could lead to higher labor costs or the use of less-qualified personnel. In addition, if any of our executives or other key employees were to join a competitor or form a competing company, we could lose customers, suppliers, know-how and key personnel. We do not maintain key-man life insurance with respect to any of our employees. Our success will be dependent on our ability to continue to attract, employ and retain highly skilled personnel.
25
Table of Contents
Failure to maintain effective quality control systems at our mining, processing and production facilities could have a material adverse effect on our business, results of operations and financial condition.
The performance and quality of our products are critical to the success of our business. These factors depend significantly on the effectiveness of our quality control systems, which, in turn, depends on a number of factors, including the design of our quality control systems, our quality-training program and our ability to ensure that our employees adhere to our quality control policies and guidelines. Any significant failure or deterioration of our quality control systems could have a material adverse effect on our business, results of operations and financial condition.
Seasonal and severe weather conditions could have a material adverse impact on our business, results of operations and financial condition.
Our business could be materially adversely affected by severe weather conditions. Severe weather conditions may affect our customers’ operations, thus reducing their need for our products, impact our operations by resulting in weather-related damage to our facilities and equipment and impact our customers’ ability to take delivery of our products at our plant site. Any weather-related interference with our operations could force us to delay or curtail services and potentially breach our contractual obligations to deliver minimum volumes or result in a loss of productivity and an increase in our operating costs.
In addition, winter weather conditions impact our operations by causing us to halt our excavation and wet plant related production activities during the winter months. During non-winter months, we excavate excess sand to build a stockpile that will feed the dry plants which continue to operate during the winter months. Unexpected winter conditions (such as winter arriving earlier than expected or lasting longer than expected) may result in us not having a sufficient sand stockpile to operate our dry plants during winter months, which could result in us being unable to deliver our contracted sand amounts during such time and lead to a material adverse effect on our business, results of operations and financial condition.
Our cash flow fluctuates on a seasonal basis.
Our cash flow is affected by a variety of factors, including weather conditions and seasonal periods. Seasonal fluctuations in weather impact the production levels at our wet processing plant. While our sales and finished product production levels are contracted evenly throughout the year, our mining and wet sand processing activities are limited to non-winter months. As a consequence, we experience lower cash costs in the first and fourth quarter of each calendar year.
A terrorist attack or armed conflict could harm our business.
Terrorist activities, anti-terrorist efforts and other armed conflicts involving the United States could adversely affect the U.S. and global economies and could prevent us from meeting financial and other obligations. We could experience loss of business, delays or defaults in payments from payors or disruptions of fuel supplies and markets if pipelines, production facilities, processing plants, refineries or transportation facilities are direct targets or indirect casualties of an act of terror or war. Such activities could reduce the overall demand for oil and natural gas, which, in turn, could also reduce the demand for our raw frac sand. Terrorist activities and the threat of potential terrorist activities and any resulting economic downturn could adversely affect our results of operations, impair our ability to raise capital or otherwise adversely impact our ability to realize certain business strategies.
Diminished access to water may adversely affect our operations or the operations of our customers.
The mining and processing activities at our facility requires significant amounts of water. Additionally, the development of oil and natural gas properties through fracture stimulation likewise requires significant water use. We have obtained water rights that we currently use to service the activities at our Oakdale facility, and we plan to obtain all required water rights to service other properties we may develop or acquire in the future. However, the amount of water that we and our customers are entitled to use pursuant to our water rights must be
26
Table of Contents
determined by the appropriate regulatory authorities in the jurisdictions in which we and our customers operate. Such regulatory authorities may amend the regulations regarding such water rights, increase the cost of maintaining such water rights or eliminate our current water rights, and we and our customers may be unable to retain all or a portion of such water rights. These new regulations, which could also affect local municipalities and other industrial operations, could have a material adverse effect on our operating costs and effectiveness if implemented. Such changes in laws, regulations or government policy and related interpretations pertaining to water rights may alter the environment in which we and our customers do business, which may negatively affect our financial condition and results of operations.
We may be subject to interruptions or failures in our information technology systems.
We rely on sophisticated information technology systems and infrastructure to support our business, including process control technology. Any of these systems may be susceptible to outages due to fire, floods, power loss, telecommunication failures, usage errors by employees, computer viruses, cyber-attacks or other security breaches, or similar events. The failure of any of our information technology systems may cause disruptions in our operations, which could adversely affect our sales and profitability.
Our inability to acquire, maintain or renew financial assurances related to the reclamation and restoration of mining property could have a material adverse effect on our business, financial condition, and results of operations.
We are generally obligated to restore property in accordance with regulatory standards and our approved reclamation plan after it has been mined. We are required under federal, state and local laws to maintain financial assurances, such as surety bonds, to secure such obligations. The inability to acquire, maintain or renew such assurances, as required by federal, state and local laws, could subject us to fines and penalties as well as the revocation of our operating permits. Such inability could result from a variety of factors, including:
| • | the lack of availability, higher expense, or unreasonable terms of such financial assurances; |
| • | the ability of current and future financial assurance counterparties to increase required collateral; and |
| • | the exercise by financial assurance counterparties of any rights to refuse to renew the financial assurance instruments. |
Our inability to acquire, maintain or renew necessary financial assurances related to the reclamation and restoration of mining property could have a material adverse effect on our business, financial condition, and results of operations.
Risks Related to Environmental, Mining and Other Regulation
We and our customers are subject to extensive environmental and occupational health and safety regulations that impose, and will continue to impose, significant costs and liabilities. In addition, future regulations, or more stringent enforcement of existing regulations, could increase those costs and liabilities, which could adversely affect our results of operations.
We are subject to a variety of federal, state, and local regulatory environmental requirements affecting the mining and mineral processing industry, including among others, those relating to employee health and safety, environmental permitting and licensing, air and water emissions, water pollution, waste management, remediation of soil and groundwater contamination, land use, reclamation and restoration of properties, hazardous materials, and natural resources. Some environmental laws impose substantial penalties for noncompliance, and others, such as the federal Comprehensive Environmental Response, Compensation, and Liability Act, as amended (“CERCLA”), may impose strict, retroactive, and joint and several liability for the remediation of releases of hazardous substances. Liability under CERCLA, or similar state and local laws, may be imposed as a result of conduct that was lawful at the time it occurred or for the conduct of, or conditions caused by, prior operators or other third parties. Failure to properly handle, transport, store, or dispose of
27
Table of Contents
hazardous materials or otherwise conduct our operations in compliance with environmental laws could expose us to liability for governmental penalties, cleanup costs, and civil or criminal liability associated with releases of such materials into the environment, damages to property, natural resources and other damages, as well as potentially impair our ability to conduct our operations. In addition, future environmental laws and regulations could restrict our ability to expand our facilities or extract our mineral deposits or could require us to acquire costly equipment or to incur other significant expenses in connection with our business. Future events, including adoption of new, or changes in any existing environmental requirements (or their interpretation or enforcement) and the costs associated with complying with such requirements, could have a material adverse effect on us.
Any failure by us to comply with applicable environmental laws and regulations may cause governmental authorities to take actions that could adversely impact our operations and financial condition, including:
| • | issuance of administrative, civil, or criminal penalties; |
| • | denial, modification, or revocation of permits or other authorizations; |
| • | imposition of injunctive obligations or other limitations on our operations, including cessation of operations; and |
| • | requirements to perform site investigatory, remedial, or other corrective actions. |
Any such regulations could require us to modify existing permits or obtain new permits, implement additional pollution control technology, curtail operations, increase significantly our operating costs, or impose additional operating restrictions among our customers that reduce demand for our services.
We may not be able to comply with any new or amended laws and regulations that are adopted, and any new or amended laws and regulations could have a material adverse effect on our operating results by requiring us to modify our operations or equipment or shut down our facility. Additionally, our customers may not be able to comply with any new or amended laws and regulations, which could cause our customers to curtail or cease operations. We cannot at this time reasonably estimate our costs of compliance or the timing of any costs associated with any new or amended laws and regulations, or any material adverse effect that any new or modified standards will have on our customers and, consequently, on our operations.
Silica-related legislation, health issues and litigation could have a material adverse effect on our business, reputation or results of operations.
We are subject to laws and regulations relating to human exposure to crystalline silica. Several federal and state regulatory authorities, including the U.S. Mining Safety and Health Administration (“MSHA”) may continue to propose changes in their regulations regarding workplace exposure to crystalline silica, such as permissible exposure limits and required controls and personal protective equipment. We may not be able to comply with any new or amended laws and regulations that are adopted, and any new or amended laws and regulations could have a material adverse effect on our operating results by requiring us to modify or cease our operations.
In addition, the inhalation of respirable crystalline silica is associated with the lung disease silicosis. There is evidence of an association between crystalline silica exposure or silicosis and lung cancer and a possible association with other diseases, including immune system disorders such as scleroderma. These health risks have been, and may continue to be, a significant issue confronting the proppant industry. Concerns over silicosis and other potential adverse health effects, as well as concerns regarding potential liability from the use of raw frac sand, may have the effect of discouraging our customers’ use of our raw frac sand. The actual or perceived health risks of mining, processing and handling proppants could materially and adversely affect proppant producers, including us, through reduced use of frac sand, the threat of product liability or employee lawsuits, increased scrutiny by federal, state and local regulatory authorities of us and our customers or reduced financing sources available to the frac sand industry.
28
Table of Contents
We are subject to the Federal Mine Safety and Health Act of 1977, which imposes stringent health and safety standards on numerous aspects of our operations.
Our operations are subject to the Federal Mine Safety and Health Act of 1977, as amended by the Mine Improvement and New Emergency Response Act of 2006, which imposes stringent health and safety standards on numerous aspects of mineral extraction and processing operations, including the training of personnel, operating procedures, operating equipment, and other matters. Our failure to comply with such standards, or changes in such standards or the interpretation or enforcement thereof, could have a material adverse effect on our business and financial condition or otherwise impose significant restrictions on our ability to conduct mineral extraction and processing operations.
We and our customers are subject to other extensive regulations, including licensing, plant and wildlife protection and reclamation regulation, that impose, and will continue to impose, significant costs and liabilities. In addition, future regulations, or more stringent enforcement of existing regulations, could increase those costs and liabilities, which could adversely affect our results of operations.
In addition to the regulatory matters described above, we and our customers are subject to extensive governmental regulation on matters such as permitting and licensing requirements, plant and wildlife protection, wetlands protection, reclamation and restoration activities at mining properties after mining is completed, the discharge of materials into the environment, and the effects that mining and hydraulic fracturing have on groundwater quality and availability. Our future success depends, among other things, on the quantity and quality of our raw frac sand deposits, our ability to extract these deposits profitably, and our customers being able to operate their businesses as they currently do.
In order to obtain permits and renewals of permits in the future, we may be required to prepare and present data to governmental authorities pertaining to the potential adverse impact that any proposed excavation or production activities, individually or in the aggregate, may have on the environment. Certain approval procedures may require preparation of archaeological surveys, endangered species studies, and other studies to assess the environmental impact of new sites or the expansion of existing sites. Compliance with these regulatory requirements is expensive and significantly lengthens the time needed to develop a site. Finally, obtaining or renewing required permits is sometimes delayed or prevented due to community opposition and other factors beyond our control. The denial of a permit essential to our operations or the imposition of conditions with which it is not practicable or feasible to comply could impair or prevent our ability to develop or expand a site. Significant opposition to a permit by neighboring property owners, members of the public, or other third parties, or delay in the environmental review and permitting process also could delay or impair our ability to develop or expand a site. New legal requirements, including those related to the protection of the environment, could be adopted that could materially adversely affect our mining operations (including our ability to extract or the pace of extraction of mineral deposits), our cost structure, or our customers’ ability to use our raw frac sand. Such current or future regulations could have a material adverse effect on our business and we may not be able to obtain or renew permits in the future.
Our inability to acquire, maintain or renew financial assurances related to the reclamation and restoration of mining property could have a material adverse effect on our business, financial condition and results of operations.
We are generally obligated to restore property in accordance with regulatory standards and our approved reclamation plan after it has been mined. We are required under federal, state, and local laws to maintain financial assurances, such as surety bonds, to secure such obligations. The inability to acquire, maintain or renew such assurances, as required by federal, state, and local laws, could subject us to fines and penalties as well as the revocation of our operating permits. Such inability could result from a variety of factors, including:
| • | the lack of availability, higher expense, or unreasonable terms of such financial assurances; |
| • | the ability of current and future financial assurance counterparties to increase required collateral; and |
| • | the exercise by financial assurance counterparties of any rights to refuse to renew the financial assurance instruments. |
29
Table of Contents
Our inability to acquire, maintain, or renew necessary financial assurances related to the reclamation and restoration of mining property could have a material adverse effect on our business, financial condition, and results of operations.
Climate change legislation and regulatory initiatives could result in increased compliance costs for us and our customers.
In recent years, the U.S. Congress has considered legislation to reduce emissions of greenhouse gases (“GHGs”), including methane, a primary component of natural gas, and carbon dioxide, a byproduct of the burning of natural gas. It presently appears unlikely that comprehensive climate legislation will be passed by either house of Congress in the near future, although energy legislation and other regulatory initiatives are expected to be proposed that may be relevant to GHG emissions issues. In addition, a number of states are addressing GHG emissions, primarily through the development of emission inventories or regional GHG cap and trade programs. Depending on the particular program, we could be required to control GHG emissions or to purchase and surrender allowances for GHG emissions resulting from our operations. Independent of Congress, the EPA has adopted regulations controlling GHG emissions under its existing authority under the Clean Air Act (“CAA”). For example, following its findings that emissions of GHGs present an endangerment to human health and the environment because such emissions contributed to warming of the earth’s atmosphere and other climatic changes, the EPA has adopted regulations under existing provisions of the CAA that, among other things establish construction and operating permit reviews for GHG emissions from certain large stationary sources that are already potential major sources for conventional pollutants. In addition, the EPA has adopted rules requiring the monitoring and reporting of GHG emissions from specified production, processing, transmission and storage facilities in the United States on an annual basis. Also, the United States is one of almost 200 nations that, in December 2015, agreed to the Paris Agreement, an international climate change agreement in Paris, France that calls for countries to set their own GHG emissions targets and be transparent about the measures each country will use to achieve its GHG emissions targets. The agreement was signed in April 2016, and is expected to enter into force in November 2016. The United States is one of over 70 nations having ratified or otherwise consented to be bound by the agreement. Although it is not possible at this time to predict how new laws or regulations in the United States or any legal requirements imposed following the United States’ agreeing to the Paris Agreement that may be adopted or issued to address GHG emissions would impact our business, any such future laws, regulations or legal requirements imposing reporting or permitting obligations on, or limiting emissions of GHGs from, our equipment and operations could require us to incur costs to reduce emissions of GHGs associated with our operations as well as delays or restrictions in our ability to permit GHG emissions from new or modified sources. In addition, substantial limitations on GHG emissions could adversely affect demand for the oil and natural gas we produce. Finally, it should be noted that increasing concentrations of GHGs in the Earth’s atmosphere may produce climate changes that have significant physical effects, such as increased frequency and severity of storms, floods and other climatic events; if any such effects were to occur, they could have an adverse effect on our exploration and production operations. Although it is not currently possible to predict how any such proposed or future GHG legislation or regulation by Congress, the states or multi-state regions or any legal requirements imposed following the United States’ agreeing to the Paris Agreement will impact our business, any legislation or regulation of GHG emissions that may be imposed in areas in which we conduct business could result in increased compliance costs or additional operating restrictions to us or our exploration and production customers, and could reduce demand for our frac sand, which could have a significant adverse effect on our operations.
Risks Related to This Offering and Ownership of Our Common Stock
We will be subject to certain requirements of Section 404 of the Sarbanes-Oxley Act. If we are unable to timely comply with Section 404 or if the costs related to compliance are significant, our profitability, stock price, results of operations and financial condition could be materially adversely affected.
We will be required to comply with certain provisions of Section 404 of the Sarbanes-Oxley Act as early as December 31, 2017. Section 404 requires that we document and test our internal control over financial reporting and issue management’s assessment of our internal control over financial reporting. This section also requires that our independent registered public accounting firm opine on those internal controls upon becoming a large
30
Table of Contents
accelerated filer, as defined in the SEC rules, or otherwise ceasing to qualify as an emerging growth company under the JOBS Act. We are evaluating our existing controls against the standards adopted by the Committee of Sponsoring Organizations of the Treadway Commission. During the course of our ongoing evaluation and integration of the internal control over financial reporting, we may identify areas requiring improvement, and we may have to design enhanced processes and controls to address issues identified through this review. For example, we anticipate the need to hire additional administrative and accounting personnel to conduct our financial reporting.
We believe that the out-of-pocket costs, diversion of management’s attention from running the day-to-day operations and operational changes caused by the need to comply with the requirements of Section 404 of the Sarbanes-Oxley Act could be significant. If the time and costs associated with such compliance exceed our current expectations, our results of operations could be adversely affected.
We cannot be certain at this time that we will be able to successfully complete the procedures, certification and attestation requirements of Section 404 or that we or our independent registered public accounting firm will not identify material weaknesses in our internal control over financial reporting. If we fail to comply with the requirements of Section 404 or if we or our independent registered public accounting firm identify and report such material weaknesses, the accuracy and timeliness of the filing of our annual and quarterly reports may be materially adversely affected and could cause investors to lose confidence in our reported financial information, which could have a negative effect on the stock price of our common stock. In addition, a material weakness in the effectiveness of our internal control over financial reporting could result in an increased chance of fraud and the loss of customers, reduce our ability to obtain financing and require additional expenditures to comply with these requirements, each of which could have a material adverse effect on our business, results of operations and financial condition.
The concentration of our capital stock ownership among our largest stockholders and their affiliates will limit your ability to influence corporate matters.
Upon completion of this offering (assuming no exercise of the underwriters’ option to purchase additional shares and the exercise after this offering of all outstanding warrants held by certain existing stockholders), Clearlake will beneficially own approximately 37% of our outstanding common stock. After the completion of this offering (assuming no exercise of the underwriters’ option to purchase additional shares and the exercise after this offering of all outstanding warrants), our Chief Executive Officer will beneficially own approximately 21% of our outstanding common stock. Consequently, Clearlake and our Chief Executive Officer (each of whom we refer to as a “Principal Stockholder”) will continue to have significant influence over all matters that require approval by our stockholders, including the election of directors and approval of significant corporate transactions. Additionally, upon consummation of this offering, we will become party to a stockholders agreement pursuant to which, so long as either Principal Stockholder maintains certain beneficial ownership levels of our common stock, each Principal Stockholder will have certain rights, including board of directors and committee designation rights and consent rights, including the right to consent to change in control transactions. For additional information, please read “Certain Relationships and Related Party Transactions—Stockholders Agreement.” This concentration of ownership and the rights of our Principal Stockholders under the stockholders agreement, will limit your ability to influence corporate matters, and as a result, actions may be taken that you may not view as beneficial.
Furthermore, conflicts of interest could arise in the future between us, on the one hand, and Clearlake and its affiliates, including its portfolio companies, on the other hand, concerning among other things, potential competitive business activities or business opportunities. Clearlake is a private equity firm in the business of making investments in entities in a variety of industries. As a result, Clearlake’s existing and future portfolio companies which it controls may compete with us for investment or business opportunities. These conflicts of interest may not be resolved in our favor.
31
Table of Contents
We have also renounced our interest in certain business opportunities. Please read “—Our amended and restated certificate of incorporation contains a provision renouncing our interest and expectancy in certain corporate opportunities.”
There is no existing market for our common stock, and a trading market that will provide you with adequate liquidity may not develop. The price of our common stock may fluctuate significantly, and you could lose all or part of your investment.
Prior to this offering, there has been no public market for our common stock. After this offering, there will be only 10,615,152 publicly traded shares of common stock held by our public common stockholders (12,207,424 shares of common stock if the underwriters exercise in full their option to purchase additional shares of common stock). Assuming that the existing stockholders exercise after this offering all outstanding warrants to purchase shares of our common stock, Clearlake will beneficially own 13,295,165 shares of common stock, representing an aggregate 37% of outstanding shares of our common stock (or 12,270,493 shares of common stock, representing an aggregate 34% of outstanding shares of our common stock, if the underwriters exercise in full their option to purchase additional shares of common stock. Assuming that the existing stockholders exercise after this offering all outstanding warrants to purchase shares of our common stock, our Chief Executive Officer will beneficially own 7,612,473 shares of common stock, representing an aggregate 21% of outstanding shares of our common stock (or 7,253,090 shares of common stock, representing an aggregate 20% of outstanding shares of our common stock, if the underwriters exercise in full their option to purchase additional shares of common stock). We do not know the extent to which investor interest will lead to the development of an active trading market or how liquid that market might be. You may not be able to resell your common stock at or above the initial public offering price. Additionally, the lack of liquidity may result in wide bid-ask spreads, contribute to significant fluctuations in the market price of the common stock and limit the number of investors who are able to buy the common stock.
The initial public offering price for the common stock offered hereby will be determined by negotiations between us, the selling stockholders and the representatives of the underwriters and may not be indicative of the market price of the common stock that will prevail in the trading market. The market price of our common stock may decline below the initial public offering price.
Our amended and restated certificate of incorporation contains a provision renouncing our interest and expectancy in certain corporate opportunities.
Our amended and restated certificate of incorporation provides for the allocation of certain corporate opportunities between us and Clearlake. Under these provisions, neither Clearlake, its affiliates and investment funds, nor any of their respective principals, officers, members, managers and/or employees, including any of the foregoing who serve as our officers or directors, will have any duty to refrain from engaging, directly or indirectly, in the same business activities or similar business activities or lines of business in which we operate. For instance, a director of our company who also serves or is a principal, officer, member, manager and/or employee of Clearlake or any of its affiliates or investment funds may pursue certain acquisitions or other opportunities that may be complementary to our business and, as a result, such acquisition or other opportunities may not be available to us. These potential conflicts of interest could have a material adverse effect on our business, financial condition and results of operations if attractive corporate opportunities are allocated by Clearlake to itself or its affiliates or investment funds instead of to us. The terms of our amended and restated certificate of incorporation are more fully described in “Description of Capital Stock.”
If securities or industry analysts do not publish research or reports or publish unfavorable research about our business, the price and trading volume of our common stock could decline.
The trading market for our common stock will depend in part on the research and reports that securities or industry analysts publish about us or our business. We do not currently have and may never obtain research coverage by securities and industry analysts. If no securities or industry analysts commence coverage of us the trading price for our common stock and other securities would be negatively affected. In the event we obtain
32
Table of Contents
securities or industry analyst coverage, if one or more of the analysts who covers us downgrades our securities, the price of our securities would likely decline. If one or more of these analysts ceases to cover us or fails to publish regular reports on us, interest in the purchase of our securities could decrease, which could cause the price of our common stock and other securities and their trading volume to decline.
Our amended and restated certificate of incorporation and amended and restated bylaws, as well as Delaware law, contain provisions that could discourage acquisition bids or merger proposals, which may adversely affect the market price of our common stock.
Our amended and restated certificate of incorporation authorizes our board of directors to issue preferred stock without stockholder approval. If our board of directors elects to issue preferred stock, it could be more difficult for a third party to acquire us. In addition, some provisions of our amended and restated certificate of incorporation and amended and restated bylaws could make it more difficult for a third party to acquire control of us, even if the change of control would be beneficial to our stockholders, including:
| • | advance notice provisions for stockholder proposals and nominations for elections to the board of directors to be acted upon at meetings of stockholders; |
| • | provisions that divide our board of directors into three classes of directors, with the classes to be as nearly equal in number as possible; |
| • | provisions that prohibit stockholder action by written consent after the date on which our Principal Stockholders collectively cease to beneficially own at least 50% of the voting power of the outstanding shares of our stock entitled to vote; |
| • | provisions that provide that special meetings of stockholders may be called only by the board of directors or, for so long as a Principal Stockholder continues to beneficially own at least 20% of the voting power of the outstanding shares of our stock, such Principal Stockholder; |
| • | provisions that provide that our stockholders may only amend our certificate of incorporation or bylaws with the approval of at least 66 2/3% of the voting power of the outstanding shares of our stock entitled to vote, or for so long as our Principal Stockholders collectively continue to beneficially own at least 50% of the voting power of the outstanding shares of our stock entitled to vote, with the approval of a majority of the voting power of the outstanding shares of our stock entitled to vote; |
| • | provisions that provide that the board of directors is expressly authorized to adopt, or to alter or repeal our bylaws; and |
| • | provisions that establish advance notice and certain information requirements for nominations for election to our board of directors or for proposing matters that can be acted upon by stockholders at stockholder meetings. |
Investors in this offering will experience immediate and substantial dilution of $12.05 per share.
Based on an assumed initial public offering price of $16.50 per share (the midpoint of the price range set forth on the cover of this prospectus), purchasers of our common stock in this offering will experience an immediate and substantial dilution of $12.05 per share in the net tangible book value per share of common stock from the initial public offering price, and our historical and as adjusted net tangible book value as of June 30, 2016 would be $4.45 per share. Please read “Dilution.”
We have broad discretion in the use of the net proceeds from this offering and may not use them effectively.
Our management will have broad discretion in the application of the net proceeds from this offering and could spend the proceeds in ways that do not improve our results of operations or enhance the value of our common stock. We intend to use a portion of the net proceeds from this offering to redeem all the outstanding
33
Table of Contents
shares of our preferred stock, to repay the outstanding indebtedness under our existing revolving credit facility, which will be terminated, and the remaining net proceeds for general corporate purposes. However, our use of these proceeds may differ substantially from our current plans. The failure by our management to apply these funds effectively could result in financial losses that could have a material adverse effect on our business and cause the price of our common stock to decline. Pending their use, we may invest the net proceeds from this offering in a manner that does not produce income or that loses value.
We do not intend to pay dividends on our common stock, and our debt agreements place certain restrictions on our ability to do so. Consequently, your only opportunity to achieve a return on your investment is if the price of our common stock appreciates.
We do not plan to declare dividends on shares of our common stock in the foreseeable future. Additionally, we expect the new revolving credit facility that we are in the process of negotiating will place certain restrictions on our ability to pay cash dividends. Consequently, unless we revise our dividend policy, your only opportunity to achieve a return on your investment in us will be if you sell your common stock at a price greater than you paid for it. There is no guarantee that the price of our common stock that will prevail in the market will ever exceed the price that you pay in this offering.
Future sales of our common stock in the public market could reduce our stock price, and the sale or issuance of equity or convertible securities may dilute your ownership in us.
We may sell additional shares of common stock in subsequent public offerings. We may also issue additional shares of common stock or convertible securities. After the completion of this offering, we will have outstanding 31,638,712 shares of common stock. Following the completion of this offering, assuming no exercise of the underwriters’ option to purchase additional shares, Clearlake will beneficially own 13,295,165 shares of our common stock, or approximately 37% (assuming all of the outstanding warrants held by our existing stockholders are exercised) of our total outstanding shares. Following the completion of this offering, assuming no exercise of the underwriters’ option to purchase additional shares, our Chief Executive Officer will beneficially own 7,612,473 shares of our common stock, or approximately 21% (assuming the exercise after this offering of all outstanding warrants) of our total outstanding shares. All of the shares beneficially owned by Clearlake and our Chief Executive Officer are restricted from immediate resale under the federal securities laws and are subject to the lock-up agreements with the underwriters described in “Underwriting,” but may be sold into the market in the future. Please read “Shares Eligible for Future Sale.”
In connection with this offering, we intend to file a registration statement with the SEC on Form S-8 providing for the registration of shares of our common stock issued or reserved for issuance under our equity incentive plans. Subject to the satisfaction of vesting conditions, the expiration of lock-up agreements and the requirements of Rule 144, shares registered under the registration statement on Form S-8 will be available for resale immediately in the public market without restriction. In addition, the issuance of shares of common stock upon the exercise of our outstanding warrants could result in substantial dilution to the interests of other stockholders. Please read “Description of Capital Stock—Outstanding Warrants.” We expect that warrants to purchase shares of our common stock held by certain of our existing stockholders will become exercisable shortly after the completion of this offering. Assuming all warrants are exercised, we will have 35,637,609 shares of common stock outstanding.
Additionally, we have agreed to provide certain registration rights for the sale of common stock by certain existing stockholders prior to this offering, including the selling stockholders, in the future. The sale of these shares could have an adverse impact on the price of our common stock or on any trading market that may develop. See “Shares Eligible for Future Sale.”
We cannot predict the size of future issuances of our common stock or securities convertible into common stock or the effect, if any, that future issuances and sales of shares of our common stock will have on the market price of our common stock. Sales of substantial amounts of our common stock (including shares issued in
34
Table of Contents
connection with an acquisition), or the perception that such sales could occur, may adversely affect prevailing market prices of our common stock.
The underwriters of this offering may waive or release parties to the lock-up agreements entered into in connection with this offering, which could adversely affect the price of our common stock.
We, Clearlake, all of our directors and executive officers, the selling stockholders and certain of our principal stockholders will enter into lock-up agreements with respect to their common stock, pursuant to which they are subject to certain resale restrictions for a period of 180 days following the effectiveness date of the registration statement of which this prospectus forms a part. Credit Suisse Securities (USA) LLC and Goldman, Sachs & Co., in their sole discretion, may, at any time and without notice, release all or any portion of the common stock subject to the foregoing lock-up agreements. If the restrictions under the lock-up agreements are waived, then common stock will be available for sale into the public markets, which could cause the market price of our common stock to decline and impair our ability to raise capital.
We will incur increased costs as a result of operating as a public company, and our management will be required to devote substantial time to compliance efforts.
As a public company, we will incur significant legal, accounting and other expenses that we did not incur as a private company. Our management and other personnel will need to devote a substantial amount of time and financial resources to comply with obligations related to being a publicly-traded corporation. We currently estimate that we will incur approximately $1.4 million annually in additional operating expenses as a publicly-traded corporation that we have not previously incurred, including costs associated with compliance under the Exchange Act, annual and quarterly reports to common stockholders, registrar and transfer agent fees, audit fees, incremental director and officer liability insurance costs and director and officer compensation.
We are an “emerging growth company” and we cannot be certain if the reduced disclosure requirements applicable to emerging growth companies will make our common stock less attractive to investors.
We are an “emerging growth company,” as defined in the JOBS Act, and we intend to take advantage of certain exemptions from various reporting requirements that are applicable to other public companies, including, but not limited to, not being required to comply with the auditor attestation requirements of Section 404 of the Sarbanes-Oxley Act, reduced disclosure obligations regarding executive compensation in our periodic reports and proxy statements, and exemptions from the requirements of holding a nonbinding advisory vote on executive compensation and stockholder approval of any golden parachute payments not previously approved. We intend to take advantage of these reporting exemptions until we are no longer an emerging growth company. We cannot predict if investors will find our common stock less attractive because we will rely on these exemptions. If some investors find our common stock less attractive as a result, there may be a less active trading market for our common stock and our stock price may be more volatile.
We will remain an emerging growth company for up to five years, although we will lose that status sooner if we have more than $1.0 billion of revenues in a fiscal year, have more than $700 million in market value of our common stock held by non-affiliates as of any June 30 or issue more than $1.0 billion of non-convertible debt over a rolling three-year period.
Under the JOBS Act, emerging growth companies can delay adopting new or revised accounting standards until such time as those standards apply to private companies. We have irrevocably elected not to avail ourselves of this exemption from new or revised accounting standards and, therefore, we will be subject to the same new or revised accounting standards as other public companies that are not emerging growth companies.
To the extent that we rely on any of the exemptions available to emerging growth companies, you will receive less information about our executive compensation and internal control over financial reporting than issuers that are not emerging growth companies.
35
Table of Contents
We may issue preferred stock whose terms could adversely affect the voting power or value of our common stock.
Our amended and restated certificate of incorporation authorizes us to issue, without the approval of our stockholders, one or more classes or series of preferred stock having such designations, preferences, limitations and relative rights, including preferences over our common stock respecting dividends and distributions, as our board of directors may determine. The terms of one or more classes or series of preferred stock could adversely impact the voting power or value of our common stock. For example, we might grant holders of preferred stock the right to elect some number of our directors in all events or on the happening of specified events or the right to veto specified transactions. Similarly, the repurchase or redemption rights or liquidation preferences we might assign to holders of preferred stock could affect the residual value of the common stock.
A loan previously made to our Chief Executive Officer that was outstanding at the time that we initially filed the registration statement of which this prospectus forms a part may be deemed to be a violation of Section 402 of the Sarbanes-Oxley Act of 2002, which prohibits us from extending or maintaining credit to directors or executive officers in the form of a personal loan.
In January 2016, before we filed our initial registration statement, we provided a one-year loan to our Chief Executive Officer in the amount of $61,000. During the third quarter of 2016, this loan was fully forgiven and included as compensation to our Chief Executive Officer. Section 402 of the Sarbanes-Oxley Act of 2002 prohibits “issuers” from extending or maintaining credit to directors or executive officers in the form of a personal loan. As defined under the Sarbanes-Oxley Act of 2002, the term “issuer” includes, in addition to public companies, a company that has filed a registration statement that has not yet become effective under the Securities Act of 1933, as amended (the “Securities Act”) and that has not been withdrawn. Because we became an “issuer” when we filed the registration statement with the SEC and the loan was outstanding at that time, we may be deemed to have violated Section 402 of the Sarbanes-Oxley Act of 2002. Violations of the Sarbanes-Oxley Act of 2002 could result in significant penalties, including censure, cease and desist orders, revocation of registration and fines. It is also possible that the criminal penalties could exist if the violation was willful and not the result of an innocent mistake, negligence or inadvertence.
Our amended and restated certificate of incorporation will designate the Court of Chancery of the State of Delaware as the sole and exclusive forum for certain types of actions and proceedings that may be initiated by our stockholders, which could limit our stockholders’ ability to obtain a favorable judicial forum for disputes with us or our directors, officers, employees or agents.
Our amended and restated certificate of incorporation will provide that unless we consent in writing to the selection of an alternative forum, the Court of Chancery of the State of Delaware will, to the fullest extent permitted by applicable law, be the sole and exclusive forum for (i) any derivative action or proceeding brought on our behalf, (ii) any action asserting a claim of breach of a fiduciary duty owed by any of our directors, officers, employees or agents to us or our stockholders, (iii) any action asserting a claim arising pursuant to any provision of the Delaware General Corporation Law (the “DGCL”), our amended and restated certificate of incorporation or our bylaws, or (iv) any action asserting a claim against us that is governed by the internal affairs doctrine, in each such case subject to such Court of Chancery having personal jurisdiction over the indispensable parties named as defendants therein. Any person or entity purchasing or otherwise acquiring any interest in shares of our capital stock will be deemed to have notice of, and consented to, the provisions of our amended and restated certificate of incorporation described in the preceding sentence. This choice of forum provision may limit a stockholder’s ability to bring a claim in a judicial forum that it finds favorable for disputes with us or our directors, officers, employees or agents, which may discourage such lawsuits against us and such persons. Alternatively, if a court were to find these provisions of our amended and restated certificate of incorporation inapplicable to, or unenforceable in respect of, one or more of the specified types of actions or proceedings, we may incur additional costs associated with resolving such matters in other jurisdictions, which could adversely affect our business, financial condition or results of operations.
36
Table of Contents
We expect to receive approximately $138.6 million of net proceeds (assuming the midpoint of the price range set forth on the cover of this prospectus) from the sale of the common stock offered by us after deducting underwriting discounts and commissions and estimated offering expenses payable by us.
We intend to use a portion of the net proceeds from this offering to redeem all of our outstanding Preferred Stock, to repay the outstanding indebtedness under our existing revolving credit facility, which will be terminated, and the remaining net proceeds for general corporate purposes.
We will not receive any of the proceeds from the sale of shares of our common stock by the selling stockholders in this offering, including pursuant to any exercise by the underwriters of their option to purchase additional shares of our common stock from the selling stockholders. The selling stockholders have granted the underwriters a 30-day option to purchase up to an aggregate of 1,592,273 additional shares of our common stock. We will pay all expenses related to this offering, other than underwriting discounts and commissions related to the shares sold by the selling stockholders.
The following table illustrates our anticipated use of the net proceeds from this offering:
| Sources of Funds |
Use of Funds |
|||||||||
| (In millions) | ||||||||||
| Net proceeds from this offering |
$ | 138.6 | Redemption of Preferred Stock |
$ | 40.3 | |||||
| Repayment of outstanding borrowings under our existing revolving credit facility |
57.0 | |||||||||
| General corporate purposes |
41.3 | |||||||||
|
|
|
|
|
|||||||
| Total sources of funds |
$ | 138.6 | Total uses of funds |
$ | 138.6 | |||||
|
|
|
|
|
|||||||
Our existing revolving credit facility has restrictions on our ability to make interest or principal payments on the Preferred Stock. As of June 30, 2016, we had $58.0 million of outstanding borrowings and $3.5 million of letters of credit outstanding under our existing revolving credit facility. Our existing revolving credit facility matures March 28, 2019 and bears interest at a variable rate. At June 30, 2016, the weighted average interest rate on borrowings under our existing revolving credit facility was 4.47%. We also pay a commitment fee on unused amounts of our revolving credit facility of 37.5 basis points. The outstanding borrowings under our existing revolving credit facility were incurred primarily to fund a portion of our 2014 and 2015 capital expenditures. In connection with the completion of this offering, we expect to terminate our existing revolving credit facility.
A $1.00 increase or decrease in the assumed initial public offering price of $16.50 per share would cause the net proceeds from this offering, after deducting the underwriting discounts and commissions and estimated offering expenses, received by us to increase or decrease, respectively, by approximately $8.5 million, assuming the number of shares offered by us, as set forth on the cover page of this prospectus, remains the same. If the proceeds increase due to a higher initial public offering price or due to the issuance of additional shares, we would use the additional net proceeds to fund our 2017 and 2018 capital expenditures or for general corporate purposes. If the proceeds decrease due to a lower initial public offering price or a decrease in the number of shares issued, then we would first reduce by a corresponding amount the net proceeds directed to general corporate purposes and then, if necessary, the net proceeds directed to repay outstanding borrowings under our existing revolving credit facility.
37
Table of Contents
We will effect a 2,200 for 1 stock split after the effective date of the registration statement of which this prospectus forms a part and prior to the completion of this offering. The stock split will affect all of our stockholders uniformly and will not affect any stockholder’s percentage ownership interest in us. Unless otherwise indicated, and other than the consolidated financial statements and the related notes included elsewhere in this prospectus, information presented in this prospectus is adjusted to reflect our 2,200 for 1 stock split.
We do not anticipate declaring or paying any cash dividends to holders of our common stock in the foreseeable future. We currently intend to retain future earnings, if any, to finance the growth of our business. Our future dividend policy is within the discretion of our board of directors and will depend upon then-existing conditions, including our results of operations, financial condition, capital requirements, investment opportunities, statutory restrictions on our ability to pay dividends and other factors our board of directors may deem relevant. In addition, we expect that the new revolving credit facility that we are in the process of negotiating will place restrictions on our ability to pay cash dividends.
38
Table of Contents
The following table sets forth our cash and cash equivalents and capitalization as of June 30, 2016:
| • | on a historical basis; and |
| • | on an as adjusted basis to reflect this offering and the application of the net proceeds from this offering as described under “Use of Proceeds.” |
This table is derived from, should be read together with and is qualified in its entirety by reference to the historical consolidated financial statements and the accompanying notes included elsewhere in this prospectus. You should also read this table in conjunction with “Management’s Discussion and Analysis of Financial Condition and Results of Operations.” Historical actual share amounts presented in the table below are not adjusted to reflect our 2,200 for 1 stock split that will occur after the effective date of the registration statement of which this prospectus forms a part and prior to the completion of this offering.
| As of June 30, 2016 | ||||||||
| Historical(1) | As Adjusted(2) | |||||||
| (in millions, except share data) |
||||||||
| Cash and cash equivalents |
$ | 1.9 | $ | 45.4 | ||||
|
|
|
|
|
|||||
| Long-term debt and redeemable preferred stock: |
||||||||
| Revolving credit facility(3) |
$ | 57.2 | $ | — | ||||
| Redeemable Series A Preferred Stock ($0.001 par value; 100,000 shares authorized, 38,266 issued and outstanding, actual historical; and zero shares authorized, zero shares issued and outstanding, as adjusted)(3) |
37.9 | — | ||||||
| Equipment financing obligations |
0.7 | 0.7 | ||||||
| Notes payable |
0.3 | 0.3 | ||||||
|
|
|
|
|
|||||
| Total long-term debt and redeemable preferred stock (net of current maturities) |
$ | 96.1 | $ | 1.0 | ||||
|
|
|
|
|
|||||
| Stockholders’ equity: |
||||||||
| Preferred stock ($0.001 par value; zero shares authorized, issued and outstanding, actual; and 10,000,000 shares authorized, zero shares issued and outstanding, as adjusted) |
— | — | ||||||
| Common stock ($0.001 par value; 15,000 shares authorized, 10,077 issued and outstanding, actual historical; and 350,000,000 shares authorized, 31,638,712 shares issued and outstanding, as adjusted)(4) |
* | * | ||||||
| Treasury stock (at cost; 18.0 shares, actual historical; 39,600 shares, as adjusted) |
(0.2 | ) | (0.2 | ) | ||||
| Additional paid-in capital |
4.6 | 143.2 | ||||||
| Accumulated deficit |
(2.3 | ) | (2.3 | ) | ||||
|
|
|
|
|
|||||
| Total stockholders’ equity |
$ | 2.1 | 140.7 | |||||
|
|
|
|
|
|||||
| Total Capitalization |
$ | 98.2 | 141.7 | |||||
|
|
|
|
|
|||||
| * | Less than $0.1 million. |
| (1) | Historical amounts as of June 30, 2016 are not adjusted to give effect to our 2,200 for 1 stock split that will occur after the effective date of the registration statement of which this prospectus forms a part and prior to the completion of this offering. |
| (2) | A $1.00 increase (decrease) in the assumed initial public offering price of $16.50 per share, which is the midpoint of the price range set forth on the cover page of this prospectus, would increase (decrease) additional paid-in capital, total stockholder’s equity and total capitalization each by approximately $16.5 million, assuming that the number of shares offered by us, as set forth on the cover page of this prospectus, |
39
Table of Contents
| remains the same, after deducting the estimated underwriting discounts and commissions payable by us. We may also increase or decrease the number of shares we are offering. An increase (decrease) of one million shares offered by us at an assumed offering price of $16.50 per share, which is the midpoint of the price range set forth on the cover page of this prospectus, would increase (decrease) additional paid-in capital, total stockholders’ equity and total capitalization each by approximately $26.5 million, after deducting the estimated underwriting discounts and commissions payable by us. |
| (3) | As of June 30, 2016, there was approximately $58.0 million (including net debt discount of $0.8 million) outstanding under our existing revolving credit facility as well as $0.2 million of accrued interest included in accrued expenses in the consolidated balance sheet. In connection with the completion of this offering, we will (i) repay in full outstanding borrowings under the revolving credit facility and (ii) redeem in full our Preferred Stock. Please read “Use of Proceeds” and “Management’s Discussion and Analysis of Financial Condition and Results of Operations—Credit Facilities—Our Credit Facility and Other Arrangements—Revolving Credit Facility.” |
| (4) | Excludes 3,998,896 shares issuable upon the exercise of outstanding warrants held by certain of our existing stockholders that we expect to be exercisable shortly after the completion of this offering. |
The following table presents the pro forma adjustments to net income (loss) and net income (loss) per share had the (i) repayment of the full outstanding borrowings under our revolving credit facility and (ii) redemption in full of our Preferred Stock occurred as of January 1, 2015 and January 1, 2016, respectively. Adjustments to net income (loss) for the year ended December 31, 2015 and for the six months ended June 30, 2016 include (i) $1.8 million and $1.3 million related to removal of interest expense on our revolving credit facility; (ii) $5.1 million and $3.1 million related to removal of interest expense on our Preferred Stock; (iii) $1.6 million and $0.8 million loss on extinguishment of debt due to the accelerated accretion of Preferred Stock transaction costs; and (iv) $0.7 million and $0.5 million income tax expense, respectively.
| December 31, 2015(a) | June 30, 2016(a) | |||||||
| (in thousands, except per share data) | ||||||||
| Net income (loss) |
$ | 4,990 | $ | (1,967 | ) | |||
| Proforma adjustments |
4,553 | 3,088 | ||||||
|
|
|
|
|
|||||
| Proforma net income |
$ | 9,543 | $ | 1,121 | ||||
|
|
|
|
|
|||||
| Net income (loss) per share, basic |
$ | 496.42 | $ | (195.20 | ) | |||
| Proforma adjustments per share, basic |
453.03 | 306.46 | ||||||
|
|
|
|
|
|||||
| Proforma net income per share, basic |
$ | 949.45 | $ | 111.26 | ||||
|
|
|
|
|
|||||
| Net income (loss) per share, diluted |
$ | 415.83 | $ | (195.20 | ) | |||
| Proforma adjustments per share, diluted |
379.49 | 288.51 | ||||||
|
|
|
|
|
|||||
| Proforma net income per share, diluted |
$ | 795.32 | $ | 93.31 | ||||
|
|
|
|
|
|||||
| (a) | Amounts presented are not adjusted to give effect to our 2,200 for 1 stock split that will occur after the effective date of the registration statement of which this prospectus forms a part and prior to the completion of this offering. |
The information presented above assumes no exercise of the option to purchase additional shares by the underwriters. The table does not reflect shares of common stock reserved for issuance under our 2016 Plan, which we plan to adopt in connection with this offering, or upon exercise of outstanding warrants.
40
Table of Contents
Purchasers of our common stock in this offering will experience immediate and substantial dilution in the net tangible book value (tangible assets less total liabilities) per share of our common stock for accounting purposes. Our net tangible book value as of June 30, 2016 was approximately $2.1 million, or $0.09 per share.
As adjusted net tangible book value per share is determined by dividing our net tangible book value, or total tangible assets less total liabilities, by our shares of common stock that will be outstanding immediately prior to the closing of this offering. Assuming an initial public offering price of $16.50 per share (which is the midpoint of the price range set forth on the cover page of this prospectus), after giving effect to the sale of the shares in this offering and further assuming the receipt of the estimated net proceeds (after deducting estimated underwriting discounts and commissions and estimated offering expenses payable by us), our adjusted net tangible book value as of June 30, 2016 would have been approximately $140.7 million, or $4.45 per share. This represents an immediate increase in the net tangible book value of $138.6 per share to our existing stockholders and an immediate dilution to new investors purchasing shares in this offering of $4.45 per share, resulting from the difference between the offering price and the as adjusted net tangible book value after this offering. The following table illustrates the per share dilution to new investors purchasing shares in this offering:
| Assumed initial public offering price per share |
$ | 16.50 | ||||||
| Net tangible book value per share as of June 30, 2016 |
$ | 0.09 | ||||||
| Increase per share attributable to new investors in this offering |
$ | 4.36 | ||||||
| As adjusted net tangible book value per share (after giving effect to this offering) |
$ | 4.45 | ||||||
|
|
|
|||||||
| Dilution in net tangible book value per share to new investors in this offering |
$ | 12.05 | ||||||
|
|
|
A $1.00 increase (decrease) in the assumed initial public offering price of $16.50 per share, which is the midpoint of the price range set forth on the cover page of this prospectus, would increase (decrease) our as adjusted net tangible book value per share after the offering by $0.34 and increase (decrease) the dilution to new investors in this offering by $0.66 per share, assuming the number of shares offered by us, as set forth on the cover page of this prospectus, remains the same, after deducting the estimated underwriting discounts and commissions and estimated offering expenses payable by us.
The following table summarizes, on an adjusted basis as of June 30, 2016, the total number of shares of common stock owned by existing stockholders and to be owned by new investors at $16.50 per share, which is the midpoint of the price range set forth on the cover page of this prospectus, and the total consideration paid and the average price per share paid by our existing stockholders and to be paid by new investors in this offering at $16.50, the midpoint of the price range set forth on the cover page of this prospectus, calculated before deduction of estimated underwriting discounts and commissions.
| Shares Acquired |
Total Consideration | Average Price Per Share |
||||||||||||||||||
| Number | Percent | Amount | Percent | |||||||||||||||||
| Existing stockholders(1) |
21,023,560 | 66 | % | $ | 1,675,000 | 1 | % | $ | 0.08 | |||||||||||
| New investors in this offering |
10,615,152 | 34 | 175,150,008 | 99 | % | 16.50 | ||||||||||||||
|
|
|
|
|
|
|
|
|
|
|
|||||||||||
| Total |
31,638,712 | 100 | % | $ | 176,825,000 | 100 | % | $ | 5.65 | |||||||||||
| (1) | The number of shares disclosed for the existing stockholders includes 1,592,273 shares that may be sold by the selling stockholder in this offering pursuant to any exercise of the underwriters’ option to purchase additional shares of common stock. |
The calculations above are based on 31,638,712 shares outstanding after the completion of this offering and exclude 3,998,896 shares issuable upon the exercise of outstanding warrants held by certain of our existing stockholders that we expect to be exercisable shortly after the completion of this offering. To the extent that any outstanding warrants are exercised, there will be further dilution to investors participating in this offering.
41
Table of Contents
SELECTED HISTORICAL CONSOLIDATED FINANCIAL DATA
The following table presents selected historical consolidated financial data of Smart Sand, Inc. as of the dates and for the periods indicated. The selected historical consolidated financial data as of and for the years ended December 31, 2015 and 2014 are derived from the audited financial statements appearing elsewhere in this prospectus. The selected historical consolidated interim financial data as of June 30, 2016 and for the six months ended June 30, 2016 and 2015 are derived from the unaudited interim financial statements appearing elsewhere in this prospectus. The unaudited condensed financial statements have been prepared on the same basis as our audited financial statements and, in our opinion, include all adjustments, consisting of normal recurring adjustments, which are considered necessary for a fair presentation of the financial position, results of operations and cash flows for such periods. Historical results are not necessarily indicative of future results.
The selected historical consolidated financial data presented below should be read in conjunction with “Risk Factors,” “Management’s Discussion and Analysis of Financial Condition and Results of Operations” and our consolidated financial statements and the related notes and other financial data included elsewhere in this prospectus.
| Year Ended December 31, |
Six Months Ended June 30, |
|||||||||||||||
| 2015 | 2014 | 2016 | 2015 | |||||||||||||
| (unaudited) | (unaudited) | |||||||||||||||
| (in thousands, except per share data) | ||||||||||||||||
| Statement of Operations Data: |
||||||||||||||||
| Revenues |
$ | 47,698 | $ | 68,170 | $ | 18,853 | $ | 23,525 | ||||||||
| Cost of goods sold |
21,003 | 29,934 | 11,869 | 12,288 | ||||||||||||
|
|
|
|
|
|
|
|
|
|||||||||
| Gross profit |
26,695 | 38,236 | 6,984 | 11,237 | ||||||||||||
| Operating expenses |
||||||||||||||||
| Salaries, benefits and payroll taxes |
5,055 | 5,088 | 2,295 | 2,828 | ||||||||||||
| Depreciation and amortization |
388 | 160 | 181 | 169 | ||||||||||||
| Selling, general and administrative |
4,669 | 7,222 | 1,926 | 2,547 | ||||||||||||
|
|
|
|
|
|
|
|
|
|||||||||
| Total operating expenses |
10,112 | 12,470 | 4,402 | 5,544 | ||||||||||||
|
|
|
|
|
|
|
|
|
|||||||||
| Operating income (loss) |
16,583 | 25,766 | 2,582 | 5,693 | ||||||||||||
| Other (expenses) income: |
||||||||||||||||
| Preferred stock interest expense(1) |
(5,078 | ) | (5,601 | ) | (3,123 | ) | (2,434 | ) | ||||||||
| Other interest expense |
(2,748 | ) | (2,231 | ) | (1,671 | ) | (1,048 | ) | ||||||||
| Other income |
362 | 370 | 189 | 351 | ||||||||||||
|
|
|
|
|
|
|
|
|
|||||||||
| Total other (expense) income(1) |
(7,464 | ) | (7,462 | ) | (4,605 | ) | (3,131 | ) | ||||||||
| Loss on extinguishment of debt |
— | (1,230 | ) | — | — | |||||||||||
|
|
|
|
|
|
|
|
|
|||||||||
| Income (loss) before income tax expense (benefit)(1) |
9,119 | 17,074 | (2,023 | ) | 2,562 | |||||||||||
| Income tax expense (benefit) |
4,129 | 9,518 | (56 | ) | 1,633 | |||||||||||
|
|
|
|
|
|
|
|
|
|||||||||
| Net and comprehensive income (loss)(1) |
$ | 4,990 | $ | 7,556 | $ | (1,967 | ) | $ | 929 | |||||||
|
|
|
|
|
|
|
|
|
|||||||||
| Per share information: |
||||||||||||||||
| Net income (loss) per common share(1): |
||||||||||||||||
| Basic(2) |
$ | 496.42 | $ | 754.23 | $ | (195.20 | ) | $ | 92.51 | |||||||
| Diluted(3) |
$ | 415.83 | $ | 633.44 | $ | (195.20 | ) | $ | 77.39 | |||||||
| Weighted-average number of common shares: |
||||||||||||||||
| Basic |
10,052 | 10,018 | 10,077 | 10,042 | ||||||||||||
| Diluted |
12,000 | 11,929 | 12,016 | 12,004 | ||||||||||||
| Balance Sheet Data (at period end): |
||||||||||||||||
| Property, plant and equipment, net |
$ | 108,928 | $ | 85,815 | $ | 106,451 | $ | 107,398 | ||||||||
| Total assets |
133,050 | 109,629 | 123,963 | 125,948 | ||||||||||||
| Total stockholders’ equity (deficit)(1) |
3,729 | (1,957 | ) | 2,103 | (694 | ) | ||||||||||
| Cash Flow Statement Data: |
||||||||||||||||
| Net cash provided by operating activities |
$ | 30,703 | $ | 22,137 | $ | 6,070 | $ | 11,446 | ||||||||
| Net cash used in investing activities |
(29,375 | ) | (30,888 | ) | (690 | ) | (21,806 | ) | ||||||||
| Net cash provided by (used in) financing activities |
1,766 | 7,434 | (7,408 | ) | 9,983 | |||||||||||
42
Table of Contents
| Year Ended December 31, |
Six Months Ended June 30, |
|||||||||||||||
| 2015 | 2014 | 2016 | 2015 | |||||||||||||
| (unaudited) | (unaudited) | |||||||||||||||
| (in thousands) | ||||||||||||||||
| Other Data: |
||||||||||||||||
| Capital expenditures(4) |
$ | 28,102 | $ | 34,719 | $ | (1,365 | ) | $ | 22,624 | |||||||
| Adjusted EBITDA(5) |
23,881 | 33,330 | 6,391 | 9,418 | ||||||||||||
| Production costs(5) |
10,114 | 20,690 | 5,654 | 6,040 | ||||||||||||
| (1) | Amounts previously reported have been updated to reflect the impacts of the immaterial correction disclosed in Note 1 to the unaudited interim financial statements as of and for the six months ended June 30, 2016 and 2015, and in Note 1 to the audited financial statements as of and for the years ended December 31, 2015 and 2014. |
| (2) | Pro forma basic net income (loss) per share of common stock, after giving effect to the 2,200 for 1 stock split to be effected prior to the completion of this offering, would have been $0.23 and $0.34 for the years ended December 31, 2015 and 2014 and $(0.09) and $0.04 for the six months ended June 30, 2016 and 2015. |
| (3) | Pro forma diluted net income (loss) per share of common stock, after giving effect to the 2,200 for 1 stock split to be effected prior to the completion of this offering, would have been $0.19 and $0.29 for the years ended December 31, 2015 and 2014 and $(0.09) and $0.04 for the six months ended June 30, 2016 and 2015. |
| (4) | Negative capital expenditures for the six months ended June 30, 2016 resulted from various deposits received for projects included in construction-in-progress. |
| (5) | For our definitions of the non-GAAP financial measures of Adjusted EBITDA and production costs and reconciliations of Adjusted EBITDA and production costs to our most directly comparable financial measures calculated and presented in accordance with GAAP, please read “—Non-GAAP Financial Measures.” |
43
Table of Contents
EBITDA and Adjusted EBITDA
We define EBITDA as our net income, plus (i) depreciation, depletion, accretion and amortization expense; (ii) income tax expense (benefit); (iii) interest expense and (iv) franchise taxes. We define Adjusted EBITDA as EBITDA, plus (i) gain or loss on sale of assets, (ii) costs related to our initial public offering, (iii) restricted stock compensation; (iv) development costs; (v) non-cash charges and unusual or non-recurring charges and (vi) gain or loss on extinguishment of debt. Adjusted EBITDA is used as a supplemental financial measure by management and by external users of our financial statements, such as investors and commercial banks, to assess:
| • | the financial performance of our assets without regard to the impact of financing methods, capital structure or historical cost basis of our assets; |
| • | the viability of capital expenditure projects and the overall rates of return on alternative investment opportunities; |
| • | our ability to incur and service debt and fund capital expenditures; and |
| • | our operating performance as compared to those of other companies in our industry without regard to the impact of financing methods and capital structure. |
We believe that our presentation of EBITDA and Adjusted EBITDA will provide useful information to investors in assessing our financial condition and results of operations. Net income is the GAAP measure most directly comparable to EBITDA and Adjusted EBITDA. EBITDA and Adjusted EBITDA should not be considered alternatives to net income presented in accordance with GAAP. Because EBITDA and Adjusted EBITDA may be defined differently by other companies in our industry, our definition of EBITDA and Adjusted EBITDA may not be comparable to similarly titled measures of other companies, thereby diminishing its utility. The following table presents a reconciliation of EBITDA and Adjusted EBITDA to net income (loss) for each of the periods indicated.
| Year Ended December 31, |
Six Months Ended June 30, |
|||||||||||||||
| 2015 | 2014 | 2016 | 2015 | |||||||||||||
| (in thousands) | ||||||||||||||||
| Net income (loss) |
$ | 4,990 | $ | 7,556 | $ | (1,967 | ) | $ | 929 | |||||||
| Depreciation, depletion, accretion and amortization |
5,318 | 3,642 | 3,209 | 2,342 | ||||||||||||
| Income tax expense (benefit) |
4,129 | 9,518 | (56 | ) | 1,633 | |||||||||||
| Interest expense |
7,826 | 7,832 | 4,794 | 3,482 | ||||||||||||
| Franchise taxes |
35 | 139 | 16 | 25 | ||||||||||||
|
|
|
|
|
|
|
|
|
|||||||||
| EBITDA |
$ | 22,298 | $ | 28,687 | $ | 5,996 | $ | 8,411 | ||||||||
| Gain (loss) on sale of assets |
39 | 57 | (30 | ) | 45 | |||||||||||
| Initial public offering-related costs |
221 | 2,687 | — | 183 | ||||||||||||
| Restricted stock compensation |
792 | 420 | 420 | 416 | ||||||||||||
| Development costs |
76 | 249 | — | 28 | ||||||||||||
| Non-cash charges and unusual or non-recurring charges |
455 | — | 5 | 335 | ||||||||||||
| Loss on extinguishment of debt |
— | 1,230 | — | — | ||||||||||||
|
|
|
|
|
|
|
|
|
|||||||||
| Adjusted EBITDA |
$ | 23,881 | $ | 33,330 | $ | 6,391 | $ | 9,418 | ||||||||
|
|
|
|
|
|
|
|
|
|||||||||
44
Table of Contents
Production Costs
We also use production costs, which we define as costs of goods sold, excluding depreciation, depletion, accretion of asset retirement obligations and freight charges to measure our financial performance. Freight charges consist of shipping costs and rail car rental and storage expenses. Shipping costs consist of railway transportation costs to deliver products to customers. Rail car rental and storage expenses are associated with our long-term rail car operating agreements with certain customers. A portion of these freight charges are passed through to our customers and therefore included in revenue. We believe production costs is a meaningful measure to management and external users of our financial statements, such as investors and commercial banks because it provides a measure of operating performance that is unaffected by historical cost basis. Cost of goods sold is the GAAP measure most directly comparable to production costs. Production costs should not be considered an alternative to cost of goods sold presented in accordance with GAAP. Because production costs may be defined differently by other companies in our industry, our definition of production costs may not be comparable to similarly titled measures of other companies, thereby diminishing its utility. The following table presents a reconciliation of production costs to cost of goods sold.
| Year Ended December 31, |
Six Months Ended June 30, |
|||||||||||||||
| 2015 | 2014 | 2016 | 2015 | |||||||||||||
| (in thousands) | ||||||||||||||||
| Cost of goods sold |
$ | 21,003 | $ | 29,934 | $ | 11,869 | $ | 12,288 | ||||||||
| Depreciation, depletion, and accretion of asset retirement obligations |
(4,930 | ) | (3,481 | ) | (3,028 | ) | (2,173 | ) | ||||||||
| Freight charges |
(5,959 | ) | (5,763 | ) | (3,187 | ) | (4,075 | ) | ||||||||
|
|
|
|
|
|
|
|
|
|||||||||
| Production costs |
$ | 10,114 | $ | 20,690 | $ | 5,654 | $ | 6,040 | ||||||||
|
|
|
|
|
|
|
|
|
|||||||||
45
Table of Contents
MANAGEMENT’S DISCUSSION AND ANALYSIS OF FINANCIAL CONDITION AND RESULTS OF OPERATIONS
You should read the following discussion and analysis of our financial condition and results of operations together with our audited financial statements and the related notes appearing at the end of this prospectus. Some of the information contained in this discussion and analysis or set forth elsewhere in this prospectus, including information with respect to our plans and strategy for our business and related financing, includes forward-looking statements that involve risks and uncertainties. You should read the “Risk Factors” section of this prospectus for a discussion of important factors that could cause actual results to differ materially from the results described in or implied by the forward-looking statements contained in the following discussion and analysis.
We are a pure-play, low-cost producer of high-quality Northern White raw frac sand, which is a preferred proppant used to enhance hydrocarbon recovery rates in the hydraulic fracturing of oil and natural gas wells. We sell our products primarily to oil and natural gas exploration and production companies, such as EOG Resources, and oilfield service companies, such as Weatherford, under a combination of long-term take-or-pay contracts and spot sales in the open market. We believe that the size and favorable geologic characteristics of our sand reserves, the strategic location and logistical advantages of our facilities and the industry experience of our senior management team have positioned us as a highly attractive source of raw frac sand to the oil and natural gas industry.
We own and operate a raw frac sand mine and related processing facility near Oakdale, Wisconsin, at which we have approximately 244 million tons of proven recoverable sand reserves and approximately 92 million tons of probable recoverable sand reserves as of June 30, 2016, respectively. We began operations with 1.1 million tons of processing capacity in July 2012 and expanded to 2.2 million tons capacity in August 2014 with an additional expansion to 3.3 million tons in September 2015. Our integrated Oakdale facility, with on-site rail infrastructure and wet and dry sand processing facilities, has access to two Class I rail lines and enables us to process and cost-effectively deliver up to approximately 3.3 million tons of raw frac sand per year. We believe that with further development and permitting the Oakdale facility ultimately could be expanded to allow production of up to 9 million tons of raw frac sand per year.
Our sand reserves include a balanced concentration of coarse (20/40, 30/50 and 40/70 gradation) sands and fine (60/140 gradation, which we refer to in this prospectus as “100 mesh”) sand. Our reserves contain deposits of approximately 19% of 20/40 and coarser substrate, 41% of 40/70 mesh substrate and approximately 40% of 100 mesh substrate. Our 30/50 gradation is a derivative of the 20/40 and 40/70 blends. We believe that this mix of coarse and fine sand reserves, combined with contractual demand for our products across a range of mesh sizes, provides us with relatively higher mining yields and lower processing costs than frac sand mines with predominantly coarse sand reserves. In addition, our approximate 244 million tons of proven recoverable reserves implies a reserve life of approximately 73 years based on our current annual processing capacity of 3.3 million tons per year. This long reserve life enables us to better serve demand for different types of raw frac sand as compared to mines with shorter reserve lives. We currently have one wet plant and one dryer in storage at Oakdale that would allow us to increase our annual processing capacity to approximately 4.4 million tons should market demand increase sufficiently to warrant capacity expansion. We believe that with further development and permitting, the Oakdale facility could ultimately be expanded to allow production of up to 9 million tons of raw frac sand per year.
Our Oakdale facility is purpose-built to exploit the reserve profile in place and produce high-quality raw frac sand. Unlike some of our competitors, our primary processing and rail loading facilities are located in close
46
Table of Contents
proximity at the mine site, which eliminates the need for us to truck sand on public roads between the mine and the production facility or between wet and dry processing facilities. Our on-site transportation assets include approximately seven miles of rail track in a double-loop configuration and three rail car loading facilities that are connected to a Class I rail line owned by Canadian Pacific. This enables us to simultaneously accommodate multiple unit trains and significantly increases our efficiency in meeting our customers’ raw frac sand transportation needs. Our Oakdale facility is dual served with connections to the Canadian Pacific and Union Pacific networks. In addition, we have a transload facility approximately 3.5 miles from the Oakdale facility in Byron Township, Wisconsin that provides us with the ability to ship sand to our customers on the Union Pacific network. We believe that we are the only sand facility in Wisconsin that has dual served rail capabilities, which should create competition among our rail carriers and allow us to provide more competitive logistics options for our customers. Most of our product is shipped via unit trains, which we believe should yield lower operating and transportation costs compared to manifest train or single-unit train facilities due to our higher rail car utilization, more efficient use of locomotive power and more predictable movement of products between mine and destination. We believe that the combination of efficient production and processing, our well-designed plant, our dual served rail access and our focus on shipping sand in unit trains offer a considerable economic advantage to our customers.
Industry Trends Impacting Our Business
Unless otherwise indicated, the information set forth under “—Industry Trends Impacting Our Business,” including all statistical data and related forecasts, is derived from The Freedonia Group’s Industry Study #3302, “Proppants in North America,” published in September 2015, Spears & Associates’ “Hydraulic Fracturing Market 2005-2017” published in the second quarter 2016, PropTester, Inc. and Kelrik, LLC’s “2015 Proppant Market Report” published in March 2016 and Baker Hughes’ “North America Rotary Rig Count” published July 2016. While we are not aware of any misstatements regarding the proppant industry data presented herein, estimates involve risks and uncertainties and are subject to change based on various factors, including those discussed under the heading “Risk Factors.”
47
Table of Contents
Demand Trends
According to Spears, the U.S. proppant market, including raw frac sand, ceramic and resin-coated proppant, was approximately 52.5 million tons in 2015. Kelrik estimates that the total raw frac sand market in 2015 represented approximately 92.3% of the total proppant market by weight. Market demand in 2015 dropped by approximately 28% from 2014 record demand levels (and a further estimated decrease of 43% in 2016 from 2015) due to the downturn in commodity prices since late 2014, which led to a corresponding decline in oil and natural gas drilling and production activity. According to the Freedonia Group, during the period from 2009 to 2014, proppant demand by weight increased by 42% annually. Spears estimates from 2016 through 2020 proppant demand is projected to grow by 23.2% per year, from 30 million tons per year to 85 million tons per year, representing an increase of approximately 55 million tons in annual proppant demand over that time period.
This change in demand has impacted contract discussions and negotiated terms with our customers as existing contracts have been adjusted resulting in a combination of reduced average selling prices per ton, adjustments to take-or-pay volumes and length of contract. We believe we have mitigated the short-term negative impact on revenues of some of these adjustments through contractual shortfall and reservation payments. In the current market environment, customers have begun to purchase more volumes on a spot basis as compared to committing to term contracts, and we expect this trend to continue in the near term until oil and natural gas drilling and completion activity begins to increase. However, should drilling and completion activity return to higher levels, we believe customers would more actively consider contracting proppant volumes under term contracts rather than continuing to rely on buying proppant on a spot basis in the market.
Demand growth for raw frac sand and other proppants is primarily driven by advancements in oil and natural gas drilling and well completion technology and techniques, such as horizontal drilling and hydraulic fracturing. These advancements have made the extraction of oil and natural gas increasingly cost-effective in formations that historically would have been uneconomic to develop. While current horizontal rig counts have fallen significantly from their peak of approximately 1,370 in 2014, rig count grew at an annual rate of 18.7% from 2009 to 2014. Additionally, the percentage of active drilling rigs used to drill horizontal wells, which require greater volumes of proppant than vertical wells, has increased from 42.2% in 2009 to 68.4% in 2014, and as of July 2016 the percentage of rigs drilling horizontal wells is 77% according to the Baker Hughes Rig Count. Moreover, the increase of pad drilling has led to a more efficient use of rigs, allowing more wells to be drilled per rig. As a result of these factors, well count, and hence proppant demand, has grown at a greater rate than overall rig count. Spears estimates that in 2019, proppant demand will exceed the 2014 peak (of approximately 72.5 million tons) and reach 77.5 million tons even though the projection assumes approximately 10,000 fewer wells will be drilled. Spears estimates that average proppant usage per well will be approximately 5,000 tons per well by 2020. Kelrik notes that current sand-based slickwater completions use in excess of 7,500 tons per well of proppant.
48
Table of Contents
While demand for proppant has declined since late 2014 in connection with the downturn in commodity prices and the corresponding decline in oil and natural gas drilling and production activity, we believe that the demand for proppant will increase over the medium and long term as commodity prices rise from their recent lows, which will lead producers to resume completion of their inventory of drilled but uncompleted wells and undertake new drilling activities. Further, we believe that demand for proppant will be amplified by the following factors:
| • | improved drilling rig productivity, resulting in more wells drilled per rig per year; |
| • | completion of exploration and production companies’ inventory of drilled but uncompleted wells; |
| • | increases in the percentage of rigs that are drilling horizontal wells; |
| • | increases in the length of the typical horizontal wellbore; |
| • | increases in the number of fracture stages per foot in the typical completed horizontal wellbore; |
| • | increases in the volume of proppant used per fracturing stage; |
| • | renewed focus of exploration and production companies to maximize ultimate recovery in active reservoirs through downspacing; and |
| • | increasing secondary hydraulic fracturing of existing wells as early shale wells age. |
Recent growth in demand for raw frac sand has outpaced growth in demand for other proppants, and industry analysts predict that this trend will continue. As well completion costs have increased as a proportion of total well costs, operators have increasingly looked for ways to improve per well economics by lowering costs without sacrificing production performance. To this end, the oil and natural gas industry is shifting away from the use of higher-cost proppants towards more cost-effective proppants, such as raw frac sand. Evolution of completion techniques and the substantial increase in activity in U.S. oil and liquids-rich resource plays has further accelerated the demand growth for raw frac sand.
In general, oil and liquids-rich wells use a higher proportion of coarser proppant while dry gas wells typically use finer grades of sand. In the past, with the majority of U.S. exploration and production spending focused on oil and liquids-rich plays, demand for coarser grades of sand exceeded demand for finer grades; however, due to innovations in completion techniques, demand for finer grade sands has also shown a considerable resurgence. According to Kelrik, a notable driver impacting demand for fine mesh sand is increased proppant loadings, specifically, larger volumes of proppant placed per frac stage. Kelrik expects the trend of using larger volumes of finer mesh materials such as 100 mesh sand and 40/70 sand, to continue.
According to The Freedonia Group, development of unconventional resources such as shale oil and natural gas has been the driving force behind growth in proppant demand over the past decade. While significant demand began with drilling in the Barnett Shale, more recent growth has been in liquids-rich plays such as the Permian and Eagle Ford Shales. Demand in these and similar formations had been driven by high oil prices, which spurred drilling activity, and by the depth and challenging geology of these wells, which require larger amounts of proppant to complete as they involve more fracturing stages. However, the drop in oil prices that began in June 2014 slowed drilling activity in liquids-rich plays and, therefore, adversely affected proppant demand. A recovery of both oil and natural gas prices should renew demand in most liquid and gas shale fields.
Supply Trends
In recent years, through the fall of 2014, customer demand for high-quality raw frac sand outpaced supply. Several factors contributed to this supply shortage, including:
| • | the difficulty of finding frac sand reserves that meet API specifications and satisfy the demands of customers who increasingly favor high-quality Northern White raw frac sand; |
49
Table of Contents
| • | the difficulty of securing contiguous raw frac sand reserves large enough to justify the capital investment required to develop a processing facility; |
| • | the challenges of identifying reserves with the above characteristics that have rail access needed for low-cost transportation to major shale basins; |
| • | the hurdles to securing mining, production, water, air, refuse and other federal, state and local operating permits from the proper authorities; |
| • | local opposition to development of certain facilities, especially those that require the use of on-road transportation, including moratoria on raw frac sand facilities in multiple counties in Wisconsin and Minnesota that hold potential sand reserves; and |
| • | the long lead time required to design and construct sand processing facilities that can efficiently process large quantities of high-quality raw frac sand. |
Supplies of high-quality Northern White frac sand are limited to select areas, predominantly in western Wisconsin and limited areas of Minnesota and Illinois. The ability to obtain large contiguous reserves in these areas is a key constraint and can be an important supply consideration when assessing the economic viability of a potential raw frac sand facility. Further constraining the supply and throughput of Northern White raw frac sand, is that not all of the large reserve mines have onsite excavation and processing capability. Additionally, much of the recent capital investment in Northern White raw frac sand mines was used to develop coarser deposits in western Wisconsin. With the shift to finer sands in the liquid and oil plays, many mines may not be economically viable as their ability to produce finer grades of sand may be limited.
Pricing
We generally expect the price of raw frac sand to correlate with the level of drilling activity for oil and natural gas. The willingness of exploration and production companies to engage in new drilling is determined by a number of factors, the most important of which are the prevailing and projected prices of oil and natural gas, the cost to drill and operate a well, the availability and cost of capital and environmental and government regulations. We generally expect the level of drilling to correlate with long-term trends in commodity prices. Similarly, oil and natural gas production levels nationally and regionally generally tend to correlate with drilling activity.
Sand is sold on a contract basis or through spot market pricing. Long-term take-or-pay contracts reduce exposure to fluctuations in price and provide predictability of volumes and price over the contract term. By contrast, the spot market provides direct access to immediate prices, with accompanying exposure to price volatility and uncertainty. For sand producers operating under stable long-term contract structures, the spot market can offer an outlet to sell excess production at opportunistic times or during favorable market conditions.
We generate revenue by excavating and processing raw frac sand, which we sell to our customers under long-term price agreements or at prevailing market rates. In some instances, revenues also include a charge for transportation services provided to customers. Our transportation revenue fluctuates based on a number of factors, including the volume of product transported and the distance between the plant and our customers.
As of June 30, 2016, our facility had the capacity to produce 3.3 million tons of raw frac sand per year. When market conditions are favorable, we look to enter into long-term take-or-pay contracts with our customers that are intended to mitigate our exposure to the potential price volatility of the spot market for raw frac sand and to enhance the stability of our cash flows. As of July 31, 2016, we had approximately 2.1 million tons (or approximately 64% of our current annual production capacity) contracted to oil and natural gas exploration and
50
Table of Contents
production and oilfield service companies. Beginning January 1, 2017, we will have approximately 1.0 million tons of average annual production (or approximately 30.6% of our current annual production capacity) contracted under long-term take-or-pay contracts. Each contract defines, among other commitments, the minimum volume of product that the customer is required to purchase per contract year and the minimum tonnage per grade, the volume of product that we are required to provide, the price that we will charge and that our customers will pay for each ton of contracted product, and certain remedies in the event either we or the customer fails to meet minimum requirements.
Our current contracts include a combination of fixed prices and market based prices. For fixed price contracts, prices are fixed and subject to adjustment, upward or downward, based upon: (i) certain changes in published producer cost indices, including the Consumer Price Index for All Urban Consumers and the Producer Price Index published by the U.S. Bureau of Labor Statistics; or (ii) market factors, including a natural gas surcharge and/or a propane surcharge which are applied if the Average Natural Gas Price or the Average Quarterly Mont Belvieu TX Propane Spot Price, respectively, as listed by the U.S. Energy Information Administration, are above the benchmark set in the contract for the preceding calendar quarter. Contracts with market based pricing mechanisms allow for our raw frac sand prices to fluctuate within certain negotiated ranges depending on the price of crude oil (based upon the Average Cushing Oklahoma WTI Spot Prices (“WTI”) as listed on www.eia.doe.gov) for the preceding three month period. As a result, our realized prices may not grow at rates consistent with broader industry pricing trends. We may also elect to sell raw frac sand in the spot market if we have excess production and the spot market conditions are favorable.
With respect to the take-or-pay contracts, if the customer is not allowed to make up deficiencies, we recognize revenues to the extent of the minimum contracted quantity, assuming payment has been received or is reasonably assured. If deficiencies can be made up, receipts in excess of actual sales are recognized as deferred revenues until production is actually taken or the right to make up deficiencies expires. For the year ended December 31, 2015 and for the six months ended June 30, 2016, we received $11.1 million and $9.5 million in contractual minimum payments, respectively. As of June 30, 2016, $1.0 million of these contractual minimum payments was recognized as deferred revenue; there were no such payments recognized as deferred revenue as of December 31, 2015.
Due to sustained freezing temperatures in our area of operation during winter months, we halt the operation of our wet plant for up to five months. As a result, we excavate and wash sand in excess of current delivery requirements during the months when the wet plant is operational. This excess sand is placed in stockpiles that feed the dry plants and enable us to fill customer orders throughout the year without interruption.
Costs of Conducting Our Business
The principal direct costs involved in operating our business are excavation, labor and utility costs.
We incur excavation costs with respect to the excavation of sand and other materials from which we ultimately do not derive revenue. However, the ratio of rejected materials to total amounts excavated has been, and we believe will continue to be, in line with our expectations, given the extensive core sampling and other testing we undertook at the Oakdale facility. For more information regarding our reserves testing procedures, please read “Business—Our Assets and Operations—Our Reserves.”
On August 1, 2010, we entered into a consulting agreement related to the purchase of land with a third party, whereby he acted as an agent for us to obtain options to purchase certain identified real property in Wisconsin, as well as obtain permits and approvals necessary to open, construct and operate a sand mining and processing facility on such real property. In connection with this agreement, our mineral rights are subject to an aggregate non-participating royalty interest of $0.50 per ton sold of 70 mesh and coarser substrate.
51
Table of Contents
We incurred excavation costs of $1.4 million and $5.4 million during the years ended December 31, 2015 and 2014, respectively. For the six months ended June 30, 2016 and 2015, we incurred $0.5 million and $0.3 million of excavation costs, respectively.
Labor costs associated with employees at our processing facility represent the most significant cost of converting raw frac sand to finished product. We incurred labor costs of $4.8 million and $5.2 million for the years ended December 31, 2015 and 2014, respectively, and $2.0 million and $2.6 million for the six months ended June 30, 2016 and 2015, respectively. We incur utility costs in connection with the operation of our processing facility, primarily electricity and natural gas, which are both susceptible to market fluctuations. We incurred utility costs of $2.6 million and $5.6 million for the years ended December 31, 2015 and 2014, respectively, and $0.9 million and $1.4 million for the six months ended June 30, 2016 and 2015, respectively. Our facilities require periodic scheduled maintenance to ensure efficient operation and to minimize downtime, which historically has not resulted in significant costs to us.
Direct excavation costs, processing costs, overhead allocation, depreciation and depletion are capitalized as a component of inventory and are reflected in cost of goods sold when inventory is sold.
Revenue is generally recognized FCA, payment made at the origination point at our facility, and title passes as the product is loaded into rail cars hired by the customer. Certain spot-rate customers have shipping terms of FCA, payment made at the destination, for which we recognize revenue when the sand is received at the destination. As a result, we generally do not incur shipping expenses, as the expense is passed through to the customer.
How We Evaluate Our Operations
Gross Profit and Production Costs
We market our raw frac sand production under long-term take-or-pay contracts that either have fixed prices for our production or market based prices for our production that fluctuate with the price of crude oil. Additionally, we sell sand on a spot basis at current prevailing spot market prices. When market conditions are favorable, we look to enter into long-term take-or-pay contracts with our customers that are intended to mitigate our exposure to the potential price volatility of the spot market for raw frac sand and to enhance the stability of our cash flows. As of July 31, 2016, we had approximately 2.1 million tons (or approximately 64% of our current annual production capacity) contracted to oil and natural gas exploration and production and oilfield service companies. Beginning January 1, 2017, we will have approximately 1.0 million tons of average annual production (or approximately 30.6% of our current annual production capacity) contracted under long-term take-or-pay contracts. Our revenues are generated from a combination of raw frac sand sales and minimum contractual payments we receive from our customers. Gross profit will primarily be affected by the price we are able to receive for the sale of our raw frac sand along with our minimum contractual payments made by our customers and our ability to control other direct and indirect costs associated with processing raw frac sand.
We also use production costs, which we define as costs of goods sold, excluding depreciation, depletion, accretion of asset retirement obligations and freight charges, to measure our financial performance. We believe production costs is a meaningful measure because it provides a measure of operating performance that is unaffected by historical cost basis. For a reconciliation of production costs to its most directly comparable financial measure calculated and presented in accordance with GAAP, please read “Selected Historical Consolidated Financial Data—Non-GAAP Financial Measures.”
EBITDA and Adjusted EBITDA
We view EBITDA and Adjusted EBITDA as an important indicator of performance. We define EBITDA as our net income, plus (i) depreciation, depletion, accretion and amortization expense, (ii) income tax expense
52
Table of Contents
(benefit), (iii) interest expense and (iv) franchise taxes. We define Adjusted EBITDA as EBITDA, plus (i) gain or loss on sale of assets, (ii) initial public offering related costs, (iii) restricted stock compensation, (iv) development costs, (v) non-cash charges and unusual or non-recurring charges and (vi) gain or loss on extinguishment of debt. We recognize shortfall payments on a quarterly or annual basis in accordance with the respective terms of our customer contracts. Therefore, shortfall payment revenue impacts EBITDA and Adjusted EBITDA in only certain periods rather than on a straight-line basis over the entire period. Please read “Selected Historical Consolidated Financial Data—Non-GAAP Financial Measures.” EBITDA and Adjusted EBITDA are supplemental measures utilized by our management and other users of our financial statements such as investors, commercial banks, research analysts and others, to assess the financial performance of our assets without regard to financing methods, capital structure or historical cost basis.
Note Regarding Non-GAAP Financial Measures
Production costs, EBITDA and Adjusted EBITDA are not financial measures presented in accordance with GAAP. We believe that the presentation of these non-GAAP financial measures will provide useful information to investors in assessing our financial condition and results of operations. Costs of goods sold is the GAAP measure most directly comparable to production costs and net income is the GAAP measure most directly comparable to EBITDA and Adjusted EBITDA. Our non-GAAP financial measures should not be considered as alternatives to the most directly comparable GAAP financial measure. Each of these non-GAAP financial measures has important limitations as analytical tools because they exclude some but not all items that affect the most directly comparable GAAP financial measures. You should not consider production costs, EBITDA or Adjusted EBITDA in isolation or as substitutes for an analysis of our results as reported under GAAP. Because production costs, EBITDA and Adjusted EBITDA may be defined differently by other companies in our industry, our definitions of these non-GAAP financial measures may not be comparable to similarly titled measures of other companies, thereby diminishing their utility. Please read “Selected Historical Consolidated Financial Data—Non-GAAP Financial Measures.”
Factors Impacting Comparability of Our Financial Results
Our historical results of operations and cash flows are not indicative of results of operations and cash flows to be expected in the future, principally for the following reasons:
| • | We completed an expansion of our Oakdale facility in September 2015. In September 2015, we completed an expansion project to increase our processing capacity at our Oakdale facility from 2.2 million tons per year to approximately 3.3 million tons per year. As of July 31, 2016, we had approximately 2.1 million tons (or approximately 64% of our current annual production capacity) contracted to oil and natural gas exploration and production and oilfield service companies. Beginning January 1, 2017, we will have approximately 1.0 million tons of average annual production (or approximately 30.6% of our current annual production capacity) contracted under long-term take-or-pay contracts, with a volume-weighted average remaining term of approximately 3.7 years. |
| • | We will incur additional operating expenses as a publicly traded corporation. We expect we will incur approximately $1.4 million annually in additional operating expenses as a publicly traded corporation that we have not previously incurred, including costs associated with compliance under the Exchange Act, annual and quarterly reports to common stockholders, registrar and transfer agent fees, audit fees, incremental director and officer liability insurance costs and director and officer compensation. We additionally expect to incur $1.0 million in non-recurring costs related to our transition to a publicly traded corporation. These incremental expenses exclude the costs of this offering, as well as the costs associated with the initial implementation of our Sarbanes-Oxley Section 404 internal control reviews and testing. |
53
Table of Contents
The following table summarizes our revenue and expenses for the periods indicated.
| Six Months Ended June 30, |
Year Ended December 31, |
|||||||||||||||
| 2016 | 2015 | 2015 | 2014 | |||||||||||||
| (in thousands) | ||||||||||||||||
| Revenues |
$ | 18,853 | $ | 23,525 | $ | 47,698 | $ | 68,170 | ||||||||
| Cost of goods sold |
11,869 | 12,288 | 21,003 | 29,934 | ||||||||||||
|
|
|
|
|
|
|
|
|
|||||||||
| Gross profit |
6,984 | 11,237 | 26,695 | 38,236 | ||||||||||||
| Operating expenses: |
||||||||||||||||
| Salaries, benefits and payroll taxes |
2,295 | 2,828 | 5,055 | 5,088 | ||||||||||||
| Depreciation and amortization |
181 | 169 | 388 | 160 | ||||||||||||
| Selling, general and administrative |
1,926 | 2,547 | 4,669 | 7,222 | ||||||||||||
|
|
|
|
|
|
|
|
|
|||||||||
| Total operating expenses |
4,402 | 5,544 | 10,112 | 12,470 | ||||||||||||
|
|
|
|
|
|
|
|
|
|||||||||
| Income from operations |
2,582 | 5,693 | 16,583 | 25,766 | ||||||||||||
| Preferred stock interest expense |
(3,123 | ) | (2,434 | ) | (5,078 | ) | (5,601 | ) | ||||||||
| Other interest expense |
(1,671 | ) | (1,048 | ) | (2,748 | ) | (2,231 | ) | ||||||||
| Other income |
189 | 351 | 362 | 370 | ||||||||||||
|
|
|
|
|
|
|
|
|
|||||||||
| Total other expense |
(4,605 | ) | (3,131 | ) | (7,464 | ) | (7,462 | ) | ||||||||
| Loss on extinguishment of debt |
— | — | — | (1,230 | ) | |||||||||||
|
|
|
|
|
|
|
|
|
|||||||||
| Income (loss) before income tax expense |
(2,023 | ) | 2,562 | 9,119 | 17,074 | |||||||||||
| Income tax expense (benefit) |
(56 | ) | 1,633 | 4,129 | 9,518 | |||||||||||
|
|
|
|
|
|
|
|
|
|||||||||
| Net and comprehensive income (loss) |
$ | (1,967 | ) | $ | 929 | $ | 4,990 | $ | 7,556 | |||||||
|
|
|
|
|
|
|
|
|
|||||||||
Six Months Ended June 30, 2016 Compared to Six Months Ended June 30, 2015
Revenue
Revenue was $18.9 million for the six months ended June 30, 2016, during which we sold approximately 322,000 tons of sand. Revenue for the six months ended June 30, 2015 was $23.5 million, during which we sold approximately 447,000 tons of sand. Although total revenue decreased for the six months ended June 30, 2016 as compared to the six months ended June 30, 2015, average revenue per ton sold increased by approximately $6 as a result of other contractual terms, such as required reservation and shortfall payments.
The key factors contributing to the decrease in revenues and increase in average revenue per ton for the six months ended June 30, 2016 as compared to the six months ended June 30, 2015 were as follows:
| • | Contractual terms of four customer contracts were amended in the second half of 2015 resulting in a combination of reduced average selling prices per ton and adjustments to required take-or-pay volumes and length of contract. Two long-term contracts were amended in 2016 resulting in a combination of reduced average selling prices per ton and adjustments to required take-or-pay volumes and length of contract. |
| • | Sand sales revenue decreased to $12.7 million for the six months ended June 30, 2016 compared to $19.6 million for the six months ended June 30, 2015 due to a decrease in tons sold and average selling price per ton. During the six months ended June 30, 2016, the average selling price per ton was $39.30 as compared to $43.82 the six months ended June 30, 2015 due to the decrease in exploration and production activity in the oil and natural gas industry. Sand sales revenue and average selling price includes any monthly reservation charges that certain of our customers are required to pay. |
54
Table of Contents
| • | Contractual shortfall and reservation revenues were $3.0 million and $5.5 million, respectively, for the six months ended June 30, 2016, which helped to mitigate the lower sales volume and average selling price. Shortfall revenues for the six months ended June 30, 2016 resulted from one customer that was unable to meet the take-or-pay requirements for its contract year. Our customer contracts indicate whether customers are invoiced quarterly or at the end of their respective contract year for shortfall payments. We recognized revenue to the extent of the unfulfilled minimum contracted quantity at the shortfall price per ton as stated in the contract once payment was received or was reasonably assured. We expect to recognize shortfall revenue in future periods only to the extent that customers do not take contractual minimum volumes. Certain customers are required to pay a fixed-price monthly reservation charge based on a minimum contractual volume over the remaining life of their contract, which then may be applied as a per ton credit to the sales price up to a certain contractually specified monthly volume or credited against any applicable shortfall payments. There was no such revenue for the six months ended June 30, 2015. |
| • | Transportation revenue was approximately $2.0 million less for the six months ended June 30, 2016 compared to the six months ended June 30, 2015. Rail car rental revenue increased by approximately $1.3 million for the six months ended June 30, 2016 compared to the six months ended June 30, 2015 due to an increase in the number of rail cars rented to our customers under long-term contracts. We incur transportation costs and recurring rail car rental expenses under our long-term rail car operating agreements. Our transportation and rail car rental revenues currently represent the pass through of these costs to our customers; therefore, these revenues do not have a material impact on our gross profit. |
Cost of Goods Sold and Production Costs
Cost of goods sold was $11.9 million and $12.3 million, or $36.83 and $27.51 per ton sold, for the six months ended June 30, 2016 and 2015, respectively. Of this amount, production costs comprised $5.7 million and $6.0 million, or $17.56 and $13.51 per ton sold, and freight charges, which consist of shipping costs and rail car rental and storage expense, comprised $3.2 million and $4.1 million for the six months ended June 30, 2016 and 2015, respectively. Cost of goods sold was lower in the first six months of 2016 in comparison to the same period in 2015 due to lower sales volume along with cost savings initiatives enacted by us, including moving excavation activities in-house and converting fuel for all dry plants from propane to natural gas at the end of 2015. Depreciation and depletion included in cost of goods sold accounted for $3.0 million and $2.2 million, respectively, for the six months ended June 30, 2016 and 2015. The per ton cost of goods sold increased by $9.32 as a result of 125,000 fewer tons sold for the six months ended June 30, 2016 compared to June 30, 2015 due to the decrease in exploration and production activity in the oil and natural gas industry. For the definition of production costs and a reconciliation to its most directly comparable financial measure calculated and presented in accordance with GAAP, please read “Selected Historical Consolidated Financial Data—Non-GAAP Financial Measures.”
Gross Profit
Gross profit equals revenues less cost of goods sold. Gross profit was $7.0 million and $11.2 million for the six months ended June 30, 2016 and 2015, respectively.
Operating Expenses
Operating expenses were $4.4 million and $5.5 million for the six months ended June 30, 2016 and 2015, respectively. Operating expenses are comprised primarily of wages and benefits, travel and professional services fees. Salaries, benefits and payroll taxes of $2.3 million and $2.8 million for the six months ended June 30, 2016 and 2015, respectively, decreased due to the restructuring of certain management salaries and a reduction in headcount. Selling, general and administrative expenses decreased by $0.6 million in the six months ended June 30, 2016 compared to the six months ended June 30, 2015 as a result of decreased professional costs due to market downturn and less growth opportunities.
55
Table of Contents
Preferred Stock and Other Interest Expense
We incurred $4.8 million and $3.5 million of interest expense for the six months ended June 30, 2016 and 2015, respectively. Interest expense for the six months ended June 30, 2016 and 2015 is derived primarily from paid-in-kind interest on the Preferred Stock as well as interest on our existing revolving credit facility. Interest on the Preferred Stock accounted for $3.1 million and $2.4 million of the expense for the six months ended June 30, 2016 and 2015, respectively. Interest on our existing revolving credit facility accounted for $1.7 million and $1.0 million for the six months ended June 30, 2016 and 2015, respectively. Additional items included in interest expense include the accretion of common stock issued and transaction costs incurred in conjunction with the September 2011 Securities Purchase Agreement, deferred financing fees, and interest incurred on capital leases. The paid-in-kind interest is added to the outstanding balance of the Preferred Stock.
Income Tax Expense (Benefit)
Income tax benefit and income tax expense was $(0.1) million and $1.6 million for the six months ended June 30, 2016 and 2015, respectively. For the six months ended June 30, 2016, our statutory tax rate and effective tax rate were approximately 35% and 53%, respectively. The tax benefit for the six months ended June 30, 2016 also includes a discrete 7% impact for a provision-to-return adjustment associated with a change in estimates related to expenses that are not deductible for tax purposes. For the six months ended June 30, 2015, our statutory tax rate and effective tax rate were approximately 35% and 64%, respectively. The difference in these tax rates for both the six months ended June 30, 2016 and 2015 was primarily due to state income tax, non-deductible interest expense on the Preferred Stock and certain book expenses not deductible for tax.
Net Loss and Adjusted EBITDA
Net loss was $(2.0) million for the six months ended June 30, 2016 compared to net income of $0.9 million for the six months ended June 30, 2015. Adjusted EBITDA was $6.4 million for the six months ended June 30, 2016 compared to $9.4 million for the six months ended June 30, 2015. The decreases in net income (loss) and Adjusted EBITDA resulted from decreases in revenue and gross profit. The decreases were primarily due to lower volumes of sand sold and average selling price per ton sold due to reduced exploration and production activity in the oil and natural gas industry. Additionally, we recognize shortfall payments on a quarterly or annual basis in accordance with the respective terms of our customer contracts. Therefore, shortfall payment revenue impacts EBITDA and Adjusted EBITDA in only certain periods rather than on a straight-line basis over the entire period. For example, we expect that shortfall payments will have less of an impact on EBITDA and Adjusted EBITDA for the six months ended June 30, 2016 than they will the six months ending December 31, 2016. For the definition of Adjusted EBITDA and a reconciliation to its most directly comparable financial measure calculated and presented in accordance with GAAP, please read “Selected Historical Consolidated Financial Data—Non-GAAP Financial Measures.”
Year Ended December 31, 2015 Compared to the Year Ended December 31, 2014
Revenue
Revenue was $47.7 million for the year ended December 31, 2015, during which we sold approximately 751,000 tons of sand. Revenue for the year ended December 31, 2014 was $68.2 million, during which we sold approximately 1,255,000 tons of sand. Although total revenue decreased for the year ended December 31, 2015 as compared to the year ended December 31, 2014, average revenue per ton sold increased by approximately $9 as a result of other contractual terms, such as required reservation and shortfall payments.
The key factors contributing to the decrease in revenues and increase in average revenue per ton for the year ended December 31, 2015 as compared to the year ended December 31, 2014 were as follows:
| • | Sand sales revenue decreased to $31.8 million for the year ended December 31, 2015 compared to $62.6 million for the year ended December 31, 2014. Tons sold decreased by 40% due to the decrease in exploration and production activity in the oil and natural gas industry; |
56
Table of Contents
| • | Average selling price per ton decreased to $42.32 for the year ended December 31, 2015 from $49.89 for the year ended December 31, 2014 due to the decrease in exploration and production activity in the oil and natural gas industry; and |
| • | Contractual shortfall and reservation revenues were $10.1 million and $1.0 million, respectively, for the year ended December 31, 2015, which helped to mitigate the lower sales volume and average selling price. Shortfall revenues for the year ended December 31, 2015 resulted from two customers that were unable to meet the take-or-pay requirements for their respective contract year. Our customer contracts indicate whether customers are invoiced quarterly or at the end of their respective contract year for shortfall payments. We recognized revenue to the extent of the unfulfilled minimum contracted quantity at the shortfall price per ton as stated in the contract once payment was received or was reasonably assured. We expect to recognize shortfall revenue in future periods only to the extent that customers do not take contractual minimum volumes. Certain customers are required to pay a fixed-price monthly reservation charge based on a minimum contractual volume over the remaining life of their contract, which are then credited against any applicable shortfall payments. There was no such revenue for the year ended December 31, 2014. |
| • | Transportation revenue was approximately $0.3 million more for the year ended December 31, 2015 compared to the year ended December 31, 2014. Rail car rental revenue increased by approximately $2.0 million for the year ended December 31, 2015 compared to the year ended December 31, 2014 due to an increase in the number of rail cars rented to our customers under long-term contracts. Transportation costs decreased by approximately $1.7 million for the year ended December 31, 2015 compared to the year ended December 31, 2014 due to a decrease in customer orders for which we paid transportation charges. We incur transportation costs and recurring rail car rental expenses under our long-term rail car operating agreements. Our transportation and rail car rental revenues currently represent the pass through of these costs to our customers; therefore, these revenues do not have a material impact on our gross profit. |
Cost of Goods Sold and Production Costs
Cost of goods sold was $21.0 million and $29.9 million, or $27.97 and $23.85 per ton sold, for the years ended December 31, 2015 and 2014, respectively. Of this amount, production costs comprised $10.1 million and $20.7 million, or $13.47 and $16.48 per ton sold, and freight charges, which consist of shipping costs and rail car rental and storage expense, comprised $6.0 million and $5.7 million for the years ended December 31, 2015 and 2014, respectively. Cost of goods sold was approximately $8.9 million lower in 2015 compared to 2014 due to lower sales volumes and reduced excavation expenses. For the year ended December 31, 2015, we performed excavation activities in-house resulting in cost savings of approximately $0.50 per ton excavated. For the year ended December 31, 2014, we outsourced excavation activities to an independent third party, with primarily fixed terms of $2.01 per ton excavated and delivered. Depreciation and depletion included in cost of goods sold account for $4.9 million and $3.5 million, respectively, for the years ended December 31, 2015 and 2014. For the definition of production costs and a reconciliation to its most directly comparable financial measure calculated and presented in accordance with GAAP, please read “Selected Historical Consolidated Financial Data—Non-GAAP Financial Measures.”
Gross Profit
Gross profit equals revenues less cost of goods sold. Gross profit was $26.7 million and $38.2 million for the years ended December 31, 2015 and 2014, respectively.
Operating Expenses
Operating expenses were $10.1 million and $12.5 million for the years ended December 31, 2015 and 2014, respectively. Salaries, benefits and payroll taxes remained consistent at $5.0 million for the years ended
57
Table of Contents
December 31, 2015 and 2014. Selling, general and administrative expenses decreased by $2.6 million in 2015 compared to 2014 due to higher professional costs incurred in 2014 related to our previous uncompleted initial public offering process.
Preferred Stock and Other Interest Expense
We incurred $7.8 million of interest expense during each of the years ended December 31, 2015 and 2014. Interest expense in 2015 and 2014 was derived primarily from paid-in-kind interest on the Preferred Stock as well as interest on our existing revolving credit facility. Interest on the Preferred Stock accounted for $5.1 million and $5.6 million of the expense for the years ended December 31, 2015 and 2014, respectively. Interest on our existing revolving credit facility accounted for $2.6 million and $2.1 million, respectively, for the years ended December 31, 2015 and 2014. Additional items included in interest expense include the accretion of common stock issued and transaction costs incurred in conjunction with the September 2011 Securities Purchase Agreement, deferred financing fees, and interest incurred on capital leases. The paid-in-kind interest is added to the outstanding balance of the Preferred Stock.
Income Tax Expense
Income tax expense was $4.1 million for the year ended December 31, 2015 compared to $9.5 million for the year ended December 31, 2014. For the year ended December 31, 2015, our statutory tax rate and effective tax rate were approximately 35% and 45%, respectively. For the year ended December 31, 2014, our statutory tax rate and effective tax rate were approximately 35% and 56%, respectively. The difference in these tax rates for both 2015 and 2014 was primarily due to state income tax, non-deductible interest expense on the Preferred Stock costs associated with our initial public offering process and changes in the applicable tax rate.
Net Income and Adjusted EBITDA
Net income was $5.0 million for year ended December 31, 2015 compared to $7.6 million for the year ended December 31, 2014. Adjusted EBITDA was $23.9 million for the year ended December 31, 2015 compared to $33.3 million for the year ended December 31, 2014. The decrease in net income and Adjusted EBITDA resulted from the decrease in revenue and gross profit primarily due to lower volumes and pricing compression resulting primarily from reduced exploration and production activity in the oil and natural gas industry. For the definition of Adjusted EBITDA and a reconciliation to its most directly comparable financial measure calculated and presented in accordance with GAAP, please read “Selected Historical Consolidated Financial Data—Non-GAAP Financial Measures.”
Liquidity and Capital Resources
Overview
Our principal liquidity requirements for the year ended December 31, 2015 and the six months ended June 30, 2016 were to fund capital expenditures for the expansion of the sand processing facility in Oakdale and to meet working capital needs. We met our liquidity needs with a combination of funds generated through operations and our existing revolving credit facility.
We expect that our future principal uses of cash will be for working capital, capital expenditures, potential acquisition activity and funding our debt service obligations. We expect our principal sources of liquidity will be cash generated by our operations and borrowings under the new revolving credit facility that we are in the process of negotiating, and we believe that cash from these sources will be sufficient to meet our short-term working capital requirements and long-term capital expenditure requirements. We believe that cash retained from the proceeds from this offering and cash generated by our operations will be sufficient to meet our short-term working capital requirements in the event we are unable to successfully enter into the new revolving credit facility.
58
Table of Contents
Working Capital
Working capital is the amount by which current assets exceed current liabilities and is a measure of our ability to pay our liabilities as they become due.
The following table presents the components of our working capital as of June 30, 2016 compared to June 30, 2015 and December 31, 2015 compared to December 31, 2014.
| June 30, | December 31, | |||||||||||||||
| 2016 | 2015 | |||||||||||||||
| (unaudited) | (unaudited) | 2015 | 2014 | |||||||||||||
| (in thousands) | ||||||||||||||||
| Current assets |
||||||||||||||||
| Cash |
$ | 1,867 | $ | 425 | $ | 3,896 | $ | 802 | ||||||||
| Accounts and unbilled receivables |
2,613 | 5,137 | 6,041 | 8,578 | ||||||||||||
| Inventories |
4,349 | 5,778 | 4,181 | 8,630 | ||||||||||||
| Prepaid expenses and other current assets |
862 | 2,375 | 1,524 | 3,923 | ||||||||||||
| Deferred tax assets, current |
— | 20 | — | 225 | ||||||||||||
|
|
|
|
|
|
|
|
|
|||||||||
| Total current assets |
9,691 | 13,735 | 15,642 | 22,158 | ||||||||||||
| Current liabilities |
||||||||||||||||
| Accounts payable |
930 | 3,264 | 1,170 | 2,047 | ||||||||||||
| Accrued liabilities |
2,559 | 5,426 | 3,778 | 6,350 | ||||||||||||
| Deferred revenue |
6,229 | — | 7,133 | — | ||||||||||||
| Income taxes payable |
2,425 | — | — | — | ||||||||||||
| Current portion of equipment lease obligations |
740 | 399 | 409 | 389 | ||||||||||||
| Current portion of long-term debt |
712 | 692 | 1,369 | 104 | ||||||||||||
| Current Redeemable Series A Preferred Stock |
37,888 | — | 34,708 | — | ||||||||||||
|
|
|
|
|
|
|
|
|
|||||||||
| Total current liabilities |
51,483 | 9,781 | 48,567 | 8,890 | ||||||||||||
|
|
|
|
|
|
|
|
|
|||||||||
| Working capital (deficit) |
$ | (41,792 | ) | $ | 3,954 | $ | (32,925 | ) | $ | 13,268 | ||||||
|
|
|
|
|
|
|
|
|
|||||||||
June 30, 2016 Compared to June 30, 2015. Our working capital deficit was $(41.8) million at June 30, 2016 compared to working capital of $4.0 million at June 30, 2015. Working capital included deferred revenue of $6.2 million at June 30, 2016 which represented contractual prepayments by certain customers. No such contractual prepayment obligations existed at June 30, 2015. Additionally, the Preferred Stock is included in current liabilities as it has a mandatory redemption date of September 13, 2016, but it can only be redeemed if certain defined pro forma financial covenants of our revolving credit facility are met. While we have classified the Preferred Stock as current because of these covenant requirements, we do not anticipate being able to redeem the Preferred Stock within the foreseeable future unless this offering is consummated. We plan to fully redeem the Preferred Stock from the proceeds of this offering.
Accounts and unbilled receivables decreased by $2.5 million from June 30, 2016 to June 30, 2015 primarily due to decreases of raw frac sand volumes sold and average selling prices.
Accounts payable and accrued liabilities decreased $2.3 million and $2.9 million, respectively, from June 30, 2016 to June 30, 2015, primarily due to payment of construction expenses related to certain capital projects in 2015.
December 31, 2015 Compared to December 31, 2014. Our working capital deficit was $(32.9) million at December 31, 2015 compared to working capital of $13.3 million at December 31, 2014. As of December 31, 2015, working capital included deferred revenue of $7.1 million that represented advanced payments from certain customers in order to secure and procure a reliable provision and delivery of product. Additionally, the
59
Table of Contents
Preferred Stock is included in current liabilities as it has a mandatory redemption date of September 13, 2016, but it can only be redeemed if certain defined pro forma financial covenants of our revolving credit facility are met. While we have classified the Preferred Stock as current, because of these covenant requirements, we do not anticipate being able to redeem the Preferred Stock within the foreseeable future unless the offering is consummated. We plan to fully redeem the Preferred Stock from the proceeds of this offering.
Accounts receivable decreased by $2.5 million from December 31, 2014 to December 31, 2015, primarily due to a decrease in raw frac sand sales volumes. The $4.4 million decrease in inventory from December 31, 2014 to December 31, 2015 is attributable to our lower estimate of sand inventory that is required to fill customer orders for a twelve-month period from the balance sheet date. Prepaid expenses and other current assets decreased $2.4 million as a result of a $1.4 million income tax refund received, collection of $0.3 million of other receivables and a $0.5 million decrease in prepaid insurance.
Accounts payable and accrued expenses included capitalized expenditures of $3.1 million and $4.4 million, as well as $0.6 million and $0.5 million of real estate taxes as of December 31, 2015 and 2014, respectively. Additionally, revolving credit facility accrued interest totaled $0.7 million as of December 31, 2015 and December 31, 2014.
Six Months Ended June 30, 2016 Compared to Six Months Ended June 30, 2015
Net cash provided by operating activities was $6.1 million and $11.4 million for the six months ended June 30, 2016 and June 30, 2015, respectively. Operating cash flows include a net loss of $(2.0) million and net income of $0.9 million in net earnings generated from the sale of raw frac sand to our customers in the six months ended June 30, 2016 and June 30, 2015, respectively. The net earnings in each period were offset by production costs, general and administrative expenses and cash interest expense, adjusted for changes in working capital to the extent they are positive or negative. Included in operating activities for the six months ended June 30, 2016 is a $0.5 million settlement of a derivative instrument; no such instrument existed in 2015.
Year Ended December 31, 2015 Compared to the Year Ended December 31, 2014
Net cash provided by operating activities was $30.7 million and $22.1 million for the years ended December 31, 2015 and 2014, respectively. Operating cash flows include net income of $5.0 million and $7.6 million in net earnings generated from the sale of raw frac sand to our customers in the year ended December 31, 2015 and December 31, 2014, respectively. The net earnings in each period were offset by production costs, general and administrative expenses and cash interest expense, adjusted for changes in working capital to the extent they are positive or negative.
60
Table of Contents
The following table presents the components of net cash used in investing activities for the periods indicated.
| Six Months Ended June 30, | Year Ended December 31, | |||||||||||||||
| 2016 | 2015 | |||||||||||||||
| (unaudited) | (unaudited) | 2015 | 2014 | |||||||||||||
| (in thousands) | ||||||||||||||||
| Oakdale: |
||||||||||||||||
| Plant Expansion |
$ | 239 | $ | 13,495 | $ | 16,907 | $ | 17,853 | ||||||||
| Land |
— | — | — | — | ||||||||||||
| Other |
722 | 1,723 | 2,027 | 4,498 | ||||||||||||
| Hixton: |
||||||||||||||||
| Original Plant |
(458 | ) | 6,212 | 8,723 | 3,224 | |||||||||||
| Land |
— | 209 | 1,397 | 3,911 | ||||||||||||
| Other |
— | 167 | 172 | 1,402 | ||||||||||||
| Byron: |
||||||||||||||||
| Original Facility |
258 | — | 149 | — | ||||||||||||
|
|
|
|
|
|
|
|
|
|||||||||
| Cash capital expenditures |
761 | 21,806 | 29,375 | 30,888 | ||||||||||||
|
|
|
|
|
|
|
|
|
|||||||||
| Non-cash capital expenditures |
987 | 5,204 | 3,113 | 4,386 | ||||||||||||
|
|
|
|
|
|
|
|
|
|||||||||
| Total capital expenditures |
$ | 1,748 | $ | 27,010 | $ | 32,488 | $ | 35,274 | ||||||||
|
|
|
|
|
|
|
|
|
|||||||||
Six Months Ended June 30, 2016 Compared to Six Months Ended June 30, 2015
Net cash used in financing activities was $7.4 million for the six months ended June 30, 2016, which included repayments of $6.2 million under our existing revolving credit facility and $1.1 million of payments on our existing equipment notes payable and capitalized leases.
Net cash provided by financing activities was $10.0 million for the six months ended June 30, 2015, which was comprised primarily of $10.4 million of net borrowings on our existing revolving credit facility and $0.2 million of payments on our existing equipment notes payable and capital leases.
Year Ended December 31, 2015 Compared to the Year Ended December 31, 2014
Net cash provided by financing activities was $1.8 million for the year ended December 31, 2015, which included net borrowings of $3.2 million under our existing revolving credit facility, offset by $0.5 million of repayments on long-term debt, $0.4 million in payments on equipment financing obligations, $0.4 million on loan amendment fees and $0.1 million in treasury stock purchases.
Net cash provided by financing activities was $7.4 million for the year ended December 31, 2014, which included net borrowings of $57.7 million under our existing revolving credit facility, offset by a $40.0 million partial redemption of the Preferred Stock, a $9.2 million pay down of the line of credit, and $0.7 million of loan origination and amendment costs.
Off Balance Sheet Arrangements
At June 30, 2016 and December 31, 2015, we had outstanding letters of credit in the amount of $3.5 million and $4.2 million, respectively.
61
Table of Contents
The second Oakdale drying facility was completed in July 2014 and the third Oakdale drying facility was completed in September 2015. As of June 30, 2016 and December 31, 2015, we had commitments related to these projects as well as future expansion projects of approximately $2.3 million and $2.4 million, respectively. We expect to incur approximately $1.6 million during the second half of 2016 in expansion capital expenditures. Expansion capital expenditures are anticipated to support incremental growth initiatives. These projects are expected to provide efficiencies in our plant operations and improve our logistics capabilities to further position us to capitalize upon growth opportunities that we anticipate will continue to develop with both current and potential new customers. We expect to fund these expansion capital expenditures with cash flow from operations. Please read “Use of Proceeds.”
Our Credit Facility and Other Arrangements
Below is a description of our existing revolving credit facility and other financing arrangements. We are in the process of negotiating a new revolving credit facility with unaffiliated third-party lenders that we expect to enter into at or shortly after the closing of this offering.
Line of Credit. On July 2, 2012, we obtained a one-year $10 million line of credit from a bank. The line of credit had an interest rate of Prime plus 1%. In July 2012, borrowings on the line of credit amounted to $6 million. In August 2012, we borrowed the remaining $4 million under the line of credit. The line of credit was guaranteed by the majority holder of our common stock (and the sole holder of the Preferred Stock). In connection with the guarantee, the holder of the Preferred Stock was paid additional stock dividends of 0.32% per annum through the maturity date of the line of credit. In July 2013, the line of credit was extended through July 9, 2014 and bore an interest rate of Prime plus 0.35% (3.60% as of December 31, 2013). There were no financial covenants associated with the agreement. On March 28, 2014, the outstanding balance of $9.3 million, which included accrued interest, was paid in full.
Existing Revolving Credit Facility. On March 28, 2014, we entered into a $72.5 million revolving credit and security agreement with our wholly-owned subsidiary Fairview Cranberry Company, LLC as co-borrowers, and PNC Bank, National Association, as administrative agent and collateral agent (the “Credit Agreement”). The existing revolving credit facility matures on March 28, 2019. We refer to this facility as the existing revolving credit facility.
On October 29, 2014, we amended the Credit Agreement to provide for up to a $100.0 million existing revolving credit facility, as well as a sublimit of up to $15.0 million for the issuance of letters of credit.
The credit facility contains various covenants and restrictive provisions and requires maintenance of financial covenants, including a fixed charge coverage ratio and a total leverage ratio (as defined in the Credit Agreement). As of September 30, 2015, our total leverage ratio exceeded the threshold of 3.00 to 1.00. We were in compliance with all other covenants at that time.
On December 18, 2015, we entered into the fourth amendment to the Credit Agreement (“Fourth Amendment”). Under the Fourth Amendment, the event of default related to the September 30, 2015 leverage ratio was waived and the following terms were amended:
| • | the total commitment was reduced from $100.0 million to $75.0 million; |
| • | quarterly permanent paydowns are required until the maximum commitment reaches $55.0 million from the sharing of excess cash flow, as defined in the Fourth Amendment. As of June 30, 2016, the maximum commitment for the existing revolving credit facility was $74.0 million; |
62
Table of Contents
| • | application of the leverage ratio and fixed charge coverage ratio covenants are foregone until the earlier of December 31, 2016 or such quarter that the Company cannot maintain a $3.0 million excess availability (as defined in the Fourth Amendment); and |
| • | annual capital expenditures are restricted, as defined in the Fourth Amendment, until the $55.0 million maximum commitment level is reached. |
In addition, the Fourth Amendment increased the interest rates applicable to borrowings under the existing revolving credit facility at our option at either:
| • | a Base Rate, as defined, which will be the base commercial lending rate of PNC Bank, as publicly announced to be in effect from time to time, plus an applicable margin of 3.00%; or |
| • | LIBOR plus an applicable margin of 4.00%. |
We incurred a $250,000 commitment fee for this amendment, recorded as debt discount against the existing revolving credit facility. At June 30, 2016, we were in compliance with the required financial covenants and had undrawn availability under this credit facility totaling $12.5 million. At June 30, 2016, outstanding borrowings under the Credit Agreement bore interest at a weighted-average rate of approximately 4.47%. We expect to fully repay any outstanding borrowings with a portion of the proceeds from this offering. Please read “Use of Proceeds.”
We expect to repay in full the existing revolving credit facility with a portion of the net proceeds of this offering and terminate the facility following the closing of this offering.
New Revolving Credit Facility. We are in the process of negotiating a new $40 to 50 million revolving credit facility with unaffiliated third-party lenders that we expect to enter into at or shortly after the closing of this offering. While this credit facility is not yet in place, we expect that the new revolving credit facility would mature three years after its closing and would have lower interest rates than our existing revolving credit facility. There can be no assurance that we will be able to enter into the new revolving credit facility, which will require (i) the continued negotiation and execution and delivery of the credit agreement and all related documents and legal opinions; (ii) delivery of officer’s certificates, financial information and organizational documents; (iii) satisfaction of conditions related to perfection of liens; (iv) obtaining all required consents and (v) payment of all fees and other amounts due to the lenders under the credit agreement. The credit facility will be used for capital expenditures and permitted acquisitions, to provide for working capital requirements and for other general corporate purposes.
We expect obligations under the new revolving credit facility would be secured by a first priority lien on substantially all of our assets and that borrowings under the new revolving credit facility will bear interest at a rate equal to LIBOR or an alternate base rate plus an applicable margin. LIBOR, the alternate base rate and the applicable margin will be defined in the replacement credit facility. We expect the unused portion of the new revolving credit facility will be subject to an annual commitment fee.
We expect that the new revolving credit facility will contain various affirmative and negative covenants and restrictive provisions that will limit our ability (as well as the ability of our subsidiaries) to, among other things:
| • | incur or guarantee additional debt; |
| • | make certain investments and acquisitions; |
| • | incur certain liens or permit them to exist; |
| • | alter our lines of business; |
| • | enter into certain types of transactions with affiliates; |
63
Table of Contents
| • | merge or consolidate with another company; and |
| • | transfer, sell or otherwise dispose of assets. |
In addition, we expect that the new revolving credit facility will restrict our ability to make distributions on, or redeem or repurchase, our equity interests so long as, both at the time of the distribution and after giving effect to the distribution, no default exists under the new revolving credit facility. We expect the new revolving credit facility will also require us to maintain certain financial covenants.
We also expect that the new revolving credit facility will contain events of default customary for facilities of this nature, including, but not limited, to:
| • | events of default resulting from our failure or the failure of any guarantors to comply with covenants and financial ratios; |
| • | the occurrence of a change of control; |
| • | the institution of insolvency or similar proceedings against us or any guarantor; and |
| • | the occurrence of a default under any other material indebtedness we or any guarantor may have. |
Upon the occurrence and during the continuation of an event of default, subject to the terms and conditions of the new revolving credit facility, we expect that the lenders will be able to declare any outstanding principal of the credit facility debt, together with accrued and unpaid interest, to be immediately due and payable and exercise other remedies.
Mandatorily Redeemable Preferred Stock. On September 13, 2011, we entered into a financing agreement with Clearlake. The agreement provides for the sale of Preferred Stock to Clearlake in three tranches. For the years ended December 31, 2015 and 2014, we incurred $5.7 million and $6.0 million of interest expense related to the Preferred Stock, respectively. We capitalized $0.6 million and $0.4 million of interest expense related to the Preferred Stock in the consolidated balance sheets as of December 31, 2015 and 2014, respectively. On March 28, 2014, in connection with entering into our existing revolving credit facility, approximately $40 million of Preferred Stock was redeemed.
The Preferred Stock is mandatorily redeemable on or after September 13, 2016 if certain defined pro forma financial covenants of our revolving credit facility are met. The redemption price is the original issuance price per share of all outstanding Preferred Stock plus any unpaid accrued dividends. The Preferred Stock is not convertible into common stock or any other security we issue. As a result of the Preferred Stock’s stated mandatory redemption date, we classified these securities as current liabilities in the accompanying consolidated balance sheets as of June 30, 2016 and December 31, 2015. As of June 30, 2015 and December 31, 2014, we classified the Preferred Stock as long-term liabilities in the accompanying consolidated balance sheets. Under our existing revolving credit facility, the Preferred Stock can be redeemed only if we meet certain defined pro forma financial covenants. While we have classified the Preferred Stock as current because of these covenant requirements, we do not anticipate being able to redeem the Preferred Shares in the foreseeable future unless the offering is consummated. We expect to redeem all of the Preferred Stock with a portion of the proceeds from this offering.
At June 30, 2016, the liquidation value of the Preferred Stock was $38.3 million.
For the six months ended June 30, 2016, sales to US Well Services, Weatherford, and C&J Energy Services accounted for 37.3%, 32.8% and 17.6%, respectively, of total revenue. For the year ended December 31, 2015, sales to EOG Resources, US Well Services, Weatherford and Archer Pressure Pumping accounted for 35.0%, 24.6%, 18.4% and 15.8%, respectively, of total revenue. The terms of each contract provide for certain remedies, including true-up payments, in the event that a customer does not purchase minimum monthly volumes of sand.
64
Table of Contents
The following table presents our contractual obligations and other commitments as of December 31, 2015.
| Less than | 1-3 | 3-5 | More than | |||||||||||||||||
| Total | 1 year | years | years | 5 years | ||||||||||||||||
| (in thousands) | ||||||||||||||||||||
| Equipment lease obligations(1) |
$ | 1,791 | $ | 483 | $ | 1,308 | $ | — | $ | — | ||||||||||
| Notes payable(2) |
1,938 | 1,369 | 569 | — | — | |||||||||||||||
| Oakdale construction obligations(3) |
2,400 | 2,400 | — | — | — | |||||||||||||||
| Asset retirement obligations(4) |
1,180 | — | — | — | 1,180 | |||||||||||||||
| Preferred Stock(5) |
34,708 | 34,708 | — | — | — | |||||||||||||||
| Equipment and office operating leases(6) |
26,153 | 6,537 | 11,372 | 6,174 | 2,070 | |||||||||||||||
| Revolving credit facility(7) |
64,216 | — | — | 64,216 | — | |||||||||||||||
|
|
|
|
|
|
|
|
|
|
|
|||||||||||
| $ | 132,386 | $ | 45,497 | $ | 13,249 | $ | 70,390 | $ | 3,250 | |||||||||||
|
|
|
|
|
|
|
|
|
|
|
|||||||||||
| (1) | Through December 31, 2015, we entered into various lease arrangements to lease operational equipment. Interest rates on these lease arrangements ranged from 4.8% to 6.3% and maturities range from 2017 through 2018. |
| (2) | We have financed certain equipment, automobile and land purchases by entering into various debt agreements. Interest rates on these notes ranged from 0% to 4.75% and maturities range from 2014 through 2017. |
| (3) | As part of our Oakdale plant expansion, we were committed to capital expenditures of approximately $2,300 as of June 30, 2016. |
| (4) | The asset retirement obligation represents the fair value of post closure reclamation and site restoration commitments for the Oakdale property and processing facility and Hixton property. |
| (5) | In September 2011, we entered into a Securities Purchase Agreement with Clearlake which provided for three investment tranches of Preferred Stock. As of December 31, 2013, two of the tranches have been funded, resulting in the issuance of 48,000 preference shares with a par value of $0.001 per share which are mandatorily redeemable on or after September 13, 2016 if certain defined pro forma financial covenants of our revolving credit facility are met. The Preferred Stock has been valued at its issuance value plus accrued dividends less a $40 million repayment made in March 2014. As of June 30, 2016, the liquidation value was $38.3 million. While we have classified the Preferred Stock as current because of these covenant requirements, we do not anticipate being able to redeem the Preferred Stock in the foreseeable future unless this offering is consummated. |
| (6) | We have entered into long-term operating leases for certain operational equipment, rail equipment and office space. Certain long-term rail car operating leases have been executed; however payment does not begin until the cars arrive. Cars are estimated to arrive in the fourth quarter of 2016. Monthly lease expense per car on these 30 cars is $645, or $232 on an annualized basis. Due to the uncertain nature of delivery, these rail car leases have not been included in the schedule. |
| (7) | The existing revolving credit facility has a maturity date of March 28, 2019. |
Quantitative and Qualitative Disclosure of Market Risks
Market risk is the risk of loss arising from adverse changes in market rates and prices. Historically, our risks have been predominantly related to potential changes in the fair value of our long-term debt due to fluctuations in applicable market interest rates. Going forward our market risk exposure generally will be limited to those risks that arise in the normal course of business, as we do not engage in speculative, non-operating transactions, nor do we utilize financial instruments or derivative instruments for trading purposes.
Commodity Price Risk
The market for proppant is indirectly exposed to fluctuations in the prices of crude oil and natural gas to the extent such fluctuations impact drilling and completion activity levels and thus impact the activity levels of our
65
Table of Contents
customers in the oilfield services and exploration and production industries. However, because we generate the substantial majority of our revenues under long-term take-or-pay contracts, we believe we have only limited exposure to short-term fluctuations in the prices of crude oil and natural gas. We do not currently intend to hedge our indirect exposure to commodity price risk.
Interest Rate Risk
As of June 30, 2016, we had $57.2 million, net of a $0.8 million debt discount, in variable rate long-term debt outstanding under our existing revolving credit facility, which bears interest at our option at either:
| • | a Base Rate (as defined in the existing revolving credit facility), which will be the base commercial lending rate of PNC Bank, as publicly announced to be in effect from time to time, plus an applicable margin of 3.00%; or |
| • | LIBOR plus an applicable margin of 4.00%. |
The fair value of our long-term debt at June 30, 2016 was approximately $58.0 million, as the debt was obtained in March 2014, and is therefore considered to reflect the application of current interest rates offered for debt with similar remaining terms and maturities. As an indication of this debt’s sensitivity to changes in interest rates, based upon an immediate 50 basis point increase in the applicable interest rates at June 30, 2016, the fair value of our variable rate long-term debt would have decreased by approximately $0.1 million. Conversely, a 50 basis point decrease in that rate would increase the fair value of this indebtedness by $0.2 million.
We expect to terminate our existing revolving credit facility following the closing of this offering and the application of the net proceeds therefrom. We expect to enter into a new revolving credit facility at or shortly after the closing of this offering.
Credit Risk
Substantially all of our revenue for the year ended December 31, 2015 was generated through long-term take-or-pay contracts with five customers. Our customers are oil and natural gas producers and oilfield service providers, all of which have been negatively impacted by the recent downturn in activity in the oil and natural gas industry. This concentration of counterparties operating in a single industry may increase our overall exposure to credit risk, in that the counterparties may be similarly affected by changes in economic, regulatory or other conditions. If a customer defaults or if any of our contracts expires in accordance with its terms, and we are unable to renew or replace these contracts, our gross profit and cash flows may be adversely affected. For example, in July 2016, one of our contracted customers, C&J Energy Services filed for bankruptcy and rejected our contract, which had 2.3 years and 0.7 million tons contracted remaining under the contract. We are pursuing a claim for damages through the bankruptcy courts at this time but it is uncertain as to what, if any recoveries we will be granted by the court.
Internal Controls and Procedures
We are not currently required to comply with the SEC’s rules implementing Section 404 of the Sarbanes Oxley Act of 2002, and are therefore not required to make a formal assessment of the effectiveness of our internal control over financial reporting for that purpose. Upon becoming a public company, we will be required to comply with the SEC’s rules implementing Section 302 of the Sarbanes-Oxley Act of 2002, which will require our management to certify financial and other information in our quarterly and annual reports and provide an annual management report on the effectiveness of our internal control over financial reporting. We will not be required to make our first assessment of our internal control over financial reporting until the year of our second annual report required to be filed with the SEC. To comply with the requirements of being a public company, we may need to implement additional financial and management controls, reporting systems and procedures and hire additional accounting, finance and legal staff.
66
Table of Contents
Further, our independent registered public accounting firm is not yet required to formally attest to the effectiveness of our internal controls over financial reporting, and will not be required to do so for as long as we are an “emerging growth company” pursuant to the provisions of the JOBS Act. Please read “Summary—Our Emerging Growth Company Status.”
Recent Accounting Pronouncements
In March 2016, the Financial Accounting Standards Board (the “FASB”) issued Accounting Standards Update (“ASU”) No. 2016-09, “Stock Compensation (ASC 718)—Improvements to Employee Share-Based Payment Accounting”, which is intended to simplify the tax accounting impacts of stock compensation. Additionally, the new standard provides accounting policy elections regarding vesting and forfeiture accounting. The new standard is effective for annual periods beginning after December 15, 2016 and interim periods within those annual periods. We are currently in the process of evaluating the impact of the adoption on our consolidated financial statements.
In February 2016, the FASB issued ASU No. 2016-02, “Leases” (ASC 842), which replaces the existing guidance in ASC 840, “Leases.” ASC 842 requires lessees to recognize most leases on their balance sheets as lease liabilities with corresponding right-of-use assets. The new lease standard does not substantially change lessor accounting. The new standard is effective for interim and annual reporting periods beginning after December 15, 2018, with early adoption permitted. We are currently in the process of evaluating the impact of the adoption on our consolidated financial statements.
In November 2015, the FASB issued ASU No. 2015-17, “Income Taxes—Balance Sheet Classification of Deferred Taxes”, which requires the presentation of deferred tax liabilities and assets be classified as non-current on balance sheets. The amendments in this ASU are effective for financial statements issued for annual periods beginning after December 15, 2016, and interim periods within those annual periods. Early adoption is permitted for all entities as of the beginning of an interim or annual reporting period. We have elected to early adopt this guidance prospectively as of December 31, 2015. The adoption only impacted deferred tax presentation on the consolidated balance sheet and related disclosure. No prior periods were retrospectively adjusted.
In July 2015, the FASB issued ASU No. 2015-11, “Simplifying the Measurement of Inventory”, which requires an entity to measure most inventory at the lower of cost and net realizable value, thereby simplifying the current guidance under which an entity must measure inventory at the lower of cost or market. The new standard is effective for public entities for financial statements issued for fiscal years beginning after December 15, 2016, including interim periods within those fiscal years. We are currently evaluating the new guidance and have not yet determined the impact this standard may have on our consolidated financial statements.
In April 2015, the FASB issued ASU No. 2015-15, “Interest-Imputation of Interest”, which simplifies presentation of debt issuance costs. The new standard requires that debt issuance costs be presented in the balance sheet as a direct deduction from the carrying amount of the debt liability, consistent with debt discounts or premiums. The new standard will be effective for financial statements issued for fiscal years beginning after December 15, 2015, and interim periods within fiscal years beginning after December 15, 2016. Early adoption is permitted for financial statements that have not been previously issued. We are currently evaluating the new guidance and have not yet determined the impact this standard may have on our consolidated financial statements.
In August 2014, the FASB issued ASU No. 2014-15, “Going Concern”, which provides guidance on determining when and how to disclose going-concern uncertainties in the financial statements. The new standard requires management to perform interim and annual assessments of an entity’s ability to continue as a going concern within one year of the date the financial statements are issued. An entity must provide certain disclosures if “conditions or events raise substantial doubt about the entity’s ability to continue as a going concern.” The
67
Table of Contents
ASU applies to all entities and is effective for annual periods ending after December 15, 2016, and interim periods thereafter, with early adoption permitted. We are currently evaluating the future disclosure requirements under this guidance.
In May 2014, the FASB issued ASU 2014-09, “Revenue from Contracts with Customers”. The objective of ASU 2014-19 is to establish a single comprehensive model for entities to use in accounting for revenue arising from contracts with customers and will supersede most of the existing revenue recognition guidance, including industry-specific guidance. The core principle of ASU 2014-09 is that an entity recognizes revenue to depict the transfer of promised goods or services to customers in an amount that reflects the consideration to which the entity expects to be entitled in exchange for those goods or services. In applying the new guidance, an entity will (1) identify the contract(s) with a customer; (2) identify the performance obligations in the contract; (3) determine the transaction price; (4) allocate the transaction price to the contract’s performance obligations; and (5) recognize revenue when (or as) the entity satisfies a performance obligation. ASU 2014-09 applies to all contracts with customers except those that are within the scope of other topics in the FASB Accounting Standards Codification. The new guidance is effective for annual reporting periods (including interim periods within those periods) beginning after December 15, 2017 for public companies. Early adoption is only permitted as of annual reporting periods beginning after December 15, 2016. Entities have the option of using either a full retrospective or modified approach to adopt ASU 2014-09. We are currently evaluating the new guidance and have not determined the impact this standard may have on our consolidated financial statements nor decided upon the method of adoption.
New and Revised Financial Accounting Standards
We qualify as an “emerging growth company” pursuant to the provisions of the JOBS Act, enacted on April 5, 2012. Section 102 of the JOBS Act provides that an “emerging growth company” can take advantage of the extended transition period provided in Section 7(a)(2)(B) of the Securities Act for complying with new or revised accounting standards. However, we are choosing to “opt out” of such extended transition period, and as a result, we will comply with new or revised accounting standards on the relevant dates on which adoption of such standards is required for non-emerging growth companies. Our election to “opt-out” of the extended transition period is irrevocable.
Critical Accounting Policies and Estimates
The discussion and analysis of our financial condition and results of operations is based on our consolidated financial statements, which have been prepared in accordance with accounting principles generally acceptable in the United States of America. The preparation of these financial statements requires us to make estimates and assumptions that affect the reported amounts of assets and liabilities and the disclosure of contingent assets and liabilities at the dates of the financial statements and the reported revenues and expenses during the reporting periods. We evaluate these estimates and assumptions on an ongoing basis and base our estimates on historical experience, current conditions and various other assumptions that we believe to be reasonable under the circumstances. The results of these estimates form the basis for making judgments about the carrying values of assets and liabilities as well as identifying and assessing the accounting treatment with respect to commitments and contingencies. Our actual results may materially differ from these estimates.
Listed below are the accounting policies we believe are critical to our financial statements due to the degree of uncertainty regarding the estimates or assumptions involved, and that we believe are critical to the understanding of our operations.
Revenue Recognition
We recognize revenue when persuasive evidence of an arrangement exists, delivery of products has occurred, the sales price charged is fixed or determinable, collectability is reasonably assured, and the risk of loss
68
Table of Contents
is transferred to the customer. This generally means that sales are FCA, payment made at the origination point at our facility, and title passes as the product is loaded into rail cars hired by the customer. Certain spot-rate customers have shipping terms of FCA, payment made at the destination; we recognize this revenue when the sand is received at the destination.
We derive our revenue by mining and processing sand that our customers purchase for various uses. Our revenues are primarily a function of the price per ton realized and the volumes sold. In some instances, our revenues also include transportation costs we charge to our customers and a monthly charge to reserve sand capacity. Our transportation revenue fluctuates based on a number of factors, including the volume of product we transport and the distance between our plant and our customers. Our reservation revenue fluctuates based on negotiated contract terms.
We sell a limited amount of product under short-term price agreements or at prevailing market rates. The majority of our revenues are realized through long-term take-or-pay contracts. The expiration dates of these contracts range from 2016 through 2020; however, certain contracts include extension periods, as defined in the respective contracts. These agreements define, among other commitments, the volume of product that our customers must purchase, the volume of product that we must provide and the price that we will charge and that our customers will pay for each ton of contracted product. Prices under these agreements are generally either fixed or indexed to WTI and subject to adjustment, upward or downward, based upon: (i) certain changes in published producer cost indices, including the Consumer Price Index for All Urban Consumers and the Producer Price Index published by the U.S. Bureau of Labor Statistics; or (ii) market factors, including a natural gas surcharge and a propane surcharge which are applied if the Average Natural Gas Price or the Average Quarterly Mont Belvieu TX Propane Spot Price, respectively, as listed by the U.S. Energy Information Administration, are above the benchmark set in the contract for the preceding calendar quarter. As a result, our realized prices may not grow at rates consistent with broader industry pricing. For example, during periods of rapid price growth, our realized prices may grow more slowly than those of competitors, and during periods of price decline, our realized prices may outperform industry averages. With respect to the take-or-pay arrangements, if the customer is not allowed to make up deficiencies, we recognize revenues to the extent of the minimum contracted quantity, assuming payment has been received or is reasonably assured. Such revenue is generally recognized either quarterly or at the end of a customer contract year rather than ratably over the respective contract year. If deficiencies can be made up, receipts in excess of actual sales are recognized as deferred revenues until production is actually taken or the right to make up deficiencies expires.
Asset Retirement Obligation
We estimate the future cost of dismantling, restoring and reclaiming operating excavation sites and related facilities in accordance with federal, state and local regulatory requirements and recognize reclamation obligations when extraction occurs and record them as liabilities at estimated fair value. In addition, a corresponding increase in the carrying amount of the related asset is recorded and depreciated over such asset’s useful life or the estimated number of years of extraction. The reclamation liability is accreted to expense over the estimated productive life of the related asset and is subject to adjustments to reflect changes in value resulting from the passage of time and revisions to the estimates of either the timing or amount of the reclamation costs. If the asset retirement obligation is settled for more or less than the carrying amount of the liability, a loss or gain will be recognized, respectively.
Inventory Valuation
Sand inventory is stated at the lower of cost or market using the average cost method. Costs applied to inventory include direct excavation costs, processing costs, overhead allocation, depreciation and depletion. Stockpile tonnages are calculated by measuring the number of tons added and removed from the stockpile. Tonnages are verified periodically by an independent surveyor. Costs are calculated on a per ton basis and are applied to the stockpiles based on the number of tons in the stockpile.
69
Table of Contents
Spare parts inventory includes critical spare parts. We account for spare parts on a first in first out basis, and value the inventory at the lower of cost or market.
Depletion
We amortize the cost to acquire land and mineral rights using a units-of-production method, based on the total estimated reserves and tonnage extracted each period.
Impairment of Long-Lived Assets
We periodically evaluate whether current events or circumstances indicate that the carrying value of our assets may not be recoverable. If circumstances indicate that the carrying value may not be recoverable, we estimate future undiscounted net cash (without interest charges), estimated future sales prices (considering historical and current prices, price trends and related factors) and anticipated operating costs and capital expenditures. We record a reduction in the carrying value of our long-lived assets if the undiscounted cash flows are less than the carrying value of the assets.
Our estimates of prices, recoverable proven reserves and operating and capital costs are subject to certain risks and uncertainties which may affect the recoverability of our long-lived assets. Although we have made our best estimate of these factors based on current conditions, it is reasonably possible that changes could occur, which could adversely affect our estimate of the net cash flows expected to be generated from our operating property. No impairment charges were recorded during the years ended December 31, 2015 and 2014 or the six-month period ended June 30, 2016.
Income Taxes
Under the balance sheet approach to provide for income taxes, we recognize deferred tax assets and liabilities for the expected future tax consequences of net operating loss carryforwards and temporary differences between the carrying amounts and the tax bases of assets and liabilities. In assessing the realizability of deferred tax assets, we consider whether it is more likely than not that some portion or all of the deferred tax assets will not be realized. The ultimate realization of deferred tax assets is dependent upon the generation of future taxable income during the period in which those temporary differences become deductible. If we determine it is more likely than not that we will not be able to realize the benefits of the deductible temporary differences, we record a valuation against the net deferred tax asset.
We recognize the impact of uncertain tax positions at the largest amount that, in our judgment, is more-likely-than-not to be required to be recognized upon examination by a taxing authority.
Stock-Based Compensation
Stock-based compensation expense is recorded based upon the fair value of the award at grant date. Such costs are recognized as expense over the corresponding requisite service period. The fair value of the awards granted was calculated based on a weighted analysis of (i) publicly-traded companies in a similar line of business to us (market comparable method) and (ii) our discounted cash flows. The application of this valuation model involves inputs and assumptions that are judgmental and highly sensitive in the valuation of incentive awards, which affects compensation expense related to these awards. These inputs and assumptions include the value of a share of our common stock.
We use a combination of the guideline company approach and a discounted cash flow analysis to determine the fair value of our stock. The key assumptions in this estimate include our projections of future cash flows, company-specific cost of capital used as a discount rate, lack of marketability discount, and qualitative factors to compare us to comparable guideline companies. During 2015, factors that contributed to changes in the
70
Table of Contents
underlying value of our stock included the continued market challenges and corresponding decline in oil and natural gas drilling activity, changes to future cash flows projected from the recent expansion of capacity, product mix including mix of finer grade versus coarser grade sand, and other factors. As our operations are highly dependent on sales to the oil and gas industry, the market conditions for this industry have a high degree of impact on the company’s value.
We will continue to use judgment in evaluating the inputs and assumptions related to our stock-based compensation on a prospective basis and incorporating these factors into our pricing model. However, once our shares are publicly traded, we will use the actual market price as the grant date fair value, and will no longer estimate the value of the shares underlying the stock-based awards.
The following is a summary of the restricted stock awards granted and the related grant date fair value in the years ended December 31, 2015 and 2014, as well as for the six months ended June 30, 2016.
| Number of Shares Granted |
Grant Date Fair Value |
|||||||
| For the six months ended June 30, 2016 |
73.0 | $ | 8,464 | |||||
| For the year ended December 31, 2015 |
20.0 | 17,732 | ||||||
| For the year ended December 31, 2014 |
154.0 | 17,732 | ||||||
During the last six months of 2015, we did not issue any restricted stock awards. During March 2016, we issued 73 shares of restricted stock (160,600 shares after giving effect to the expected 2,200 to 1 stock split). These restricted stock awards consist of 50% service-based vesting over 4 years and 50% performance-based vesting upon the achievement of certain triggering events. These triggering events are consistent with the triggering events of our outstanding warrants. Please read “Description of Capital Stock—Outstanding Warrants.”
We are subject to various federal, state and local laws and regulations governing, among other things, hazardous materials, air and water emissions, environmental contamination and reclamation and the protection of the environment and natural resources. We have made, and expect to make in the future, expenditures to comply with such laws and regulations, but cannot predict the full amount of such future expenditures.
71
Table of Contents
Unless otherwise indicated, the information set forth under “—Industry Trends Impacting Our Business,” including all statistical data and related forecasts, is derived from The Freedonia Group’s Industry Study #3302, “Proppants in North America,” published in September 2015, Spears & Associates’ “Hydraulic Fracturing Market 2005-2017” published in the second quarter 2016, PropTester, Inc. and Kelrik, LLC’s “2015 Proppant Market Report” published in March 2016 and Baker Hughes’ “North America Rotary Rig Count” published in July 2016. We believe that the third-party sources are reliable and that the third-party information included in this prospectus or in our estimates is accurate and complete. While we are not aware of any misstatements regarding the proppant industry data presented herein, estimates involve risks and uncertainties and are subject to change based on various factors, including those discussed under the heading “Risk Factors.”
The oil and natural gas proppant industry is comprised of businesses involved in the mining or manufacturing of the propping agents used in the drilling and completion of oil and natural gas wells. Hydraulic fracturing is the most widely used method for stimulating increased production from wells. The process consists of pumping fluids, mixed with granular proppants, into the geologic formation at pressures sufficient to create fractures in the hydrocarbon-bearing rock. Proppant-filled fractures create conductive channels through which the hydrocarbons can flow more freely from the formation into the wellbore and then to the surface.
There are three primary types of proppant that are commonly utilized in the hydraulic fracturing process: raw frac sand, which is the product we produce, resin-coated sand and manufactured ceramic beads. The following chart illustrates the composition of the U.S. market for proppant by type.
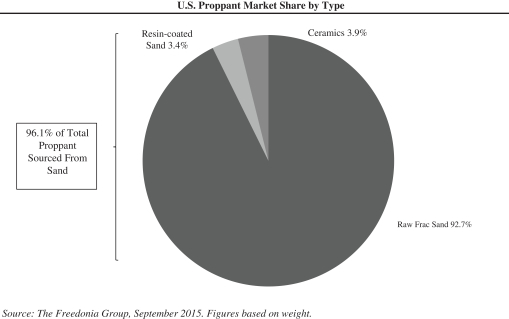
72
Table of Contents
The U.S. Bureau of Labor Statistics started tracking hydraulic frac sand as part of its Producer Price Index (“PPI”) related to commodities in 2012. A chart of their Frac Sand PPI is below.
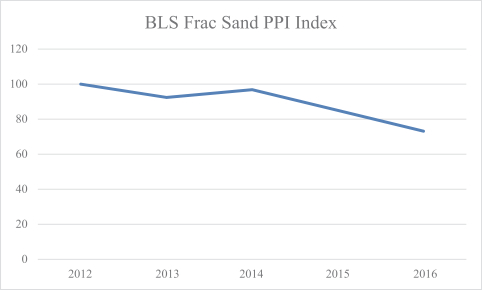
Raw Frac Sand
Of the three primary types of proppant, raw frac sand is the most widely used due to its broad applicability in oil and natural gas wells and its cost advantage relative to other proppants. Raw frac sand has been employed in nearly all major U.S. oil and natural gas producing basins, including the Barnett, Eagle Ford, Fayetteville, Granite Wash, Haynesville, Marcellus, Niobrara, DJ, Permian, Utica, Williston and Woodford basins.
Raw frac sand is generally mined from the surface or underground, and in some cases crushed, and then cleaned and sorted into consistent mesh sizes. The API has a range of guidelines it uses to evaluate frac sand grades and mesh sizes. In order to meet API specifications, raw frac sand must meet certain thresholds related to particle size, shape (sphericity and roundness), crush resistance, turbidity (fines and impurities) and acid solubility. Oil and natural gas producers generally require that raw frac sand used in their drilling and completion processes meet API specifications.
Raw frac sand can be further delineated into two main naturally occurring types: white sand and brown sand. Northern White, which is the specific type of white raw frac sand that we produce, is considered to be of higher quality than brown sand due to the monocrystalline grain structure of Northern White frac sand. Brown sand (also called Brady or Hickory sand) has historically been considered the lower quality raw frac sand, due to its polycrystalline structure and inferior angularity, strength and purity characteristics. Northern White frac sand, due to its exceptional quality, commands premium prices relative to other types of sand. Northern White frac sand has historically experienced the greatest market demand relative to supply, due both to its superior physical characteristics and the fact that it is a limited resource that exists predominately in Wisconsin and other limited parts of the upper Midwest region of the United States. However, even within Northern White raw frac sand, the quality of Northern White raw frac sand can vary significantly across deposits.
Resin-Coated Frac Sand
Resin-coated frac sand consists of raw frac sand that is coated with a resin that increases the sand’s crush strength and prevents crushed sand from dispersing throughout the fracture. The strength and shape of the end product are largely determined by the quality of the underlying raw frac sand. Pressured (or tempered) resin-
73
Table of Contents
coated sand primarily enhances crush strength, thermal stability and chemical resistance, allowing the sand to perform under harsh downhole conditions. Curable (or bonding) resin-coated frac sand uses a resin that is designed to bond together under closure stress and high temperatures, preventing proppant flowback. In general, resin-coated frac sand is better suited for higher pressure, higher temperature drilling operations commonly associated with deep wells and natural gas wells.
Ceramics
Ceramic proppant is a manufactured product of comparatively consistent size and spherical shape that typically offers the highest crush strength relative to other types of proppants. As a result, ceramic proppant use is most applicable in the highest pressure and temperature drilling environments. Ceramic proppant derives its product strength from the molecular structure of its underlying raw material and is designed to withstand extreme heat, depth and pressure environments. The deepest, highest temperature and highest pressure wells typically require heavy weight ceramics with high alumina/bauxite content and coarser mesh sizes. The lower crush resistant ceramic proppants are lighter weight and derived from kaolin clay, with densities closer to raw frac sand.
Comparison of Key Proppant Characteristics
The following table sets forth what we believe to be the key comparative characteristics of the primary types of proppant, including Northern White raw frac sand that we produce.
| Brown Raw Frac Sand |
Northern White |
Resin-coated |
Ceramics | |||||
| Product and Characteristics |
• Natural resource
• Quality of sand varies widely depending on source |
• Natural resource
• Considered highest quality raw frac sand
• Monocrystalline in nature, exhibiting crush strength, turbidity and roundness and sphericity in excess of API specifications |
• Raw frac sand substrate with resin coating
• Coating increases crush strength
• Bond together to prevent proppant flowback |
• Manufactured product
• Typically highest crush strength | ||||
| Crush Strength |
up to 12,000 psi | up to 12,000 psi | up to 15,000 psi | up to 18,000 psi | ||||
| Relative Price |
Least Expensive | × |
Most Expensive | |||||
Source: API; Stim-Lab, Inc.; company provided information; The Freedonia Group, September 2015
Proppant Mesh Sizes
Mesh size is used to describe the size of the proppant and is determined by sieving the proppant through screens with uniform openings corresponding to the desired size of the proppant. Each type of proppant comes in various sizes, categorized as mesh sizes, and the various mesh sizes are used in different applications in the oil and natural gas industry. The mesh number system is a measure of the number of equally sized openings there are per linear inch of screen (composed of a grid pattern of crisscrossed wires) through which the proppant is sieved. For example, a 30 mesh screen has 30 equally sized openings per linear inch. Therefore, as the mesh size increases, the granule size decreases. A mesh size of 30/50 refers to sand that passes through a 30 mesh screen but is retained on a 50 mesh screen. As defined by John T. Boyd, 100 mesh sand refers to sand that passes through a 70 mesh screen but is retained on a 140 mesh screen.
Frac Sand Extraction, Processing and Distribution
Raw frac sand is a naturally occurring mineral that is mined and processed. While the specific extraction method utilized depends primarily on the geologic setting, most raw frac sand is mined using conventional open-pit bench extraction methods. The composition, depth and chemical purity of the sand also dictate the processing method and equipment utilized. After extraction, the raw frac sand is washed with water to remove fine impurities such as clay and organic particles. The final steps in the production process involve the drying and sorting of the raw frac sand according to mesh size required to meet API specifications.
74
Table of Contents
After this processing stage, most frac sand is shipped in bulk from the processing facility to customers by rail, barge or truck. For high volumes of raw frac sand, transportation costs often represent a significant portion of the customer’s overall cost, which highlights the importance of efficient bulk shipping. Due to the midcontinent location of Northern White raw frac sand mines, rail is the predominant method of long distance sand shipment from the region. For this reason, direct access to Class I rail lines (such as Canadian Pacific and Union Pacific) is an important differentiator in the industry. Our Oakdale facility has access to two Class I rail lines. The presence of an onsite rail yard capable of storing multiple trains, like the rail facility at our Oakdale plant, provides optimal efficiency. Rail shipment can occur via manifest trains or unit trains. Manifest trains, also called mixed-freight trains, are considered less efficient because these trains switch cars at various intermediate junctions in transit and routinely encounter delays. By contrast, unit trains, like those we employ at our Oakdale facility, tend to travel from origin to destination without stopping at intermediate destinations or multiple switching yards. The capability to ship via unit train, and simultaneously manage multiple unit trains at the production facility, enables reliable and cost effective delivery of high volumes of sand.
According to Spears, the U.S. proppant market, including raw frac sand, ceramic and resin-coated proppant, was approximately 52.5 million tons in 2015. Kelrik estimates that the total raw frac sand market in 2015 represented approximately 92.3% of the total proppant market by weight. Market demand in 2015 dropped by approximately 28% from 2014 record demand levels (and a further estimated decrease of 43% in 2016 from 2015) due to the downturn in commodity prices since late 2014, which led to a corresponding decline in oil and natural gas drilling and production activity. According to the Freedonia Group, during the period from 2009 to 2014, proppant demand by weight increased by 42% annually. Spears estimates from 2016 through 2020 proppant demand is projected to grow by 23.2% per year, from 30 million tons per year to 85 million tons per year, representing an increase of approximately 55 million tons in annual proppant demand over that time period.
Demand growth for raw frac sand and other proppants is primarily driven by advancements in oil and natural gas drilling and well completion technology and techniques, such as horizontal drilling and hydraulic fracturing. These advancements have made the extraction of oil and natural gas increasingly cost-effective in formations that historically would have been uneconomic to develop. While current horizontal rig counts have fallen significantly from their peak of approximately 1,370 in 2014, rig count grew at an annual rate of 18.7% from 2009 to 2014. Additionally, the percentage of active drilling rigs used to drill horizontal wells, which require greater volumes of proppant than vertical wells, has increased from 42.2% in 2009 to 68.4% in 2014, and as of July 2016 the percentage of rigs drilling horizontal wells is 77% according to the Baker Hughes Rig Count.
75
Table of Contents
According to its “Drilling and Production Outlook” published in June 2016, Spears estimates that drilling and completion spending will increase from an estimated $49 billion in 2016 to $144 billion in 2020, driving an estimated increase in the total active rig count to 1,089 active rigs by 2020, with the estimated percentage of horizontal wells being drilled at 62%. Moreover, the increase of pad drilling has led to a more efficient use of rigs, allowing more wells to be drilled per rig. As a result of these factors, well count, and hence proppant demand, has grown at a greater rate than overall rig count. Spears estimates that in 2019, proppant demand will exceed the 2014 peak (of approximately 72.5 million tons) and reach 77.5 million tons even though the projection assumes approximately 10,000 fewer wells will be drilled. Spears estimates that average proppant usage per well will be approximately 5,000 tons per well by 2020. Kelrik notes that current sand-based slickwater completions use in excess of 7,500 tons per well of proppant.
We believe that demand for proppant will be amplified by the following factors:
| • | improved drilling rig productivity, resulting in more wells drilled per rig per year; |
| • | completion of exploration and production companies’ inventory of drilled but uncompleted wells; |
| • | increases in the percentage of rigs that are drilling horizontal wells; |
| • | increases in the length of the typical horizontal wellbore; |
| • | increases in the number of fracture stages per foot in the typical completed horizontal wellbore; |
| • | increases in the volume of proppant used per fracturing stage; |
| • | renewed focus of exploration and production companies to maximize ultimate recovery in active reservoirs through downspacing; and |
| • | increasing secondary hydraulic fracturing of existing wells as early shale wells age. |
The following table illustrates the steadily increasing intensity of proppant use in those wells.
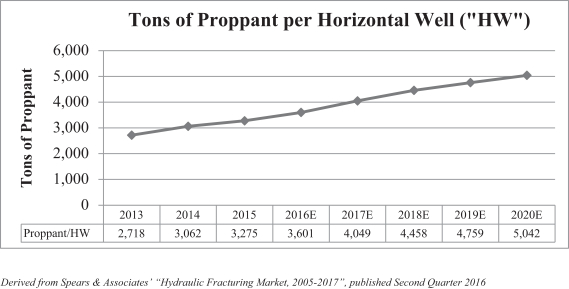
Wells in unconventional reservoirs are characterized by high initial production rates followed by a steep decline in production rates during the first several years of the well’s life. Producers must continuously drill new wells to offset production declines and maintain overall production levels. Additionally, operators are beginning to perform secondary hydraulic fracturing of existing wells in order to maintain overall production levels. We believe these efforts to offset steep production declines in unconventional oil and natural gas reservoirs will be a strong driver of future proppant demand growth.
76
Table of Contents
Recent growth in demand for raw frac sand has outpaced growth in demand for other proppants, and industry analysts predict that this trend will continue. As oil prices have fallen, operators have increasingly looked for ways to improve per well economics by lowering costs without sacrificing production performance. To this end, the oil and natural gas industry is shifting away from the use of higher-cost proppants towards more cost-effective proppants, such as raw frac sand. Evolution of completion techniques and the substantial increase in activity in U.S. oil and liquids-rich resource plays has further accelerated the demand growth for raw frac sand.
In general, oil and liquids-rich wells use a higher proportion of coarser proppant while dry gas wells typically use finer grades of sand. In the past, with the majority of U.S. exploration and production spending focused on oil and liquids-rich plays, demand for coarser grades of sand exceeded demand for finer grades; however, due to innovations in completion techniques, demand for finer grade sands has also shown a considerable resurgence. According to Kelrik, a notable driver impacting demand is increased proppant loadings, specifically, larger volumes of proppant placed per frac stage. Kelrik expects the trend of using larger volumes of finer mesh materials such as 100 mesh sand and 40/70 sand, to continue.
In recent years, through the fall of 2014, customer demand for high-quality raw frac sand outpaced supply. Several factors contributed to this supply shortage, including:
| • | the difficulty of finding raw frac sand reserves that meet API specifications and satisfy the demands of customers who increasingly favor high-quality Northern White raw frac sand; |
| • | the difficulty of securing contiguous raw frac sand reserves large enough to justify the capital investment required to develop a processing facility; |
| • | the challenges of identifying reserves with the above characteristics that have rail access needed for low-cost transportation to major shale basins; |
| • | the hurdles to securing mining, production, water, air, refuse and other federal, state and local operating permits from the proper authorities; |
| • | local opposition to development of certain facilities, especially those that require the use of on-road transportation, including moratoria on raw frac sand facilities in multiple counties in Wisconsin and Minnesota that hold potential sand reserves; and |
| • | the long lead time required to design and construct sand processing facilities that can efficiently process large quantities of high-quality raw frac sand. |
Supplies of high-quality Northern White raw frac sand are limited to select areas, predominantly in western Wisconsin and limited areas of Minnesota and Illinois. The ability to obtain large contiguous reserves in these areas is a key constraint and can be an important supply consideration when assessing the economic viability of a potential raw frac sand facility. Further constraining the supply and throughput of Northern White raw frac sand, is that not all of the large reserve mines have onsite excavation and processing capability. Additionally, much of the recent capital investment in Northern White raw frac sand mine was used to develop coarser deposits in western Wisconsin. With the shift to finer sands in the liquid and oil plays, many mines may not be economically viable as their ability to produce finer grades of sand may be limited.
Pricing and Contract Considerations
Sand is sold on a contract basis or through spot market pricing. Long-term take-or-pay contracts reduce exposure to fluctuations in price and provide predictability of volumes and price over the contract term. By contrast, the spot market provides direct access to immediate prices, with accompanying exposure to price volatility and uncertainty. For sand producers operating under stable long-term contract structures, the spot market can offer an outlet to sell excess production at opportunistic times or during favorable market conditions.
77
Table of Contents
We are a pure-play, low-cost producer of high-quality Northern White raw frac sand, which is a preferred proppant used to enhance hydrocarbon recovery rates in the hydraulic fracturing of oil and natural gas wells. We sell our products primarily to oil and natural gas exploration and production companies, such as EOG Resources and oilfield service companies, such as Weatherford, under a combination of long-term take-or-pay contracts and spot sales in the open market. We believe that the size and favorable geologic characteristics of our sand reserves, the strategic location and logistical advantages of our facilities and the industry experience of our senior management team have positioned us as a highly attractive source of raw frac sand to the oil and natural gas industry.
We own and operate a raw frac sand mine and related processing facility near Oakdale, Wisconsin, at which we have approximately 244 million tons of proven recoverable sand reserves and approximately 92 million tons of probable recoverable sand reserves as of June 30, 2016, respectively. We began operations with 1.1 million tons of processing capacity in July 2012 and expanded to 2.2 million tons capacity in August 2014 with an additional expansion to 3.3 million tons in September 2015. Our integrated Oakdale facility, with on-site rail infrastructure and wet and dry sand processing facilities, has access to two Class I rail lines and enables us to process and cost-effectively deliver up to approximately 3.3 million tons of raw frac sand per year. We believe that with further development and permitting the Oakdale facility could ultimately be expanded to allow production of up to 9 million tons of raw frac sand per year.
In addition to the Oakdale facility, we own a second property in Jackson County, Wisconsin, which we call the Hixton site. The Hixton site is also located adjacent to a Class I rail line and is fully permitted and available for future development. As of August 2014, our Hixton site had approximately 100 million tons of proven recoverable sand reserves.
For the year ended December 31, 2015 and six months ended June 30, 2016, we generated net income (loss) of approximately $5.0 million and $(2.0) million, respectively, and Adjusted EBITDA of approximately $23.9 million and $6.4 million, respectively. For the definition of Adjusted EBITDA and reconciliations to its most directly comparable financial measure calculated and presented in accordance with GAAP, please read “Selected Historical Consolidated Financial Data—Non-GAAP Financial Measures.”
Over the past decade, exploration and production companies have increasingly focused on exploiting the vast hydrocarbon reserves contained in North America’s unconventional oil and natural gas reservoirs utilizing advanced techniques, such as horizontal drilling and hydraulic fracturing. In recent years, this focus has resulted in exploration and production companies drilling more and longer horizontal wells, completing more hydraulic fracturing stages per well and utilizing more proppant per stage in an attempt to maximize the volume of hydrocarbon recoveries per wellbore. From 2010 to 2015 frac sand demand experienced strong growth, growing at an average annual rate of 25%. In addition, raw frac sand’s share of the total proppant market continues to increase, growing from approximately 78% in 2010 to approximately 92% in 2015 as exploration and production companies continue to look closely at overall well cost, completion efficiency and design optimization, which has led to a greater use of raw frac sand in comparison to resin-coated sand and manufactured ceramic proppants.
Northern White raw frac sand, which is found predominantly in Wisconsin and limited portions of Minnesota and Illinois, is highly valued by oil and natural gas producers as a preferred proppant due to its favorable physical characteristics. We believe that the market for high-quality raw frac sand, like the Northern White raw frac sand we produce, particularly finer mesh sizes, will grow based on the potential recovery in the development of North America’s unconventional oil and natural gas reservoirs as well as the increased proppant volume usage per well. According to Kelrik, a notable driver impacting demand for fine mesh sand is increased proppant loadings, specifically, larger volumes of proppant placed per frac stage. Kelrik expects the trend of using larger volumes of finer mesh materials, such as 100 mesh sand and 40/70 sand, to continue.
78
Table of Contents
We believe the growth in the supply of raw frac sand will be increasingly constrained by logistics complexity, limited availability of API-specification sand reserves globally as well as the difficulty of obtaining the myriad of construction, environmental, mining and other permits required by local, state and federal regulators. Our sand reserves include a balanced concentration of coarse (20/40, 30/50 and 40/70 gradation) sands and fine (60/140 gradation, which we refer to in this prospectus as “100 mesh”) sand. Our reserves contain deposits of approximately 19% of 20/40 and coarser substrate, 41% of 40/70 mesh substrate and approximately 40% of 100 mesh substrate. Our 30/50 gradation is a derivative of the 20/40 and 40/70 blends. We believe that this mix of coarse and fine sand reserves, combined with contractual demand for our products across a range of mesh sizes, provides us with relatively higher mining yields and lower processing costs than frac sand mines with predominately coarse sand reserves. In addition, our approximate 244 million tons of proven recoverable reserves at our Oakdale facility as of June 30, 2016, implies a reserve life of approximately 73 years based on our current annual processing capacity of 3.3 million tons per year. This long reserve life, coupled with our balanced mix of coarse and fine sand reserves, enables us to better serve demand for different types of raw frac sand as compared to mines with disproportionate amounts of coarse or fine sand and mines with shorter reserve lives.
As of July 31, 2016, we had approximately 2.1 million tons (or approximately 64% of our current annual production capacity) contracted to oil and natural gas exploration and production and oilfield service companies. Beginning January 1, 2017, we will have approximately 1.0 million tons of average annual production (or approximately 30.6% of our current annual production capacity) contracted under long-term take-or-pay contracts, with a volume-weighted average remaining term of approximately 3.7 years. Each of these contracts contains a minimum volume purchase requirement, is subject to certain price escalators and provides for delivery of raw frac sand FCA at our Oakdale facility. Certain of these contracts contain provisions that allow our customers to extend the term of the contracts. The mesh size specifications in these contracts vary and include a mix of 20/40, 30/50, 40/70 and 100 mesh frac sand.
Our Oakdale facility is optimized to exploit the reserve profile in place and produce high-quality raw frac sand. Unlike some of our competitors, our mine, processing plants and rail loading facilities are located in one location, which eliminates the need for us to truck sand on public roads between the mine and the production facility or between wet and dry processing facilities. Our on-site transportation assets include approximately seven miles of rail track in a double-loop configuration and three rail car loading facilities that are connected to a Class I rail line owned by Canadian Pacific, which enables us to simultaneously accommodate multiple unit trains and significantly increases our efficiency in meeting our customers’ raw frac sand transportation needs. We currently ship a substantial portion of our sand volumes (approximately 56% from April 1, 2016 to July 31, 2016) in unit train shipments through rail cars that our customers own or lease and deliver to our facility.
We believe that we are one of the few raw frac sand producers with a facility custom-designed for the specific purpose of delivering raw frac sand to all of the major U.S. oil and natural gas producing basins by an on-site rail facility that can simultaneously accommodate multiple unit trains. Our ability to handle multiple rail car sets allows for the efficient transition of locomotives from empty inbound trains to fully loaded outbound trains at our facility. We believe our customized on-site logistical configuration yields lower overall operating and transportation costs compared to manifest train or single-unit train facilities as a result of our higher rail car utilization, more efficient use of locomotive power and more predictable movement of product between mine and destination. Unit train operations such as ours can double or triple the average number of loads that a rail car carries per year reducing the number of rail cars needed to support our operations thus limiting our exposure to unutilized rail cars and the corresponding storage and lease expense. We believe our Oakdale facility’s connection to the Canadian Pacific rail network, combined with our unit train logistics capabilities, will provide us enhanced flexibility to serve customers located in shale plays throughout North America.
In addition, we have invested in a transloading facility on the Union Pacific rail network in Byron Township, Wisconsin, approximately 3.5 miles from our Oakdale facility. This facility is operational and provides us with the ability to ship directly on the Union Pacific rail network to locations in the major operating basins of Texas, Oklahoma, and Colorado, which should facilitate more competitive pricing among our rail
79
Table of Contents
carriers. With the addition of this transload facility, we believe we are the only mine in Wisconsin with dual served railroad shipment capabilities on the Canadian Pacific and Union Pacific rail networks, which should provide us more competitive logistics options to the market relative to other Wisconsin-based sand mining and production facilities.
In addition to the Oakdale facility, our Hixton site consists of approximately 959 acres in Jackson County, Wisconsin. The Hixton site is fully permitted to initiate operations and is available for future development and is located on a Class I rail line. As of August 2014, our Hixton site had approximately 100 million tons of proven recoverable sand reserves.
We believe that we will be able to successfully execute our business strategies because of the following competitive strengths:
| • | Long-lived, strategically located, high-quality reserve base. We believe our Oakdale facility is one of the few raw frac sand mine and production facilities that has the unique combination of a large high-quality reserve base of primarily fine mesh sand that is contiguous to its production and primary rail loading facilities. Our Oakdale facility is situated on 1,196 acres in a rural area of Monroe County, Wisconsin, on a Class I rail line, and contains approximately 244 million tons of proven recoverable reserves and approximately 92 million tons of probable recoverable reserves as of June 30, 2016. We have an implied current proven reserve life of approximately 73 years based on our current annual processing capacity of 3.3 million tons per year. As of July 31, 2016, we have utilized 135 acres for facilities and mining operations, or only 11.3% of this location’s acreage. We believe that with further development and permitting, the Oakdale facility ultimately could be expanded to allow production of up to 9 million tons of raw frac sand per year. |
We believe our reserve base positions us well to take advantage of current market trends of increasing demand for finer mesh raw frac sand. Approximately 80% of our reserve mix today is 40/70 mesh substrate and 100 mesh substrate, considered to be the finer mesh substrates of raw frac sand. We believe that if oil and natural gas exploration and production companies continue recent trends in drilling and completion techniques to increase lateral lengths per well, the number of frac stages per well, the amount of proppant used per stage and the utilization of slickwater completions, that the demand for the finer grades of raw frac sand will continue to increase, which we can take advantage of due to the high percentage of high-quality, fine mesh sand in our reserve base.
We also believe that having our mine, processing facilities and primary rail loading facilities at our Oakdale facility provides us with an overall low-cost structure, which enables us to compete effectively for sales of raw frac sand and to achieve attractive operating margins. The proximity of our mine, processing plants and primary rail loading facilities at one location eliminates the need for us to truck sand on public roads between the mine and the production facility or between wet and drying processing facilities, eliminating additional costs to produce and ship our sand.
In addition to the Oakdale facility, we own the Hixton site in Jackson County, Wisconsin. The Hixton site is a second fully permitted location adjacent to a Class I rail line that is fully permitted to initiate operations and is available for future development. As of August 2014, our Hixton site had approximately 100 million tons of proven recoverable sand reserves.
| • | Intrinsic logistics advantage. We believe that we are one of the few operating frac sand producers with a facility custom-designed for the specific purpose of delivering operating frac sand to all of the major U.S. oil and natural gas producing basins by an on-site rail facility that can simultaneously accommodate multiple unit trains. Our on-site transportation assets at Oakdale include approximately seven miles of rail track in a double-loop configuration and three rail car loading facilities that are connected to a Class I rail line owned by Canadian Pacific. We believe our customized on-site logistical configuration typically |
80
Table of Contents
| yields lower operating and transportation costs compared to manifest train or single-unit train facilities as a result of our higher rail car utilization, more efficient use of locomotive power and more predictable movement of product between mine and destination. In addition, we have recently constructed a transload facility on a Class I rail line owned by Union Pacific in Byron Township, Wisconsin, approximately 3.5 miles from the Oakdale facility. This transload facility allows us to ship sand directly to our customers on more than one Class I rail carrier. This facility commenced operations in June 2016 and provides increased delivery options for our customers, greater competition among our rail carriers and potentially lower freight costs. With the addition of this transload facility, we believe we are the only mine in Wisconsin with dual served railroad shipment capabilities on the Canadian Pacific and Union Pacific rail networks. Our Hixton site is also located adjacent to a Class I rail line. |
| • | Significant organic growth potential. We believe that we have a significant pipeline of attractive opportunities to expand our sales volumes and our production capacity at our Oakdale facility, which commenced commercial operations in July 2012 and was expanded to 3.3 million tons of annual processing capacity in September 2015. We currently have one wet plant and one dryer in storage at Oakdale that would allow us to increase our annual processing capacity to approximately 4.4 million tons should market demand increase sufficiently to warrant capacity expansion. We believe these units could be installed and operational in approximately six to nine months from commencement of construction. We believe, under current regulations and permitting requirements, that we can ultimately expand our annual production capacity at Oakdale of up to 9 million tons. Other growth opportunities include the ability to expand our Byron Township transload facility to handle multiple unit trains simultaneously and to invest in transload facilities located in the shale operating basins. Investments in additional rail loading facilities should enable us to provide more competitive transportation costs and allow us to offer additional pricing and delivery options to our customers. We also have opportunities to expand our sales into the industrial sand market which would provide us the opportunity to diversify our customer base and sales product mix. |
Additionally, as of July 31, 2016, we have approximately 2.1 million tons of washed raw frac sand inventory at our Oakdale facility available to be processed through our dryers and sold in the market. This inventory of available washed raw frac sand provides us with the ability to quickly meet changing market demand and strategically sell sand on a spot basis to expand our market share of raw frac sand sales if market conditions are favorable.
| • | Strong balance sheet and financial flexibility. We believe that as a public company we will have a strong balance sheet and ample liquidity to pursue our growth initiatives. At the closing of this offering, we expect to have approximately $45 million in liquidity from cash on hand. In addition, in connection with the repayment in full and retirement of our existing credit facility with a portion of the proceeds of this offering, we are in the process of negotiating a new $40 to 50 million revolving credit facility, which we expect will be effective at or shortly after the completion of this offering. Additionally, unlike some of our peers, we have minimal exposure to unutilized rail cars. We currently have 855 rail cars under long-term leases of which 710 are currently rented to our customers, which minimizes our exposure to storage and leasing expense for rail cars that are currently not being utilized for sand shipment and provides us greater flexibility in managing our transportation costs prospectively. |
| • | Focus on safety and environmental stewardship. We are committed to maintaining a culture that prioritizes safety, the environment and our relationship with the communities in which we operate. In August 2014, we were accepted as a “Tier 1” participant in Wisconsin’s voluntary “Green Tier” program, which encourages, recognizes and rewards companies for voluntarily exceeding environmental, health and safety legal requirements. In addition, we committed to certification under ISO standards and, in April 2016, we received ISO 9001 and ISO 14001 registrations for our quality management system and environmental management system programs, respectively. We believe that our commitment to safety, the environment and the communities in which we operate is critical to the success of our business. We are one of a select group of companies who are members of the Wisconsin Industrial Sand Association, which promotes safe and environmentally responsible sand mining standards. |
81
Table of Contents
| • | Experienced management team. The members of our senior management team bring significant experience to the market environment in which we operate. Their expertise covers a range of disciplines, including industry-specific operating and technical knowledge as well as experience managing high-growth businesses. |
Our principal business objective is to be a pure-play, low-cost producer of high-quality raw frac sand and to increase stockholder value. We expect to achieve this objective through the following business strategies:
| • | Focusing on organic growth by increasing our capacity utilization and processing capacity. We intend to continue to position ourselves as a pure-play producer of high-quality Northern White raw frac sand, as we believe the proppant market offers attractive long-term growth fundamentals. While demand for proppant has declined since late 2014 in connection with the downturn in commodity prices and the corresponding decline in oil and natural gas drilling and production activity, we believe that the demand for proppant will increase over the medium and long term as commodity prices rise from their recent lows, which will lead producers to resume completion of their inventory of drilled but uncompleted wells and undertake new drilling activities. We expect this demand growth for raw frac sand will be driven by increased horizontal drilling, increased proppant loadings per well (as operators increase lateral length and increase proppant per lateral foot above current levels), increased wells drilled per rig and the cost advantages of raw frac sand over resin-coated sand and manufactured ceramics. As market dynamics improve, we will continue to evaluate economically attractive facility enhancement opportunities to increase our capacity utilization and processing capacity. For example, our current annual processing capacity is approximately 3.3 million tons per year, and we believe that with further development and permitting the Oakdale facility could ultimately be expanded to allow production of up to 9 million tons of raw frac sand per year. |
| • | Optimizing our logistics infrastructure and developing additional origination and destination points. We intend to further optimize our logistics infrastructure and develop additional origination and destination points. We expect to capitalize on our Oakdale facility’s ability to simultaneously accommodate multiple unit trains to maximize our product shipment rates, increase rail car utilization and lower transportation costs. With our recently developed transloading facility located on the Union Pacific rail network approximately 3.5 miles from our Oakdale facility, we have the ability to ship our raw frac sand directly to our customers on more than one Class I rail carrier. This facility provides increased delivery options for our customers, greater competition among our rail carriers, and potentially lower freight costs. In addition, we intend to continue evaluating ways to reduce the landed cost of our products at the basin for our customers, such as investing in transload and storage facilities and assets in our target shale basins to increase our customized service offerings and provide our customers with additional delivery and pricing alternatives, including selling product on an “as-delivered” basis at our target shale basins. |
| • | Focusing on being a low-cost producer and continuing to make process improvements. We will focus on being a low-cost producer, which we believe will permit us to compete effectively for sales of raw frac sand and to achieve attractive operating margins. Our low-cost structure results from a number of key attributes, including, among others, our (i) relatively low royalty rates compared to other industry participants, (ii) balance of coarse and fine mineral reserve deposits and corresponding contractual demand that minimizes yield loss and (iii) Oakdale facility’s proximity to two Class I rail lines and other sand logistics infrastructure, which helps reduce transportation costs, fuel costs and headcount needs. We have strategically designed our operations to provide low per-ton production costs. For example, we completed the construction of a natural gas connection to our Oakdale facility in October 2015 that provides us the optionality to source lower cost natural gas (as compared to propane under current commodity pricing) as a fuel source for our drying operations. In addition, we seek to maximize our mining yields on an ongoing basis by targeting sales volumes that more closely match our reserve gradation in order to minimize mining and processing of superfluous tonnage and continue to evaluate the potential of mining by dredge to reduce the overall cost of our mining operations. |
82
Table of Contents
| • | Pursuing accretive acquisitions and greenfield opportunities. At the closing of this offering, we expect to have approximately $45 million of liquidity in the form of cash on hand and anticipate entering into a new $40 to 50 million revolving credit facility with third-party lenders at or shortly after the completion of this offering. We believe this level of liquidity will position us to pursue strategic acquisitions to increase our scale of operations and our logistical capabilities as well as to potentially diversify our mining and production operations into locations other than our current Oakdale and Hixton locations. We may also grow by developing low-cost greenfield projects, where we can capitalize on our technical knowledge of geology, mining and processing. |
| • | Maintaining financial strength and flexibility. We plan to pursue a disciplined financial policy to maintain financial strength and flexibility. We believe that our cash on hand, expected borrowing capacity and ability to access debt and equity capital markets after this offering will provide us with the financial flexibility necessary to achieve our organic expansion and acquisition strategy. |
Overview
Our Oakdale facility is purpose-built to exploit the reserve profile in place and produce high-quality raw frac sand. Unlike some of our competitors, our mine, processing plants and primary rail loading facilities are in one location, which eliminates the need for us to truck sand on public roads between the mine and the production facility or between wet and dry processing facilities. Our on-site transportation assets include approximately seven miles of rail track in a double-loop configuration and three rail car loading facilities that are connected to a Class I rail line owned by Canadian Pacific, which enables us to simultaneously accommodate multiple unit trains and significantly increases our efficiency in meeting our customers’ raw frac sand transportation needs. We ship a substantial portion of our sand volumes (approximately 56% from April 1, 2016 to July 31, 2016) in unit train shipments through rail cars that our customers own or lease and deliver to our facility. We believe that we are one of the few raw frac sand producers with a facility custom-designed for the specific purpose of delivering raw frac sand to all of the major U.S. oil and natural gas producing basins by an on-site rail facility that can simultaneously accommodate multiple unit trains. Our ability to handle multiple rail car sets allows for the efficient transition of locomotives from empty inbound trains to fully loaded outbound trains at our facility.
We believe our customized on-site logistical configuration yields lower overall operating and transportation costs compared to manifest train or single-unit train facilities as a result of our higher rail car utilization, more efficient use of locomotive power and more predictable movement of product between mine and destination. Unit train operations such as ours can double or triple the average number of loads that a rail car carries per year reducing the number of rail cars needed to support our operations thus limiting our exposure to unutilized rail cars and the corresponding storage and lease expense. We believe that our Oakdale facility’s connection to the Canadian Pacific rail network, combined with our unit train logistics capabilities, will provide us enhanced flexibility to serve customers located in shale plays throughout North America. In addition, we have invested in a transloading facility on the Union Pacific rail network in Byron Township, Wisconsin, approximately 3.5 miles from our Oakdale facility. This facility is operational and provides us with the ability to ship directly on the Union Pacific network to locations in the major operating basins in the Western and Southwestern United States, which should facilitate more competitive pricing among our rail carriers. With the addition of this transload facility, we believe we are the only raw frac sand mine in Wisconsin with dual served railroad shipment capabilities on the Canadian Pacific and Union Pacific, which should provide us more competitive logistics options to the market relative to other Wisconsin based sand mining and production facilities.
In addition to the Oakdale facility, our Hixton site consists of approximately 959 acres in Jackson County, Wisconsin. The Hixton site is fully permitted to initiate operations and is available for future development. As of August 2014, our Hixton site had approximately 100 million tons of proven recoverable sand reserves. This location is located on a Class I rail line, the Canadian National.
83
Table of Contents
The following tables provide key characteristics of our Oakdale facility and Hixton site (as of June 30, 2016, unless otherwise stated):
Our Oakdale Facility
| Facility Characteristic |
Description | |
| Site geography |
Situated on 1,196 contiguous acres, with on-site processing and rail loading facilities. | |
| Proven recoverable reserves |
244 million tons. | |
| Probable recoverable reserves |
92 million tons. | |
| Deposits |
Sand reserves of up to 200 feet; grade mesh sizes 20/40, 30/50, 40/70 and 100 mesh. | |
| Proven reserve mix |
Approximately 19% of 20/40 and coarser substrate, 41% of 40/70 mesh substrate and approximately 40% of 100 mesh substrate. Our 30/50 gradation is a derivative of the 20/40 and 40/70 blends. | |
| Excavation technique |
Generally shallow overburden allowing for surface excavation. | |
| Annual processing capacity |
3.3 million tons with the ability to increase to 4.4 million tons within approximately six to nine months. | |
| Logistics capabilities |
Dual served rail line logistics capabilities. On-site transportation infrastructure capable of simultaneously accommodating multiple unit trains and connected to the Canadian Pacific rail network. Additional transload facility located approximately 3.5 miles from the Oakdale facility in Byron Township that provides access to the Union Pacific rail network. | |
| Royalties |
$0.50 per ton sold of 70 mesh and coarser substrate. | |
| Expansion Capabilities |
We believe that with further development and permitting the Oakdale facility could ultimately be expanded to allow production of up to 9 million tons of raw frac sand per year. |
Our Hixton Site
| Facility Characteristic |
Description | |
| Site geography |
Situated on 959 contiguous acres, with access to a Canadian National Class I rail line. | |
| Proven recoverable reserves |
100 million tons. | |
| Deposits |
Sand reserves with an average thickness of 120 feet; grade mesh sizes 20/40, 30/50, 40/70 and 100 mesh. | |
| Proven reserve mix |
Approximately 72% of 70 mesh and coarser substrate and approximately 28% of 100 mesh substrate. | |
| Logistics capabilities |
Planned on-site transportation infrastructure capable of simultaneously accommodating multiple unit trains and connected to the Canadian National rail network. | |
| Royalties |
$0.50 per ton sold of 70 mesh and coarser substrate. |
Our Reserves
We believe that our strategically located Oakdale and Hixton sites provide us with a large and high-quality mineral reserves base. Mineral resources and reserves are typically classified by confidence (reliability) levels based on the level of exploration, consistency and assurance of geologic knowledge of the deposit. This classification system considers different levels of geoscientific knowledge and varying degrees of technical and economic evaluation. Mineral reserves are derived from in situ resources through application of modifying factors, such as mining, analytical, economic, marketing, legal, environmental, social and governmental factors, relative to mining methods, processing techniques, economics and markets. In estimating our reserves, John T. Boyd does not classify a resource as a reserve unless that resource can be demonstrated to have reasonable
84
Table of Contents
certainty to be recovered economically in accordance with the modifying factors listed above. “Reserves” are defined by SEC Industry Guide 7 as that part of a mineral deposit that could be economically and legally extracted or produced at the time of the reserve determination. Industry Guide 7 defines “proven (measured) reserves” as reserves for which (a) quantity is computed from dimensions revealed in outcrops, trenches, workings or drill holes; grade and/or quality are computed from the results of detailed sampling and (b) the sites for inspection, sampling and measurement are spaced so closely and the geologic character is so well defined that size, shape, depth and mineral content of reserves are well-established.
In estimating our reserves, John T. Boyd categorizes our reserves as proven recoverable in accordance with these SEC definitions. According to such definitions, John T. Boyd estimates that we, as of June 30, 2016, had a total of approximately 244 million tons of proven recoverable sand reserves and approximately 92 million tons of probable recoverable sand reserves at our Oakdale facility and approximately 100 million tons of proven recoverable sand reserves at our Hixton site. The quantity and nature of the sand reserves at our Oakdale site are estimated by third-party geologists and mining engineers, and we internally track the depletion rate on an interim basis. Before acquiring new reserves, we perform surveying, drill core analysis and other tests to confirm the quantity and quality of the acquired reserves.
Our Oakdale reserves are located on 1,196 contiguous acres in Monroe County, Wisconsin. We own our Monroe County acreage in fee and acquired surface and mineral rights on all of such acreage from multiple landowners in separate transactions. Our mineral rights are subject to an aggregate non-participating royalty interest of $0.50 per ton sold of coarser than 70 mesh, which we believe is significantly lower than many of our competitors.
In addition to the Oakdale facility, we own the Hixton site that is on approximately 959 acres in Jackson County, Wisconsin. The Hixton site is fully permitted and available for future development. We own our Jackson County acreage in fee and acquired surface and mineral rights on all of such acreage from multiple landowners in separate transactions. Our mineral rights are subject to an aggregate non-participating royalty interest of $0.50 per ton sold of coarser than 70 mesh, which we believe is significantly lower than many of our competitors.
To opine as to the economic viability of our reserves, John T. Boyd reviewed our financial cost and revenue per ton data at the time of the reserve determination. Based on their review of our cost structure and their extensive experience with similar operations, John T. Boyd concluded that it is reasonable to assume that we will operate under a similar cost structure over the remaining life of our reserves. John T. Boyd further assumed that if our revenue per ton remained relatively constant over the life of the reserves, our current operating margins are sufficient to expect continued profitability throughout the life of our reserves.
The cutoff grade used by John T. Boyd in estimating our reserves considers sand that falls between 20 and 140 mesh sizes as proven recoverable reserves, meaning that sands within this range are included in John T. Boyd’s estimate of our proven recoverable. In addition, John T. Boyd’s estimate of our reserves adjusts for mining losses of 10% and processing losses through the wet plant and dry plants, for a total yield of the in-place sand resource. Our processing losses are primarily due to minus 140 mesh sand being removed at the wet processing plant, plus 20 mesh sand being removed in the dry plants (including moisture) through normal attrition and all other material discarded as waste (including clay and other contaminants).
During wet plant processing operations, the wet plant process water leaving the wet plant is pumped into a settling basin for the ultra-fine (minus 140 mesh) sand to settle. The settling basin allows the wet plant process water to flow back to the fresh water pump pond via a canal system to its original starting point. The fresh water pump pond, wet plant, settling basin and canal system complete an enclosed circuit for continuous recycled wet plant process water.
Wet plant process tailings are temporarily piled and/or stored. Tailings are systematically used throughout the mining operation for various purposes such as reclamation, roads and soil stabilization. Dry plant process material discharged during the drying process is temporarily piled and/or stored for various purposes such as reclamation and soil stabilization, and it is commonly recycled through the wet plant process.
85
Table of Contents
Our Oakdale reserves are a mineral resource deposited over millions of years. Approximately 500 million years ago, quartz rich Cambrian sands were deposited in the upper Midwest region of the United States. During the Quaternary era, glaciation and erosion caused by the melting of glaciers removed millions of years of bedrock, to expose the Cambrian sandstone deposit, near the surface. Our deposits are located in an ancient marine setting, which is the reason our deposit is well sorted and rounded. The high quartz content of the Cambrian sands and the monocrystalline structure of our deposits are responsible for the extremely high crush strength relative to other types of sand. The deposit found in our open-pit Oakdale mine and our Hixton site is a Cambrian quartz sandstone deposit that produces high-quality Northern White raw frac sand with a silica content of 99%.
Although crush strength is one of a number of characteristics that define the quality of raw frac sand, it is a key characteristic for our customers and other purchasers of raw frac sand in determining whether the product will be suitable for its desired application. For example, raw frac sand with exceptionally high crush strength is suitable for use in high pressure downhole conditions that would otherwise require the use of more expensive resin-coated or ceramic proppants.
The sand deposit at our formation does not require crushing or extensive processing to eliminate clays or other contaminants, enabling us to cost-effectively produce high-quality raw frac sand meeting API specifications. In addition, the sand deposit is present to a depth of approximately 200 feet, with a generally shallow overburden of less than 10 feet, on average, over the entire property. The shallow depth of the sand deposits allows us to conduct surface mining rather than underground mining, which lowers our production costs and decreases safety risks as compared to underground mining. All of our surface mining is currently conducted utilizing excavators and trucks to deliver sand to the wet plant. We have considered utilizing other mining methods, such as a dredge operation, and may continue evaluating other mining methods from time to time in the future.
Our Oakdale Facility
We began construction of our Oakdale facility in November 2011 and commenced operations in July 2012. Prior to our commencement of operations, we performed surveying, drill core analysis and other tests to confirm the quantity and quality of the reserves. The process was performed with the assistance of John T. Boyd. Before acquiring new acreage in the future, including material additional acreage adjacent to our Oakdale site, we will perform similar procedures.
Our Oakdale wet plant facility is comprised of a steel structure and relies primarily on industrial grade aggregate processing equipment to process up to 3.3 million tons per year of wet sand. Our Oakdale dry plants sit inside insulated metal buildings designed to minimize weather-related effects during winter months. Each building contains one 200 ton per hour propane-or natural gas-fired fluid bed dryer as well as four to six high-capacity mineral separators. Each dryer is capable of producing over 1.1 million tons per year of dry Northern White raw frac sand in varying gradations, including 20/40, 30/50, 40/70 and 100 mesh. For the year ended December 31, 2015, we sold approximately 751,000 tons of raw frac sand and produced approximately 702,000 tons of raw frac sand. All of our sales volumes have historically, and are currently, sold FCA our Oakdale facility. Generally, logistics costs can comprise 60-80% of the delivered cost of Northern White raw frac sand, depending on the basin into which the product is delivered. Some of our competitors’ sales volumes are sold FCA basin.
The surface excavation operations at our Oakdale site are conducted by our employees with leased or purchased heavy equipment. The mining technique at our Oakdale site is open-pit excavation of our silica deposits. The excavation process involves clearing and grubbing vegetation and trees overlying the proposed mining area. The initial shallow overburden is removed and utilized to construct perimeter berms around the pit and property boundary. No underground mines are operated at our Oakdale site. In situations where the sand-bearing geological formation is tightly cemented, it may be necessary to utilize blasting to make the sand easier to excavate.
86
Table of Contents
A track excavator and articulated trucks are utilized for excavating the sand at several different elevation levels of the active pit. The pit is dry mined, and the water elevation is maintained below working level through a dewatering and pumping process. The mined material is loaded and hauled from different areas of the pit and different elevations within the pit to the primary loading facility at our mine’s on-site wet processing facility.
Once processed and dried, sand from our Oakdale facility is stored in one of ten on-site silos with a combined storage capacity of 27,000 tons. In addition to the 27,000 tons of silo capacity, we own approximately seven miles of on-site rail track (in a double-loop configuration) that is connected to the Canadian Pacific rail network and that is used to stage and store empty or recently loaded customer rail cars. Our strategic location adjacent to a Canadian Pacific mainline provides our customers with the ability to transport Northern White raw frac sand from our Oakdale facility to all major unconventional oil and natural gas basins currently producing in the United States. For additional information regarding our transportation logistics and infrastructure, please read “—Transportation Logistics and Infrastructure.”
Our Oakdale facility undergoes regular maintenance to minimize unscheduled downtime and to ensure that the quality of our raw frac sand meets applicable API and ISO standards and our customers’ specifications. In addition, we make capital investments in our facility as required to support customer demand and our internal performance goals. Because raw sand cannot be wet-processed during extremely cold temperatures, our wet plant typically operates only seven to eight months out of the year. Except for planned and unplanned downtime, our dry plants operate year-round.
As of July 31, 2016, we have utilized 135 acres for facilities and mining operations, or only 11.3% of Oakdale location.
Transportation Logistics and Infrastructure
Historically, all of our product has been shipped by rail from our approximately seven-mile on-site rail spur, in a double-loop configuration, that connects our Oakdale facility to a Canadian Pacific mainline. The length of this rail spur and the capacity of the associated product storage silos allow us to accommodate a large number of rail cars. This configuration also enables us to accommodate multiple unit trains simultaneously, which significantly increases our efficiency in meeting our customers’ raw frac sand transportation needs. Unit trains, typically 80 rail cars in length or longer, are dedicated trains chartered for a single delivery destination. Generally, unit trains receive priority scheduling and do not switch cars at various intermediate junctions, which results in a more cost-effective and efficient method of shipping than the standard method of rail shipment. While many of our competitors may be able to handle a single unit train, we believe that our Oakdale facility is one of the few raw frac sand facilities in the industry that is able to simultaneously accommodate multiple unit trains in its rail yard.
The ability to handle multiple rail car sets is particularly important in order to allow for the efficient transition of the locomotive from empty inbound trains to fully-loaded outbound trains at the originating mine. For example, in a “hook-and-haul” operation, inbound locomotive power arriving at the mine unhooks from an empty train and hooks up to a fully loaded unit car train waiting at the rail yard with a turnaround time of as little as two hours. We believe that this type of operation typically yields lower operating and transportation costs compared to manifest train traffic movements as a result of higher rail car utilization, more efficient use of locomotive power and more predictable movement of product between mine and destination. We believe that this is a key differentiator as currently rail cars are in high demand in the industry and hook-and-haul operations can increase the average number of turns per year of a rail car from seven to nine turns per year for manifest train shipments to over 20 turns per year while reducing demand variability for locomotive services. We believe that we are one of the few raw frac sand producers with a facility custom-designed for the specific purpose of delivering raw frac sand to all of the major U.S. oil and natural gas producing basins by an on-site rail facility that can simultaneously accommodate multiple unit trains, a capability that requires sufficient acreage, loading facilities and rail spurs.
87
Table of Contents
In addition, we recently constructed a transload facility on a rail line owned by the Union Pacific in Byron Township, Wisconsin, approximately 3.5 miles from the Oakdale facility. This transload facility will allow us to ship sand directly to our customers on more than one rail carrier. This facility has been operational since June 2016 and should provide increased delivery options for our customers, greater competition among our rail carriers and potentially lower freight costs. With the addition of this transload facility, we believe we are the only mine in Wisconsin with dual served railroad shipment capabilities on the Canadian Pacific and Union Pacific railroads, which should provide us more competitive logistics options to the market relative to other Wisconsin-based sand mining and production facilities.
The logistics capabilities of raw frac sand producers are important to customers, who focus on both the reliability and flexibility of product delivery. Because our customers generally find it impractical to store raw frac sand in large quantities near their job sites, they seek to arrange for product to be delivered where and as needed, which requires predictable and efficient loading and shipping of product. The integrated nature of our logistics operations, our approximate seven-mile on-site rail spur and our ability to ship using unit trains enable us to handle rail cars for multiple customers simultaneously, which:
| • | minimizes the time required to successfully load shipments, even at times of peak activity; |
| • | eliminates the need to truck sand on public roads between the mine and the production facility or between wet and dry processing facilities; and |
| • | minimizes transloading at our Oakdale site, lowers product movement costs and minimizes the reduction in sand quality due to handling. |
In addition, with the transload facility now operational at Byron Township, our Oakdale facility is now dual served and capable of shipping sand directly on the Canadian Pacific and Union Pacific rail lines. Together, these advantages provide our customers with a reliable and efficient delivery method from our facility to each of the major U.S. oil and natural gas producing basins, and allow us to take advantage of the increasing demand for such a delivery method.
We operate in a highly regulated environment overseen by many government regulatory and enforcement bodies. To conduct our mining operations, we are required to obtain permits and approvals from local, state and federal governmental agencies. These governmental authorizations address environmental, land use and safety issues. We have obtained numerous federal, state and local permits required for operations at the Oakdale facility, the Byron Transload Facility and our Hixton mine location. Our current and planned areas for excavation of our Oakdale property are permitted for extraction of our proven reserves. Outlying areas at the edge of our Oakdale property’s boundaries that lie in areas delineated as wetlands will require additional local, state or federal permits prior to mining and reclaiming those areas.
We also meet requirements for several international standards concerning safety, greenhouse gases and rail operations. We have voluntarily agreed to meet the standards of the Wisconsin DNR’s “Green Tier” program and the “Wisconsin Industrial Sand Association.” Further, we have agreed to meet the standards required to maintain our ISO 9001/14001 quality/environmental management system registrations. These voluntary requirements are tracked and managed along with our permits.
While resources invested in securing permits are significant, this cost has not had a material adverse effect on our results of operations or financial condition. We cannot assure that existing environmental laws and regulations will not be reinterpreted or revised or that new environmental laws and regulations will not be adopted or become applicable to us. Revised or additional environmental requirements that result in increased compliance costs or additional operating restrictions could have a material adverse effect on our business.
88
Table of Contents
Our core customers are major oil and natural gas exploration and production and oilfield service companies. These customers have signed long-term take-or-pay contracts, which mitigate our risk of non-performance by such customers. Our contracts provide for a true-up payment in the event the customer does not take delivery of the minimum annual volume of raw frac sand specified in the contract and has not purchased in certain prior periods an amount exceeding the minimum volume, resulting in a shortfall. The true-up payment is designed to compensate us, at least in part, for our margins for the applicable contract year and is calculated by multiplying the contract price (or, in some cases, a discounted contract price ) by the tonnage shortfall. Any sales of the shortfall volumes to other customers on the spot market would provide us with additional margin on these volumes. For the year ended December 31, 2015, EOG Resources, US Well Services, Weatherford and Archer Pressure Pumping accounted for 35.0%, 24.6%, 18.4% and 15.8%, respectively, of our total revenues, and the remainder of our revenues represented sales to seven customers. For the six months ended June 30, 2016, US Well Services, Weatherford, and C&J Energy Services accounted for 37.3%, 32.8% and 17.6%, respectively, of our total revenues, and the remainder of our revenues represented sales to three customers. Beginning January 1, 2017, we will have approximately 1.0 million tons of average annual production (or approximately 30.6% of our current annual production capacity) contracted under long-term take-or-pay contracts, with a volume-weighted average remaining term of approximately 3.7 years. For the year ended December 31, 2015 and the six months ended June 30, 2016, we generated approximately 96.4% and 99.6%, respectively, of our revenues from raw frac sand delivered under long-term take-or-pay contracts. We sell raw frac sand under long-term contracts as well as in the spot market if we have excess production and the spot market conditions are favorable.
Our current contracts include a combination of either fixed prices or market based prices. For fixed price contracts, prices are fixed and subject to adjustment, upward or downward, based upon: (i) certain changes in published producer cost indices, including the Consumer Price Index for All Urban Consumers and the Producer Price Index published by the U.S. Bureau of Labor Statistics; or (ii) market factors, including a natural gas surcharge and/or a propane surcharge which are applied if the Average Natural Gas Price or the Average Quarterly Mont Belvieu TX Propane Spot Price, respectively, as listed by the U.S. Energy Information Administration, are above the benchmark set in the contract for the preceding calendar quarter. Contracts with market based pricing mechanisms allow for our raw frac sand prices to fluctuate within certain negotiated ranges depending on the price of crude oil (based upon the average WTI as listed on www.eia.doe.gov) for the preceding three month period.
Our contracts generally provide that, if we are unable to deliver the contracted minimum volume of raw frac sand, the customer has the right to purchase replacement raw frac sand from alternative sources, provided that our inability to supply is not the result of an excusable delay. In the event that the price of replacement raw frac sand exceeds the contract price and our inability to supply the contracted minimum volume is not the result of an excusable delay, we are responsible for the price difference. At June 30, 2016 and December 31, 2015, we had significant levels of raw frac sand inventory on hand; therefore, the likelihood of any such penalties was considered remote.
Some of our long-term take-or-pay contracts contain provisions that allow our customers to extend the term of the contracts. Some of our customers executed such options to extend existing contracts. Each of our contracts contains a minimum volume purchase requirement and provides for delivery of raw frac sand FCA at our Oakdale facility. Certain of our contracts allow the customer to defer a portion of the annual minimum volume to future contract years, subject to a maximum deferral amount. The mesh size specifications in our contracts vary and include a mix of 20/40, 30/50, 40/70 and 100 mesh raw frac sand. In the event that one or more of our current contract customers decides not to continue purchasing our raw frac sand following the expiration of its contract with us, we believe that we will be able to sell the volume of sand that they previously purchased to other customers through long-term contracts or sales on the spot market.
89
Table of Contents
Our Relationship with Our Sponsor
Our sponsor is a fund managed by Clearlake Capital Group, L.P., which, together with its affiliates and related persons, we refer to as Clearlake. Clearlake is a private investment firm with a sector-focused approach. The firm seeks to partner with world-class management teams by providing patient, long-term capital to dynamic businesses that can benefit from Clearlake’s operational and strategic expertise. The firm’s core target sectors include technology, communications and business services; industrials, energy and power; and consumer products and services. Clearlake currently has over $3.0 billion of assets under management. We believe our relationship with Clearlake provides us with a unique resource to effectively compete for acquisitions within the industry by being able to take advantage of their experience in acquiring businesses to assist us in seeking out, evaluating and closing attractive acquisition opportunities over time.
The proppant industry is highly competitive. Please read “Risk Factors—Risks Inherent in Our Business—We face significant competition that may cause us to lose market share.” There are numerous large and small producers in all sand producing regions of the United States with whom we compete. Our main competitors include Badger Mining Corporation, Emerge Energy Services LP, Fairmount Santrol, Hi-Crush Partners LP, Unimin Corporation and U.S. Silica Holdings, Inc.
Although some of our competitors have greater financial and other resources than we do, we believe that we are competitively well positioned due to our low cost of production, transportation infrastructure and high-quality, balanced reserve profile. The most important factors on which we compete are product quality, performance, sand characteristics, transportation capabilities, reliability of supply and price. Demand for raw frac sand and the prices that we will be able to obtain for our products, to the extent not subject to a fixed price or take-or-pay contract, are closely linked to proppant consumption patterns for the completion of oil and natural gas wells in North America. These consumption patterns are influenced by numerous factors, including the price for hydrocarbons, the drilling rig count and hydraulic fracturing activity, including the number of stages completed and the amount of proppant used per stage. Further, these consumption patterns are also influenced by the location, quality, price and availability of raw frac sand and other types of proppants such as resin-coated sand and ceramic proppant.
Our business is affected to some extent by seasonal fluctuations in weather that impact the production levels at our wet processing plant. While our dry plants are able to process finished product volumes evenly throughout the year, our excavation and our wet sand processing activities are limited to non-winter months. As a consequence, we experience lower cash operating costs in the first and fourth quarter of each calendar year. We may also sell raw frac sand for use in oil and natural gas producing basins where severe weather conditions may curtail drilling activities and, as a result, our sales volumes to those areas may be reduced during such severe weather periods. For a discussion of the impact of weather on our operations, please read “Risk Factors—Seasonal and severe weather conditions could have a material adverse impact on our business, results of operations and financial condition” and “Risk Factors—Our cash flow fluctuates on a seasonal basis.”
We believe that our insurance coverage is customary for the industry in which we operate and adequate for our business. As is customary in the proppant industry, we review our safety equipment and procedures and carry insurance against most, but not all, risks of our business. Losses and liabilities not covered by insurance would increase our costs. To address the hazards inherent in our business, we maintain insurance coverage that includes physical damage coverage, third-party general liability insurance, employer’s liability, business interruption, environmental and pollution and other coverage, although coverage for environmental and pollution-related losses is subject to significant limitations.
90
Table of Contents
Environmental and Occupational Health and Safety Regulations
We are subject to stringent and complex federal, state and local laws and regulations governing the discharge of materials into the environment or otherwise relating to protection of worker health, safety and the environment. Compliance with these laws and regulations may expose us to significant costs and liabilities and cause us to incur significant capital expenditures in our operations. Any failure to comply with these laws and regulations may result in the assessment of administrative, civil and criminal penalties, imposition of remedial obligations, and the issuance of injunctions delaying or prohibiting operations. Private parties may also have the right to pursue legal actions to enforce compliance as well as to seek damages for non-compliance with environmental laws and regulations or for personal injury or property damage. In addition, the clear trend in environmental regulation is to place more restrictions on activities that may affect the environment, and thus, any changes in, or more stringent enforcement of, these laws and regulations that result in more stringent and costly pollution control equipment, the occurrence of delays in the permitting or performance of projects, or waste handling, storage, transport, disposal or remediation requirements could have a material adverse effect on our operations and financial position.
We do not believe that compliance by us and our customers with federal, state or local environmental laws and regulations will have a material adverse effect on our business, financial position or results of operations or cash flows. We cannot assure you, however, that future events, such as changes in existing laws or enforcement policies, the promulgation of new laws or regulations or the development or discovery of new facts or conditions adverse to our operations will not cause us to incur significant costs. The following is a discussion of material environmental and worker health and safety laws, as amended from time to time. that relate to our operations or those of our customers that could have a material adverse effect on our business.
Air Emissions
Our operations are subject to the CAA and related state and local laws, which restrict the emission of air pollutants and impose permitting, monitoring and reporting requirements on various sources. These regulatory programs may require us to install emissions abatement equipment, modify operational practices, and obtain permits for existing or new operations. Obtaining air emissions permits has the potential to delay the development or continued performance of our operations. Over the next several years, we may be required to incur certain capital expenditures for air pollution control equipment or to address other air emissions-related issues. Changing and increasingly stricter requirements, future non-compliance, or failure to maintain necessary permits or other authorizations could require us to incur substantial costs or suspend or terminate our operations.
Climate change
In recent years, the U.S. Congress has considered legislation to reduce emissions of GHGs. It presently appears unlikely that comprehensive climate legislation will be passed by either house of Congress in the near future, although energy legislation and other regulatory initiatives are expected to be proposed that may be relevant to GHG emissions issues. In addition, a number of states are addressing GHG emissions, primarily through the development of emission inventories or regional GHG cap and trade programs. Depending on the particular program, we could be required to control GHG emissions or to purchase and surrender allowances for GHG emissions resulting from our operations. Independent of Congress, the EPA has adopted regulations controlling GHG emissions under its existing authority under the CAA. For example, following its findings that emissions of GHGs present an endangerment to human health and the environment because such emissions contributed to warming of the Earth’s atmosphere and other climatic changes, the EPA has adopted regulations under existing provisions of the CAA that, among other things, establish construction and operating permit reviews for GHG emissions from certain large stationary sources that are already potential major sources for conventional pollutants. In addition, the EPA has adopted rules requiring the monitoring and reporting of GHG emissions from specified production, processing, transmission and storage facilities in the United States on an annual basis. Also, the United States is one of almost 200 nations that, in December 2015, agreed to the Paris
91
Table of Contents
Agreement, an international climate change agreement in Paris, France that calls for countries to set their own GHG emissions targets and be transparent about the measures each country will use to achieve its GHG emissions targets. The agreement was signed in April 2016, and is expected to enter into force in November 2016. The United States is one of over 70 nations having ratified or otherwise consented to be bound by the agreement. Although it is not possible at this time to predict how new laws or regulations in the United States or any legal requirements imposed following the United States’ agreeing to the Paris Agreement that may be adopted or issued to address GHG emissions would impact our business, any such future laws, regulations or legal requirements imposing reporting or permitting obligations on, or limiting emissions of GHGs from, our equipment and operations could require us to incur costs to reduce emissions of GHGs associated with our operations as well as delays or restrictions in our ability to permit GHG emissions from new or modified sources. In addition, substantial limitations on GHG emissions could adversely affect demand for the oil and natural gas we produce. Finally, it should be noted that increasing concentrations of GHGs in the Earth’s atmosphere may produce climate changes that have significant physical effects, such as increased frequency and severity of storms, floods and other climatic events; if any such effects were to occur, they could have an adverse effect on our exploration and production operations.
Water Discharges
The Clean Water Act (“CWA”), and analogous state laws impose restrictions and strict controls with respect to the discharge of pollutants, including spills and leaks of oil and other substances, into state waters or waters of the United States. The discharge of pollutants into regulated waters is prohibited, except in accordance with the terms of a permit issued by the EPA or an analogous state agency. Spill prevention control and countermeasure requirements require containment to mitigate or prevent contamination of navigable waters in the event of an oil overflow, rupture or leak, and the development and maintenance of Spill Prevention Control and Countermeasure, or SPCC, plans at our facilities. The CWA and regulations implemented thereunder also prohibit the discharge of dredge and fill material into regulated waters, including jurisdictional wetlands, unless authorized by the Army Corps of Engineers pursuant to an appropriately issued permit. In addition, the CWA and analogous state laws require individual permits or coverage under general permits for discharges of storm water runoff from certain types of facilities. The EPA has issued final rules attempting to clarify the federal jurisdictional reach over waters of the United States but this rule has been stayed nationwide by the U.S. Sixth Circuit Court of Appeals as that appellate court and numerous district courts ponder lawsuits opposing implementation of the rule. In February 2016, a split three-judge panel of the Sixth Circuit Court of Appeals concluded that it has jurisdiction to review challenges to these final rules and the Sixth Circuit subsequently elected not to review this decision en banc but it is currently unknown whether other federal Circuit Courts or state courts currently considering this rulemaking will place their cases on hold, pending the Sixth Circuit’s hearing of the case. Federal and state regulatory agencies can impose administrative, civil and criminal penalties as well as other enforcement mechanisms for non-compliance with discharge permits or other requirements of the CWA and analogous state laws and regulations.
Hydraulic Fracturing
We supply raw frac sand to hydraulic fracturing operators in the oil and natural gas industry. Hydraulic fracturing is an important and increasingly common practice that is used to stimulate production of natural gas and oil from low permeability hydrocarbon bearing subsurface rock formations. The hydraulic fracturing process involves the injection of water, proppants, and chemicals under pressure into the formation to fracture the surrounding rock, increase permeability and stimulate production. Although we do not directly engage in hydraulic fracturing activities, our customers purchase our raw frac sand for use in their hydraulic fracturing activities. Hydraulic fracturing is typically regulated by state oil and natural gas commissions and similar agencies. Some states have adopted, and other states are considering adopting, regulations that could impose new or more stringent permitting, disclosure or well construction requirements on hydraulic fracturing operations. Aside from state laws, local land use restrictions may restrict drilling in general or hydraulic fracturing in particular. Municipalities may adopt local ordinances attempting to prohibit hydraulic fracturing altogether or, at
92
Table of Contents
a minimum, allow such fracturing processes within their jurisdictions to proceed but regulating the time, place and manner of those processes. In addition, federal agencies have started to assert regulatory authority over the process and various studies have been conducted or are currently underway by the EPA, and other federal agencies concerning the potential environmental impacts and, in some instances, have pursued voter ballot initiatives of hydraulic fracturing activities. At the same time, certain environmental groups have suggested that additional laws may be needed to more closely and uniformly limit or otherwise regulate the hydraulic fracturing process, and legislation has been proposed by some members of Congress to provide for such regulation.
The adoption of new laws or regulations at the federal or state levels imposing reporting obligations on, or otherwise limiting or delaying, the hydraulic fracturing process could make it more difficult to complete natural gas wells, increase our customers’ costs of compliance and doing business, and otherwise adversely affect the hydraulic fracturing services they perform, which could negatively impact demand for our raw frac sand. In addition, heightened political, regulatory, and public scrutiny of hydraulic fracturing practices could expose us or our customers to increased legal and regulatory proceedings, which could be time-consuming, costly, or result in substantial legal liability or significant reputational harm. We could be directly affected by adverse litigation involving us, or indirectly affected if the cost of compliance limits the ability of our customers to operate. Such costs and scrutiny could directly or indirectly, through reduced demand for our raw frac sand, have a material adverse effect on our business, financial condition and results of operations.
Non-Hazardous and Hazardous Wastes
The Resource Conservation and Recovery Act (“RCRA”) and comparable state laws control the management and disposal of hazardous and non-hazardous waste. These laws and regulations govern the generation, storage, treatment, transfer and disposal of wastes that we generate. In the course of our operations, we generate waste that are regulated as non-hazardous wastes and hazardous wastes, obligating us to comply with applicable standards relating to the management and disposal of such wastes. In addition, drilling fluids, produced waters, and most of the other wastes associated with the exploration, development, and production of oil or natural gas, if properly handled, are currently exempt from regulation as hazardous waste under RCRA and, instead, are regulated under RCRA’s less stringent non-hazardous waste provisions, state laws or other federal laws. However, it is possible that certain oil and natural gas drilling and production wastes now classified as non-hazardous could be classified as hazardous wastes in the future. For example, in May 2016, several non-governmental environmental groups filed suit against the EPA in the U.S. District Court for the District of Columbia for failing to timely assess its RCRA Subtitle D criteria regulations for oil and natural gas wastes, asserting that the agency is required to review its Subtitle D regulations every three years but has not conducted an assessment on those oil and natural gas waste regulations since July 1988. A loss of the RCRA exclusion for drilling fluids, produced waters and related wastes could result in an increase in our customers’ costs to manage and dispose of generated wastes and a corresponding decrease in their drilling operations, which developments could have a material adverse effect on our business.
Site Remediation
The CERCLA and comparable state laws impose strict, joint and several liability without regard to fault or the legality of the original conduct on certain classes of persons that contributed to the release of a hazardous substance into the environment. These persons include the owner and operator of a disposal site where a hazardous substance release occurred and any company that transported, disposed of, or arranged for the transport or disposal of hazardous substances released at the site. Under CERCLA, such persons may be liable for the costs of remediating the hazardous substances that have been released into the environment, for damages to natural resources, and for the costs of certain health studies. In addition, where contamination may be present, it is not uncommon for the neighboring landowners and other third parties to file claims for personal injury, property damage and recovery of response costs. We have not received notification that we may be potentially responsible for cleanup costs under CERCLA at any site.
93
Table of Contents
Endangered Species
The Endangered Species Act (“ESA”) restricts activities that may affect endangered or threatened species or their habitats. Similar protections are offered to migratory birds under the Migratory Bird Treaty Act. As a result of a settlement approved by the U.S. District Court for the District of Columbia in 2011, the U.S. Fish and Wildlife Service is required to consider listing numerous species as endangered or threatened under the Endangered Species Act before the completion of the agency’s 2017 fiscal year. Current ESA listings and the designation of previously unprotected species as threatened or endangered in areas where we or our customers operate could cause us or our customers to incur increased costs arising from species protection measures and could result in delays or limitations in our or our customers’ performance of operations, which could adversely affect or reduce demand for our raw frac sand.
Mining and Workplace Safety
Our sand mining operations are subject to mining safety regulation. MSHA is the primary regulatory organization governing raw frac sand mining and processing. Accordingly, MSHA regulates quarries, surface mines, underground mines and the industrial mineral processing facilities associated with and located at quarries and mines. The mission of MSHA is to administer the provisions of the Federal Mine Safety and Health Act of 1977 and to enforce compliance with mandatory miner safety and health standards. As part of MSHA’s oversight, representatives perform at least two unannounced inspections annually for each above-ground facility. To date, these inspections have not resulted in any citations for material violations of MSHA standards. In 2015, we experienced no lost time incidents in our mining facilities.
OSHA has promulgated new rules for workplace exposure to respirable silica for several other industries. Respirable silica is a known health hazard for workers exposed over long periods. The MSHA is expected to adopt similar rules, although they may change as a result of multiple legal challenges against the OSHA rules. Airborne respirable silica is associated with a limited number of work areas at our site and is monitored closely through routine testing and MSHA inspection. If the workplace exposure limit is lowered significantly, we may be required to incur certain capital expenditures for equipment to reduce this exposure. Smart Sand voluntarily adheres to the National Industrial Sand Association’s (NISA) respiratory protection program, and ensures that workers are provided with fitted respirators and ongoing radiological monitoring.
Environmental Reviews
Our operations may be subject to broad environmental review under the National Environmental Policy Act, as amended, (“NEPA”). NEPA requires federal agencies to evaluate the environmental impact of all “major federal actions” significantly affecting the quality of the human environment. The granting of a federal permit for a major development project, such as a mining operation, may be considered a “major federal action” that requires review under NEPA. As part of this evaluation, the federal agency considers a broad array of environmental impacts, including, among other things, impacts on air quality, water quality, wildlife (including threatened and endangered species), historic and archeological resources, geology, socioeconomics, and aesthetics. NEPA also requires the consideration of alternatives to the project. The NEPA review process, especially the preparation of a full environmental impact statement, can be time consuming and expensive. The purpose of the NEPA review process is to inform federal agencies’ decision-making on whether federal approval should be granted for a project and to provide the public with an opportunity to comment on the environmental impacts of a proposed project. Though NEPA requires only that an environmental evaluation be conducted and does not mandate a particular result, a federal agency could decide to deny a permit or impose certain conditions on its approval, based on its environmental review under NEPA, or a third party could challenge the adequacy of a NEPA review and thereby delay the issuance of a federal permit or approval.
State and Local Regulation
We are subject to a variety of state and local environmental review and permitting requirements. Some states, including Wisconsin where our current projects are located, have state laws similar to NEPA; thus our
94
Table of Contents
development of a new site or the expansion of an existing site may be subject to comprehensive state environmental reviews even if it is not subject to NEPA. In some cases, the state environmental review may be more stringent than the federal review. Our operations may require state-law based permits in addition to federal permits, requiring state agencies to consider a range of issues, many the same as federal agencies, including, among other things, a project’s impact on wildlife and their habitats, historic and archaeological sites, aesthetics, agricultural operations, and scenic areas. Wisconsin has specific permitting and review processes for commercial silica mining operations, and state agencies may impose different or additional monitoring or mitigation requirements than federal agencies. The development of new sites and our existing operations also are subject to a variety of local environmental and regulatory requirements, including land use, zoning, building, and transportation requirements.
Demand for raw frac sand in the oil and natural gas industry drove a significant increase in the production of frac sand. As a result, some local communities expressed concern regarding silica sand mining operations. These concerns have generally included exposure to ambient silica sand dust, truck traffic, water usage and blasting. In response, certain state and local communities have developed or are in the process of developing regulations or zoning restrictions intended to minimize dust from becoming airborne, control the flow of truck traffic, significantly curtail the amount of practicable area for mining activities, provide compensation to local residents for potential impacts of mining activities and, in some cases, ban issuance of new permits for mining activities. To date, we have not experienced any material impact to our existing mining operations or planned capacity expansions as a result of these types of concerns. We would expect this trend to continue as oil and natural gas production increases.
In August 2014, we were accepted as a “Tier 1” participant in Wisconsin’s voluntary “Green Tier” program, which encourages, recognizes and rewards companies for voluntarily exceeding environmental, health and safety legal requirements. Successful Tier 1 participants are required to demonstrate a strong record of environmental compliance, develop and implement an environmental management system meeting certain criteria, conduct and submit annual performance reviews to the Wisconsin Department of Natural Resources, promptly correct any findings of non-compliance discovered during these annual performance reviews, and make certain commitments regarding future environmental program improvements. Our most recent annual report required under the Tier 1 protocol was submitted to the Green Tier Program contact on July 28, 2016.
As of July 31, 2016, we employed 97 people. None of our employees are subject to collective bargaining agreements. We consider our employee relations to be good.
From time to time we may be involved in litigation relating to claims arising out of our operations in the normal course of business. We are not currently a party to any legal proceedings that we believe would have a material adverse effect on our financial position, results of operations or cash flows and are not aware of any material legal proceedings contemplated by governmental authorities.
95
Table of Contents
Directors and Executive Officers of Smart Sand, Inc.
The following table sets forth the names, ages and titles of our directors and executive officers. Directors hold office until their successors have been elected or qualified or until their earlier death, resignation, removal or disqualification. Executive officers are appointed by, and serve at the discretion of, the board of directors. The following table shows information for the directors and executive officers as of September 30, 2016.
| Name |
Age | Position with Smart Sand, Inc. | ||
| Charles E. Young |
48 | Chief Executive Officer and Director | ||
| Lee E. Beckelman |
51 | Chief Financial Officer | ||
| Robert Kiszka |
48 | Executive Vice President of Operations | ||
| William John Young |
42 | Executive Vice President of Sales and Logistics | ||
| Susan Neumann |
37 | Vice President of Accounting, Controller and Secretary | ||
| Ronald P. Whelan |
39 | Vice President of Business Development | ||
| José E. Feliciano |
43 | Co-Chairman of the Board | ||
| Colin Leonard |
34 | Director | ||
| Timothy J. Pawlenty |
55 | Director | ||
| Tracy Robinson |
52 | Director | ||
| Sharon Spurlin |
51 | Director | ||
| Andrew Speaker |
53 | Co-Chairman of the Board |
Charles E. Young
Charles E. Young was named Chief Executive Officer in July 2014. Mr. Young has also served as a director since September 2011. Mr. Young founded Smart Sand, LLC (our predecessor) and served as its President from November 2009 to August 2011. Mr. Young served as our President and Secretary from September 2011 to July 2014. Mr. Young has over 20 years of executive and entrepreneurial experience in the high-technology, telecommunications and renewable energy industries. He previously served as the President and Founder of Premier Building Systems, a construction, solar, geothermal and energy audit company in Pennsylvania and New Jersey from 2006 to 2011. Mr. Young received a B.A. in Political Science from Miami University. Mr. Young is the brother of William John Young, our Vice President of Sales and Logistics. We believe that Mr. Young’s industry experience and deep knowledge of our business makes him well suited to serve as Chief Executive Officer and Director.
Lee E. Beckelman
Lee E. Beckelman was named Chief Financial Officer in August 2014. From December 2009 to February 2014, Mr. Beckelman served as Executive Vice President and Chief Financial Officer of Hilcorp Energy Company, an exploration and production company. From February 2008 to October 2009, he served as the Executive Vice President and Chief Financial Officer of Price Gregory Services, Incorporated, a crude oil and natural gas pipeline construction firm until its sale to Quanta Services. Prior thereto, Mr. Beckelman served in various roles from 2002 to 2007 at Hanover Compressor Company, an international oil field service company, until its merger with Universal Compression to form Exterran Holdings. Mr. Beckelman received his BBA in Finance with High Honors from the University of Texas at Austin.
Robert Kiszka
Robert Kiszka was named Executive Vice President of Operations in May 2014. Mr. Kiszka has served as the Vice President of Operations since September 2011. Mr. Kiszka has over 20 years of construction, real estate, renewable energy and mining experience. Prior to joining Smart Sand, Inc., Mr. Kiszka was President of A-1 Bracket Group Inc. from 2005 to 2011 and a member of Premier Building Systems LLC from 2010 to 2011. Mr. Kiszka attended Pedagogical University in Krakow, Poland and Rutgers University.
96
Table of Contents
William John Young
William John Young was named Executive Vice President of Sales and Logistics in October 2016. Mr. Young served as Vice President of Sales and Logistics from May 2014 to September 2016 and Director of Sales from November 2011 to April 2014. Prior to joining Smart Sand, Inc., Mr. Young was Director of Sales for Comcast Corporation from 2002 to 2011. Mr. Young brings over 20 years of experience in the mining, commercial telecommunications and broadband industries. Mr. Young received a BSc in Biology from Dalhousie University. Mr. Young is the brother of Charles E. Young, our Chief Executive Officer and a member of our board of directors.
Susan Neumann
Susan Neumann was named Vice President of Accounting, Controller and Secretary in October 2016. Previously, Ms. Neumann was named Controller and Secretary in April 2013 and July 2014, respectively. Prior to joining Smart Sand, Inc. in April 2013, Ms. Neumann was an assurance senior manager at BDO USA, LLP (“BDO”). At BDO, she served in various roles in the assurance group from September 2000 to March 2013. Ms. Neumann received an MBA with a Global Perspective from Arcadia University in March 2008, and a B.A. in Accounting from Beaver College (currently Arcadia University) in May 2000.
Ronald P. Whelan
Ronald P. Whelan was named Vice President of Business Development in September 2016. Mr. Whelan has also served as Director of Business Development for Smart Sand, Inc. from April 2014 to August 2016 and prior to that he was the Operations Manager responsible for the design, development and production of the Oakdale facility from November 2011 to April 2014. Prior to joining Smart Sand, Mr. Whelan ran his own software design company from 2004 to 2011 and was a member of Premier Building Systems LLC from 2008 to 2009. Mr. Whelan has over 15 years of entrepreneurial experience in mining, technology and renewable energy industries. Mr. Whelan received a B.A. in Marketing from Bloomsburg University and M.S. in Instructional Technology from Bloomsburg University.
José E. Feliciano
José E. Feliciano was appointed co-Chairman of the board of directors in June 2014 and previously served as the sole Chairman of the board of directors from September 2011 to June 2014. Mr. Feliciano is a Managing Partner and Co-Founder of Clearlake which he co-founded in 2006. Mr. Feliciano is responsible for the day-to-day management of Clearlake, and is primarily focused on investments in the industrials, energy and consumer sectors. Mr. Feliciano currently serves, or has served, on the boards of several private companies including AmQuip Crane Rental, Ashley Stewart, Globe Energy Services, Jacuzzi Brands and Sage Automotive. Mr. Feliciano graduated with High Honors from Princeton University, where he received a Bachelor of Science in Mechanical & Aerospace Engineering. He received his Masters of Business Administration from the Graduate School of Business at Stanford University. We believe Mr. Feliciano’s experience as a current and former director of many companies and his financial expertise makes him well qualified to serve on our board of directors.
Colin M. Leonard
Colin M. Leonard was appointed as a member of the board of directors in September 2011. Mr. Leonard is a Principal of Clearlake and joined Clearlake in 2007. Prior to Clearlake, Mr. Leonard was an investment professional at HBK Investments L.P. where he focused on investments in the industrials and transportation/logistics sectors. Mr. Leonard currently serves, or has served, on the boards of several private companies including Globe Energy Services, Jacuzzi Brands and Sage Automotive. Mr. Leonard graduated cum laude with a B.S. in Economics (Wharton School) and a minor in Mathematics at the University of Pennsylvania. We believe Mr. Leonard’s experience as a current and former director of many companies and his financial expertise makes him well qualified to serve on our board of directors.
97
Table of Contents
Timothy J. Pawlenty
Timothy J. Pawlenty was appointed as a member of the board of directors in June 2012. Since November 2012, Mr. Pawlenty has served as President and Chief Executive Officer of Financial Services Roundtable, a leading advocacy organization for America’s financial services industry. From January 2011 to November 2012, Mr. Pawlenty served as an independent contractor. Mr. Pawlenty previously served as Governor of the State of Minnesota for two terms from 2003 to 2011. During his tenure as Governor, Mr. Pawlenty was responsible for overseeing a $60 billion biennial budget and 30,000 employees, and worked closely with state agencies including those dealing with natural resource and transportation issues. Mr. Pawlenty previously served as a director of Digital River, Inc., a company that provides global e-commerce solutions. Mr. Pawlenty served as a member of Digital River’s Audit Committee, Compensation Committee and Nominating and Corporate Governance Committee. Mr. Pawlenty also serves as a director of several privately-held companies. Mr. Pawlenty received a degree in Political Science from University of Minnesota. He also received his law degree from the University of Minnesota. We believe Mr. Pawlenty’s knowledge of our business as well as his legal, regulatory and enterprise oversight experience make him well qualified to serve on our board of directors.
Tracy Robinson
Tracy Robinson was appointed as a member of our board of directors in February 2015. Ms. Robinson holds the position of Vice President, Supply Chain for TransCanada Corporation, a leader in the responsible development and reliable operation of North American energy infrastructure, including natural gas and liquids pipelines, power generation and storage facilities. In her role, Ms. Robinson has overall responsibility for the strategy and execution of sourcing and procurement, including material management, inventory, logistics and payables. Previous to this, Ms. Robinson served as Vice President Transportation, Liquids Pipelines for TransCanada. Prior to joining TransCanada in 2014, Ms. Robinson served as Vice President, Marketing and Sales for Canadian Pacific Railway with responsibility for the Energy and Merchandise team in advancement of the company’s strategy across a broad group of business sectors, accounting for $2.3 billion in annual revenues. Over her 27-year career with Canadian Pacific, Ms. Robinson advanced through positions across the Commercial, Operations and Finance area, most recently including Vice President Marketing and Sales, Vice President and Treasurer and General Manager, Operations. Ms. Robinson received her Masters of Business Administration from the University of Pennsylvania’s Wharton School of Business and her Bachelor of Commerce Degree from the University of Saskatchewan. She serves on the Dean’s Advisory Council of the Edwards School of Business at the University of Saskatchewan. Ms. Robinson also serves on the Board of the Canadian Energy Pipeline Association (CEPA) Foundation and represents TransCanada at the Interstate Natural Gas Association of America (INGAA) Foundation. We believe that Ms. Robinson’s extensive experience and industry knowledge relating to railways, logistics and transportation make her well qualified to serve on our board of directors.
Andrew Speaker
Andrew Speaker was appointed co-Chairman of our board of directors in June 2014. He was appointed as a director in September 2011. Mr. Speaker served as our Chief Executive Officer from April 2011 to June 2014. Since June 2014, Mr. Speaker has continued to work on special projects for us. Prior to joining Smart Sand, Inc., Mr. Speaker was the President and Chief Executive Officer of Mercer Insurance Group, Inc. and its subsidiaries since 2000. At Mercer, Mr. Speaker held various offices including Chief Financial Officer and Chief Operating Officer. Since June 2015, Mr. Speaker also has served as a director of a privately-held company. Mr. Speaker received a BS in Accounting from LaSalle University. We believe that Mr. Speaker’s industry experience and deep knowledge of our business make him well qualified to serve on our board of directors.
Sharon Spurlin
Sharon Spurlin was appointed as a member of our board of directors in February 2015. Ms. Spurlin is a finance executive with more than 25 years of experience leading various finance functions. Ms. Spurlin currently
98
Table of Contents
is the Vice President and Treasurer of Plains All American Pipeline, L.P. (“PAA”) and is responsible for financial planning activities, customer credit functions, insurance risk management, foreign exchange and interest rate management activities and coordination of banking transactions and lending arrangements. Prior to joining PAA in October 2014, Ms. Spurlin was Sr. Vice President and CFO of PetroLogistics from 2012 to 2014 where she held a lead role in PetroLogistics’ initial public offering as a master limited partnership. In addition, Ms. Spurlin held various positions with other privately owned PetroLogistics entities from 2009 to 2014. Ms. Spurlin was also elected to the board of AdvanSix Inc. in October 2016 in connection with its spin-off from Honeywell International Inc. We believe that Ms. Spurlin’s industry experience and deep knowledge of our business make her well qualified to serve on our board of directors.
Committees of the Board of Directors
The board of directors will have an audit committee, a compensation committee and a nominating and corporate governance committee, and may have such other committees as the board of directors shall determine from time to time.
Audit Committee
Our audit committee will be comprised of Sharon Spurlin (Chair), Timothy J. Pawlenty and Tracy Robinson, all of whom meet the independence standards established by the NASDAQ and the Exchange Act. Our audit committee will assist the board of directors in its oversight of the integrity of our financial statements and our compliance with legal and regulatory requirements and corporate policies and controls. Our audit committee will have the sole authority to retain and terminate our independent registered public accounting firm, approve all auditing services and related fees and the terms thereof, and pre-approve any non-audit services to be rendered by our independent registered public accounting firm. Our audit committee will also be responsible for confirming the independence and objectivity of our independent registered public accounting firm. Our independent registered public accounting firm will be given unrestricted access to our audit committee.
Compensation Committee
Our compensation committee will be comprised of José E. Feliciano (Chair), Timothy J. Pawlenty and Tracy Robinson, all of whom meet the independence standards established by the NASDAQ and the Exchange Act. This committee will establish salaries, incentives and other forms of compensation for officers and directors. The compensation committee will also administer our long-term incentive plan.
Nominating and Corporate Governance Committee
Our nominating and corporate governance committee will be comprised of Colin M. Leonard (Chair) and Tracy Robinson, all of whom meet the independence standards established by the NASDAQ and the Exchange Act. The nominating and corporate governance committee is responsible for making recommendations to the board of directors regarding candidates for directorships and the size and composition of the board. In addition, the nominating and corporate governance committee is responsible for overseeing our corporate governance guidelines and reporting and making recommendations to the board concerning corporate governance matters.
Compensation Committee Interlocks and Insider Participation
None of our executive officers serve on the board of directors or compensation committee of a company that has an executive officer that serves on our board or compensation committee. No member of our board is an executive officer of a company in which one of our executive officers serves as a member of the board of directors or compensation committee of that company.
99
Table of Contents
In connection with this offering, we will enter into a stockholders agreement with Clearlake and Keystone Cranberry, LLC (the entity through which our Chief Executive Officer beneficially owns substantially all of his shares of our common stock) pursuant to which our board of directors will be comprised of seven members upon the completion of this offering. Our board of directors will initially include (i) three designees of Clearlake and (ii) two designees of our Chief Executive Officer. Each of our Principal Stockholders will separately retain the right to designate nominees to our board of directors subject to the maintenance of certain ownership thresholds in our company. See “Certain Relationships and Related Party Transactions—Stockholders Agreement.”
Following the closing of this offering, our board of directors will be divided into three classes. The members of each class will serve staggered, three-year terms (other than with respect to the initial terms of the Class I and Class II directors, which will be one and two years, respectively). Upon the expiration of the term of a class of directors, directors in that class will be elected for three-year terms at the annual meeting of stockholders in the year in which their term expires. Following the completion of this offering:
| • | Timothy J. Pawlenty and Sharon Spurlin will be Class I directors, whose initial terms will expire at the 2017 annual meeting of stockholders; |
| • | Colin Leonard and Andrew Speaker will be Class II directors, whose initial terms will expire at the 2018 annual meeting of stockholders; and |
| • | José E. Feliciano, Charles E. Young and Tracy Robinson will be Class III directors, whose initial terms will expire at the 2019 annual meeting of stockholders. |
Our board of directors has determined that Timothy J. Pawlenty, Sharon Spurlin, Tracy Robinson, José E. Feliciano and Colin Leonard are independent under NASDAQ listing standards.
Our corporate governance guidelines will provide that the board of directors is responsible for reviewing the process for assessing the major risks facing us and the options for their mitigation. This responsibility will be largely satisfied by our audit committee, which is responsible for reviewing and discussing with management and our independent registered public accounting firm our major risk exposures and the policies management has implemented to monitor such exposures, including our financial risk exposures and risk management policies.
100
Table of Contents
This executive compensation disclosure provides an overview of the executive compensation program for the named executive officers identified below. For the year ended December 31, 2015, our named executive officers, or the NEOs, were:
| • | Charles E. Young, Chief Executive Officer; |
| • | Lee E. Beckelman, Chief Financial Officer; and |
| • | Robert Kiszka, Executive Vice President of Operations. |
Summary Compensation Table For 2015
The following table sets forth certain information with respect to the compensation paid to our NEOs for the year ended December 31, 2015. The amounts shown below include all compensation paid to these individuals for services in 2015.
| Name and principal position |
Year | Salary ($) | All other compensation ($) |
Total ($) | ||||||||||||
| Charles E. Young |
2015 | 498,077 | 210,590 | (1) | 708,667 | |||||||||||
| Chief Executive Officer |
||||||||||||||||
| Lee E. Beckelman |
2015 | 298,846 | 11,944 | (2) | 310,790 | |||||||||||
| Chief Financial Officer |
||||||||||||||||
| Robert Kiszka. |
2015 | 373,557 | 23,483 | (3) | 397,040 | |||||||||||
| Executive Vice President of Operations |
||||||||||||||||
| (1) | Amount shown represents costs associated with providing Mr. Young use of a company-owned automobile ($3,952), employer contributions made under our 401(k) Plan ($15,274) and relocation cost reimbursement ($191,364). |
| (2) | Amount shown represents Mr. Beckelman’s employer contributions made under our 401(k) Plan ($11,944). |
| (3) | Amount shown represents costs associated with providing Mr. Kiszka use of a company-owned automobile ($6,541) and employer contributions made under our 401(k) Plan ($16,942). |
Narrative Disclosure to Summary Compensation Table
We provide compensation to our executives, including our NEOs, in the form of base salaries, annual cash incentive awards and participation in various employee benefit plans and arrangements, including participation in a qualified 401(k) retirement plan and health and welfare benefits on the same basis as offered to other full-time employees.
Base Salaries
We pay our NEOs a base salary to compensate them for the satisfactory performance of services rendered to our company. The base salary payable to each NEO is intended to provide a fixed component of compensation reflecting the executive’s skill set, experience and responsibilities and has historically been set at levels deemed necessary to attract and retain individuals with superior talent.
Our NEOs’ base salaries for 2015 were $500,000 for Mr. Young, $300,000 for Mr. Beckelman and $375,000 for Mr. Kiszka. None of our NEOs received any base salary increases in 2015. In December 2015, due to market conditions generally affecting our industry, our NEO’s, with the support of the board of directors, determined to reduce their base salary amounts by 10% each. In September 2016 the compensation committee of our board of directors determined to reinstate the base salary amounts of our executives, including our NEOs, effective January 1, 2017.
101
Table of Contents
Performance Bonuses
We offer our NEOs the opportunity to earn annual cash incentive awards to compensate them for attaining short-term company or individual performance goals. Each NEO has an annual target bonus that is expressed as a percentage of his annual base salary. The target bonus percentages for our NEOs for 2015 were 100% of base salary for Mr. Young, 50% of base salary for Mr. Beckelman and 50% of base salary for Mr. Kiszka.
Our annual cash incentive awards have historically been determined by the compensation committee of our board of directors on a discretionary basis. In making individual bonus decisions, the compensation committee does not rely on predetermined financial performance targets or metrics. Instead, determinations regarding annual cash incentive awards are based on a subjective assessment of individual and company performance. For 2015, our compensation committee determined not to award any discretionary bonuses to our NEOs.
Pursuant to a letter agreement with Mr. Beckelman entered into in connection with his commencement of employment, Mr. Beckelman is entitled to receive a one-time bonus of $300,000 following the consummation of this offering.
Equity Compensation
In 2014, we granted shares of restricted stock to each of Mr. Beckelman and Mr. Kiszka as the long-term incentive component of their compensation. The restricted shares were granted under our 2012 Equity Incentive Plan, or the 2012 Plan, and vest in equal installments over a period of four (4) years for Mr. Beckelman or five (5) years for Mr. Kiszka, subject to continued employment through the applicable vesting date and accelerated vesting upon a change in control of us.
None of our NEOs received awards or grants of equity during 2015. In connection with this offering, we intend to adopt a 2016 Omnibus Incentive Plan, or the 2016 Plan, to facilitate the grant of cash and equity incentives to our directors, employees (including our NEOs) and consultants and to enable our company to obtain and retain the services of these individuals, which we believe is essential to our long-term success. Following the effective date of our 2016 Plan, we will not make any further grants under our 2012 Plan. However, the 2012 Plan will continue to govern the terms and conditions of the outstanding awards granted under it. For additional information about the 2016 Plan and the 2012 Plan, please read “Incentive Compensation Plans” below.
Retirement, Health, Welfare and Additional Benefits
Our NEOs are eligible to participate in our employee benefit plans and programs, including medical and dental benefits, long-term care benefits, and short- and long-term disability and life insurance, to the same extent as our other full time employees, subject to the terms and eligibility requirements of those plans. We sponsor a 401(k) defined contribution plan in which our NEOs may participate, subject to limits imposed by the Code, to the same extent as our other full time employees. Currently, we match 100% of contributions made by participants in the 401(k) plan, up to 3% of eligible compensation, and 50% of contributions made between 3% and 5% of eligible compensation. Matching contributions are fully vested when made. Our NEOs are also entitled to certain perquisites, including relocation cost reimbursements and use of company-owned automobiles, as set forth in the Summary Compensation Table above.
102
Table of Contents
Outstanding Equity Awards at December 31, 2015
The following table sets forth the outstanding equity awards held by our NEOs as of December 31, 2015.
| Stock awards | ||||||||
| Name |
Number of shares that have not vested (#) |
Market value of shares that have not vested ($)(3) |
||||||
| Charles E. Young. |
— | — | ||||||
| Lee E. Beckelman |
57,200 | (1) | 220,064 | |||||
| Robert Kiszka. |
61,600 | (2) | 236,992 | |||||
| (1) | The restricted shares vest in substantially equal installments on each of August 11, 2016, 2017 and 2018, subject to Mr. Beckelman’s continued employment on the applicable vesting date and accelerated vesting upon a change in control. |
| (2) | The restricted shares vest in substantially equal installments on June 10, 2016, 2017, 2018 and 2019, subject to Mr. Kiszka’s continued employment on the applicable vesting date and accelerated vesting upon a change in control. |
| (3) | Amount shown is based on the fair value of our common stock as of December 31, 2015, as determined by a third party valuation firm. |
Executive Employment Agreements
We have entered into employment agreements with each of Messrs. Young and Kiszka. Certain key terms of these agreements are described below. We have not entered into a current employment agreement with Mr. Beckelman.
Messrs. Young and Kiszka
We entered into employment agreements with Messrs. Young and Kiszka in September 2011, and these agreements were amended in 2014. As amended, Mr. Young’s employment agreement is for a term that will end on May 15, 2017, and Mr. Kiszka’s employment agreement was for an initial term that expired on May 15, 2016, but has renewed for at least one additional year. The agreements automatically renew for successive one-year periods unless thirty (30) days’ notice of non-renewal is delivered by either party. The agreements entitle the executives to an annual base salary, an annual bonus and participation in the benefit plans maintained by us from time to time.
If the employment of Messrs. Young or Kiszka terminates due to death or disability, then he or his estate, as applicable, will be entitled to receive an amount equal to six months of base salary, payable in monthly installments until the earlier to occur of (i) six months following the date of death or termination due to disability or (ii) February of the calendar year immediately following the year of death or termination due to disability, with the remaining amount payable in a lump sum. If the employment of Messrs. Young or Kiszka is terminated by us without cause or he resigns for good reason, then he will be entitled to receive an amount equal to 12 months of base salary, payable in monthly installments until the earlier to occur of (i) 12 months or (ii) February of the calendar year immediately following the year of termination, with the remaining amount payable in a lump sum. Receipt of payments upon termination due to disability, by us without cause or due to resignation for good reason is conditioned upon Messrs. Young and Kiszka signing a release of claims in our favor. In addition, Messrs. Young and Kiszka are subject to a 12-month non-competition and non-solicitation period following termination of employment for any reason.
For purposes of the employment agreements, “cause” is generally defined as (i) repeated failure by the executive to perform his duties, (ii) executive’s conviction or entry of a plea of nolo contendere for fraud,
103
Table of Contents
misappropriation or embezzlement, or any felony or crime of moral turpitude, (iii) willful material violation of a policy which is directly and materially injurious to the company or (iv) executive’s material breach of the employment agreement; in the case of items (i), (iii) or (iv), subject to notice and a 30-day cure period. “Good reason” is generally defined as (i) material diminution by the company of executive’s authority, duties and responsibilities, which change would cause executive’s position to become one of less responsibility, importance and scope or (ii) material reduction by the company of base salary, unless such reduction is a result of a reduction of salaries to all employees and is no greater than the average of the salary reductions imposed on other employees; in each case, subject to notice and a 30-day cure period.
Benefits Upon a Change in Control
The agreements governing Messrs. Beckelman’s and Kiszka’s restricted shares provide for full accelerated vesting of any unvested portion of the award in connection with a change in control.
The following summarizes the material terms of the incentive compensation plans in which our employees, including the NEOs, participate.
2016 Omnibus Incentive Plan
In connection with this offering, we intend to adopt and ask our stockholders to approve the 2016 Omnibus Incentive Plan, or the 2016 Plan, under which we may grant cash and equity-based incentive awards to eligible service providers in order to attract, retain and motivate the persons who make important contributions to our company. The material terms of the 2016 Plan are summarized below.
Eligibility and Administration
Our employees, consultants and directors, and employees and consultants of our subsidiaries, will be eligible to receive awards under the 2016 Plan. The 2016 Plan will be administered by the compensation committee of the board of directors, which may delegate its duties and responsibilities to one or more officers, agents or advisors as provided in the 2016 Plan (referred to collectively as the plan administrator below), subject to the limitations imposed under the 2016 Plan, Section 16 of the Exchange Act, stock exchange rules and other applicable laws, or a sub-committee thereof or any other committee designated by the board of directors. The plan administrator will have the authority to take all actions and make all determinations under the 2016 Plan, to interpret the 2016 Plan and award agreements and to adopt, amend and repeal rules for the administration of the 2016 Plan as it deems advisable. The plan administrator will also have the authority to determine which eligible service providers receive awards, grant awards and set the terms and conditions of all awards under the 2016 Plan, including any vesting and vesting acceleration provisions, subject to the conditions and limitations in the 2016 Plan.
Shares Available for Awards
The aggregate number of shares of our common stock that will initially be available for issuance under the 2016 Plan is equal to the sum of (i) 3,563,762 shares and (ii) any shares of common stock which as of the effective date of the 2016 Plan are subject to awards granted under the 2012 Plan that are forfeited, expire or otherwise terminate without the issuance of shares. No more than 3,563,762 shares of common stock may be issued under the 2016 Plan upon the exercise of incentive stock options.
If an award under the 2016 Plan or the 2012 Plan expires, lapses or is terminated, exchanged for cash, canceled without having been fully exercised or forfeited, any unused shares subject to the award will, as applicable, become or again be available for new grants under the 2016 Plan. Any shares of common stock repurchased on the open market using the proceeds from the exercise of an award under the 2016 Plan will not increase the number of shares available under the 2016 Plan.
104
Table of Contents
In addition, the maximum aggregate grant date fair value, as determined in accordance with FASB ASC Topic 718 (or any successor thereto), of awards granted to any non-employee director for services as a director pursuant to the 2016 Plan during any fiscal year may not exceed $600,000 (or, in the fiscal year of any director’s initial service, $1,000,000). The plan administrator may, however, make exceptions to such limit on director compensation in extraordinary circumstances, subject to the limitations in the 2016 Plan.
Awards
The 2016 Plan provides for the grant of stock options, including incentive stock options, or ISOs, and nonqualified stock options, or NSOs, stock appreciation rights, or SARs, restricted stock, dividend equivalents, restricted stock units, or RSUs, performance awards, performance cash awards and other stock or cash based awards. Certain awards under the 2016 Plan may constitute or provide for payment of “nonqualified deferred compensation” under Section 409A of the Code. All awards under the 2016 Plan will be set forth in award agreements, which will detail the terms and conditions of awards, which may include any applicable vesting and payment terms and post-termination exercise limitations. A brief description of each award type follows.
| • | Stock Options and SARs. Stock options provide for the purchase of shares of our common stock in the future at an exercise price set on the grant date. ISOs, by contrast to NSOs, may provide tax deferral beyond exercise and favorable capital gains tax treatment to their holders if certain holding period and other requirements of the Code are satisfied. SARs entitle their holder, upon exercise, to receive from us an amount equal to the appreciation of the shares subject to the award between the grant date and the exercise date. The plan administrator will determine the number of shares covered by each option and SAR, the exercise price of each option and SAR and the conditions and limitations applicable to the exercise of each option and SAR. The exercise price of a stock option or SAR will not be less than 100% of the fair market value of the underlying share on the grant date (or 110% in the case of ISOs granted to certain significant stockholders). The term of a stock option or SAR may not be longer than ten years (or five years in the case of ISOs granted to certain significant stockholders). |
| • | Restricted Stock and RSUs. Restricted stock is an award of nontransferable shares of our common stock that remain forfeitable unless and until specified conditions are met and which may be subject to a purchase price. RSUs are contractual promises to deliver shares of our common stock in the future, which may also remain forfeitable unless and until specified conditions are met and may be accompanied by the right to receive the equivalent value of dividends paid on shares of our common stock prior to the delivery of the underlying shares. The plan administrator may provide that the delivery of the shares underlying RSUs will be deferred on a mandatory basis or at the election of the participant. The terms and conditions applicable to restricted stock and RSUs will be determined by the plan administrator, subject to the conditions and limitations contained in the 2016 Plan. |
| • | Performance Awards. Performance awards are awards of cash, shares of our common stock, or a combination thereof, as determined by the plan administrator, that may be granted under the 2016 Plan based upon the achievement of one or more performance goals or other objectives over a specified performance period. The terms and conditions applicable to performance awards will be determined by the plan administrator, subject to the conditions and limitations contained in the 2016 Plan. |
| • | Performance Cash Awards. Performance cash awards are awards denominated in cash in such amounts and upon such terms as the plan administrator may determine, which may be based on the achievement of specified performance goals over a performance period. |
| • | Other Stock or Cash Based Awards. Other stock based awards are awards of cash, fully vested shares of our common stock and other awards valued wholly or partially by referring to, or otherwise based on, shares of our common stock or other property. Other cash based awards are awards denominated and paid in cash. The plan administrator will determine the terms and conditions of other stock or cash based awards, which may include any purchase price, performance goal, transfer restrictions and vesting conditions. |
105
Table of Contents
Performance Measures
The plan administrator may select performance measures for an award to establish performance goals for a performance period. Performance measures under the 2016 Plan may include, but are not limited to, the following: net earnings (either before or after one or more of the following: interest, taxes, depreciation, depletion and/or accretion, amortization, non-cash equity-based compensation expense, gain or loss on sale of assets, financing costs, development costs, non-cash charges, unusual or nonrecurring charges and gain or loss on extinguishment of debt); gross or net sales or revenue or sales or revenue growth; net income (either before or after taxes); adjusted net income; operating earnings or profit; cash flow (including, but not limited to, operating cash flow and free cash flow); return on assets; return on capital; return on stockholders’ equity; total stockholder return; return on sales; gross or net profit or operating margin; costs (including, but not limited to, production costs); funds from operations; expenses; working capital; earnings per share; adjusted earnings per share; price per share; regulatory body approval for commercialization of a product; implementation or completion of critical projects; market share; economic value; debt levels or reduction; sales-related goals; comparisons with other stock market indices; operating efficiency; financing and other capital raising transactions; recruiting and maintaining personnel; year-end cash; customer service; and marketing initiatives, any of which may be measured either in absolute terms or on a per share, per ton, per product, per customer/prospect, per employee, or any other similar basis or as compared to any incremental increase or decrease. Such performance goals also may be based solely by reference to the company’s performance or the performance of a subsidiary, division, business segment or business unit of the company or a subsidiary, or based upon performance relative to performance of other companies or upon comparisons of any of the indicators of performance relative to performance of other companies. When determining performance goals, the plan administrator may provide for the inclusion or exclusion of the impact of an event or occurrence which the plan administrator determines should appropriately be included or excluded, including, without limitation, non-recurring charges or events, acquisitions or divestitures, changes in the corporate or capital structure, events unrelated to the business or outside of the control of management, foreign exchange considerations, and legal, regulatory, tax or accounting changes.
Certain Transactions
In the event of a change in control in which outstanding awards under the 2016 Plan are not assumed or substituted, then prior to the change in control (i) all outstanding options and SARs will become immediately exercisable in full and will terminate upon consummation of the change in control; (ii) all restrictions and vesting requirements applicable to any award based solely on the continued service of the participant will terminate; and (c) all awards, the vesting or payment of which are based on performance goals, will vest as though such performance goals were achieved at target. Notwithstanding the foregoing, in connection with a change in control, the plan administrator may determine that outstanding stock-based awards granted under the 2016 Plan, whether or not exercisable or vested, will be canceled and terminated in exchange for a cash payment (or the delivery of shares, other securities or a combination of cash, shares and securities) equal to the difference, if any, between the consideration to be received by company stockholders in respect of a share of common stock in connection with such change in control and the purchase price per share, if any, under the award, multiplied by the number of shares of common stock subject to such award. In addition, in the event of certain non-reciprocal transactions with our stockholders, the plan administrator will make equitable adjustments to the 2016 Plan and outstanding awards as it deems appropriate to reflect the transaction.
Plan Amendment and Termination
Our board of directors may terminate the 2016 Plan at any time and the plan administrator may amend the 2016 Plan at any time; however, no amendment, other than an amendment that increases the number of shares available under the 2016 Plan, may adversely affect an award outstanding under the 2016 Plan without the consent of the affected participant, and stockholder approval will be obtained for any amendment to the extent necessary to comply with applicable laws. Further, the plan administrator cannot, without the approval of our stockholders, amend any outstanding stock option or SAR to reduce its price per share. The 2016 Plan will
106
Table of Contents
remain in effect until the day before the tenth anniversary of the date it was initially approved by our board of directors, unless earlier terminated by our board of directors. No awards may be granted under the 2016 Plan after its termination.
Foreign Participants, Claw-Back Provisions, Transferability and Participant Payments
The plan administrator may modify awards granted to participants who are foreign nationals or employed outside the United States or establish subplans or procedures to address differences in laws, rules, regulations or customs of such foreign jurisdictions. All awards will be subject to any company claw-back policy as set forth in such claw-back policy or the applicable award agreement. Except as expressly provided in the 2016 Plan or in an award agreement, awards under the 2016 Plan are generally non-transferrable, except by will or the laws of descent and distribution and are generally exercisable only by the participant. With regard to exercise price obligations arising in connection with the exercise of options under the 2016 Plan, such amounts must be paid in cash (including check, bank draft or money order), except that the plan administrator may allow such payments to be made by tender of a broker exercise notice, tender of previously acquired shares of our common stock, net exercise, a combination of such methods or any other method approved by the plan administrator. With regard to tax withholding obligations arising in connection with awards under the 2016 Plan, the plan administrator may permit or require such withholding obligations to be satisfied through the withholding of shares underlying an award, tender of previously acquired shares, delivery of a broker exercise notice, or a combination of such methods.
2012 Plan
Our board of directors and stockholders have approved the 2012 Plan, under which we have granted shares of restricted stock. We previously reserved a total of 880,000 shares of our common stock for issuance under the 2012 Plan.
Following the effectiveness of the 2016 Plan, we will not make any further grants under the 2012 Plan. However, the 2012 Plan will continue to govern the terms and conditions of outstanding awards granted under it. Shares of our common stock subject to awards granted under the 2012 Plan that are forfeited, lapse unexercised or are settled in cash and which following the effective date of the 2016 Plan are not issued under the 2012 Plan will be available for issuance under the 2016 Plan.
Administration
The 2012 Plan is administered by our board of directors, or a committee of the board to the extent the board has delegated its authority under the 2012 Plan to a committee. The board has authority to issue awards under the 2012 Plan; to adopt, alter and repeal administrative rules, guidelines and practices governing the 2012 Plan; to establish the terms of awards granted under the 2012 Plan; to interpret the terms of the 2012 Plan and any awards granted thereunder; and to otherwise supervise the administration of the 2012 Plan. The board may correct any defect, supply any omission or reconcile any inconsistency in the 2012 Plan or in any outstanding award in the manner and to the extent it deems necessary to carry out the intent of the 2012 Plan. Following the effectiveness of this offering, we expect that the board of directors will delegate its general administrative authority under the 2012 Plan to its compensation committee.
Types of Awards
The 2012 Plan provides for the grant of stock options and restricted stock awards to employees, consultants and directors or other service providers of the company or its affiliates. As of the date of this prospectus, awards of restricted stock are outstanding under the 2012 Plan.
107
Table of Contents
Certain Transactions
In the event of certain events or transactions affecting our common stock, including a recapitalization, stock split or combination, or stock dividend, the 2012 Plan and outstanding awards may be adjusted with respect to the number, type and issuer of securities, as determined by the board of directors. In the event of a change in control, the board may take one or more of the following actions in its discretion: (i) cause any or all outstanding awards to become vested or non-forfeitable, in whole or in part; (ii) cancel any award in exchange for an award in the successor corporation; or (iii) cancel outstanding awards for cash or other consideration.
Amendment and Termination
The board of directors may amend, alter or terminate the 2012 Plan at any time, provided that, except with respect to actions that may be taken by the board in connection with a change in control as described above, no alteration, amendment or discontinuation of the 2012 Plan may impair the rights of a holder of an outstanding award without the holder’s consent. Any amendment that increases the total number of shares reserved for issuance under the 2012 Plan or changes the persons or class of persons eligible to receive awards under the 2012 Plan must be approved by our stockholders.
2016 Employee Stock Purchase Plan
In connection with this offering, we intend to adopt and ask our stockholders to approve the 2016 Employee Stock Purchase Plan, or the 2016 ESPP. The material terms of the 2016 ESPP are summarized below.
Shares available for Awards; Administration
A total of 3,563,762 shares of our common stock are initially reserved for issuance under the 2016 ESPP and no more than 3,563,762 shares of our common stock may be issued on each purchase date under the 2016 ESPP. The number of shares available for issuance under the 2016 ESPP is subject to adjustment in certain events, as described below.
The compensation committee of our board of directors, or a subcommittee thereof, has authority to interpret the terms of the 2016 ESPP and determine the eligibility of participants. The compensation committee may delegate its duties, power and authority under the 2016 ESPP to any officers of the company in accordance with the terms of the 2016 ESPP.
Eligibility
Our employees are eligible to participate in the 2016 ESPP if they are customarily employed by us or a participating subsidiary for more than 20 hours per week and more than five months in any calendar year. However, an employee may not be granted rights to purchase stock under our 2016 ESPP if such employee, immediately after the grant, would own (directly or through attribution) stock possessing 5% or more of the total combined voting power or value of all classes of our common or other class of stock.
Grant of Rights
The 2016 ESPP is intended to qualify under Section 423 of the Code and stock will be offered under the 2016 ESPP during offering periods. The length of the offering periods under the 2016 ESPP will be determined by the plan administrator and may be up to 27 months long. Employee payroll deductions will be used to purchase shares on each purchase date during an offering period. The purchase dates for each offering period will be the final trading day in the offering period. Offering periods under the 2016 ESPP are initially intended to continue for six months and will commence on January 1 and July 1 of each year, except that the first offering period under the 2016 ESPP will commence and terminate when determined by the plan administrator. The plan administrator may, in its discretion, modify the terms of future offering periods.
108
Table of Contents
The 2016 ESPP permits participants to purchase common stock through payroll deductions of up to 20% of their eligible compensation, which includes a participant’s gross base compensation for services to us, including commissions that are included in regular compensation, amounts that would have constituted compensation but for a participant’s election to defer or reduce compensation pursuant to any deferred compensation, cafeteria, capital accumulation or any other similar plan of the company, and overtime and shift premiums, but excluding all other amounts such as amounts attributable to stock-based, cash-based and other incentive compensation and bonuses. The plan administrator will establish a maximum number of shares that may be purchased by a participant during any offering period, which, in the absence of a contrary designation, will be 1,000 shares. In addition, no employee will be permitted to accrue the right to purchase stock under the 2016 ESPP at a rate in excess of $25,000 worth of shares during any calendar year during which such a purchase right is outstanding (based on the fair market value per share of our common stock as of the first day of the offering period).
On the first trading day of each offering period, each participant will automatically be granted an option to purchase shares of our common stock. The option will expire at the end of the applicable offering period, and will be exercised at that time to the extent of the payroll deductions accumulated during the offering period. The purchase price of the shares, in the absence of a contrary designation, will be 85% of the lower of the fair market value of our common stock on the first trading day of the offering period or on the purchase date, which will be the final trading day of the offering period. Participants may voluntarily end their participation in the 2016 ESPP at any time prior to the end of the applicable offering period, and will be paid their accrued payroll deductions that have not yet been used to purchase shares of common stock. Participation ends automatically upon a participant’s termination of employment.
A participant may not transfer rights granted under the 2016 ESPP other than by will or the laws of descent and distribution.
Certain Transactions
In the event of certain non-reciprocal transactions or events affecting our common stock known as “equity restructurings,” the plan administrator will make equitable adjustments to the 2016 ESPP and outstanding rights. In the event of a merger or sale of all or substantially all of the assets of the company, each outstanding option will be assumed or substituted by the successor corporation. In the event that the successor corporation does not assume or substitute for outstanding options, or in the event of a dissolution or liquidation of the company, the offering period then in progress will be shortened by setting a new exercise date immediately prior to the effective date of such transaction.
Plan Amendment
The board of directors may amend, suspend or terminate the 2016 ESPP at any time. However, stockholder approval of any amendment to the 2016 ESPP will be obtained for any amendment to the extent necessary to comply with applicable laws.
109
Table of Contents
The table below sets forth the compensation paid to our non-employee directors for their service on our board of directors during 2015.
| Name |
Fees earned or paid in cash ($) |
Stock awards ($)(1) |
All other compensation ($)(2) |
Total ($) | ||||||||||||
| José E. Feliciano(3) |
60,000 | — | — | 60,000 | ||||||||||||
| Colin Leonard(3) |
60,000 | — | — | 60,000 | ||||||||||||
| Timothy J. Pawlenty(4) |
60,000 | — | — | 60,000 | ||||||||||||
| Tracy Robinson(4) |
60,000 | 177,324 | — | 237,324 | ||||||||||||
| Sharon Spurlin(4) |
60,000 | 177,324 | — | 237,324 | ||||||||||||
| Andrew Speaker(5) |
200,000 | — | 7,308 | 207,308 | ||||||||||||
| (1) | Amount shown represents the grant date fair value of shares of restricted stock granted in 2015. |
| (2) | Amount shown represents our contributions to Mr. Speaker’s 401(k) Plan account in 2015. |
| (3) | These directors are employed by Clearlake and, pursuant to arrangements with Clearlake, amounts shown are paid to Clearlake at the direction of the directors. |
| (4) | As of December 31, 2015, Mr. Pawlenty held 6,600 unvested shares of our restricted stock and Ms. Robinson and Ms. Spurlin each held 22,000 unvested shares of our restricted stock. |
| (5) | Effective as of January 1, 2016, Mr. Speaker’s annual board retainer fee was reduced to $100,000. |
In connection with this offering, we intend to adopt a director compensation policy pursuant to which directors who are not officers, employees or paid consultants or advisors of us, may receive a combination of cash and equity-based awards under our 2016 Plan as compensation for their services on our board of directors. Such directors will also receive reimbursement for out-of-pocket expenses associated with attending board or committee meetings and director and officer liability insurance coverage. Officers, employees or paid consultants or advisors of us who also serve as directors will not receive additional compensation for their service as directors. All directors will be indemnified by us for actions associated with being a director to the fullest extent permitted under Delaware law.
110
Table of Contents
PRINCIPAL AND SELLING STOCKHOLDERS
The following table sets forth the beneficial ownership of our common stock that, upon the consummation of this offering, will be owned by:
| • | each person known to us to beneficially own more than 5% of any class of our outstanding common stock; |
| • | each of our directors; |
| • | each of our named executive officers; |
| • | all of our directors and executive officers as a group; and |
| • | the selling stockholders. |
The amounts and percentage of shares of common stock beneficially owned are reported on the basis of regulations of the SEC governing the determination of beneficial ownership of securities. Under the rules of the SEC, a person is deemed to be a “beneficial owner” of a security if that person has or shares “voting power,” which includes the power to vote or to direct the voting of such security, or “investment power,” which includes the power to dispose of or to direct the disposition of such security. In computing the number of shares beneficially owned by a person and the percentage ownership of that person, common stock subject to options or warrants held by that person that are currently exercisable or exercisable within 60 days of the date of this prospectus, if any, are deemed outstanding, but are not deemed outstanding for computing the percentage ownership of any other person. Except as indicated by footnote, the persons named in the table below have sole voting and investment power with respect to all shares of common stock shown as beneficially owned by them, subject to community property laws where applicable. Information presented in the table below is adjusted to reflect our 2,200 for 1 stock split that will occur after the effective date of the registration statement of which this prospectus forms a part and prior to the completion of this offering.
| Name of Beneficial Owner(1) |
Shares Beneficially Owned Before this Offering |
Number of shares of common stock offered if the underwriters’ option to purchase additional shares is not exercised |
Number of shares of common stock offered if the underwriters’ option to purchase additional shares is exercised in full |
Shares Beneficially Owned After this Offering (Assuming No Exercise of the Underwriters’ Over-Allotment Option) |
Shares Beneficially Owned After this Offering (Assuming the Underwriters’ Over-Allotment Option is Exercised in Full) |
|||||||||||||||||||||||||||
| Number | Percentage | Number | Percentage | Number | Percentage | |||||||||||||||||||||||||||
| Clearlake Capital Partners II (Master), L.P.(2) |
14,270,207 | 63.3 | % | 975,042 | 1,999,714 | 13,295,165 | 42.0 | % | 12,270,493 | 38.8 | % | |||||||||||||||||||||
| Keystone Cranberry, LLC(3) |
7,604,283 | 28.7 | % | 341,977 | 701,361 | 7,262,306 | 20.4 | % | 6,902,922 | 19.4 | % | |||||||||||||||||||||
| Directors/Named Executive Officers |
||||||||||||||||||||||||||||||||
| Charles E. Young(4) |
7,954,451 | 30.0 | % | 341,977 | 701,361 | 7,612,473 | 21.4 | % | 7,253,090 | 20.4 | % | |||||||||||||||||||||
| Lee Beckelman |
38,500 | * | 2,631 | 5,395 | 35,869 | * | 33,105 | * | ||||||||||||||||||||||||
| Robert Kiszka(5) |
607,420 | 2.3 | % | 27,842 | 57,100 | 579,578 | 1.6 | % | 550,320 | 1.5 | % | |||||||||||||||||||||
| José E. Feliciano(2) |
14,270,207 | 63.3 | % | 975,042 | 1,999,714 | 13,295,165 | 42.0 | % | 12,270,493 | 38.8 | % | |||||||||||||||||||||
| Colin Leonard |
— | — | — | — | — | — | — | — | ||||||||||||||||||||||||
| Timothy J. Pawlenty |
60,793 | * | 4,154 | 8,519 | 56,639 | * | 52,274 | * | ||||||||||||||||||||||||
| Andrew Speaker(6) |
1,490,834 | 5.6 | % | 60,879 | 124,858 | 1,429,955 | 4.0 | % | 1,365,976 | 3.8 | % | |||||||||||||||||||||
| Sharon Spurlin |
11,000 | * | 752 | 1,541 | 10,248 | * | 9,459 | * | ||||||||||||||||||||||||
| Tracy Robinson |
11,000 | * | — | — | 11,000 | * | 11,000 | * | ||||||||||||||||||||||||
| All Directors and Executive Officers as a group (12 persons) |
24,486,400 | 92.3 | % | 1,416,159 | 2,904,401 | 23,070,240 | 64.7 | % | 21,581,999 | 60.6 | % | |||||||||||||||||||||
| Other Selling Stockholders |
||||||||||||||||||||||||||||||||
| Speaker Children 2012 Irrevocable Trusts(7) |
264,000 | 1.2 | % | 18,038 | 36,995 | 245,962 | * | 227,005 | * | |||||||||||||||||||||||
| Frank Porcelli(8) |
1,754,834 | 6.6 | % | 78,918 | 161,853 | 1,675,916 | 4.7 | % | 1,592,982 | 4.5 | % | |||||||||||||||||||||
| F. Philip Handy(9) |
29,792 | * | 2,036 | 4,175 | 27,757 | * | 25,618 | * | ||||||||||||||||||||||||
| William John Young |
20,259 | * | 1,384 | 2,839 | 18,874 | * | 17,420 | * | ||||||||||||||||||||||||
| Susan Neumann |
10,891 | * | 744 | 1,526 | 10,147 | * | 9,365 | * | ||||||||||||||||||||||||
| Ronald P. Whelan |
11,045 | * | 755 | 1,548 | 10,290 | * | 9,497 | * | ||||||||||||||||||||||||
111
Table of Contents
| * | Less than 1%. |
| (1) | Unless otherwise indicated, the address for all beneficial owners in this table is c/o Smart Sand, Inc., 24 Waterway Avenue, Suite 350, The Woodlands, Texas 77380. |
| (2) | Represents shares held of record by Clearlake Capital Partners II (Master), L.P., a Delaware limited partnership (“CCPII”). CCPII is managed by Clearlake Capital Management II, L.P., a Delaware limited partnership (“CCMII”). CCMII’s general partner is Clearlake Capital Group, L.P., whose general partner is CCG Operations, L.L.C., a Delaware limited liability company (“CCG Ops”). CCPII’s general partner is Clearlake Capital Partners II GP, L.P., a Delaware limited partnership (“CCPII GP”). CCPII GP’s general partner is Clearlake Capital Partners, LLC, a Delaware limited liability company (“CCP”). CCP’s managing member is CCG Ops. José E. Feliciano and Behdad Eghbali are managers of CCG Ops and may be deemed to share voting and dispositive power of the shares held of record by CCPII. The address of Messrs. Feliciano and Eghbali and the entities named in this footnote is c/o Clearlake Capital Group, 233 Wilshire Blvd, Suite 800, Santa Monica, CA 90401. |
| (3) | Charles E. Young owns approximately 86% of the membership interests in Keystone Cranberry, LLC, is the sole managing member and has sole voting and investment power over the shares held by Keystone Cranberry, LLC. |
| (4) | Includes 2,600,000 shares that may be purchased upon the exercise of outstanding warrants that the company expects to be exercisable within 60 days of the date of this prospectus. All shares are held by Keystone Cranberry, LLC, a Pennsylvania limited liability company. Mr. Young owns approximately 86% of the membership interests in Keystone Cranberry, LLC, is the sole managing member and has sole voting and investment power over the shares held by Keystone Cranberry, LLC. Also includes 350,167 shares of restricted stock issued under the 2012 Plan as the holders of such shares of restricted stock have executed a proxy in favor of Mr. Young. |
| (5) | Includes 200,000 shares that may be purchased upon the exercise of outstanding warrants that the company expects to be exercisable within 60 days of the date of this prospectus. Other than 22,475 shares held directly by Mr. Kiszka, all shares are held by BAMK Associates, LLC, a Pennsylvania limited liability company. Mr. Kiszka is the sole member and has sole voting and investment power over the shares held by BAMK Associates, LLC. |
| (6) | Includes 599,999 shares that may be purchased upon the exercise of outstanding warrants that the company expects to be exercisable within 60 days of the date of this prospectus. |
| (7) | Includes (i) 88,000 shares held by the Trust for Jessica L. Speaker dated October 18, 2012, (ii) 88,000 shares held by the Trust for Mary J. Speaker dated October 18, 2012, and (iii) 88,000 shares held by the Trust for Thomas A. Speaker dated October 18, 2012 (collectively, the “Speaker Children Trusts”). Joseph Speaker is trustee of the Speaker Children Trusts, and as trustee, Mr. Speaker has sole voting and investment power over the shares held by the Speaker Children Trusts. Mr. Speaker is also the brother of Andrew Speaker, who is the Co-Chairman of our Board of Directors. |
| (8) | Includes 599,999 shares that may be purchased upon the exercise of outstanding warrants that the company expects to be exercisable within 60 days of the date of this prospectus. |
| (9) | All shares are held by the Blaine Trust U/A/D dated January 26, 2001 (the “Blaine Trust”). Given the revocable nature of the Blaine Trust, Mr. Handy, as settlor and trustee, is deemed to have voting and investment power over the shares held by the Blaine Trust. |
112
Table of Contents
CERTAIN RELATIONSHIPS AND RELATED PARTY TRANSACTIONS
In connection with the closing of this offering, we will enter into a registration rights agreement with certain stockholders, including the selling stockholders (the “Registration Rights Holders”). Pursuant to the registration rights agreement, we may be required to register under the Securities Act shares of common stock owned by the Registration Rights Holders (the “Registrable Securities”) upon their request in certain circumstances.
Demand Registration Rights. At any time after the closing of this offering following the expiration of the 180-day lockup period described in this prospectus, our Principal Stockholders will have the right to require us by written notice to register their Registrable Securities. We will be obligated to effect two demand registrations on a long-form registration statement in any twelve-month period and an unlimited number of demand registrations on a short-form registration statement, including “shelf registrations”; provided that we will not be obligated to file more than one registration statement in response to a demand registration within 90 days after the effective date of any registration statement filed by us in response to a demand registration. Upon written request of any of our Principal Stockholders, we will retain underwriters and facilitate an underwritten offering to dispose of Registrable Securities having a market price of at least $20.0 million held individually by a Principal Stockholder, or collectively by the Principal Stockholders.
Piggy-back Registration Rights. If, at any time, we propose to register an offering of our securities (subject to certain exceptions) for our own account or for the account of any stockholder other than the Registration Rights Holders, then we must give notice to the Registration Rights Holders holding at least $0.1 million in shares of our common stock to allow them to include a specified number of Registrable Securities in that registration statement.
Conditions and Limitations; Expenses. The registration rights are subject to certain conditions and limitations, including the right of the underwriters to limit the number of Registrable Securities to be included in a registration and our right to delay or withdraw a registration statement under certain circumstances. We will generally pay all registration expenses in connection with our obligations under the registration rights agreement, regardless of whether a registration statement is filed or becomes effective. The obligations to register Registrable Securities under the registration rights agreement will terminate when no Registrable Securities remain outstanding. Registrable Securities will cease to be covered by the registration rights agreement when they have (i) been sold pursuant to an effective registration statement under the Securities Act, (ii) been sold in a transaction exempt from registration under the Securities Act (including transactions pursuant to Rule 144), (iii) are held by the Company or one of its subsidiaries; (iv) at the time such Registrable Security has been sold in a private transaction in which the transferor’s rights under the registration rights agreement are not assigned to the transferee of such securities; or (v) are sold in a private transaction in which the transferor’s rights under the registration rights agreement are assigned to the transferee and such transferee is not an affiliate of the company, two years following the transfer of such Registrable Security to such transferee.
In connection with this offering, we intend to enter into a stockholders agreement with Clearlake and Keystone Cranberry, LLC (the entity through which our Chief Executive Officer beneficially owns substantially all of his shares of our common stock) that will provide each Principal Stockholder certain rights to designate nominees for election to our board of directors. The stockholders agreement will provide that, for so long as a Principal Stockholder beneficially owns at least 30% of our common stock then outstanding, it shall be entitled to designate three directors; for so long as a Principal Stockholder beneficially owns at least 20% of our common stock then outstanding, it shall be entitled to designate two directors; and for so long as a Principal Stockholder beneficially owns at least 10% of our common stock then outstanding, it shall be entitled to designate one director.
113
Table of Contents
A Principal Stockholder shall be entitled to designate the replacement for any of their board designees whose board service terminates prior to the end of the director’s term regardless of their beneficial ownership at such time. Each Principal Stockholder shall also have the right, but not the obligation, to designate at least one of their nominees as a member to each of the committees of our board of directors for so long as they are allowed to designate at least one director, subject to compliance with applicable law and stock exchange rules.
For so long as such Principal Stockholder holds at least 20% of our outstanding common stock, we, and our subsidiaries, shall not effect any transaction or series of related transactions involving a change of control of the Company (or enter into an agreement to take such action) without the approval of such Principal Stockholder.
Additionally, for so long as such Principal Stockholder has one of its designees serving on our board of directors, we, and our subsidiaries, shall not take the following actions (or enter into an agreement to take such actions) without the approval of such Principal Stockholder:
| • | any increase or decrease in the size or composition of the board of directors, committees of the board of directors, and boards and committees of subsidiaries of the company; or |
| • | any action that otherwise could reasonably be expected to adversely affect such Principal Stockholder’s board of directors and committee designation rights. |
The rights and obligations of each Principal Stockholder under the stockholders agreement will be several and not joint, and no Principal Stockholder will be responsible in any way for the performance of the rights and obligations of any other Principal Stockholder under the stockholders agreement.
114
Table of Contents
Our amended and restated bylaws will provide that we will indemnify our directors and officers to the fullest extent permitted by law. In addition, we intend to enter into separate indemnification agreements with our directors and certain officers. Each indemnification agreement will provide, among other things, for indemnification to the fullest extent permitted by law and our amended and restated bylaws against any and all expenses, judgments, fines, penalties and amounts paid in settlement of any claim. The indemnification agreements will provide for the advancement or payment of all expenses to the indemnitee and for the reimbursement to us if it is found that such indemnitee is not entitled to such indemnification under applicable law and our amended and restated bylaws.
Procedures for Review, Approval and Ratification of Related Person Transactions
Our board of directors will adopt a written policy on transactions with related persons in connection with the completion of this offering that will provide that the board of directors or its authorized committee will review on at least a quarterly basis all transactions with related persons that are required to be disclosed under SEC rules and, when appropriate, initially authorize or ratify all such transactions. In the event that the board of directors or its authorized committee considers ratification of a transaction with a related person and determines not to so ratify, the written policy on transactions with related persons will provide that our management will make all reasonable efforts to cancel or annul the transaction.
The written policy on transactions with related persons will provide that, in determining whether or not to recommend the initial approval or ratification of a transaction with a related person, the board of directors or its authorized committee should consider all of the relevant facts and circumstances available, including (if applicable) but not limited to whether the transaction is on terms comparable to those that could be obtained in arm’s length dealings with an unrelated third party and the extent of the related person’s interest in the transaction and whether entering into the transaction would be consistent with the written policy on transactions with related persons.
The written policy on transactions with related persons described above will be adopted in connection with the completion of this offering and, therefore, the transactions described below were not reviewed under such policy.
Loan to Named Executive Officer
In January 2016, the company provided a one-year, 0% loan to its Chief Executive Officer in the amount of $61,000. During the third quarter of 2016, this loan was fully forgiven and included as compensation to the Chief Executive Officer.
Existing Stockholders Rights Agreement
The company is party to a stockholders agreement with certain of its existing stockholders (the “existing stockholders rights agreement”). The existing stockholders rights agreement provided for certain restrictions on transfer of shares of stock of the company and board designation, consent and expense reimbursement rights. Under the existing stockholders rights agreement, the company reimbursed Clearlake approximately $130,000 in 2014 for certain out-of-pocket and other expenses in connection with certain management and administrative support services provided. In connection with this offering, we expect to terminate the existing stockholders rights agreement and enter into a new stockholders agreement. See “—Stockholders Agreement”.
115
Table of Contents
Upon completion of this offering, the authorized capital stock of Smart Sand, Inc., will consist of 350,000,000 shares of common stock, $0.001 par value per share, of which 31,638,712 shares will be issued and outstanding, and 10,000,000 shares of preferred stock, $0.001 par value per share, of which no shares will be issued and outstanding. Please read “Summary—The Offering.”
The following summary of the capital stock and amended and restated certificate of incorporation and amended and restated bylaws of Smart Sand, Inc., does not purport to be complete and is qualified in its entirety by reference to the provisions of applicable law, our amended and restated certificate of incorporation, amended and restated bylaws, stockholders agreement and the registration rights agreement, which are filed as exhibits to the registration statement of which this prospectus is a part.
Except as provided by law or in a preferred stock designation, holders of common stock are entitled to one vote for each share held of record on all matters submitted to a vote of the stockholders, will have the exclusive right to vote for the election of directors and do not have cumulative voting rights. Except as otherwise required by law, holders of common stock are not entitled to vote on any amendment to the amended and restated certificate of incorporation (including any certificate of designations relating to any series of preferred stock) that relates solely to the terms of any outstanding series of preferred stock if the holders of such affected series are entitled, either separately or together with the holders of one or more other such series, to vote thereon pursuant to the amended and restated certificate of incorporation (including any certificate of designations relating to any series of preferred stock) or pursuant to the DGCL. Subject to the rights of any holders of any outstanding shares or series of preferred stock, holders of common stock are entitled to the payment of dividends when and as declared by our board of directors in accordance with applicable law and to receive other distributions. All outstanding shares of common stock are fully paid and non-assessable. The holders of common stock have no pre-emptive or other subscription rights. Subject to the rights of any holders of any outstanding shares or series of preferred stock, in the event of any liquidation, dissolution or winding up of our affairs, whether voluntary or involuntary, our funds and assets, to the extent they may be legally distributed to holders of common stock, shall be distributed among the holders of the then outstanding common stock pro rata in accordance with the number of shares of common stock held by each such holder.
Our amended and restated certificate of incorporation authorizes our board of directors, in accordance with the DGCL and subject to the stockholders agreement, without further stockholder approval, to establish and to issue from time to time one or more series of preferred stock, par value $0.001 per share. Our board of directors is authorized to determine the terms and rights of each such series of preferred stock, including the number of shares, voting rights, if any, and such designations, preferences and relative participating, optional or other special rights, and qualifications, limitations or restrictions thereof, including without limitation thereof, dividend rights, conversion rights, redemption privileges and liquidation preferences, as our board of directors may deem advisable, all to the fullest extent permitted by the DGCL and the stockholders agreement.
On September 13, 2011, we issued four warrants to purchase an aggregate of 3,998,896 shares of our common stock at an exercise price of $0.00455 per share. The material terms and provisions of our outstanding warrants are summarized below. The following description is subject to, and qualified in its entirety by, the common stock purchase warrants, which are filed as exhibits to the registration statement of which this prospectus is a part.
116
Table of Contents
Term. The warrants (and the right to purchase shares of common stock upon the exercise thereof) terminate upon the earliest to occur of (i) the eight-year anniversary of the issue date (September 13, 2011) and (ii) a change of control (as defined in the warrants) of us.
Exercise Price. The exercise price of the warrants is $0.00455 per whole share of common stock. The exercise price is subject to appropriate adjustment in the event of certain stock dividends and distributions, stock splits, stock combinations, stock issuances, reclassifications or similar events affecting our common stock.
Exercisability. Holders may exercise the warrants, in whole or in part, on and after the earlier of:
| (i) | the date upon which we have achieved EBITDA in excess of $76.8 million over the course of any twenty-four month period; |
| (ii) | (A) the occurrence of a transaction in which our stockholders immediately prior to such transaction do not retain direct or indirect beneficial ownership of at least 60% of the total outstanding shares of our common stock following the transaction and such transaction implies a valuation of our common stock of at least $300 million, or (B) the adoption of a plan relating to the dissolution or liquidation of us; provided that if such transaction is in connection with an initial public offering (as defined in the warrants), then the warrants shall become exercisable following the date described in clause (iii) below; and |
| (iii) | the date immediately following the 20th consecutive trading day on which our common stock is actively traded on a national securities exchange and the aggregate market value of the common stock is at least $300 million for each of the 20 trading days. |
We expect the existing stockholders holding warrants to exercise in full the outstanding warrants following this offering pursuant to clause (iii) above.
No Fractional Shares. No fractional shares will be issued upon the exercise of the warrants. As to any fraction of a share that the holder would otherwise be entitled to purchase upon such exercise, we will pay a cash adjustment in respect of such fraction in an amount equal to such fraction multiplied by the fair market value of one share of common stock on the date of exercise, as determined in good faith by our board of directors.
Transferability. Except for affiliate transfers (as defined in the warrants), the warrants may not be assigned or transferred by the registered holder without our prior written consent.
Authorized Shares. During the period the warrants are outstanding, we will reserve from our authorized and unissued common stock a sufficient number of shares to provide for the issuance of shares of common stock underlying the warrants upon the exercise of the warrants.
Exchange Listing. The warrants are not listed on any securities exchange.
Fundamental Transactions. In the event of certain fundamental transactions, as described in the warrants and generally including any merger or consolidation with or into another entity in which the Company is not the surviving entity, then upon any subsequent exercise of a warrant the holder shall have the right to receive as alternative consideration, for each share of our common stock that would have been issuable upon such exercise immediately prior to the occurrence of such fundamental transaction, the number of shares of common stock of the successor or acquiring corporation, and any additional consideration receivable upon or as a result of such transaction by a holder of the number of shares of our common stock for which the warrant is exercisable immediately prior to such event.
Right as a Stockholder. Except as otherwise provided in the warrants or by virtue of such holder’s ownership of shares of our common stock, the holders of the warrants do not have the rights or privileges of holders of our common stock, including any voting rights, until they exercise their warrants.
117
Table of Contents
Amendments or Waivers. Any term of the warrants may be amended or waived only by an instrument in writing signed by the party against which enforcement of the amendment or waiver is sought.
Our certificate of incorporation will divide our board of directors into three classes, as nearly equal in number as possible, with staggered three-year terms. Subject to our stockholders agreement, under our certificate of incorporation and our bylaws, any vacancy on our board of directors, including a vacancy resulting from an enlargement of our board of directors, may be filled only by the affirmative vote of a majority of our directors then in office, even though less than a quorum of the board of directors. The classification of our board of directors and the limitations on the ability of our stockholders to remove directors and fill vacancies could make it more difficult for a third party to acquire, or discourage a third party from seeking to acquire, control of us. See “Management—Board Composition” and “Certain Relationships and Related Party Transactions—Stockholders Agreement.”
Anti-Takeover Effects of Provisions of Our Amended and Restated Certificate of Incorporation, our Amended and Restated Bylaws and Delaware Law
Some provisions of Delaware law, our amended and restated certificate of incorporation and our amended and restated bylaws will contain provisions that could make acquisitions of us by means of a tender offer, a proxy contest or otherwise or removal of our directors more difficult. These provisions may also have the effect of preventing changes in our management. It is possible that these provisions could make it more difficult to accomplish or could deter transactions that stockholders may otherwise consider to be in their best interest or in our best interests, including transactions that might result in a premium over the market price for our shares.
These provisions are expected to discourage coercive takeover practices and inadequate takeover bids. These provisions are also designed to encourage persons seeking to acquire control of us to first negotiate with us. We believe that the benefits of increased protection and our potential ability to negotiate with the proponent of an unfriendly or unsolicited proposal to acquire or restructure us outweigh the disadvantages of discouraging these proposals because, among other things, negotiation of these proposals could result in an improvement of their terms.
Delaware Law
Section 203 of the DGCL prohibits a Delaware corporation, including those whose securities are listed for trading on the NASDAQ, from engaging in any business combination (as defined in Section 203) with any interested stockholder (as defined in Section 203) for a period of three years following the date that the stockholder became an interested stockholder, unless:
| • | the business combination or the transaction which resulted in the stockholder becoming an interested stockholder is approved by the board of directors before the date the interested stockholder attained that status; |
| • | upon consummation of the transaction that resulted in the stockholder becoming an interested stockholder, the interested stockholder owned at least 85% of the voting stock of the corporation outstanding at the time the transaction commenced; or |
| • | on or after such time the business combination is approved by the board of directors and authorized at a meeting of stockholders by at least two-thirds of the outstanding voting stock that is not owned by the interested stockholder. |
A corporation may elect not to be subject to Section 203 of the DGCL. We have elected to not be subject to the provisions of Section 203 of the DGCL.
118
Table of Contents
Amended and Restated Certificate of Incorporation and Amended and Restated Bylaws
Provisions of our amended and restated certificate of incorporation and amended and restated bylaws, which will become effective upon the closing of this offering, may delay or discourage transactions involving an actual or potential change in control or change in our management, including transactions in which stockholders might otherwise receive a premium for their shares, or transactions that our stockholders might otherwise deem to be in their best interests. Therefore, these provisions could adversely affect the price of our common stock.
Among other things, upon the completion of this offering, our amended and restated certificate of incorporation and amended and restated bylaws will:
| • | establish advance notice procedures with regard to stockholder proposals relating to the nomination of candidates for election as directors or new business to be brought before meetings of our stockholders. These procedures provide that notice of stockholder proposals must be timely given in writing to our corporate secretary prior to the meeting at which the action is to be taken. Generally, to be timely, notice must be received at our principal executive offices not less than 90 days nor more than 120 days prior to the first anniversary date of the annual meeting for the preceding year. Our amended and restated bylaws specify the requirements as to form and content of all stockholders’ notices. These requirements may preclude stockholders from bringing matters before the stockholders at an annual or special meeting; |
| • | provide our board of directors the ability to authorize undesignated preferred stock. This ability makes it possible for our board of directors to issue, without stockholder approval, preferred stock with voting or other rights or preferences that could impede the success of any attempt to change control of us. These and other provisions may have the effect of deferring hostile takeovers or delaying changes in control or management of our company; |
| • | provide that our board of directors will be divided into three classes, as nearly equal in number as possible, with staggered three-year terms; |
| • | subject to the stockholders agreement, provide that the size of our board of directors may be changed only by resolution of the board of directors; |
| • | subject to the stockholders agreement, provide that all vacancies, including newly created directorships, shall, except as otherwise required by law or, if applicable, the rights of holders of a series of preferred stock, be filled exclusively by the affirmative vote of a majority of directors then in office, even if less than a quorum; |
| • | provide that, after such time as the Principal Stockholders cease to collectively beneficially own at least 50% of the voting power of the outstanding shares of our stock entitled to vote, any action required or permitted to be taken by the stockholders must be effected at a duly called annual or special meeting of stockholders and may not be effected by any consent in writing in lieu of a meeting of such stockholders, subject to the rights of the holders of any series of preferred stock with respect to such series; |
| • | provide that, after such time as the Principal Stockholders cease to collectively beneficially own at least 50% of the voting power of the outstanding shares of our stock entitled to vote, our stockholders may only amend or repeal our bylaws with the affirmative vote of at least 66 2⁄3% of the voting power of the outstanding shares of our stock entitled to vote; |
| • | provide that special meetings of our stockholders may only be called by the board of directors (except that a Principal Stockholder may also call special meetings of our stockholders so long as such Principal Stockholder beneficially owns at least 20% of the voting power of the outstanding shares of our stock); |
| • | provide that, after such time as the Principal Stockholders cease to collectively beneficially own at least 50% of the voting power of the outstanding shares of our stock entitled to vote, our stockholders may only amend our certificate of incorporation with the affirmative vote of at least 66 2⁄3% of the voting power of the outstanding shares of our stock entitled to vote; |
119
Table of Contents
| • | provide that, subject to the rights of the preferred stockholders and the stockholders agreement, if any, any director may be removed only upon the affirmative vote of the holders of at least 66 2⁄3% of the voting power of the outstanding shares of our stock entitled to vote; and |
| • | provide that our bylaws can be amended or repealed by the board of directors. |
Approval of Certain Significant Matters
Pursuant to the terms of the stockholders agreement, upon consummation of this offering, so long as either Principal Stockholder maintains certain beneficial ownership level of our common stock, such Principal Stockholder must provide consent to certain significant business actions before we are permitted to take such actions. See “Certain Relationships and Related Party Transactions—Stockholders Agreement.”
Under our amended and restated certificate of incorporation, to the extent permitted by law:
| • | any of our directors or officers who is also a principal, officer, member, manager and/or employee (a “Covered Person”) of Clearlake or its affiliates will have the right to carry on and conduct, directly or indirectly, business with any business that is competitive or in the same line of business as us, do business with any of our clients, customers, vendors or lessors, or make investments in the kind of property in which we may make investments; |
| • | if Clearlake, its affiliates or a Covered Person acquires knowledge of a potential transaction that could be a corporate opportunity for either (a)(i) the Covered Person in their capacity as an officer, director, employee, managing director or other affiliate of Clearlake or (ii) Clearlake or its affiliates or (b) us, he or she will have no duty to offer such corporate opportunity to us; |
| • | we have renounced any interest or expectancy in, or in being offered an opportunity to participate in, such corporate opportunities; and |
| • | we have waived any claim against Clearlake, its affiliates or any Covered Person and shall indemnify, and will pay in advance any expenses incurred in defense of such claims by, Clearlake, its affiliates or a Covered Person against any claim that Clearlake, its affiliates or a Covered Person is liable to us or our stockholders for breach of any fiduciary duty solely by reason of the fact that Clearlake, its affiliates or a Covered Person (x) pursues or acquires any corporate opportunity for his or her own account or the account of any affiliate, (y) directs, recommends, sells, assigns, or otherwise transfers such corporate opportunity to another person or (z) does not communicate information regarding such corporate opportunity to us. |
Our amended and restated certificate of incorporation will provide that unless we consent in writing to the selection of an alternative forum, the Court of Chancery of the State of Delaware will, to the fullest extent permitted by applicable law, be the sole and exclusive forum for:
| • | any derivative action or proceeding brought on our behalf; |
| • | any action asserting a claim of breach of a fiduciary duty owed by any of our directors, officers, employees or agents to us or our stockholders; |
| • | any action asserting a claim against us arising pursuant to any provision of the DGCL, our amended and restated certificate of incorporation or our bylaws; or |
120
Table of Contents
| • | any action asserting a claim against us that is governed by the internal affairs doctrine, in each such case subject to such Court of Chancery having personal jurisdiction over the indispensable parties named as defendants therein. |
Our amended and restated certificate of incorporation will also provide that any person or entity purchasing or otherwise acquiring any interest in shares of our capital stock will be deemed to have notice of and to have consented to this forum selection provision. However, it is possible that a court could find our forum selection provision to be inapplicable or unenforceable.
Limitation of Liability and Indemnification Matters
Our amended and restated certificate of incorporation limits the liability of our directors to the fullest extent permitted by Delaware law for monetary damages for breach of their fiduciary duty as directors.
Any amendment, repeal or modification of these provisions will be prospective only and would not affect any limitation on liability of a director for acts or omissions that occurred prior to any such amendment, repeal or modification.
Our amended and restated certificate of incorporation and amended and restated bylaws also provide that we will indemnify and advance expenses to our directors and officers to the fullest extent permitted by Delaware law. Under Delaware law we may purchase insurance on behalf of any officer, director, employee or other agent for any liability arising out of that person’s actions as our officer, director, employee or agent, regardless of whether Delaware law would permit indemnification. We intend to enter into indemnification agreements with each of our current and future directors and officers. These agreements will require us to indemnify these individuals to the fullest extent permitted under Delaware law against liability that may arise by reason of their service to us, and to advance expenses incurred as a result of any proceeding against them as to which they could be indemnified. We believe that the limitation of liability, indemnification and advancement of expenses provisions in our amended and restated certificate of incorporation and the indemnification agreements will facilitate our ability to continue to attract and retain qualified individuals to serve as directors and officers.
In connection with this offering, we will enter into the registration rights agreement with certain stockholders, including the selling stockholders, whereby such stockholders and certain of their respective affiliates and transferees will have specified rights, under certain circumstances and subject to certain restrictions, to require us to register under the Securities Act all or any portion of the shares of common stock beneficially owned by such stockholders. See “Certain Relationships and Related Party Transactions—Registration Rights Agreement.”
In connection with this offering, we will enter into the stockholders agreement with Clearlake and Keystone Cranberry, LLC pursuant to which our Principal Stockholders will have certain rights, including board of directors and committee designation rights and consent rights, including the right to consent to change in control transactions. See “Certain Relationships and Related Party Transactions—Stockholders Agreement.”
In addition, we intend to enter into separate indemnification agreements with of our directors and certain officers. Each indemnification agreement will provide, among other things, for indemnification to the fullest
121
Table of Contents
extent permitted by law and our amended and restated bylaws against any and all expenses, judgments, fines, penalties and amounts paid in settlement of any claim. The indemnification agreements will provide for the advancement or payment of all expenses to the indemnitee and for the reimbursement to us if it is found that such indemnitee is not entitled to such indemnification under applicable law and our amended and restated bylaws.
122
Table of Contents
SHARES ELIGIBLE FOR FUTURE SALE
Prior to this offering, there has been no public market for our common stock. Future sales of our common stock in the public market, or the availability of such shares for sale in the public market, could adversely affect the market price of our common stock prevailing from time to time. As described below, only a limited number of shares will be available for sale shortly after this offering due to contractual and legal restrictions on resale. Nevertheless, sales of a substantial number of shares of our common stock in the public market after such restrictions lapse, or the perception that those sales may occur, could adversely affect the prevailing market price of our common stock at such time and our ability to raise equity-related capital at a time and price we deem appropriate.
Upon completion of this offering, we will have outstanding an aggregate of 31,638,712 shares of common stock, after giving effect to the 2,200 for 1 stock split of our common stock that we will effect after the effective date of the registration statement of which this prospectus forms a part and prior to the completion of this offering. Of these shares, all of the 10,615,152 shares of common stock to be sold in this offering (or 12,207,424 shares assuming the underwriters exercise the option to purchase additional shares in full) will be freely tradable without restriction or further registration under the Securities Act, unless the shares are held by any of our “affiliates” as such term is defined in Rule 144 under the Securities Act. All remaining shares of common stock will be deemed “restricted securities” as such term is defined under Rule 144. The restricted securities were, or will be, issued and sold by us in private transactions and are eligible for public sale only if registered under the Securities Act or if they qualify for an exemption from registration under Rule 144 or Rule 701 under the Securities Act, which rules are summarized below.
As a result of the lock-up agreements described below and the provisions of Rule 144 and Rule 701 under the Securities Act, all of the shares of our common stock (excluding the shares to be sold in this offering) will be available for sale in the public market upon the expiration of the lock-up agreements, beginning 180 days after the date of this prospectus (subject to extension) and when permitted under Rule 144 or Rule 701.
We, all of our directors and executive officers, the selling stockholders and certain of our principal stockholders will agree not to sell any common stock or securities convertible into or exchangeable for shares of common stock for a period of 180 days from the date of this prospectus, subject to certain exceptions. For a description of these lock-up provisions, please read “Underwriting.”
In general, under Rule 144 under the Securities Act as currently in effect, a person (or persons whose shares are aggregated) who is not deemed to have been an affiliate of ours at any time during the three months preceding a sale, and who has beneficially owned restricted securities within the meaning of Rule 144 for a least six months (including any period of consecutive ownership of preceding non-affiliated holders) would be entitled to sell those shares, subject only to the availability of current public information about us. A non-affiliated person who has beneficially owned restricted securities within the meaning of Rule 144 for at least one year would be entitled to sell those shares without regard to the provisions of Rule 144.
A person (or persons whose shares are aggregated) who is deemed to be an affiliate of ours and who has beneficially owned restricted securities within the meaning of Rule 144 for at least six months would be entitled to sell within any three-month period a number of shares that does not exceed the greater of one percent of the then outstanding shares of our common stock or the average weekly trading volume of our common stock reported through the NASDAQ during the four calendar weeks preceding the filing of notice of the sale. Such sales are also subject to certain manner of sale provisions, notice requirements and the availability of current public information about us.
123
Table of Contents
In general, under Rule 701 under the Securities Act, any of our employees, directors, officers, consultants or advisors who purchases shares from us in connection with a compensatory stock or option plan or other written agreement before the effective date of this offering is entitled to sell such shares 90 days after the effective date of this offering in reliance on Rule 144, without having to comply with the holding period requirement of Rule 144 and, in the case of non-affiliates, without having to comply with the public information, volume limitation or notice filing provisions of Rule 144. The SEC has indicated that Rule 701 will apply to typical stock options granted by an issuer before it becomes subject to the reporting requirements of the Exchange Act, along with the shares acquired upon exercise of such options, including exercises after the date of this prospectus.
Stock Issued Under Employee Plans
We intend to file a registration statement on Form S-8 under the Securities Act to register stock issuable under our LTIP. This registration statement on Form S-8 is expected to be filed following the effective date of the registration statement of which this prospectus is a part and will be effective upon filing. Accordingly, shares registered under such registration statement will be available for sale in the open market following the effective date, unless such shares are subject to vesting restrictions with us, Rule 144 restrictions applicable to our affiliates or the lock-up restrictions described above.
On September 13, 2011, we issued four warrants to purchase an aggregate of 3,998,896 shares of our common stock at an exercise price of $0.00455 per share. During the period the warrants are outstanding, we will reserve from our authorized and unissued common stock a sufficient number of shares to provide for the issuance of shares of common stock underlying the warrants upon the exercise of the warrants. Holders may exercise the warrants, in whole or in part, on and after the earlier of:
(i) the date upon which we have achieved EBITDA in excess of $76.8 million over the course of any twenty-four month period;
(ii) (A) the occurrence of a transaction in which our stockholders immediately prior to such transaction do not retain direct or indirect beneficial ownership of at least 60% of the total outstanding shares of our common stock following the transaction and such transaction implies a valuation of our common stock of at least $300 million, or (B) the adoption of a plan relating to our dissolution or liquidation; and
(iii) the date immediately following the 20th consecutive trading day on which our common stock is actively traded on a national securities exchange and the aggregate market value of the common stock is at least $300 million for each of the 20 trading days.
Please read “Description of Capital Stock—Outstanding Warrants.”
In connection with this offering, we will enter into a registration rights agreement with certain stockholders, including the selling stockholders, pursuant to which we will grant such stockholders and certain of their respective affiliates and transferees the right, under certain circumstances and subject to certain restrictions, to require us to register under the Securities Act shares of common stock owned by such stockholders. Securities registered under any such registration statement will be available for sale in the open market unless restrictions apply. See “Certain Relationships and Related Transactions—Registration Rights Agreement.”
124
Table of Contents
MATERIAL U.S. FEDERAL INCOME TAX CONSEQUENCES TO NON-U.S. HOLDERS
The following discussion is a summary of the material U.S. federal income tax consequences to Non-U.S. Holders (as defined below) of the purchase, ownership and disposition of our common stock issued pursuant to this offering, but does not purport to be a complete analysis of all potential tax effects. The effects of other U.S. federal tax laws, such as estate and gift tax laws, and any applicable state, local or non-U.S. tax laws are not discussed. This discussion is based on the U.S. Internal Revenue Code of 1986, as amended (the “Code”), Treasury regulations promulgated thereunder (“Treasury Regulations”), judicial decisions, and published rulings and administrative pronouncements of the U.S. Internal Revenue Service (the “IRS”), in each case as in effect as of the date hereof. These authorities may change or be subject to differing interpretations. Any such change or differing interpretation may be applied retroactively in a manner that could adversely affect a Non-U.S. Holder of our common stock. We have not sought and will not seek any rulings from the IRS regarding the matters discussed below. There can be no assurance the IRS or a court will not take a contrary position to those discussed below regarding the tax consequences of the purchase, ownership and disposition of our common stock.
This discussion is limited to Non-U.S. Holders that hold our common stock as a “capital asset” within the meaning of Section 1221 of the Code (generally, property held for investment). This discussion does not address all U.S. federal income tax consequences relevant to a Non-U.S. Holder’s particular circumstances, including the impact of the Medicare contribution tax on net investment income. In addition, it does not address consequences relevant to Non-U.S. Holders subject to special rules, including, without limitation:
| • | U.S. expatriates and former citizens or long-term residents of the United States; |
| • | persons subject to the alternative minimum tax; |
| • | persons holding our common stock as part of a hedge, straddle or other risk reduction strategy or as part of a conversion transaction or other integrated investment; |
| • | banks, insurance companies, and other financial institutions; |
| • | real estate investment trusts or regulated investment companies; |
| • | brokers, dealers or traders in securities; |
| • | “controlled foreign corporations,” “passive foreign investment companies,” and corporations that accumulate earnings to avoid U.S. federal income tax; |
| • | partnerships, or other entities or arrangements treated as partnerships for U.S. federal income tax purposes; |
| • | tax-exempt organizations or governmental organizations; |
| • | persons deemed to sell our common stock under the constructive sale provisions of the Code; |
| • | persons who hold or receive our common stock pursuant to the exercise of any employee stock option or otherwise as compensation; |
| • | “qualified foreign pension funds” as defined in Section 897(1)(2) of the Code and entities all of the interests of which are held by qualified foreign pension funds; and |
| • | tax-qualified retirement plans. |
If an entity treated as a partnership for U.S. federal income tax purposes holds our common stock, the tax treatment of a partner in the partnership will depend on the status of the partner, the activities of the partnership and certain determinations made at the partner level. Accordingly, partnerships holding our common stock and partners in such partnerships should consult their tax advisors regarding the U.S. federal income tax consequences to them.
125
Table of Contents
THIS DISCUSSION IS FOR INFORMATIONAL PURPOSES ONLY AND IS NOT TAX ADVICE. INVESTORS SHOULD CONSULT THEIR TAX ADVISORS WITH RESPECT TO THE APPLICATION OF THE U.S. FEDERAL INCOME TAX LAWS TO THEIR PARTICULAR SITUATIONS AS WELL AS ANY TAX CONSEQUENCES OF THE PURCHASE, OWNERSHIP AND DISPOSITION OF OUR COMMON STOCK ARISING UNDER THE U.S. FEDERAL ESTATE OR GIFT TAX LAWS OR UNDER THE LAWS OF ANY STATE, LOCAL OR NON-U.S. TAXING JURISDICTION OR UNDER ANY APPLICABLE INCOME TAX TREATY.
Definition of a Non-U.S. Holder
For purposes of this discussion, a “Non-U.S. Holder” is any beneficial owner of our common stock that is neither a “U.S. person” nor an entity treated as a partnership for U.S. federal income tax purposes. A U.S. person is any person that, for U.S. federal income tax purposes, is or is treated as any of the following:
| • | an individual who is a citizen or resident of the United States; |
| • | a corporation, or an entity treated as a corporation for U.S. federal income tax purposes, created or organized under the laws of the United States, any state thereof, or the District of Columbia; |
| • | an estate, the income of which is subject to U.S. federal income tax regardless of its source; or |
| • | a trust that (1) is subject to the primary supervision of a U.S. court and the control of one or more “United States persons” (within the meaning of Section 7701(a)(30) of the Code), or (2) has a valid election in effect to be treated as a United States person for U.S. federal income tax purposes. |
As described in the section entitled “Dividend Policy” we do not anticipate declaring or paying dividends to holders of our common stock in the foreseeable future. However, if we do make distributions of cash or property on our common stock, such distributions will constitute dividends for U.S. federal income tax purposes to the extent paid from our current or accumulated earnings and profits, as determined under U.S. federal income tax principles. Amounts not treated as dividends for U.S. federal income tax purposes will constitute a return of capital and first be applied against and reduce a Non-U.S. Holder’s adjusted tax basis in its common stock, but not below zero. Any excess will be treated as capital gain and will be treated as described below under “—Sale or Other Taxable Disposition.”
Subject to the discussion below on effectively connected income, dividends paid to a Non-U.S. Holder of our common stock will be subject to U.S. federal withholding tax at a rate of 30% of the gross amount of the dividends (or such lower rate specified by an applicable income tax treaty, provided the Non-U.S. Holder furnishes to us or our paying agent prior to the payment of dividends a valid IRS Form W-8BEN or W-8BEN-E (or other applicable documentation) certifying qualification for the lower treaty rate). A Non-U.S. Holder that does not timely furnish the required documentation, but that qualifies for a reduced treaty rate, may obtain a refund of any excess amounts withheld by timely filing an appropriate claim for refund with the IRS. Non-U.S. Holders should consult their tax advisors regarding their entitlement to benefits under any applicable income tax treaty.
If dividends paid to a Non-U.S. Holder are effectively connected with the Non-U.S. Holder’s conduct of a trade or business within the United States (and, if required by an applicable income tax treaty, the Non-U.S. Holder maintains a permanent establishment in the United States to which such dividends are attributable), the Non-U.S. Holder will be exempt from the U.S. federal withholding tax described above. To claim the exemption, the Non-U.S. Holder must furnish to the applicable withholding agent a valid IRS Form W-8ECI, certifying that the dividends are effectively connected with the Non-U.S. Holder’s conduct of a trade or business within the United States.
126
Table of Contents
Any such effectively connected dividends will be subject to U.S. federal income tax on a net income basis at the regular graduated rates. A Non-U.S. Holder that is a corporation also may be subject to a branch profits tax at a rate of 30% (or such lower rate specified by an applicable income tax treaty) on its effectively connected earnings and profits (as adjusted for certain items), which will include such effectively connected dividends. Non-U.S. Holders should consult their tax advisors regarding any applicable tax treaties that may provide for different rules.
Sale or Other Taxable Disposition
A Non-U.S. Holder will not be subject to U.S. federal income tax on any gain realized upon the sale or other taxable disposition of our common stock unless:
| • | the gain is effectively connected with the Non-U.S. Holder’s conduct of a trade or business within the United States (and, if required by an applicable income tax treaty, the Non-U.S. Holder maintains a permanent establishment in the United States to which such gain is attributable); |
| • | the Non-U.S. Holder is a nonresident alien individual present in the United States for 183 days or more during the taxable year of the disposition and certain other requirements are met; or |
| • | our common stock constitutes a United States real property interest (“USRPI”) by reason of our status as a United States real property holding corporation (“USRPHC”) for U.S. federal income tax purposes. Generally, a domestic corporation is a USRPHC if the fair market value of its USRPIs equals or exceeds 50% of the sum of the fair market value of its worldwide real property interests plus its other assets used or held for use in its trade or business. |
Gain described in the first bullet point above generally will be subject to U.S. federal income tax on a net income basis at the regular graduated rates. A Non-U.S. Holder that is a corporation also may be subject to a branch profits tax at a rate of 30% (or such lower rate specified by an applicable income tax treaty) on its effectively connected earnings and profits (as adjusted for certain items), which will include such effectively connected gain.
A Non-U.S. Holder described in the second bullet point above will be subject to U.S. federal income tax at a rate of 30% (or such lower rate specified by an applicable income tax treaty) on any gain derived from the disposition, which may be offset by U.S. source capital losses of the Non-U.S. Holder (even though the individual is not considered a resident of the United States), provided the Non-U.S. Holder has timely filed U.S. federal income tax returns with respect to such losses.
With respect to the third bullet point above, we believe that we currently are, and expect to remain for the foreseeable future, a USRPHC for U.S. federal income tax purposes. However, so long as our common stock is “regularly traded on an established securities market,” a Non-U.S. Holder will be subject to U.S. federal net income tax on a disposition of our common stock only if the Non-U.S. Holder actually or constructively holds or held (at any time during the shorter of the five-year period preceding the date of disposition or the Non-U.S. Holder’s holding period) more than 5% of our common stock. If our common stock is not considered to be so traded, a Non-U.S. Holder generally would be subject to U.S. federal income tax on the gain realized on a disposition of our common stock and generally would be required to file a U.S. federal income tax return, and a 15% withholding tax would apply to the gross proceeds from such sale.
Non-U.S. Holders should also consult their tax advisors regarding potentially applicable income tax treaties that may provide for different rules.
127
Table of Contents
Information Reporting and Backup Withholding
Payments of dividends on our common stock will not be subject to backup withholding, provided the applicable withholding agent does not have actual knowledge or reason to know the Non-U.S. Holder is a United States person and the Non-U.S. Holder either certifies its non-U.S. status, such as by furnishing a valid IRS Form W-8BEN, W-8BEN-E or W-8ECI, or otherwise establishes an exemption. However, information returns are required to be filed with the IRS in connection with any dividends on our common stock paid to the Non-U.S. Holder, regardless of whether any tax was actually withheld. In addition, proceeds of the sale or other taxable disposition of our common stock within the United States or conducted through certain U.S.-related brokers generally will not be subject to backup withholding or information reporting if the applicable withholding agent receives the certification described above and does not have actual knowledge or reason to know that such Non-U.S. Holder is a United States person, or the Non-U.S. Holder otherwise establishes an exemption. Proceeds of a disposition of our common stock conducted through a non-U.S. office of a non-U.S. broker generally will not be subject to backup withholding or information reporting.
Copies of information returns that are filed with the IRS may also be made available under the provisions of an applicable treaty or agreement to the tax authorities of the country in which the Non-U.S. Holder resides or is established.
Backup withholding is not an additional tax. Any amounts withheld under the backup withholding rules may be allowed as a refund or a credit against a Non-U.S. Holder’s U.S. federal income tax liability, provided the required information is timely furnished to the IRS.
Additional Withholding Tax on Payments Made to Foreign Accounts
Withholding taxes may be imposed under Sections 1471 to 1474 of the Code (such Sections commonly referred to as the Foreign Account Tax Compliance Act, or “FATCA”) on certain types of payments made to non-U.S. financial institutions and certain other non-U.S. entities. Specifically, a 30% withholding tax may be imposed on dividends on, or gross proceeds from the sale or other disposition of, our common stock paid to a “foreign financial institution” or a “non-financial foreign entity” (each as defined in the Code) (including, in some cases, when such foreign financial institution or non-financial foreign entity is acting as an intermediary), unless (1) the foreign financial institution undertakes certain diligence and reporting obligations, (2) the non-financial foreign entity either certifies it does not have any “substantial United States owners” (as defined in the Code) or furnishes identifying information regarding each direct and indirect substantial United States owner, or (3) the foreign financial institution or non-financial foreign entity otherwise qualifies for an exemption from these rules and provides appropriate documentation (such as IRS Form W-8BEN-E). If the payee is a foreign financial institution and is subject to the diligence and reporting requirements in (1) above, it must enter into an agreement with the U.S. Department of the Treasury requiring, among other things, that it undertake to identify accounts held by certain “specified United States persons” or “United States-owned foreign entities” (each as defined in the Code), annually report certain information about such accounts, and withhold 30% on certain payments to non-compliant foreign financial institutions and certain other account holders. Foreign financial institutions located in jurisdictions that have an intergovernmental agreement with the United States governing FATCA may be subject to different rules.
Under the applicable Treasury Regulations and administrative guidance, withholding under FATCA generally applies to payments of dividends on our common stock, and will apply to payments of gross proceeds from the sale or other disposition of such stock on or after January 1, 2019.
Prospective investors should consult their tax advisors regarding the potential application of withholding under FATCA to their investment in our common stock.
128
Table of Contents
Under the terms and subject to the conditions contained in an underwriting agreement dated , , we and the selling stockholders have agreed to sell to the underwriters named below, for whom Credit Suisse Securities (USA) LLC and Goldman, Sachs & Co. are acting as representatives, the following respective numbers of shares of common stock:
| Underwriter |
Number of Shares |
|||
| Credit Suisse Securities (USA) LLC |
||||
| Goldman, Sachs & Co. |
||||
| Jefferies LLC |
||||
| Piper Jaffray & Co. |
||||
| Tudor, Pickering, Holt & Co. Securities, Inc. |
||||
| Deutsche Bank Securities Inc. |
||||
|
|
|
|||
| Total |
10,615,152 | |||
|
|
|
|||
The underwriting agreement provides that the underwriters are obligated to purchase all the shares of common stock in the offering if any are purchased, other than those shares covered by the over-allotment option described below. The underwriting agreement also provides that if an underwriter defaults on the purchase commitments of non-defaulting underwriters may be increased or the offering may be terminated.
The underwriters propose to offer the shares of common stock initially at the public offering price on the cover page of this prospectus and to selling group members at that price less a selling concession of $ per share. The underwriters and selling group members may allow a discount of $ per share on sales to other broker/dealers. After the initial public offering the representatives and underwriters may change the public offering price and concession and discount to broker/dealers. The offering of the shares by the underwriters is subject to receipt and acceptance and subject to the underwriters’ right to reject any order in whole or in part.
The selling stockholders have also granted the underwriters an option exercisable for 30 days after the date of this prospectus, to purchase, from time to time, in whole or in part, up to an aggregate of shares from the selling stockholders at the public offering price less underwriting discounts and commissions. The share amounts in the option assume that the public offering price is equal to $ per share (the mid-point of the price range set forth on the cover of this prospectus). To the extent that the option is exercised, each underwriter will be obligated, subject to certain conditions, to purchase its pro rata portion of these additional shares based on the underwriter’s underwriting commitment in this offering as indicated in the table at the beginning of this “Underwriting” section.
The following table summarizes the compensation and estimated expenses we and the selling stockholders will pay:
| Per Share | Total | |||||||||||||||
| Without Over-allotment |
With Over-allotment |
Without Over-allotment |
With Over-allotment |
|||||||||||||
| Underwriting Discounts and Commissions paid by us |
$ | $ | $ | $ | ||||||||||||
| Underwriting Discounts and Commissions paid by the selling stockholders |
$ | $ | $ | $ | ||||||||||||
The expenses of this offering that have been paid or are payable by us and the selling stockholders are estimated to be approximately $ million (excluding underwriting discounts and commissions). We have agreed to pay expenses incurred by the selling stockholders in connection with this offering, other than the underwriting discounts and commissions. We have also agreed to reimburse the underwriters for certain of their expenses in an amount up to $ .
129
Table of Contents
We have agreed, subject to certain exceptions, that we will not offer, sell, contract to sell, pledge or otherwise dispose of, directly or indirectly, or file with the SEC a registration statement under the Securities Act relating to, any shares of our common stock or securities convertible into or exchangeable or exercisable for any shares of our common stock, or publicly disclose the intention to make any offer, sale, pledge, disposition or filing, without the prior written consent of Credit Suisse Securities (USA) LLC and Goldman, Sachs & Co. for a period of 180 days after the date of this prospectus.
Our officers, directors and the selling stockholders have agreed, subject to certain exceptions, that they will not offer, sell, contract to sell, pledge or otherwise dispose of, directly or indirectly, any shares of our common stock or securities convertible into or exchangeable or exercisable for any shares of our common stock, enter into a transaction that would have the same effect, or enter into any swap, hedge or other arrangement that transfers, in whole or in part, any of the economic consequences of ownership of our common stock, whether any of these transactions are to be settled by delivery of our common stock or other securities, in cash or otherwise, or publicly disclose the intention to make any offer, sale, pledge or disposition, or to enter into any transaction, swap, hedge or other arrangement, without, in each case, the prior written consent of Credit Suisse Securities (USA) LLC and Goldman, Sachs & Co. for a period of 180 days after the date of this prospectus.
We and the selling stockholders have agreed to indemnify the underwriters against liabilities under the Securities Act, or contribute to payments that the underwriters may be required to make in that respect.
We have applied to list the shares of common stock on NASDAQ, under the symbol “SND.”
Prior to this offering, there has been no public market for our common stock. The initial public offering price was determined by negotiations among us, the selling stockholders and the representatives and will not necessarily reflect the market price of the common stock following this offering. The principal factors that were considered in determining the initial public offering price included:
| • | the information presented in this prospectus and otherwise available to the underwriters; |
| • | the history of, and prospects for, the industry in which we compete; |
| • | the ability of our management; |
| • | the prospects for our future earnings; |
| • | the present state of our development, results of operations and our current financial condition; |
| • | the general condition of the securities markets at the time of this offering; and |
| • | the recent market prices of, and the demand for, publicly traded common stock of generally comparable companies. |
We cannot assure you that the initial public offering price will correspond to the price at which the common stock will trade in the public market subsequent to this offering or that an active trading market for the common stock will develop and continue after this offering.
In connection with the offering the underwriters may engage in stabilizing transactions, over-allotment transactions, syndicate covering transactions, penalty bids and passive market making in accordance with Regulation M under the Exchange Act.
| • | Stabilizing transactions permit bids to purchase the underlying security so long as the stabilizing bids do not exceed a specified maximum. |
| • | Over-allotment involves sales by the underwriters of shares in excess of the number of shares the underwriters are obligated to purchase, which creates a syndicate short position. The short position may be either a covered short position or a naked short position. In a covered short position, the number of shares over-allotted by the underwriters is not greater than the number of shares that they may purchase in |
130
Table of Contents
| the over-allotment option. In a naked short position, the number of shares involved is greater than the number of shares in the over-allotment option. The underwriters may close out any covered short position by either exercising their over-allotment option and/or purchasing shares in the open market. |
| • | Syndicate covering transactions involve purchases of the common stock in the open market after the distribution has been completed in order to cover syndicate short positions. In determining the source of shares to close out the short position, the underwriters will consider, among other things, the price of shares available for purchase in the open market as compared to the price at which they may purchase shares through the over-allotment option. If the underwriters sell more shares than could be covered by the over-allotment option, a naked short position, the position can only be closed out by buying shares in the open market. A naked short position is more likely to be created if the underwriters are concerned that there could be downward pressure on the price of the shares in the open market after pricing that could adversely affect investors who purchase in the offering. |
| • | Penalty bids permit the representatives to reclaim a selling concession from a syndicate member when the common stock originally sold by the syndicate member is purchased in a stabilizing or syndicate covering transaction to cover syndicate short positions. |
| • | In passive market making, market makers in the common stock who are underwriters or prospective underwriters may, subject to limitations, make bids for or purchases of our common stock until the time, if any, at which a stabilizing bid is made. |
These stabilizing transactions, syndicate covering transactions and penalty bids may have the effect of raising or maintaining the market price of our common stock or preventing or retarding a decline in the market price of the common stock. As a result the price of our common stock may be higher than the price that might otherwise exist in the open market. These transactions may be effected on NASDAQ or otherwise and, if commenced, may be discontinued at any time.
A prospectus in electronic format may be made available on the web sites maintained by one or more of the underwriters, or selling group members, if any, participating in this offering and one or more of the underwriters participating in this offering may distribute prospectuses electronically. The representatives may agree to allocate a number of shares to underwriters and selling group members for sale to their online brokerage account holders. Internet distributions will be allocated by the underwriters and selling group members that will make internet distributions on the same basis as other allocations
In addition, in the ordinary course of their business activities, the underwriters and their affiliates may make or hold a broad array of investments and actively trade debt and equity securities (or related derivative securities) and financial instruments (including bank loans) for their own account and for the accounts of their customers. These investments and securities activities may involve securities and/or instruments of ours or our affiliates. The underwriters and their affiliates may also make investment recommendations and/or publish or express independent research views in respect of such securities or financial instruments and may hold, or recommend to clients that they acquire, long and/or short positions in such securities and instruments.
Selling Restrictions:
Notice to Canadian Residents
Resale Restrictions
The distribution of our common stock in Canada is being made only in the provinces of Ontario, Quebec, Alberta and British Columbia on a private placement basis exempt from the requirement that we prepare and file a prospectus with the securities regulatory authorities in each province where trades of these securities are made. Any resale of our common stock in Canada must be made under applicable securities laws which may vary
131
Table of Contents
depending on the relevant jurisdiction, and which may require resales to be made under available statutory exemptions or under a discretionary exemption granted by the applicable Canadian securities regulatory authority. Purchasers are advised to seek legal advice prior to any resale of the securities.
Representations of Canadian Purchasers
By purchasing our common stock in Canada and accepting delivery of a purchase confirmation, a purchaser is representing to us and the dealer from whom the purchase confirmation is received that:
| • | the purchaser is entitled under applicable provincial securities laws to purchase our common stock without the benefit of a prospectus qualified under those securities laws as it is an “accredited investor” as defined under National Instrument 45-106—Prospectus Exemptions, |
| • | the purchaser is a “permitted client” as defined in National Instrument 31-103—Registration Requirements, Exemptions and Ongoing Registrant Obligations, |
| • | where required by law, the purchaser is purchasing as principal and not as agent, and |
| • | the purchaser has reviewed the text above under Resale Restrictions. |
Conflicts of Interest
Canadian purchasers are hereby notified that the underwriters are relying on the exemption set out in section 3A.3 or 3A.4, if applicable, of National Instrument 33-105—Underwriting Conflicts from having to provide certain conflict of interest disclosure in this document.
Statutory Rights of Action
Securities legislation in certain provinces or territories of Canada may provide a purchaser with remedies for rescission or damages if the offering memorandum (including any amendment thereto) such as this document contains a misrepresentation, provided that the remedies for rescission or damages are exercised by the purchaser within the time limit prescribed by the securities legislation of the purchaser’s province or territory. The purchaser of these securities in Canada should refer to any applicable provisions of the securities legislation of the purchaser’s province or territory for particulars of these rights or consult with a legal advisor.
Enforcement of Legal Rights
All of our directors and officers as well as the experts named herein may be located outside of Canada and, as a result, it may not be possible for Canadian purchasers to effect service of process within Canada upon us or those persons. All or a substantial portion of our assets and the assets of those persons may be located outside of Canada and, as a result, it may not be possible to satisfy a judgment against us or those persons in Canada or to enforce a judgment obtained in Canadian courts against us or those persons outside of Canada.
Taxation and Eligibility for Investment
Canadian purchasers of our common stock should consult their own legal and tax advisors with respect to the tax consequences of an investment in our common stock in their particular circumstances and about the eligibility of our common stock for investment by the purchaser under relevant Canadian legislation.
United Kingdom
This document is only being distributed to and is only directed at (i) persons who are outside the United Kingdom or (ii) investment professionals falling within Article 19(5) of the Financial Services and Markets Act 2000 (Financial Promotion) Order 2005 (the “Order”) or (iii) high net worth entities, and other persons to
132
Table of Contents
whom it may lawfully be communicated, falling with Article 49(2)(a) to (d) of the Order (all such persons together being referred to as “relevant persons”). The securities are only available to, and any invitation, offer or agreement to subscribe, purchase or otherwise acquire such securities will be engaged in only with, relevant persons. Any person who is not a relevant person should not act or rely on this document or any of its contents.
European Economic Area
In relation to each Member State of the European Economic Area which has implemented the Prospectus Directive (each, a “Relevant Member State”), each underwriter has represented and agreed that with effect from and including the date on which the Prospectus Directive is implemented in that Relevant Member State it has not made and will not make an offer of common stock which are the subject of the offering contemplated by this prospectus to the public in that Relevant Member State other than:
| • | to any legal entity which is a “qualified investor” as defined in the Prospectus Directive; |
| • | to fewer than 150 natural or legal persons (other than “qualified investors” as defined in the Prospectus Directive), per Relevant Member State, subject to obtaining the prior consent of the underwriters; or |
| • | in any other circumstances falling within Article 3(2) of the Prospectus Directive, |
provided that no such offer of common stock shall result in a requirement for us or any underwriter to publish a prospectus pursuant to Article 3 of the Prospectus Directive or a supplemental prospectus pursuant to Article 16 of the Prospectus Directive.
For the purposes of this provision, the expression an “offer of common stock to the public” in relation to any common stock in any Relevant Member State means the communication in any form and by any means of sufficient information on the terms of the offer and the common stock to be offered so as to enable an investor to decide to purchase or subscribe for the common stock, as the same may be varied in that Relevant Member State by any measure implementing the Prospectus Directive in that Relevant Member State. The expression “Prospectus Directive” means Directive 2003/71/EC (as amended, including by Directive 2010/73/EU), and includes any relevant implementing measure in the Relevant Member State.
Hong Kong
The shares have not been offered or sold and will not be offered or sold in Hong Kong, by means of any document, other than (a) to “professional investors” as defined in the Securities and Futures Ordinance (Cap. 571) of Hong Kong and any rules made under that Ordinance; or (b) in other circumstances which do not result in the document being a “prospectus” as defined in the Companies Ordinance (Cap. 32) of Hong Kong or which do not constitute an offer to the public within the meaning of that Ordinance. No advertisement, invitation or document relating to the shares has been or may be issued or has been or may be in the possession of any person for the purposes of issue, whether in Hong Kong or elsewhere, which is directed at, or the contents of which are likely to be accessed or read by, the public of Hong Kong (except if permitted to do so under the securities laws of Hong Kong) other than with respect to shares which are or are intended to be disposed of only to persons outside Hong Kong or only to “professional investors” as defined in the Securities and Futures Ordinance (Cap. 571) of Hong Kong and any rules made under that Ordinance.
Japan
The shares have not been and will not be registered under the Financial Instruments and Exchange Law of Japan (Law No. 25 of 1948, as amended) and, accordingly, will not be offered or sold, directly or indirectly, in Japan, or for the benefit of any Japanese Person or to others for re-offering or resale, directly or indirectly, in Japan or to any Japanese Person, except in compliance with all applicable laws, regulations and ministerial
133
Table of Contents
guidelines promulgated by relevant Japanese governmental or regulatory authorities in effect at the relevant time. For the purposes of this paragraph, “Japanese Person” shall mean any person resident in Japan, including any corporation or other entity organized under the laws of Japan.
Singapore
This prospectus has not been registered as a prospectus with the Monetary Authority of Singapore. Accordingly, this prospectus and any other document or material in connection with the offer or sale, or invitation for subscription or purchase, of the shares may not be circulated or distributed, nor may the shares be offered or sold, or be made the subject of an invitation for subscription or purchase, whether directly or indirectly, to persons in Singapore other than (i) to an institutional investor under Section 274 of the Securities and Futures Act, Chapter 289 of Singapore (the “SFA”), (ii) to a relevant person pursuant to Section 275(1), or any person pursuant to Section 275(1A), and in accordance with the conditions specified in Section 275, of the SFA, or (iii) otherwise pursuant to, and in accordance with the conditions of, any other applicable provision of the SFA.
Where the shares are subscribed or purchased under Section 275 of the SFA by a relevant person which is:
| (a) | a corporation (which is not an accredited investor (as defined in Section 4A of the SFA)) the sole business of which is to hold investments and the entire share capital of which is owned by one or more individuals, each of whom is an accredited investor; or |
| (b) | a trust (where the trustee is not an accredited investor) whose sole purpose is to hold investments and each beneficiary of the trust is an individual who is an accredited investor, |
securities (as defined in Section 239(1) of the SFA) of that corporation or the beneficiaries’ rights and interest (howsoever described) in that trust shall not be transferred within six months after that corporation or that trust has acquired the shares pursuant to an offer made under Section 275 of the SFA except:
| (a) | to an institutional investor or to a relevant person defined in Section 275(2) of the SFA, or to any person arising from an offer referred to in Section 275(1A) or Section 276(4)(i)(B) of the SFA; |
| (b) | where no consideration is or will be given for the transfer; |
| (c) | where the transfer is by operation of law; |
| (d) | as specified in Section 276(7) of the SFA; or |
| (e) | as specified in Regulation 32 of the Securities and Futures (Offers of Investments) (Shares and Debentures) Regulations 2005 of Singapore. |
134
Table of Contents
The validity of the shares of common stock offered by this prospectus will be passed upon for us by Latham & Watkins LLP, Houston, Texas. Certain legal matters in connection with this offering will be passed upon for the underwriters by Vinson & Elkins L.L.P., Houston, Texas.
The audited consolidated financial statements included in this prospectus and elsewhere in the registration statement have been so included in reliance upon the report of Grant Thornton LLP, independent registered public accountants, upon the authority of said firm as experts in accounting and auditing.
The information appearing in this prospectus concerning estimates of our proven mineral reserves was derived from the report of John T. Boyd Company, independent mining engineers and geologists, and has been included herein on the authority of John T. Boyd Company as experts with respect to the matters covered by such report and in giving such report.
The information appearing in this prospectus concerning the crush strength of our raw frac sand and attributed to Stim-Lab, Inc. was derived from the results of third party testing performed by, and summarized in reports of, Stim-Lab, Inc. and has been included herein on the authority of Stim-Lab, Inc. as experts with respect to the matters covered by such reports and in giving such reports.
WHERE YOU CAN FIND ADDITIONAL INFORMATION
We have filed with the SEC a registration statement on Form S-1 relating to the shares of common stock offered by this prospectus. This prospectus, which constitutes a part of the registration statement, does not contain all of the information set forth in the registration statement. For further information regarding us and the shares of common stock offered by this prospectus, we refer you to the full registration statement, including its exhibits and schedules, filed under the Securities Act. The registration statement, of which this prospectus constitutes a part, including its exhibits and schedules, may be inspected and copied at the SEC’s Public Reference Room at 100 F Street, N.E., Washington, D.C. 20549. Copies of the materials may also be obtained from the SEC at prescribed rates by writing to the Public Reference Room. You may obtain information on the operation of the Public Reference Room by calling the SEC at 1-800-SEC-0330.
The SEC maintains a website at http://www.sec.gov that contains reports, information statements and other information regarding issuers that file electronically with the SEC. Our registration statement, of which this prospectus constitutes a part, can be downloaded from the SEC’s website. After the completion of this offering, we will file with or furnish to the SEC periodic reports and other information. These reports and other information may be inspected and copied at the Public Reference Room maintained by the SEC or obtained from the SEC’s website as provided above. Following the completion of this offering, our website will be located at www.smartsand.com. We intend to make our periodic reports and other information filed with or furnished to the SEC available, free of charge, through our website, as soon as reasonably practicable after those reports and other information are electronically filed with or furnished to the SEC. Information on our website or any other website is not incorporated by reference into this prospectus and does not constitute a part of this prospectus.
We intend to furnish or make available to our stockholders annual reports containing our audited financial statements prepared in accordance with GAAP. We also intend to furnish or make available to our stockholders quarterly reports containing our unaudited interim financial information, including the information required by Form 10-Q, for the first three fiscal quarters of each fiscal year.
135
Table of Contents
This prospectus contains forward-looking statements. Statements that are predictive in nature, that depend upon or refer to future events or conditions or that include the words “believe,” “expect,” “anticipate,” “intend,” “estimate” and other expressions that are predictions of or indicate future events and trends and that do not relate to historical matters identify forward-looking statements. Our forward-looking statements include statements about our business strategy, our industry, our future profitability, our expected capital expenditures and the impact of such expenditures on our performance, the costs of being a publicly traded corporation and our capital programs.
A forward-looking statement may include a statement of the assumptions or bases underlying the forward-looking statement. We believe that we have chosen these assumptions or bases in good faith and that they are reasonable. You are cautioned not to place undue reliance on any forward-looking statements. You should also understand that it is not possible to predict or identify all such factors and should not consider the following list to be a complete statement of all potential risks and uncertainties. Factors that could cause our actual results to differ materially from the results contemplated by such forward-looking statements include:
| • | large or multiple customer defaults, including defaults resulting from actual or potential insolvencies; |
| • | the level of production of crude oil, natural gas and other hydrocarbons and the resultant market prices of crude oil, natural gas, natural gas liquids and other hydrocarbons; |
| • | changes in general economic and geopolitical conditions; |
| • | competitive conditions in our industry; |
| • | changes in the long-term supply of and demand for oil and natural gas; |
| • | actions taken by our customers, competitors and third-party operators; |
| • | changes in the availability and cost of capital; |
| • | our ability to successfully implement our business plan; |
| • | our ability to complete growth projects on time and on budget; |
| • | the price and availability of debt and equity financing (including changes in interest rates); |
| • | changes in our tax status; |
| • | technological changes; |
| • | operating hazards, natural disasters, weather-related delays, casualty losses and other matters beyond our control; |
| • | the effects of existing and future laws and governmental regulations (or the interpretation thereof); |
| • | failure to secure or maintain contracts with our largest customers or non-performance of any of those customers under the applicable contract; |
| • | the effects of future litigation; and |
| • | other factors discussed in this prospectus. |
You should not place undue reliance on our forward-looking statements. Although forward-looking statements reflect our good faith beliefs at the time they are made, forward-looking statements involve known and unknown risks, uncertainties and other factors, including the factors described under “Risk Factors,” which may cause our actual results, performance or achievements to differ materially from anticipated future results, performance or achievements expressed or implied by such forward-looking statements. We undertake no obligation to publicly update or revise any forward-looking statement, whether as a result of new information, future events, changed circumstances or otherwise, unless required by law.
136
Table of Contents
Smart Sand, Inc.
Historical Consolidated Financial Statements
F-1
Table of Contents
SMART SAND, INC.
UNAUDITED CONSOLIDATED BALANCE SHEETS
| June 30, 2016 (unaudited) |
December 31, 2015 |
|||||||
| (in thousands, except per share data) | ||||||||
| Assets |
||||||||
| Current assets: |
||||||||
| Cash |
$ | 1,867 | $ | 3,896 | ||||
| Accounts and unbilled receivables, net, of which $346 is unbilled receivables at June 30, 2016 and $4,021 at December 31, 2015, respectively |
2,613 | 6,041 | ||||||
| Inventories, net |
4,349 | 4,181 | ||||||
| Prepaid expenses and other current assets |
862 | 1,524 | ||||||
|
|
|
|
|
|||||
| Total current assets |
9,691 | 15,642 | ||||||
| Inventories, long-term |
7,384 | 7,961 | ||||||
| Property, plant and equipment, net |
106,451 | 108,928 | ||||||
| Deferred financing costs, net |
404 | 486 | ||||||
| Other assets |
33 | 33 | ||||||
|
|
|
|
|
|||||
| Total assets |
$ | 123,963 | $ | 133,050 | ||||
|
|
|
|
|
|||||
| Liabilities and Stockholders’ Equity |
||||||||
| Current liabilities: |
||||||||
| Accounts payable |
$ | 930 | $ | 1,170 | ||||
| Accrued and other expenses |
2,559 | 3,778 | ||||||
| Deferred revenue |
6,229 | 7,133 | ||||||
| Income taxes payable |
2,425 | — | ||||||
| Current portion of equipment financing obligations |
740 | 409 | ||||||
| Current portion of notes payable |
712 | 1,369 | ||||||
| Redeemable Series A preferred stock $0.001 par value, 100,000 shares authorized, 38,266 and 35,552 issued and outstanding as of June 30, 2016 and December 31, 2015, respectively |
37,888 | 34,708 | ||||||
|
|
|
|
|
|||||
| Total current liabilities |
51,483 | 48,567 | ||||||
| Revolving credit facility, net |
57,197 | 63,254 | ||||||
| Equipment financing obligations, net of current portion |
717 | 1,246 | ||||||
| Notes payable, net of current portion |
288 | 569 | ||||||
| Deferred tax liabilities, long-term, net |
10,959 | 14,505 | ||||||
| Asset retirement obligation |
1,216 | 1,180 | ||||||
|
|
|
|
|
|||||
| Total liabilities |
121,860 | 129,321 | ||||||
| Commitments and contingencies (Note 20) |
||||||||
| Stockholders’ equity |
||||||||
| Common stock, $0.001 par value, 15,000 shares authorized, 10,077 and 10,052 issued and outstanding at June 30, 2016 and December 31, 2015, respectively |
— | — | ||||||
| Treasury stock, at cost, 18.0 shares and 11.3 shares respectively at June 30, 2016 and December 31, 2015, respectively |
(178 | ) | (123 | ) | ||||
| Additional paid-in capital |
4,564 | 4,168 | ||||||
| Accumulated deficit |
(2,283 | ) | (316 | ) | ||||
|
|
|
|
|
|||||
| Total stockholders’ equity |
2,103 | 3,729 | ||||||
|
|
|
|
|
|||||
| Total liabilities and stockholders’ equity |
$ | 123,963 | $ | 133,050 | ||||
|
|
|
|
|
|||||
The accompanying notes are an integral part of these unaudited consolidated financial statements.
F-2
Table of Contents
SMART SAND, INC.
UNAUDITED CONSOLIDATED STATEMENTS OF OPERATIONS AND
COMPREHENSIVE INCOME (LOSS)
| Six Months Ended June 30, 2016 | ||||||||
| 2016 | 2015 | |||||||
| (in thousands, except per share data) | ||||||||
| Revenues |
$ | 18,853 | $ | 23,525 | ||||
| Cost of goods sold |
11,869 | 12,288 | ||||||
|
|
|
|
|
|||||
| Gross profit |
6,984 | 11,237 | ||||||
| Operating expenses: |
||||||||
| Salaries, benefits and payroll taxes |
2,295 | 2,828 | ||||||
| Depreciation and amortization |
181 | 169 | ||||||
| Selling, general and administrative |
1,926 | 2,547 | ||||||
|
|
|
|
|
|||||
| Total operating expenses |
4,402 | 5,544 | ||||||
|
|
|
|
|
|||||
| Operating income |
2,582 | 5,693 | ||||||
| Other (expenses) income: |
||||||||
| Preferred stock interest expense |
(3,123 | ) | (2,434 | ) | ||||
| Other interest expense |
(1,671 | ) | (1,048 | ) | ||||
| Other income |
189 | 351 | ||||||
|
|
|
|
|
|||||
| Total other expenses |
(4,605 | ) | (3,131 | ) | ||||
|
|
|
|
|
|||||
| Income (loss) before income tax (benefit) expense |
(2,023 | ) | 2,562 | |||||
| Income tax (benefit) expense |
(56 | ) | 1,633 | |||||
|
|
|
|
|
|||||
| Net (loss) income |
$ | (1,967 | ) | $ | 929 | |||
|
|
|
|
|
|||||
| Per share information: |
||||||||
| Net (loss) income per common share: |
||||||||
| Basic |
$ | (195.20 | ) | $ | 92.51 | |||
| Diluted |
$ | (195.20 | ) | $ | 77.39 | |||
| Weighted-average number of common shares: |
||||||||
| Basic |
10,077 | 10,042 | ||||||
| Diluted |
12,016 | 12,004 | ||||||
The accompanying notes are an integral part of these unaudited consolidated financial statements.
F-3
Table of Contents
SMART SAND, INC.
UNAUDITED CONSOLIDATED STATEMENTS OF CHANGES IN STOCKHOLDERS’ EQUITY
| Common Stock | Treasury Stock |
Additional Paid-in Capital |
Accumulated Deficit |
Total Stockholders’ Equity |
||||||||||||||||||||
| Outstanding Shares |
Par Value |
|||||||||||||||||||||||
| (in thousands, except per share data) | ||||||||||||||||||||||||
| Balance at December 31, 2015 |
10,052 | $ | — | $ | (123 | ) | $ | 4,168 | $ | (316 | ) | $ | 3,729 | |||||||||||
| Vesting of restricted stock |
32 | — | — | — | — | — | ||||||||||||||||||
| Stock-based compensation, inclusive of $24 tax benefit |
— | — | — | 396 | — | 396 | ||||||||||||||||||
| Restricted stock buy back |
(7 | ) | — | (55 | ) | — | — | (55 | ) | |||||||||||||||
| Net income (loss) |
— | — | — | (1,967 | ) | (1,967 | ) | |||||||||||||||||
|
|
|
|
|
|
|
|
|
|
|
|
|
|||||||||||||
| Balance at June 30, 2016 |
10,077 | $ | — | $ | (178 | ) | $ | 4,564 | $ | (2,283 | ) | $ | 2,103 | |||||||||||
|
|
|
|
|
|
|
|
|
|
|
|
|
|||||||||||||
The accompanying notes are an integral part of these unaudited consolidated financial statements.
F-4
Table of Contents
SMART SAND, INC.
UNAUDITED CONSOLIDATED STATEMENTS OF CASH FLOWS
| Six Months Ended June 30, 2016 | ||||||||
| 2016 | 2015 | |||||||
| (in thousands) | ||||||||
| Operating activities: |
||||||||
| Net (loss) income |
$ | (1,967 | ) | $ | 929 | |||
| Adjustments to reconcile net income to net cash provided by (used in) operating activities: |
||||||||
| Depreciation, depletion and amortization of asset retirement obligation |
3,227 | 2,342 | ||||||
| (Gain) loss on disposal of assets |
(30 | ) | 45 | |||||
| Loss on derivatives |
5 | 335 | ||||||
| Provision for bad debt |
119 | — | ||||||
| Amortization of deferred financing cost |
80 | 70 | ||||||
| Accretion of debt discount |
159 | 145 | ||||||
| Deferred income taxes |
(3,568 | ) | 162 | |||||
| Stock-based compensation, net |
420 | 416 | ||||||
| Non-cash interest expense on revolving credit facility |
— | 706 | ||||||
| Non-cash interest expense on Series A preferred stock |
3,123 | 2,434 | ||||||
| Changes in assets and liabilities: |
||||||||
| Accounts and unbilled receivables |
3,309 | 3,441 | ||||||
| Inventories |
408 | (355 | ) | |||||
| Prepaid expenses and other assets |
667 | 1,541 | ||||||
| Deferred revenue |
(904 | ) | — | |||||
| Accounts payable |
(240 | ) | (558 | ) | ||||
| Accrued and other expenses |
(1,163 | ) | (237 | ) | ||||
| Income taxes payable |
2,425 | 30 | ||||||
|
|
|
|
|
|||||
| Net cash provided by operating activities |
6,070 | 11,446 | ||||||
|
|
|
|
|
|||||
| Investing activities: |
||||||||
| Purchases of property, plant and equipment |
(761 | ) | (21,806 | ) | ||||
| Proceeds from disposal of assets |
71 | — | ||||||
|
|
|
|
|
|||||
| Net cash used in investing activities |
(690 | ) | (21,806 | ) | ||||
|
|
|
|
|
|||||
| Financing activities: |
||||||||
| Repayments of notes payable |
(938 | ) | (54 | ) | ||||
| Payments under equipment financing obligations |
(198 | ) | (189 | ) | ||||
| Payment of deferred financing and amendment costs |
1 | (24 | ) | |||||
| Proceeds from revolving credit facility |
— | 11,000 | ||||||
| Repayment of revolving credit facility |
(6,216 | ) | (647 | ) | ||||
| Cash dividend on Series A preferred stock |
(2 | ) | (2 | ) | ||||
| Purchase of treasury stock |
(55 | ) | (101 | ) | ||||
|
|
|
|
|
|||||
| Net cash (used in) provided by financing activities |
(7,408 | ) | 9,983 | |||||
|
|
|
|
|
|||||
| Net decrease in cash |
(2,028 | ) | (377 | ) | ||||
| Cash at beginning of period |
3,896 | 802 | ||||||
|
|
|
|
|
|||||
| Cash at end of period |
$ | 1,868 | $ | 425 | ||||
|
|
|
|
|
|||||
| Non-cash activities: |
||||||||
| Financing: |
||||||||
| Equipment purchased with debt |
$ | — | $ | 1,080 | ||||
| Capitalized expenditures in accounts payable and accrued expenses |
987 | 5,204 | ||||||
| Cash paid for: |
||||||||
| Interest |
1,772 | 1,140 | ||||||
| Income taxes paid |
76 | 369 | ||||||
The accompanying notes are an integral part of these unaudited consolidated financial statements.
F-5
Table of Contents
SMART SAND, INC.
NOTES TO THE CONSOLIDATED FINANCIAL STATEMENTS (UNAUDITED)
For the Six Months Ended June 30, 2016 and 2015
(Dollars in thousands, except per share and percentage data)
1. Organization and Nature of Business
Smart Sand, Inc. and its subsidiaries (collectively, the “Company”) headquartered in The Woodlands, Texas, was incorporated in July 2011. The Company is engaged in the excavation, processing and sale of industrial sand, or proppant, for use in hydraulic fracturing operations for the oil and gas industry. The Company completed construction of the first phase of its primary facility in Oakdale, Wisconsin and commenced operations in July 2012.
Immaterial Correction
The Company discovered that an immaterial correction should be made relating to the amortization of deferred transaction costs associated with the issuance of the Company’s outstanding preferred shares. The Company has been amortizing the deferred costs into interest expense from the date of issuance to the mandatory redemption date of the preferred shares, which is September 13, 2016. In March 2014, the Company redeemed certain preferred shares prior to the mandatory redemption date and wrote off a portion of the transaction costs as part of the early redemption. The Company never adjusted the quarterly amortization amount for the portion previously written off. The Company concluded the amounts were immaterial to its 2016 and 2015 interim financial statements in accordance with the guidance in SEC Staff Accounting Bulletin (SAB) No. 99 “Materiality” and SAB No. 108 “Considering the Effects of Prior Year Misstatements when Quantifying Misstatements in the Current Year Financial Statements.” As a result, the correction resulted in a decrease in interest expense and corresponding increase to net income by $246 for the six months ended June 30, 2016 and 2015, respectively. The correction also resulted in a decrease to current liabilities by $1,107 and $861 as of June 30, 2016 and December 31, 2015, respectively. The immaterial correction did not impact the statement of cash flows or cash paid for interest. Basic and diluted loss per share each decreased by $24.42 for the six months ended June 30, 2016. Basic and diluted earnings per share increased by $24.50 and 20.50, respectively, for the six months ended June 30, 2015.
2. Basis of Presentation
General
The accompanying unaudited interim consolidated financial statements (“interim statements”) of the Company have been prepared in accordance with accounting principles generally accepted in the United States (“GAAP”) for interim financial information and with the instructions to Form 10-Q and Article 10 of Regulation S-X issued by the U.S. Securities and Exchange Commission. Accordingly, they do not include all of the information and footnotes required by GAAP for complete financial statements. In the opinion of management, all adjustments and disclosures necessary for a fair presentation of these interim statements have been included. The results reported in these interim statements are not necessarily indicative of the results that may be reported for the entire year. The consolidated balance sheet as of December 31, 2015 was derived from the audited consolidated financial statements as of and for the year ended December 31, 2015. These interim statements should be read in conjunction with the Company’s consolidated financial statements for the year ended December 31, 2015.
3. Summary of Significant Accounting Policies
Use of Estimates
The preparation of financial statements in accordance with GAAP requires management to make estimates and assumptions that affect the reported amounts of assets and liabilities and disclosure of contingent liabilities at the date of the financial statements, and the reported amounts of revenues and expenses during the reporting period. Significant estimates used in the preparation of these financial statements include, but are not limited to,
F-6
Table of Contents
the sand reserves and its impact on calculating the depletion expense under the units-of-production method; the depreciation associated with property and equipment, impairment considerations of those assets; estimated cost of future asset retirement obligations; stock-based compensation; recoverability of deferred tax assets; inventory reserve; collectability of receivables and certain liabilities. Actual results could differ from management’s best estimates as additional information or actual results become available in the future, and those differences could be material.
The Company utilizes significant estimates and assumptions in determining the fair value of its common stock. The Company determined the estimated fair value of the preferred and common stock based on a number of objective and subjective factors, including external market conditions affecting its industry, market comparables and future discounted cash flows.
Revenue Recognition
The Company recognizes revenue when persuasive evidence of an arrangement exists, delivery of products has occurred, the sales price charged is fixed or determinable, collectability is reasonably assured, and the risk of loss is transferred to the customer. The Company’s sales are generally free carrier (“FCA”), payment made at the origination point at the Company’s facility, and title passes as the product is loaded into rail cars hired by the customer. Certain spot-rate customers have shipping terms of FCA, payment made at the destination; the Company recognizes this revenue when the sand is received at the destination.
The Company derives its revenue by mining and processing sand that its customers purchase. Its revenues are primarily a function of the price per ton realized and the volumes sold. In some instances, its revenues may also include a monthly reservation charge, at agreed-upon terms with its customers, or a charge for transportation services it provides to its customers. The Company’s transportation revenue fluctuates based on a number of factors, including the volume of product it transports and the distance between its plant and customers. The Company’s reservation revenue fluctuates based on negotiated contract terms and is recognized only when rights of use are expired; until such rights are expired, reservation charges are recorded as deferred revenue.
The Company sells a limited amount of its products under short-term price agreements or at prevailing market rates. The majority of the Company’s revenues are realized through take-or-pay supply agreements with five customers. The expiration dates of these contracts range from 2016 through 2020; however, certain contracts include extension periods, as defined in the respective contracts. These agreements define, among other commitments, the volume of product that its customers must purchase, the volume of product that the Company must provide, and the price that the Company will charge and that its customers will pay for each ton of contracted product. Prices under these agreements are generally either fixed or indexed to the Average Cushing Oklahoma WTI Spot Prices and subject to adjustment, upward or downward, only for certain changes in published producer cost indices or market factors. As a result, the Company’s realized prices may not grow at rates consistent with broader industry pricing. For example, during periods of rapid price growth, its realized prices may grow more slowly than those of competitors, and during periods of price decline, its realized prices may outperform industry averages. With respect to the take-or-pay arrangements, if the customer is not allowed to make up deficiencies, the Company recognizes revenues of the minimum contracted quantity and minimum contract price, assuming payment has been received or is reasonably assured. If deficiencies can be made up, amounts billed and collected in excess of actual sales are recognized as deferred revenues until production is actually taken by the customer or the right to make up deficiencies expires. These agreements generally provide that, if the Company is unable to deliver the contracted minimum volumes, the customer has the right to purchase replacement product from alternative sources, provided that the inability to supply is not the result of an excusable delay, as defined in these agreements. In the event that the price of the replacement product exceeds the contract price and the inability to supply the contracted minimum volume is not the result of an excusable delay, the Company is responsible for the difference.
F-7
Table of Contents
The Company also recognizes revenue on the rental of its leased rail car fleet (Note 20) to customers either under long-term contracts or on an as-used basis. For the six months ended June 30, 2016 and 2015, the Company recognized $2,942 and $1,656 of rail car revenue, respectively.
For the six months ended June 30, 2016 and 2015, the Company recognized $2,997 and $0 of revenue relating to minimum required payments under take-or-pay contracts, respectively. For the six months ended June 30, 2016 and 2015, the Company recognized $5,541 and $0 of monthly reservation charges required under certain customer contracts.
At June 30, 2016 and December 31, 2015, the Company determined that no amounts related to minimum commitments under customer contracts were due or payable to the Company.
Accounts and Unbilled Receivables
Accounts receivable represents customer transactions that have been invoiced as of the balance sheet date; unbilled receivables represent customer transactions that have not yet been invoiced as of the balance sheet date. Accounts receivable are due within 30 days, or in accordance with terms agreed upon with customers, and are stated at amounts due from customers net of any allowance for doubtful accounts. The Company considers accounts outstanding longer than the payment terms past due. The Company determines the allowance by considering a number of factors, including the length of time trade accounts receivable are past due, previous loss history, the customer’s current ability to pay its obligation, and the condition of the general economy and the industry as a whole. Accounts receivables are written off when they are deemed uncollectible, and payments subsequently received on such receivables are credited to bad debt expense. As of June 30, 2016 and December 31, 2015, the Company maintained an allowance for doubtful accounts of $119 and $0, respectively.
Deferred Revenue
The Company receives advance payments from certain customers in order to secure and procure a reliable provision and delivery of product. The Company classifies such advances as current or noncurrent liabilities depending upon the anticipated timing of delivery of the supplied product. Revenue is recognized upon the delivery of the product.
The Company may receive an advance payment from a customer, based on the terms of the customer’s long-term contract, for a certain volume of product to be delivered. Revenue is recognized as product is delivered and the deferred revenue is reduced.
The deferred revenue balance at June 30, 2016 and December 31, 2015 was $6,229 and $7,133, respectively.
Shipping
Shipping costs are classified as cost of sales. Shipping costs consist of railway transportation costs to deliver products to customers. Shipping revenue is classified as revenue. Revenue generated from shipping was $121 and $2,294, respectively, for the six months ended June 30, 2016 and 2015, respectively. Cost of sales generated from shipping was $157 and $2,257 for the six months ended June 30, 2016 and 2015, respectively.
Inventories
The Company’s sand inventory consists of raw material (sand that has been excavated but not processed), work-in-progress (sand that has undergone some but not all processing) and finished goods (sand that has been completely processed and is ready for sale). The spare parts inventory consists of critical spare parts.
F-8
Table of Contents
Sand inventory is stated at the lower of cost or market using the average cost method. For the six months ended June 30, 2016 and 2015, the Company had no write-down of inventory as a result of any lower of cost or market assessment. Costs applied to the inventory include direct excavation costs, processing costs, overhead allocation, depreciation and depletion. Stockpile tonnages are calculated by measuring the number of tons added and removed from the stockpile. Costs are calculated on a per ton basis and are applied to the stockpiles based on the number of tons in the stockpile. The Company performs quarterly physical inventory measurements to verify the quantity of inventory on hand. Due to variation in sand density and moisture content and production processes utilized to manufacture the Company’s products, physical inventories will not necessarily detect all variances. To mitigate this risk, the Company recognizes a yield adjustment on its inventories.
Spare parts inventory is accounted for on a first-in, first-out basis at the lower of cost or market.
Deferred Financing Charges
Direct costs incurred in connection with the revolving credit facility have been capitalized and are being amortized using the straight-line method, which approximates the effective interest method, over the life of the debt. Fees attributable to the lender of $1,664 are presented as a discount to the carrying value of debt.
Amortization expense of the deferred financing charges of $80 and $70, and accretion expense of debt discount of $159 and $145 are included in interest expense for the six months ended June 30, 2016 and 2015, respectively.
As part of the December 2015 amendment to the revolving credit facility, the Company is required to calculate quarterly permanent reductions to the maximum commitment available under the revolving credit facility. During the six months ended June 30, 2016, the Company accelerated amortization of $18 representing a portion of the remaining unamortized balance of debt issuance costs. Refer to Note 8—Credit Facilities for additional disclosure on the Company’s revolver credit agreement.
Financial Instruments
The carrying value of the Company’s financial instruments, consisting of cash, accounts receivable, accounts payable and accrued expenses, approximates their fair value due to the short maturity of such instruments. Financial instruments also consist of debt for which fair value approximates carrying values as the debt bears interest at a variable rate which is reflective of current rates otherwise available to the Company. Unless otherwise noted, it is management’s opinion that the Company is not exposed to significant interest, currency or credit risks arising from these financial instruments.
Fair Value Measurements
The Company’s financial assets and liabilities are to be measured using inputs from the three levels of the fair value hierarchy, of which the first two are considered observable and the last unobservable, which are as follows:
| • | Level 1—Inputs are unadjusted quoted prices in active markets for identical assets or liabilities that the Company has the ability to access at the measurement date; |
| • | Level 2—Inputs other than Level 1 that are observable, either directly or indirectly, such as quoted prices for similar assets or liabilities in active markets, quoted prices for identical or similar assets or liabilities in markets that are not active or other inputs corroborated by observable market data for substantially the full term of the assets or liabilities; and |
| • | Level 3—Unobservable inputs that reflect the Company’s assumptions that market participants would use in pricing assets or liabilities based on the best information available. |
F-9
Table of Contents
Stock-Based Compensation
The Company accounts for stock-based compensation in accordance with the provisions of ASC Topic 718, Compensation—Stock Compensation (ASC 718), which requires the recognition of expense related to the fair value of stock-based compensation awards in the Statements of Operations and Comprehensive Income (Loss).
For restricted stock issued to employees and members of the Board for their services on the Board, the Company estimates the grant date fair value of each share of restricted stock at issuance. For awards subject to service-based vesting conditions, the Company recognizes stock-based compensation expense, net of estimated forfeitures, equal to the grant date fair value of stock options on a straight-line basis over the requisite service period, which is generally the vesting term. For awards subject to both performance and service-based vesting conditions, the Company recognizes stock-based compensation expense using the straight-line recognition method when it is probable that the performance condition will be achieved. Forfeitures are required to be estimated at the time of grant and revised, if necessary, in subsequent periods if actual forfeitures differ from those estimates.
Share-based payments issued to non-employees are recorded at their fair values, and are periodically revalued as the equity instruments vest and are recognized as expense over the related service period in accordance with the provisions of ASC 718 and ASC Topic 505, Equity. The grant date fair value was calculated based on a weighted analysis of (i) publicly-traded companies in similar line of business to the Company (market comparable method)—Level 2 inputs, and (ii) discounted cash flows of the Company—Level 3 inputs.
Income Taxes
The Company applies the provisions of ASC Topic 740, Income Taxes (ASC 740), which principally utilizes a balance sheet approach to provide for income taxes. Under this method, deferred tax assets and liabilities are recognized for the expected future tax consequences of net operating loss carryforwards and temporary differences between the carrying amounts and the tax bases of assets and liabilities.
ASC 740 clarifies the accounting for uncertainty in income taxes recognized in an enterprise’s financial statements. The impact of an uncertain income tax position on the income tax returns must be recognized at the largest amount that is more-likely-than-not to be required to be recognized upon audit by the relevant taxing authority. This standard also provides guidance on de-recognition, measurement, classification, interest and penalties, accounting for interim periods, disclosure and transition issues with respect to tax positions. The Company includes interest and penalties as a component of income tax expense in the consolidated statement of operations. For the periods presented, no interest and penalties were recorded.
Environmental Matters
The Company is subject to various federal, state and local laws and regulations relating to the protection of the environment. Management has established procedures for the ongoing evaluation of the Company’s operations, to identify potential environmental exposures and to comply with regulatory policies and procedures. Environmental expenditures that relate to current operations are expensed or capitalized as appropriate. Expenditures that relate to an existing condition caused by past operations and do not contribute to current or future revenue generation are expensed as incurred. Liabilities are recorded when environmental costs are probable, and the costs can be reasonably estimated. The Company maintains insurance which may cover in whole or in part certain environmental expenditures. As of June 30, 2016 and December 31, 2015, there were no probable environmental matters.
Comprehensive Income (Loss)
Comprehensive income (loss) is defined as the change in equity of a business enterprise during a period from transactions and other events and circumstances from non-owner sources. Comprehensive income (loss) was equal to net income (loss) for all periods presented.
F-10
Table of Contents
Segment Information
Operating segments are identified as components of an enterprise about which separate discrete financial information is available for evaluation by the chief operating decision maker, or decision-making group, in making decisions on how to allocate resources and assess performance. The Company’s chief operating decision maker is the chief executive officer. The Company and the chief executive officer view the Company’s operations and manage its business as one operating segment. All long-lived assets of the Company reside in the United States.
Basic and Diluted Net Income (Loss) Per Share of Common Stock
Basic net income (loss) per share of common stock is computed by dividing net income (loss) attributable to common stockholders by the weighted-average number of shares of common stock outstanding during the period, excluding the dilutive effects of preferred stock, warrants to purchase common stock and restricted stock. Diluted net income per share of common stock is computed by dividing the net income (loss) attributable to common stockholders by the sum of the weighted-average number of shares of common stock outstanding during the period plus the potential dilutive effects of preferred stock and warrants to purchase common stock, and restricted stock outstanding during the period calculated in accordance with the treasury stock method, although these shares, restricted stock and warrants are excluded if their effect is anti-dilutive. Because the impact of these items is anti-dilutive during periods of net loss, there was no difference between basic and diluted net loss per share of common stock for the six months ended June 30, 2016. The following table reconciles the weighted-average common shares outstanding used in the calculation of basic net income per share to the weighted average common shares outstanding used in the calculation of diluted net income per share:
| For six months ended June 30, |
2016 | 2015 | ||||||
| Determination of shares: |
||||||||
| Weighted average common shares outstanding |
10,077 | 10,042 | ||||||
| Assumed conversion of warrant |
1,818 | 1,818 | ||||||
| Assumed conversion of restricted stock |
121 | 144 | ||||||
|
|
|
|
|
|||||
| Diluted weighted-average common stock outstanding |
12,016 | 12,004 | ||||||
|
|
|
|
|
|||||
Recent Accounting Pronouncements
In March 2016, the FASB issued Accounting Standards Update (“ASU”) No. 2016-09, “Stock Compensation (ASC 718)—Improvements to Employee Share-Based Payment Accounting”, which is intended to simplify the tax accounting impacts of stock compensation. Additionally, the new standard provides accounting policy elections regarding vesting and forfeiture accounting. The new standard is effective for annual periods beginning after December 15, 2016 and interim periods within those annual periods. The Company is currently in the process of evaluating the impact of the adoption on its consolidated financial statements.
In February 2016, the FASB issued ASU No. 2016-02, “Leases” (ASC 842), which replaces the existing guidance in ASC 840, “Leases.” ASC 842 requires lessees to recognize most leases on their balance sheets as lease liabilities with corresponding right-of-use assets. The new lease standard does not substantially change lessor accounting. The new standard is effective for interim and annual reporting periods beginning after December 15, 2018, with early adoption permitted. The Company currently in the process of evaluating the impact of the adoption on its consolidated financial statements.
In November 2015, the FASB issued ASU No. 2015-17, “Income Taxes—Balance Sheet Classification of Deferred Taxes”, which requires the presentation of deferred tax liabilities and assets be classified as non-current on balance sheets. The amendments in this ASU are effective for financial statements issued for annual periods beginning after December 15, 2016, and interim periods within those annual periods. Early adoption is permitted for all entities as of the beginning of an interim or annual reporting period. The Company has elected to early
F-11
Table of Contents
adopt this guidance prospectively as of December 31, 2015. The adoption only impacted deferred tax presentation on the consolidated balance sheet and related disclosure. No prior periods were retrospectively adjusted.
In July 2015, the FASB issued ASU No. 2015-11, “Simplifying the Measurement of Inventory”, which requires an entity to measure most inventory at the lower of cost and net realizable value, thereby simplifying the current guidance under which an entity must measure inventory at the lower of cost or market. The new standard is effective for public entities for financial statements issued for fiscal years beginning after December 15, 2016, including interim periods within those fiscal years. The Company is currently evaluating the new guidance and has not yet determined the impact this standard may have on its consolidated financial statements.
In April 2015, the FASB issued ASU No. 2015-15, “Interest-Imputation of Interest”, which simplifies presentation of debt issuance costs. The new standard requires that debt issuance costs be presented in the balance sheet as a direct deduction from the carrying amount of the debt liability, consistent with debt discounts or premiums. The new standard will be effective for financial statements issued for fiscal years beginning after December 15, 2015, and interim periods within fiscal years beginning after December 15, 2016. Early adoption is permitted for financial statements that have not been previously issued. The Company is currently evaluating the new guidance and has not yet determined the impact this standard may have on its consolidated financial statements.
In August 2014, the FASB issued ASU No. 2014-15, “Going Concern”, which provides guidance on determining when and how to disclose going-concern uncertainties in the financial statements. The new standard requires management to perform interim and annual assessments of an entity’s ability to continue as a going concern within one year of the date the financial statements are issued. An entity must provide certain disclosures if “conditions or events raise substantial doubt about the entity’s ability to continue as a going concern.” The ASU applies to all entities and is effective for annual periods ending after December 15, 2016, and interim periods thereafter, with early adoption permitted. The Company is currently evaluating the future disclosure requirements under this guidance.
In May 2014, the FASB issued ASU 2014-09, “Revenue from Contracts with Customers”. The objective of ASU 2014-19 is to establish a single comprehensive model for entities to use in accounting for revenue arising from contracts with customers and will supersede most of the existing revenue recognition guidance, including industry-specific guidance. The core principle of ASU 2014-09 is that an entity recognizes revenue to depict the transfer of promised goods or services to customers in an amount that reflects the consideration to which the entity expects to be entitled in exchange for those goods or services. In applying the new guidance, an entity will (1) identify the contract(s) with a customer; (2) identify the performance obligations in the contract; (3) determine the transaction price; (4) allocate the transaction price to the contract’s performance obligations; and (5) recognize revenue when (or as) the entity satisfies a performance obligation. ASU 2014-09 applies to all contracts with customers except those that are within the scope of other topics in the FASB Accounting Standards Codification. The new guidance is effective for annual reporting periods (including interim periods within those periods) beginning after December 15, 2017 for public companies. Early adoption is only permitted as of annual reporting periods beginning after December 15, 2016. Entities have the option of using either a full retrospective or modified approach to adopt ASU 2014-09. The Company is currently evaluating the new guidance and has not determined the impact this standard may have on its consolidated financial statements nor decided upon the method of adoption.
F-12
Table of Contents
4. Inventories
Net inventories consisted of the following:
| June 30, 2016 | December 31, 2015 | |||||||
| Raw material |
$ | 120 | $ | 3 | ||||
| Work-in-progress |
11,031 | 11,096 | ||||||
| Finished goods |
553 | 1,021 | ||||||
| Spare parts |
29 | 22 | ||||||
|
|
|
|
|
|||||
| Total |
11,773 | 12,142 | ||||||
| Less: current portion |
4,349 | 4,181 | ||||||
|
|
|
|
|
|||||
| Inventories, long-term |
$ | 7,384 | $ | 7,961 | ||||
|
|
|
|
|
|||||
5. Prepaid Expenses and Other Current Assets
Prepaid expenses and other current assets comprised of the following:
| June 30, 2016 | December 31, 2015 | |||||||
| Prepaid insurance |
$ | — | $ | 100 | ||||
| Prepaid expenses |
776 | 533 | ||||||
| Prepaid income taxes |
— | 888 | ||||||
| Other receivables |
86 | 3 | ||||||
|
|
|
|
|
|||||
| Prepaid expenses and other current assets |
$ | 862 | $ | 1,524 | ||||
|
|
|
|
|
|||||
6. Property, Plant and Equipment
Property, plant and equipment consists of:
| June 30, 2016 | December 31, 2015 | |||||||
| Machinery, equipment and tooling |
$ | 4,773 | $ | 4,673 | ||||
| Vehicles |
928 | 952 | ||||||
| Furniture and fixtures |
303 | 303 | ||||||
| Plant and building |
64,248 | 64,001 | ||||||
| Real estate properties |
3,500 | 3,500 | ||||||
| Railroad and sidings |
7,920 | 7,868 | ||||||
| Land and improvements |
13,169 | 12,977 | ||||||
| Asset retirement obligation |
1,135 | 1,135 | ||||||
| Mineral properties |
9,785 | 9,785 | ||||||
| Deferred mining costs |
417 | 155 | ||||||
| Construction in progress |
16,461 | 16,637 | ||||||
|
|
|
|
|
|||||
| 122,639 | 121,986 | |||||||
| Less: accumulated depreciation and depletion |
16,188 | 13,058 | ||||||
|
|
|
|
|
|||||
| Property, plant and equipment, net |
$ | 106,451 | $ | 108,928 | ||||
|
|
|
|
|
|||||
Depreciation expense was $3,172 and $2,281 for the six months ended June 30, 2016 and 2015, respectively.
The Company capitalized $139 and $979 of interest expense associated with the construction of new plant and equipment for the six months ended June 30, 2016 and 2015, respectively.
F-13
Table of Contents
7. Accrued Expenses
Accrued expenses were comprised of the following:
| June 30, 2016 | December 31, 2015 | |||||||
| Employee related expenses |
$ | 200 | $ | 216 | ||||
| Accrued construction |
605 | 917 | ||||||
| Accrued real estate taxes |
344 | — | ||||||
| Accrued legal expenses |
51 | 99 | ||||||
| Accrued professional fees |
214 | 139 | ||||||
| Accrued freight and delivery charges |
80 | 162 | ||||||
| Accrued interest revolver |
241 | 701 | ||||||
| Derivative liability |
— | 455 | ||||||
| Other accrued liabilities |
822 | 1,089 | ||||||
|
|
|
|
|
|||||
| Accrued and other expenses |
$ | 2,557 | $ | 3,778 | ||||
|
|
|
|
|
|||||
From time to time, the Company enters into fixed-price purchase obligations to purchase propane (which is used in its production operations). The contracts specify the quantity of propane to be delivered over a specified period of time and at a specified fixed price. The Company has historically concluded that these obligations are precluded from recognition in its consolidated financial statements in accordance with the normal sales and normal purchases exclusion as provided in ASC 815 “Derivatives and Hedging”. However, as the Company did not take physical delivery under its current fixed-price propane agreement, the Company accounted for this agreement under derivative accounting. As of December 31, 2015 the liability for this agreement was marked to market and was settled in February 2016 for $460. The settlement is presented as part of the change in accrued and other expenses in operating activities on the consolidated statement of cash flows.
8. Credit Facilities
On March 28, 2014, Smart Sand Inc. and its wholly-owned subsidiary Fairview Cranberry Company, LLC entered into a $72,500 revolving credit and security agreement (“the Credit Agreement”) as borrowers (“the Borrowers”), and PNC Bank National Association, as administrative agent and collateral agent. The Credit Agreement provides for a $72,500 variable rate senior secured revolving credit facility (“revolving credit facility”) which was available to repay a $40,000 portion of the outstanding Preferred Shares (Note 10) and the outstanding balance of a previous line of credit described above. In addition, the revolving credit facility was available to fund fees and expenses totaling $1,675 incurred in connection with the credit facility, and for general business purposes, including working capital requirements, capital expenditures, and permitted acquisitions. In addition, the Credit Agreement includes a sublimit of up to $5,000 for the issuance of letters of credit. Substantially all of the assets of the Borrowers are pledged as collateral under the Credit Agreement. The revolving credit facility matures on March 28, 2019.
The Company also incurred certain commitment fees on committed amounts that are neither used for borrowings nor under letters of credit.
The Company initially borrowed $53,837 on March 28, 2014. Of the $1,675 of direct financing costs, $1,139 was recorded as debt discount against the amount borrowed, resulting in net proceeds of $52,698. The debt discount is being amortized to interest expense over the remaining term of the credit facility using the effective interest rate method. The unamortized debt discount balance was $1.0 million as of September 30, 2014. The remaining direct costs for professional and legal fees of $537 were recorded as deferred financing costs. As a result of this transaction, the Company recognized an approximate $1,230 loss on extinguishment of debt.
On October 29, 2014, the Company amended the Credit Agreement to provide for up to $100,000 variable senior secured revolving credit facility, as well as a sublimit of up to $15,000 for the issuance of letters of credit.
F-14
Table of Contents
Substantially all of the assets of the Borrowers are pledged as collateral under the amended Credit Agreement. The Company incurred a $275 commitment fee for this amendment.
On December 18, 2015, the Company entered into the fourth amendment to the Credit Agreement (“Fourth Amendment”). Under the Fourth Amendment, the event of default related to the September 30, 2015 leverage ratio was waived and the following terms were amended:
| • | The total commitment was reduced from $100,000 to $75,000. |
| • | Quarterly permanent paydowns are required until the maximum commitment reaches $55,000 from the sharing of excess cash flow, as defined in the Fourth Amendment. As of June 30, 2016, the maximum commitment was $74,000. |
| • | Application of the leverage ratio and fixed charge coverage ratio covenants is foregone until the earlier of December 31, 2016 or such quarter that the Company cannot maintain a $3,000 excess availability (as defined in the Fourth Amendment). |
| • | Annual capital expenditures are restricted, as defined in the Fourth Amendment, until the $55,000 maximum commitment level is reached. |
In addition, the Fourth Amendment increased the interest rates applicable to borrowings under the revolving credit at the Borrowers’ option at either:
| • | A Base Rate, as defined, which will be the base commercial lending rate of PNC Bank, as publicly announced to be in effect from time to time, plus an applicable margin of 3.00%; or |
| • | LIBOR plus an applicable margin of 4.00%. |
The Company incurred a $250 commitment fee for this amendment, recorded as debt discount against the revolving credit facility.
At June 30, 2016, the total amount drawn under the facility was $58,000, net of debt discount of $803, and the Company had $3,529 letters of credit outstanding. The total undrawn availability under the Fourth Amendment was $12,431. At June 30, 2016, outstanding borrowings under the Credit Agreement bore interest at a weighted-average rate of approximately 4.47%.
9. Equipment Lease Obligations
The Company entered into various lease arrangements to lease equipment. The equipment with a cost of $2,853 has been capitalized and included in the Company’s property, plant and equipment. Depreciation expense under capital lease assets was approximately $146 for the six months ended June 30, 2016 and 2015, respectively.
Future minimum lease payments for equipment lease obligations as of June 30, 2016 are as follows:
| Period ending June 30, |
Amount | |||
| 2017 |
$ | 810 | ||
| 2018 |
320 | |||
| 2019 |
425 | |||
| 2020 |
— | |||
| 2021 |
— | |||
|
|
|
|||
| Total minimum lease payments |
1,555 | |||
| Amount representing interest at 4.8%—6.3% |
(98 | ) | ||
|
|
|
|||
| Present value of payments |
1,457 | |||
| Less: current portion |
(740 | ) | ||
|
|
|
|||
| Equipment financing obligations, net of current portion |
$ | 717 | ||
|
|
|
|||
F-15
Table of Contents
10. Notes Payable
The Company financed certain equipment and automobile purchases by entering into various debt agreements. Interest rates on these notes ranged from 0% to 8.39%. Aggregate maturities of notes payable are as follows:
| Period ending June 30, |
Amount | |||
| 2017 |
$ | 712 | ||
| 2018 |
288 | |||
| 2019 |
— | |||
| 2020 |
— | |||
| 2021 |
— | |||
|
|
|
|||
| Total |
1,000 | |||
| Less: current portion |
(712 | ) | ||
|
|
|
|||
| Notes payable |
$ | 288 | ||
|
|
|
|||
11. Asset Retirement Obligation
The Company had a post closure reclamation and site restoration obligation of $1,216 as of June 30, 2016. The following is a reconciliation of the total reclamation liability for asset retirement obligations:
| Balance at December 31, 2015 |
$ | 1,180 | ||
| Additions to liabilities |
— | |||
| Accretion expenses |
36 | |||
|
|
|
|||
| Balance at June 30, 2016 |
$ | 1,216 | ||
|
|
|
12. Mandatorily Redeemable Series A Preferred Stock
On September 13, 2011, the Company entered into a financing agreement with an Investor (“Series A Investor”). The agreement provides for the sale of Series A Preferred Stock (“Preferred Shares”) to the Company in three tranches. As part of this agreement, the investor received 22,000 Preferred Shares with an issuance price of $1,000 per share as well as 6,500 shares of common stock in exchange for gross proceeds of $22,000 in September 2011. The second tranche of 26,000 Preferred Shares was issued in January 2012, in exchange for gross proceeds of $26,000. The third tranche of up to 27,000 Preferred Shares is available to the Company at the discretion of the Company’s board of directors.
The Company authorized 200,000 shares of Series A Preferred Stock. Effective July 1, 2013, the Company reduced the number of authorized Preferred Shares to 100,000. The holders of the Preferred Shares are not entitled to vote, but are entitled to elect four of the seven directors on the board of directors. In the event of liquidation, after provision for payment of all debts and liabilities of the Company, the holders of the Preferred Shares, before any payment shall be made to the holders of common stock, shall be entitled to receive the original issuance price per share, for all outstanding preferred shares plus any unpaid accrued dividends. If upon any such liquidation event the assets of the Company available for distribution to its stockholders shall be insufficient to pay the holders of shares of Series A Preferred Stock the full amount to which they shall be entitled, the holders of Series A Preferred Stock shall share ratably in any distribution of the assets available for distribution in proportion to the respective amounts which otherwise be respectively entitled. Dividends accrue and accumulate on the Preferred Shares, whether or not earned or declared, at the rate of 15% per annum and compound quarterly on April 1, July 1, October 1 and January 1. Dividends are paid in-kind with additional Preferred Shares; fractional share portion of calculated dividends are paid in cash. In-kind dividends are accounted for as interest expense and are accrued as part of the long-term liability in the consolidated balance
F-16
Table of Contents
sheets. The Company issued 2,714 and 2,343 Preferred Shares for dividends in the six months ended June 30, 2016 and 2015, respectively. For the six months ended June 30, 2016 and June 30, 2015, the Company incurred $3,182 and $2,713 of interest expense related to the Preferred Shares, respectively. Of this expense, $59 and $279 was capitalized into property, plant and equipment in the consolidated balance sheets as of June 30, 2016 and 2015, respectively.
The Preferred Shares are mandatorily redeemable on September 13, 2016 only if certain defined pro forma covenants of the Credit Agreement (Note 8) are met. The redemption price is the original issuance price per share of all outstanding preferred shares plus any unpaid accrued dividends. The Company has an option to repay the Preferred Shares before September 13, 2016; if this option is exercised, the Company must repay at least $1,000. The Preferred Shares are not convertible into common stock or any other security issued by the Company. As a result of the Preferred Shares’ mandatory redemption feature, the Company classified these securities as current liabilities in the accompanying consolidated balance sheets as of June 30, 2016 and December 31, 2015. While the Company has classified the Preferred Shares as current, because of these covenant requirements the Company does not anticipate being able to redeem the Preferred Shares in the foreseeable future.
The Company incurred $1,698 of transaction costs in connection with the issuance of the first tranche of the Preferred Shares. The transaction costs and the allocation of value to the common shares (see Note 13) have been recorded as a reduction of the carrying amount of the Preferred Shares long-term liability. The Company incurred $1,639 of transaction costs in connection with the issuance of the second tranche of the Preferred Shares. The Preferred Shares liability will be accreted to the face value with a corresponding charge to interest expense over the remaining term of the Preferred Shares to present the face value of the Preferred Shares mandatory redemption date value on September 13, 2016.
At June 30, 2016 and December 31, 2015, the Series A Redeemable Convertible Preferred Stock consisted of:
| 2016 | 2015 | |||||||
| Face Value |
$ | 26,469 | $ | 26,469 | ||||
| Accumulated dividends |
11,797 | 9,083 | ||||||
| Net Accretion of issuance & transaction cost |
(378 | ) | (844 | ) | ||||
|
|
|
|
|
|||||
| Total Series A Redeemable Convertible Preferred Stock |
$ | 37,888 | $ | 34,708 | ||||
|
|
|
|
|
|||||
At June 30, 2016 the liquidation value of the Series A Preferred Stock is $38,266.
13. Common Stock
The Company had 15,000 authorized and 10,077 issued shares of common stock at June 30, 2016. The holders of the common stock are entitled to one vote per share.
The stockholders’ agreement provides certain restrictions on all classes of stock for the transfer of shares or the issuance of additional shares. In the event a stockholder proposes to sell their shares, other investors in the Company and then the Company itself have a right of first refusal to purchase the shares, as defined. Alternatively, if a stockholder proposes to sell their shares, other stockholders have the right to participate in the sale based on a formula, as defined. Additionally, the stockholders’ agreement also restricts the Company from selling or issuing additional shares of stock, securities convertible into stock or options, warrants or rights to purchase stock without stockholder approval, as defined.
In the event of a sale of the Company, as defined, where the board of directors of the Company and at least a majority of the Preferred Shares and common stockholders agree to sell substantially all the assets or capital stock of the Company, all remaining stockholders are required to participate in the transaction.
F-17
Table of Contents
The holder of the Series A Preferred Shares was issued 6,500 shares of common stock for no cash consideration in 2011. As a result and in order to recognize the value of the common stock issued, $1,179 was bifurcated from the proceeds of the Series A Preferred Shares and allocated to the 6,500 shares of common stock received by Series A Investor. The Company used a current value method to determine the fair value of the shares at the issuance date since the company was at such an early stage of development that no material progress had been made to the Company’s business plan. As discussed in Note 11, the amount allocated to the Series A Investor’s common shares will be accreted to the face value of the Preferred Shares with a corresponding charge to interest expense over the 5-year term of the Preferred Shares.
Certain management stockholders have pledged 2,680 shares of common stock as a guarantee of performance on the Series A Preferred Shares (Note 12).
14. Warrants
Contemporaneous with the financing transaction in 2011 described in Note 12, the Company issued certain management stockholders warrants to purchase 1,818 shares of common stock for a purchase price of $10 per share. The warrants are scheduled to expire 8 years after issuance. The warrants are exercisable upon the achievement of certain triggering events, as defined, in the warrant agreements. During the six months ended June 30, 2016, management determined that certain performance criteria for the warrants were met and therefore an immaterial amount of expense was recognized. No expense was recorded for the six months ended June 30, 2015.
15. Stock-Based Compensation
In May 2012, the Board approved the 2012 Equity Incentive Plan (“Plan”), which provides for the issuance of Awards (as defined in the Plan) of up to a maximum of 200 shares of the Company’s common stock to employees, non-employee members of the Board, and consultants of the Corporation. During 2014, the Plan was amended to provide for the issuance of Awards up to 400 shares of the Company’s common stock. The awards can be issued in the form of incentive stock options, non-qualified stock options or restricted stock, and have expiration dates of 5 or 10 years after issuance, depending whether the recipient already holds above 10% of the voting power of all classes of the Company’s shares. The exercise price will be based on the fair market value of the share on the date of issuance; vesting periods will be determined by the board upon issuance of the Award.
During the six months ended June 30, 2016, 73 shares of restricted stock were issued under the Plan. The grant date fair value of all restricted stock issuances ranged from $4,160-$17,732 per share. The grant date fair value was calculated based on a weighted analysis of (i) publicly-traded companies in similar line of business to the Company (market comparable method)—Level 2 inputs, and (ii) discounted cash flows of the Company—Level 3 inputs. The Company recognized $420 and $416 of compensation expense for the vested restricted stock during the six months ended June 30, 2016 and 2015, respectively. As of June 30, 2016 the Company had unrecognized compensation expense of $2,046.
The following table summarizes restricted stock activity under the Plan from January 1, 2015 through June 30, 2016:
| Number of Units |
Weighted Average |
|||||||
| Unvested, January 1, 2015 |
168.3 | $ | 17,365 | |||||
| Granted |
20.0 | 17,332 | ||||||
| Vested |
(44.8 | ) | (16,734 | ) | ||||
| Forfeiture |
(12.0 | ) | (17,054 | ) | ||||
|
|
|
|||||||
| Unvested, December 31,2015 |
131.5 | $ | 17,636 | |||||
| Granted |
73.0 | 8,464 | ||||||
| Vested |
(31.7 | ) | (17,598 | ) | ||||
| Forfeiture |
— | — | ||||||
|
|
|
|||||||
| Unvested, June 30, 2016 |
172.9 | $ | 15,251 | |||||
|
|
|
|||||||
F-18
Table of Contents
The total fair value of the granted restricted stock is determined by utilizing the underlying fair value of the common stock at the date of grant. The grant date fair value was calculated based on a weighted analysis of (i) publicly-traded companies in similar line of business to the Company (market comparable method)-Level 2 inputs, and (ii) discounted cash flows of the Company-Level 3 inputs.
16. Income Taxes
The Company calculates its interim income tax provision in accordance with ASC 740. At the end of each interim period, the Company makes an estimate of the annual expected effective tax rate and applies that rate to its ordinary year to date earnings or loss. In addition, the effect of changes in enacted tax laws, rates or tax status is recognized in the interim period in which the change occurs.
The computation of the annual expected effective tax rate at each interim period requires certain estimates and assumptions including, but not limited to, the expected operating income for the year, projections of the proportion of income (or loss) earned and taxed in foreign jurisdictions, permanent and temporary differences, and the likelihood of recovering deferred tax assets generated in the current year. The accounting estimates used to compute the provision for income taxes may change as new events occur, more experience is acquired or additional information is obtained. The computation of the annual effective tax rate includes modifications, which were projected for the year, for share based compensation, the domestic manufacturing deduction and state research and development credits among others.
For the six months ended June 30, 2016 and 2015, the Company recorded a tax benefit of $(56) and a tax provision of $1,633, respectively, for federal and state income taxes. For the six months ended June 30, 2016, the Company’s statutory tax rate and effective tax rate were approximately 34% and 53%, respectively. The difference in these tax rates was primarily due to state income tax, non-deductible interest expense on the preferred shares and certain book expenses not deductible for tax. The tax benefit for the six months ended June 30, 2016 also includes a 7% discrete rate impact for a provision-to-return adjustment associated with a change in estimate related to expenses that are not deductible for tax purposes. For the six months ended June 30, 2015, the Company’s statutory tax rate and effective tax rate were approximately 35% and 64%, respectively. The difference in these tax rates was primarily due to state income tax, non-deductible interest expense on the preferred shares and certain book expenses not deductible for tax.
17. 401(k) Plan
The Company has a defined contribution plan that covers all employees over the age of 21 who have been employed for at least 90 days. The plan is subject to the provisions of the Employee Retirement Income Security Act of 1974. In accordance with the provisions of the plan, the Company may make discretionary contribution to the account of each participant. During the six months ended June 30, 2016 and 2015, the Company made contributions of $98 and $91, respectively.
18. Concentrations
As of June 30, 2016 and December 31, 2015, four suppliers accounted for 66% and four suppliers accounted for 71% of the Company’s accounts payable, respectively. For the six months ended June 30, 2016 and 2015, two suppliers accounted for 39% and two suppliers accounted for 53% of the Company’s cost of goods sold, respectively.
As of June 30, 2016, five customers accounted for 99% of the Company’s accounts receivable. As of December 31, 2015, three customers accounted for 96% of the Company’s accounts receivable.
For the six months ended June 30, 2016, three customers accounted for 88% of the Company’s revenue. For the six months ended June 30, 2015, four customers accounted for 91% of the Company’s revenue. In July 2016, one of the Company’s customers, which accounted for 18% and 2% of revenue for the six months ended June 30, 2016 and 2015, respectively, filed a voluntary petition under Chapter 11 of the Bankruptcy Code.
F-19
Table of Contents
The Company’s inventory and operations are located in Wisconsin. There is a risk of loss if there are significant environmental, legal or economic change to this geographic area. The Company currently utilizes one third-party rail company to ship its products to customers from its plant. There is a risk of business loss if there are significant impacts to this third party’s operations.
19. Related Party Transactions
In January 2016, the Company provided a one-year, 0% loan to its Chief Executive Officer in the amount of $61,000; this receivable is included in prepaid expenses and other current assets on the consolidated balance sheet. During the third quarter of 2016, this loan was fully forgiven and included as compensation to the Chief Executive Officer.
For the six months ended June 30, 2016 and 2015, the Company reimbursed the Series A Investor $3 and $14 respectively, for certain out-of-pocket and other expenses in connection certain management and administrative support services provided.
20. Commitments and Contingencies
Leases
The Company is obligated under certain operating leases and rental agreements for railroad cars, office space, and other equipment. Future minimum annual commitments under such operating leases at June 30, 2016 are as follows:
| Six months ending June 30, |
||||
| 2017 |
$ | 6,723 | ||
| 2018 |
5,285 | |||
| 2019 |
3,949 | |||
| 2020 |
3,186 | |||
| 2021 |
2,357 | |||
| Thereafter |
1,230 | |||
Expense related to operating leases and rental agreements was $3,437 and $1,808 for the six months ended June 30, 2016. Lease expense related to rail cars are included in cost of goods sold in the consolidated statement of operations. Certain long-term rail car operating leases have been executed; however, payment on the company’s use of the lease does not begin until the cars arrive. These 30 cars are estimated to arrive beginning October 2016 and will result in additional annual lease expense of $232 when all cars are received. Due to the uncertain nature of the delivery, these rail car leases have not been included in the schedule above.
Litigation
The Company is periodically involved in litigation and claims incidental to its operation. Other than the below, management believes that any pending litigation will not have a material impact the Company’s financial position.
In August 2016, an affiliate of one of the Company’s customers, in conjunction with bankruptcy proceedings, demanded a refund of the remaining balance of prepayments it claimed to have made pursuant to the agreement with the Company’s customer. As of June 30, 2016, the balance of this prepayment was $4,969, and was presented as deferred revenue in the consolidated balance sheet. The Company disputes the threatened claim and will vigorously defend any action brought. If resolved unfavorably, this threatened claim may have a material impact to the Company’s financial position; however, there should be no material impact to the Company’s results of operations.
F-20
Table of Contents
Employment Agreements
Certain of the Company’s executives are employed under employment agreements, the terms of which provide for, among other things, a base salary plus additional compensation including an annual bonus based on the percentage as defined and agreed upon by the Board based on service and/or performance in a given calendar year. The agreements, which contain one-year automatic renewals, provide for benefits that are customary for senior-level employees. The Company is required to pay severance under these agreements under certain conditions, as defined, in the event employment of these key executives is terminated. The Company’s commitment under these agreements is $1,175 as of June 30, 2016. The agreements are scheduled to expire through May 2017.
Consulting Agreements
On August 1, 2010, the Company entered into a consulting agreement related to the purchase of land with a third party. The third party acted as an agent for the Company to obtain options to purchase certain identified real property in Wisconsin, as well as obtain permits and approvals necessary to open, construct and operate a sand mining and processing facility on such real property. The agreement continues for two years after the closing of one or more of the identified real properties. The third party’s compensation consists of $10 per month through the end of the agreement, reimbursement of expenses, and $1 per each acre purchased as a closing fee. For the six months ended June 30, 2016, the Company paid the third party $0 and $841, respectively, in consulting fees, expense reimbursements and closing costs. These costs have been capitalized in property and equipment in the accompanying consolidated balance sheets as they relate to the acquisition of land.
In addition to the aforementioned fees, the third-party agreement provides for tonnage fees based upon mining operations. The payment of $0.50 per sold ton of certain grades of sand that were mined and sold from the properties acquired under the agreement begins with the second year of operations of the plant and continues indefinitely. The minimum annual tonnage fee is $200. During the six months ended June 30, 2016 and 2015, the Company incurred $98 and $167 related to tonnage fees, respectively.
Letters of Credit
As of June 30, 2016, the Company had $3,529 outstanding letters of credit. The Company provided a $770 letter of credit to the favor of Monroe County, Wisconsin to assure performance under the reclamation plan filed with Monroe County. Additionally, the Company had two letters of credit to the favor of a fuel pipeline common carrier; a letter of credit for $627 issued in July 2014 amended in May 2016, to expand the pipeline capacity to the Company’s plant location and a letter of credit for $2,132 issued in March 2015 to assure future minimum annual usage payments.
Bonds
The Company entered into a performance bond with Jackson County, Wisconsin for $4,400. The Company provided this performance bond to assure performance under the reclamation plan filed with Jackson County. The Company entered into a $1,000 permit bond with the Town of Curran, Wisconsin to use certain town roadways. The Company provided this permit bond to assure maintenance and restoration of the roadway.
21. Subsequent Events
The Company has evaluated events and transactions subsequent to the balance sheet date and through August 11, 2016, the date the financial statements were available to be issued. Based on this evaluation, except for those events or transactions disclosed in Note 18, Note 19 and Note 20, the Company is not aware of any events or transactions that occurred subsequent to June 30, 2016 through August 11, 2016 that would require recognition or disclosure in the consolidated financial statements.
F-21
Table of Contents
REPORT OF INDEPENDENT REGISTERED PUBLIC ACCOUNTING FIRM
Board of Directors and Stockholders
Smart Sand, Inc.
We have audited the accompanying consolidated balance sheets of Smart Sand Inc. (a Delaware corporation) and subsidiaries (the “Company”) as of December 31, 2015 and 2014, and the related consolidated statements of operations and comprehensive income (loss), changes in stockholders’ equity (deficit), and cash flows for each of the two years in the period ended December 31, 2015. These financial statements are the responsibility of the Company’s management. Our responsibility is to express an opinion on these financial statements based on our audits.
We conducted our audits in accordance with the standards of the Public Company Accounting Oversight Board (United States). Those standards require that we plan and perform the audit to obtain reasonable assurance about whether the financial statements are free of material misstatement. We were not engaged to perform an audit of the Company’s internal control over financial reporting. Our audits included consideration of internal control over financial reporting as a basis for designing audit procedures that are appropriate in the circumstances, but not for the purpose of expressing an opinion on the effectiveness of the Company’s internal control over financial reporting. Accordingly, we express no such opinion. An audit also includes examining, on a test basis, evidence supporting the amounts and disclosures in the financial statements, assessing the accounting principles used and significant estimates made by management, as well as evaluating the overall financial statement presentation. We believe that our audits provide a reasonable basis for our opinion.
In our opinion, the consolidated financial statements referred to above present fairly, in all material respects, the financial position of Smart Sand Inc. and subsidiaries as of December 31, 2015 and 2014, and the results of their operations and their cash flows for each of the two years in the period ended December 31, 2015 in conformity with accounting principles generally accepted in the United States of America.
/s/ GRANT THORNTON LLP
Philadelphia, Pennsylvania
March 31, 2016
F-22
Table of Contents
SMART SAND, INC.
| December 31, | ||||||||
| 2015 | 2014 | |||||||
| (in thousands, except per share data) |
||||||||
| Assets |
||||||||
| Current assets: |
||||||||
| Cash |
$ | 3,896 | $ | 802 | ||||
| Accounts and unbilled receivables, net, of which $4,021 and $681 is unbilled receivables at December 31, 2015 and 2014, respectively |
6,041 | 8,578 | ||||||
| Inventories, net |
4,181 | 8,630 | ||||||
| Prepaid expenses and other current assets |
1,524 | 3,923 | ||||||
| Deferred tax assets, net |
— | 225 | ||||||
|
|
|
|
|
|||||
| Total current assets |
15,642 | 22,158 | ||||||
| Inventories, long-term |
7,961 | 1,050 | ||||||
| Property, plant and equipment, net |
108,928 | 85,815 | ||||||
| Deferred financing costs, net |
486 | 573 | ||||||
| Other assets |
33 | 33 | ||||||
|
|
|
|
|
|||||
| Total assets |
$ | 133,050 | $ | 109,629 | ||||
|
|
|
|
|
|||||
| Liabilities and Stockholders’ Deficit |
||||||||
| Current liabilities: |
||||||||
| Accounts payable |
$ | 1,170 | $ | 2,047 | ||||
| Accrued and other expenses |
3,778 | 6,350 | ||||||
| Deferred revenue |
7,133 | — | ||||||
| Current portion of equipment financing obligations |
409 | 389 | ||||||
| Current portion of notes payable |
1,369 | 104 | ||||||
| Current Redeemable Series A preferred stock |
34,708 | — | ||||||
|
|
|
|
|
|||||
| Total current liabilities |
48,567 | 8,890 | ||||||
| Revolving credit facility, net |
63,254 | 59,126 | ||||||
| Equipment financing obligations, net of current portion |
1,246 | 1,655 | ||||||
| Notes payable, net of current portion |
569 | 61 | ||||||
| Deferred tax liabilities, long-term, net |
14,505 | 11,030 | ||||||
| Asset retirement obligation |
1,180 | 1,765 | ||||||
| Redeemable Series A preferred stock |
||||||||
| $0.001 par value, 100,000 shares authorized, 35,552 and 30,687 issued and outstanding as of December 31, 2015 and 2014, respectively |
— | 29,059 | ||||||
|
|
|
|
|
|||||
| Total liabilities |
129,321 | 111,586 | ||||||
| Commitments and contingencies (Note 18) |
||||||||
| Stockholders’ deficit |
||||||||
| Common stock, $0.001 par value, 15,000 shares authorized, 10,052 and 10,018 issued and outstanding at December 31, 2015 and December 31, 2014, respectively |
— | — | ||||||
| Treasury stock, at cost, 11.3 shares and 0.1 shares respectively at December 31, 2015 and 2014, respectively |
(123 | ) | (2 | ) | ||||
| Additional paid-in capital |
4,168 | 3,351 | ||||||
| Accumulated deficit |
(316 | ) | (5,306 | ) | ||||
|
|
|
|
|
|||||
| Total stockholders’ equity (deficit) |
3,729 | (1,957 | ) | |||||
|
|
|
|
|
|||||
| Total liabilities and stockholders’ equity (deficit) |
$ | 133,050 | $ | 109,629 | ||||
|
|
|
|
|
|||||
The accompanying notes are an integral part of these financial statements.
F-23
Table of Contents
SMART SAND, INC.
CONSOLIDATED STATEMENTS OF OPERATIONS AND COMPREHENSIVE INCOME (LOSS)
| Year Ended December 31, |
||||||||
| 2015 | 2014 | |||||||
| (in thousands, except per share data) |
||||||||
| Revenues |
$ | 47,698 | $ | 68,170 | ||||
| Cost of goods sold |
21,003 | 29,934 | ||||||
|
|
|
|
|
|||||
| Gross profit |
26,695 | 38,236 | ||||||
| Operating expenses: |
||||||||
| Salaries, benefits and payroll taxes |
5,055 | 5,088 | ||||||
| Depreciation and amortization |
388 | 160 | ||||||
| Selling, general and administrative |
4,669 | 7,222 | ||||||
|
|
|
|
|
|||||
| Total operating expenses |
10,112 | 12,470 | ||||||
|
|
|
|
|
|||||
| Operating income |
16,583 | 25,766 | ||||||
| Other (expenses) income: |
||||||||
| Preferred stock interest expense |
(5,078 | ) | (5,601 | ) | ||||
| Other interest expense |
(2,748 | ) | (2,231 | ) | ||||
| Other income |
362 | 370 | ||||||
|
|
|
|
|
|||||
| Total other expenses |
(7,464 | ) | (7,462 | ) | ||||
| Loss on extinguishment of debt |
— | (1,230 | ) | |||||
|
|
|
|
|
|||||
| Income before income tax expense |
9,119 | 17,074 | ||||||
| Income tax expense |
4,129 | 9,518 | ||||||
|
|
|
|
|
|||||
| Net income |
$ | 4,990 | $ | 7,556 | ||||
|
|
|
|
|
|||||
| Per share information: |
||||||||
| Net income per common share: |
||||||||
| Basic |
$ | 496.42 | $ | 754.23 | ||||
| Diluted |
$ | 415.83 | $ | 633.44 | ||||
| Weighted-average number of common shares: |
||||||||
| Basic |
10,052 | 10,018 | ||||||
| Diluted |
12,000 | 11,929 | ||||||
The accompanying notes are an integral part of these financial statements.
F-24
Table of Contents
SMART SAND, INC.
CONSOLIDATED STATEMENTS OF CHANGES IN STOCKHOLDERS’ EQUITY (DEFICIT)
| Common Stock | Treasury Stock |
Additional Paid-in Capital |
Accumulated Deficit |
Total Stockholders’ Equity (Deficit) |
||||||||||||||||||||
| Outstanding Shares |
Par Value |
|||||||||||||||||||||||
| (in thousands, except per share data) | ||||||||||||||||||||||||
| Balance at December 31, 2013 |
10,008 | $ | — | $ | — | $ | 2,914 | $ | (12,862 | ) | $ | (9,948 | ) | |||||||||||
| Vesting of restricted stock |
10 | — | — | — | — | — | ||||||||||||||||||
| Stock-based compensation, inclusive of $18 tax benefit |
0 | — | — | 437 | — | 437 | ||||||||||||||||||
| Restricted stock buy back |
0 | — | (2 | ) | — | — | (2 | ) | ||||||||||||||||
| Net income |
0 | — | — | 7,556 | 7,556 | |||||||||||||||||||
|
|
|
|
|
|
|
|
|
|
|
|
|
|||||||||||||
| Balance at December 31, 2014 |
10,018 | — | (2 | ) | 3,351 | (5,306 | ) | (1,957 | ) | |||||||||||||||
| Vesting of restricted stock |
45 | — | — | — | — | — | ||||||||||||||||||
| Stock-based compensation, inclusive of $24 tax benefit |
0 | — | — | 817 | — | 817 | ||||||||||||||||||
| Restricted stock buy back |
(11 | ) | — | (121 | ) | — | — | (121 | ) | |||||||||||||||
| Net income |
0 | — | — | 4,990 | 4,990 | |||||||||||||||||||
|
|
|
|
|
|
|
|
|
|
|
|
|
|||||||||||||
| Balance at December 31, 2015 |
10,052 | $ | — | $ | (123 | ) | $ | 4,168 | $ | (316 | ) | $ | 3,729 | |||||||||||
|
|
|
|
|
|
|
|
|
|
|
|
|
|||||||||||||
The accompanying notes are an integral part of these financial statements.
F-25
Table of Contents
SMART SAND, INC.
CONSOLIDATED STATEMENTS OF CASH FLOWS
| Year Ended December 31, |
||||||||
| 2015 | 2014 | |||||||
| (in thousands) | ||||||||
| Operating activities: |
||||||||
| Net income |
$ | 4,990 | $ | 7,556 | ||||
| Adjustments to reconcile net income to net cash provided by (used in) operating activities: |
||||||||
| Depreciation, depletion and amortization of asset retirement obligation |
5,318 | 3,642 | ||||||
| Loss on disposal of assets |
54 | 57 | ||||||
| Loss on derivatives |
455 | — | ||||||
| Loss on extinguishment of debt |
— | 1,230 | ||||||
| Revenue reserve |
(92 | ) | — | |||||
| Amortization of deferred financing cost |
251 | 86 | ||||||
| Accretion of debt discount |
519 | 183 | ||||||
| Deferred income taxes |
3,700 | 8,378 | ||||||
| Stock-based compensation, net |
792 | 418 | ||||||
| Non-cash interest expense on revolving credit facility |
706 | 1,852 | ||||||
| Non-cash interest expense on Series A preferred stock |
5,078 | 5,601 | ||||||
| Changes in assets and liabilities: |
||||||||
| Accounts and unbilled receivables |
2,629 | (4,367 | ) | |||||
| Inventories |
(2,462 | ) | 316 | |||||
| Prepaid expenses and other assets |
2,423 | (3,492 | ) | |||||
| Deferred revenue |
7,133 | (183 | ) | |||||
| Accounts payable |
(137 | ) | 759 | |||||
| Accrued and other expenses |
(654 | ) | 272 | |||||
| Income taxes payable |
— | (171 | ) | |||||
|
|
|
|
|
|||||
| Net cash provided by operating activities |
30,703 | 22,137 | ||||||
|
|
|
|
|
|||||
| Investing activities: |
||||||||
| Purchases of property, plant and equipment |
(29,375 | ) | (30,888 | ) | ||||
|
|
|
|
|
|||||
| Net cash used in investing activities |
(29,375 | ) | (30,888 | ) | ||||
|
|
|
|
|
|||||
| Financing activities: |
||||||||
| Repayment of line of credit |
— | (9,230 | ) | |||||
| Repayments of notes payable |
(456 | ) | (139 | ) | ||||
| Payments under equipment financing obligations |
(390 | ) | (231 | ) | ||||
| Payment of deferred financing and amendment costs |
(415 | ) | (659 | ) | ||||
| Proceeds from revolving credit facility |
12,800 | 61,199 | ||||||
| Repayment of revolving credit facility |
(9,647 | ) | (3,500 | ) | ||||
| Repayment of Series A preferred stock |
— | (39,999 | ) | |||||
| Cash dividend on Series A preferred stock |
(5 | ) | (5 | ) | ||||
| Purchase of treasury stock |
(121 | ) | (2 | ) | ||||
|
|
|
|
|
|||||
| Net cash provided by (used in) financing activities |
1,766 | 7,434 | ||||||
|
|
|
|
|
|||||
| Net (decrease) increase in cash |
3,094 | (1,317 | ) | |||||
| Cash at beginning of year |
802 | 2,119 | ||||||
|
|
|
|
|
|||||
| Cash at end of year |
$ | 3,896 | $ | 802 | ||||
|
|
|
|
|
|||||
| Non-cash activities: |
||||||||
| Investing: |
||||||||
| Asset retirement obligation |
$ | (614 | ) | $ | 1,544 | |||
| Financing: |
||||||||
| Equipment purchased with debt |
1,982 | 180 | ||||||
| Equipment purchased under equipment financing obligations |
— | 2,217 | ||||||
| Capitalized non-cash interest into property, plant and equipment |
1,808 | 453 | ||||||
| Debt issuance costs netted against proceeds |
— | 1,414 | ||||||
| Capitalized expenditures in accounts payable and accrued expenses |
3,113 | 4,386 | ||||||
| Cash paid for: |
||||||||
| Interest |
2,270 | 2,782 | ||||||
| Income taxes paid, net of $1,443 refund |
(1,093 | ) | 3,542 | |||||
The accompanying notes are an integral part of these financial statements.
F-26
Table of Contents
SMART SAND, INC.
NOTES TO CONSOLIDATED FINANCIAL STATEMENTS
For the Years Ended December 31, 2015 and 2014
(Dollars in thousands, except per share and percentage data)
1. Organization and Nature of Business
Smart Sand, Inc. and its subsidiaries (collectively, the “Company”), headquartered in The Woodlands, Texas, was incorporated in July 2011. The Company is engaged in the excavation, processing and sale of industrial sand, or proppant, for use in hydraulic fracturing operations for the oil and gas industry. The Company completed the construction of the first phase of its primary facility in Oakdale, Wisconsin and commenced operations in July 2012.
Immaterial Correction
The Company discovered that an immaterial correction should be made relating to the amortization of deferred transaction costs associated with the issuance of the Company’s outstanding preferred shares. The Company has been amortizing the deferred costs into interest expense from the date of issuance to the mandatory redemption date of the preferred shares, which is September 13, 2016. In March 2014, the Company redeemed certain preferred shares prior to the mandatory redemption date and wrote off a portion of the transaction costs as part of the early redemption. The Company never adjusted the quarterly amortization amount for the portion previously written off. The Company concluded the amounts were immaterial to its 2015 and 2014 financial statements in accordance with the guidance in SEC Staff Accounting Bulletin (SAB) No. 99 “Materiality” and SAB No. 108 “Considering the Effects of Prior Year Misstatements when Quantifying Misstatements in the Current Year Financial Statements.” As a result, the correction resulted in a decrease in interest expense and corresponding increase to net income by $492 and 369 for the years ended December 31, 2015 and 2014, respectively. The correction also resulted in a decrease to current liabilities by $861 and $369 as of December 31, 2015 and 2014, respectively. The immaterial correction did not impact the statement of cash flows or cash paid for interest. Basic and diluted earnings per share increased by $48.96 and $41.01, respectively, for the year ended December 31, 2015. Basic and diluted earnings per share increased by $36.85 and $30.94, respectively, for the year ended December 31, 2014.
2. Summary of Significant Accounting Policies
This summary of significant accounting policies of the Company is presented to assist in the understanding of the Company’s consolidated financial statements. These accounting policies conform to accounting principles generally accepted in the United States of America and have been consistently applied in the preparation of the consolidated financial statements.
Consolidation
The accompanying consolidated financial statements include the accounts of Smart Sand, Inc. and its wholly-owned subsidiaries Fairview Cranberry Company, LLC, Will Logistics, LLC, Smart Sand GP, LLC, Smart Sand Partners, Inc., Smart Sand Live Oak, LLC, Smart Sand Fayette County, LLC, Smart Sand Hixton, LLC, Smart Sand Reagan County, LLC, and Smart Sand Tom Green County, LLC. All material intercompany transactions and balances have been eliminated in consolidation.
Use of Estimates
The preparation of financial statements in accordance with generally accepted accounting principles in the United States of America requires management to make estimates and assumptions that affect the reported amounts of assets and liabilities and disclosure of contingent liabilities at the date of the consolidated financial statements, and the reported amounts of revenues and expenses during the reporting period. Significant estimates used in the preparation of these financial statements include, but are not limited to, the sand reserves and their
F-27
Table of Contents
impact on calculating the depletion expense under the units-of-production method; the depreciation associated with property and equipment, impairment considerations of those assets; estimated cost of future asset retirement obligations; stock-based compensation; recoverability of deferred tax assets; inventory reserve; collectability of receivables and certain liabilities. Actual results could differ from management’s best estimates as additional information or actual results become available in the future, and those differences could be material.
Cash
Cash is maintained at financial institutions and, at times, balances may exceed federally insured limits of $250 at each financial institution. The Company has not experienced any losses related to these balances.
Accounts and Unbilled Receivables
Accounts receivables represent customer transactions that have been invoiced as of the balance sheet date; unbilled receivables represent customer transactions that have not yet been invoiced as of the balance sheet date. Accounts receivable are due within 30 days, or in accordance with terms agreed upon with customers, and are stated at amounts due from customers net of any allowance for doubtful accounts. The Company considers accounts outstanding longer than the payment terms past due. The Company determines the allowance by considering a number of factors, including the length of time trade accounts receivable are past due, previous loss history, the customer’s current ability to pay its obligation, and the condition of the general economy and the industry as a whole. Accounts receivable are written off when they are deemed uncollectible, and payments subsequently received on such receivables are credited to bad debt expense. As of December 31, 2015 and 2014, the Company maintained an allowance for doubtful accounts of $0 and $161, respectively. As of December 31, 2015 and 2014, $3,875 and $0 of unbilled revenue represent transactions included in deferred revenue, respectively.
Deferred Financing Charges
Direct costs incurred in connection with the revolving credit facility have been capitalized and are being amortized using the straight-line method, which approximates the effective interest method, over the life of the debt. Fees attributable to the lender of $1,664 are presented as a discount to the carrying value of debt. Amortization expense of the deferred financing charges of $251 and $86, and accretion expense of debt discount of $519 and $183 are included in interest expense as of December 31, 2015 and 2014, respectively.
On December 18, 2015, the Company amended the revolving credit agreement. As a result of this modification, the Company accelerated amortization of $324 representing a portion of the remaining unamortized balance of debt issuance costs. Refer to Note 7—Credit Facilities for additional disclosure on our revolver credit agreement.
Inventories
The Company’s sand inventory consists of raw material (sand that has been excavated but not processed), work-in-progress (sand that has undergone some but not all processing) and finished goods (sand that has been completely processed and is ready for sale). The spare parts inventory consists of critical spare parts.
Sand inventory is stated at the lower of cost or market using the average cost method. For the years ended December 31, 2015 and 2014, the Company had no write-down of inventory as a result of any lower of cost or market assessment. Costs applied to the inventory include direct excavation costs, processing costs, overhead allocation, depreciation and depletion. Stockpile tonnages are calculated by measuring the number of tons added and removed from the stockpile. Costs are calculated on a per ton basis and are applied to the stockpiles based on the number of tons in the stockpile. The Company performs quarterly physical inventory measurements to verify the quantity of inventory on hand. Due to variation in sand density and moisture content and production processes utilized to manufacture the Company’s products, physical inventories will not detect all variances. To mitigate this risk, the Company recognizes a yield adjustment on its inventories.
Spare parts inventory is accounted for on a first-in, first-out basis at the lower of cost or market.
F-28
Table of Contents
Property, Plant and Equipment
Property, plant and equipment are recorded at cost. Costs related to researching, surveying, drilling, and related activities are recorded at cost and capitalized once a determination has been made that the Company’s property has proven and probable reserves. Capitalized mining costs are depleted using the units-of-production method. Construction in progress is primarily comprised of machinery and equipment which has not been placed in service and is not depreciated until the related assets or improvements are ready to be placed in service. Depreciation is calculated using the straight-line method over the estimated useful lives of the property, plant and equipment, which are:
| Years | ||||
| Land improvements |
10 | |||
| Plant and buildings |
5-15 | |||
| Real estate properties |
10-40 | |||
| Rail spur |
30 | |||
| Vehicles |
3-5 | |||
| Machinery, equipment and tooling |
3-15 | |||
| Furniture and fixtures |
3-10 | |||
| Deferred mining costs |
3 | |||
Expenditures for maintenance and repairs are charged against income as incurred; betterments that increase the value or materially extend the life of the related assets are capitalized. Upon sale or disposition of property and equipment, the cost and related accumulated depreciation and amortization are removed from the accounts and any resulting gain or loss is recognized in the consolidated income statements.
Impairment of Long-Lived Assets
The Company evaluates long-lived assets for impairment whenever events or changes in circumstances indicate that the carrying value of an asset may not be recoverable. If the estimated future cash flows (undiscounted and without interest charges) from the use of an asset are less than the carrying value, a write-down will be recorded to reduce the related asset to its estimated fair value. Management performed an impairment analysis as of December 31, 2015 due to the decline in the crude oil markets which resulted in no impairment charge. No impairment charge was recorded as of December 31, 2014.
Revenue Recognition
The Company recognizes revenue when persuasive evidence of an arrangement exists, delivery of products has occurred, the sales price charged is fixed or determinable, collectability is reasonably assured, and the risk of loss is transferred to the customer. The Company’s sales are generally FCA, payment made at the origination point at the Company’s facility, and title passes as the product is loaded into rail cars hired by the customer. Certain spot-rate customers have shipping terms of FCA, payment made at the destination; the Company recognizes this revenue when the sand is received at the destination. At December 31, 2015 and 2014, there was no deferred revenue related to such transactions.
The Company derives its revenue by mining and processing sand that its customers purchase. Its revenues are primarily a function of the price per ton realized and the volumes sold. In some instances, its revenues may also include a monthly reservation charge, at agreed-upon terms with its customers, or a charge for transportation services it provides to its customers. The Company’s transportation revenue fluctuates based on a number of factors, including the volume of product it transports and the distance between its plant and customers.
The Company sells a limited amount of its products under short-term price agreements or at prevailing market rates. The majority of the Company’s revenues are realized through take-or-pay supply agreements with five customers. The expiration dates of these contracts range from 2016 through 2020; however, contracts
F-29
Table of Contents
include extension periods, as defined in the respective contracts. These agreements define, among other commitments, the volume of product that its customers must purchase, the volume of product that the Company must provide, and the price that the Company will charge and that its customers will pay for each ton of contracted product. Prices under these agreements are generally fixed and subject to adjustment, upward or downward, only for certain changes in published producer cost indices or market factors. As a result, the Company’s realized prices may not grow at rates consistent with broader industry pricing. For example, during periods of rapid price growth, its realized prices may grow more slowly than those of competitors, and during periods of price decline, its realized prices may outperform industry averages. With respect to the take-or-pay arrangements, if the customer is not allowed to make up deficiencies, the Company recognizes revenues to the extent of the minimum contracted quantity and minimum contract price, assuming payment has been received or is reasonably assured. If deficiencies can be made up, receipts in excess of actual sales are recognized as deferred revenues until production is actually taken or the right to make up deficiencies expires. These agreements generally provide that, if the Company is unable to deliver the contracted minimum volumes, the customer has the right to purchase replacement product from alternative sources, provided that the inability to supply is not the result of an excusable delay, as defined in these agreements. In the event that the price of the replacement product exceeds the contract price and the inability to supply the contracted minimum volume is not the result of an excusable delay, the Company is responsible for the difference. At December 31, 2015 and 2014, the Company had significant levels of inventory on hand; therefore, the likelihood of any such penalties was considered remote.
The Company also recognizes revenue on the rental of its leased rail car fleet (Note 19) to customers either under long-term contracts or on an as-used basis. For the years ended December 31, 2015 and 2014, the Company recognized $3,543 and $1,563 of rail car revenue, respectively.
At December 31, 2015, the Company recognized $10,095 of revenue relating to minimum required payments under take-or-pay contracts.
At December 31, 2015 and 2014, the Company determined that no amounts related to minimum commitments under customer contracts were due or payable to the Company.
Amounts invoiced or received from customers in advance of sand deliveries are recorded as deferred revenue.
Deferred Revenue
The Company receives advanced payments from certain customers in order to secure and procure a reliable provision and delivery of product. The Company classifies such advances as current or non-current liabilities depending upon the anticipated timing of delivery of the supplied product.
The Company may receive an advance payment from a customer, based on the terms of the customer’s long-term contract, for a certain volume of product to be delivered. Revenue is recognized as product is delivered and the deferred revenue is reduced.
Deferred revenue balance at December 31, 2015 and 2014 was $7,133 and $0, respectively.
Shipping
Shipping revenue is classified as revenue. Revenue generated from shipping was $2,294 and $3,972, respectively, for the years ended December 31, 2015 and 2014. Shipping costs are classified as cost of sales. Shipping costs consist of railway transportation costs to deliver products to customers. Cost of sales generated from shipping was $2,257 and $4,246 for the years ended December 31, 2015 and 2014, respectively.
F-30
Table of Contents
Asset Retirement Obligation
In accordance with the Financial Accounting Standards Board (“FASB”) Account Standard Codification (“ASC”) 410-20, “Asset Retirement Obligation”, the Company recognizes reclamation obligations when extraction occurs and records them as liabilities at estimated fair value. In addition, a corresponding increase in the carrying amount of the related asset is recorded and depreciated over such asset’s useful life or the estimated number of years of extraction. The reclamation liability is accreted to expense over the estimated productive life of the related asset and is subject to adjustments to reflect changes in value resulting from the passage of time and revisions to the estimates of either the timing or amount of the reclamation costs. At December 31, 2015 and 2014, the Company’s net asset retirement obligation was $1,180 and $1,765, respectively.
Financial Instruments
The carrying value of the Company’s financial instruments, consisting of cash, accounts receivable, accounts payable and accrued expenses, approximates their fair value due to the short maturity of such instruments. Financial instruments also consist of debt for which fair value approximates carrying values as the debt bears interest at a variable rate which is reflective of current rates otherwise available to the Company. Unless otherwise noted, it is management’s opinion that the Company is not exposed to significant interest, currency or credit risks arising from these financial instruments.
Fair Value Measurements
The Company’s financial assets and liabilities are to be measured using inputs from the three levels of the fair value hierarchy, of which the first two are considered observable and the last unobservable, which are as follows:
| • | Level 1—Inputs are unadjusted quoted prices in active markets for identical assets or liabilities that the Company has the ability to access at the measurement date; |
| • | Level 2—Inputs other than Level 1 that are observable, either directly or indirectly, such as quoted prices for similar assets or liabilities in active markets, quoted prices for identical or similar assets or liabilities in markets that are not active or other inputs corroborated by observable market data for substantially the full term of the assets or liabilities; and |
| • | Level 3—Unobservable inputs that reflect the Company’s assumptions that market participants would use in pricing assets or liabilities based on the best information available. |
Stock-Based Compensation
The Company accounts for stock-based compensation in accordance with the provisions of ASC 718, “Compensation—Stock Compensation”, which requires the recognition of expense related to the fair value of stock-based compensation awards in the consolidated income statements.
For restricted stock issued to employees and members of the Board for their services on the Board, the Company estimates the grant date fair value of each share of restricted stock at issuance. For awards subject to service-based vesting conditions, the Company recognizes stock-based compensation expense, net of estimated forfeitures, equal to the grant date fair value of stock options on a straight-line basis over the requisite service period, which is generally the vesting term. Forfeitures are required to be estimated at the time of grant and revised, if necessary, in subsequent periods if actual forfeitures differ from those estimates.
F-31
Table of Contents
Income Taxes
The Company applies the provisions of ASC 740 “Income Taxes”, which utilizes a balance sheet approach to provide for income taxes. Under this method, deferred tax assets and liabilities are recognized for the expected future tax consequences of net operating loss carryforwards and temporary differences between the carrying amounts and the tax bases of assets and liabilities.
ASC 740 clarifies the accounting for uncertainty in income taxes recognized in an enterprise’s financial statements. The impact of an uncertain income tax position on the income tax returns must be recognized at the largest amount that is more-likely-than-not to be required to be recognized upon audit by the relevant taxing authority. This standard also provides guidance on de-recognition, measurement, classification, interest and penalties, accounting for interim periods, disclosure and transition issues with respect to tax positions. The Company includes interest and penalties as a component of income tax expense in the consolidated income statements. For the periods presented, no interest and penalties were recorded. Additionally, for the periods presented, the Company has not recorded any liabilities for unrecognized tax benefits as it has not taken any filing position for which an unrecognized tax benefit would be required to be recorded.
Environmental Matters
The Company is subject to various federal, state and local laws and regulations relating to the protection of the environment. Management has established procedures for the ongoing evaluation of the Company’s operations, to identify potential environmental exposures and to comply with regulatory policies and procedures. Environmental expenditures that relate to current operations are expensed or capitalized as appropriate. Expenditures that relate to an existing condition caused by past operations and do not contribute to current or future revenue generation are expensed as incurred. Liabilities are recorded when environmental costs are probable, and the costs can be reasonably estimated. The Company maintains insurance which may cover in whole or in part certain environmental expenditures. As of December 31, 2015 and 2014, there were no environmental matters deemed probable.
Comprehensive Income
Comprehensive income is defined as the change in equity of a business enterprise during a period from transactions and other events and circumstances from non-owner sources. Comprehensive income was equal to net income for all periods presented.
Segment Information
Operating segments are identified as components of an enterprise about which separate discrete financial information is available for evaluation by the chief operating decision maker, or decision-making group, in making decisions on how to allocate resources and assess performance. The Company’s chief operating decision maker is the chief executive officer. The Company and the chief executive officer view the Company’s operations and manage its business as one operating segment. All long-lived assets of the Company reside in the United States.
Basic and Diluted Net Income Per Share of Common Stock
Basic net income per share of common stock is computed by dividing net income attributable to common stockholders by the weighted-average number of shares of common stock outstanding during the period, warrants to purchase common stock and restricted stock. Diluted net income per share of common stock is computed by dividing the net income attributable to common stockholders by the sum of the weighted-average number of shares of common stock outstanding during the period plus the potential dilutive effects of preferred stock and warrants to purchase common stock, and restricted stock outstanding during the period calculated in accordance with the treasury stock method, although these shares, restricted stock and warrants are excluded if their effect is anti-dilutive.
F-32
Table of Contents
The following table reconciles the weighted-average common shares outstanding used in the calculation of basic net income per share to the weighted average common shares outstanding used in the calculation of diluted net income per share for the year ended December 31, 2015 and 2014:
| Year ended December 31, |
2015 | 2014 | ||||||
| Determination of shares: |
||||||||
| Weighted average common shares outstanding |
10,052 | 10,018 | ||||||
| Assumed conversion of warrants |
1,818 | 1,818 | ||||||
| Assumed conversion of restricted stock |
130 | 93 | ||||||
|
|
|
|
|
|||||
| Diluted weighted-average common stock outstanding |
12,000 | 11,929 | ||||||
|
|
|
|
|
|||||
Recent Accounting Pronouncements
In February 2016, the FASB issued ASU No. 2016-02, “Leases” (ASC 842), which replaces the existing guidance in ASC 840, “Leases.” ASC 842 requires lessees to recognize most leases on their balance sheets as lease liabilities with corresponding right-of-use assets. The new lease standard does not substantially change lessor accounting. The new standard is effective for interim and annual reporting periods beginning after December 15, 2018, with early adoption permitted. The Company currently in the process of evaluating the impact of the adoption on its consolidated financial statements.
In November 2015, the FASB issued ASU No. 2015-17, “Income Taxes—Balance Sheet Classification of Deferred Taxes”, which requires the presentation of deferred tax liabilities and assets be classified as non-current on balance sheets. The amendments in this ASU are effective for financial statements issued for annual periods beginning after December 15, 2016, and interim periods within those annual periods. Early adoption is permitted for all entities as of the beginning of an interim or annual reporting period. The Company has elected to early adopt this guidance prospectively as of December 31, 2015. The adoption only impacted deferred tax presentation on the consolidated balance sheet and related disclosure. No prior periods were retrospectively adjusted.
In July 2015, the FASB issued ASU No. 2015-11, “Simplifying the Measurement of Inventory”, which requires an entity to measure most inventory at the lower of cost and net realizable value, thereby simplifying the current guidance under which an entity must measure inventory at the lower of cost or market. The new standard is effective for public entities for financial statements issued for fiscal years beginning after December 15, 2016, including interim periods within those fiscal years. The Company is currently evaluating the new guidance and has not yet determined the impact this standard may have on its consolidated financial statements.
In April 2015, the FASB issued ASU No. 2015-15, “Interest-Imputation of Interest”, which simplifies presentation of debt issuance costs. The new standard requires that debt issuance costs be presented in the balance sheet as a direct deduction from the carrying amount of the debt liability, consistent with debt discounts or premiums. The new standard will be effective for financial statements issued for fiscal years beginning after December 15, 2015, and interim periods within fiscal years beginning after December 15, 2016. Early adoption is permitted for financial statements that have not been previously issued. The Company is currently evaluating the new guidance and has not yet determined the impact this standard may have on its consolidated financial statements.
In August 2014, the FASB issued ASU No. 2014-15, “Going Concern”, which provides guidance on determining when and how to disclose going-concern uncertainties in the financial statements. The new standard requires management to perform interim and annual assessments of an entity’s ability to continue as a going concern within one year of the date the financial statements are issued. An entity must provide certain disclosures if “conditions or events raise substantial doubt about the entity’s ability to continue as a going concern.” The ASU applies to all entities and is effective for annual periods ending after December 15, 2016, and interim periods thereafter, with early adoption permitted. The Company is currently evaluating the future disclosure requirements under this guidance.
F-33
Table of Contents
In May 2014, the FASB issued ASU 2014-09, “Revenue from Contracts with Customers”. The objective of ASU 2014-19 is to establish a single comprehensive model for entities to use in accounting for revenue arising from contracts with customers and will supersede most of the existing revenue recognition guidance, including industry-specific guidance. The core principle of ASU 2014-09 is that an entity recognizes revenue to depict the transfer of promised goods or services to customers in an amount that reflects the consideration to which the entity expects to be entitled in exchange for those goods or services. In applying the new guidance, an entity will (1) identify the contract(s) with a customer; (2) identify the performance obligations in the contract; (3) determine the transaction price; (4) allocate the transaction price to the contract’s performance obligations; and (5) recognize revenue when (or as) the entity satisfies a performance obligation. ASU 2014-09 applies to all contracts with customers except those that are within the scope of other topics in the FASB Accounting Standards Codification. The new guidance is effective for annual reporting periods (including interim periods within those periods) beginning after December 15, 2017 for public companies. Early adoption is only permitted as of annual reporting periods beginning after December 15, 2016. Entities have the option of using either a full retrospective or modified approach to adopt ASU 2014-09. The Company is currently evaluating the new guidance and has not determined the impact this standard may have on its consolidated financial statements nor decided upon the method of adoption.
3. Inventories
Inventories consisted of the following at December 31, 2015 and 2014:
| 2015 | 2014 | |||||||
| Raw material |
$ | 3 | $ | — | ||||
| Work-in-progress |
11,096 | 9,478 | ||||||
| Finished goods |
1,021 | 180 | ||||||
| Spare parts |
22 | 22 | ||||||
|
|
|
|
|
|||||
| Total |
12,142 | 9,680 | ||||||
| Less: current portion |
4,181 | 8,630 | ||||||
|
|
|
|
|
|||||
| Inventories, long-term |
$ | 7,961 | $ | 1,050 | ||||
|
|
|
|
|
|||||
Long-term inventories represent the estimated volume of sand as of the consolidated balance sheet date that will be sold beyond the next twelve months.
4. Prepaid Expenses and Other Current Assets
As of December 31, 2015 and 2014, prepaid expenses and other current assets were comprised of the following:
| 2015 | 2014 | |||||||
| Prepaid insurance |
$ | 100 | $ | 585 | ||||
| Prepaid expenses |
533 | 514 | ||||||
| Prepaid income taxes |
888 | 2,393 | ||||||
| Other receivables |
3 | 264 | ||||||
| Other current assets |
— | 167 | ||||||
|
|
|
|
|
|||||
| Prepaid expenses and other current assets |
$ | 1,524 | $ | 3,923 | ||||
|
|
|
|
|
|||||
F-34
Table of Contents
5. Property, Plant and Equipment
Property, plant and equipment consists of the following at December 31, 2015 and 2014:
| 2015 | 2014 | |||||||
| Machinery, equipment and tooling |
$ | 4,673 | $ | 4,011 | ||||
| Vehicles |
952 | 733 | ||||||
| Furniture and fixtures |
303 | 206 | ||||||
| Plant and building |
64,001 | 43,785 | ||||||
| Real estate properties |
3,500 | 2,131 | ||||||
| Railroad and sidings |
7,868 | 7,193 | ||||||
| Land and improvements |
12,977 | 9,132 | ||||||
| Asset retirement obligation |
1,135 | 1,748 | ||||||
| Mineral properties |
9,785 | 9,734 | ||||||
| Deferred mining costs |
155 | — | ||||||
| Construction in progress |
16,637 | 14,941 | ||||||
|
|
|
|
|
|||||
| 121,986 | 93,614 | |||||||
| Less: accumulated depreciation and depletion |
13,058 | 7,799 | ||||||
|
|
|
|
|
|||||
| Property, plant and equipment, net |
$ | 108,928 | $ | 85,815 | ||||
|
|
|
|
|
|||||
Depreciation expense was $5,276 and $3,611 for the years ended December 31, 2015 and 2014, respectively. Depletion expense was $13 and $14 for the years ended December 31, 2015 and 2014, respectively. The Company capitalized $1,808 and $453 of interest expense associated with the construction of new plant and equipment for the years ended December 31, 2015 and 2014, respectively.
6. Accrued and Other Expenses
As of December 31, 2015 and 2014, accrued and other expenses were comprised of the following:
| 2015 | 2014 | |||||||
| Employee related expenses |
$ | 216 | $ | 473 | ||||
| Accrued construction |
917 | 3,440 | ||||||
| Accrued real estate taxes |
— | 200 | ||||||
| Accrued legal fees |
99 | 73 | ||||||
| Accrued consulting expense |
139 | 400 | ||||||
| Accrued freight charges |
162 | 247 | ||||||
| Accrued site work |
— | 27 | ||||||
| Accrued interest revolving credit facility |
701 | 699 | ||||||
| Derivative liability |
455 | — | ||||||
| Other accrued liabilities |
1,089 | 791 | ||||||
|
|
|
|
|
|||||
| Accrued and other expenses |
$ | 3,778 | $ | 6,350 | ||||
|
|
|
|
|
|||||
From time to time, the Company enters into fixed-price purchase obligations to purchase propane (which is used in its production operations). The contracts specify the quantity of propane to be delivered over a specified period of time and at a specified fixed price. The Company has historically concluded that these obligations are precluded from recognition in its consolidated financial statements in accordance with the normal sales and normal purchases exclusion as provided in ASC 815 “Derivatives and Hedging”. However, as the Company did not take physical delivery under its current fixed-price propane agreement, the Company accounted for this agreement under derivative accounting. As of December 31, 2015, the liability for this agreement was marked to market and was settled in February 2016 for $460.
F-35
Table of Contents
7. Credit Facilities
Line of Credit
On July 2, 2012, the Company obtained a one-year $10,000 line of credit from a bank. The line of credit had an interest rate of Prime plus 1%. In July 2012, the Company borrowed $6,000 under the line of credit. In August 2012, the Company borrowed the remaining $4,000 under the line of credit. The majority holder of the Company’s common stock (and the sole holder of the Series A Preferred Stock) guaranteed the line of credit. In connection with the guarantee, the Company agreed to pay the holder of the Series A Preferred Stock additional stock dividends of 0.32% per annum through the maturity date of the line of credit. In July 2013, the line of credit was extended through July 9, 2014 and bore an interest rate of Prime plus 0.35%. Once a portion of the line of credit has been repaid, it cannot be re-borrowed. There were no financial covenants associated with the agreement. Interest expense under the line of credit was $0 and $80 for the years ended December 31, 2015 and 2014, respectively.
On March 28, 2014, as part of the financing transaction disclosed below, the outstanding balance of $9,256, which included accrued interest, was paid in full.
Revolving Credit Facility
On March 28, 2014, Smart Sand Inc. and its wholly owned subsidiary Fairview Cranberry Company, LLC entered into a $72,500 revolving credit and security agreement (the “Credit Agreement”) as borrowers (the “Borrowers”), and PNC Bank National Association, as administrative agent and collateral agent, and other lender. The Credit Agreement provides for a $72,500 variable rate senior secured revolving credit facility (“revolving credit facility”) which was available to repay a $40,000 portion of the outstanding Preferred Shares (Note 11) and the outstanding balance of the line of credit described above. In addition, the revolving credit facility was available to fund fees and expenses totaling $1,675 incurred in connection with the credit facility, and for general business purposes, including working capital requirements, capital expenditures, and permitted acquisitions. In addition, the Credit Agreement includes a sublimit of up to $5,000 for the issuance of letters of credit. Substantially all of the assets of the Borrowers are pledged as collateral under the Credit Agreement. The revolving credit facility matures on March 28, 2019.
Loans under the revolving credit facility bear interest at the Borrowers’ option at either:
| • | A Base Rate (as defined in the Credit Agreement), which will be the base commercial lending rate of PNC Bank, as publicly announced to be in effect from time to time, plus an applicable margin ranging from 2.50% to 3.00% based on the total leverage ratio; or |
| • | LIBOR plus an applicable margin ranging from 3.50% to 4.00% based on the total leverage ratio. |
The Company also incurred certain commitment fees on committed amounts that are neither used for borrowings nor under letters of credit.
The Company initially borrowed $53,837. Of the $1,675 of direct financing costs, $1,139 was recorded as debt discount against the amount borrowed, resulting in net proceeds of $52,698. The debt discount is being amortized to interest expense over the remaining term of the credit facility using the effective interest rate method. The unamortized debt discount balance was $962 and $956 as of December 31, 2015 and 2014, respectively. The remaining direct costs for professional and legal fees of $678 were recorded as deferred financing costs which are amortized through interest expense over the term of the facility. As a result of this transaction, the Company recognized an approximate $1,230 loss on extinguishment of debt related to the accelerated accretion of the original issuance costs associated with the $40,000 repayment of the portion of the outstanding Preferred Shares.
On October 29, 2014, the Company amended the Credit Agreement to provide for up to $100,000 variable senior secured revolving credit facility, as well as a sublimit of up to $15,000 for the issuance of letters of credit.
F-36
Table of Contents
Substantially all of the assets of the Borrowers are pledged as collateral under the amended Credit Agreement. The Company incurred a $275 commitment fee for this amendment, recorded as debt discount against the revolving credit facility.
The Credit Agreement contains various covenants and restrictive provisions and requires maintenance of financial covenants, including a fixed charge coverage ratio and a total leverage ratio (as defined in the credit facility). As of September 30, 2015, the Company’s total leverage ratio exceeded the threshold of 3.00 to 1.00. The Company was in compliance with all other covenants at that time.
On December 18, 2015, the Company entered into the Fourth Amendment to the Credit Agreement (“Fourth Amendment”). Under the Fourth Amendment, the event of default related to the September 30, 2015 leverage ratio was waived and the following terms were amended:
| • | The total commitment was reduced from $100,000 to $75,000. |
| • | Quarterly permanent paydowns are required until the maximum commitment reaches $55,000 from the sharing of excess cash flow, as defined in the Fourth Amendment. |
| • | Application of the leverage ratio and fixed charge coverage ratio covenants is foregone until the earlier of December 31, 2016 or such quarter that the Company cannot maintain a $3,000 excess availability (as defined in the Fourth Amendment). |
| • | Annual capital expenditures are restricted, as defined in the Fourth Amendment, until the $55,000 maximum commitment level is reached. |
In addition, the Fourth Amendment increased the interest rates applicable to borrowings under the revolving credit at the Borrowers’ option at either:
| • | A Base Rate, as defined, which will be the base commercial lending rate of PNC Bank, as publicly announced to be in effect from time to time, plus an applicable margin of 3.00%; or |
| • | LIBOR plus an applicable margin of 4.00%. |
The Company incurred a $250 commitment fee for this amendment, recorded as debt discount against the revolving credit facility.
At December 31, 2015, the total amount drawn under the facility was $64,216, net of debt discount of $962, and the Company had $4,157 letters of credit outstanding. The total undrawn availability under the Fourth Amendment was $6,602. At December 31, 2015 outstanding borrowings under the Credit Agreement bore interest at a weighted-average rate of approximately 4.1%.
8. Equipment Financing Obligations
The Company entered into various arrangements to finance equipment. Accordingly, the equipment with a cost of $2,853 has been capitalized and included in the Company’s property, plant and equipment for year ended December 31, 2015. Depreciation expense under equipment financing obligation assets was $366 and $245 for the years ended December 31, 2015 and 2014, respectively.
F-37
Table of Contents
Future annual payments for equipment financing obligations at December 31, 2015 are as follows:
| Year Ending December 31, |
Amount | |||
| 2016 |
$ | 483 | ||
| 2017 |
720 | |||
| 2018 |
588 | |||
| 2019 |
— | |||
| 2020 |
— | |||
|
|
|
|||
| Total payments |
1,791 | |||
| Less: amount representing interest at 4.8%—6.3% |
136 | |||
|
|
|
|||
| Present value of payments |
1,655 | |||
| Less: current portion |
409 | |||
|
|
|
|||
| Equipment financing obligations, net of current portion |
$ | 1,246 | ||
|
|
|
|||
9. Notes Payable
The Company financed certain equipment and automobile purchases by entering into various debt agreements. Interest rates on these notes ranged from 0% to 4.75%. Aggregate maturities of notes payable are as follows:
| Year ending December 31, |
||||
| 2016 |
$ | 1,369 | ||
| 2017 |
281 | |||
| 2018 |
288 | |||
| 2019 |
— | |||
| 2020 |
— | |||
|
|
|
|||
| Total |
1,938 | |||
| Less: current portion |
1,369 | |||
|
|
|
|||
| Notes payable, net of current portion |
$ | 569 | ||
|
|
|
|||
10. Asset Retirement Obligation
The Company has recorded a post-closure reclamation and site restoration obligation in the consolidated balance sheet. The following is a reconciliation of the total reclamation liability for asset retirement obligations.
| Balance at December 31, 2013 |
$ | 204 | ||
| Additions to liabilities |
1,544 | |||
| Accretion expenses |
17 | |||
|
|
|
|||
| Balance at December 31, 2014 |
$ | 1,765 | ||
| Additions to liabilities |
105 | |||
| Reductions to liabilities due to revision of estimates |
(719 | ) | ||
| Accretion expenses |
29 | |||
|
|
|
|||
| Balance at December 31, 2015 |
$ | 1,180 | ||
|
|
|
F-38
Table of Contents
11. Mandatorily Redeemable Series A Preferred Stock
On September 13, 2011, the Company entered into a financing agreement with an Investor (“Series A Investor”). The agreement provides for the sale of Preferred Shares to the Company in three tranches. As part of this agreement, the investor received 22,000 Preferred Shares with an issuance price of $1,000 per share as well as 6,500 shares of common stock in exchange for gross proceeds of $22,000 in September 2011. The second tranche of 26,000 Preferred Shares was issued in January 2012, in exchange for gross proceeds of $26,000. The third tranche of up to 27,000 Preferred Shares is available to the Company at the discretion of the Company’s Board.
The Company authorized 200,000 shares of Series A Preferred Stock. Effective July 1, 2013, the Company reduced the number of authorized Preferred Shares to 100,000. The holders of the Preferred Shares are not entitled to vote, but are entitled to elect four of the seven directors on the Board. In the event of liquidation, after provision for payment of all debts and liabilities of the Company, the holders of the Preferred Shares, before any payment shall be made to the holders of common stock, shall be entitled to receive the original issuance price per share, for all outstanding Preferred Shares plus any unpaid accrued dividends. If upon any such liquidation event the assets of the Company available for distribution to its stockholders shall be insufficient to pay the holders of shares of Series A Preferred Stock the full amount to which they shall be entitled, the holders of Series A Preferred Stock shall share ratably in any distribution of the assets available for distribution in proportion to the respective amounts which would otherwise be respectively entitled. Dividends accrue and accumulate on the Preferred Shares, whether or not earned or declared, at the rate of 15% per annum and compound quarterly on April 1, July 1, October 1 and January 1. Dividends are paid in-kind with additional Preferred Shares; fractional share portion of calculated dividends are paid in cash. In-kind dividends are accounted for as interest expense and are accrued as part of the Preferred Shares liability in the consolidated balance sheets. The Company issued 4,865 and 4,218 Preferred Shares for dividends in December 31, 2015 and 2014, respectively. The Company incurred $5,652 and $5,965 of interest expense related to the Preferred Shares for the years ending December 31, 2015 and 2014. Of such interest expense $574 and $364 was capitalized into property, plant and equipment in the consolidated balance sheet at December 31, 2015 and 2014, respectively.
The Preferred Shares are mandatorily redeemable on September 13, 2016, only if certain defined proforma covenants of the Credit Agreement (Note 7) are met and immediately prior, and after give effect to, such a redemption payment, undrawn availability would be the greater of $12,500 or a certain percentage of the maximum commitment level, as defined. While the Company has classified the Preferred Shares as current, because of these covenant requirements the Company does not anticipate being able to redeem the Preferred Shares in the foreseeable future (at least for one year and a day from the date the consolidated financial statements were available to be issued, as disclosed in Note 20.) The redemption price is the original issuance price per share of all outstanding Preferred Shares plus any unpaid accrued dividends. The Company has an option to repay the Preferred Shares before September 13, 2016; if this option is exercised, the Company must repay at least $1,000. The Preferred Shares are not convertible into common stock or any other security issued by the Company. As a result of the Preferred Shares’ mandatory redemption feature, the Company classified these securities as current liabilities in the accompanying consolidated balance sheets as of December 31, 2015 and long-term liabilities as of December 31, 2014, respectively.
The Company incurred $1,698 of transaction costs in connection with the issuance of the first tranche of the Preferred Shares. The transaction costs and the allocation of value to the common shares (see Note 12) have been recorded as a reduction of the carrying amount of the Preferred Shares liability. The Company incurred $1,639 of transaction costs in connection with the issuance of the second tranche of the Preferred Shares. The Preferred Shares liability will be accreted to the face value with a corresponding charge to interest expense over the remaining term of the Preferred Shares to present the face value of the Preferred Shares mandatory redemption date value on September 13, 2016.
F-39
Table of Contents
At December 31, 2015 and 2014, the Series A Redeemable Preferred Stock consisted of:
| December 31, |
2015 | 2014 | ||||||
| Face value |
$ | 26,469 | $ | 26,469 | ||||
| Unaccreted value of common stock and issuance costs |
(1,628 | ) | (1,938 | ) | ||||
| Accumulated dividends |
9,083 | 4,218 | ||||||
| Current year accretion of common stock and issuance costs |
784 | 310 | ||||||
|
|
|
|
|
|||||
| Total Series A Redeemable Preferred Stock |
$ | 34,708 | $ | 29,059 | ||||
|
|
|
|
|
|||||
At December 31, 2015 and 2014, the liquidation value of the Series A Preferred Stock is $35,552 and $30,687, respectively.
On March 28, 2014, as part of the financing transaction disclosed in Note 7, approximately $40,000 was redeemed by the Company and paid to the holders of Preferred Shares.
12. Common Stock
The Company had 15,000 authorized and 10,052 and 10,018 issued shares of common stock at December 31, 2015, and 2014, respectively. The holders of the common stock are entitled to one vote per share.
The stockholders’ agreement provides certain restrictions on all classes of stock for the transfer of shares or the issuance of additional shares. In the event a stockholder proposes to sell their shares, other investors in the Company and then the Company itself have a right of first refusal to purchase the shares, as defined. Alternatively, if a stockholder proposes to sell their shares, other stockholders have the right to participate in the sale based on a formula, as defined. Additionally, the stockholders’ agreement also restricts the Company from selling or issuing additional shares of stock, securities convertible into stock or options, warrants or rights to purchase stock without stockholder approval, as defined.
In the event of a sale of the Company, as defined, where the Board and at least a majority of the Preferred Shares and common stockholders agree to sell substantially all the assets or capital stock of the Company, all remaining stockholders are required to participate in the transaction.
The holder of the Series A Preferred Shares was issued 6,500 shares of common stock for no cash consideration in 2011. As a result and in order to recognize the value of the common stock issued, $1,179 was bifurcated from the proceeds of the Series A Preferred Shares and allocated to the 6,500 shares of common stock received by the Series A Investor. The Company used a current value method to determine the fair value of the shares at the issuance date since the Company was at such an early stage of development that no material progress had been made to the Company’s business plan. As discussed in Note 11, the amount allocated to the Series A Investor’s common shares will be accreted to the face value of the Preferred Shares with a corresponding charge to interest expense over the five-year term of the Preferred Shares.
Certain management stockholders have pledged 2,680 shares of common stock as a guarantee of performance on the Series A Preferred Shares (Note 11).
13. Warrants
Contemporaneous with the financing transaction in 2011 described in Note 11, the Company issued certain management stockholders warrants to purchase 1,818 shares of common stock for a purchase price of $10 per share. The warrants are scheduled to expire eight years after issuance. The warrants are exercisable upon the achievement of certain triggering events, as defined, in the warrant agreements. No expense was recorded related to these warrants during the years ended December 31, 2015 and 2014, because the performance criteria were not met.
F-40
Table of Contents
14. Stock-Based Compensation
In May 2012, the Board approved the 2012 Plan, which provides for the issuance of Awards (as defined in the Plan) of up to a maximum of 200 shares of the Company’s common stock to employees, non-employee members of the Board, and consultants of the Company. During 2014, the Plan was amended to provide for the issuance of Awards of up to a maximum of 400 shares of the Company’s common stock to employees, non-employee members of the Board, and consultants of the Company.
The awards can be issued in the form of incentive stock options, non-qualified stock options or restricted stock, and have expiration dates of 5 or 10 years after issuance, depending whether the recipient already holds above 10% of the voting power of all classes of the Company’s shares. The exercise price will be based on the fair market value of the share on the date of issuance; vesting periods will be determined by the Board upon issuance of the Award.
During 2015 and 2014, 20 and 154 shares of restricted stock were issued under the Plan, respectively. The grant date fair value range of the restricted stock per share was $4,160—$17,732. The shares vest over two to five years from their respective grant dates. The grant date fair value was calculated based on a weighted analysis of (i) publicly-traded companies in a similar line of business to the Company (market comparable method)—Level 2 inputs, and (ii) discounted cash flows of the Company—Level 3 inputs. The Company recognized $793 and $419 of compensation expense for the restricted stock during 2015 and 2014, respectively, in operating expenses on the consolidated income statements. At December 31, 2015 the Company had unrecognized compensation expense of $1,849. That expense is expected to be recognized as follows:
| Year ending December 31, |
||||
| 2016 |
$ | 723 | ||
| 2017 |
544 | |||
| 2018 |
442 | |||
| 2019 |
140 | |||
|
|
|
|||
| $ | 1,849 | |||
|
|
|
The following table summarizes restricted stock activity under the Plan from January 1, 2014 through December 31, 2015:
| Number of Shares |
Weighted Average |
|||||||
| January 1, 2014 |
24.2 | $ | 4,761 | |||||
| Granted |
154.0 | 17,732 | ||||||
| Vested |
(9.8 | ) | (6,605 | ) | ||||
| Forfeiture |
(0.1 | ) | (4,960 | ) | ||||
|
|
|
|||||||
| Unvested, December 31, 2014 |
168.3 | $ | 17,365 | |||||
| Granted |
20.0 | 17,332 | ||||||
| Vested |
(44.8 | ) | (16,734 | ) | ||||
| Forfeiture |
(12.0 | ) | (17,054 | ) | ||||
|
|
|
|||||||
| Unvested, December 31, 2015 |
131.5 | $ | 17,636 | |||||
|
|
|
|||||||
The total fair value of the granted restricted stock is determined by utilizing the underlying fair value of the common stock at the date of grant.
F-41
Table of Contents
15. Income Taxes
The provision for income taxes consists of the following:
| 2015 | 2014 | |||||||
| Current: |
||||||||
| Federal |
$ | 245 | $ | 819 | ||||
| State and local |
184 | 320 | ||||||
|
|
|
|
|
|||||
| Total current expense |
429 | 1,139 | ||||||
|
|
|
|
|
|||||
| Deferred: |
||||||||
| Federal |
3,610 | 8,199 | ||||||
| State and local |
90 | 180 | ||||||
|
|
|
|
|
|||||
| Total deferred income tax expense |
3,700 | 8,379 | ||||||
|
|
|
|
|
|||||
| Total income tax expense |
$ | 4,129 | $ | 9,518 | ||||
|
|
|
|
|
|||||
Income tax expense related to operations differs from the amounts computed by applying the statutory income tax rate of 35% to pretax income as follows:
| 2015 | 2014 | |||||||
| At statutory rate |
$ | 3,192 | $ | 5,976 | ||||
| Non-deductible interest expense |
1,777 | 2,136 | ||||||
| State taxes, net of US federal benefit |
211 | 393 | ||||||
| Change in valuation allowance |
— | — | ||||||
| Change in applicable tax rate |
— | 308 | ||||||
| Costs associated with possible restructuring |
(940 | ) | 913 | |||||
| Other |
(111 | ) | (208 | ) | ||||
|
|
|
|
|
|||||
| Total income tax expense |
$ | 4,129 | $ | 9,518 | ||||
|
|
|
|
|
|||||
Deferred income taxes reflect the net tax effects of loss and credit carry-forwards and temporary differences between the carrying amounts of assets and liabilities for financial reporting purposes and the amounts used for income tax purposes.
Significant components of the Company’s deferred tax assets for federal and state income taxes are as follows:
| December 31, |
2015 | 2014 | ||||||
| Deferred tax assets: |
||||||||
| Reserves and accruals |
$ | 537 | $ | 431 | ||||
|
|
|
|
|
|||||
| Total gross deferred tax assets |
537 | 431 | ||||||
| Deferred tax liabilities: |
||||||||
| Prepaid expenses and other |
122 | (304 | ) | |||||
| Depreciation, amortization and depletion |
(15,164 | ) | (10,932 | ) | ||||
|
|
|
|
|
|||||
| Total gross deferred tax liabilities |
(15,042 | ) | (11,236 | ) | ||||
| Less: current net deferred tax assets |
— | (225 | ) | |||||
|
|
|
|
|
|||||
| Noncurrent deferred tax liabilities, net |
$ | (14,505 | ) | $ | (11,030 | ) | ||
|
|
|
|
|
|||||
In assessing the realizability of deferred tax assets, the Company considered whether it is more likely than not that some portion or all of the deferred tax assets will not be realized. The ultimate realization of deferred tax assets is dependent upon the generation of future taxable income during the period in which those temporary
F-42
Table of Contents
differences become deductible. At December 31, 2015 and 2014, based on the Company’s future income projections, management determined it was more likely than not that the Company will be able to realize the benefits of the deductible temporary differences. As of December 31, 2015 and 2014, the Company determined no valuation allowance was necessary.
The Company has no state net operating losses as of December 31, 2015 and 2014, respectively.
The Company has evaluated its tax positions taken as of December 31, 2015 and 2014 and believes all positions taken would be upheld under examination from income taxing authorities. Therefore, no liability for the effects of uncertain tax positions has been recorded in the accompanying consolidated balance sheets as of December 31, 2015 or 2014. The Company is open to examination by taxing authorities since incorporation.
16. 401(k) Plan
The Company has a defined contribution plan that covers all employees over the age of 21 who have been employed for at least 90 days. The plan is subject to the provisions of the Employee Retirement Income Security Act of 1974. In accordance with the provisions of the plan, the Company may make discretionary contribution to the account of each participant. During the years ended December 31, 2015 and 2014, the Company made contributions of $181 and $121, respectively.
17. Concentrations
As of December 31, 2015 and 2014, three customers accounted for 96% and four customers accounted for 93% of the Company’s total accounts receivable, respectively.
During the years ended December 31, 2015 and 2014, 94% of our revenues were earned from four of our customers and 79% from three of our customers, respectively.
As of December 31, 2015 and 2014, three vendors accounted for 71% and three vendors accounted for 47% of the Company’s accounts payable, respectively.
For the years ended December 31, 2015 and 2014, four suppliers accounted for 33% and three suppliers accounted for 45% of the Company’s cost of goods sold, respectively.
The Company’s inventory and operations are located in Wisconsin. There is a risk of loss if there are significant environmental, legal or economic changes to this geographic area.
18. Related Party Transactions
During 2015 and 2014, the Company reimbursed the Series A Investor $27 and $130, respectively, for certain out-of-pocket and other expenses in connection with certain management and administrative support services provided. During 2015 and 2014, the Company expensed $0 and $104, respectively, for services under consulting agreements from relatives of certain Company stockholders. During 2014, the Company purchased vehicles from certain Company stockholders and upper management for $45.
F-43
Table of Contents
19. Commitments and Contingencies
Leases
The Company is obligated under certain operating leases and rental agreements for railroad cars, office space, and other equipment. Future minimum annual commitments under such operating leases at December 31, 2015 are as follows:
| Years ending December 31, |
||||
| 2016 |
$ | 6,537 | ||
| 2017 |
5,750 | |||
| 2018 |
5,622 | |||
| 2019 |
3,452 | |||
| 2020 |
2,722 | |||
| Thereafter |
2,070 | |||
Expense related to operating leases and rental agreements was $4,098 and $2,530 for the years ended December 31, 2015 and 2014, respectively. Lease expense related to rail cars are included in cost of goods sold in the consolidated statement of operations. Certain long-term rail car operating leases have been executed; however payment or the Company’s use of the lease does not begin until the cars arrive. These 50 cars are estimated to arrive beginning October 2016. Due to the uncertain nature of delivery, these rail car leases have not been included in the schedule above.
Litigation
The Company is periodically involved in litigation and claims incidental to its operation. Management believes that any pending litigation will not have a material impact on the Company’s consolidated financial position.
Employment Agreements
Certain of the Company’s executives are employed under employment agreements, the terms of which provide for, among other things, a base salary plus additional compensation including an annual bonus based on the percentage as defined and agreed upon by the Board based on service and/or performance in a given calendar year. The agreements, which contain one-year automatic renewals, provide for benefits that are customary for senior-level employees. The Company is required to pay severance under these agreements under certain conditions, as defined, in the event employment of these key executives is terminated. The Company’s commitment under these agreements is $1,175 as of December 31, 2015. The agreements are scheduled to expire through May 2017.
Consulting Agreements
On August 1, 2010, the Company entered into a consulting agreement related to the purchase of land with a third party. The third party acted as an agent for the Company to obtain options to purchase certain identified real property in Wisconsin, as well as obtain permits and approvals necessary to open, construct and operate a sand mining and processing facility on such real property. The agreement continues for two years after the closing of one or more of the identified real properties. The third party’s compensation consists of $10 per month through the end of the agreement, reimbursement of expenses, and $1 per each acre purchased as a closing fee. In 2015 and 2014, the Company paid the third party $841 and $206, respectively, in consulting fees, expense reimbursements and closing costs. These costs have been capitalized in property and equipment in the accompanying consolidated balance sheets as they relate to the acquisition of land.
F-44
Table of Contents
In addition to the aforementioned fees, the consulting agreement provides for tonnage fees based upon mining operations. The payment of $0.50 per sold ton of certain grades of sand that were mined and sold from the properties acquired under the consulting agreement begins with the second year of operations of the plant and continues indefinitely. The minimum annual tonnage fee is $200 per contract year, which runs from August 1 to July 31. During the years ended December 31, 2015 and 2014, the Company incurred $252 and $332, respectively, related to tonnage fees.
Letters of Credit
As of December 31, 2015, the Company has an outstanding letter of credit to the favor of Monroe County, Wisconsin for $770. The Company provided this letter of credit to assure performance under the reclamation plan filed with Monroe County. Additionally, the Company had two letters of credit to the favor of a fuel pipeline common carrier; a letter of credit for $1,254 issued in July 2014 to expand the pipeline capacity to the Company’s plant location and a letter of credit for $2,132 issued in March 2015 to assure future minimum annual usage payments.
Bonds
The Company entered into a performance bond with Jackson County, Wisconsin for $4,400. The Company provided this performance bond to assure performance under the reclamation plan filed with Jackson County. The Company entered into a $1,000 permit bond with the Town of Curran, Wisconsin to use certain town roadways. The Company provided this permit bond to assure maintenance and restoration of the roadway.
20. Subsequent Events
The Company has evaluated events and transactions subsequent to the consolidated balance sheet date and through March 31, 2016, the date the consolidated financial statements were available to be issued. Based on this evaluation, the Company is not aware of any events or transactions that occurred subsequent to December 31, 2015 through March 31, 2016 that would require recognition or disclosure in the consolidated financial statements.
F-45
Table of Contents
GLOSSARY OF TERMS
100 mesh frac sand: Sand that passes through a sieve with 60 holes per linear inch and is retained by a sieve with 140 holes per linear inch.
20/40 mesh frac sand: Sand that passes through a sieve with 20 holes per linear inch and is retained by a sieve with 40 holes per linear inch.
30/50 mesh frac sand: Sand that passes through a sieve with 30 holes per linear inch and is retained by a sieve with 50 holes per linear inch.
40/70 mesh frac sand: Sand that passes through a sieve with 40 holes per linear inch and is retained by a sieve with 70 holes per linear inch.
API: American Petroleum Institute.
Ceramic proppant: Artificially manufactured proppants of consistent size and sphere shape that offers a high crush strength.
Coarse sand: Sand of mesh size equal to or less than 70.
Crush strength: Ability to withstand high pressures. Crush strength is measured according to the pounds per square inch of pressure that can be withstood before the proppant breaks down into finer granules.
Dry plant: An industrial site where slurried sand product is fed through a dryer and screening system to be dried and screened in varying gradations. The finished product that emerges from the dry plant is then stored in silos before being transported to customers. Dry plants may also include a stone breaking machine and stone crusher.
Energy Information Administration (EIA): The statistical and analytical agency within the U.S. Department of Energy.
FCA: “FCA” (abbreviation for “free carrier”) has the meaning given such term under the International Chamber of Commerce’s Incoterms® 2010 rules.
Fine sand: Sand of mesh size greater than 70.
Frac sand: A proppant used in the completion and re-completion of unconventional oil and natural gas wells to stimulate and maintain oil and natural gas exploration and production through the process of hydraulic fracturing.
Hydraulic fracturing: The process of pumping fluids, mixed with granular proppants, into a geological formation at pressures sufficient to create fractures in the hydrocarbon-bearing rock.
ISO: means International Organization of Standards.
Mesh size: Measurement of the size of a grain of sand indicating it will pass through a sieve of a certain size.
Monocrystalline: Consisting of a single crystal rather than multiple crystals bonded together (polycrystalline). Monocrystalline frac sand typically exhibits higher crush strength than polycrystalline sand, as these structures are more prone to breaking down under high pressures than a single crystal.
Natural gas: A mixture of hydrocarbons (principally methane, ethane, propane, butanes and pentanes), water vapor, hydrogen sulfide, carbon dioxide, helium, nitrogen and other chemicals that occur naturally underground in a gaseous state.
A-1
Table of Contents
Northern White frac sand: A monocrystalline sand with greater sphericity and roundness enabling higher crush strengths and conductivity.
Overburden: The material that lies above an area of economic interest.
Probable reserves: Reserves for which quantity and grade and/or quality are computed from information similar to that used for proven reserves, but the sites for inspection, sampling and measurement are farther apart or are otherwise less adequately spaced. The degree of assurance, although lower than that for proven reserves, is high enough to assume continuity between points of observation.
Proppant: A sized particle mixed with fracturing fluid to hold fractures open after a hydraulic fracturing treatment.
Proven reserves: Reserves for which (a) quantity is computed from dimensions revealed in outcrops, trenches, workings or drill holes; grade and/or quality are computed from the results of detailed sampling and (b) the sites for inspection, sampling and measurement are spaced so closely and the geologic character is so well defined that size, shape, depth and mineral content of reserves are well-established.
Reserves: Sand that can be economically extracted or produced at the time of determination based on relevant legal, economic and technical considerations.
Resin-coated sand: Raw sand that is coated with a resin that increases the sand’s crush strength and prevents crushed sand from dispersing throughout the fracture.
Roundness: A measure of how round the curvatures of an object are. The opposite of round is angular. It is possible for an object to be round but not spherical (e.g., an egg-shaped particle is round, but not spherical). When used to describe proppant, roundness is a reference to having a curved shape which promotes hydrocarbon flow, as the curvature creates a space through which the hydrocarbons can flow.
Silica: A chemically resistant dioxide of silicon that occurs in crystalline, amorphous and cryptocrystalline forms.
Sphericity: A measure of how well an object is formed in a shape where all points are equidistant from the center. The more spherical a proppant, the more it promotes hydrocarbon flow.
Shale Play: A geological formation that contains petroleum and/or natural gas in nonporous rock that requires special drilling and completion techniques.
Turbidity: A measure of the level of contaminants, such as silt and clay, in a sample.
Wet plant: An industrial site where quarried sand is slurried into the plant. The sand ore is then scrubbed and hydrosized by washers or scrubbers to remove the deleterious materials from the ore, and then separated using a vibrating screen and waterway system to generate separate frac sand stockpiles, providing a uniform feedstock for the dryer. The ultra-fine materials are typically sent to a mechanical thickener, and eventually to settling ponds.
A-2
Table of Contents
Smart Sand, Inc.
10,615,152 Shares
Prospectus
,
Credit Suisse
Goldman, Sachs & Co.
Jefferies
Simmons & Company International
Energy Specialists of Piper Jaffray
Tudor, Pickering, Holt & Co.
Deutsche Bank Securities
Through and including , (the 25th day after the date of this prospectus), all dealers effecting transactions in these securities, whether or not participating in this offering, may be required to deliver a prospectus. This is in addition to a dealer’s obligation to deliver a prospectus when acting as an underwriter and with respect to an unsold allotment or subscription.
Table of Contents
PART II
Information Not Required in Prospectus
Item 13. Other Expenses of Issuance and Distribution
Set forth below are the expenses (other than underwriting discounts and the structuring fee) expected to be incurred in connection with the issuance and distribution of the securities registered hereby. With the exception of the SEC registration fee, the FINRA filing fee and the NASDAQ listing fee, the amounts set forth below are estimates.
| SEC registration fee |
$ | 10,070 | ||
| FINRA filing fee |
15,500 | |||
| NASDAQ listing fee |
150,000 | |||
| Printing and engraving expenses |
253,000 | |||
| Fees and expenses of legal counsel |
1,210,000 | |||
| Accounting fees and expenses |
393,000 | |||
| Transfer agent and registrar fees |
7,000 | |||
| Miscellaneous |
24,000 | |||
|
|
|
|||
| Total |
$ | 2,062,570 | ||
|
|
|
Item 14. Indemnification of Directors and Officers
Our amended and restated certificate of incorporation will provide that a director will not be liable to the corporation or its stockholders for monetary damages to the fullest extent permitted by the DGCL. In addition, if the DGCL is amended to authorize the further elimination or limitation of the liability of directors, then the liability of a director of the corporation, in addition to the limitation on personal liability provided for in our certificate of incorporation, will be limited to the fullest extent permitted by the amended DGCL. Our amended and restated bylaws will provide that the corporation will indemnify, and advance expenses to, any officer or director to the fullest extent authorized by the DGCL.
Section 145 of the DGCL provides that a corporation may indemnify directors and officers as well as other employees and individuals against expenses, including attorneys’ fees, judgments, fines and amounts paid in settlement in connection with specified actions, suits and proceedings whether civil, criminal, administrative, or investigative, other than a derivative action by or in the right of the corporation, if they acted in good faith and in a manner they reasonably believed to be in or not opposed to the best interests of the corporation and, with respect to any criminal action or proceeding, had no reasonable cause to believe their conduct was unlawful. A similar standard is applicable in the case of derivative actions, except that indemnification extends only to expenses, including attorneys’ fees, incurred in connection with the defense or settlement of such action and the statute requires court approval before there can be any indemnification where the person seeking indemnification has been found liable to the corporation. The statute provides that it is not exclusive of other indemnification that may be granted by a corporation’s certificate of incorporation, bylaws, disinterested director vote, stockholder vote, agreement or otherwise.
Our amended and restated certificate of incorporation will also contain indemnification rights for our directors and our officers. Specifically, our amended and restated certificate of incorporation will provide that we shall indemnify our officers and directors to the fullest extent authorized by the DGCL. Further, we may maintain insurance on behalf of our officers and directors against expense, liability or loss asserted incurred by them in their capacities as officers and directors.
We have obtained directors’ and officers’ insurance to cover our directors, officers and some of our employees for certain liabilities.
II-1
Table of Contents
In addition, we intend to enter into separate indemnification agreements with of our directors and certain officers. Each indemnification agreement will provide, among other things, for indemnification to the fullest extent permitted by law and our amended and restated bylaws against any and all expenses, judgments, fines, penalties and amounts paid in settlement of any claim. The indemnification agreements will provide for the advancement or payment of all expenses to the indemnitee and for the reimbursement to us if it is found that such indemnitee is not entitled to such indemnification under applicable law and our amended and restated bylaws.
The underwriting agreement provides for indemnification by the underwriters of us and our officers and directors, and by us of the underwriters, for certain liabilities arising under the Securities Act or otherwise in connection with this offering.
Item 15. Recent Sales of Unregistered Securities
During the past three years, we have issued unregistered securities to a limited number of persons, as described below. None of these transactions involved any underwriters, underwriting discounts or commissions or any public offering, and we believe that each of these transactions was exempt from the registration requirements pursuant to exemptions available under the Securities Act. All share and price information included in this section does not reflect the impact of the expected pre-offering split of our common stock.
The following table sets forth information on the restricted stock awards issued by us in the three years preceding the filing of this registration statement. The Company did not receive any consideration upon the grant of Restricted Stock.
| Date |
Person or Class of Person | Restricted Stock | ||
| April 29, 2013 |
Employee | 5.0 | ||
| August 14, 2013 |
Employee | 2.5 | ||
| June 10, 2014 |
Executive Officers | 80.0 | ||
| June 10, 2014 |
Employee | 15.0 | ||
| June 10, 2014 |
Director | 5.0 | ||
| August 1, 2014 |
Executive Officer | 15.0 | ||
| August 11, 2014 |
Executive Officer | 35.0 | ||
| August 11, 2014 |
Employee | 2.0 | ||
| October 31, 2014 |
Employee | 2.0 | ||
| February 4, 2015 |
Director | 10.0 | ||
| February 4, 2015 |
Director | 10.0 | ||
| March 15, 2016 |
Executive Officers | 37.0 | ||
| March 15, 2016 |
Employees | 36.0 |
The issuances of common stock described above represent grants of restricted stock under our compensation plans to our officers, directors and employees in reliance upon an available exemption from the registration requirements of the Securities Act, including those contained in Rule 701 promulgated under Section 3(b) of the Securities Act. Among other things, we relied on the fact that, under Rule 701, companies that are not subject to the reporting requirements of Section 13 or Section 15(d) of the Exchange Act are exempt from registration under the Securities Act with respect to certain offers and sales of securities pursuant to “compensatory benefit plans” as defined under that rule.
II-2
Table of Contents
The following table sets forth information on the shares of Preferred Stock issued as paid-in-kind dividends on existing outstanding and issued shares of Preferred Stock in the three years preceding the filing of this registration statement.
Table presents paid-in-kind dividends of Preferred Stock (with a redemption value of $1,000 per share of Preferred Stock) for which stock certificates were issue, and does not included calculated accrued dividends for any redemptions, such as the March 28, 2014 $40 million redemption. The Company did not receive any consideration upon the issuance of paid-in-kind dividends of shares of Preferred Stock.
| Date | # of PIK shares issued | |||
| January 1, 2013 |
2,062 | |||
| April 1, 2013 |
2,143 | |||
| July 1, 2013 |
2,225 | |||
| October 1, 2013 |
2,310 | |||
| January 1, 2014 |
2,399 | |||
| April 1, 2014 |
1,013 | |||
| July 1, 2014 |
1,029 | |||
| October 1, 2014 |
1,068 | |||
| January 1, 2015 |
1,108 | |||
| April 1, 2015 |
1,150 | |||
| July 1, 2015 |
1,193 | |||
| October 1, 2015 |
1,238 | |||
| January 1, 2016 |
1,284 | |||
| April 1, 2016 |
1,332 | |||
| July 1, 2016 |
1,382 | |||
The Preferred Stock, to which these paid-in-kind distributions relate, was originally issued to a single accredited investor upon an available exemption from the registration requirements of the Securities Act, primarily under the exemption provided for in Rule 506 of Regulation D of the Securities Act. The additional issuances of Preferred Stock are distributions in-kind on the previously issued Preferred Stock and are exempt from the registration requirements of the Securities Act, primarily under Section 4(a)(2) of the Securities Act. The Company received no additional consideration for these paid-in-kind distributions.
II-3
Table of Contents
Item 16. Exhibits
See the Exhibit Index immediately following the signature page hereto, which is incorporated by reference as if fully set forth herein.
Item 17. Undertakings
The undersigned registrant hereby undertakes to provide to the underwriters at the closing specified in the underwriting agreement certificates in such denominations and registered in such names as required by the underwriters to permit prompt delivery to each purchaser.
Insofar as indemnification for liabilities arising under the Securities Act may be permitted to directors, officers and controlling persons of the registrant pursuant to the foregoing provisions, or otherwise, the registrant has been advised that in the opinion of the Securities and Exchange Commission such indemnification is against public policy as expressed in the Securities Act and is, therefore, unenforceable. In the event that a claim for indemnification against such liabilities (other than the payment by the registrant of expenses incurred or paid by a director, officer or controlling person of the registrant in the successful defense of any action, suit or proceeding) is asserted by such director, officer or controlling person in connection with the securities being registered, the registrant will, unless in the opinion of its counsel the matter has been settled by controlling precedent, submit to a court of appropriate jurisdiction the question whether such indemnification by it is against public policy as expressed in the Securities Act and will be governed by the final adjudication of such issue.
The undersigned registrant hereby undertakes that,
(1) For purposes of determining any liability under the Securities Act, the information omitted from the form of prospectus filed as part of this registration statement in reliance upon Rule 430A and contained in a form of prospectus filed by the registrant pursuant to Rule 424(b)(1) or (4) or 497(h) under the Securities Act shall be deemed to be part of this registration statement as of the time it was declared effective.
(2) For the purpose of determining any liability under the Securities Act, each post-effective amendment that contains a form of prospectus shall be deemed to be a new registration statement relating to the securities offered therein, and the offering of such securities at that time shall be deemed to be the initial bona fide offering thereof.
(3) That, for the purpose of determining liability under the Securities Act of 1933 to any purchaser, each prospectus filed pursuant to Rule 424(b) as part of a registration statement relating to an offering, other than registration statements relying on Rule 430B or other than prospectuses filed in reliance on Rule 430A, shall be deemed to be part of and included in the registration statement as of the date it is first used after effectiveness. Provided, however, that no statement made in a registration statement or prospectus that is part of the registration statement or made in a document incorporated or deemed incorporated by reference into the registration statement or prospectus that is part of the registration statement will, as to a purchaser with a time of contract of sale prior to such first use, supersede or modify any statement that was made in the registration statement or prospectus that was part of the registration statement or made in any such document immediately prior to such date of first use.
(4) That, for the purpose of determining liability of the registrant under the Securities Act of 1933 to any purchaser in the initial distribution of the securities, the undersigned registrant undertakes that in a primary offering of securities of the undersigned registrant pursuant to this registration statement, regardless of the underwriting method used to sell the securities to the purchaser, if the securities are offered or sold to such purchaser by means of any of the following communications, the undersigned registrant will be a seller to the purchaser and will be considered to offer or sell such securities to such purchaser:
(a) Any preliminary prospectus or prospectus of the undersigned registrant relating to the offering required to be filed pursuant to Rule 424;
II-4
Table of Contents
(b) Any free writing prospectus relating to the offering prepared by or on behalf of the undersigned registrant or used or referred to by the undersigned registrant;
(c) The portion of any other free writing prospectus relating to the offering containing material information about the undersigned registrant or its securities provided by or on behalf of the undersigned registrant; and
(d) Any other communication that is an offer in the offering made by the undersigned registrant to the purchaser.
II-5
Table of Contents
SIGNATURES
Pursuant to the requirements of the Securities Act of 1933, as amended, the registrant has duly caused this Registration Statement to be signed on its behalf by the undersigned, thereunto duly authorized, in the City of Houston, Texas, on October 25, 2016.
| Smart Sand, Inc. | ||
| By: | /s/ Charles E. Young | |
| Charles E. Young Chief Executive Officer | ||
Pursuant to the requirements of the Securities Act of 1933, as amended this Registration Statement has been signed by the following persons in the capacities indicated on October 25, 2016.
| Signature |
Title | |
| /s/ Charles E. Young Charles E. Young |
Chief Executive Officer and Director | |
| /s/ Lee E. Beckelman Lee E. Beckelman |
Chief Financial Officer | |
| * Susan Neumann |
Vice President of Accounting, Controller and Secretary | |
| * José E. Feliciano |
Director (Co-Chairman of the Board) | |
| * Colin Leonard |
Director | |
| * Timothy J. Pawlenty |
Director | |
| * Andrew Speaker |
Director (Co-Chairman of the Board) | |
| * Tracy Robinson |
Director | |
| * Sharon Spurlin |
Director | |
| *By: |
/s/ Lee E. Beckelman | |
| Lee E. Beckelman | ||
| Attorney-in-fact | ||
II-6
Table of Contents
EXHIBIT INDEX
| Exhibit |
Description | |
| 1.1 | Form of Underwriting Agreement (including form of lock-up agreement) | |
| 3.1** | Form of Second Amended and Restated Certificate of Incorporation of Smart Sand, Inc. | |
| 3.2** | Form of Second Amended and Restated Bylaws of Smart Sand, Inc. | |
| 4.1** | Specimen Stock Certificate | |
| 4.2** | Common Stock Purchase Warrant, dated September 13, 2011, between Smart Sand, Inc. and Keystone Cranberry, LLC | |
| 4.3** | Common Stock Purchase Warrant, dated September 13, 2011, between Smart Sand, Inc. and Andrew Speaker | |
| 4.4** | Common Stock Purchase Warrant, dated September 13, 2011, between Smart Sand, Inc. and Frank Porcelli | |
| 4.5** | Common Stock Purchase Warrant, dated September 13, 2011, between Smart Sand, Inc. and BAMK Associates, LLC | |
| 4.6** | Form of Registration Rights Agreement | |
| 4.7** | Form of Stockholders Agreement | |
| 5.1 | Opinion of Latham & Watkins LLP as to the legality of the securities being registered | |
| 10.1#** | Form of Smart Sand, Inc. 2016 Omnibus Incentive Plan | |
| 10.2#** | Smart Sand, Inc. 2012 Equity Incentive Plan | |
| 10.3#** | Amendment No. 1 to Smart Sand, Inc. 2012 Equity Incentive Plan | |
| 10.4#** | Employment Agreement between Smart Sand, Inc. and Charles Young | |
| 10.5#** | Amendment No. 1 to Employment Agreement Between Smart Sand, Inc. and Charles Young | |
| 10.6#** | Form of Restricted Stock Award Agreement under Smart Sand, Inc. 2012 Equity Incentive Plan | |
| 10.7#** | Employment Agreement between Smart Sand, Inc. and Robert Kiszka | |
| 10.8#** | Amendment No. 1 to Employment Agreement between Smart Sand, Inc. and Robert Kiszka | |
| 10.9#** | Letter Agreement between Smart Sand, Inc. and Lee Beckelman, dated August 4, 2014 | |
| 10.10†** | Amended and Restated Master Product Purchase Agreement dated as of December 16, 2015 between Archer Pressure Pumping, LLC and Smart Sand, Inc. | |
| 10.11†** | Amended and Restated Railcar Usage Agreement dated as of December 16, 2015 between Archer Pressure Pumping, LLC and Smart Sand, Inc. | |
| 10.12† | Master Product Purchase Agreement dated as of November 15, 2013 between EOG Resources, Inc. and Smart Sand, Inc. | |
| 10.13†** | First Amendment to Master Product Purchase Agreement dated November 15, 2014 between EOG Resources, Inc. and Smart Sand, Inc. | |
| 10.14†** | Amended and Restated Master Product Purchase Agreement dated as of November 6, 2015 between US Well Services LLC and Smart Sand, Inc. | |
| 10.15†** | First Amendment to Amended and Restated Master Product Purchase Agreement dated as of May 1, 2016 between US Well Services LLC and Smart Sand, Inc. | |
| 10.16†** | Railcar Usage Agreement dated as of September 15, 2014 between US Well Services LLC and Smart Sand, Inc. | |
II-7
Table of Contents
| Exhibit |
Description | |
| 10.17†** | First Amendment to Railcar Usage Agreement dated as of November 6, 2015 between US Well Services LLC and Smart Sand, Inc. | |
| 10.18†** | Amended and Restated Master Product Purchase Agreement dated as of January 15, 2016 between Weatherford U.S., L.P. and Smart Sand, Inc. | |
| 10.19†** | First Amendment to Amended and Restated Master Product Purchase Agreement dated as of May 1, 2016 between Weatherford U.S., L.P. and Smart Sand, Inc. | |
| 10.20†** | Amended and Restated Railcar Usage Agreement dated as of January 15, 2016 between Weatherford U.S., L.P. and Smart Sand, Inc. | |
| 10.21†** | Second Amendment to Amended and Restated Master Product Purchase Agreement dated September 30, 2016 between Weatherford U.S., L.P. and Smart Sand, Inc. | |
| 10.22#** | Form of 2016 Employee Stock Purchase Plan | |
| 10.23** | Form of Indemnification Agreement between the Company and its officers and directors | |
| 21.1** | List of Subsidiaries of Smart Sand, Inc. | |
| 23.1 | Consent of Grant Thornton LLP | |
| 23.2** | Consent of John T. Boyd Company | |
| 23.3** | Consent of Stim-Lab Inc. | |
| 23.4** | Consent of Spears & Associates | |
| 23.5** | Consent of PropTester, Inc. | |
| 23.6** | Consent of Freedonia Group | |
| 23.7 | Consent of Latham & Watkins LLP (contained in Exhibit 5.1) | |
| 24.1** | Powers of Attorney (contained on the signature page to this Registration Statement) | |
| ** | Previously filed. |
| # | Compensatory plan, contract or arrangement. |
| † | Certain portions have been omitted pursuant to a confidential treatment request. Omitted information has been separately filed with the Securities and Exchange Commission. |
II-8