Attached files
| file | filename |
|---|---|
| 8-K - FORM 8-K - POPULAR, INC. | d272408d8k.htm |
Exhibit 99.1
|
|

Investor Presentation
Third Quarter 2016
|
|

Forward-Looking Statements
This presentation contains forward-looking statements within the meaning of the Private Securities Litigation Reform Act of 1995. These forward-looking statements are based on management’s current expectations and are subject to risks and uncertainties. Please refer to our Annual Report on Form 10-K for the year ended December 31, 2015, the Quarterly Reports on Form 10-Q for the quarters ended March 31, 2016 and June 30, 2016, and our other filings with the Securities and Exchange Commission for a discussion of factors that may cause the Corporation’s actual results to differ materially from any future results expressed or implied by such forward-looking statements. Those filings are available on the Corporation’s website (www.popular.com) and on the Securities and Exchange Commission website (www.SEC.gov). The Corporation does not undertake to update or revise any forward-looking statement to reflect events or circumstances that may arise after the date of such statements.
|
|
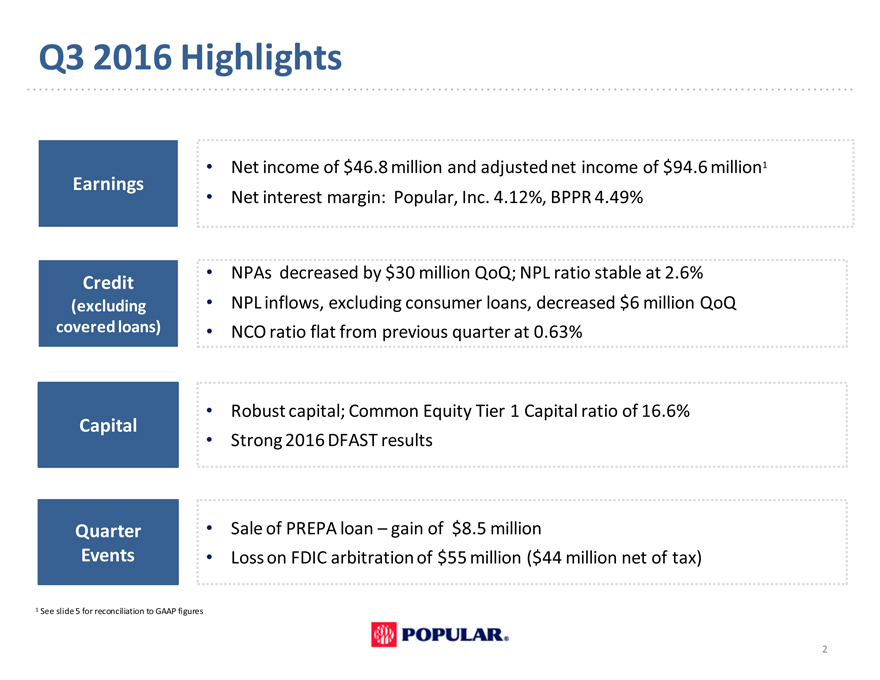
Q3 2016 Highlights
Earnings
• Net income of $46.8 million and adjusted net income of $94.6 million1
• Net interest margin: Popular, Inc. 4.12%, BPPR 4.49%
Credit
(excluding
covered loans)
• NPAs decreased by $30 million QoQ; NPL ratio stable at 2.6%
NPL inflows, excluding consumer loans, decreased $6 million QoQ
NCO ratio flat from previous quarter at 0.63%
Capital
Quarter
Events
Strong 2016 DFAST results
• Robust capital; Common Equity Tier 1 Capital ratio of 16.6%
Sale of PREPA loan – gain of $8.5 million
Loss on FDIC arbitration of $55 million ($44 million net of tax)
1 See slide 5 for reconciliation to GAAP figures
2
|
|
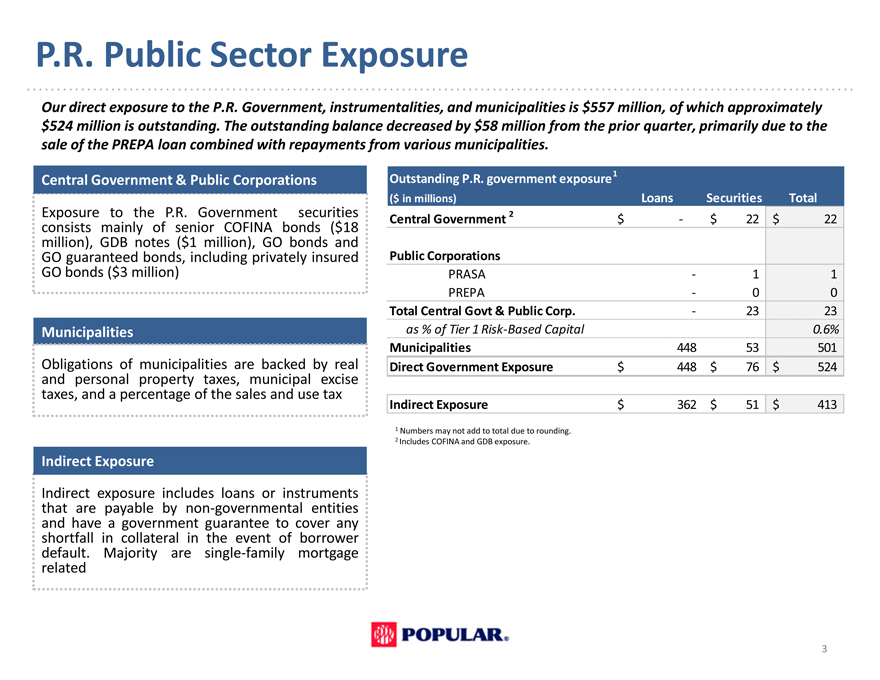
P.R. Public Sector Exposure
Our direct exposure to the P.R. Government, instrumentalities, and municipalities is $557 million, of which approximately $524 million is outstanding. The outstanding balance decreased by $58 million from the prior quarter, primarily due to the sale of the PREPA loan combined with repayments from various municipalities.
Central Government & Public Corporations
Exposure to the P.R. Government securities consists mainly of senior COFINA bonds ($18 million), GDB notes ($1 million), GO bonds and GO guaranteed bonds, including privately insured GO bonds ($3 million)
Municipalities
Obligations of municipalities are backed by real and personal property taxes, municipal excise taxes, and a percentage of the sales and use tax
Indirect Exposure
Indirect exposure includes loans or instruments that are payable by non-governmental entities and have a government guarantee to cover any shortfall in collateral in the event of borrower default. Majority are single-family mortgage related
Outstanding P.R. government exposure 1
($ in millions) Loans Securities Total
Central Government 2 $—$ 22 $ 22
Public Corporations
PRASA—1 1
PREPA—0 0
Total Central Govt & Public Corp.—23 23
as % of Tier 1 Risk-Based Capital 0.6%
Municipalities 448 53 501
Direct Government Exposure $ 448 $ 76 $ 524
Indirect Exposure $ 362 $ 51 $ 413
1 Numbers may not add to total due to rounding.
2 Includes COFINA and GDB exposure.
3
|
|
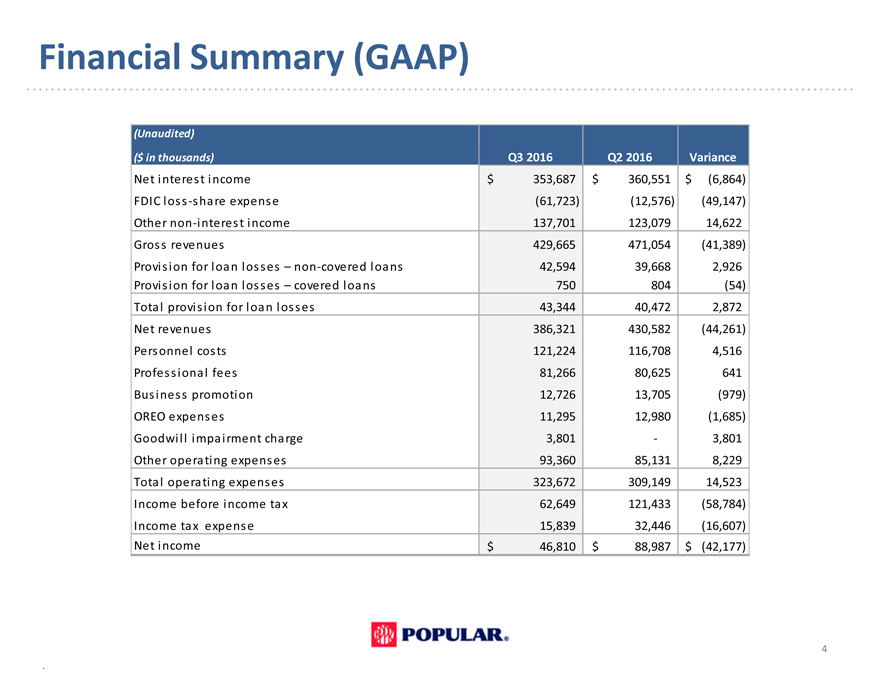
Financial Summary (GAAP)
(Unaudited)
($ in thousands) Q3 2016 Q2 2016 Variance
Net interest income $ 353,687 $ 360,551 $ (6,864)
FDIC loss -share expense(61,723)(12,576)(49,147)
Other non -interest income 137,701 123,079 14,622
Gross revenues 429,665 471,054(41,389)
Provision for loan losses – non -covered loans 42,594 39,668 2,926
Provision for loan losses – covered loans 750 804(54)
Total provision for loan losses 43,344 40,472 2,872
Net revenues 386,321 430,582(44,261)
Personnel costs 121,224 116,708 4,516
Professional fees 81,266 80,625 641
Business promotion 12,726 13,705(979)
OREO expenses 11,295 12,980(1,685)
Goodwill impairment charge 3,801—3,801
Other operating expenses 93,360 85,131 8,229
Total operating expenses 323,672 309,149 14,523
Income before income tax 62,649 121,433(58,784)
Income tax expense 15,839 32,446(16,607)
Net income $ 46,810 $ 88,987 $ (42,177)
4
|
|
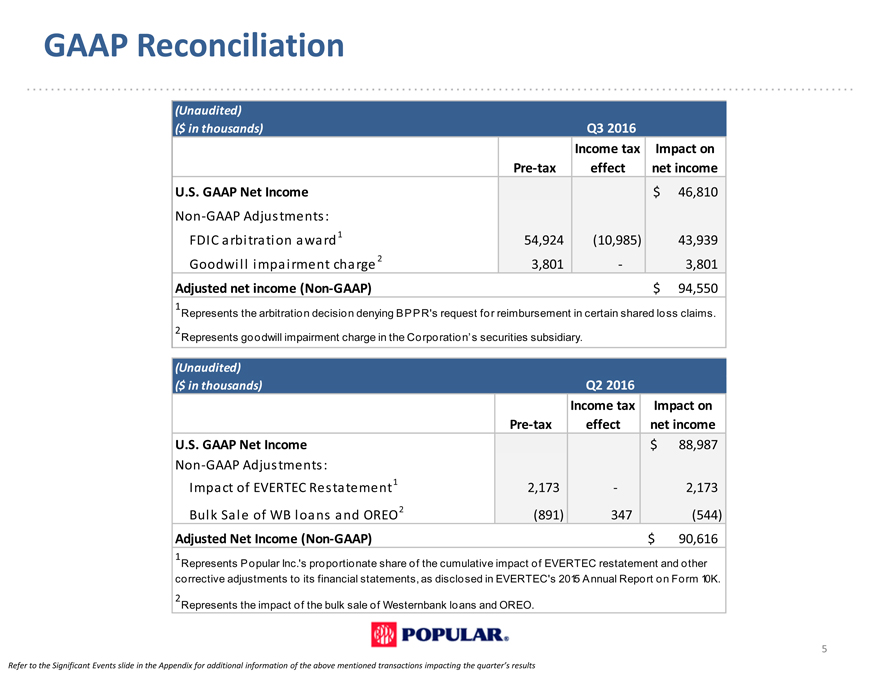
GAAP Reconciliation
(Unaudited)
($ in thousands) Q3 2016
Income tax Impact on
Pre-tax effect net income
U.S. GAAP Net Income $ 46,810
Non -GAAP Adjustments:
FDIC arbitration award 1 54,924(10,985) 43,939
Goodwill impairment charge 2 3,801—3,801
Adjusted net income (Non-GAAP) $ 94,550
1
Represents the arbitration decision denying BPPR’s request for reimbursement in certain shared loss claims.
2
Represents goodwill impairment charge in the Corporation’s securities subsidiary.
(Unaudited) Q2 2016
($ in thousands) Pre-tax Income tax effect Impact on net income
U.S. GAAP Net Income $ 88,987
Non -GAAP Adjustments:
Impact of EVERTEC Restatement 1 2,173—2,173
Bulk Sale of WB loans and OREO 2(891) 347(544)
Adjusted Net Income (Non-GAAP) $ 90,616
1
Represents Popular Inc.‘s proportionate share of the cumulative impact of EVERTEC restatement and other corrective adjustments to its financial statements, as disclosed in EVERTEC’s 2015 Annual Report on Form 10K.
2
Represents the impact of the bulk sale of Westernbank loans and OREO.
Refer to the Significant Events slide in the Appendix for additional information of the above mentioned transactions impacting the quarter’s results
5
|
|
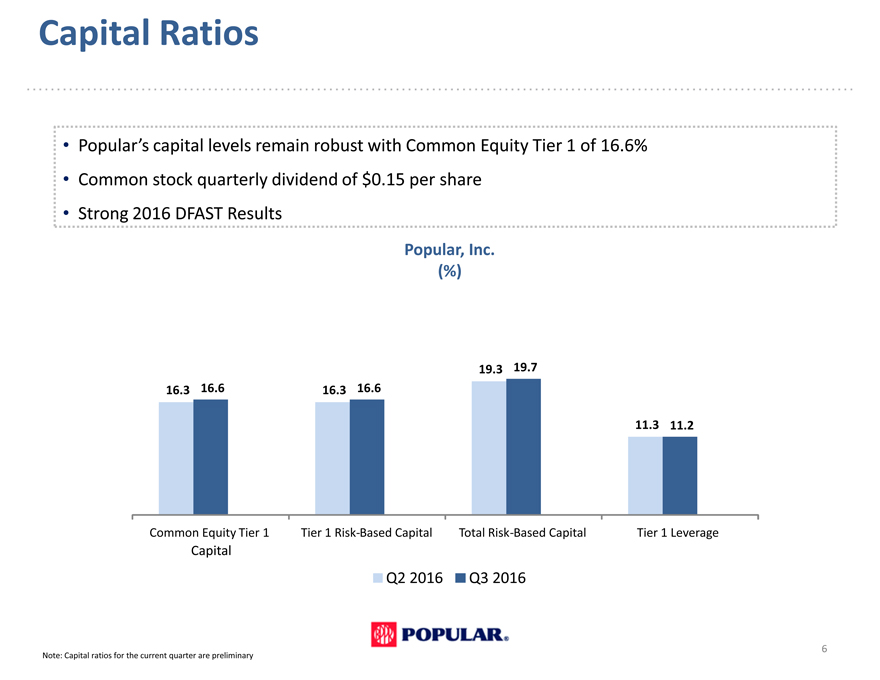
Capital Ratios
Popular’s capital levels remain robust with Common Equity Tier 1 of 16.6%
Common stock quarterly dividend of $0.15 per share
Strong 2016 DFAST Results
Popular, Inc. (%)
19.3 19.7
16.3 16.6 16.3 16.6
11.3 11.2
Common Equity Tier 1 Tier 1 Risk-Based Capital Total Risk-Based Capital Tier 1 Leverage
Capital
Q2 2016 Q3 2016
Note: Capital ratios for the current quarter are preliminary
6
|
|
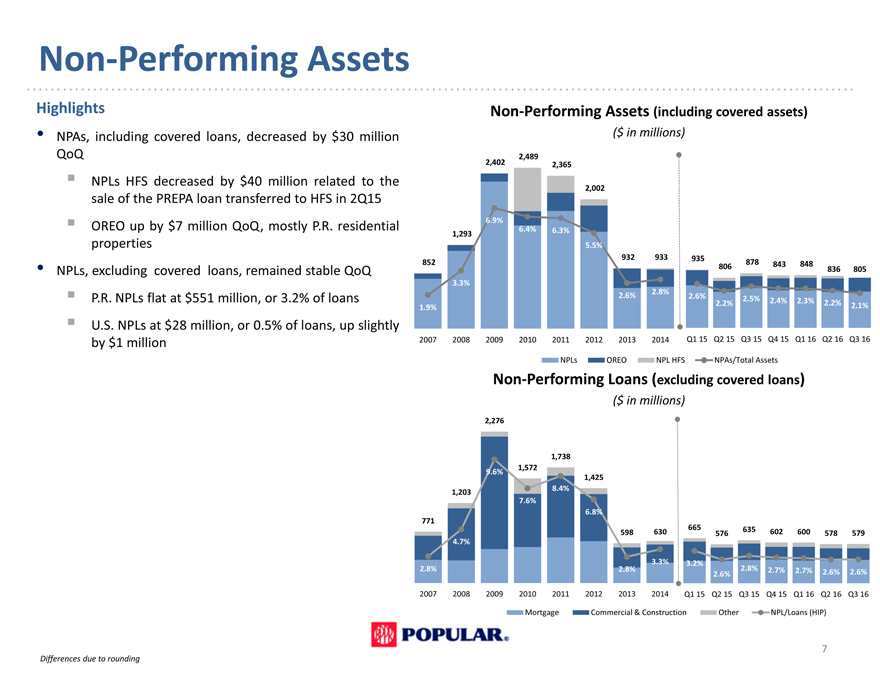
Non-Performing Assets
Highlights
NPAs, including covered loans, decreased by $30 million QoQ
? NPLs HFS decreased by $40 million related to the sale of the PREPA loan transferred to HFS in 2Q15 ? OREO up by $7 million QoQ, mostly P.R. residential properties
NPLs, excluding covered loans, remained stable QoQ
? P.R. NPLs flat at $551 million, or 3.2% of loans ? U.S. NPLs at $28 million, or 0.5% of loans, up slightly by $1 million
Non-Performing Assets (including covered assets)
($ in millions)
2,489
2,402 2,365
2,002
6.9%
1,293 6.4% 6.3%
5.5%
932 933 935
852 806 878 843 848 836 805
3.3%
2.8%
2.6% 2.6% 2.5% 2.4% 2.3%
1.9% 2.2% 2.2% 2.1%
2007 2008 2009 2010 2011 2012 2013 2014 Q1 15 Q2 15 Q3 15 Q4 15 Q1 16 Q2 16 Q3 16
NPLs OREO NPL HFS NPAs/Total Assets
Non-Performing Loans (excluding covered loans)
($ in millions)
2,276 12.0%
1,738 10.0%
9.6% 1,572
1,425 8.0%
1,203 8.4%
7.6%
6.8% 6.0%
771
598 630 665 576 635 602 600 578 579
4.7% 4.0%
3.3% 3.2%
2.8% 2.8% 2.6% 2.8% 2.7% 2.7% 2.2. 0%6% 2.6%
2007 2008 2009 2010 2011 2012 2013 2014 Q1 15 Q2 15 Q3 15 Q4 15 Q1 16 0.Q2 0%16 Q3 16
Mortgage Commercial & Construction Other NPL/Loans (HIP)
Differences due to rounding
7
|
|
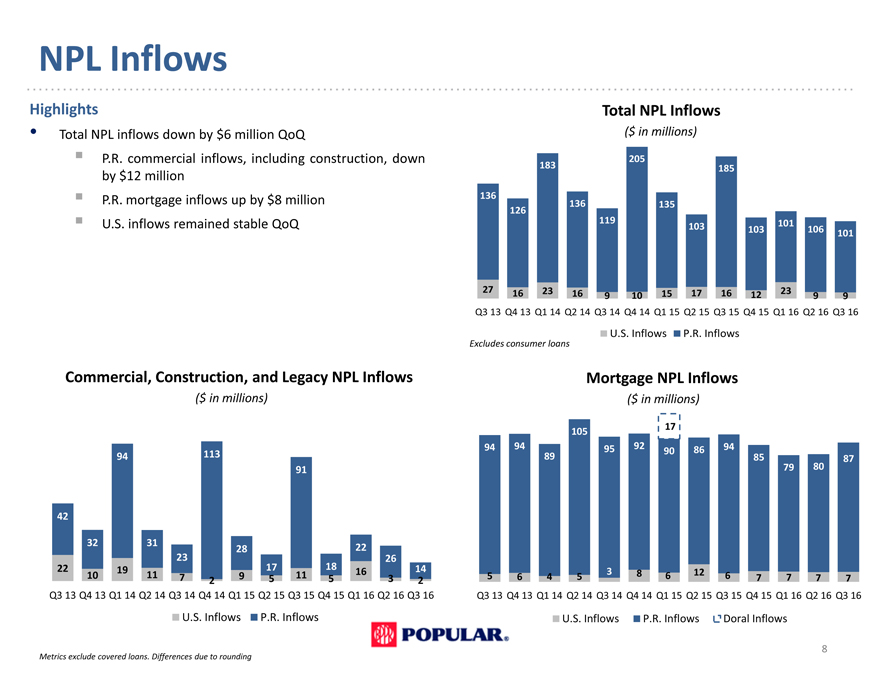
NPL Inflows
Highlights
Total NPL inflows down by $6 million QoQ
? P.R. commercial inflows, including construction, down by $12 million ? P.R. mortgage inflows up by $8 million ? U.S. inflows remained stable QoQ
Commercial, Construction, and Legacy NPL Inflows ($ in millions)
94 113
91
42
32 31 28 22
23 26
22 19 17 18 16 14
10 11 7 2 9 5 11 5 3 2
Q3 13 Q4 13 Q1 14 Q2 14 Q3 14 Q4 14 Q1 15 Q2 15 Q3 15 Q4 15 Q1 16 Q2 16 Q3 16
U.S. Inflows P.R. Inflows
Total NPL Inflows
($ in millions)
205
183 185
136
136 135
126
119 101
103 103 106
101
27 16 23 16 9 10 15 17 16 12 23 9 9
Q3 13 Q4 13 Q1 14 Q2 14 Q3 14 Q4 14 Q1 15 Q2 15 Q3 15 Q4 15 Q1 16 Q2 16 Q3 16
U.S. Inflows P.R. Inflows
Excludes consumer loans
Mortgage NPL Inflows
($ in millions)
105 17
94 94 95 92 90 86 94
89 85 87
79 80
5 6 4 5 3 8 6 12 6 7 7 7 7
Q3 13 Q4 13 Q1 14 Q2 14 Q3 14 Q4 14 Q1 15 Q2 15 Q3 15 Q4 15 Q1 16 Q2 16 Q3 16
U.S. Inflows P.R. Inflows Doral Inflows
Metrics exclude covered loans. Differences due to rounding
8
|
|
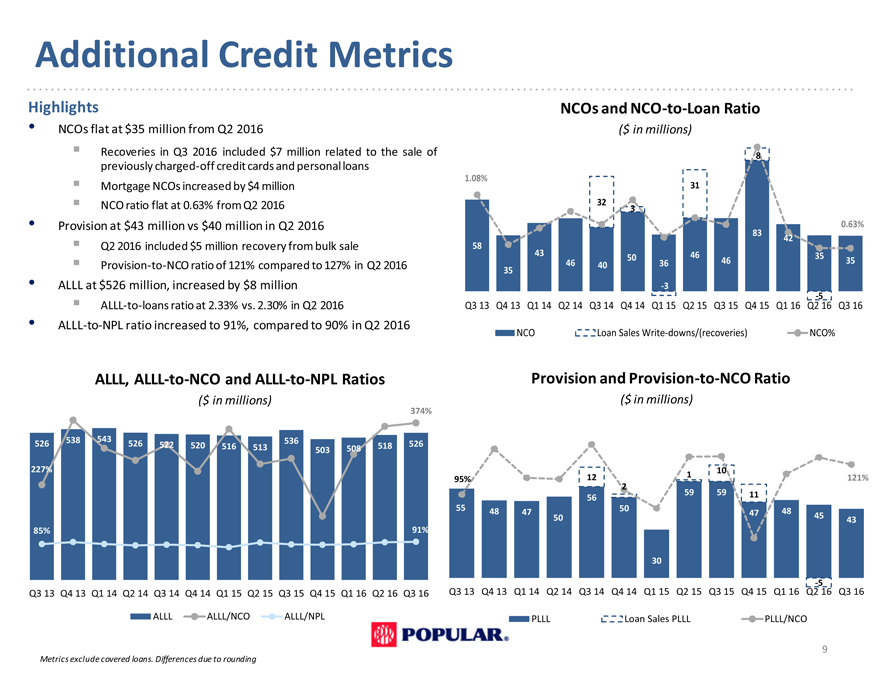
Additional Credit Metrics
Highlights
NCOs flat at $35 million from Q2 2016
Recoveries in Q3 2016 included $7 million related to the sale of previously charged-off credit cards and personal loans ? Mortgage NCOs increased by $4 million ? NCO ratio flat at 0.63% from Q2 2016
Provision at $43 million vs $40 million in Q2 2016
Q2 2016 included $5 million recovery from bulk sale
Provision-to-NCO ratio of 121% compared to 127% in Q2 2016
ALLL at $526 million, increased by $8 million
ALLL-to-loans ratio at 2.33% vs. 2.30% in Q2 2016
ALLL-to-NPL ratio increased to 91%, compared to 90% in Q2 2016
ALLL, ALLL-to-NCO and ALLL-to-NPL Ratios
($ in millions)
374%
538 543 536
526 526 522 520 516 513 503 508 518 526
227%
85% 91%
Q3 13 Q4 13 Q1 14 Q2 14 Q3 14 Q4 14 Q1 15 Q2 15 Q3 15 Q4 15 Q1 16 Q2 16 Q3 16
ALLL ALLL/NCO ALLL/NPL
NCOs and NCO-to-Loan Ratio
($ in millions)
8
1.08%
31
32
3
0.63%
83 42
58
43 50 46 35
35 46 40 36 46 35
-3
-5
Q3 13 Q4 13 Q1 14 Q2 14 Q3 14 Q4 14 Q1 15 Q2 15 Q3 15 Q4 15 Q1 16 Q2 16 Q3 16
NCO Loan Sales Write-downs/(recoveries) NCO%
Provision and Provision-to-NCO Ratio
($ in millions)
1 10
95% 12 121%
2
56 59 59 11
55 48 47 50 47 48
50 45 43
30
-5
Q3 13 Q4 13 Q1 14 Q2 14 Q3 14 Q4 14 Q1 15 Q2 15 Q3 15 Q4 15 Q1 16 Q2 16 Q3 16
PLLL Loan Sales PLLL PLLL/NCO
Metrics exclude covered loans. Differences due to rounding
9
|
|
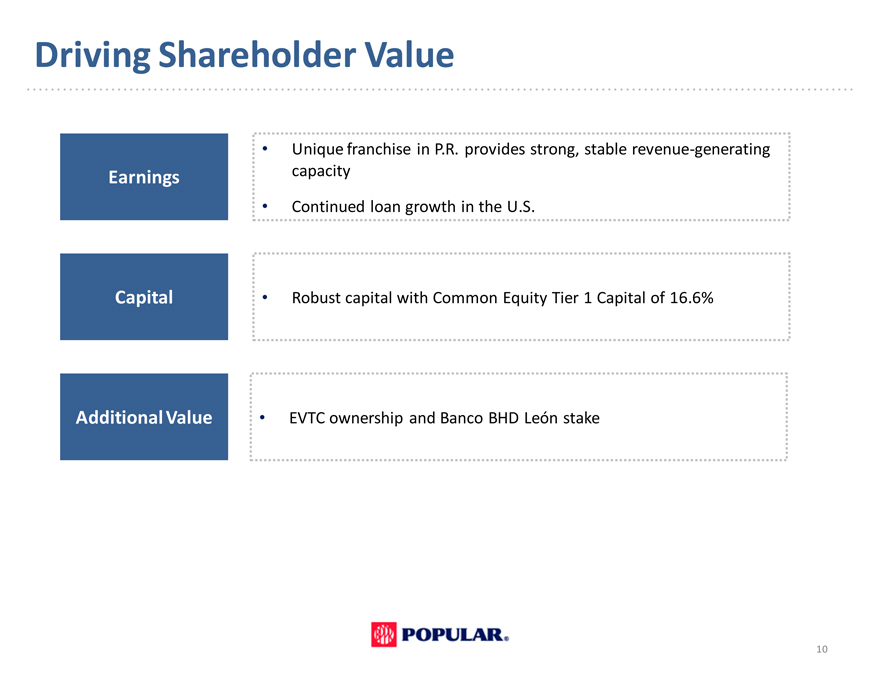
Driving Shareholder Value
Earnings
• Unique franchise in P.R. provides strong, stable revenue-generating capacity
Continued loan growth in the U.S.Capital
• Robust capital with Common Equity Tier 1 Capital of 16.6% Additional Value
• EVTC ownership and Banco BHD León stake
10
|
|

Investor Presentation
Third Quarter 2016
APPENDIX
|
|
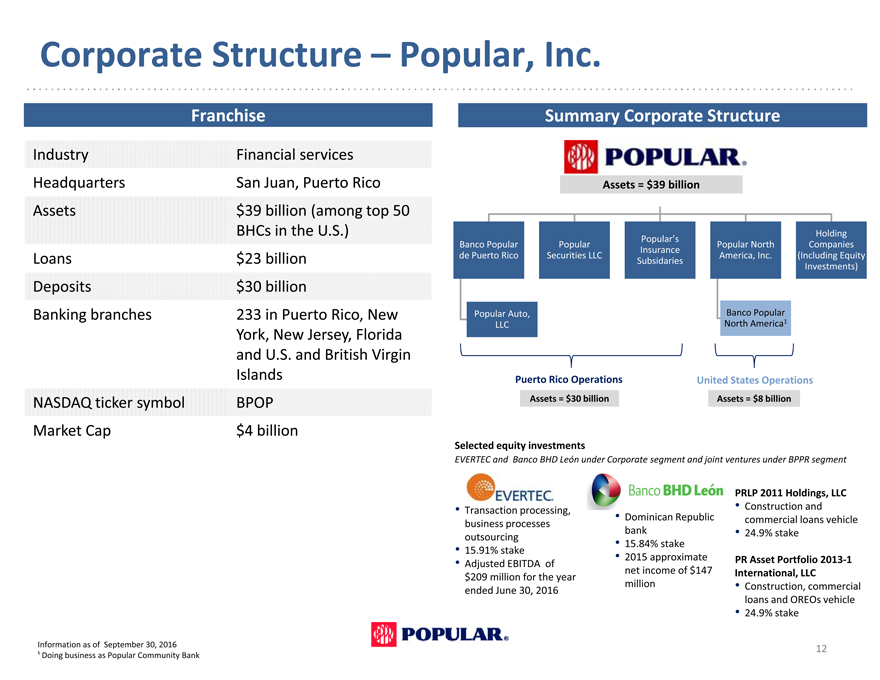
Who We Are – Popular, Inc.
Corporate Structure – Popular, Inc.
Franchise
Industry Financial services
Headquarters San Juan, Puerto Rico
Assets $39 billion (among top 50
BHCs in the U.S.)
Loans $23 billion
Deposits $30 billion
Banking branches 233 in Puerto Rico, New
York, New Jersey, Florida
and U.S. and British Virgin
Islands
NASDAQ ticker symbol BPOP
Market Cap $4 billion
Summary Corporate Structure
Assets = $39 billion
Popular’s Holding
Banco Popular Popular Popular North Companies
Insurance
de Puerto Rico Securities LLC America, Inc.(Including Equity
Subsidaries Investments)
Popular Auto, Banco Popular
LLC North America1
Puerto Rico Operations United States Operations
Assets = $30 billion Assets = $8 billion
Selected equity investments
EVERTEC and Banco BHD León under Corporate segment and joint ventures under BPPR segment
PRLP 2011 Holdings, LLC
Transaction processing, Construction and
business processes • Dominican Republic commercial loans vehicle
bank • 24.9% stake
15.91% outsourcing stake 15.84% stake
• Adjusted EBITDA of • 2015 approximate PR Asset Portfolio 2013-1
$209 million for the year net income of $147 International, LLC
ended June 30, 2016 million • Construction, commercial
loans and OREOs vehicle
• 24.9% stake
Information as of September 30, 2016
¹ Doing business as Popular Community Bank
12
|
|
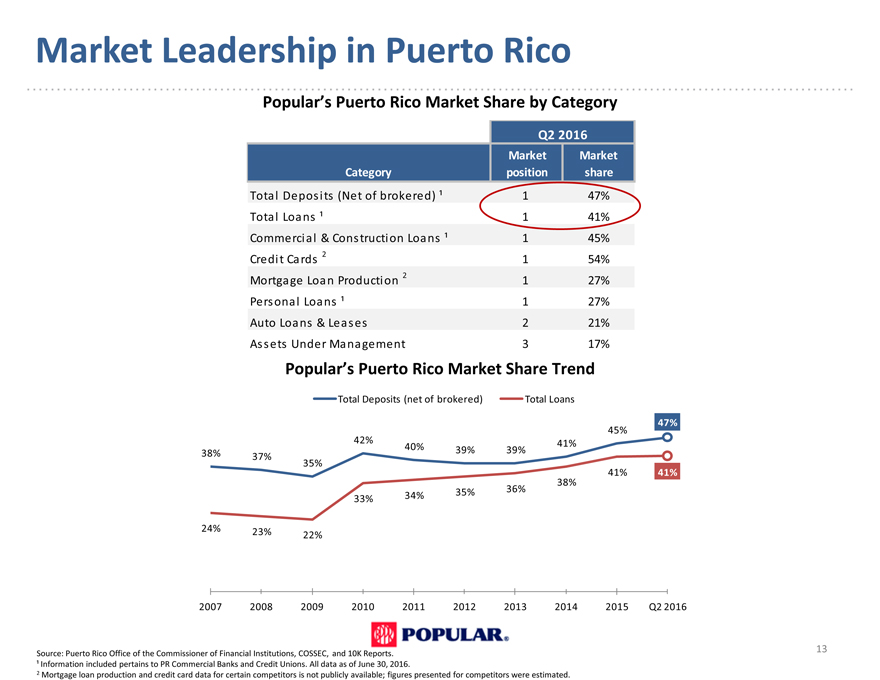
Market Leadership in Puerto Rico
Popular’s Puerto Rico Market Share by Category
Q2 2016
Market Market
Category position share
Total Deposits (Net of brokered) ¹ 1 47%
Total Loans ¹ 1 41%
Commercial & Construction Loans ¹ 1 45%
Credit Cards 2 1 54%
Mortgage Loan Production 2 1 27%
Personal Loans ¹ 1 27%
Auto Loans & Leases 2 21%
Assets Under Management 3 17%
Popular’s Puerto Rico Market Share Trend
Total Deposits (net of brokered) Total Loans
47%
45%
42%
40% 39% 39% 41%
38% 37%
35%
41% 41%
38%
36%
33% 34% 35%
24%
23% 22%
2007 2008 2009 2010 2011 2012 2013 2014 2015 Q2 2016
Source: Puerto Rico Office of the Commissioner of Financial Institutions, COSSEC, and 10K Reports. ¹ Information included pertains to PR Commercial Banks and Credit Unions. All data as of June 30, 2016.
2 Mortgage loan production and credit card data for certain competitors is not publicly available; figures presented for competitors were estimated.
13
|
|
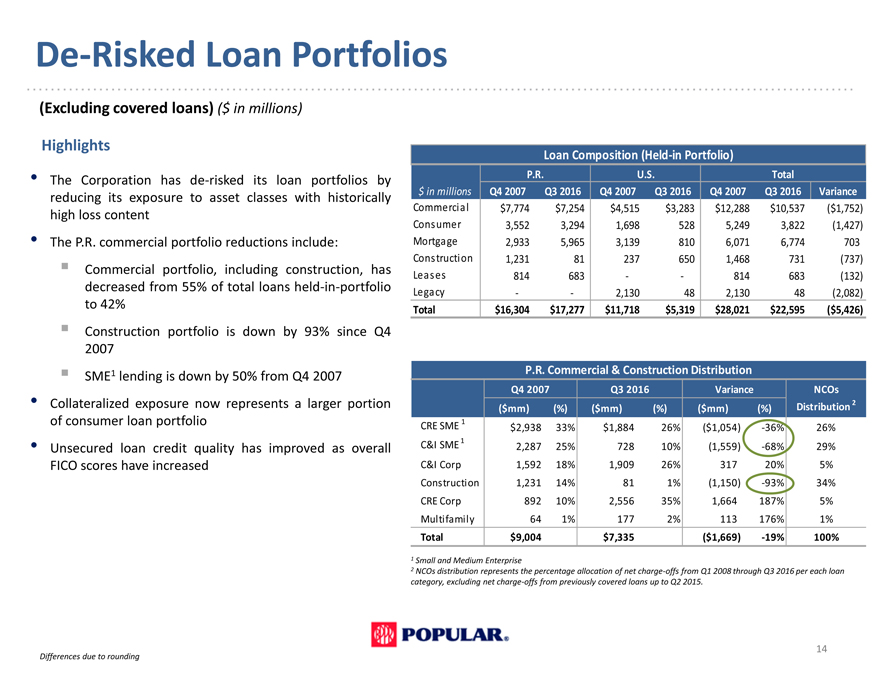
De-Risked Loan Portfolios
(Excluding covered loans) ($ in millions)
Highlights
The Corporation has de-risked its loan portfolios by reducing its exposure to asset classes with historically high loss content
The P.R. commercial portfolio reductions include: ? Commercial portfolio, including construction, has decreased from 55% of total loans held-in-portfolio to 42% ? Construction portfolio is down by 93% since Q4 2007 ? SME1 lending is down by 50% from Q4 2007
Collateralized exposure now represents a larger portion of consumer loan portfolio
Unsecured loan credit quality has improved as overall FICO scores have increased
Loan Composition (Held-in Portfolio)
P.R. U.S. Total
$ in millions Q4 2007 Q3 2016 Q4 2007 Q3 2016 Q4 2007 Q3 2016 Variance
Commercial $7,774 $7,254 $4,515 $3,283 $ 12,288 $ 10,537($1,752)
Consumer 3,552 3,294 1,698 528 5,249 3,822(1,427)
Mortgage 2,933 5,965 3,139 810 6,071 6,774 703
Construction 1,231 81 237 650 1,468 731(737)
Leases 814 683 — 814 683(132)
Legacy — 2,130 48 2,130 48(2,082)
Total $16,304 $17,277 $11,718 $5,319 $ 28,021 $ 22,595($5,426)
P.R. Commercial & Construction Distribution
Q4 2007 Q3 2016 Variance NCOs
($mm)(%)($mm)(%)($mm)(%) Distribution 2
CRE SME 1 $2,938 33% $1,884 26%($1,054) -36% 26%
C&I SME 1 2,287 25% 728 10%(1,559) -68% 29%
C&I Corp 1,592 18% 1,909 26% 317 20% 5%
Construction 1,231 14% 81 1%(1,150) -93% 34%
CRE Corp 892 10% 2,556 35% 1,664 187% 5%
Multifamily 64 1% 177 2% 113 176% 1%
Total $9,004 $7,335($1,669) -19% 100%
1 Small and Medium Enterprise
2 NCOs distribution represents the percentage allocation of net charge-offs from Q1 2008 through Q3 2016 per each loan category, excluding net charge-offs from previously covered loans up to Q2 2015.
Differences due to rounding
14
|
|
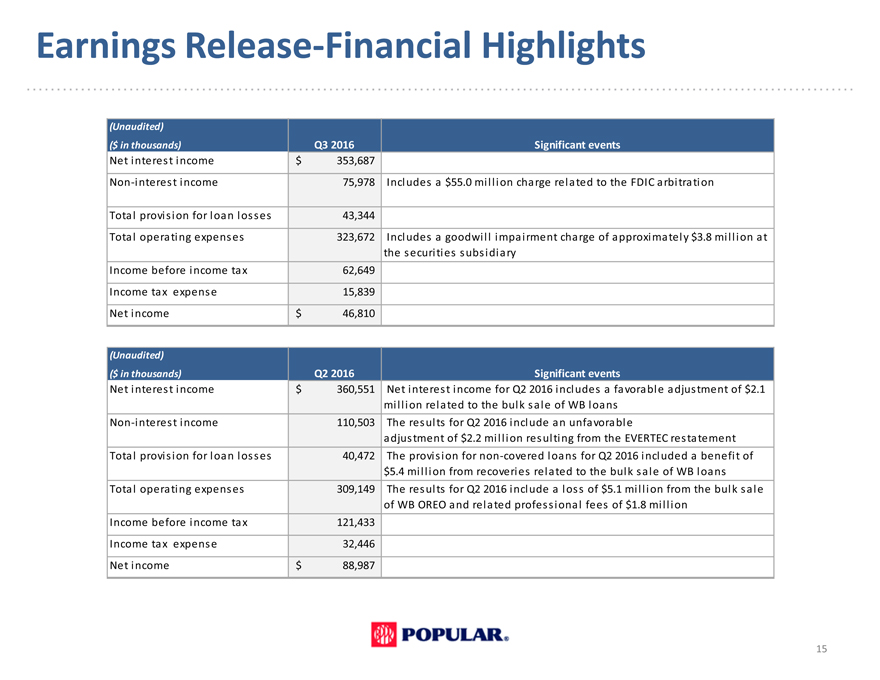
Earnings Release-Financial Highlights
(Unaudited)
($ in thousands) Q3 2016 Significant events
Net interest income $ 353,687
Non-interest income 75,978 Includes a $55.0 million charge related to the FDIC arbitration
Total provision for loan losses 43,344
Total operating expenses 323,672 Includes a goodwill impairment charge of approximately $3.8 million at
the securities subsidiary
Income before income tax 62,649
Income tax expense 15,839
Net income $ 46,810
(Unaudited)
($ in thousands) Q2 2016 Significant events
Net interest income $ 360,551 Net interest income for Q2 2016 includes a favorable adjustment of $2.1
million related to the bulk sale of WB loans
Non-interest income 110,503 The results for Q2 2016 include an unfavorable
adjustment of $2.2 million resulting from the EVERTEC restatement
Total provision for loan losses 40,472 The provision for non-covered loans for Q2 2016 included a benefit of
$5.4 million from recoveries related to the bulk sale of WB loans
Total operating expenses 309,149 The results for Q2 2016 include a loss of $5.1 million from the bulk sale
of WB OREO and related professional fees of $1.8 million
Income before income tax 121,433
Income tax expense 32,446
Net income $ 88,987
15
|
|
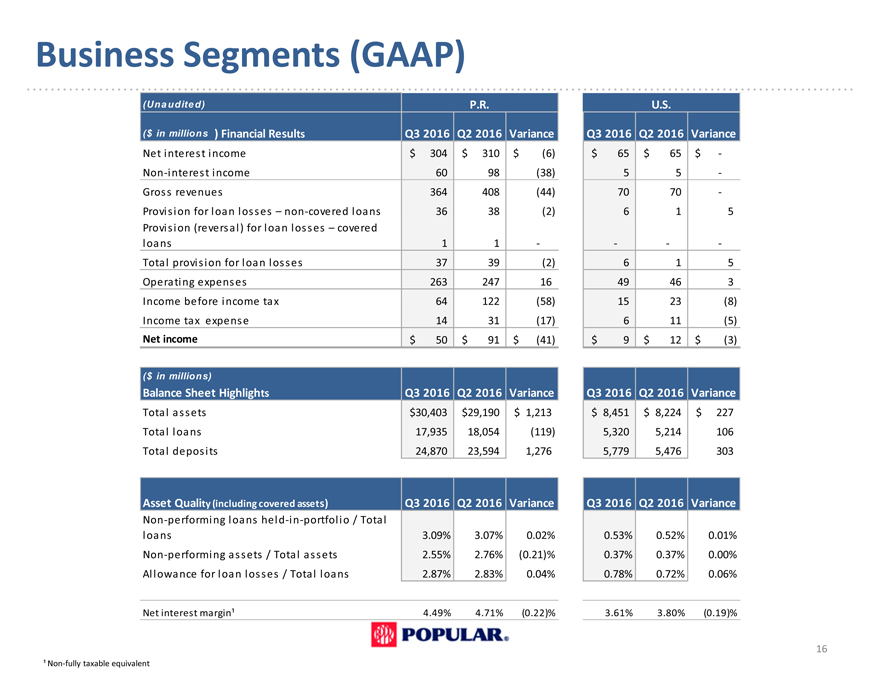
Business Segments (GAAP)
(Una udite d) P.R. U.S.
($ in millions ) Financial Results Q3 2016 Q2 2016 Variance Q3 2016 Q2 2016 Variance
Net interest income $ 304 $ 310 $(6) $ 65 $ 65 $ -
Non-interest income 60 98(38) 5 5 -
Gross revenues 364 408(44) 70 70 -
Provision for loan losses – non-covered loans 36 38(2) 6 1 5
Provision (reversal) for loan losses – covered
loans 1 1 — —
Total provision for loan losses 37 39(2) 6 1 5
Operating expenses 263 247 16 49 46 3
Income before income tax 64 122(58) 15 23(8)
Income tax expense 14 31(17) 6 11(5)
Net income $ 50 $ 91 $(41) $ 9 $ 12 $(3)
($ in millions)
Balance Sheet Highlights Q3 2016 Q2 2016 Variance Q3 2016 Q2 2016 Variance
Total assets $30,403 $29,190 $ 1,213 $ 8,451 $ 8,224 $ 227
Total loans 17,935 18,054(119) 5,320 5,214 106
Total deposits 24,870 23,594 1,276 5,779 5,476 303
Asset Quality (including covered assets) Q3 2016 Q2 2016 Variance Q3 2016 Q2 2016 Variance
Non-performing loans held-in-portfolio / Total
loans 3.09% 3.07% 0.02% 0.53% 0.52% 0.01%
Non-performing assets / Total assets 2.55% 2.76%(0.21)% 0.37% 0.37% 0.00%
Allowance for loan losses / Total loans 2.87% 2.83% 0.04% 0.78% 0.72% 0.06%
Net interest margin¹ 4.49% 4.71%(0.22)% 3.61% 3.80%(0.19)%
¹ Non-fully taxable equivalent
16
|
|
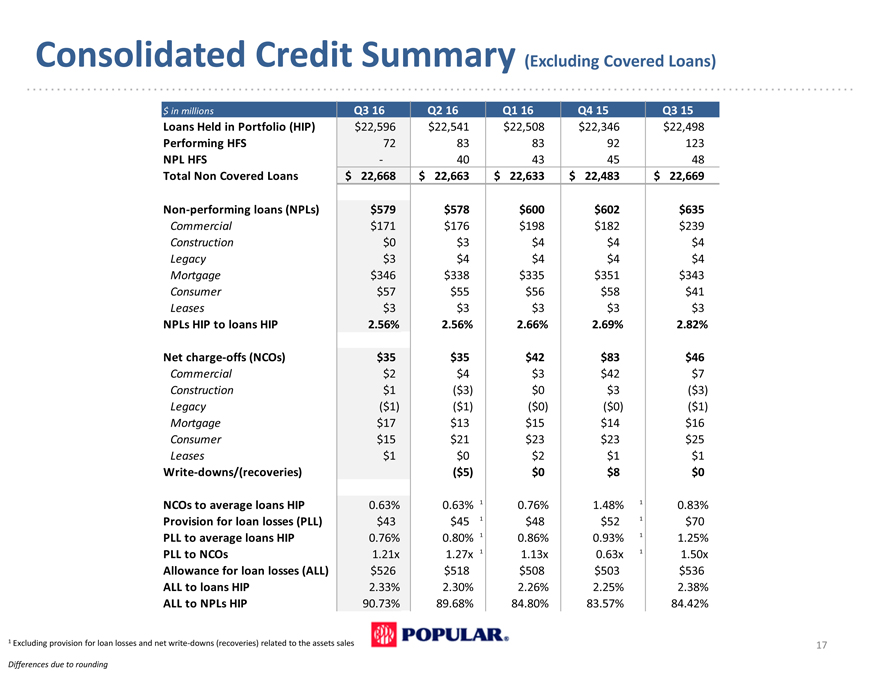
Consolidated Credit Summary (Excluding Covered Loans)
$ in millions Q3 16 Q2 16 Q1 16 Q4 15 Q3 15
Loans Held in Portfolio (HIP) $22,596 $22,541 $22,508 $22,346 $22,498
Performing HFS 72 83 83 92 123
NPL HFS—40 43 45 48
Total Non Covered Loans $ 22,668 $ 22,663 $ 22,633 $ 22,483 $ 22,669
Non-performing loans (NPLs) $579 $578 $600 $602 $635
Commercial $171 $176 $198 $182 $239
Construction $0 $3 $4 $4 $4
Legacy $3 $4 $4 $4 $4
Mortgage $346 $338 $335 $351 $343
Consumer $57 $55 $56 $58 $41
Leases $3 $3 $3 $3 $3
NPLs HIP to loans HIP 2.56% 2.56% 2.66% 2.69% 2.82%
Net charge-offs (NCOs) $35 $35 $42 $83 $46
Commercial $2 $4 $3 $42 $7
Construction $1($3) $0 $3($3)
Legacy($1)($1)($0)($0)($1)
Mortgage $17 $13 $15 $14 $16
Consumer $15 $21 $23 $23 $25
Leases $1 $0 $2 $1 $1
Write-downs/(recoveries)($5) $0 $8 $0
NCOs to average loans HIP 0.63% 0.63% 1 0.76% 1.48% 1 0.83%
Provision for loan losses (PLL) $43 $45 1 $48 $52 1 $70
PLL to average loans HIP 0.76% 0.80% 1 0.86% 0.93% 1 1.25%
PLL to NCOs 1.21x 1.27x 1 1.13x 0.63x 1 1.50x
Allowance for loan losses (ALL) $526 $518 $508 $503 $536
ALL to loans HIP 2.33% 2.30% 2.26% 2.25% 2.38%
ALL to NPLs HIP 90.73% 89.68% 84.80% 83.57% 84.42%
1 Excluding provision for loan losses and net write-downs (recoveries) related to the assets sales
Differences due to rounding
17
|
|
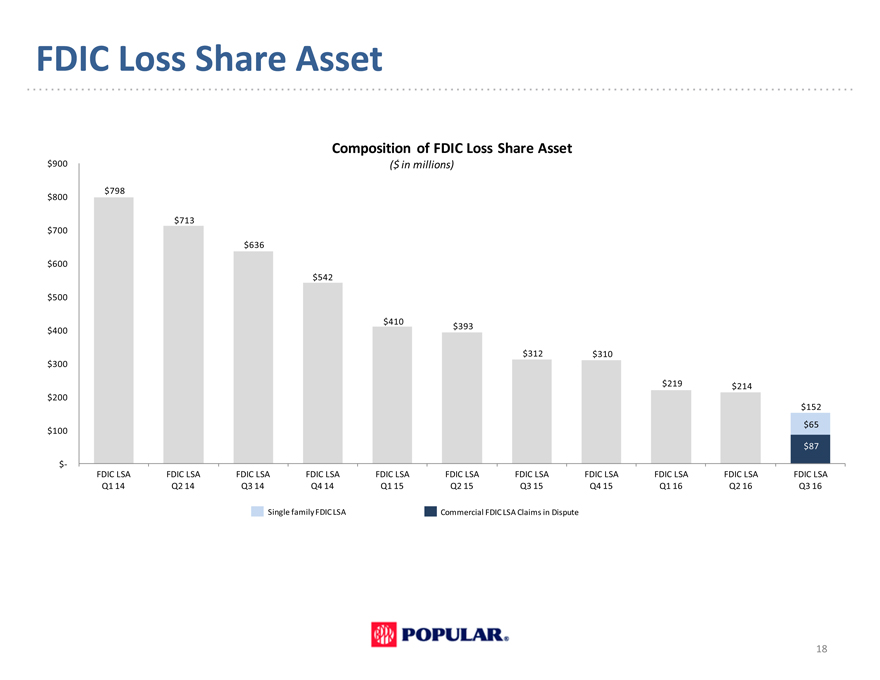
FDIC Loss Share Asset
Composition of FDIC Loss Share Asset
$900 ($ in millions)
$798 $800
$713 $700 $636
$600 $542
$500
$410 $393 $400
$312 $310 $300
$219 $214 $200 $152
$65 $100 $87
$-
FDIC LSA FDIC LSA FDIC LSA FDIC LSA FDIC LSA FDIC LSA FDIC LSA FDIC LSA FDIC LSA FDIC LSA FDIC LSA Q1 14 Q2 14 Q3 14 Q4 14 Q1 15 Q2 15 Q3 15 Q4 15 Q1 16 Q2 16 Q3 16
Single family FDIC LSA Commercial FDIC LSA Claims in Dispute
18
|
|
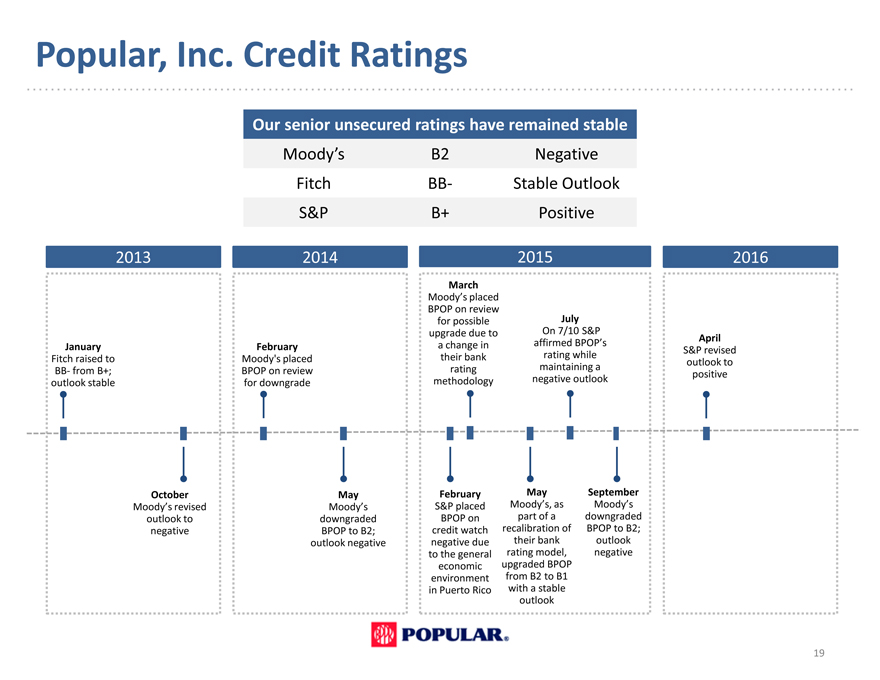
Popular, Inc. Credit Ratings
Our senior unsecured ratings have remained stable
Moody’s B2 Negative Fitch BB- Stable Outlook S&P B+ Positive
2013 2014 2015 2016
March
Moody’s placed
BPOP on review for possible July upgrade due to On 7/10 S&P
April January February a change in affirmed BPOP’s
S&P revised Fitch raised to Moody’s placed their bank rating while outlook to BB- from B+; BPOP on review rating maintaining a positive outlook stable for downgrade methodology negative outlook
October May February May September
Moody’s revised Moody’s S&P placed Moody’s, as Moody’s outlook to downgraded BPOP on part of a downgraded negative BPOP to B2; credit watch recalibration of BPOP to B2; outlook negative negative due their bank outlook to the general rating model, negative economic upgraded BPOP environment from B2 to B1 in Puerto Rico with a stable outlook
19
|
|

Investor Presentation
Third Quarter 2016