Attached files
| file | filename |
|---|---|
| EX-95 - EXHIBIT 95 - COMPASS MINERALS INTERNATIONAL INC | cmp-20160930xex95.htm |
| EX-32 - EXHIBIT 32 - COMPASS MINERALS INTERNATIONAL INC | cmp-20160930xex32.htm |
| EX-31.2 - EXHIBIT 31.2 - COMPASS MINERALS INTERNATIONAL INC | cmp-20160930xex312.htm |
| EX-31.1 - EXHIBIT 31.1 - COMPASS MINERALS INTERNATIONAL INC | cmp-20160930xex311.htm |
UNITED STATES
SECURITIES AND EXCHANGE COMMISSION
Washington, D.C. 20549
FORM 10-Q
þ QUARTERLY REPORT PURSUANT TO SECTION 13 OR 15(d) OF THE SECURITIES EXCHANGE ACT OF 1934
For the quarterly period ended September 30, 2016
or
¨ TRANSITION REPORT PURSUANT TO SECTION 13 OR 15(d) OF THE SECURITIES EXCHANGE ACT OF 1934
For the transition period from _______________________ to __________________________
Commission File Number 001-31921

Compass Minerals International, Inc.
(Exact name of registrant as specified in its charter)
Delaware | 36-3972986 |
(State or other jurisdiction of incorporation or organization) | (I.R.S. Employer Identification Number) |
9900 West 109th Street
Suite 100
Overland Park, KS 66210
(913) 344-9200
(Address of principal executive offices, zip code and telephone number, including area code)
Indicate by check mark whether the registrant (1) has filed all reports required to be filed by Section 13 or 15(d) of the Securities Exchange Act of 1934 during the preceding 12 months (or for such shorter period that the registrant was required to file such reports), and (2) has been subject to such filing requirements for the past 90 days.
Yes: þ No: ¨
Indicate by check mark whether the registrant has submitted electronically and posted on its corporate Web site, if any, every Interactive Data File required to be submitted and posted pursuant to Rule 405 of Regulation S-T (§232.405 of this chapter) during the preceding 12 months (or for such shorter period that the registrant was required to submit and post such files).
Yes: þ No: ¨
Indicate by check mark whether the registrant is a large accelerated filer, an accelerated filer, a non-accelerated filer, or a smaller reporting company. See the definitions of “large accelerated filer,” “accelerated filer” and “smaller reporting company” in Rule 12b-2 of the Exchange Act.
Large accelerated filer þ | Accelerated filer ¨ | Non-accelerated filer ¨ | Smaller reporting company ¨ |
Indicate by check mark whether the registrant is a shell company (as defined in Rule 12b-2 of the Exchange Act).
Yes: ¨ No: þ
The number of shares outstanding of the registrant’s common stock, $0.01 par value per share, as of October 21, 2016, was 33,786,645 shares.
COMPASS MINERALS INTERNATIONAL, INC.
TABLE OF CONTENTS
Page | ||
PART I. FINANCIAL INFORMATION | ||
Item 1. | ||
Item 2. | ||
Item 3. | ||
Item 4. | ||
PART II. OTHER INFORMATION | ||
Item 1. | ||
Item 1A. | ||
Item 2. | ||
Item 3. | ||
Item 4. | ||
Item 5. | ||
Item 6. | ||
1
PART I. FINANCIAL INFORMATION
Item 1. Financial Statements
COMPASS MINERALS INTERNATIONAL, INC.
CONSOLIDATED BALANCE SHEETS
(in millions, except share data)
(Unaudited) | |||||||
September 30, 2016 | December 31, 2015 | ||||||
ASSETS | |||||||
Current assets: | |||||||
Cash and cash equivalents | $ | 432.2 | $ | 58.4 | |||
Receivables, less allowance for doubtful accounts of $1.7 in 2016 and $1.3 in 2015 | 115.1 | 147.8 | |||||
Inventories | 272.6 | 275.3 | |||||
Other | 40.9 | 30.8 | |||||
Total current assets | 860.8 | 512.3 | |||||
Property, plant and equipment, net | 907.6 | 800.7 | |||||
Intangible assets, net | 85.2 | 85.3 | |||||
Goodwill | 60.6 | 58.1 | |||||
Investment in equity investee | 127.5 | 116.4 | |||||
Other | 60.7 | 52.0 | |||||
Total assets | $ | 2,102.4 | $ | 1,624.8 | |||
LIABILITIES AND STOCKHOLDERS’ EQUITY | |||||||
Current liabilities: | |||||||
Current portion of long-term debt | $ | 8.5 | $ | 4.9 | |||
Accounts payable | 52.2 | 80.7 | |||||
Accrued expenses | 53.4 | 48.9 | |||||
Accrued salaries and wages | 16.9 | 15.2 | |||||
Income taxes payable | — | 14.8 | |||||
Accrued interest | 3.3 | 6.3 | |||||
Total current liabilities | 134.3 | 170.8 | |||||
Long-term debt, net of current portion | 1,204.1 | 718.0 | |||||
Deferred income taxes, net | 70.1 | 71.3 | |||||
Other noncurrent liabilities | 26.6 | 25.0 | |||||
Commitments and contingencies (Note 8) | |||||||
Stockholders’ equity: | |||||||
Common stock: $0.01 par value, 200,000,000 authorized shares; 35,367,264 issued shares | 0.4 | 0.4 | |||||
Additional paid-in capital | 96.0 | 91.7 | |||||
Treasury stock, at cost — 1,581,197 shares at September 30, 2016, and 1,665,731 shares at December 31, 2015 | (3.0 | ) | (3.2 | ) | |||
Retained earnings | 653.5 | 659.1 | |||||
Accumulated other comprehensive loss | (79.6 | ) | (108.3 | ) | |||
Total stockholders’ equity | 667.3 | 639.7 | |||||
Total liabilities and stockholders’ equity | $ | 2,102.4 | $ | 1,624.8 | |||
The accompanying notes are an integral part of the consolidated financial statements.
2
COMPASS MINERALS INTERNATIONAL, INC.
CONSOLIDATED STATEMENTS OF OPERATIONS
(Unaudited, in millions, except share and per share data)
Three Months Ended September 30, | Nine Months Ended September 30, | ||||||||||||||
2016 | 2015 | 2016 | 2015 | ||||||||||||
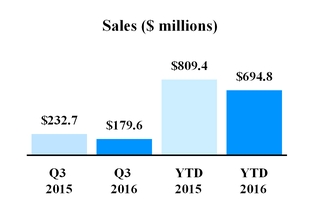
Sales | $ | 179.6 | $ | 232.7 | $ | 694.8 | $ | 809.4 | |||||||
Shipping and handling cost | 38.4 | 53.2 | 164.9 | 195.9 | |||||||||||
Product cost | 96.0 | 111.5 | 340.8 | 381.7 | |||||||||||
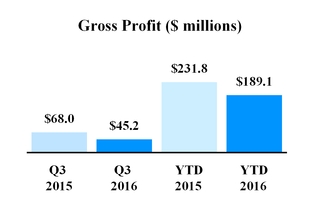
Gross profit | 45.2 | 68.0 | 189.1 | 231.8 | |||||||||||
Selling, general and administrative expenses | 25.7 | 27.2 | 79.8 | 82.3 | |||||||||||
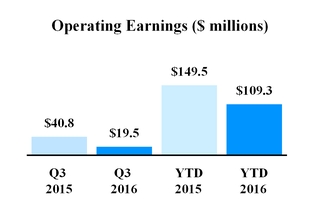
Operating earnings | 19.5 | 40.8 | 109.3 | 149.5 | |||||||||||
Other (income) expense: | |||||||||||||||
Interest expense | 5.4 | 5.4 | 16.8 | 16.1 | |||||||||||
Net loss from equity investee | 0.4 | — | 1.7 | — | |||||||||||
Other, net | 1.5 | (4.3 | ) | 1.6 | (9.0 | ) | |||||||||
Earnings before income taxes | 12.2 | 39.7 | 89.2 | 142.4 | |||||||||||
Income tax expense | 3.1 | 12.7 | 24.1 | 41.6 | |||||||||||
Net earnings | $ | 9.1 | $ | 27.0 | $ | 65.1 | $ | 100.8 | |||||||
Basic net earnings per common share | $ | 0.27 | $ | 0.80 | $ | 1.92 | $ | 2.98 | |||||||
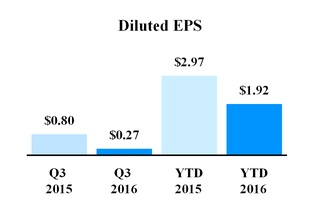
Diluted net earnings per common share | $ | 0.27 | $ | 0.80 | $ | 1.92 | $ | 2.97 | |||||||
Weighted-average common shares outstanding (in thousands): | |||||||||||||||
Basic | 33,786 | 33,696 | 33,772 | 33,668 | |||||||||||
Diluted | 33,789 | 33,708 | 33,775 | 33,687 | |||||||||||
Cash dividends per share | $ | 0.695 | $ | 0.66 | $ | 2.085 | $ | 1.98 | |||||||
The accompanying notes are an integral part of the consolidated financial statements.
3
COMPASS MINERALS INTERNATIONAL, INC.
CONSOLIDATED STATEMENTS OF COMPREHENSIVE INCOME (LOSS)
(Unaudited, in millions)
Three Months Ended September 30, | Nine Months Ended September 30, | ||||||||||||||
2016 | 2015 | 2016 | 2015 | ||||||||||||
Net earnings | $ | 9.1 | $ | 27.0 | $ | 65.1 | $ | 100.8 | |||||||
Other comprehensive income (loss): | |||||||||||||||
Unrealized gain from change in pension obligations, net of tax of $(0.0) in both the three and nine months ended September 30, 2016, and $(0.1) and $(0.2) in the three and nine months ended September 30, 2015, respectively. | — | 0.2 | 0.2 | 0.8 | |||||||||||
Unrealized gain (loss) on cash flow hedges, net of tax of $0.0 and $(0.8) in the three and nine months ended September 30, 2016, respectively, and $0.1 and $(0.3) in the three and nine months ended September 30, 2015, respectively. | (0.1 | ) | — | 1.3 | 0.5 | ||||||||||
Cumulative translation adjustment | (3.9 | ) | (37.4 | ) | 27.2 | (76.0 | ) | ||||||||
Comprehensive income (loss) | $ | 5.1 | $ | (10.2 | ) | $ | 93.8 | $ | 26.1 | ||||||
The accompanying notes are an integral part of the consolidated financial statements.
4
COMPASS MINERALS INTERNATIONAL, INC.
CONSOLIDATED STATEMENT OF STOCKHOLDERS’ EQUITY
For the nine months ended September 30, 2016
(Unaudited, in millions)
Common Stock | Additional Paid-In Capital | Treasury Stock | Retained Earnings | Accumulated Other Comprehensive Loss | Total | ||||||||||||||||||
Balance, December 31, 2015 | $ | 0.4 | $ | 91.7 | $ | (3.2 | ) | $ | 659.1 | $ | (108.3 | ) | $ | 639.7 | |||||||||
Comprehensive income | 65.1 | 28.7 | 93.8 | ||||||||||||||||||||
Dividends on common stock | 0.2 | (70.7 | ) | (70.5 | ) | ||||||||||||||||||
Shares issued for stock units | (0.1 | ) | 0.1 | — | |||||||||||||||||||
Income tax deficiency from equity awards | (0.2 | ) | (0.2 | ) | |||||||||||||||||||
Stock options exercised | 0.6 | 0.1 | 0.7 | ||||||||||||||||||||
Stock-based compensation | 3.8 | 3.8 | |||||||||||||||||||||
Balance, September 30, 2016 | $ | 0.4 | $ | 96.0 | $ | (3.0 | ) | $ | 653.5 | $ | (79.6 | ) | $ | 667.3 | |||||||||
The accompanying notes are an integral part of the consolidated financial statements.
5
COMPASS MINERALS INTERNATIONAL, INC.
CONSOLIDATED STATEMENTS OF CASH FLOWS
(Unaudited, in millions)
Nine Months Ended September 30, | |||||||
2016 | 2015 | ||||||
Cash flows from operating activities: | |||||||
Net earnings | $ | 65.1 | $ | 100.8 | |||
Adjustments to reconcile net earnings to net cash flows provided by operating activities: | |||||||
Depreciation, depletion and amortization | 62.7 | 57.8 | |||||
Finance fee amortization | 1.0 | 0.9 | |||||
Early extinguishment of debt | 0.1 | — | |||||
Stock-based compensation | 3.8 | 4.9 | |||||
Deferred income taxes | (4.5 | ) | 1.2 | ||||
Net loss in equity investee | 1.7 | — | |||||
Other, net | 0.5 | 2.6 | |||||
Changes in operating assets and liabilities: | |||||||
Receivables | 33.6 | 70.1 | |||||
Inventories | 3.1 | (78.2 | ) | ||||
Other assets | (12.8 | ) | (11.7 | ) | |||
Accounts payable and accrued expenses | (46.6 | ) | (54.0 | ) | |||
Other liabilities | (0.6 | ) | 0.7 | ||||
Net cash provided by operating activities | 107.1 | 95.1 | |||||
Cash flows from investing activities: | |||||||
Capital expenditures | (148.7 | ) | (154.4 | ) | |||
Investment in equity method investee | (4.7 | ) | — | ||||
Other, net | (2.9 | ) | (0.9 | ) | |||
Net cash used in investing activities | (156.3 | ) | (155.3 | ) | |||
Cash flows from financing activities: | |||||||
Proceeds from the issuance of long-term debt | 850.0 | — | |||||
Proceeds from revolving credit facility borrowings | 264.9 | — | |||||
Principal payments on revolving credit facility borrowings | (147.4 | ) | — | ||||
Principal payments on long-term debt | (474.5 | ) | (2.9 | ) | |||
Dividends paid | (70.5 | ) | (67.0 | ) | |||
Fees paid to refinance debt | (1.5 | ) | — | ||||
Deferred financing costs | (5.8 | ) | — | ||||
Proceeds received from stock option exercises | 0.7 | 2.3 | |||||
Excess tax benefit (deficiency) from equity compensation awards | (0.2 | ) | 0.1 | ||||
Net cash provided by (used in) financing activities | 415.7 | (67.5 | ) | ||||
Effect of exchange rate changes on cash and cash equivalents | 7.3 | (20.0 | ) | ||||
Net change in cash and cash equivalents | 373.8 | (147.7 | ) | ||||
Cash and cash equivalents, beginning of the year | 58.4 | 266.8 | |||||
Cash and cash equivalents, end of period | $ | 432.2 | $ | 119.1 | |||
Supplemental cash flow information: | |||||||
Interest paid, net of amounts capitalized | $ | 18.6 | $ | 18.6 | |||
Income taxes paid, net of refunds | $ | 54.0 | $ | 83.5 | |||
The accompanying notes are an integral part of the consolidated financial statements.
6
COMPASS MINERALS INTERNATIONAL, INC.
NOTES TO CONSOLIDATED FINANCIAL STATEMENTS
(Unaudited)
1. | Accounting Policies and Basis of Presentation: |
Compass Minerals International, Inc. (“CMI”), through its subsidiaries, is a producer and marketer of essential mineral products with manufacturing sites in North America and the United Kingdom (the “U.K.”). Except where otherwise noted, references to North America include only the continental United States (the “U.S.”) and Canada, and references to the U.K. include only England, Scotland and Wales. References to the “Company,” “Compass,” “Compass Minerals,” “we,” “us” and “our” refer to CMI and its consolidated subsidiaries. The Company’s principal products are salt, consisting of sodium chloride and magnesium chloride, and sulfate of potash (“SOP”), a specialty fertilizer the Company markets under the trade name Protassium+™. Additionally, the Company sells various premium micronutrient products under its Wolf Trax® brand. The Company provides highway deicing products to customers in North America and the U.K. and plant nutrients to growers and fertilizer distributors worldwide. The Company also produces and markets consumer deicing and water conditioning products, ingredients used in consumer and commercial food preparation, and other mineral-based products for consumer, agricultural and industrial applications. Compass Minerals also provides records management services to businesses located in the U.K. In October 2016, the Company acquired Produquímica Indústria e Comércio S.A. (“Produquímica”) which operates two primary businesses in Brazil – agricultural productivity and chemical solutions (see Note 14).
CMI is a holding company with no significant operations other than those of its wholly-owned subsidiaries. The consolidated financial statements include the accounts of CMI and its wholly-owned subsidiaries. All significant intercompany balances and transactions have been eliminated in consolidation.
The Company uses the equity method of accounting for equity securities when it has significant influence or when it has more than a minor ownership interest or more than a minor influence over the investee’s operations but does not have a controlling financial interest. The Company recognizes its share of the investee’s earnings or losses on a three-month lag.
The accompanying unaudited consolidated financial statements have been prepared in accordance with U.S. generally accepted accounting principles (“GAAP”) for interim financial information and with the instructions to Form 10-Q and Article 10 of Regulation S-X. Accordingly, they do not include all of the information and footnotes required by GAAP for complete financial statements. These unaudited consolidated financial statements should be read in conjunction with the consolidated financial statements of the Company for the year ended December 31, 2015, as filed with the Securities and Exchange Commission in its Annual Report on Form 10-K. In the opinion of management, all adjustments, consisting of normal recurring accruals considered necessary for a fair presentation, have been included.
The Company experiences a substantial amount of seasonality in its sales, primarily with respect to its deicing salt products. As a result, sales and operating income are generally higher in the first and fourth quarters and lower during the second and third quarters of each year. In particular, sales of highway and consumer deicing salt and magnesium chloride products vary based on the severity of the winter conditions in areas where the product is used. Following industry practice in North America and the U.K., the Company seeks to stockpile sufficient quantities of deicing salt throughout the second, third and fourth quarters to meet the estimated requirements for the upcoming winter season. Production of deicing salt can also vary based on the severity or mildness of the preceding winter season. Due to the seasonal nature of the deicing product lines, operating results for the interim periods are not necessarily indicative of the results that may be expected for the full year.
Reclassifications
Certain prior year amounts have been reclassified from other noncurrent assets to long-term debt, net of current portion, to conform to the current year presentation as required by the new accounting standard on debt issuance costs (see Note 7).
Recent Accounting Pronouncements
In August 2016, the Financial Accounting Standards Board (the “FASB”) issued guidance to clarify how certain cash receipts and payments should be presented and classified in the statement of cash flows. The guidance is effective for fiscal years beginning after December 15, 2017, including interim periods within those fiscal years, and early adoption is permitted. The Company is currently evaluating the timing of adoption of this guidance and the impact of the adoption of this guidance on its consolidated financial statements.
7
In June 2016, the FASB issued guidance for estimating credit losses on certain types of financial instruments, including trade receivables, by introducing an approach based on expected losses. The expected loss approach will require entities to incorporate considerations of historical information, current information and reasonable and supportable forecasts. The guidance is effective for fiscal years beginning after December 15, 2019, including interim periods within those fiscal years, requires a modified retrospective transition method and early adoption is permitted. The Company is currently evaluating the impact of the adoption of this guidance on its consolidated financial statements.
In March 2016, the FASB issued guidance to simplify several aspects of the accounting for share-based payment transactions, including the income tax consequences, classification of awards as either equity or liabilities and classification on the statement of cash flows. The guidance is effective for fiscal years beginning after December 15, 2016, including interim periods within those fiscal years, and early adoption is permitted. The Company is currently evaluating the impact of the adoption of this guidance on its consolidated financial statements.
In February 2016, the FASB issued guidance which requires lessees to recognize on their balance sheet a right-of-use asset which represents a lessee’s right to use the underlying asset. Under this guidance, an entity must also recognize a lease liability which represents a lessee’s obligation to make lease payments for the right to use the asset. In addition, the standard requires expanded qualitative and quantitative disclosures. The guidance is effective for fiscal years beginning after December 15, 2018, including interim periods within those fiscal years, and requires a modified retrospective transition method. The Company is currently evaluating the impact of the adoption of this guidance on its consolidated financial statements.
In July 2015, the FASB issued guidance that requires entities to measure inventory within the scope of the standard at the lower of cost or net realizable value. “Net realizable value” is defined as the estimated selling prices in the ordinary course of business, less reasonably predictable costs of completion, disposal and transportation. The guidance is effective for fiscal years beginning after December 15, 2016, and interim periods within those years, and early adoption is permitted. The Company does not plan to early adopt, and the Company does not expect that this guidance will have a material impact on its consolidated financial statements.
In August 2014, the FASB issued guidance which requires management to evaluate whether there is substantial doubt about an entity’s ability to continue as a going concern and to provide disclosure in the footnotes under certain circumstances. This guidance is effective for this fiscal year and interim periods beginning in 2017, and early adoption is permitted. The Company does not expect that this guidance will have a material impact on its consolidated financial statements.
In May 2014, the FASB issued guidance to provide a single, comprehensive revenue recognition model for all contracts with customers. The new revenue recognition model supersedes existing revenue recognition guidance and requires revenue recognition to depict the transfer of promised goods or services to customers in an amount that reflects the consideration an entity expects to receive in exchange for those goods or services. This guidance is effective for fiscal years beginning after December 15, 2017, and interim periods with those years, and early adoption is permitted. The guidance permits the use of either a full or modified retrospective or cumulative effect transition method. The Company is currently evaluating the impact of this guidance on its consolidated financial statements.
2. | Equity Investment: |
In December 2015, the Company entered into a subscription agreement with Produquímica, a Brazilian corporation, and a sale and purchase agreement with certain shareholders of Produquímica. Pursuant to these agreements, the Company acquired, in the aggregate, 35% of the issued and outstanding capital stock of Produquímica for an aggregate purchase price of R$452.4 million Brazilian Reais, or $114.1 million U.S. dollars at closing. Of the 35% capital stock, 6% consisted of common shares at closing, and the remaining 29% consisted of preferred shares that converted to common shares upon the settlement of certain post-closing adjustments, including additional consideration paid by the Company based upon Produquímica’s 2015 financial performance. The additional consideration of $4.7 million U.S. dollars was paid in the second quarter of 2016 and was recorded as an increase in investment in equity investee in the Company’s consolidated financial statements.
In connection with this transaction, the Company entered into a new U.S. dollar-denominated $100.0 million term loan in the fourth quarter of 2015 with certain existing lenders to fund the acquisition of the 35% equity stake in Produquímica. The term loan was refinanced in the second quarter of 2016 (see Note 7).
In connection with the acquisition of the 35% capital stock, the Company completed a purchase price allocation for the Company’s investment in Produquímica. As of the acquisition date, the cost basis of the Company’s equity interest in Produquímica exceeded the Company’s proportional interest in the underlying net assets of Produquímica. This basis difference of approximately $115 million represents the Company’s share of the amount by which the fair market value of Produquímica’s net identifiable assets exceeded their book value and equity method goodwill. The portion of the basis difference related to property, plant and equipment
8
and intangible assets is being amortized based on the remaining estimated useful lives of the various underlying net assets, as appropriate. The portion of the basis difference related to finished goods inventory is being expensed as the inventory is sold. The additional expense associated with these basis differences is included as a component of the Company’s share of the equity investee’s earnings or loss.
The Company recognizes its share of earnings or losses from Produquímica on a three-month lag. The Company has recognized losses of $0.4 million and $1.7 million related to its share of earnings for the three and nine months ended September 30, 2016, respectively, in its consolidated statements of operations.
The subscription agreement, as amended, contains a put option allowing the majority shareholders to sell the remaining equity interests in Produquímica to the Company, which was exercised in August 2016. As a result of the exercise, the Company acquired the remaining 65% of the issued and outstanding capital stock of Produquímica in October 2016 (see Note 14).
3. | Inventories: |
Inventories consist of the following (in millions):
September 30, 2016 | December 31, 2015 | ||||||
Finished goods | $ | 220.1 | $ | 223.1 | |||
Raw materials and supplies | 52.5 | 52.2 | |||||
Total inventories | $ | 272.6 | $ | 275.3 | |||
4. | Property, Plant and Equipment, Net: |
Property, plant and equipment, net, consists of the following (in millions):
September 30, 2016 | December 31, 2015 | ||||||
Land, buildings and structures, and leasehold improvements | $ | 364.5 | $ | 347.3 | |||
Machinery and equipment | 775.9 | 701.5 | |||||
Office furniture and equipment | 25.1 | 25.4 | |||||
Mineral interests | 170.2 | 169.6 | |||||
Construction in progress | 256.4 | 191.5 | |||||
1,592.1 | 1,435.3 | ||||||
Less accumulated depreciation and depletion | (684.5 | ) | (634.6 | ) | |||
Property, plant and equipment, net | $ | 907.6 | $ | 800.7 | |||
9
5. | Goodwill and Intangible Assets, Net: |
The estimated lives of the Company’s intangible assets are as follows:
Intangible asset | Estimated Lives |
Supply agreement | 50 years |
SOP production rights | 25 years |
Patents | 10-20 years |
Developed technology | 5 years |
Lease rights | 25 years |
Customer and distributor relationships | 10 years |
Trademarks | 10 years |
Noncompete agreements | 5 years |
Trade names | Indefinite |
Water rights | Indefinite |
None of the finite-lived intangible assets have a residual value. Aggregate amortization expense was $1.1 million and $1.0 million in the third quarters of 2016 and 2015, respectively, and $3.2 million and $3.3 million in the first nine months of 2016 and 2015, respectively.
The Company had goodwill of $60.6 million and $58.1 million as of September 30, 2016, and December 31, 2015, respectively, in its consolidated balance sheets. $54.7 million and $51.7 million of the amounts recorded for goodwill as of September 30, 2016, and December 31, 2015, respectively, were recorded in the Company’s plant nutrition segment, and the remaining amounts in both periods were immaterial and recorded in the Company’s salt segment and corporate and other. The change in goodwill between December 31, 2015, and September 30, 2016, was due to the impact from translating foreign-denominated amounts to U.S. dollars.
6. | Income Taxes: |
The Company’s effective income tax rate differs from the U.S. statutory federal income tax rate primarily due to U.S. statutory depletion, state income taxes (net of federal tax benefit), foreign income tax rate differentials, foreign mining taxes, domestic manufacturing deductions and interest expense recognition differences for book and tax purposes. The Company’s effective rate is impacted by permanent tax deductions which have a less favorable impact as pretax income increases.
The Company had $5.5 million and $3.6 million as of September 30, 2016, and December 31, 2015, respectively, of gross foreign federal net operating loss (“NOL”) carryforwards that have no expiration date. In addition, the Company had $11.2 million and $6.4 million as of September 30, 2016, and December 31, 2015, respectively, of gross foreign federal NOL carryforwards which expire beginning in 2033 and $1.3 million and $0.8 million as of September 30, 2016, and December 31, 2015, respectively, of tax-effected state NOL carryforwards which expire beginning in 2033.
Canadian provincial tax authorities have challenged tax positions claimed by one of the Company’s Canadian subsidiaries and have issued tax reassessments for years 2002-2011. The reassessments are a result of ongoing audits and total $92.4 million, including interest through September 30, 2016. The Company disputes these reassessments and will continue to work with the appropriate authorities in Canada to resolve the dispute. There is a reasonable possibility that the ultimate resolution of this dispute, and any related disputes for other open tax years, may be materially higher or lower than the amounts the Company has reserved for such disputes. In connection with this dispute, local regulations require the Company to post security with the tax authority until the dispute is resolved. The Company has posted collateral in the form of a $60.5 million performance bond, has paid $30.0 million (most of which is recorded in other assets in its consolidated balance sheets) and the remaining balance (which is currently $1.8 million) will be addressed later this year, which is necessary to proceed with future appeals or litigation.
In addition, Canadian federal and provincial taxing authorities have reassessed the Company for years 2004-2006, which have been previously settled by agreement among the Company, the Canadian federal taxing authority and the U.S. federal taxing authority. The Company has fully complied with the agreement since entering into it, and it believes this action is highly unusual. The Company is seeking to enforce the agreement which provided the basis upon which the returns were previously filed and settled. The total amount of the reassessments, including penalties and interest through September 30, 2016, related to this matter is $94.9 million. The Company has posted collateral in the form of a $20.4 million performance bond and a $36.7 million bank
10
letter guarantee, which is necessary to proceed with future appeals or litigation. In July 2016, a trial commenced in the Tax Court of Canada with respect to the Canadian federal tax issues for these matters. Written closing arguments were submitted in September 2016, and the outcome of the trial is pending.
The Company received Canadian income tax reassessments for years 2007-2008. The total amount of the reassessments, including penalties and interest through September 30, 2016, related to this matter is $33.9 million. The Company does not agree with these adjustments and is receiving assistance from the tax jurisdictions for relief from the impact of double taxation as available in the tax treaty between the U.S. and Canada. The Company has filed protective Notices of Objection and has agreed to post collateral in the form of a $9.1 million performance bond and a $10.0 million bank letter guarantee, which is necessary to proceed with future appeals or litigation. Although the outcome of examinations by taxing authorities is uncertain, the Company believes it has adequately reserved for this matter.
The Company will be required by local regulations to provide security for additional interest on the above disputed amounts and for any future reassessments issued by these Canadian tax authorities in the form of cash, letters of credit, performance bonds, asset liens or other arrangements agreeable with the tax authorities until the dispute is resolved.
The Company expects that the ultimate outcome of these matters will not have a material impact on its results of operations, cash flows or financial condition. However, the Company can provide no assurance as to the ultimate outcome of these matters and the impact could be material if they are not resolved in the Company’s favor. As of September 30, 2016, the amount reserved related to these reassessments was immaterial to the Company’s consolidated financial statements.
Additionally, the Company has other uncertain tax positions as well as assessments and disputed positions with taxing authorities in its various jurisdictions, which are consistent with those matters disclosed in the Company’s Annual Report on Form 10-K for the year ended December 31, 2015.
7. | Long-term Debt: |
Long-term debt consists of the following (in millions):
September 30, 2016 | December 31, 2015 | ||||||
Term Loans due July 2021 | $ | 843.8 | $ | — | |||
Term Loans due May 2017 | — | 471.9 | |||||
Revolving Credit Facility due August 2017 | — | 4.5 | |||||
Revolving Credit Facility due July 2021 | 122.0 | — | |||||
4.875% Senior Notes due July 2024 | 246.8 | 246.5 | |||||
1,212.6 | 722.9 | ||||||
Less current portion | (8.5 | ) | (4.9 | ) | |||
Long-term debt | $ | 1,204.1 | $ | 718.0 | |||
In September 2016, the Company entered into a new $450 million term loan tranche under its existing credit agreement to fund the acquisition of the remaining 65% of Produquímica’s equity in October 2016 (see Note 14). This additional tranche will mature July 1, 2021, and bears interest at LIBOR plus 2.0%. In connection with this transaction, the Company incurred $2.2 million of financing fees ($0.7 million was recorded as an expense and $1.5 million was capitalized as deferred financing costs).
In April 2016, the Company refinanced its existing $471 million term loans and $125 million revolving credit facility with a new $400 million senior secured term loan and a $300 million senior secured revolving credit facility, which both mature July 1, 2021. The new term loan and revolving credit facility bear interest at LIBOR plus 1.5% based on the Company’s current leverage ratio and credit rating. In connection with the refinancing, the Company incurred $5.8 million of refinancing fees ($1.4 million was recorded as an expense and $4.4 million was capitalized as deferred financing costs) and wrote-off $0.1 million of existing deferred financing costs related to the previous term loans and revolving credit facility.
In the first quarter of 2016, the Company adopted guidance which requires debt issuance costs to be presented as a reduction to the carrying value of the related debt rather than as a deferred charge. In connection with this adoption, the Company reclassified $3.5 million of debt issuance costs related to its 4.875% senior notes due July 2024 and $0.6 million of debt issuance costs related to its term loans in its consolidated balance sheets as of December 31, 2015.
11
As of September 30, 2016, the term loans and revolving credit facility were secured by substantially all existing and future U.S. assets, the Goderich mine in Ontario, Canada, and capital stock of certain subsidiaries.
8. | Commitments and Contingencies: |
The Company is involved in proceedings alleging unfair labor practices at its Cote Blanche, Louisiana, mine. This matter arises out of a labor dispute between the Company and the United Steelworkers Union over the terms of a contract for certain employees at the mine. These employees initiated a strike that began on April 7, 2010, and ended on June 15, 2010. In September 2012, the U.S. National Labor Relations Board issued a decision finding that the Company had committed unfair labor practices in connection with the labor dispute. Under the ruling, the Company is responsible for back pay to affected employees as a result of changes made in union work rules and past practices beginning April 1, 2010. Any requirement for the Company to pay back wages will be offset by any wages earned at other places of employment during this period. In the fourth quarter of 2013, this ruling was upheld by an appeals court, and the Company recorded a reserve of $5.0 million in its consolidated financial statements related to expected payments required to resolve the dispute.
In the first quarter of 2015, additional information became available, and the Company recorded an additional $2.0 million reserve for this matter in its consolidated financial statements. The Company is also recording interest on the amount reserved at approximately 4% per year. Both parties are currently negotiating in an effort to reach a settlement. If the Company is unable to come to terms with the union, the parties may agree to arbitration, and any decisions reached in arbitration would be binding. The reserves that the Company has recorded for this matter are at the minimum of its estimated range of potential losses, and the Company may need to record additional losses in its financial statements as a result of future developments.
The Wisconsin Department of Agriculture, Trade and Consumer Protection (“DATCP”) has information indicating that agricultural chemicals may be present in soil and ground water at the Company’s Kenosha, Wisconsin, plant. The agricultural chemicals were used by previous owners and operators of the site. None of the identified chemicals have been used in association with the Company’s operations since it acquired the property in 2002. DATCP directed the Company to conduct further investigations into the possible presence of agricultural chemicals in soil and ground water at the Kenosha plant. The Company has completed these investigations of the soil and ground water and has provided the findings to DATCP. The Company is presently proceeding with select remediation activities to mitigate agricultural chemical impact to soil and ground water at the site. All investigations and mitigation activities to date are being conducted, and any potential future remediation work may be conducted, under the Wisconsin Agricultural Chemical Cleanup Program (the “ACCP”), which would provide for reimbursement of some of the costs. The Company also may seek participation by, or cost reimbursement from, the parties responsible for the presence of any agricultural chemicals found in soil and ground water at this site if the Company does not receive an acknowledgment of no further action from DACTP and is required to conduct further investigation or remedial work that may not be eligible for reimbursement under the ACCP.
In addition, from time to time, the Company is involved in various routine legal proceedings arising from the ordinary course of the Company’s business. These primarily involve commercial claims, product liability claims, personal injury claims and workers’ compensation claims.
Management cannot predict the outcome of legal proceedings and claims with certainty. Nevertheless, management believes that the outcome of legal proceedings and claims, which are pending or known to be threatened, even if determined adversely, will not, either individually or in the aggregate, have a material adverse effect on the Company’s results of operations, cash flows or financial condition.
9. | Operating Segments: |
Segment information is as follows (in millions):
Three Months Ended September 30, 2016 | |||||||||||||||
Salt | Plant Nutrition(a) | Corporate and Other(b) | Total | ||||||||||||
Sales to external customers | $ | 135.7 | $ | 41.5 | $ | 2.4 | $ | 179.6 | |||||||
Intersegment sales | — | 0.6 | (0.6 | ) | — | ||||||||||
Shipping and handling cost | 33.3 | 5.1 | — | 38.4 | |||||||||||
Operating earnings (loss) | 30.0 | 2.5 | (13.0 | ) | 19.5 | ||||||||||
Depreciation, depletion and amortization | 12.2 | 8.3 | 1.3 | 21.8 | |||||||||||
Total assets (as of end of period) | 1,249.3 | 794.1 | 59.0 | 2,102.4 | |||||||||||
12
Three Months Ended September 30, 2015 | |||||||||||||||
Salt | Plant Nutrition(a) | Corporate and Other(b) | Total | ||||||||||||
Sales to external customers | $ | 179.9 | $ | 50.2 | $ | 2.6 | $ | 232.7 | |||||||
Intersegment sales | — | 1.6 | (1.6 | ) | — | ||||||||||
Shipping and handling cost | 48.5 | 4.7 | — | 53.2 | |||||||||||
Operating earnings (loss) | 45.0 | 8.8 | (13.0 | ) | 40.8 | ||||||||||
Depreciation, depletion and amortization | 11.1 | 7.6 | 0.9 | 19.6 | |||||||||||
Total assets (as of end of period) | 898.2 | 568.9 | 61.6 | 1,528.7 | |||||||||||
Nine Months Ended September 30, 2016 | |||||||||||||||
Salt | Plant Nutrition(a) | Corporate and Other(b) | Total | ||||||||||||
Sales to external customers | $ | 546.9 | $ | 140.4 | $ | 7.5 | $ | 694.8 | |||||||
Intersegment sales | — | 2.7 | (2.7 | ) | — | ||||||||||
Shipping and handling cost | 147.7 | 17.2 | — | 164.9 | |||||||||||
Operating earnings (loss) | 136.0 | 12.5 | (39.2 | ) | 109.3 | ||||||||||
Depreciation, depletion and amortization | 34.2 | 24.6 | 3.9 | 62.7 | |||||||||||
Nine Months Ended September 30, 2015 | |||||||||||||||
Salt | Plant Nutrition(a) | Corporate and Other(b) | Total | ||||||||||||
Sales to external customers | $ | 612.9 | $ | 187.9 | $ | 8.6 | $ | 809.4 | |||||||
Intersegment sales | 0.1 | 5.1 | (5.2 | ) | — | ||||||||||
Shipping and handling cost | 178.1 | 17.8 | — | 195.9 | |||||||||||
Operating earnings (loss) | 143.1 | 46.4 | (40.0 | ) | 149.5 | ||||||||||
Depreciation, depletion and amortization | 32.9 | 21.7 | 3.2 | 57.8 | |||||||||||
(a) | Plant nutrition segment assets include the equity investment in Produquímica. |
(b) | Corporate and other includes corporate entities, records management operations and other incidental operations and eliminations. Operating earnings (loss) for corporate and other includes indirect corporate overhead, including costs for general corporate governance and oversight, as well as costs for the human resources, information technology, legal and finance functions. |
10. | Stockholders’ Equity and Equity Instruments: |
In May 2015, the Company’s shareholders approved the 2015 Incentive Award Plan, which authorizes the issuance of 3,000,000 shares. Since the date the 2015 Incentive Award Plan was approved, the Company ceased issuing equity awards under the 2005 Incentive Award Plan. In 2016, the Company elected to move its grant date for annual grants of equity awards from March to April. For outstanding awards, the Company’s closing stock price on the grant date was used to set the exercise price for options and the fair value of restricted stock units (“RSUs”). In the first nine months of 2016, the Company granted 157,887 options, 28,353 RSUs and 42,902 performance stock units (“PSUs”) to certain employees under its 2015 Incentive Award Plan. None of the granted equity awards have voting rights.
Options
Options granted in 2016 vest ratably on each anniversary date over a four-year service period. Unexercised options expire after seven years. Options do not have dividend rights. To estimate the fair value of options on the grant date, the Company uses the Black-Scholes option valuation model. Award recipients are grouped according to expected exercise behavior. Unless better information is available to estimate the expected term of the options, the estimate is based on historical exercise experience. The risk-free rate, using U.S. Treasury yield curves in effect at the time of grant, is selected based on the expected term of each group. The Company’s historical stock price is used to estimate expected volatility. The inputs used to calculate fair value for options granted in 2016 are included in the table below.
13
Fair value of options granted | $10.17 |
Exercise price | $70.48 |
Expected term (years) | 4.5 |
Expected volatility | 24.4% |
Dividend yield | 3.3% |
Risk-free rate of return | 1.2% |
RSUs
RSUs granted in 2016 generally vest on the third anniversary following the grant date and are earned if a performance hurdle tied to the Company’s 2016 financial performance has been satisfied. Holders of RSUs are entitled to receive non-forfeitable dividends or other distributions equal to those declared on the Company’s common stock for RSUs that are earned.
PSUs
PSUs granted in 2016 have a three-year performance period that begins on the grant date and vest on the third anniversary following the grant date. PSUs represent a target number of shares of Company common stock that may be earned before adjustment based upon the attainment of certain performance conditions. Holders of PSUs are entitled to receive non-forfeitable dividends or other distributions equal to those declared on the Company’s common stock for PSUs that are earned.
The Company granted two types of PSUs in 2016, total shareholder return PSUs (“TSR PSUs”) and return on invested capital PSUs (“ROIC PSUs”). The actual number of shares of common stock that may be earned with respect to TSR PSUs is calculated by comparing the Company’s total shareholder return to the total shareholder return for each company comprising the Russell 3000 Index over the three-year performance period and may range from 0% to 150% of the target number of shares based upon the attainment of these performance conditions. The actual number of shares of common stock that may be earned with respect to ROIC PSUs is calculated based on the average of the Company’s annual return on invested capital for each year in the three-year performance period and may range from 0% to 200% of the target number of shares based upon the attainment of these performance conditions.
To estimate the fair value of the TSR PSUs on the grant date, the Company uses a Monte-Carlo simulation model, which simulates future stock prices of the Company as well as the companies comprising the Russell 3000 Index. This model uses historical stock prices to estimate expected volatility and the Company’s correlation to the Russell 3000 Index. The risk-free rate was determined using the same methodology as the option valuations as discussed above. The Company’s closing stock price on the grant date was used to estimate the fair value of the ROIC PSUs. The Company will adjust the expense of the ROIC PSUs based upon its estimate of the number of shares that will ultimately vest at each interim date during the three-year vesting period.
During the nine months ended September 30, 2016, the Company reissued the following number of shares from treasury stock: 11,377 shares related to the exercise of stock options, 51,324 shares related to the release of RSUs which vested, 10,258 shares related to the release of PSUs which vested and 11,575 shares related to stock payments. The Company recognized a tax deficiency of $0.2 million from its equity compensation awards as a decrease to additional paid-in capital during the first nine months of 2016. During the first nine months of 2016 and 2015, the Company recorded $3.8 million and $4.9 million, respectively, of compensation expense pursuant to its stock-based compensation plans. No amounts have been capitalized. The following table summarizes stock-based compensation activity during the nine months ended September 30, 2016.
Stock Options | RSUs | PSUs(a) | |||||||||||||||||||
Number | Weighted-average exercise price | Number | Weighted-average fair value | Number | Weighted-average fair value | ||||||||||||||||
Outstanding at December 31, 2015 | 353,087 | $ | 83.94 | 91,008 | $ | 80.65 | 77,365 | $ | 96.63 | ||||||||||||
Granted | 157,887 | 70.48 | 28,353 | 70.78 | 42,902 | 73.77 | |||||||||||||||
Exercised(b) | (11,377 | ) | 62.50 | — | — | — | — | ||||||||||||||
Released from restriction(b) | — | — | (51,324 | ) | 75.18 | (10,258 | ) | 78.49 | |||||||||||||
Cancelled/expired | (26,389 | ) | 84.96 | (3,073 | ) | 88.93 | (11,957 | ) | 91.06 | ||||||||||||
Outstanding at September 30, 2016 | 473,208 | $ | 79.91 | 64,964 | $ | 80.27 | 98,052 | $ | 89.21 | ||||||||||||
(a) | Until they vest, PSUs are included in the table at the target level at their grant date and at that level represent one share of common stock per PSU. The final performance period for the 2013 PSU grant was completed in 2015. The Company cancelled 5,263 PSUs in 2016 related to the 2013 PSU grant. |
(b) | Common stock issued for exercised options and for vested and earned RSUs and PSUs was issued from treasury stock. |
14
Other Comprehensive Income (Loss)
The Company’s comprehensive income (loss) is comprised of net earnings, net amortization of the unrealized loss of the pension obligation, the change in the unrealized gain (loss) on natural gas cash flow hedges and foreign currency translation adjustments. The components of and changes in accumulated other comprehensive income (loss) (“AOCI”) as of and for the three and nine months ended September 30, 2016, and 2015, are as follows (in millions):
Three Months Ended September 30, 2016(a) | Gains and (Losses) on Cash Flow Hedges | Defined Benefit Pension | Foreign Currency | Total | |||||||||||
Beginning balance | $ | (0.2 | ) | $ | (3.6 | ) | $ | (71.8 | ) | $ | (75.6 | ) | |||
Other comprehensive income (loss) before reclassifications(b) | (0.3 | ) | — | (3.9 | ) | (4.2 | ) | ||||||||
Amounts reclassified from accumulated other comprehensive loss | 0.2 | — | — | 0.2 | |||||||||||
Net current period other comprehensive income (loss) | (0.1 | ) | — | (3.9 | ) | (4.0 | ) | ||||||||
Ending balance | $ | (0.3 | ) | $ | (3.6 | ) | $ | (75.7 | ) | $ | (79.6 | ) | |||
Three Months Ended September 30, 2015(a) | Gains and (Losses) on Cash Flow Hedges | Defined Benefit Pension | Foreign Currency | Total | |||||||||||
Beginning balance | $ | (1.5 | ) | $ | (8.4 | ) | $ | (43.1 | ) | $ | (53.0 | ) | |||
Other comprehensive income (loss) before reclassifications(b) | (0.3 | ) | — | (37.4 | ) | (37.7 | ) | ||||||||
Amounts reclassified from accumulated other comprehensive loss | 0.3 | 0.2 | — | 0.5 | |||||||||||
Net current period other comprehensive income (loss) | — | 0.2 | (37.4 | ) | (37.2 | ) | |||||||||
Ending balance | $ | (1.5 | ) | $ | (8.2 | ) | $ | (80.5 | ) | $ | (90.2 | ) | |||
Nine Months Ended September 30, 2016(a) | Gains and (Losses) on Cash Flow Hedges | Defined Benefit Pension | Foreign Currency | Total | |||||||||||
Beginning balance | $ | (1.6 | ) | $ | (3.8 | ) | $ | (102.9 | ) | $ | (108.3 | ) | |||
Other comprehensive income (loss) before reclassifications(b) | (0.1 | ) | — | 27.2 | 27.1 | ||||||||||
Amounts reclassified from accumulated other comprehensive loss | 1.4 | 0.2 | — | 1.6 | |||||||||||
Net current period other comprehensive income (loss) | 1.3 | 0.2 | 27.2 | 28.7 | |||||||||||
Ending balance | $ | (0.3 | ) | $ | (3.6 | ) | $ | (75.7 | ) | $ | (79.6 | ) | |||
Nine Months Ended September 30, 2015(a) | Gains and (Losses) on Cash Flow Hedges | Defined Benefit Pension | Foreign Currency | Total | |||||||||||
Beginning balance | $ | (2.0 | ) | $ | (9.0 | ) | $ | (4.5 | ) | $ | (15.5 | ) | |||
Other comprehensive income (loss) before reclassifications(b) | (0.9 | ) | — | (76.0 | ) | (76.9 | ) | ||||||||
Amounts reclassified from accumulated other comprehensive loss | 1.4 | 0.8 | — | 2.2 | |||||||||||
Net current period other comprehensive income (loss) | 0.5 | 0.8 | (76.0 | ) | (74.7 | ) | |||||||||
Ending balance | $ | (1.5 | ) | $ | (8.2 | ) | $ | (80.5 | ) | $ | (90.2 | ) | |||
(a) | With the exception of the cumulative foreign currency translation adjustment, for which no tax effect is recorded, the changes in the components of accumulated other comprehensive gain (loss) presented in the tables above are reflected net of applicable income taxes. |
(b) | The Company recorded foreign exchange (gains) losses of $3.8 million and $(22.9) million in the three and nine months ended September 30, 2016, respectively, and $13.0 million and $27.6 million in the three and nine months ended September 30, 2015, respectively, in accumulated other comprehensive income (loss) related to intercompany notes which were deemed to be of long-term investment nature. |
15
The amounts reclassified from AOCI to (income) expense for the three and nine months ended September 30, 2016, and 2015, are shown below (in millions):
Amount Reclassified from AOCI | |||||||||
Three Months Ended September 30, 2016 | Nine Months Ended September 30, 2016 | Line Item Impacted in the Consolidated Statement of Operations | |||||||
Gains and (losses) on cash flow hedges: | |||||||||
Natural gas instruments | $ | 0.3 | $ | 2.2 | Product cost | ||||
(0.1 | ) | (0.8 | ) | Income tax expense (benefit) | |||||
Reclassifications, net of income taxes | 0.2 | 1.4 | |||||||
Amortization of defined benefit pension: | |||||||||
Amortization of loss | $ | — | $ | 0.2 | Product cost | ||||
— | — | Income tax expense (benefit) | |||||||
Reclassifications, net of income taxes | — | 0.2 | |||||||
Total reclassifications, net of income taxes | $ | 0.2 | $ | 1.6 | |||||
Amount Reclassified from AOCI | |||||||||
Three Months Ended September 30, 2015 | Nine Months Ended September 30, 2015 | Line Item Impacted in the Consolidated Statement of Operations | |||||||
Gains and (losses) on cash flow hedges: | |||||||||
Natural gas instruments | $ | 0.5 | $ | 2.2 | Product cost | ||||
(0.2 | ) | (0.8 | ) | Income tax expense (benefit) | |||||
Reclassifications, net of income taxes | 0.3 | 1.4 | |||||||
Amortization of defined benefit pension: | |||||||||
Amortization of loss | $ | 0.3 | $ | 1.0 | Product cost | ||||
(0.1 | ) | (0.2 | ) | Income tax expense (benefit) | |||||
Reclassifications, net of income taxes | 0.2 | 0.8 | |||||||
Total reclassifications, net of income taxes | $ | 0.5 | $ | 2.2 | |||||
11. | Derivative Financial Instruments: |
The Company is subject to various types of market risks, including interest rate risk, foreign currency exchange rate transaction and translation risk, and commodity pricing risk. Management may take actions to mitigate the exposure to these types of risks, including entering into forward purchase contracts and other financial instruments. Currently, the Company manages a portion of its commodity pricing risk by using derivative instruments. The Company does not seek to engage in trading activities or take speculative positions with any financial instrument arrangements. The Company has entered into natural gas derivative instruments with counterparties it views as creditworthy. However, management does attempt to mitigate its counterparty credit risk exposures by, among other things, entering into master netting agreements with these counterparties.
Cash Flow Hedges
As of September 30, 2016, the Company has entered into natural gas derivative instruments. The Company records derivative financial instruments as either assets or liabilities at fair value in the consolidated balance sheets. Derivatives qualify for treatment as hedges when there is a high correlation between the change in fair value of the derivative instrument and the related change in value of the underlying hedged item. Depending on the exposure being hedged, the Company must designate the hedging instrument as a fair value hedge, a cash flow hedge or a net investment in foreign operations hedge. All derivative instruments held by the Company as of September 30, 2016, and December 31, 2015, qualified as cash flow hedges. For these qualifying hedges, the effective portion of the change in fair value is recognized through earnings when the underlying transaction being hedged affects earnings, allowing a derivative’s gains and losses to offset related results from the hedged item in the statements of operations (see Note 10). For derivative instruments that are not accounted for as hedges, or for the ineffective portions of qualifying hedges, the change in fair value is recorded through earnings in the period of change. The Company formally documents, designates and assesses the effectiveness of transactions that receive hedge accounting treatment initially and on an ongoing basis. Any ineffectiveness related to these hedges was not material for any of the periods presented.
16
Natural gas is consumed at several of the Company’s production facilities, and a change in natural gas prices impacts the Company’s operating margin. As of September 30, 2016, the Company had entered into natural gas derivative instruments to hedge a portion of its natural gas purchase requirements through December 2017. The Company’s objective is to reduce the earnings and cash flow impacts of changes in market prices of natural gas by fixing the purchase price of up to 90% of its forecasted natural gas usage. It is the Company’s policy to consider hedging portions of its natural gas usage up to 36 months in advance of the forecasted purchase. As of September 30, 2016, and December 31, 2015, the Company had agreements in place to hedge forecasted natural gas purchases of 2.1 million and 2.8 million MMBtus, respectively.
As of September 30, 2016, the Company expects to reclassify from accumulated other comprehensive loss to earnings during the next twelve months $0.5 million of net losses on derivative instruments related to its natural gas hedges.
The following tables present the fair value of the Company’s hedged items as of September 30, 2016, and December 31, 2015 (in millions):
Asset Derivatives | Liability Derivatives | ||||||||||
Derivatives designated as hedging instruments(a) | Balance Sheet Location | September 30, 2016 | Balance Sheet Location | September 30, 2016 | |||||||
Commodity contracts | Other current assets | $ | 0.2 | Accrued expenses | $ | 0.6 | |||||
Commodity contracts | Other assets | — | Other noncurrent liabilities | 0.1 | |||||||
Total derivatives designated as hedging instruments | $ | 0.2 | $ | 0.7 | |||||||
(a) | As of September 30, 2016, the Company had commodity hedge agreements with two counterparties. Amounts recorded as liabilities for the Company’s commodity contracts were payable to one counterparty, and amounts recorded as assets were due from one counterparty. The Company has master netting agreements with its counterparties and accordingly has netted in its consolidated balance sheets $0.1 million of contracts that were in receivable positions against its contracts in payable positions. |
Asset Derivatives | Liability Derivatives | ||||||||||
Derivatives designated as hedging instruments(a) | Balance Sheet Location | December 31, 2015 | Balance Sheet Location | December 31, 2015 | |||||||
Commodity contracts | Other current assets | $ | 0.1 | Accrued expenses | $ | 2.6 | |||||
Commodity contracts | Other assets | — | Other noncurrent liabilities | 0.1 | |||||||
Total derivatives designated as hedging instruments | $ | 0.1 | $ | 2.7 | |||||||
(a) | As of December 31, 2015, the Company had commodity hedge agreements with two counterparties. Amounts recorded as liabilities for the Company’s commodity contracts were payable to both counterparties. The Company has master netting agreements with its counterparties and accordingly has netted in its consolidated balance sheets $0.1 million of contracts that were in receivable positions against its contracts in payable positions. |
12. | Fair Value Measurements: |
The Company’s financial instruments are measured and reported at their estimated fair value. Fair value is the price that would be received to sell an asset or paid to transfer a liability in an orderly transaction. When available, the Company uses quoted prices in active markets to determine the fair values for its financial instruments (level one inputs) or, absent quoted market prices, observable market-corroborated inputs over the term of the financial instruments (level two inputs). The Company does not have any unobservable inputs that are not corroborated by market inputs (level three inputs).
The Company holds marketable securities associated with its non-qualified retirement plan, which are valued based on readily available quoted market prices. The Company utilizes derivative instruments to manage its risk of changes in natural gas prices. The fair value of the natural gas derivative instruments are determined using market data of forward prices for all of the Company’s contracts.
17
The estimated fair values for each type of instrument are presented below (in millions).
September 30, 2016 | Level One | Level Two | Level Three | ||||||||||||
Asset Class: | |||||||||||||||
Mutual fund investments in a non-qualified retirement plan(a) | $ | 1.8 | $ | 1.8 | $ | — | $ | — | |||||||
Derivatives – natural gas instruments, net | 0.2 | — | 0.2 | — | |||||||||||
Total Assets | $ | 2.0 | $ | 1.8 | $ | 0.2 | $ | — | |||||||
Liability Class: | |||||||||||||||
Liabilities related to non-qualified retirement plan | $ | (1.8 | ) | $ | (1.8 | ) | $ | — | $ | — | |||||
Derivatives – natural gas instruments, net | (0.7 | ) | — | (0.7 | ) | — | |||||||||
Total Liabilities | $ | (2.5 | ) | $ | (1.8 | ) | $ | (0.7 | ) | $ | — | ||||
(a) | Includes mutual fund investments of approximately 20% in common stock of large-cap U.S. companies, 10% in common stock of small to mid-cap U.S. companies, 5% in international companies, 10% in bond funds, 20% in short-term investments and 35% in blended funds. |
December 31, 2015 | Level One | Level Two | Level Three | ||||||||||||
Asset Class: | |||||||||||||||
Mutual fund investments in a non-qualified retirement plan(a) | $ | 1.6 | $ | 1.6 | $ | — | $ | — | |||||||
Total Assets | $ | 1.6 | $ | 1.6 | $ | — | $ | — | |||||||
Liability Class: | |||||||||||||||
Liabilities related to non-qualified retirement plan | $ | (1.6 | ) | $ | (1.6 | ) | $ | — | $ | — | |||||
Derivatives – natural gas instruments, net | (2.6 | ) | — | (2.6 | ) | — | |||||||||
Total Liabilities | $ | (4.2 | ) | $ | (1.6 | ) | $ | (2.6 | ) | $ | — | ||||
(a) | Includes mutual fund investments of approximately 20% in common stock of large-cap U.S. companies, 5% in common stock of small to mid-cap U.S. companies, 5% in the common stock of international companies, 5% in bond funds, 35% in short-term investments and 30% in blended funds. |
Cash and cash equivalents, accounts receivable (net of allowance for bad debts) and payables are carried at cost, which approximates fair value due to their liquid and short-term nature. The Company’s investments related to its nonqualified retirement plan of $1.8 million and $1.6 million at September 30, 2016, and December 31, 2015, respectively, are stated at fair value based on quoted market prices. As of September 30, 2016, the estimated amount a third-party would pay for the Company’s fixed-rate 4.875% senior notes due July 2024, based on available trading information, totaled $236.7 million (level two) compared with the aggregate principal amount at maturity of $250.0 million. The estimated amount a third-party would pay at September 30, 2016, for the amounts outstanding under the Company’s term loans and revolving credit facility, based upon available bid information received from the Company’s lender, totaled $958.4 million (level two) compared with the aggregate principal balance of $970.0 million.
18
13. | Earnings per Share: |
The Company calculates earnings per share using the two-class method. The two-class method requires allocating the Company’s net earnings to both common shares and participating securities. The following table sets forth the computation of basic and diluted earnings per common share (in millions, except for share and per-share data):
Three months ended September 30, | Nine Months Ended September 30, | ||||||||||||||
2016 | 2015 | 2016 | 2015 | ||||||||||||
Numerator: | |||||||||||||||
Net earnings | $ | 9.1 | $ | 27.0 | $ | 65.1 | $ | 100.8 | |||||||
Less: net earnings allocated to participating securities (a) | (0.1 | ) | (0.1 | ) | (0.3 | ) | (0.6 | ) | |||||||
Net earnings available to common shareholders | $ | 9.0 | $ | 26.9 | $ | 64.8 | $ | 100.2 | |||||||
Denominator (in thousands): | |||||||||||||||
Weighted-average common shares outstanding, shares for basic earnings per share | 33,786 | 33,696 | 33,772 | 33,668 | |||||||||||
Weighted-average awards outstanding (b) | 3 | 12 | 3 | 19 | |||||||||||
Shares for diluted earnings per share | 33,789 | 33,708 | 33,775 | 33,687 | |||||||||||
Net earnings per common share, basic | $ | 0.27 | $ | 0.80 | $ | 1.92 | $ | 2.98 | |||||||
Net earnings per common share, diluted | $ | 0.27 | $ | 0.80 | $ | 1.92 | $ | 2.97 | |||||||
(a) | Weighted participating securities include RSUs and PSUs that receive non-forfeitable dividends and consist of 148,000 weighted participating securities for both the three and nine months ended September 30, 2016, respectively, and 182,000 and 197,000 weighted participating securities for the three and nine months ended September 30, 2015, respectively. |
(b) | For the calculation of diluted earnings per share, the Company uses the more dilutive of either the treasury stock method or the two-class method to determine the weighted-average number of outstanding common shares. In addition, the Company had 547,000 and 509,000 weighted-average equity awards outstanding for the three and nine months ended September 30, 2016, respectively, and 450,000 and 429,000 weighted-average equity awards for the three and nine months ended September 30, 2015, respectively, which were anti-dilutive and therefore not included in the diluted earnings per share calculation. |
14. | Subsequent Event: |
On October 3, 2016, the Company acquired the remaining 65% of the issued and outstanding capital stock of Produquímica for an aggregate purchase price of R$1,066 million Brazilian Reais, or $331.9 million U.S. dollars at closing, which is subject to customary, post-closing adjustments. The Company also assumed approximately R$445 million Brazilian Reais, or $138.5 million U.S. dollars at closing, of net debt (inclusive of cash on hand at closing). During the fourth quarter of 2016, the Company expects to retire a portion of the debt assumed.
Based in São Paulo, Brazil, Produquímica operates two primary businesses – agricultural productivity and chemical solutions. The agricultural productivity division manufactures and distributes a broad offering of specialty plant nutrition solution-based products. These include micronutrients, controlled release fertilizers and other specialty supplements that are used in direct soil and foliar applications, as well as through irrigation systems and for seed treatment. Many of these products are developed through Produquímica’s research and development capabilities. Produquímica also manufactures and markets specialty chemicals, primarily for the water treatment industry and for use in other industrial processes in Brazil. The acquisition broadens the Company’s geographic scope of operations and expands its specialty plant nutrition portfolio while reducing the Company’s dependence on winter weather conditions.
The transaction will be accounted for in accordance with the acquisition method of accounting for business combinations, which requires the Company to record the assets acquired and the liabilities assumed on its consolidated balance sheet at their respective fair values on the acquisition date. The total results of Produquímica’s operations will be included in the Company’s consolidated financial statements from the date of acquisition of the remaining 65% equity interest in Produquímica. In connection with the transaction, the Company incurred $0.7 million of transaction costs, which were recorded in selling, general and administrative expenses during the third quarter of 2016.
Due to the short amount of time that has elapsed from the closing of the acquisition, the initial accounting for the business combination is incomplete at this time. As a result, the Company is unable to provide contingent consideration disclosures and the amounts recognized as of the acquisition date for the major classes of assets acquired and liabilities assumed, including the information required for net working capital, pre-acquisition contingencies, intangible assets and goodwill. Additionally, the
19
Company is unable to include the fair value of the pre-existing 35% equity interest in Produquímica immediately before its acquisition date and the related gain or loss which will be recognized as a result of remeasuring the equity interest which was carried at $127.5 million as of September 30, 2016. The Company is also unable to include the effects of the acquisition in pro forma revenues and earnings of the combined entity. To the extent such information is required, the Company intends to include this information in its Annual Report on Form 10-K for the year ended December 31, 2016.
Item 2. Management’s Discussion and Analysis of Financial Condition and Results of Operations
All statements, other than statements of historical fact, contained in this Quarterly Report on Form 10-Q constitute “forward-looking statements” within the meaning of the Private Securities Litigation Reform Act of 1995.
Forward-looking statements relate to future events or our future financial performance, and involve known and unknown risks, uncertainties, and other factors that may cause our actual results, levels of activity, performance or achievements to be materially different from any future results, levels of activity, performance or achievements expressed or implied by these forward-looking statements. Factors that could cause actual results to differ materially from those expressed or implied by the forward-looking statements include, but are not limited to, the following: hazards of mining, including acts of nature; uninsured risks; difficulties or delays in receiving or renewing required governmental or regulatory approvals; the impact of new technology on the demand for our products; the price or lack of availability of transportation services; agricultural economics, customer expectations about future plant nutrition prices and customer application rates; weather conditions; cyber security issues; the ability to attract and retain skilled personnel or avoid a disruption in our workforce; the impact of competitive products; governmental policies affecting highway maintenance programs, or consumer, industrial or agricultural sectors in localities where we or our customers operate; constraints on supplies and prices of raw materials and energy used in manufacturing certain of our products; changes in tax laws or estimates; domestic and international general business and economic conditions; foreign exchange rates and their fluctuations; the effects of and changes in trade, monetary, environmental and fiscal policies, laws and regulations; the costs and effects of legal and tax proceedings, including environmental and administrative proceedings; the impact of indebtedness and interest rates, including access to additional credit and capital markets; the ability to successfully complete acquisitions or integrate acquired businesses; misappropriation or infringement claims relating to intellectual property; capacity constraints limiting the production of certain products; difficulties or delays in the development, production, testing and marketing of products; market acceptance issues, including the failure of products to generate anticipated sales levels; and other risks referenced from time to time in this report and our other filings with the Securities and Exchange Commission (“SEC”), including the “Risk Factors” of our Annual Report on Form 10-K for the year ended December 31, 2015.
In some cases, you can identify forward-looking statements by terminology such as “may,” “might,” “will,” “should,” “could,” “expects,” “intends,” “plans,” “anticipates,” “believes,” “estimates,” “predicts,” “potential,” “continue,” the negative of these terms or other comparable terminology. Forward-looking statements include without limitation statements about our expected outlook, including expected sales volumes, production costs, EBITDA contributions from Produquímica Indústria e Comércio S.A. (“Produquímica”), and savings from our cost structure review; our ability to meet debt service requirements, optimize cash accessibility and minimize tax expense; capital expenditures; and outcomes of matters with taxing authorities. These forward-looking statements are only predictions. Actual events or results may differ materially.
Although we believe that the expectations reflected in the forward-looking statements are reasonable, we cannot guarantee future results, levels of activity, performance or achievements. We undertake no duty to update any of the forward-looking statements after the date hereof or to reflect the occurrence of unanticipated events.
Unless the context requires otherwise, references to the “Company,” “Compass,” “Compass Minerals,” “we,” “us” and “our” refer to Compass Minerals International, Inc. (“CMI,” the parent holding company) and its consolidated subsidiaries. Except where otherwise noted, references to North America include only the continental United States (the “U.S.”) and Canada, and references to the United Kingdom (the “U.K.”) include only England, Scotland and Wales. Except where otherwise noted, all references to tons refer to “short tons” and all amounts are in U.S. dollars. One short ton equals 2,000 pounds.
Critical Accounting Estimates
Preparation of our consolidated financial statements in accordance with U.S. generally accepted accounting principles (“GAAP”) requires management to make estimates and assumptions that affect the reported amounts of assets, liabilities, revenues and expenses. Management believes the most complex and sensitive judgments result primarily from the need to make estimates about matters that are inherently uncertain. Management’s Discussion and Analysis and Note 2 to the Consolidated Financial Statements included in our Annual Report on Form 10-K for the year ended December 31, 2015, describe the significant accounting estimates and policies used in preparation of our consolidated financial statements. Actual results in these areas could differ from management’s estimates.
20
Company Overview
Based in the Kansas City metropolitan area, Compass Minerals is a leading producer of essential minerals, including salt, sulfate of potash (“SOP”) specialty fertilizer and magnesium chloride. As of September 30, 2016, we operated 13 production and packaging facilities, including the largest rock salt mine in the world in Goderich, Ontario, Canada, and the largest dedicated rock salt mine in the U.K. in Winsford, Cheshire. Our salt business produces and sells sodium chloride and magnesium chloride, which are used for highway deicing, dust control, consumer deicing, water conditioning, consumer and industrial food preparation and agricultural and industrial applications. Our solar evaporation facility located in Ogden, Utah, is both the largest SOP production site and the largest solar salt production site in North America. In addition, we operate a records management business utilizing excavated areas of our Winsford salt mine with one other location in London, U.K., which provides services to businesses throughout the U.K. In October 2016, we acquired Produquímica which operates two primary businesses in Brazil – agricultural productivity and chemical solutions.
Consolidated Results of Operations
The following is a summary of our consolidated results of operations for the three and nine months ended September 30, 2016, and September 30, 2015, respectively. The following discussion should be read in conjunction with the information contained in our Consolidated Financial Statements and the Notes thereto included in this Quarterly Report on Form 10-Q.
THREE AND NINE MONTHS ENDED SEPTEMBER 30
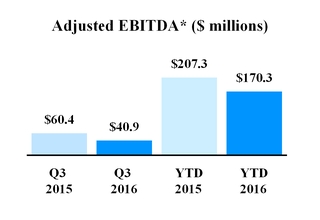
* Refer to “—Sensitivity Analysis Related to EBITDA and Adjusted EBITDA” for a reconciliation to the most directly comparable GAAP financial measure and the reasons we use this non-GAAP measure.
21
COMMENTARY: THREE MONTHS ENDED SEPTEMBER 30, 2015 AND 2016
• | Sales decreased 23% to $179.6 million. |
• | Operating earnings decreased 52% to $19.5 million. |
• | Salt segment operating earnings decreased 33%, and plant nutrition operating earnings decreased 72%. |
• | Adjusted earnings before interest, income taxes, depreciation and amortization (“Adjusted EBITDA”)* decreased 32% to $40.9 million. |
• | Diluted earnings per share decreased 66% to $0.27. |
COMMENTARY: NINE MONTHS ENDED SEPTEMBER 30, 2015 AND 2016
• | Sales decreased 14% to $694.8 million. |
• | Operating earnings decreased 27% to $109.3 million. |
• | Salt segment operating earnings decreased 5%, and plant nutrition operating earnings decreased 73%. |
• | Adjusted EBITDA* decreased 18% to $170.3 million. |
• | Diluted earnings per share decreased 35% to $1.92. |
THREE AND NINE MONTHS ENDED SEPTEMBER 30
COMMENTARY: THREE MONTHS ENDED SEPTEMBER 30, 2015 AND 2016
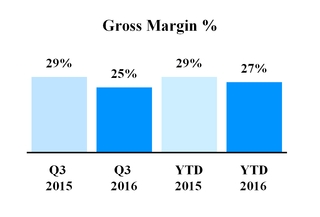
Gross Profit: Decreased $22.8 million or 34%; Gross Margin decreased 4 percentage points from 29% to 25%
• | Salt gross profit decreased by approximately $16 million. |
• | The decrease in salt gross profit was due primarily to lower sales volumes due to a decrease in pre-winter demand and lower average selling prices, which was partially offset by lower logistics costs in the third quarter of 2016. |
• | Plant nutrition gross profit decreased by approximately $7 million. |
• | The decrease in plant nutrition gross profit was primarily due to a decline of 21% in average sales prices, which was partially offset by a 4% increase in sales volumes and sales of lower-cost SOP inventory during the third quarter of 2016. |
COMMENTARY: NINE MONTHS ENDED SEPTEMBER 30, 2015 AND 2016
Gross Profit: Decreased $42.7 million or 18%; Gross Margin decreased 2 percentage points from 29% to 27%
• | Salt gross profit decreased by approximately $9 million. |
• | The decrease in salt gross profit was due primarily to reduced salt average selling prices and lower salt sales volumes. |
• | The decrease in salt gross profit was partially offset by lower logistics costs and lower sales of purchased salt. We purchased salt in the first quarter of 2015 to supplement production due to unplanned downtime at our North American mines. |
• | Plant nutrition gross profit decreased by approximately $33 million. |
• | The decrease in plant nutrition gross profit was primarily due to lower average sales prices, lower sales volumes and a slight increase in per-unit production costs as we sold the remaining higher-cost SOP inventory from 2015 in the second quarter of 2016. |
• | The decrease in plant nutrition segment gross profit was partially offset by a $1.9 million gain from a transaction to exchange land at our Ogden, Utah, facility. |
22
OTHER EXPENSES AND INCOME
COMMENTARY: THREE MONTHS ENDED SEPTEMBER 30, 2015 AND 2016
SG&A: Decreased $1.5 million; increased 2.6 percentage points to 14.3% from 11.7% as a percentage of sales
• | The decrease in expense was due to lower marketing expenses of $1.5 million in our plant nutrition segment and a decrease in incentive compensation, primarily in corporate and our salt segment, which was partially offset by higher corporate information and technology costs. |
Interest Expense: $5.4 million in both periods
• | Interest expense related to our higher aggregate debt level was offset by lower interest rates due to the refinancing of our term loans and revolving credit facility in April 2016. |
Net Loss from Equity Investee: Loss of $0.4 million in the three months ended September 30, 2016
• | We recognized a loss of $0.4 million related to our share of Produquímica’s net loss from the second quarter of 2016, which includes $1.0 million of charges related to adjustments for the impact of the fair value of assets acquired in excess of their book value. We report Produquímica’s results on a three-month lag. |
Other (Income) Loss: Decreased from income of $4.3 million to a loss of $1.5 million
• | Foreign exchange losses were $1.1 million in the third quarter of 2016 compared to foreign exchange gains of $4.1 million in same period of the prior year. In addition, we incurred $0.7 million of expenses related to the additional term loan incurred in September 2016, which was used to acquire the remaining 65% of Produquímica’s equity in October 2016. |
Income Tax Expense: Decreased $9.6 million to $3.1 million
• | The decrease was primarily due to lower pre-tax income. |
• | Our income tax provision in both periods differs from the U.S. statutory rate primarily due to U.S. statutory depletion, domestic manufacturing deductions, state income taxes, foreign income, mining and withholding taxes and interest expense recognition differences for tax and financial reporting purposes. |
• | Our effective tax rate decreased from 32% in the third quarter of 2015 to 25% in the third quarter of 2016 due to refinements made in each respective period related to the expected full-year pretax profit and effective tax rate. |
COMMENTARY: NINE MONTHS ENDED SEPTEMBER 30, 2015 AND 2016
SG&A: Decreased $2.5 million; increased 1.3 percentage points to 11.5% from 10.2% as a percentage of sales
• | The decrease in expense was due to a $1.9 million decrease in professional services expenses in corporate, lower marketing expenses of $1.4 million in both our salt and plant nutrition segments and lower total corporate incentive compensation. |
• | The decrease in expense was partially offset by $2.0 million of plant nutrition and corporate severance costs related to the restructuring of our business. |
Interest Expense: Increased $0.7 million to $16.8 million
• | Interest expense related to our higher aggregate debt level was offset by lower interest rates due to the refinancing of our term loans and revolving credit facility in April 2016. |
Net Loss from Equity Investee: Loss of $1.7 million in the nine months ended September 30, 2016
• | We recognized a loss of $1.7 million related to our share of Produquimica’s net loss from the date of acquisition through the second quarter of 2016, which includes $1.9 million related to adjustments for the impact of the fair value of assets acquired in excess of their book value. |
Other Income: Decreased from income of $9.0 million to a loss $1.6 million
• | The decrease was primarily due to lower foreign exchange gains of $8.0 million in 2016 and $2.2 million of expenses related to the refinancing of our credit facility in April 2016 and the additional term loan incurred in September 2016, which was used to acquire the remaining 65% of Produquímica’s equity in October 2016. |
Income Tax Expense: Decreased $17.5 million to $24.1 million
• | The decrease was primarily due to lower pre-tax income. |
• | Our income tax provision in both periods differs from the U.S. statutory rate primarily due to U.S. statutory depletion, domestic manufacturing deductions, state income taxes, foreign income, mining and withholding taxes and interest expense recognition differences for tax and financial reporting purposes. |
• | Our effective tax rate decreased from 29% in the first nine months of 2015 to 27% in the first nine months of 2016. |
23
Operating Segment Performance
The following financial results represent consolidated financial information with respect to sales from our salt and plant nutrition segments. Sales primarily include revenues from the sales of our products, or “product sales,” and the impact of shipping and handling costs incurred to deliver salt and plant nutrition products to our customers.
The results of operations of the consolidated records management business and other incidental revenues include sales of $2.4 million and $2.6 million for the third quarter of 2016 and 2015, respectively, and $7.5 million and $8.6 million for the first nine months of 2016 and 2015, respectively. These revenues are not material to our consolidated financial results and are not included in the following operating segment financial data.
SALT SEGMENT RESULTS THREE AND NINE MONTHS ENDED SEPTEMBER 30
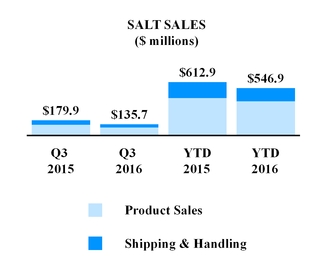
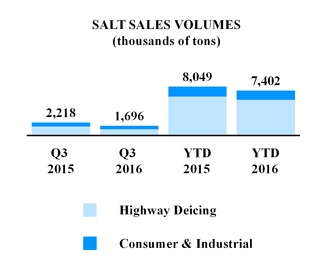
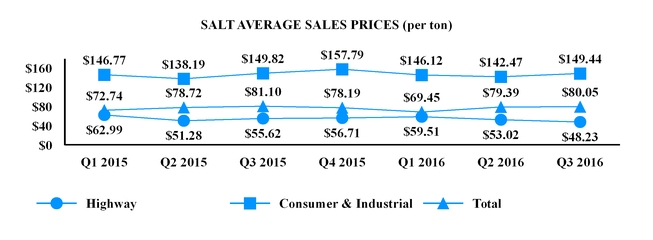
Salt Sales (in millions) | Q3 2016 | Q3 2015 | 2016 YTD | 2015 YTD | |||||||||||
Salt sales | $ | 135.7 | $ | 179.9 | $ | 546.9 | $ | 612.9 | |||||||
Less: salt shipping and handling | 33.3 | 48.5 | 147.7 | 178.1 | |||||||||||
Salt product sales | $ | 102.4 | $ | 131.4 | $ | 399.2 | $ | 434.8 | |||||||
Salt Sales Volumes (thousands of tons) | |||||||||||||||
Highway deicing | 1,162 | 1,618 | 5,944 | 6,476 | |||||||||||
Consumer and industrial | 534 | 600 | 1,458 | 1,573 | |||||||||||
Total tons sold | 1,696 | 2,218 | 7,402 | 8,049 | |||||||||||
Average Salt Sales Price (per ton) | |||||||||||||||
Highway deicing | $ | 48.23 | $ | 55.62 | $ | 56.15 | $ | 59.32 | |||||||
Consumer and industrial | $ | 149.44 | $ | 149.82 | $ | 146.23 | $ | 145.39 | |||||||
Combined | $ | 80.05 | $ | 81.10 | $ | 73.89 | $ | 76.14 | |||||||
24
COMMENTARY: THREE MONTHS ENDED SEPTEMBER 30, 2015 AND 2016
• | Salt sales were $135.7 million, a decrease of 25%, due to lower salt sales volumes and lower average salt selling prices. |
• | Salt average selling price decreased 1%, as the increased proportion of sales from higher-priced consumer and industrial products offset the decline in highway deicing average sales prices. |
• | Highway deicing average sales prices decreased 13%, primarily as a result of lower North American highway deicing contract prices, negative impacts of UK exchange rates and a higher mix of sales to chemical customers compared to the third quarter of 2015. |
• | Salt sales volumes decreased 522,000 tons, or 24%, and contributed approximately $33 million to the decline in salt segment product sales. Lower pre-season demand for bulk and packaged deicing products resulted in a 28% reduction in highway deicing sales volumes and an 11% decline in consumer and industrial sales volumes. |
• | Favorable logistics costs partially offset the decline in salt product sales. |
COMMENTARY: NINE MONTHS ENDED SEPTEMBER 30, 2015 AND 2016
• | Salt sales were $546.9 million, a decrease of 11%, primarily due to lower average salt selling prices, lower early fill volumes in the third quarter and mild winter weather in the first quarter of 2016 in the U.K. |
• | Salt average selling price decreased 3% due to lower highway deicing prices partially offset by higher consumer and industrial product mix. |
• | Salt sales volumes declined 647,000 tons, or 8%, due to lower highway and consumer deicing sales volumes, primarily as a result of mild winter weather experienced in the first quarter of 2016 in the U.K. when compared to the same period in the prior year. This decline in sales volumes contributed approximately $34 million to the decline in salt segment product sales. |
• | Salt sales volumes in North America were unfavorably impacted by lower highway deicing early fill volumes in the third quarter, which was partially offset by an increase in the first six months resulting from the fulfillment of contract volumes associated with the 2015-2016 bid season. |
• | A decrease of 3% in salt average selling prices contributed approximately $15 million to the decline in salt product sales and included unfavorable foreign currency exchange rates. |
• | Favorable logistics costs partially offset the decline in salt product sales. |
PLANT NUTRITION SEGMENT RESULTS THREE AND NINE MONTHS ENDED SEPTEMBER 30
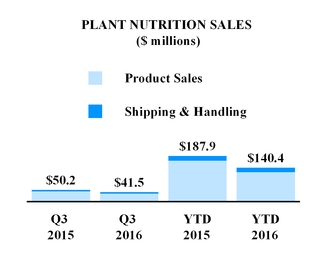
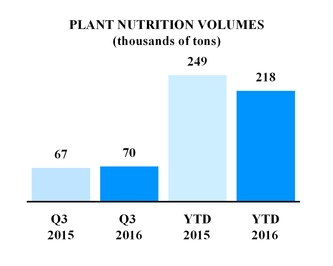
25
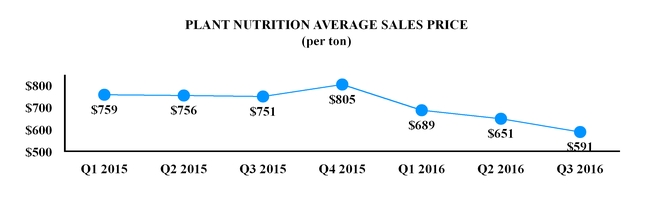
Plant Nutrition Sales (in millions) | Q3 2016 | Q3 2015 | 2016 YTD | 2015 YTD | |||||||||||
Plant nutrition sales | $ | 41.5 | $ | 50.2 | $ | 140.4 | $ | 187.9 | |||||||
Less: Plant nutrition shipping and handling | 5.1 | 4.7 | 17.2 | 17.8 | |||||||||||
Plant Nutrition product sales | $ | 36.4 | $ | 45.5 | $ | 123.2 | $ | 170.1 | |||||||
Plant Nutrition Sales Volumes (thousands of tons) | 70 | 67 | 218 | 249 | |||||||||||
Plant Nutrition Average Price (per ton) | $ | 591 | $ | 751 | $ | 645 | $ | 756 | |||||||
COMMENTARY: THREE MONTHS ENDED SEPTEMBER 30, 2015 AND 2016
• | Plant nutrition sales were $41.5 million, a decrease of 17%. |
• | The 21% decrease in plant nutrition average selling price contributed approximately $11 million to the decrease in plant nutrition product sales. The lower average selling prices resulted from price actions we initiated to increase demand. |
• | Plant nutrition sales volumes increased 3,000 tons, or 4%, and offset the decline in plant nutrition product sales by approximately $2 million. |
COMMENTARY: NINE MONTHS ENDED SEPTEMBER 30, 2015 AND 2016
• | Plant nutrition sales were $140.4 million, a decrease of 25%. |
• | The 15% decrease in plant nutrition average selling price contributed approximately $31 million to the decrease in plant nutrition product sales. |
• | Plant nutrition sales volumes declined 31,000 tons, or 12%, and contributed approximately $15 million to the decrease in plant nutrition product sales primarily due to the continued weak demand in the agriculture market. |
Outlook
• | The annual bidding process for North American highway deicing contracts has been completed and resulted in a decline of 7% in our awarded bid price when compared to our 2015-2016 bid season. |
• | Our awarded bid volume has declined approximately 15 percent compared to the prior bid season. We expect 2016 full-year salt sales volumes to range from 10.8 million tons to 11.1 million tons. |
• | We expect fourth quarter of 2016 plant nutrition sales volumes to exceed the sales volumes experienced in the fourth quarter of 2015. |
• | We continue to expect annual 2016 plant nutrition sales volumes in the range of 285,000 to 300,000 tons. |
• | We continue to expect to benefit from improved plant nutrition production costs in the fourth quarter of 2016, as we have sold our higher-cost, KCl-based inventory from 2015. |
• | We expect that the acquisition of Produquímica will contribute between R$60 million and R$70 million in adjusted EBITDA in the fourth quarter of 2016, based on a Brazilian Real-to-US$ exchange rate of R$3.25/US$1.00 and excluding any impact of purchase accounting adjustments. |
• | In February 2016, we announced steps to align our inventories with market demand, and we are undergoing a thorough review of our cost structure. This effort resulted in a restructuring charge in the first quarter of 2016 of $3.4 million, or $0.06 per diluted share, related to a workforce reduction of approximately 150 positions. A significant portion of this total results from our investment in continuous mining at our Goderich, Ontario location. We expect ongoing annualized savings of approximately $15 million beginning in 2018. |
26
Liquidity and Capital Resources
Historically, we have used cash generated from operations to meet our working capital needs, fund capital expenditures, pay dividends and repay our debt. Principally due to the nature of our deicing salt business, our cash flows from operations are seasonal with the majority of our cash flows from operations generated during the first half of the calendar year. When we have not been able to meet our short-term liquidity or capital needs with cash from operations, whether as a result of the seasonality of our business or other causes, we have met those needs with borrowings under our revolving credit facility. We expect to meet the ongoing requirements for debt service, any declared dividends and capital expenditures from these sources. To a certain extent, our ability to meet our short- and long-term liquidity and capital needs is subject to general economic, financial, competitive, legislative, regulatory, weather, effects of climate change, geological variations in our mine deposits and other factors that are beyond our control. For example, our Ogden, Utah, operations use a portion of the Great Salt Lake which currently has unusually low lake levels as a result of drought conditions that have been exacerbated by delays in the opening of a causeway that allows bi-directional water flows. If these conditions continue, we may incur increased capital expenditures.
In April 2016, we refinanced our existing $471 million term loans and $125 million revolving credit facility with a new $400 million senior secured term loan and a $300 million senior secured revolving credit facility, which both mature July 1, 2021. The new term loan and revolving credit facility bear interest at LIBOR plus 1.5% based on our current leverage ratio and credit rating. In connection with the refinancing, we paid $5.8 million of refinancing fees ($1.4 million was recorded as an expense and $4.4 million was capitalized as deferred financing costs) and wrote-off $0.1 million of existing deferred financing costs related to the previous term loans and revolving credit facility. In September 2016, we amended our credit facility to increase our senior secured term loan by $450 million. This additional tranche will mature July 1, 2021, and bears interest at LIBOR plus 2.0%. In connection with this transaction, we incurred $2.2 million of financing fees ($0.7 million was recorded as an expense and $1.5 million was capitalized as deferred financing costs). Proceeds of this additional tranche were used to fund the acquisition of the remaining 65% of Produquímica’s equity in October 2016.
Cash and cash equivalents of $432.2 million as of September 30, 2016, increased $373.8 million over December 31, 2015, due to increased borrowings under our credit facility to fund the acquisition of Produquímica. We generated $107.1 million of operating cash flows in the first nine months of 2016. In the first nine months of 2016, we used cash on hand and cash flows from operations to fund capital expenditures of $148.7 million and to pay dividends on our common stock of $70.5 million.
As of September 30, 2016, we had $1,212.6 million of indebtedness, net of deferred financing costs, consisting of $246.8 million outstanding under our 4.875% senior notes due July 2024, $843.8 million outstanding under our term loans and $122.0 million outstanding under our revolving credit facility. We had $6.2 million of outstanding letters of credit as of September 30, 2016, which reduced our revolving credit facility borrowing availability to $171.8 million.
Our debt service obligations could, under certain circumstances, materially affect our financial condition and impair our ability to operate our business or pursue our business strategies. As a holding company, CMI’s investments in its operating subsidiaries constitute substantially all of its assets. Consequently, our subsidiaries conduct substantially all of our consolidated operating activities and own substantially all of our operating assets. The principal source of the cash needed to pay our obligations is the cash generated from our subsidiaries’ operations and their borrowings. Our subsidiaries are not obligated to make funds available to CMI. Furthermore, we must remain in compliance with the terms of our credit agreement governing our term loans and revolving credit facility, including the total leverage ratio and interest coverage ratio, in order to make payments on our debt or pay dividends to our stockholders. We must also comply with the terms of our indenture governing our senior notes. Although we are in compliance with our debt covenants as of September 30, 2016, we can make no assurance that we will remain in compliance with these ratios nor can we make any assurance that the agreements governing the current and future indebtedness of our subsidiaries will permit our subsidiaries to provide us with sufficient dividends, distributions or loans to fund scheduled interest payments on our debt when due. If we consummate an additional acquisition, our debt service requirements could increase. Furthermore, we may need to refinance all or a portion of our indebtedness on or before maturity; however, we cannot provide assurance that we will be able to refinance any of our indebtedness on commercially reasonable terms or at all.
We have been able to manage our cash flows generated and used across Compass Minerals to permanently reinvest earnings in our foreign jurisdictions or efficiently repatriate those funds to the U.S. As of September 30, 2016, we had $30.6 million of cash and cash equivalents (in our consolidated balance sheets) that was either held directly or indirectly by foreign subsidiaries. Due in large part to the seasonality of our deicing salt business, we experience large changes in our working capital requirements from quarter to quarter. Typically, our consolidated working capital requirements are the highest in the fourth quarter and lowest in the second quarter. When needed, we fund short-term working capital requirements by accessing our revolving credit facility. Due to our ability to generate adequate levels of domestic cash flow on an annual basis, it is our current intention to permanently reinvest our foreign earnings outside of the U.S. However, if we were to repatriate our foreign earnings to the U.S., we may be required
27
to accrue and pay U.S. taxes in accordance with the applicable U.S. tax rules and regulations as a result of the repatriation. We review our tax circumstances on a regular basis with the intent of optimizing cash accessibility and minimizing tax expense.
In addition, the amount of permanently reinvested earnings is influenced by, among other things, the profits generated by our foreign subsidiaries and the amount of investment in those same subsidiaries. The profits generated by our domestic and foreign subsidiaries are, to some extent, impacted by the values charged on the transfer of our products between them. We calculate values charged on transfers based on guidelines established by a multi-national organization which publishes accepted tax guidelines recognized in all of the jurisdictions in which we operate, and those calculated values are the basis upon which our subsidiary income taxes, profits and cash flows are realized. Some of our calculated values have been approved by taxing authorities for certain periods, while the values for those same periods or different periods have been challenged by the same or other taxing authorities. While we believe our calculations are proper and consistent with the accepted guidelines, we can make no assurance that the final resolution of these matters with all of the relevant taxing authorities will be consistent with our existing calculations and resulting financial statements. Additionally, the timing for settling these challenges may not occur for many years. We currently expect the outcome of these matters will not have a material impact on our results of operations. However, it is possible the resolution could impact the amount of earnings attributable to our domestic and foreign subsidiaries, which could impact the amount of permanently reinvested earnings and the tax-efficient access to consolidated cash on hand in all jurisdictions, as well as future cash flows from operations.
See Note 6 to our Consolidated Financial Statements for a discussion regarding our Canadian tax reassessments. See Note 8 to our Consolidated Financial Statements for a discussion regarding labor, environmental and litigation matters.
In December 2015, we completed the acquisition of a 35% equity stake in Produquímica, one of Brazil’s leading manufacturers and distributors of specialty plant nutrients. The purchase price for this all-cash transaction was R$452.4 million Brazilian Reais (or $114.1 million U.S. dollars at closing), subject to customary post-closing adjustments. Of the 35% equity stake, 6% consisted of common shares and the remaining 29% consisted of preferred shares that converted to common shares upon the settlement of certain post-closing adjustments, including additional consideration that was paid by us based upon Produquímica’s 2015 financial performance. The additional consideration of $4.7 million U.S. dollars was paid in the second quarter of 2016 and was recorded as an increase in investment in equity investee in our consolidated financial statements.
In October 2016, we completed the acquisition of the remaining 65% of Produquímica’s equity. The purchase price for this all-cash transaction was R$1,066 million Brazilian Reais (or $331.9 million U.S. dollars at closing), subject to customary post-closing adjustments. As a result of the transaction, we assumed approximately R$445 million Brazilian Reais (or $138.5 million U.S. dollars at closing) in net debt (inclusive of cash on hand at closing). During the fourth quarter of 2016, we expect to retire a portion of the debt assumed.
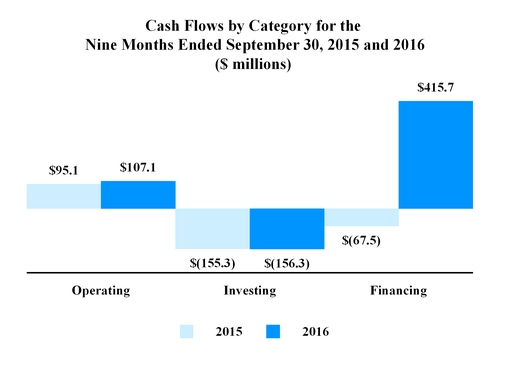
28
NINE MONTHS ENDED SEPTEMBER 30, 2016 | NINE MONTHS ENDED SEPTEMBER 30, 2015 |
Operating Activities: | |
» Net earnings were $65.1 million. » Non-cash depreciation and amortization expense was $62.7 million. » Working capital items were a use of operating cash flows of $22.7 million. | » Net earnings were $100.8 million. » Non-cash depreciation and amortization expense was $57.8 million. » Working capital items were a use of operating cash flows of $73.8 million. |
Investing Activities: | |
» Net cash flows used by investing activities included $148.7 million of capital expenditures and an additional investment in Produquímica of $4.7 million. | » Net cash flows used by investing activities included $154.4 million of capital expenditures. |
Financing Activities: | |
» Net cash flows used by financing activities included the payment of dividends of $70.5 million. » In addition, we had net proceeds from issuance of debt of $493.0 million, payments of $7.3 million related to the refinancing of our credit facility in April and September 2016 and proceeds from stock option exercises of $0.7 million. | » Net cash flows used by financing activities included the payment of dividends of $67.0 million. » In addition, we had net payments on long-term debt of $2.9 million and proceeds from stock option exercises of $2.3 million. |
Sensitivity Analysis Related to EBITDA and Adjusted EBITDA
Management uses a variety of measures to evaluate the performance of Compass Minerals. While the consolidated financial statements, taken as a whole, provide an understanding of our overall results of operations, financial condition and cash flows, we analyze components of the consolidated financial statements to identify certain trends and evaluate specific performance areas. In addition to using GAAP financial measures, such as gross profit, net earnings and cash flows generated by operating activities, management uses EBITDA and EBITDA adjusted for items which management believes are not indicative of our ongoing operating performance (“Adjusted EBITDA”). Both EBITDA and Adjusted EBITDA are non-GAAP financial measures used to evaluate the operating performance of our core business operations. Our resource allocation, financing methods, cost of capital and income tax positions are managed at a corporate level, apart from the activities of the operating segments. In addition, the operating facilities are located in different taxing jurisdictions, which can cause considerable variation in net earnings. We also use EBITDA and Adjusted EBITDA to assess our operating performance and return on capital and to evaluate potential acquisitions or other capital projects. EBITDA and Adjusted EBITDA are not calculated under GAAP and should not be considered in isolation or as a substitute for net earnings, cash flows or other financial data prepared in accordance with GAAP or as a measure of our overall profitability or liquidity. EBITDA and Adjusted EBITDA exclude interest expense, income taxes and depreciation and amortization, each of which are an essential element of our cost structure and cannot be eliminated. Furthermore, Adjusted EBITDA excludes other cash and non-cash items in other (income) expense. Our borrowings are a significant component of our capital structure and interest expense is a continuing cost of debt. We are also required to pay income taxes, a required and ongoing consequence of our operations. We have a significant investment in capital assets and depreciation and amortization reflect the utilization of those assets in order to generate revenues. Consequently, any measure that excludes these elements has material limitations. While EBITDA and Adjusted EBITDA are frequently used as measures of operating performance, these terms are not necessarily comparable to similarly titled measures of other companies due to the potential inconsistencies in the method of calculation. The calculation of EBITDA and Adjusted EBITDA as used by management is set forth in the table below (in millions).
Three Months Ended September 30, | Nine Months Ended September 30, | ||||||||||||||
2016 | 2015 | 2016 | 2015 | ||||||||||||
Net earnings | $ | 9.1 | $ | 27.0 | $ | 65.1 | $ | 100.8 | |||||||
Interest expense | 5.4 | 5.4 | 16.8 | 16.1 | |||||||||||
Income tax expense | 3.1 | 12.7 | 24.1 | 41.6 | |||||||||||
Depreciation, depletion and amortization | 21.8 | 19.6 | 62.7 | 57.8 | |||||||||||
EBITDA | 39.4 | 64.7 | 168.7 | 216.3 | |||||||||||
Adjustments to EBITDA: | |||||||||||||||
Other (income) expense, net | 1.5 | (4.3 | ) | 1.6 | (9.0 | ) | |||||||||
Adjusted EBITDA | $ | 40.9 | $ | 60.4 | $ | 170.3 | $ | 207.3 | |||||||
29
Recent Accounting Pronouncements
See Note 1 to our Consolidated Financial Statements for a discussion of recent accounting pronouncements.
Effects of Currency Fluctuations
We conduct operations in Canada and the U.K. As of September 30, 2016, we also had an equity investment in Produquímica, a Brazilian corporation. Therefore, our results of operations are subject to both currency transaction risk and currency translation risk. We incur currency transaction risk whenever we or one of our subsidiaries enter into either a purchase or sales transaction using a currency other than the local currency of the transacting entity. With respect to currency translation risk, our financial condition and results of operations are measured and recorded in the relevant local currency and then translated into U.S. dollars for inclusion in our historical consolidated financial statements. Exchange rates between these currencies and the U.S. dollar have fluctuated significantly from time to time and may do so in the future. As of September 30, 2016, the majority of our revenues and costs is denominated in U.S. dollars, with British pounds sterling and Canadian dollars also being significant. Significant changes in the value of the Canadian dollar, British pound sterling or Brazilian real relative to the U.S. dollar could have a material effect on our financial condition.
Although inflation has not had a significant impact on our operations, our efforts to recover cost increases due to inflation may be hampered as a result of the competitive industries in which we operate.
Seasonality
We experience a substantial amount of seasonality in our sales, primarily with respect to our deicing products. Consequently, sales and operating income are generally higher in the first and fourth quarters and lower during the second and third quarters of each year. In particular, sales of highway and consumer deicing salt and magnesium chloride products vary based on the severity of the winter conditions in areas where the product is used. Following industry practice in North America and the U.K., we seek to stockpile sufficient quantities of deicing salt throughout the second, third and fourth quarters to meet the estimated requirements for the upcoming winter season.
Item 3. Quantitative and Qualitative Disclosures About Market Risk
Our business is subject to various types of market risks that include interest rate risk, foreign currency exchange rate risk and commodity pricing risk. Management has taken actions to mitigate our exposure to commodity pricing by entering into forward derivative instruments and may take further actions to mitigate our exposure to interest rates, exchange rates and changes in the cost of transporting our products due to variations in our contracted carriers’ cost of fuel, which is typically diesel fuel. However, there can be no assurance that our hedging activities will eliminate or substantially reduce these risks. We do not enter into any financial instrument arrangements for speculative purposes. Our market risk exposure related to these items has not changed materially since December 31, 2015.
Item 4. Controls and Procedures
Evaluation of Disclosure Controls and Procedures
As of the end of the period covered by this Quarterly Report on Form 10-Q, an evaluation of the effectiveness of the design and operation of the Company’s disclosure controls and procedures (as defined in Rule 13a-15(e) under the Securities Exchange Act of 1934, as amended (the “Exchange Act”)) was performed under the supervision and with the participation of the Company’s management, including the Chief Executive Officer and Chief Financial Officer. Based on that evaluation, the Company’s Chief Executive Officer and Chief Financial Officer concluded that the Company’s disclosure controls and procedures were effective as of September 30, 2016, to ensure that information required to be disclosed in the reports it files and submits under the Exchange Act is recorded, processed, summarized and reported within the time periods specified in the SEC’s rules and forms.
For this purpose, disclosure controls and procedures include controls and procedures designed to ensure that information that is required to be disclosed under the Exchange Act is accumulated and communicated to the Company’s management, including the Chief Executive Officer and Chief Financial Officer, as appropriate to allow timely decisions regarding required disclosure.
30
Changes in Internal Control Over Financial Reporting
There has been no change in the Company’s internal control over financial reporting during the most recently completed fiscal quarter that has materially affected, or is reasonably likely to materially affect, the Company’s internal control over financial reporting.
PART II. OTHER INFORMATION
Item 1. | Legal Proceedings |
We are involved in the legal proceedings described in Note 8 to our Consolidated Financial Statements and, from time to time, various routine legal proceedings arising from the ordinary course of our business. These primarily involve commercial claims, product liability claims, personal injury claims and workers’ compensation claims. Management cannot predict the outcome of legal proceedings and claims with certainty. Nevertheless, management believes that the outcome of legal proceedings and claims, which are pending or known to be threatened, even if determined adversely, will not, either individually or in the aggregate, have a material adverse effect on our results of operations, cash flows or financial condition. There have been no material developments since December 31, 2015, with respect to our legal proceedings.
Item 1A. | Risk Factors |
For a discussion of the risk factors applicable to Compass Minerals, please refer to Part I, Item 1A. “Risk Factors” in our Annual Report on Form 10-K for the year ended December 31, 2015. There have been no material changes to our risk factors as disclosed in such Annual Report.
Item 2. | Unregistered Sales of Equity Securities and Use of Proceeds |
None.
Item 3. | Defaults Upon Senior Securities |
None.
Item 4. | Mine Safety Disclosures |
Information concerning mine safety violations or other regulatory matters required by Section 1503(a) of the Dodd-Frank Wall Street Reform and Consumer Protection Act and Item 104 of Regulation S-K is included in Exhibit 95 to this Quarterly Report on Form 10-Q.
Item 5. | Other Information |
None.
Item 6. | Exhibits |
The Exhibit Index attached to this Quarterly Report on Form 10-Q is incorporated herein by reference.
31
SIGNATURES
Pursuant to the requirements of the Securities Exchange Act of 1934, the registrant has duly caused this report to be signed on its behalf by the undersigned, thereunto duly authorized.
COMPASS MINERALS INTERNATIONAL, INC. | |||
Date: October 25, 2016 | By: | /s/ MATTHEW J. FOULSTON | |
Matthew J. Foulston | |||
Chief Financial Officer | |||
(Principal Financial and Accounting Officer) | |||
32
EXHIBIT INDEX
Exhibit No. | Exhibit Description | |
2.1 | Second Amendment, dated August 12, 2016, to the Subscription Agreement and Other Covenants, dated December 16, 2015, among Compass Minerals do Brasil Ltda., certain shareholders of Produquímica Indústria e Comércio S.A. and Produquímica Indústria e Comércio S.A. (incorporated herein by reference to Exhibit 2.1 to Compass Minerals International Inc.’s Current Report on Form 8-K filed on August 15, 2016). | |
10.1 | Incremental Amendment, dated September 28, 2016, to the Credit Agreement, dated April 20, 2016, among Compass Minerals International, Inc., Compass Minerals Canada Corp. and Compass Minerals UK Limited, JPMorgan Chase Bank, N.A., as administrative agent, and the lenders party thereto (incorporated herein by reference to Exhibit 10.1 to Compass Minerals International Inc.’s Current Report on Form 8-K filed on September 28, 2016). | |
31.1* | Section 302 Certifications of Francis J. Malecha, President and Chief Executive Officer. | |
31.2* | Section 302 Certifications of Matthew J. Foulston, Chief Financial Officer. | |
32** | Certification Pursuant to 18 U.S.C. §1350 of Francis J. Malecha, President and Chief Executive Officer, and Matthew J. Foulston, Chief Financial Officer. | |
95* | Mine Safety Disclosures. | |
101** | The following financial statements from the Company’s Quarterly Report on Form 10-Q for the quarter ended September 30, 2016, formatted in Extensive Business Reporting Language (XBRL): (i) consolidated balance sheets, (ii) consolidated statements of operations, (iii) consolidated statements of comprehensive income (loss), (iv) consolidated statement of stockholders’ equity, (v) consolidated statements of cash flows, and (vi) the notes to the consolidated financial statements. | |
* | Filed herewith |
** | Furnished herewith |
33