Attached files
| file | filename |
|---|---|
| 8-K - TMUS FORM 8-K - T-Mobile US, Inc. | tmus09302016form8-k.htm |
| EX-99.1 - TMUS EXHIBIT 99.1 - T-Mobile US, Inc. | tmus09302016ex991.htm |
EXHIBIT 99.2

1
T-Mobile US, Inc. | ||
Investor Factbook | ||
T-Mobile US Reports Third Quarter 2016 Results | ||
2.0 Million Customer Net Adds Translate into 13% Service Revenue Growth, $366 Million in Net Income and $2.6 Billion in Adjusted EBITDA | ||
Third Quarter 2016 Highlights: | ||
The fastest growing wireless company in America: | ||
n 2.0 million total net adds - 14th consecutive quarter of over 1 million | ||
n 851,000 branded postpaid phone net adds - industry leader in net adds for the 11th consecutive quarter | ||
n 684,000 branded prepaid net adds - 2nd best quarterly net adds performance in Company history | ||
n 1.32% branded postpaid phone churn* - down 14 bps YoY | ||
Customer growth continues to drive industry-leading financial growth: | ||
n $7.1 billion service revenues, up 13.2% YoY - industry leader in growth for 10th consecutive quarter | ||
n $9.2 billion total revenues, up 17.8% YoY - industry leader in growth for 13th time in past 14 quarters | ||
n $366 million net income, up 165% YoY - 5.1% as a percentage of service revenues. Third quarter 2016 includes | ||
$122 million in spectrum gains. | ||
n $0.42 EPS, up $0.27 YoY. Third quarter 2016 includes $0.15 in spectrum gains. | ||
n $2.6 billion Adjusted EBITDA**, up 37.8% YoY - 37% Adjusted EBITDA margin***. Third quarter 2016 includes | ||
$199 million in spectrum gains. | ||
America's fastest and fastest growing 4G LTE network - 312 million POPs covered - 99.7% of Verizon | ||
Raising customer outlook and narrowing Adjusted EBITDA target for 2016: | ||
n Guidance range for branded postpaid net adds increased to 3.7 to 3.9 million from 3.4 to 3.8 million | ||
n Net income is not available on a forward looking basis**** | ||
n Raising and narrowing Adjusted EBITDA target to $10.2 to $10.4 billion from $9.8 to $10.1 billion | ||
n Narrowing cash capital expenditures guidance to $4.5 to $4.7 billion from $4.5 to $4.8 billion | ||
* Includes impact of the MVNO Transaction completed September 1, 2016. | ||
**Adjusted EBITDA is a non-GAAP financial measure and should be considered in addition to, but not as a | ||
substitute for, the information provided in accordance with GAAP. Reconciliations for the non-GAAP financial | ||
measures to the most directly comparable GAAP financial measures are provided in the financial tables. | ||
*** Calculated as Adjusted EBITDA divided by service revenues. | ||
**** T-Mobile is not able to forecast net income on a forward looking basis without unreasonable efforts due to the | ||
high variability and difficulty in predicting certain items that affect GAAP net income including, but not limited to, | ||
income tax expense, stock based compensation expense, interest expense and interest income. | ||
2
Total Branded Postpaid Net Adds
(in thousands)
Branded Postpaid Phone Churn
CUSTOMER METRICS
Branded Postpaid Customers
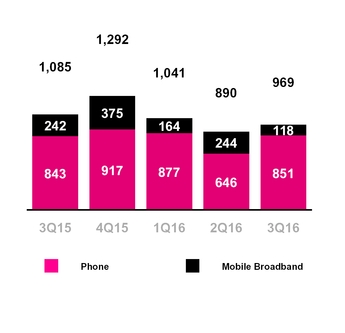
▪ | Branded postpaid phone net customer additions were 851,000 in the third quarter of 2016, compared to 646,000 in the second quarter of 2016 and 843,000 in the third quarter of 2015. T-Mobile expects to again lead the industry in branded postpaid phone net customer additions for the 11th consecutive quarter. |
▪ | The sequential increase was primarily due to the introduction of the T-Mobile ONE plans, the launch of the iPhone 7 in the quarter and an increase in branded prepaid customer migrations to postpaid plans. |
▪ | The year-over-year increase was primarily due to an increase in branded prepaid customer migrations to postpaid plans and lower churn. |
▪ | Branded postpaid mobile broadband net customer additions were 118,000 in the third quarter of 2016, compared to 244,000 in the second quarter of 2016 and 242,000 in the third quarter of 2015. |
▪ | Branded postpaid net customer additions were 969,000 in the third quarter of 2016 compared to 890,000 in the second quarter of 2016 and 1,085,000 in the third quarter of 2015. |
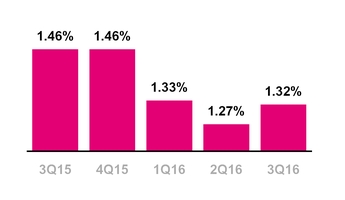
▪ | Branded postpaid phone churn was 1.32% in the third quarter of 2016, up 5 basis points from 1.27% in the second quarter of 2016 and down 14 basis points from 1.46% in the third quarter of 2015. |
▪ | On September 1, 2016, T-Mobile sold its marketing and distribution rights to certain existing T-Mobile co-branded customers to a current MVNO partner for nominal consideration. The sale resulted in a re-categorization of 1.365 million branded postpaid phone customers and 326,000 branded prepaid customers to wholesale customers (the "MVNO Transaction"). The reported branded postpaid phone churn of 1.32% in the third quarter of 2016 reflects the transfer of the MVNO Transaction customers prospectively from September 1, 2016. |
▪ | The sequential increase in reported branded postpaid phone churn reflects typical seasonality, partially offset by the MVNO Transaction. Year-over-year, branded postpaid phone churn was lower as a result of the MVNO Transaction as well as increased customer satisfaction and loyalty from ongoing improvements to network quality, customer service, and the overall value of the Company's offerings in the marketplace. |
▪ | On a pro-forma basis, had the MVNO Transaction closed on July 1, 2016, reported branded postpaid phone churn would have been 1.20% in the third quarter of 2016. |
3
Total Branded Prepaid Net Adds
(in thousands)
Branded Prepaid Churn
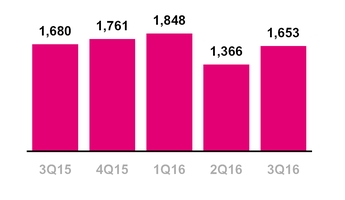
Total Branded Net Adds
(in thousands)
Branded Prepaid Customers
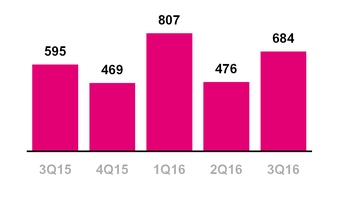
▪ | Branded prepaid net customer additions were 684,000 in the third quarter of 2016, compared to 476,000 in the second quarter of 2016 and 595,000 in the third quarter of 2015. This marked the second best quarterly branded prepaid net customer additions performance in T-Mobile's history. The sequential and year-over-year increase was primarily driven by successful MetroPCS promotional activities and continued growth in new markets, partially offset by branded prepaid customer migrations to branded postpaid plans. |
▪ | Migrations to branded postpaid plans reduced branded prepaid net customer additions in the third quarter of 2016 by approximately 250,000, up from 210,000 in the second quarter of 2016 and 185,000 in the third quarter of 2015. |
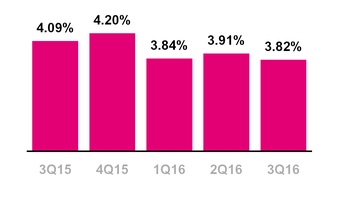
▪ | Branded prepaid churn was 3.82% in the third quarter of 2016, compared to 3.91% in the second quarter of 2016 and 4.09% in the third quarter of 2015. The sequential and year-over-year decline was primarily impacted by a decrease in certain customers, which had a higher rate of branded prepaid churn, as well as strong performance of the MetroPCS brand. |
Total Branded Customers
▪ | Total branded net customer additions were 1,653,000 in the third quarter of 2016 compared to 1,366,000 in the second quarter of 2016 and 1,680,000 in the third quarter of 2015. This was the 11th consecutive quarter in which branded net customer additions surpassed the one million milestone. |
4
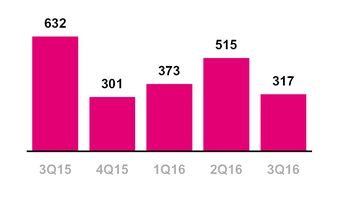
Wholesale Net Adds
(in thousands)
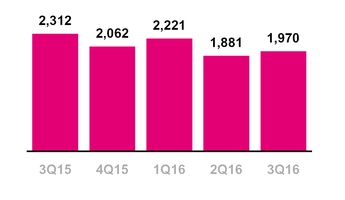
Total Net Adds
(in thousands)
Wholesale Customers
▪ | Wholesale net customer additions were 317,000 in the third quarter of 2016 compared to 515,000 in the second quarter of 2016 and 632,000 in the third quarter of 2015. |
Total Customers
▪ | Total net customer additions were 1,970,000 in the third quarter of 2016 compared to 1,881,000 in the second quarter of 2016 and 2,312,000 in the third quarter of 2015. This was the 14th consecutive quarter in which total net customer additions exceeded one million. |
▪ | T-Mobile ended the third quarter of 2016 with 69.4 million total customers. |
5
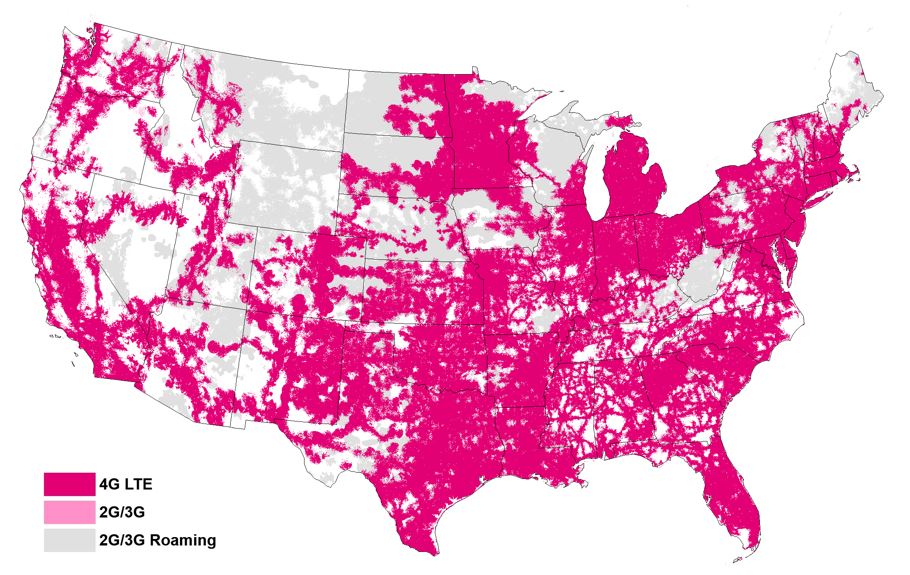
T-Mobile Coverage Map
(as of September 30, 2016)
NETWORK
Network Modernization Update
▪ | T-Mobile has built the nation’s densest, highest-capacity LTE network, with more spectrum and cell sites per customer than either Verizon or AT&T. T-Mobile is also leading the industry in technology advancements such as Voice over LTE ("VoLTE"), Carrier Aggregation, 4x4 MIMO, and 256 Quadrature Amplitude Modulation ("QAM") to continue to improve the network performance for all of its customers. |
▪ | T-Mobile continues to expand its coverage breadth and currently provides 4G LTE coverage to 312 million people, up from zero 4G LTE coverage just over three years ago. T-Mobile now has effective population coverage parity with Verizon, reaching 99.7% of the consumers Verizon does with 4G LTE. |
▪ | T-Mobile is also improving its coverage depth with Wideband LTE, which is available nationwide, covering 231 million people. Wideband LTE refers to markets that have bandwidth of at least 15+15 MHz dedicated to 4G LTE. |
▪ | VoLTE comprised approximately 61% of total voice calls in the third quarter of 2016 compared to 16% in the third quarter of 2015. Moving voice traffic to VoLTE frees up capacity and allows for an accelerated re-farming of spectrum currently used for 2G and 3G. T-Mobile is leading the US wireless industry in terms of VoLTE migration. |
▪ | Carrier aggregation is live for T-Mobile customers in 535 cities. This advanced technology delivers superior speed and performance by bonding two or three discrete spectrum channels together. |
▪ | 4x4 MIMO is currently available in 319 cities. This technology effectively delivers twice the speed to customers by doubling the number of data paths between the cell site and a customer's device. |
▪ | 256 QAM will be extended to nearly every cell site in the T-Mobile network later this month. This technology increases the number of bits delivered per transmission to enable faster speed. |
6
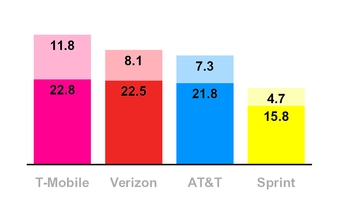
Average 4G LTE Download and
Upload Speeds - 3Q16
(in Mbps, D/L at Base, U/L at Top)
Based on T-Mobile's analysis of crowd-sourced 4G LTE download and upload speeds.
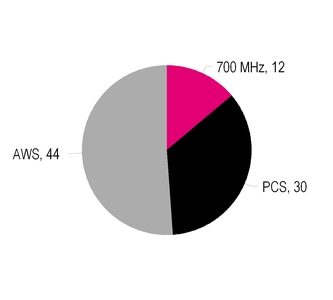
T-Mobile Average Spectrum
Ownership, Top 25 Markets
(Band, in MHz)
Network Speed
▪ | T-Mobile continues to have the fastest nationwide 4G LTE network in the U.S. based on both download and upload speeds from millions of user-generated tests. This is the eleventh consecutive quarter that T-Mobile has led the industry in both average download speeds and average upload speeds. |
▪ | In the third quarter of 2016, T-Mobile’s average 4G LTE download speed was 22.8 Mbps compared to Verizon at 22.5 Mbps, AT&T at 21.8 Mbps, and Sprint at 15.8 Mbps. |
▪ | In the third quarter of 2016, T-Mobile's average 4G LTE upload speed was 11.8 Mbps compared to Verizon at 8.1 Mbps, AT&T at 7.3 Mbps, and Sprint at 4.7 Mbps. |
Spectrum
▪ | At the end of the third quarter of 2016, T-Mobile owns or has agreements to own an average of 86 MHz of spectrum across the top 25 markets in the U.S. The spectrum is comprised of an average of 12 MHz in the 700 MHz band, 30 MHz in the 1900 MHz PCS band, and 44 MHz in the AWS band. |
▪ | During the third quarter of 2016, T-Mobile closed on several previously announced transactions that increased its low-band spectrum holdings to 260 million POPs, including the cities of Nashville, Salt Lake City, and Columbus. T-Mobile expects to close on additional previously announced transactions, including Chicago and Eastern Montana, in the fourth quarter of 2016, bringing its total low-band spectrum holdings to 272 million POPs upon closing. |
A-Block Update
▪ | T-Mobile owns or has agreements to acquire 700 MHz A-Block spectrum covering 272 million people or approximately 84% of the U.S. population. The spectrum covers all of the top 10 market areas and 29 of the top 30 market areas in the U.S. |
▪ | T-Mobile has deployed its 700 MHz A-Block spectrum in 366 market areas covering more than 225 million people under the brand name “Extended Range LTE.” Extended Range LTE travels up to twice as far as mid-band spectrum and works up to four times better in buildings. T-Mobile expects to continue to aggressively roll-out new 700 MHz sites in 2016 including Phoenix, San Diego, and Las Vegas. |
7
UN-CARRIER INITIATIVES
Un-carrier Updates
▪ | Un-carrier 12: T-Mobile ONE: On September 1, 2016, T-Mobile ended the era of tiered data rate plans by introducing T-Mobile ONE: a simple Unlimited offer that allows customers to use their devices without ever worrying about data limits. Everyone on the T-Mobile ONE plan gets unlimited calls, unlimited text, and unlimited high-speed 4G LTE data on their device on the fastest LTE network in America. On T-Mobile ONE, video typically streams at DVD (480p) quality and tethering is at maximum 3G speeds. Since launch, approximately 80% of new postpaid phone account activations have selected the T-Mobile ONE plans. |
▪ | T-Mobile ONE Plus: T-Mobile amped up Un-carrier 12 by creating T-Mobile ONE Plus, a premium offer that provides unlimited high-speed 4G LTE mobile hotspot data, unlimited High Definition (HD) Day Passes, and up to two times faster speeds when traveling abroad in 140+ countries and destinations. |
▪ | Un-carrier 11: T-Mobile Tuesdays: During the third quarter of 2016, T-Mobile continued to thank its customers with T-Mobile Tuesdays, a program that thanks all of our eligible customers with free stuff and a chance to win epic prizes every Tuesday. Since T-Mobile Tuesdays launched, the app was ranked up to #1 on the Apple App Store, and customers have hit the redemption button 17 million times to receive their gifts. Recent partners included in T-Mobile Tuesdays include Subway, Buffalo Wild Wings, PetSmart, and Shell. |
Devices Sold or Leased | ||||||
(in million units) | ||||||
3Q15 | 2Q16 | 3Q16 | ||||
Total Company | ||||||
Smartphones | 8.1 | 8.1 | 8.7 | |||
Non-Smartphones | 0.3 | 0.3 | 0.1 | |||
Mobile Broadband Devices | 0.5 | 0.5 | 0.4 | |||
Total Company | 8.9 | 8.9 | 9.2 | |||
DEVICES
▪ | Total devices sold or leased were 9.2 million units in the third quarter of 2016 compared to 8.9 million units in the second quarter of 2016 and 8.9 million units in the third quarter of 2015. |
▪ | Total smartphones sold or leased were 8.7 million units in the third quarter of 2016 compared to 8.1 million units in the second quarter of 2016 and 8.1 million units in the third quarter of 2015. |
▪ | The upgrade rate for branded postpaid customers was approximately 7% in the third quarter of 2016 compared to approximately 6% in the second quarter of 2016 and approximately 9% in the third quarter of 2015. |
8
▪ | During the quarter ended and subsequent to September 30, 2016, a handset Original Equipment Manufacturer (“OEM”) announced recalls on certain of its smartphone devices. As a result, T-Mobile recorded no revenue associated with the device sales to customers and impaired the devices to their |
net realizable value. The OEM has agreed to reimburse T-Mobile for these costs.
▪ | Device unit volumes in the third quarter of 2016 reflect the reversal of all the recalled devices sold or leased during the period. |
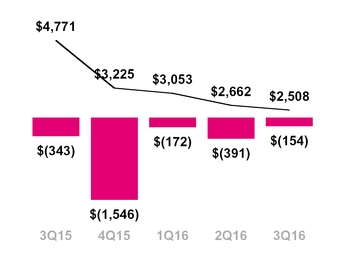
Total EIP Receivables, net and QoQ
Change in Total EIP Receivables
($ in millions)
DEVICE FINANCING
Equipment Installment Plans (EIP)
▪ | T-Mobile provided $1.372 billion in gross EIP device financing to its customers in the third quarter of 2016, down 12.2% from $1.562 billion in the second quarter of 2016 and up 23.9% from $1.107 billion in the third quarter of 2015. The sequential decrease was primarily due to a lower average gross amount financed per device on EIP, partially offset by a higher number of device sales under the EIP program. The year-over-year increase was primarily due to a higher level of device sales under the EIP program in the third quarter of 2016. |
▪ | Customers on T-Mobile plans had associated EIP billings of $1.394 billion in the third quarter of 2016, up 3.7% compared to $1.344 billion in the second quarter of 2016 and down 1.1% from $1.409 billion in the third quarter of 2015. The sequential increase was primarily due to a higher level of devices financed using EIP plans. The year-over-year decline was primarily due to the impact of the JUMP! On Demand leasing program launched at the end of the second quarter 2015. |
▪ | Total EIP receivables, net of imputed discount and allowances for credit losses, was $2.508 billion at the end of the third quarter of 2016 compared to $2.662 billion at the end of the second quarter of 2016 and $4.771 billion at the end of the third quarter of 2015. The sequential decline in the total EIP receivables, net was primarily due to continued growth in EIP billings as well as a decline in the gross amount of equipment financed on EIP during the quarter. The year-over-year decline in the total EIP receivables, net was primarily due to sales of certain EIP receivables and the impact of the JUMP! On Demand leasing program launched at the end of the second quarter of 2015. |
9
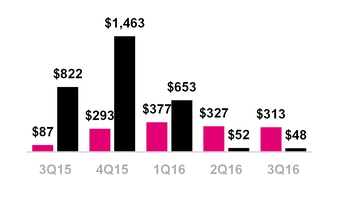
Leased Devices Transferred to P&E,
net and Original Consideration
Received & Lease Revenues, Net
($ in millions)
Leasing Plans
▪ | Leased devices transferred from inventory to property and equipment, net was $48 million in the third quarter of 2016 compared to $52 million in the second quarter of 2016 and $822 million in the third quarter of 2015. The year-over-year decline was primarily due to the continued mix shift back to the EIP program, which started in the first quarter of 2016. |
▪ | Depreciation expense associated with leased devices was $367 million in the third quarter of 2016 compared to $397 million in the second quarter of 2016 and $58 million in the third quarter of 2015. |
▪ | Leased devices included in property and equipment, net were $1.559 billion at the end of the third quarter of 2016 compared to $1.878 billion at the end of the second quarter of 2016 and $764 million at the end of the third quarter of 2015. |
▪ | Lease revenues were $353 million in the third quarter of 2016 compared to $367 million in the second quarter of 2016 and $30 million in the third quarter of 2015. |
▪ | Future minimum lease payments expected to be received over the lease term were $924 million at the end of the third quarter of 2016, down from $1.178 billion at the end of the second quarter of 2016 and up from $439 million at the end of the third quarter of 2015. Future minimum lease payments exclude optional residual buy-out amounts at the end of the lease term. |
Total Bad Debt Expense and Losses from Sales of Receivables
($ in millions, % of Total Revs)
CUSTOMER QUALITY
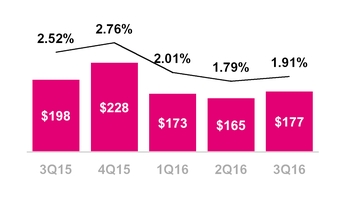
▪ | Total bad debt expense and losses from sales of receivables was $177 million in the third quarter of 2016 compared to $165 million in the second quarter of 2016 and $198 million in the third quarter of 2015. |
▪ | As a percentage of total revenues, total bad debt expense and losses from sales of receivables was 1.91% in the third quarter of 2016 compared to 1.79% in the second quarter of 2016 and 2.52% in the third quarter of 2015. |
▪ | Total bad debt expense and losses from sales of receivables was sequentially higher in the third quarter of 2016. Typically, bad debt expense tends to increase seasonally in the second half of the year compared to the first half. Year-over-year, total bad debt expense and losses from sales of receivables declined by $21 million and by 61 basis points as a percentage of total revenues, reflecting the Company's focus on managing its customer quality. |
10
▪ | Including the EIP receivables sold, total EIP receivables classified as Prime were 53% of total EIP receivables at the end of the third quarter of 2016, flat compared to 53% at the end of the second quarter of 2016 and up compared to 52% at the end of the third quarter of 2015. Excluding the receivables sold, EIP receivables classified as Prime were 42% at the end of the third quarter of 2016, flat compared to 42% at the end of the second quarter of 2016 and down compared to 52% at the end of the third quarter of 2015. The year-over-year decline in EIP receivables classified as Prime was due to the sales of certain EIP receivables. |
Branded Postpaid Phone ARPU
($ per month)
Branded Postpaid ABPU
($ per month)
OPERATING METRICS
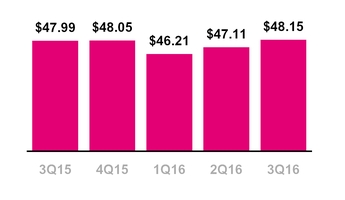
Branded Postpaid Phone ARPU
▪ | Branded postpaid phone ARPU was $48.15 in the third quarter of 2016, up 2.2% from $47.11 in the second quarter of 2016 and up 0.3% from $47.99 in the third quarter of 2015. As noted in prior quarters, branded postpaid phone ARPU in the third quarter of 2016 was impacted by the non-cash net revenue deferral for Data Stash. |
▪ | Excluding the impact of Data Stash, branded postpaid phone ARPU in the third quarter of 2016 increased by 1.6% sequentially and 1.5% year-over-year: |
◦ | Sequentially, the increase in branded postpaid phone ARPU was primarily due to the introduction of the new T-Mobile ONE rate plans and the MVNO Transaction, partially offset by continued strategic focus on family plan penetration and promotional activity. |
◦ | Year-over-year, the increase in branded postpaid phone ARPU was primarily due to growth in our insurance programs, higher data attach rates and the MVNO Transaction, partially offset by the family plan penetration and promotional activity. |
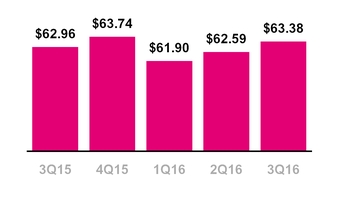
Branded Postpaid ABPU
▪ | Branded postpaid ABPU was $63.38 in the third quarter of 2016, up 1.3% from $62.59 in the second quarter of 2016 and up 0.7% from $62.96 in the third quarter of 2015. Branded postpaid ABPU in the third quarter of 2016 was impacted by the non-cash net revenue deferral for Data Stash. |
11
Branded Postpaid Customers per Account
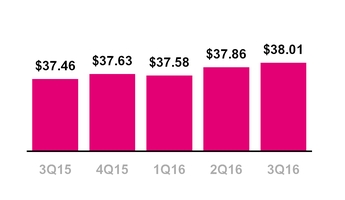
Branded Prepaid ARPU
($ per month)
▪ | Excluding the impact of Data Stash, branded postpaid ABPU in the third quarter of 2016 increased by 0.8% sequentially and by 1.5% year-over-year: |
◦ | Sequentially, the increase in branded postpaid ABPU was primarily due to the introduction of the new T-Mobile ONE rate plans, the MVNO Transaction, and growth in EIP billings, partially offset by a decline in lease revenues. |
◦ | Year-over year, the increase was primarily due to higher lease revenues and the MVNO Transaction, partially offset by lower EIP billings, dilution from continued growth of customers on promotions targeting families and increased penetration of mobile broadband devices. |
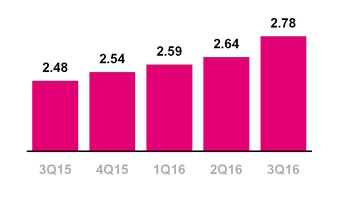
Branded Postpaid Customers per Account
▪ | Branded postpaid customers per account was 2.78 at the end of the third quarter of 2016, compared to 2.64 at the end of the second quarter of 2016 and 2.48 at the end of the third quarter of 2015. Sequentially, the increase was primarily due to the impact of the MVNO Transaction. Year-over-year, the increase was primarily due to ongoing service promotions targeting families, increased penetration of mobile broadband devices and the MVNO Transaction. |
Branded Prepaid ARPU
▪ | Branded prepaid ARPU was $38.01 in the third quarter of 2016, up 0.4% from $37.86 in the second quarter of 2016 and up 1.5% compared to $37.46 in the third quarter of 2015. Sequentially, the increase was primarily due to the MVNO Transaction. Year-over-year, the increase was primarily due to a decrease in customers with lower branded prepaid ARPU and higher data attach rates, partially offset by dilution from growth of customers on rate plan promotions. |
12
Service Revenue Growth at
Wireless Peers
(YoY % Growth)
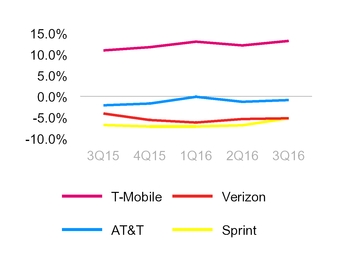
Based on reported results if available or based on consensus
expectations if company has not yet reported quarterly results.
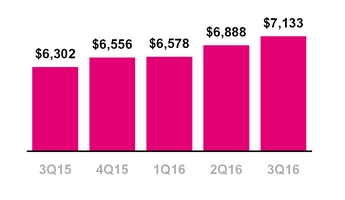
Service Revenues
($ in millions)
REVENUES
Service Revenues
▪ | T-Mobile is expected to once again lead the industry in year-over-year service revenue percentage growth in the third quarter of 2016. This would mark the tenth consecutive quarter that T-Mobile has led the industry in year-over-year service revenue percentage growth. |
▪ | Service revenues were $7.133 billion in the third quarter of 2016, up 3.6% from $6.888 billion in the second quarter of 2016 and up 13.2% from $6.302 billion in the third quarter of 2015. |
▪ | Sequentially, the increase in service revenues was primarily due to growth in the Company’s customer base from the continued success of T-Mobile’s Un-carrier initiatives and T-Mobile's prepaid brands, strong customer response to promotional activities targeting families, the introduction of the new T-Mobile ONE rate plans and a sequentially lower non-cash net revenue deferral from Data Stash, which totaled $59 million in the third quarter of 2016, compared to $88 million in the second quarter of 2016. |
▪ | Year-over-year, the increase in service revenues was primarily due to growth in T-Mobile's branded customer base from the continued success of T-Mobile’s Un-carrier initiatives and T-Mobile's prepaid brands, strong customer response to promotional activities targeting families and growth in insurance revenues. These increases were partially offset by a higher non-cash net revenue deferral from Data Stash, which totaled $59 million in the third quarter of 2016, compared to $3 million in the third quarter of 2015. |
13
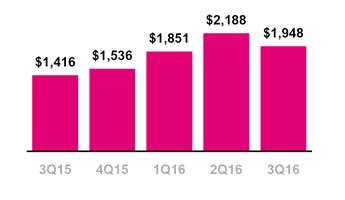
Equipment Revenues
($ in millions)
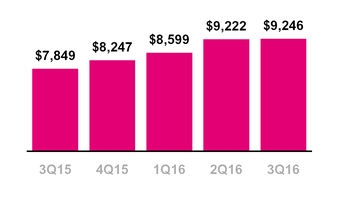
Total Revenues
($ in millions)
Equipment Revenues
▪ | Equipment revenues were $1.948 billion in the third quarter of 2016, down 11.0% from $2.188 billion in the second quarter of 2016 and up 37.6% from $1.416 billion in the third quarter of 2015. Equipment revenues in the third quarter of 2016 were comprised of lease revenues of $353 million and non-lease revenues of $1.595 billion. |
▪ | Sequentially, the decrease in equipment revenues was primarily due to promotional activity in the period. One promotion, which ran from September 9th through September 25th, 2016, allowed customers to trade-in a fully paid-off iPhone 6 or 6s to receive a new iPhone 7 for $0 per month as long as they remained a customer. Under this offer, the equipment revenue recognized in that transaction was the trade-in value of the received iPhone, which was typically lower than the equipment revenue that would be recognized under a traditional EIP sale. This decrease was partially offset by a higher level of device units sold in the quarter. |
▪ | Year-over-year, the increase in equipment revenues was primarily due to an increase in lease revenues and a higher number of devices sold. |
Total Revenues
▪ | T-Mobile expects to once again lead the industry in year-over-year total revenue percentage growth in the third quarter of 2016. This would mark the 13th time in the past fourteen quarters that T-Mobile has led the industry in year-over-year total revenue percentage growth. |
▪ | Total revenues were $9.246 billion in the third quarter of 2016, up 0.3% from $9.222 billion in the second quarter of 2016 and up 17.8% from $7.849 billion in the third quarter of 2015. |
▪ | Sequentially, the slight increase in total revenues was primarily due to an increase in service revenues in the third quarter of 2016, partially offset by a decrease in equipment revenues. |
▪ | Year-over-year, the increase in total revenues was primarily due to higher service revenues from growth in the customer base and higher equipment revenues. |
14
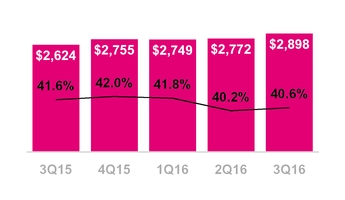
Cost of Services
($ in millions, % of Service Revs)
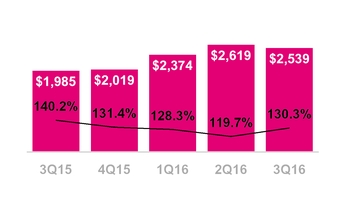
Cost of Equipment Sales
($ in millions, % of Equipment Revs)
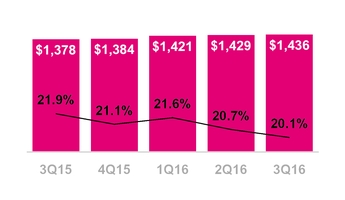
SG&A Expense
($ in millions, % of Service Revs)
OPERATING EXPENSES
Cost of Services
▪ | Cost of services was $1.436 billion in the third quarter of 2016, up 0.5% from $1.429 billion in the second quarter of 2016 and up 4.2% from $1.378 billion in the third quarter of 2015. Sequentially, cost of services remained generally stable. Year-over-year, the increase in cost of services was primarily due to higher regulatory program costs, network expansion, 700 MHz A-Block build-out and higher employee related costs, partially offset by synergies realized from the decommissioning of the MetroPCS CDMA network and lower long distance and toll costs. As a percentage of service revenues, cost of service declined by 180 basis points year-over-year. |
Cost of Equipment Sales
▪ | Cost of equipment sales was $2.539 billion in the third quarter of 2016, down 3.1% from $2.619 billion in the second quarter of 2016 and up 27.9% from $1.985 billion in the third quarter of 2015. |
▪ | Sequentially, the decrease in cost of equipment sales was primarily due to a decrease in the average cost per device sold, partially offset by a higher level of device units sold in the quarter. |
▪ | Year-over-year, the increase was primarily driven by an increase in the number of devices sold as well as a higher average cost per device sold. |
Selling, General and Admin. (SG&A) Expense
▪ | SG&A expense were $2.898 billion in the third quarter of 2016, up 4.5% from $2.772 billion in the second quarter of 2016 and up 10.4% from $2.624 billion in the third quarter of 2015. |
▪ | Sequentially, the increase in SG&A expense was primarily due to higher branded customer additions and strategic investments to support growing the customer base including higher employee-related expenses and promotional costs. |
▪ | Year-over-year, the increase was primarily due to strategic investments to support growing the customer base including higher employee-related expenses and promotional costs. As a percentage of service revenues, SG&A expense declined by 100 basis points year-over-year. |
15
D&A Expense
($ in millions, % of Total Revs)
Depreciation and Amortization (D&A)
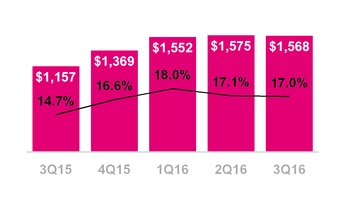
▪ | D&A was $1.568 billion in the third quarter of 2016, down 0.4% from $1.575 billion in the second quarter of 2016 and up 35.5% from $1.157 billion in the third quarter of 2015. D&A in the third quarter of 2016 was comprised of device lease-related D&A of $367 million and non-device lease-related D&A of $1.201 billion. |
▪ | Sequentially, the slight decrease in D&A was primarily due to a decrease in D&A expense related to leased devices which declined to $367 million in the third quarter of 2016 from $397 million in the second quarter of 2016. D&A not related to leased devices increased primarily due to the continued build-out of T-Mobile’s 4G LTE network. |
▪ | Year-over-year, the increase was primarily due to the impact of leasing under our JUMP! On Demand Program, which was launched at the end of the second quarter of 2015. D&A related to leased devices was $367 million in the third quarter of 2016 compared to $58 million in the third quarter of 2015. Under leasing, the cost of the leased device is recognized as depreciation expense over the term of the lease rather than recognized as cost of equipment sales when the device is delivered to the customer. The total number of devices under lease was higher year-over-year, resulting in higher depreciation expense. Additionally, non lease-related D&A increased primarily due to the continued build-out of the Company's 4G LTE network. |
Net Income
($ in millions)
NET INCOME AND EARNINGS PER SHARE
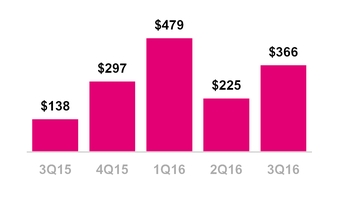
▪ | Net income was $366 million in the third quarter of 2016, up 63% compared to net income of $225 million in the second quarter of 2016 and up 165% compared to $138 million in the third quarter of 2015. Net income in the third quarter of 2016 included after-tax spectrum gains of $122 million. |
▪ | Earnings per share was $0.42 in the third quarter of 2016 compared to earnings per share of $0.25 in the second quarter of 2016 and $0.15 in the third quarter of 2015. The after-tax impact of spectrum gains on EPS in the third quarter of 2016 was $0.15. |
16
▪ | Sequentially, the increases in net income and earnings per share were primarily due to higher service revenues, gains on disposal of spectrum licenses, and lower cost of equipment sales. These increases were partially offset by lower equipment revenues, higher SG&A expense from strategic investments to support growing the customer base, and higher income tax expense. |
▪ | Year-over-year, the increases in net income and EPS resulted primarily from higher service and equipment revenues due to growth in the customer base and the spectrum gains, partially offset by higher operating and non-operating expenses. The increase in operating expenses resulted from a rise in cost of equipment due to an increase in devices sold and average cost per device, increased SG&A expense due to strategic investments to support growing the customer base, and higher D&A expense related to leased devices and the build-out of the LTE network. The increase in non-operating expenses was due primarily to higher income tax and interest expense. |
▪ | Net income as a percentage of service revenues was 5.1% in the third quarter of 2016 compared to 2.2% in the third quarter of 2015. |
Adjusted EBITDA
($ in millions)
ADJUSTED EBITDA
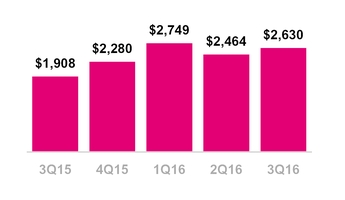
▪ | Adjusted EBITDA was $2.630 billion in the third quarter of 2016, up 6.7% from $2.464 billion in the second quarter of 2016 and up 37.8% from $1.908 billion in the third quarter of 2015. |
▪ | Adjusted EBITDA in the third quarter of 2016 included a pre-tax gain of $199 million from spectrum license transactions. |
▪ | Sequentially, the increase in Adjusted EBITDA was primarily due to higher service revenues from growth in the customer base, spectrum gains and lower cost of equipment sales. These increases were partially offset by an increase in losses on equipment and higher SG&A expense due to strategic investments to support growing the customer base. |
▪ | Year-over-year, the increase in Adjusted EBITDA was primarily due to higher service revenues from growth in the customer base, spectrum gains, focused cost control and synergies realized from the MetroPCS business combination. These increases were partially offset by higher SG&A expense from strategic investments to support growing the customer base. |
17
▪ | Adjusted EBITDA margin was 37% in the third quarter of 2016 compared to 36% in the second quarter of 2016 and 30% in the third quarter of 2015. Adjusted EBITDA margin is calculated as Adjusted EBITDA divided by service revenues. Excluding the spectrum gains, Adjusted EBITDA margin was 34% in the third quarter of 2016 compared to 36% in the second quarter of 2016 and 30% in the third quarter of 2015. |
▪ | The aggregate net impact from leasing and Data Stash on Adjusted EBITDA in the third quarter of 2016 was $294 million. Lease revenues were $353 million and the net impact from Data Stash was $59 million in the third quarter of 2016. |
Cash Capital Expenditures
($ in millions, % of Service Revs)
CAPITAL EXPENDITURES
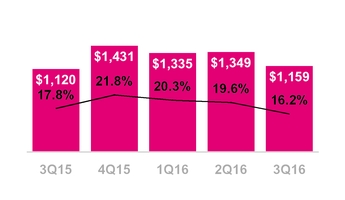
▪ | Cash capital expenditures for property and equipment were $1.159 billion in the third quarter of 2016 compared to $1.349 billion in the second quarter of 2016 and $1.120 billion in the third quarter of 2015. The sequential decrease and year-over-year increase were primarily due to the timing of network spend in connection with T-Mobile’s build out of its 4G LTE network. |
Net Cash Provided by Operating Activities
($ in millions)
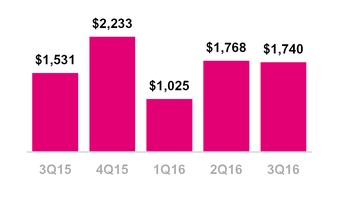
CASH FLOW
Operating Activities
▪ | Net cash provided by operating activities was $1.740 billion in the third quarter of 2016, compared to $1.768 billion in the second quarter of 2016 and $1.531 billion in the third quarter of 2015. |
▪ | Sequentially, the slight decrease in cash provided by operating activities was primarily due to a decline in net non-cash income and expenses included in net income primarily due to changes in deferred income tax expense and gains on disposal of spectrum licenses, and an increase in the net cash outflows from changes in working capital, partially offset by an increase in net income. |
▪ | Year-over-year, the increase in net cash provided by operating activities was primarily due to an increase in net income and an increase in net non-cash income and expenses included in net income primarily due to changes in D&A and gains on disposal of spectrum licenses, partially offset by an increase in net cash outflows from changes in working capital. |
18
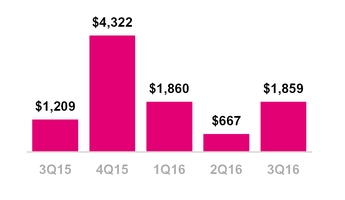
Net Cash Used in Investing Activities
($ in millions)
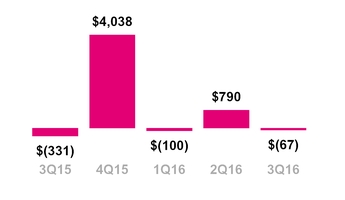
Net Cash Provided by (Used in)
Financing Activities
($ in millions)
Investing Activities
▪ | Cash used in investing activities was $1.859 billion in the third quarter of 2016 compared to $667 million in the second quarter of 2016 and $1.209 billion in the third quarter of 2015. |
▪ | Sequentially, the increase was primarily due to purchases of spectrum licenses and other intangible assets in the third quarter of 2016 as well as the impact from sales of short-term investments in the second quarter of 2016, partially offset by the impact from a refundable deposit made to a third party in connection with a potential asset purchase in the second quarter of 2016. |
▪ | Year-over-year, the increase was primarily due to purchases of spectrum licenses and other intangible assets in the third quarter of 2016. |
Financing Activities
▪ | Cash used in financing activities was an outflow of $67 million in the third quarter of 2016 compared to an inflow of $790 million in the second quarter of 2016 and an outflow of $331 million in the third quarter of 2015. |
▪ | Sequentially, the decrease in net cash from financing activities was primarily due to the impact of proceeds from the issuance of long-term debt of $997 million in the second quarter of 2016, partially offset by a decrease in payments of short-term debt for purchases of inventory, and property and equipment, net. |
▪ | Year-over-year, the decrease in net cash used in financing activities was primarily due to a decrease in repayments of short-term debt for purchases of property and equipment, net, partially offset by an increase in repayments of capital lease obligations. |
19
Free Cash Flow and
Adjusted Free Cash Flow
($ in millions)
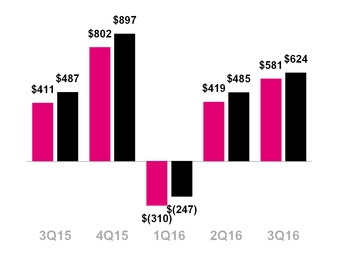
FREE CASH FLOW
▪ | Free Cash Flow was $581 million in the third quarter of 2016, compared to $419 million in the second quarter of 2016 and $411 million in the third quarter of 2015. Sequentially, the increase in free cash flow was primarily due to the decrease in cash capital expenditures. Year-over-year, the increase in free cash flow was primarily due to the increase in net cash provided by operating activities, partially offset by the increase in cash capital expenditures. |
▪ | Adjusted Free Cash Flow was $624 million in the third quarter of 2016, compared to $485 million in the second quarter of 2016 and $487 million in the third quarter of 2015. Adjusted Free Cash Flow excludes decommissioning payments related to the one-time shutdown of the CDMA portion of the MetroPCS network. Decommissioning payments in the third quarter of 2016 were $43 million, compared to $66 million in the second quarter of 2016 and $76 million in the third quarter of 2015. |
Total Debt and Net Debt (excl. Tower Obligations)
($ in billions, Net Debt to LTM Adj. EBITDA)
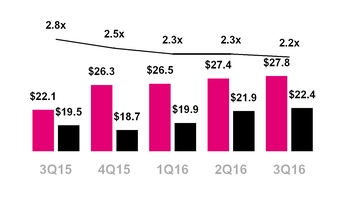
— Net Debt to LTM Adj. EBITDA
CAPITAL STRUCTURE
▪ | Total debt, excluding tower obligations, at the end of the third quarter of 2016 was $27.750 billion and was comprised of short-term debt of $325 million, long-term debt to affiliates of $5.600 billion, and long-term debt of $21.825 billion. |
▪ | Net debt, excluding tower obligations, at the end of the third quarter of 2016 was $22.398 billion. |
▪ | The ratio of net debt, excluding tower obligations, to Adjusted EBITDA for the trailing last twelve month (“LTM”) period was 2.2x at the end of the third quarter of 2016 compared to 2.3x at the end of the second quarter of 2016 and 2.8x at the end of the third quarter of 2015. |
▪ | T-Mobile’s cash position remains strong with $5.352 billion in cash and cash equivalents at the end of the third quarter of 2016. |
20
2016 Guidance Outlook | ||||||||
Original | 1Q16 | 2Q16 | 3Q16 | |||||
Branded Postpaid Net Adds (in millions) | 2.4 - 3.4 | 3.2 - 3.6 | 3.4 - 3.8 | 3.7 - 3.9 | ||||
Adjusted EBITDA ($ in billions) | $9.1-$9.7 | $9.7 - $10.2 | $9.8 - $10.1 | $10.2 - $10.4 | ||||
Cash Capex ($ in billions) | $4.5-$4.8 | Unchanged | Unchanged | $4.5 - $4.7 | ||||
GUIDANCE
▪ | T-Mobile expects to drive further customer momentum while delivering strong growth in Adjusted EBITDA and free cash flow in 2016. |
▪ | Branded postpaid net customer additions for the full-year 2016 are now expected to be between 3.7 and 3.9 million, an increase from the previous guidance range of 3.4 to 3.8 million. |
▪ | T-Mobile is not able to forecast net income on a forward looking basis without unreasonable efforts due to the high variability and difficulty in predicting certain items that affect GAAP net income including, but not limited to, income tax expense, stock based compensation expense, interest expense and interest income. |
▪ | For the full-year 2016, T-Mobile now expects Adjusted EBITDA to be in the range of $10.2 to $10.4 billion, raising and narrowing the previous guidance range of $9.8 to $10.1 billion. This guidance includes the aggregate net impact from leasing and Data Stash, now expected to be approximately $1.0 to $1.1 billion, and $0.8 billion related to spectrum gains recognized in the first nine months of 2016. |
▪ | Cash capital expenditures for the full-year 2016 are expected to be in the range of $4.5 to $4.7 billion, narrowing the previous guidance range of $4.5 to $4.8 billion. |
UPCOMING EVENTS (All dates and attendance tentative)
▪ | Wells Fargo 2016 Technology, Media and Telecom Conference, November 9-10, 2016, New York, NY |
▪ | Morgan Stanley European Technology, Media and Telecom Conference, November 16-18, 2016, Barcelona, Spain |
▪ | UBS 44th Annual Global Media and Communications Conference, December 5-7, 2016, New York, NY |
▪ | Citi 2017 Global Internet, Media and Telecommunications Conference, January 4-5, 2017, Las Vegas, NV |
CONTACT INFORMATION
Press:
Media Relations
T-Mobile US, Inc.
mediarelations@t-mobile.com
http://newsroom.t-mobile.com
Investor Relations:
Nils Paellmann, nils.paellmann@t-mobile.com
Ben Barrett, ben.barrett@t-mobile.com
Jon Perachio, jonathan.perachio@t-mobile.com
Cristal Dunkin, cristal.dunkin@t-mobile.com
877-281-TMUS or 212-358-3210
investor.relations@t-mobile.com
http://investor.t-mobile.com
21
T-Mobile US, Inc.
Condensed Consolidated Balance Sheets
(Unaudited)
(in millions, except share and per share amounts) | September 30, 2016 | December 31, 2015 | |||||
Assets | |||||||
Current assets | |||||||
Cash and cash equivalents | $ | 5,352 | $ | 4,582 | |||
Short-term investments | — | 2,998 | |||||
Accounts receivable, net of allowances of $111 and $116 | 1,885 | 1,788 | |||||
Equipment installment plan receivables, net | 1,669 | 2,378 | |||||
Accounts receivable from affiliates | 46 | 36 | |||||
Inventories | 1,039 | 1,295 | |||||
Asset purchase deposit | 2,203 | — | |||||
Other current assets | 1,336 | 1,813 | |||||
Total current assets | 13,530 | 14,890 | |||||
Property and equipment, net | 20,574 | 20,000 | |||||
Goodwill | 1,683 | 1,683 | |||||
Spectrum licenses | 26,590 | 23,955 | |||||
Other intangible assets, net | 431 | 594 | |||||
Equipment installment plan receivables due after one year, net | 839 | 847 | |||||
Other assets | 625 | 444 | |||||
Total assets | $ | 64,272 | $ | 62,413 | |||
Liabilities and Stockholders' Equity | |||||||
Current liabilities | |||||||
Accounts payable and accrued liabilities | $ | 6,146 | $ | 8,084 | |||
Payables to affiliates | 313 | 135 | |||||
Short-term debt | 325 | 182 | |||||
Deferred revenue | 980 | 717 | |||||
Other current liabilities | 355 | 410 | |||||
Total current liabilities | 8,119 | 9,528 | |||||
Long-term debt | 21,825 | 20,461 | |||||
Long-term debt to affiliates | 5,600 | 5,600 | |||||
Tower obligations | 2,629 | 2,658 | |||||
Deferred tax liabilities | 4,648 | 4,061 | |||||
Deferred rent expense | 2,591 | 2,481 | |||||
Other long-term liabilities | 1,007 | 1,067 | |||||
Total long-term liabilities | 38,300 | 36,328 | |||||
Commitments and contingencies | |||||||
Stockholders' equity | |||||||
5.50% Mandatory Convertible Preferred Stock Series A, par value $0.00001 per share, 100,000,000 shares authorized; 20,000,000 and 20,000,000 shares issued and outstanding; $1,000 and $1,000 aggregate liquidation value | — | — | |||||
Common Stock, par value $0.00001 per share, 1,000,000,000 shares authorized; 825,422,350 and 819,773,724 shares issued, 824,010,863 and 818,391,219 shares outstanding | — | — | |||||
Additional paid-in capital | 38,853 | 38,666 | |||||
Treasury stock, at cost, 1,411,487 and 1,382,505 shares issued | (1 | ) | — | ||||
Accumulated other comprehensive income (loss) | 1 | (1 | ) | ||||
Accumulated deficit | (21,000 | ) | (22,108 | ) | |||
Total stockholders' equity | 17,853 | 16,557 | |||||
Total liabilities and stockholders' equity | $ | 64,272 | $ | 62,413 | |||
22
T-Mobile US, Inc.
Condensed Consolidated Statements of Comprehensive Income
(Unaudited)
Three Months Ended | Nine Months Ended September 30, | ||||||||||||||||||
(in millions, except share and per share amounts) | September 30, 2016 | June 30, 2016 | September 30, 2015 | 2016 | 2015 | ||||||||||||||
Revenues | |||||||||||||||||||
Branded postpaid revenues | $ | 4,647 | $ | 4,509 | $ | 4,197 | $ | 13,458 | $ | 12,046 | |||||||||
Branded prepaid revenues | 2,182 | 2,119 | 1,894 | 6,326 | 5,597 | ||||||||||||||
Wholesale revenues | 238 | 207 | 170 | 645 | 492 | ||||||||||||||
Roaming and other service revenues | 66 | 53 | 41 | 170 | 130 | ||||||||||||||
Total service revenues | 7,133 | 6,888 | 6,302 | 20,599 | 18,265 | ||||||||||||||
Equipment revenues | 1,948 | 2,188 | 1,416 | 5,987 | 5,182 | ||||||||||||||
Other revenues | 165 | 146 | 131 | 481 | 359 | ||||||||||||||
Total revenues | 9,246 | 9,222 | 7,849 | 27,067 | 23,806 | ||||||||||||||
Operating expenses | |||||||||||||||||||
Cost of services, exclusive of depreciation and amortization shown separately below | 1,436 | 1,429 | 1,378 | 4,286 | 4,170 | ||||||||||||||
Cost of equipment sales | 2,539 | 2,619 | 1,985 | 7,532 | 7,325 | ||||||||||||||
Selling, general and administrative | 2,898 | 2,772 | 2,624 | 8,419 | 7,434 | ||||||||||||||
Depreciation and amortization | 1,568 | 1,575 | 1,157 | 4,695 | 3,319 | ||||||||||||||
Cost of MetroPCS business combination | 15 | 59 | 193 | 110 | 355 | ||||||||||||||
Gains on disposal of spectrum licenses | (199 | ) | — | (1 | ) | (835 | ) | (24 | ) | ||||||||||
Total operating expenses | 8,257 | 8,454 | 7,336 | 24,207 | 22,579 | ||||||||||||||
Operating income | 989 | 768 | 513 | 2,860 | 1,227 | ||||||||||||||
Other income (expense) | |||||||||||||||||||
Interest expense | (376 | ) | (368 | ) | (262 | ) | (1,083 | ) | (780 | ) | |||||||||
Interest expense to affiliates | (76 | ) | (93 | ) | (121 | ) | (248 | ) | (277 | ) | |||||||||
Interest income | 62 | 68 | 109 | 198 | 335 | ||||||||||||||
Other expense, net | (1 | ) | (3 | ) | (1 | ) | (6 | ) | (8 | ) | |||||||||
Total other expense, net | (391 | ) | (396 | ) | (275 | ) | (1,139 | ) | (730 | ) | |||||||||
Income before income taxes | 598 | 372 | 238 | 1,721 | 497 | ||||||||||||||
Income tax expense | (232 | ) | (147 | ) | (100 | ) | (651 | ) | (61 | ) | |||||||||
Net income | 366 | 225 | 138 | 1,070 | 436 | ||||||||||||||
Dividends on preferred stock | (13 | ) | (14 | ) | (13 | ) | (41 | ) | (41 | ) | |||||||||
Net income attributable to common stockholders | $ | 353 | $ | 211 | $ | 125 | $ | 1,029 | $ | 395 | |||||||||
Net income | $ | 366 | $ | 225 | $ | 138 | $ | 1,070 | $ | 436 | |||||||||
Other comprehensive gain (loss), net of tax | |||||||||||||||||||
Unrealized gain (loss) on available-for-sale securities, net of tax effect of $1, $2, $(1), $1 and $(2) | 2 | 3 | (2 | ) | 2 | (2 | ) | ||||||||||||
Other comprehensive income (loss) | 2 | 3 | (2 | ) | 2 | (2 | ) | ||||||||||||
Total comprehensive income | $ | 368 | $ | 228 | $ | 136 | $ | 1,072 | $ | 434 | |||||||||
Earnings per share | |||||||||||||||||||
Basic | $ | 0.43 | $ | 0.26 | $ | 0.15 | $ | 1.25 | $ | 0.49 | |||||||||
Diluted | $ | 0.42 | $ | 0.25 | $ | 0.15 | $ | 1.24 | $ | 0.48 | |||||||||
Weighted average shares outstanding | |||||||||||||||||||
Basic | 822,998,697 | 822,434,490 | 815,069,272 | 821,626,675 | 811,783,620 | ||||||||||||||
Diluted | 832,257,819 | 829,752,956 | 822,017,220 | 831,241,027 | 820,514,748 | ||||||||||||||
23
T-Mobile US, Inc.
Condensed Consolidated Statements of Cash Flows
(Unaudited)
Three Months Ended | Nine Months Ended September 30, | ||||||||||||||||||
(in millions) | September 30, 2016 | June 30, 2016 | September 30, 2015 | 2016 | 2015 | ||||||||||||||
Operating activities | |||||||||||||||||||
Net income | $ | 366 | $ | 225 | $ | 138 | $ | 1,070 | $ | 436 | |||||||||
Adjustments to reconcile net income to net cash provided by operating activities | |||||||||||||||||||
Depreciation and amortization | 1,568 | 1,575 | 1,157 | 4,695 | 3,319 | ||||||||||||||
Stock-based compensation expense | 59 | 60 | 42 | 171 | 153 | ||||||||||||||
Deferred income tax expense | 219 | 140 | 134 | 623 | 82 | ||||||||||||||
Bad debt expense | 118 | 119 | 172 | 358 | 384 | ||||||||||||||
Losses from sales of receivables | 59 | 46 | 26 | 157 | 139 | ||||||||||||||
Deferred rent expense | 32 | 33 | 43 | 97 | 131 | ||||||||||||||
Gains on disposal of spectrum licenses | (199 | ) | — | (1 | ) | (835 | ) | (24 | ) | ||||||||||
Changes in operating assets and liabilities | |||||||||||||||||||
Accounts receivable | (155 | ) | (105 | ) | (48 | ) | (462 | ) | (156 | ) | |||||||||
Equipment installment plan receivables | 104 | 343 | 229 | 556 | (350 | ) | |||||||||||||
Inventories | 301 | 3 | (915 | ) | (497 | ) | (973 | ) | |||||||||||
Deferred purchase price from sales of receivables | (16 | ) | (204 | ) | (34 | ) | (199 | ) | (46 | ) | |||||||||
Other current and long-term assets | (98 | ) | (56 | ) | (184 | ) | 31 | (58 | ) | ||||||||||
Accounts payable and accrued liabilities | (731 | ) | (345 | ) | 582 | (1,568 | ) | 36 | |||||||||||
Other current and long-term liabilities | 112 | (74 | ) | 92 | 326 | 2 | |||||||||||||
Other, net | 1 | 8 | 98 | 10 | 106 | ||||||||||||||
Net cash provided by operating activities | 1,740 | 1,768 | 1,531 | 4,533 | 3,181 | ||||||||||||||
Investing activities | |||||||||||||||||||
Purchases of property and equipment | (1,159 | ) | (1,349 | ) | (1,120 | ) | (3,843 | ) | (3,293 | ) | |||||||||
Purchases of spectrum licenses and other intangible assets, including deposits | (705 | ) | (2,245 | ) | (94 | ) | (3,544 | ) | (1,938 | ) | |||||||||
Sales of short-term investments | — | 2,923 | — | 2,998 | — | ||||||||||||||
Other, net | 5 | 4 | 5 | 3 | (7 | ) | |||||||||||||
Net cash used in investing activities | (1,859 | ) | (667 | ) | (1,209 | ) | (4,386 | ) | (5,238 | ) | |||||||||
Financing activities | |||||||||||||||||||
Proceeds from issuance of long-term debt | — | 997 | — | 997 | — | ||||||||||||||
Repayments of capital lease obligations | (54 | ) | (43 | ) | (13 | ) | (133 | ) | (24 | ) | |||||||||
Repayments of short-term debt for purchases of inventory, property and equipment, net | — | (150 | ) | (315 | ) | (150 | ) | (563 | ) | ||||||||||
Repayments of long-term debt | (5 | ) | (5 | ) | — | (15 | ) | — | |||||||||||
Tax withholdings on share-based awards | (3 | ) | (3 | ) | (2 | ) | (52 | ) | (100 | ) | |||||||||
Dividends on preferred stock | (13 | ) | (14 | ) | (13 | ) | (41 | ) | (41 | ) | |||||||||
Other, net | 8 | 8 | 12 | 17 | 103 | ||||||||||||||
Net cash provided by (used in) financing activities | (67 | ) | 790 | (331 | ) | 623 | (625 | ) | |||||||||||
Change in cash and cash equivalents | (186 | ) | 1,891 | (9 | ) | 770 | (2,682 | ) | |||||||||||
Cash and cash equivalents | |||||||||||||||||||
Beginning of period | 5,538 | 3,647 | 2,642 | 4,582 | 5,315 | ||||||||||||||
End of period | $ | 5,352 | $ | 5,538 | $ | 2,633 | $ | 5,352 | $ | 2,633 | |||||||||
24
T-Mobile US, Inc. Supplementary Operating and Financial Data
Quarter | Nine Months Ended September 30, | |||||||||||||||||||||||||
(in thousands) | Q1 2015 | Q2 2015 | Q3 2015 | Q4 2015 | Q1 2016 | Q2 2016 | Q3 2016 | 2015 | 2016 | |||||||||||||||||
Customers, end of period | ||||||||||||||||||||||||||
Branded postpaid phone customers | 26,835 | 27,595 | 28,438 | 29,355 | 30,232 | 30,878 | 30,364 | 28,438 | 30,364 | |||||||||||||||||
Branded postpaid mobile broadband customers | 1,475 | 1,723 | 1,965 | 2,340 | 2,504 | 2,748 | 2,866 | 1,965 | 2,866 | |||||||||||||||||
Total branded postpaid customers | 28,310 | 29,318 | 30,403 | 31,695 | 32,736 | 33,626 | 33,230 | 30,403 | 33,230 | |||||||||||||||||
Branded prepaid customers | 16,389 | 16,567 | 17,162 | 17,631 | 18,438 | 18,914 | 19,272 | 17,162 | 19,272 | |||||||||||||||||
Total branded customers | 44,699 | 45,885 | 47,565 | 49,326 | 51,174 | 52,540 | 52,502 | 47,565 | 52,502 | |||||||||||||||||
Wholesale customers | 12,137 | 13,023 | 13,655 | 13,956 | 14,329 | 14,844 | 16,852 | 13,655 | 16,852 | |||||||||||||||||
Total customers, end of period | 56,836 | 58,908 | 61,220 | 63,282 | 65,503 | 67,384 | 69,354 | 61,220 | 69,354 | |||||||||||||||||
Quarter | Nine Months Ended September 30, | |||||||||||||||||||||||||
(in thousands) | Q1 2015 | Q2 2015 | Q3 2015 | Q4 2015 | Q1 2016 | Q2 2016 | Q3 2016 | 2015 | 2016 | |||||||||||||||||
Net customer additions | ||||||||||||||||||||||||||
Branded postpaid phone customers | 991 | 760 | 843 | 917 | 877 | 646 | 851 | 2,594 | 2,374 | |||||||||||||||||
Branded postpaid mobile broadband customers | 134 | 248 | 242 | 375 | 164 | 244 | 118 | 624 | 526 | |||||||||||||||||
Total branded postpaid customers | 1,125 | 1,008 | 1,085 | 1,292 | 1,041 | 890 | 969 | 3,218 | 2,900 | |||||||||||||||||
Branded prepaid customers | 73 | 178 | 595 | 469 | 807 | 476 | 684 | 846 | 1,967 | |||||||||||||||||
Total branded customers | 1,198 | 1,186 | 1,680 | 1,761 | 1,848 | 1,366 | 1,653 | 4,064 | 4,867 | |||||||||||||||||
Wholesale customers | 620 | 886 | 632 | 301 | 373 | 515 | 317 | 2,138 | 1,205 | |||||||||||||||||
Total net customer additions | 1,818 | 2,072 | 2,312 | 2,062 | 2,221 | 1,881 | 1,970 | 6,202 | 6,072 | |||||||||||||||||
Transfer from branded postpaid phone customers | — | — | — | — | — | — | (1,365 | ) | — | (1,365 | ) | |||||||||||||||
Transfer from branded prepaid customers | — | — | — | — | — | — | (326 | ) | — | (326 | ) | |||||||||||||||
Transfer to wholesale customers | — | — | — | — | — | — | 1,691 | — | 1,691 | |||||||||||||||||
Quarter | Nine Months Ended September 30, | |||||||||||||||||||||||||
Q1 2015 | Q2 2015 | Q3 2015 | Q4 2015 | Q1 2016 | Q2 2016 | Q3 2016 | 2015 | 2016 | ||||||||||||||||||
Branded postpaid phone churn | 1.30 | % | 1.32 | % | 1.46 | % | 1.46 | % | 1.33 | % | 1.27 | % | 1.32 | % | 1.36 | % | 1.30 | % | ||||||||
Branded prepaid churn | 4.62 | % | 4.93 | % | 4.09 | % | 4.20 | % | 3.84 | % | 3.91 | % | 3.82 | % | 4.54 | % | 3.86 | % | ||||||||
25
T-Mobile US, Inc. Supplementary Operating and Financial Data (continued)
Quarter | Nine Months Ended September 30, | ||||||||||||||||
Q1 2015 | Q2 2015 | Q3 2015 | Q4 2015 | Q1 2016 | Q2 2016 | Q3 2016 | 2015 | 2016 | |||||||||
Financial Metrics | |||||||||||||||||
Service revenues (in millions) | $5,819 | $6,144 | $6,302 | $6,556 | $6,578 | $6,888 | $7,133 | $18,265 | $20,599 | ||||||||
Total revenues (in millions) | $7,778 | $8,179 | $7,849 | $8,247 | $8,599 | $9,222 | $9,246 | $23,806 | $27,067 | ||||||||
Net income (loss) (in millions) | $(63) | $361 | $138 | $297 | $479 | $225 | $366 | $436 | $1,070 | ||||||||
Net income margin (in millions) | (1)% | 6% | 2% | 13% | 7% | 3% | 5% | 2% | 5% | ||||||||
Adjusted EBITDA (in millions) | $1,388 | $1,817 | $1,908 | $2,280 | $2,749 | $2,464 | $2,630 | $5,113 | $7,843 | ||||||||
Adjusted EBITDA margin | 24% | 30% | 30% | 35% | 42% | 36% | 37% | 28% | 38% | ||||||||
Cash capex - Property & Equipment (in millions) | $982 | $1,191 | $1,120 | $1,431 | $1,335 | $1,349 | $1,159 | $3,293 | $3,843 | ||||||||
Net cash provided by operating activities (in millions) | $489 | $1,161 | $1,531 | $2,233 | $1,025 | $1,768 | $1,740 | $3,181 | $4,533 | ||||||||
Net cash used in investing activities (in millions) | $(2,692) | $(1,337) | $(1,209) | $(4,322) | $(1,860) | $(667) | $(1,859) | $(5,238) | $(4,386) | ||||||||
Net cash provided by (used in) financing activities (in millions) | $(80) | $(214) | $(331) | $4,038 | $(100) | $790 | $(67) | $(625) | $623 | ||||||||
Free Cash Flow (in millions) | $(493) | $(30) | $411 | $802 | $(310) | $419 | $581 | $(112) | $690 | ||||||||
Adjusted Free Cash Flow (in millions) | $(422) | $73 | $487 | $897 | $(247) | $485 | $624 | $138 | $862 | ||||||||
Revenue Metrics | |||||||||||||||||
Branded postpaid phone ARPU | $46.43 | $48.19 | $47.99 | $48.05 | $46.21 | $47.11 | $48.15 | $47.55 | $47.17 | ||||||||
Branded postpaid ABPU | $60.94 | $63.29 | $62.96 | $63.74 | $61.90 | $62.59 | $63.38 | $62.42 | $62.63 | ||||||||
Branded prepaid ARPU | $37.81 | $37.83 | $37.46 | $37.63 | $37.58 | $37.86 | $38.01 | $37.70 | $37.82 | ||||||||
Branded postpaid accounts, end of period (in thousands) | 11,831 | 12,061 | 12,250 | 12,456 | 12,639 | 12,753 | 11,932 | 12,250 | 11,932 | ||||||||
Branded postpaid customers per account | 2.39 | 2.43 | 2.48 | 2.54 | 2.59 | 2.64 | 2.78 | 2.48 | 2.78 | ||||||||
Device Sales and Leased Devices | |||||||||||||||||
Smartphone units (in millions) | 8.0 | 7.4 | 8.1 | 10.0 | 8.8 | 8.1 | 8.7 | 23.5 | 25.6 | ||||||||
Branded postpaid handset upgrade rate | 8% | 9% | 9% | 10% | 7% | 6% | 7% | 26% | 20% | ||||||||
Device Financing | |||||||||||||||||
Gross EIP financed (in millions) | $1,483 | $1,697 | $1,107 | $926 | $1,246 | $1,562 | $1,372 | $4,287 | $4,180 | ||||||||
EIP billings (in millions) | $1,292 | $1,393 | $1,409 | $1,400 | $1,324 | $1,344 | $1,394 | $4,094 | $4,062 | ||||||||
EIP receivables, net (in millions) | $4,842 | $5,114 | $4,771 | $3,225 | $3,053 | $2,662 | $2,508 | $4,771 | $2,508 | ||||||||
Lease revenues (in millions) | $— | $— | $30 | $194 | $342 | $367 | $353 | $30 | $1,062 | ||||||||
Leased devices transferred from inventory to property and equipment (in millions) | $— | $— | $854 | $1,597 | $784 | $157 | $234 | $854 | $1,175 | ||||||||
Returned leased devices transferred from property and equipment to inventory (in millions) | $— | $— | $(32) | $(134) | $(131) | $(105) | $(186) | $(32) | $(422) | ||||||||
Customer Quality | |||||||||||||||||
EIP receivables classified as prime | 52% | 52% | 52% | 48% | 47% | 42% | 42% | 52% | 42% | ||||||||
EIP receivables classified as prime (including EIP receivables sold) | 52% | 52% | 52% | 52% | 52% | 53% | 53% | 52% | 53% | ||||||||
Total bad debt expense and losses from sales of receivables (in millions) | $169 | $156 | $198 | $228 | $173 | $165 | $177 | $523 | $515 | ||||||||
26
T-Mobile US, Inc.
Reconciliation of Non-GAAP Financial Measures to GAAP Financial Measures
(Unaudited)
This Investor Factbook includes non-GAAP financial measures. The non-GAAP financial measures should be considered in addition to, but not as a substitute for, the information provided in accordance with GAAP. Reconciliations for the non-GAAP financial measures to the most directly comparable GAAP financial measures are provided below. T-Mobile is not able to forecast net income on a forward looking basis without unreasonable efforts due to the high variability and difficulty in predicting certain items that affect GAAP net income including, but not limited to, income tax expense, stock based compensation expense, interest expense and interest income.
Adjusted EBITDA is reconciled to net income (loss) as follows:
Quarter | Nine Months Ended September 30, | ||||||||||||||||||||||||||||||||||
(in millions) | Q1 2015 | Q2 2015 | Q3 2015 | Q4 2015 | Q1 2016 | Q2 2016 | Q3 2016 | 2015 | 2016 | ||||||||||||||||||||||||||
Net income (loss) | $ | (63 | ) | $ | 361 | $ | 138 | $ | 297 | $ | 479 | $ | 225 | $ | 366 | $ | 436 | $ | 1,070 | ||||||||||||||||
Adjustments: | |||||||||||||||||||||||||||||||||||
Interest expense | 261 | 257 | 262 | 305 | 339 | 368 | 376 | 780 | 1,083 | ||||||||||||||||||||||||||
Interest expense to affiliates | 64 | 92 | 121 | 134 | 79 | 93 | 76 | 277 | 248 | ||||||||||||||||||||||||||
Interest income | (112 | ) | (114 | ) | (109 | ) | (85 | ) | (68 | ) | (68 | ) | (62 | ) | (335 | ) | (198 | ) | |||||||||||||||||
Other expense (income), net | 8 | (1 | ) | 1 | 3 | 2 | 3 | 1 | 8 | 6 | |||||||||||||||||||||||||
Income tax expense (benefit) | (41 | ) | 2 | 100 | 184 | 272 | 147 | 232 | 61 | 651 | |||||||||||||||||||||||||
Operating income | 117 | 597 | 513 | 838 | 1,103 | 768 | 989 | 1,227 | 2,860 | ||||||||||||||||||||||||||
Depreciation and amortization | 1,087 | 1,075 | 1,157 | 1,369 | 1,552 | 1,575 | 1,568 | 3,319 | 4,695 | ||||||||||||||||||||||||||
Cost of MetroPCS business combination | 128 | 34 | 193 | 21 | 36 | 59 | 15 | 355 | 110 | ||||||||||||||||||||||||||
Stock-based compensation (1) | 56 | 71 | 43 | 52 | 53 | 61 | 57 | 170 | 171 | ||||||||||||||||||||||||||
Other, net | — | 40 | 2 | — | 5 | 1 | 1 | 42 | 7 | ||||||||||||||||||||||||||
Adjusted EBITDA | $ | 1,388 | $ | 1,817 | $ | 1,908 | $ | 2,280 | $ | 2,749 | $ | 2,464 | $ | 2,630 | $ | 5,113 | $ | 7,843 | |||||||||||||||||
(1) | Stock-based compensation includes payroll tax impacts and may not agree to stock-based compensation expense in the condensed consolidated financial statements. |
Net debt (excluding Tower Obligations) to last twelve months adjusted EBITDA ratio is calculated as follows:
(in millions, except net debt ratio) | Mar 31, 2015 | Jun 30, 2015 | Sep 30, 2015 | Dec 31, 2015 | Mar 31, 2016 | Jun 30, 2016 | Sep 30, 2016 | ||||||||||||||||||||
Short-term debt | $ | 467 | $ | 386 | $ | 114 | $ | 182 | $ | 365 | $ | 258 | $ | 325 | |||||||||||||
Long-term debt to affiliates | 5,600 | 5,600 | 5,600 | 5,600 | 5,600 | 5,600 | 5,600 | ||||||||||||||||||||
Long-term debt (1) | 16,248 | 16,373 | 16,430 | 20,461 | 20,505 | 21,574 | 21,825 | ||||||||||||||||||||
Less: Cash and cash equivalents | (3,032 | ) | (2,642 | ) | (2,633 | ) | (4,582 | ) | (3,647 | ) | (5,538 | ) | (5,352 | ) | |||||||||||||
Less: Short-term investments | — | — | — | (2,998 | ) | (2,925 | ) | — | — | ||||||||||||||||||
Net Debt (excluding Tower Obligations) | $ | 19,283 | $ | 19,717 | $ | 19,511 | $ | 18,663 | $ | 19,898 | $ | 21,894 | $ | 22,398 | |||||||||||||
Divided by: Last twelve months Adjusted EBITDA | $ | 5,936 | $ | 6,302 | $ | 6,864 | $ | 7,393 | $ | 8,754 | $ | 9,401 | $ | 10,123 | |||||||||||||
Net Debt (excluding Tower Obligations) to Last Twelve Months Adjusted EBITDA Ratio | 3.2 | 3.1 | 2.8 | 2.5 | 2.3 | 2.3 | 2.2 | ||||||||||||||||||||
(1) | Long-term debt as of March 31, 2015 through December 31, 2015 has been restated for the adoption of Accounting Standards Update 2015-03, “Simplifying the Presentation of Debt Issuance Costs” in the first quarter of 2016. The impact to the Net Debt (excluding Tower Obligations) to Last Twelve Months Adjusted EBITDA Ratio was not significant. |
27
T-Mobile US, Inc.
Reconciliation of Non-GAAP Financial Measures to GAAP Financial Measures (continued)
(Unaudited)
Free cash flow and adjusted free cash flow are calculated as follows:
Quarter | Nine Months Ended September 30, | ||||||||||||||||||||||||||||||||||
(in millions) | Q1 2015 | Q2 2015 | Q3 2015 | Q4 2015 | Q1 2016 | Q2 2016 | Q3 2016 | 2015 | 2016 | ||||||||||||||||||||||||||
Net cash provided by operating activities | $ | 489 | $ | 1,161 | $ | 1,531 | $ | 2,233 | $ | 1,025 | $ | 1,768 | $ | 1,740 | $ | 3,181 | $ | 4,533 | |||||||||||||||||
Cash purchases of property and equipment | (982 | ) | (1,191 | ) | (1,120 | ) | (1,431 | ) | (1,335 | ) | (1,349 | ) | (1,159 | ) | (3,293 | ) | (3,843 | ) | |||||||||||||||||
Free Cash Flow | (493 | ) | (30 | ) | 411 | 802 | (310 | ) | 419 | 581 | (112 | ) | 690 | ||||||||||||||||||||||
MetroPCS CDMA network decommissioning payments | 71 | 103 | 76 | 95 | 63 | 66 | 43 | 250 | 172 | ||||||||||||||||||||||||||
Adjusted Free Cash Flow | $ | (422 | ) | $ | 73 | $ | 487 | $ | 897 | $ | (247 | ) | $ | 485 | $ | 624 | $ | 138 | $ | 862 | |||||||||||||||
Net cash used in investing activities | $ | (2,692 | ) | $ | (1,337 | ) | $ | (1,209 | ) | $ | (4,322 | ) | $ | (1,860 | ) | $ | (667 | ) | $ | (1,859 | ) | $ | (5,238 | ) | $ | (4,386 | ) | ||||||||
Net cash provided by (used in) financing activities | $ | (80 | ) | $ | (214 | ) | $ | (331 | ) | $ | 4,038 | $ | (100 | ) | $ | 790 | $ | (67 | ) | $ | (625 | ) | $ | 623 | |||||||||||
T-Mobile US, Inc.
Reconciliation of Operating Measures to Branded Postpaid Service Revenues
(Unaudited)
The following tables illustrate the calculation of our operating measures ARPU and ABPU and reconcile these measures to the related service revenues:
Quarter | Nine Months Ended September 30, | ||||||||||||||||||||||||||||||||||
(in millions, except average number of customers, ARPU and ABPU) | Q1 2015 | Q2 2015 | Q3 2015 | Q4 2015 | Q1 2016 | Q2 2016 | Q3 2016 | 2015 | 2016 | ||||||||||||||||||||||||||
Calculation of Branded Postpaid Phone ARPU | |||||||||||||||||||||||||||||||||||
Branded postpaid service revenues | $ | 3,774 | $ | 4,075 | $ | 4,197 | $ | 4,337 | $ | 4,302 | $ | 4,509 | $ | 4,647 | $ | 12,046 | $ | 13,458 | |||||||||||||||||
Less: Branded postpaid mobile broadband revenues | (109 | ) | (135 | ) | (165 | ) | (179 | ) | (182 | ) | (193 | ) | (193 | ) | (409 | ) | (568 | ) | |||||||||||||||||
Branded postpaid phone service revenues | $ | 3,665 | $ | 3,940 | $ | 4,032 | $ | 4,158 | $ | 4,120 | $ | 4,316 | $ | 4,454 | $ | 11,637 | $ | 12,890 | |||||||||||||||||
Divided by: Average number of branded postpaid phone customers (in thousands) and number of months in period | 26,313 | 27,250 | 28,003 | 28,849 | 29,720 | 30,537 | 30,836 | 27,189 | 30,364 | ||||||||||||||||||||||||||
Branded postpaid phone ARPU | $ | 46.43 | $ | 48.19 | $ | 47.99 | $ | 48.05 | $ | 46.21 | $ | 47.11 | $ | 48.15 | $ | 47.55 | $ | 47.17 | |||||||||||||||||
Calculation of Branded Postpaid ABPU | |||||||||||||||||||||||||||||||||||
Branded postpaid service revenues | $ | 3,774 | $ | 4,075 | $ | 4,197 | $ | 4,337 | $ | 4,302 | $ | 4,509 | $ | 4,647 | $ | 12,046 | $ | 13,458 | |||||||||||||||||
EIP billings | 1,292 | 1,393 | 1,409 | 1,400 | 1,324 | 1,344 | 1,394 | 4,094 | 4,062 | ||||||||||||||||||||||||||
Lease revenues | — | — | 30 | 194 | 342 | 367 | 353 | 30 | 1,062 | ||||||||||||||||||||||||||
Total billings for branded postpaid customers | $ | 5,066 | $ | 5,468 | $ | 5,636 | $ | 5,931 | $ | 5,968 | $ | 6,220 | $ | 6,394 | $ | 16,170 | $ | 18,582 | |||||||||||||||||
Divided by: Average number of branded postpaid customers (in thousands) and number of months in period | 27,717 | 28,797 | 29,838 | 31,013 | 32,140 | 33,125 | 33,632 | 28,784 | 32,966 | ||||||||||||||||||||||||||
Branded postpaid ABPU | $ | 60.94 | $ | 63.29 | $ | 62.96 | $ | 63.74 | $ | 61.90 | $ | 62.59 | $ | 63.38 | $ | 62.42 | $ | 62.63 | |||||||||||||||||
Calculation of Branded Prepaid ARPU | |||||||||||||||||||||||||||||||||||
Branded prepaid service revenues | $ | 1,842 | $ | 1,861 | $ | 1,894 | $ | 1,956 | $ | 2,025 | $ | 2,119 | $ | 2,182 | $ | 5,597 | $ | 6,326 | |||||||||||||||||
Divided by: Average number of branded prepaid customers (in thousands) and number of months in period | 16,238 | 16,396 | 16,853 | 17,330 | 17,962 | 18,662 | 19,134 | 16,496 | 18,586 | ||||||||||||||||||||||||||
Branded prepaid ARPU | $ | 37.81 | $ | 37.83 | $ | 37.46 | $ | 37.63 | $ | 37.58 | $ | 37.86 | $ | 38.01 | $ | 37.70 | $ | 37.82 | |||||||||||||||||
28
Definitions of Terms
Operating and financial measures are utilized by T-Mobile's management to evaluate its operating performance and, in certain cases, its ability to meet liquidity requirements. Although companies in the wireless industry may not define measures in precisely the same way, T-Mobile believes the measures facilitate key operating performance comparisons with other companies in the wireless industry to provide management, investors and analysts with useful information to assess and evaluate past performance and assist in forecasting future performance.
1. | Customer - SIM card with a unique T-Mobile mobile identity number which generates revenue. Branded customers generally include customers that are qualified either for postpaid service, where they generally pay after incurring service, or prepaid service, where they generally pay in advance. Wholesale customers include Machine-to-Machine (M2M) and Mobile Virtual Network Operator (MVNO) customers that operate on T-Mobile's network, but are managed by wholesale partners. |
2. | Churn - Number of customers whose service was disconnected as a percentage of the average number of customers during the specified period. The number of customers whose service was disconnected is presented net of customers that subsequently have their service restored within a certain period of time. |
3. | Customers per account - The number of branded postpaid customers as of the end of the period divided by the number of branded postpaid accounts as of the end of the period. An account may include branded postpaid phone and mobile broadband customers. |
4. | Average Revenue Per User (ARPU) - Average monthly service revenue earned from customers. Service revenues for the specified period divided by the average customers during the period, further divided by the number of months in the period. |
Branded postpaid phone ARPU excludes mobile broadband customers and related revenues.
Average Billings per User (ABPU) - Average monthly branded postpaid service revenue earned from customers plus monthly EIP billings and lease revenues divided by the average branded postpaid customers during the period, further divided by the number of months in the period. T-Mobile believes branded postpaid ABPU is indicative of estimated cash collections, including device financing payments, from T-Mobile's postpaid customers each month.
Service revenues - Branded postpaid, including handset insurance, branded prepaid, wholesale, and roaming and other service revenues.
5. | Cost of services - Costs directly attributable to providing wireless service through the operation of T-Mobile's network, including direct switch and cell site costs, such as rent, network access and transport costs, utilities, maintenance, associated labor costs, long distance costs, regulatory program costs, roaming fees paid to other carriers and data content costs. |
Cost of equipment sales - Costs of devices and accessories sold to customers and dealers, device costs to fulfill insurance and warranty claims, write-downs of inventory related to shrinkage and obsolescence, and shipping and handling costs.
Selling, general and administrative expenses - Costs not directly attributable to providing wireless service for the operation of sales, customer care and corporate activities. These include commissions paid to dealers and retail employees for activations and upgrades, labor and facilities costs associated with retail sales force and administrative space, marketing and promotional costs, customer support and billing, bad debt expense and administrative support activities.
6. | Net income margin - Margin % calculated as net income divided by service revenues. |
7. | Adjusted EBITDA - Earnings before interest expense, net of interest income, income tax expense, depreciation and amortization expense, non-cash stock-based compensation and certain expenses not reflective of T-Mobile's ongoing operating performance. Adjusted EBITDA is a non-GAAP financial measure utilized by T-Mobile's management to monitor the financial performance of its operations. T-Mobile uses Adjusted EBITDA internally as a metric to evaluate and compensate its personnel and management for their performance, and as a benchmark to evaluate T-Mobile's operating performance in comparison to its competitors. Management believes analysts and investors use Adjusted EBITDA as a supplemental measure to evaluate overall operating performance and facilitate comparisons with other wireless communications companies because it is indicative of T-Mobile's ongoing operating performance and trends by excluding the impact of interest expense from financing, non-cash depreciation and amortization from capital investments as well as non-cash stock-based compensation and certain other nonrecurring expenses. Adjusted EBITDA has limitations as an analytical tool and should not be considered in isolation or as a substitute for income from operations, net income or any other measure of financial performance reported in accordance with GAAP. The reconciliation of Adjusted EBITDA to net income is detailed in the Reconciliation of Non-GAAP Financial Measures to GAAP Financial Measures schedule. |
8. | Adjusted EBITDA Margin - Margin % calculated as Adjusted EBITDA divided by service revenues. |
9. | Cash capital expenditures - Amounts paid for construction and the purchase of property and equipment. |
10. | Smartphones - UMTS/HSPA/HSPA+ 21/HSPA+ 42/4G LTE enabled converged devices, which integrate voice and data services. |
11. | Free Cash Flow - Net cash provided by operating activities less cash capital expenditures for property and equipment. Free Cash Flow is utilized by T-Mobile's management, investors, and analysts to evaluate cash available to pay debt and provide further investment in the business. The reconciliation of Free Cash Flow to net cash provided by operating activities is detailed in the Reconciliation of Non-GAAP Financial Measures to GAAP Financial Measures schedule. |
12. | Adjusted Free Cash Flow - Free Cash Flow excluding decommissioning payments related to the shutdown of the CDMA portion of the MetroPCS network. |
13. | Net debt - Short-term debt, long-term debt to affiliates, and long-term debt (excluding tower obligations), less cash and cash equivalents and short-term investments. |
29
Forward-Looking Statements
This Investor Factbook includes "forward-looking statements" within the meaning of the U.S. federal securities laws. Any statements made herein that are not statements of historical fact, including statements about T-Mobile's plans, outlook, beliefs, opinion, projections, guidance, strategy, expected network modernization and other advancements, are forward-looking statements. Generally, forward-looking statements may be identified by words such as "anticipate," "expect," "suggests," "plan," “project,” "believe," "intend," "estimates," "targets," "views," "may," "will," "forecast," and other similar expressions. The forward-looking statements speak only as of the date made, are based on current assumptions and expectations, and involve a number of risks and uncertainties. Important factors that could affect future results and cause those results to differ materially from those expressed in the forward-looking statements include, among others, the following: our ability to compete in the highly competitive U.S. wireless telecommunications industry; adverse conditions in the U.S. and international economies and markets; significant capital commitments and the capital expenditures required to effect our business plan; our ability to adapt to future changes in technology, enhance existing offerings, and introduce new offerings to address customers' changing demands; changes in legal and regulatory requirements, including any change or increase in restrictions on our ability to operate our network; our ability to successfully maintain and improve our network, and the possibility of incurring additional costs in doing so; major equipment failures; severe weather conditions or other force majeure events; and other risks described in our filings with the Securities and Exchange Commission, including those described in our most recently filed Annual Report on Form 10-K. You should not place undue reliance on these forward-looking statements. We do not undertake to update forward-looking statements, whether as a result of new information, future events or otherwise, except as required by law.
About T-Mobile US, Inc.
As America's Un-carrier, T-Mobile US, Inc. (NASDAQ: TMUS) is redefining the way consumers and businesses buy wireless services through leading product and service innovation. The Company's advanced nationwide 4G LTE network delivers outstanding wireless experiences to 69.4 million customers who are unwilling to compromise on quality and value. Based in Bellevue, Washington, T-Mobile US provides services through its subsidiaries and operates its flagship brands, T-Mobile and MetroPCS. For more information, please visit http://www.T-Mobile.com or join the conversation on Twitter using $TMUS.
30