Attached files
| file | filename |
|---|---|
| EX-99.1 - EXHIBIT 99.1 - Independent Bank Group, Inc. | exhibit991q32016.htm |
| 8-K - 8-K - Independent Bank Group, Inc. | form8-kibgpressreleaseocto.htm |

Third Quarter 2016
Earnings Release Presentation
October 25, 2016
Exhibit 99.2

Safe Harbor Statement
2
From time to time, our comments and releases may contain “forward-looking statements” within the meaning of the Private Securities Litigation Reform Act
of 1995 (the “Act”). Forward-looking statements can be identified by words such as “believes,” “anticipates,” “expects,” “forecast,” “guidance,” “intends,”
“targeted,” “continue,” “remain,” “should,” “may,” “plans,” “estimates,” “will,” “will continue,” “will remain,” variations on such words or phrases, or
similar references to future occurrences or events in future periods; however, such words are not the exclusive means of identifying such statements.
Examples of forward-looking statements include, but are not limited to: (i) projections of revenues, expenses, income or loss, earnings or loss per share, and
other financial items; (ii) statements of plans, objectives, and expectations of Independent Bank Group or its management or Board of Directors; (iii)
statements of future economic performance; and (iv) statements of assumptions underlying such statements. Forward-looking statements are based on
Independent Bank Group’s current expectations and assumptions regarding its business, the economy, and other future conditions. Because forward-looking
statements relate to the future, they are subject to inherent uncertainties, risks, and changes in circumstances that are difficult to predict. Independent Bank
Group’s actual results may differ materially from those contemplated by the forward-looking statements, which are neither statements of historical fact nor
guarantees or assurances of future performance. Factors that could cause actual results to differ from those discussed in the forward-looking statements
include, but are not limited to: (1) local, regional, national, and international economic conditions and the impact they may have on us and our customers and
our assessment of that impact; (2) volatility and disruption in national and international financial markets; (3) government intervention in the U.S. financial
system, whether through changes in the discount rate or money supply or otherwise; (4) changes in the level of non-performing assets and charge-offs; (5)
changes in estimates of future reserve requirements based upon the periodic review thereof under relevant regulatory and accounting requirements; (6)
adverse conditions in the securities markets that lead to impairment in the value of securities in our investment portfolio; (7) inflation, deflation, changes in
market interest rates, developments in the securities market, and monetary fluctuations; (8) the timely development and acceptance of new products and
services and perceived overall value of these products and services by customers; (9) changes in consumer spending, borrowings, and savings habits; (10)
technological changes; (11) the ability to increase market share and control expenses; (12) changes in the competitive environment among banks, bank
holding companies, and other financial service providers; (13) the effect of changes in laws and regulations (including laws and regulations concerning taxes,
banking, securities, and insurance) with which we and our subsidiaries must comply; (14) the effect of changes in accounting policies and practices, as may
be adopted by the regulatory agencies, as well as the Public Company Accounting Oversight Board, the Financial Accounting Standards Board, and other
accounting standard setters; (15) the costs and effects of legal and regulatory developments including the resolution of legal proceedings; and (16) our
success at managing the risks involved in the foregoing items and (17) the other factors that are described in the Company’s Quarterly Report on Form 10-Q
for the quarter ended June 30, 2016, the Company’s Annual Report on Form 10-K filed on February 25, 2016, or the Prospectus Supplement filed pursuant to
Rule 424(b)(5) on June 23, 2016, under the heading “Risk Factors”, and other reports and statements filed by the Company with the SEC. Any forward-
looking statement made by the Company in this release speaks only as of the date on which it is made. Factors or events that could cause the Company’s
actual results to differ may emerge from time to time, and it is not possible for the Company to predict all of them. The Company undertakes no obligation to
publicly update any forward-looking statement, whether as a result of new information, future developments or otherwise, except as may be required by law.

Today's Presenters
David R. Brooks
Chairman of the Board, CEO and President, Director
• 37 years in the financial services industry; 29 years at Independent Bank
• Active in community banking since the early 1980s - led the investor group that
acquired Independent Bank in 1988
Michelle S. Hickox
Executive Vice President, Chief Financial Officer
•26 years in the financial services industry; 4 years at the Company
•Previously a Financial Services Audit Partner at McGladrey LLP
3

Third Quarter Key Highlights
• Core earnings were $14.8 million, or $0.80 per diluted share, compared to
$13.8 million, or $0.74 per diluted share, for second quarter 2016,
representing an increase of 7.7%
• Return on average assets above 1%
• Annualized organic loan growth of 10.2% for the quarter and 12.4% year to
date
• Improved core efficiency ratio of 52.07%, compared to 55.05% for second
quarter 2016
• Strong credit quality metrics as reflected by the nonperforming loans to
total loans ratio of 0.26% and the nonperforming assets to total assets ratio
of 0.23%
4

Third Quarter Selected Financial Data
($ in thousands except per share data)
As of and for the Quarter Ended
Balance Sheet Data September 30, 2016 June 30, 2016 September 30, 2015
Linked Quarter
Change Annual Change
Total assets $ 5,667,195 $ 5,446,797 $ 4,478,339 4.0 % 26.5 %
Loans held for investment (gross) 4,360,690 4,251,457 3,529,275 2.6 23.6
Total deposits 4,416,493 4,208,405 3,534,040 4.9 25.0
Total borrowings (excluding trust preferred securities) 577,974 578,169 334,485 — 72.8
Earnings and Profitability Data
Net interest income $ 45,737 $ 45,883 $ 38,089 (0.3 )% 20.1 %
Net interest margin 3.66 % 3.96 % 4.08 % (7.6 )% (10.3 )%
Non-interest income $ 4,932 $ 4,929 $ 3,799 0.1 % 29.8 %
Non-interest expense 26,887 31,023 25,830 (13.3 )% 4.1 %
Net income 14,504 11,809 8,202 22.8 % 76.8 %
Basic EPS $ 0.78 $ 0.64 $ 0.48 21.9 % 62.5 %
Diluted EPS $ 0.78 $ 0.64 $ 0.47 21.9 % 66.0 %
Core net interest margin (1) (2) 3.65 % 3.94 % 4.07 (7.4 )% (99.1 )%
Core net income (1) $ 14,819 $ 13,764 $ 8,917 7.7 % 66.2 %
Core basic EPS (1) $ 0.80 $ 0.75 $ 0.52 6.7 % 53.8 %
Core diluted EPS (1) $ 0.80 $ 0.74 $ 0.52 8.1 % 53.8 %
5
(1) See Appendix for Non-GAAP reconciliation
(2) Excludes income recognized on acquired loans of $116, $265 and $88, respectively.

Earnings Per Share and Core Earnings Per Share Trends (1)
Consistent Earnings Growth
(1) See Appendix for Non-GAAP reconciliation
6

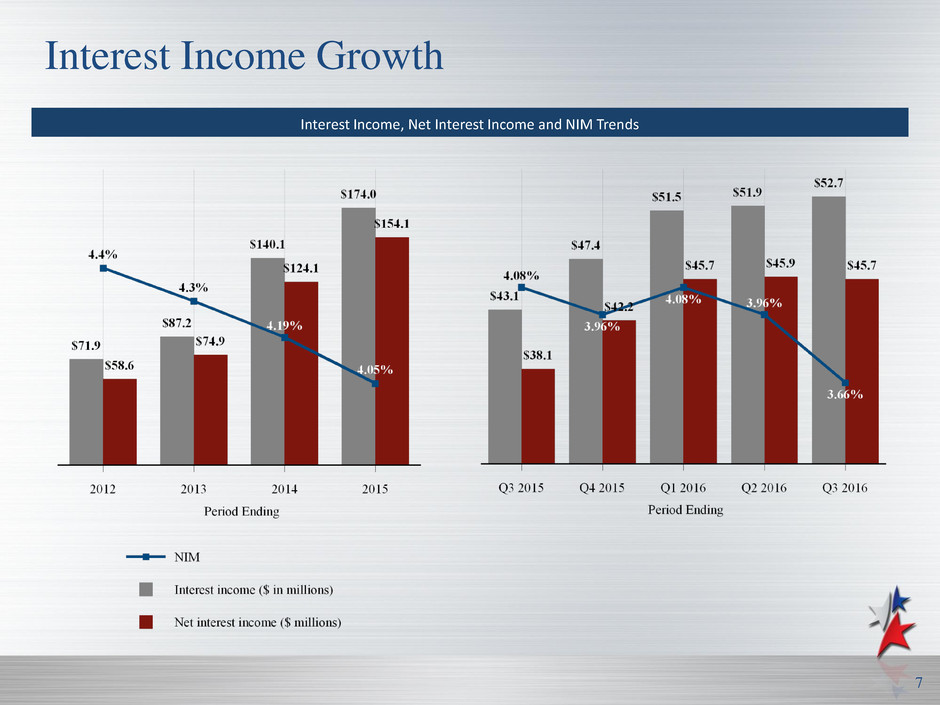
Interest Income Growth
7
Interest Income, Net Interest Income and NIM Trends
Core EPS (1)

Core Efficiency Ratio
Core Efficiency Ratio Trends (1)
(1) See Appendix for non-GAAP Reconciliation
8

Diversified Loan Portfolio
Loan Composition at 9/30/16 CRE Loan Composition at 9/30/16
Loans by Region
9

Historically Strong Credit Culture
10
NPLs / Loans
Note: Financial data as of and for years ended December 31, and quarter ended June 30, 2016 for peer data and September 30, 2016 for IBTX. Interim chargeoff data annualized.
Source: U.S. and Texas Commercial Bank numbers from SNL Financial.
NCOs / Average Loans

Provision expense and Net chargeoff trends
Provision and Chargeoffs
• Historically low chargeoffs
• Q3 2016 - $3MM chargeoff related to impaired energy loan
11
($ in thousands)

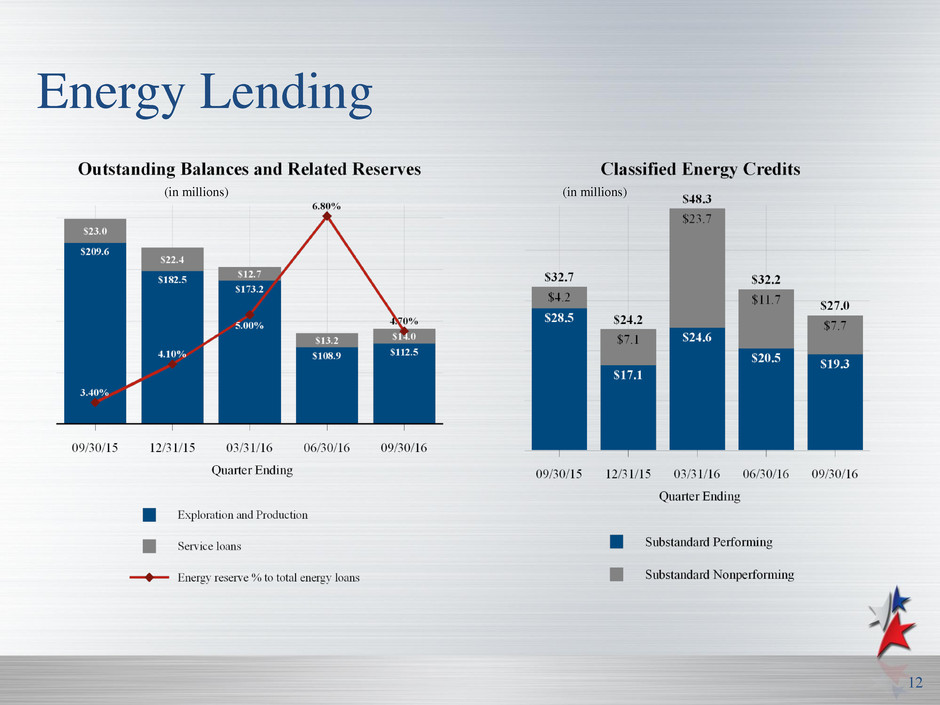
Energy Lending
(in millions)
12
(in millions)

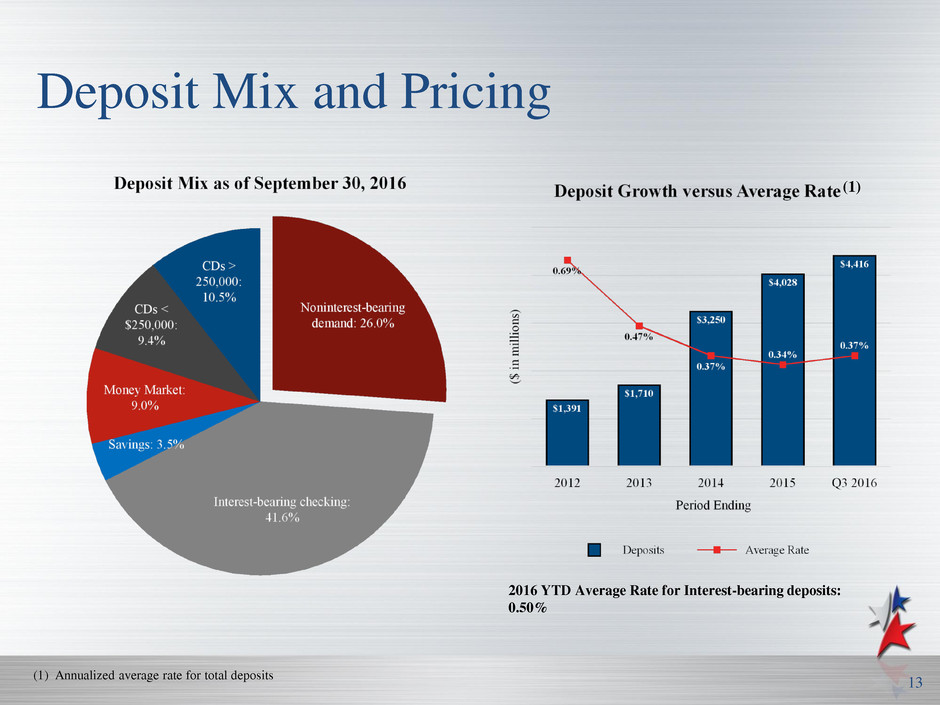
Deposit Mix and Pricing
(1)
(1) Annualized average rate for total deposits
2016 YTD Average Rate for Interest-bearing deposits:
0.50%
13

Capital
Total Capital and TCE/TA Ratios (1)
(1) See Appendix for non-GAAP Reconciliation 14

($ in thousands except per share data) September 30, 2016 June 30, 2016 March 31, 2016 December 31, 2015 September 30, 2015
Net Interest Income - Reported (a) 45,737 45,883 45,660 42,151 38,089
Income recognized on acquired loans (116 ) (265 ) (1,333 ) (516 ) (88 )
Adjusted Net Interest Income (b) 45,621 45,618 44,327 41,635 38,001
Provision Expense - Reported (c) 2,123 2,123 2,997 1,970 3,932
Noninterest Income - Reported (d) 4,932 4,929 4,470 4,254 3,799
Gain on sale of loans — — — — (116 )
Loss on sale of branch 43 — — — —
Gain on Sale of OREO/repossessed assets (4 ) (10 ) (48 ) (70 ) (41 )
Gain on sale of securities — (4 ) — (44 ) —
Loss / (Gain) on Sale of PP&E 9 (3 ) (38 ) (16 ) 374
Adjusted Noninterest Income (e) 4,980 4,912 4,384 4,124 4,016
Noninterest Expense - Reported (f) 26,887 31,023 28,519 28,527 25,830
Senior leadership restructuring — (2,575 ) —
OREO Impairment (51 ) — (55 ) — (10 )
IPO related stock grant and bonus expense (104 ) (156 ) (156 ) (156 ) (156 )
Acquisition Expense (384 ) (475 ) (1,187 ) (1,487 ) (770 )
Adjusted Noninterest Expense (g) 26,348 27,817 27,121 26,884 24,894
Core net income (1) (b) - (c) + (e) - (g)= (h) 14,819 13,764 12,438 11,377 8,917
Core Efficiency Ratio (g) / (b + e) 52.07 % 55.05 % 55.68 % 58.75 % 59.25 %
Average shares for basic EPS (i) 18,478,289 18,469,182 18,444,284 17,965,055 17,110,090
Average shares for diluted EPS (j) 18,568,622 18,547,074 18,528,031 18,047,960 17,199,281
Core basic EPS (h) / (i) $ 0.80 $ 0.75 $ 0.67 $ 0.63 $ 0.52
Core diluted EPS (h) / (j) $ 0.80 $ 0.74 $ 0.67 $ 0.63 $ 0.52
Supplemental Information - Non-GAAP Financial Measures (unaudited)
Reconciliation of Core Earnings and Core EPS--Quarterly Periods
APPENDIX
(1) Assumes actual effective tax rate of 33.0%, 33.2%, 33.1%, 32.7%, and 32.4%, for the quarters ended September 30, 2016, June 30, 2016, March 31, 2016, December 31, 2015, and September 30,
2015, respectively. 15

($ in thousands except per share data) Year Ended December 31,
2013 2014 2015
Net Interest Income - Reported (a) $ 74,933 $ 124,145 $ 154,098
Write-off of debt origination warrants 223 — —
Income recognized on acquired loans (1,399 ) (1,960 ) (1,272 )
Adjusted Net Interest Income (b) $ 73,759 $ 122,187 $ 152,828
Provision Expense - Reported (c) 3,822 5,359 9,231
Noninterest Income - Reported (d) 11,021 13,624 16,128
Gain on sale of loans — (1,078 ) (116 )
Loss on Sale of OREO/repossessed assets (1,507 ) (71 ) (290 )
Gain on sale of securities — (362 ) (134 )
Gain on Sale of PP&E 18 22 358
Adjusted Noninterest Income (e) 9,532 12,135 15,946
Noninterest Expense - Reported (f) 57,671 88,512 103,198
Adriatica expenses (806 ) (23 ) —
OREO Impairment (642 ) (22 ) (35 )
FDIC refund 504 — —
IPO related stock grant and bonus expense (948 ) (630 ) (624 )
Registration statements — (619 ) —
Core system conversion — (265 ) —
Acquisition Expense (1,956 ) (9,237 ) (3,954 )
Adjusted Noninterest Expense (g) 53,823 77,716 98,585
Core net income (1) (b) - (c) + (e) - (g)= (h) $ 17,232 $ 34,427 $ 41,056
Core Efficiency Ratio (g) / (b + e) 64.62 % 57.86 % 58.41 %
Average shares for basic EPS (i) 11,143,726 15,458,666 17,321,513
Average shares for diluted EPS (j) 11,212,194 15,557,120 17,406,108
Core basic EPS (h) / (i) $ 1.55 $ 2.23 $ 2.37
Core diluted EPS (h) / (j) $ 1.54 $ 2.21 $ 2.36
Supplemental Information - Non-GAAP Financial Measures (unaudited)
Reconciliation of Core Earnings and Core EPS--Annual Periods
APPENDIX
(1) Assumes actual effective tax rate of 32.8%, 32.8% and 32.6% for the year ended December 31, 2013, 2014 and 2015, respectively.
16

Supplemental Information - Non-GAAP Financial Measures (unaudited)
Reconciliation of Tangible Book Value per Common Share
APPENDIX
Tangible Book Value Per Common Share 9/30/16 6/30/16 3/31/16 12/31/2015 12/31/14 12/31/13
($ in thousands)
Tangible Common Equity
Total common stockholders' equity $ 643,253 $ 629,628 $ 616,258 $ 603,371 $ 516,913 $ 233,772
Adjustments:
Goodwill (258,319 ) (258,319 ) (258,319 ) (258,643 ) (229,457 ) (34,704 )
Core deposit intangibles, net (14,669 ) (15,161 ) (15,653 ) (16,357 ) (12,455 ) (3,148 )
Tangible common equity $ 370,265 $ 356,148 $ 342,286 $ 328,371 $ 275,001 $ 195,920
Tangible assets 5,394,207 5,173,317 4,987,995 4,780,000 3,890,727 2,126,132
Tangible common equity to tangible assets 6.86 % 6.88 % 6.86 % 6.87 % 7.07 % 9.21 %
17
