Attached files
| file | filename |
|---|---|
| 8-K - 8-K - Alliance HealthCare Services, Inc | d275408d8k.htm |
| Exhibit 99.1
|
Alliance HealthCare Services
Investor Presentation
October 24, 2016
1
|
|
Disclaimer
During the course of this presentation, the Company may make projections or other forward-looking statements regarding, among other things, our business outlook, operations and strategy; service areas; competition; changes in laws and regulations and the impact of such changes on us; our estimates for future performance and operating results, including future revenues, cash flows and capital requirements. In some cases you can identify these statements by words such as “could,” “may,” “expects,” “anticipates,” “believes,” “intends,” “estimates,” or similar words. These forward-looking statements are based largely on the Company’s current expectations and are subject to a number of known or unknown risks and uncertainties (some of which are beyond the Company’s control). We urge you to review the factors discussed under the caption “Risk Factors” in the Company’s Form 10-K for the year ended December 31, 2015, and the Company’s Form 10Q for the quarter ended March 30, 2016, filed with the Securities and Exchange Commission. In light of these risks and uncertainties, there can be no assurance that the forward-looking statements made during this presentation will in fact be realized. Except as otherwise required by applicable securities laws, we disclaim any intention or obligation to publicly update or revise forward-looking statements, whether as a result of new information, future events or otherwise.
2
|
|
Disclaimer
This presentation includes certain supplemental measures of our performance and liquidity that are not required by, or presented in accordance with, U.S. generally accepted accounting principles (“GAAP“), including Adjusted EBITDA. We present Adjusted EBITDA because we believe that, in addition to GAAP metrics, this non-GAAP metric is a useful measure for investors, for a variety of reasons. Our management regularly communicates Adjusted EBITDA and their interpretation of such results to our board of directors. We also compare actual periodic Adjusted EBITDA against internal targets as a key factor in determining cash incentive compensation for executives and other employees, largely because we view Adjusted EBITDA results as indicative of how our radiology, radiation oncology and interventional healthcare services businesses are performing and are being managed. Adjusted EBITDA is a non-GAAP financial measures and should not be considered as an alternative to net (loss) income attributable to Alliance HealthCare Services, Inc. as a measure of financial performance or cash flows from operations as a measure of liquidity, or any other performance measure derived in accordance with GAAP. The presentation of a non-GAAP metric does not imply that the reconciling items presented are non-recurring, infrequent or unusual. In general, non-GAAP metrics have certain limitations as analytical financial measures and are used in conjunction with GAAP results to evaluate our operating performance and by considering independently the economic effects of the items that are, or are not, reflected in non-GAAP metrics. We compensate for such limitations by providing GAAP-based disclosures concerning the excluded items in our financial disclosures. As a result of these limitations, and because non-GAAP metrics may not be directly comparable to similarly titled measures reported by other companies, however, the non-GAAP metrics are not an alternative to the most directly comparable GAAP measure, or as an alternative to any other GAAP measure of operating performance. Please refer to page 44 of this presentation for reconciliations of Adjusted EBITDA attributable to Alliance HealthCare Services, Inc. The term “LTM ended June 30, 2016” used in this presentation means last twelve months ended June 30, 2016, which data has been calculated by subtracting the data for the six months ended June 30, 2015 from the data for the year ended December 31, 2015 and adding the data for the six months ended June 30, 2016.
3
|
|
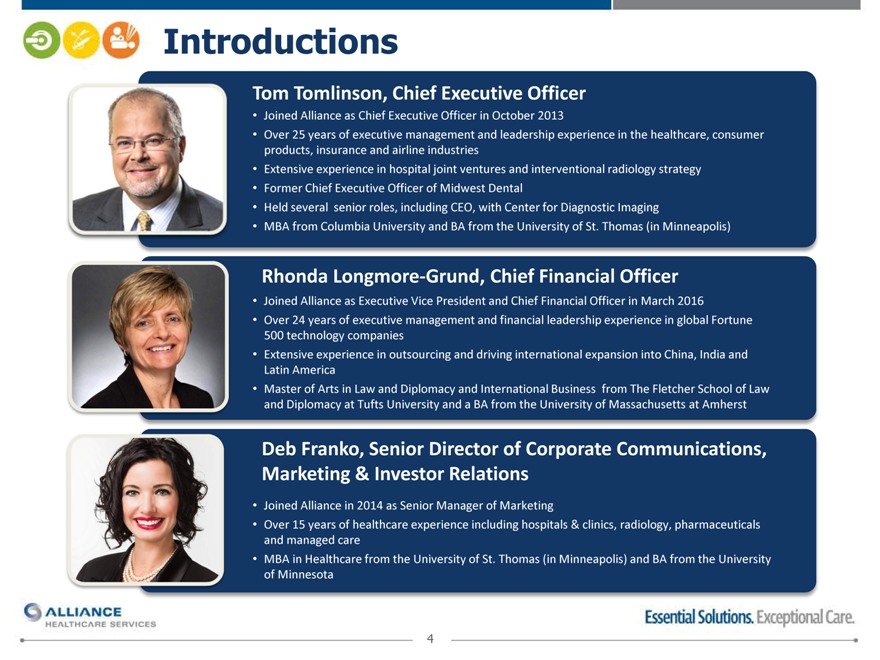
Introductions
Tom Tomlinson, Chief Executive Officer
Joined Alliance as Chief Executive Officer in October 2013
Over 25 years of executive management and leadership experience in the healthcare, consumer products, insurance and airline industries
Extensive experience in hospital joint ventures and interventional radiology strategy
Former Chief Executive Officer of Midwest Dental
Held several senior roles, including CEO, with Center for Diagnostic Imaging
MBA from Columbia University and BA from the University of St. Thomas (in Minneapolis)
Rhonda Longmore-Grund, Chief Financial Officer
Joined Alliance as Executive Vice President and Chief Financial Officer in March 2016
Over 24 years of executive management and financial leadership experience in global Fortune 500 technology companies
Extensive experience in outsourcing and driving international expansion into China, India and Latin America
Master of Arts in Law and Diplomacy and International Business from The Fletcher School of Law and Diplomacy at Tufts University and a BA from the University of Massachusetts at Amherst
Deb Franko, Senior Director of Corporate Communications, Marketing & Investor Relations
Joined Alliance in 2014 as Senior Manager of Marketing
Over 15 years of healthcare experience including hospitals & clinics, radiology, pharmaceuticals and managed care
MBA in Healthcare from the University of St. Thomas (in Minneapolis) and BA from the University of Minnesota
4
|
|
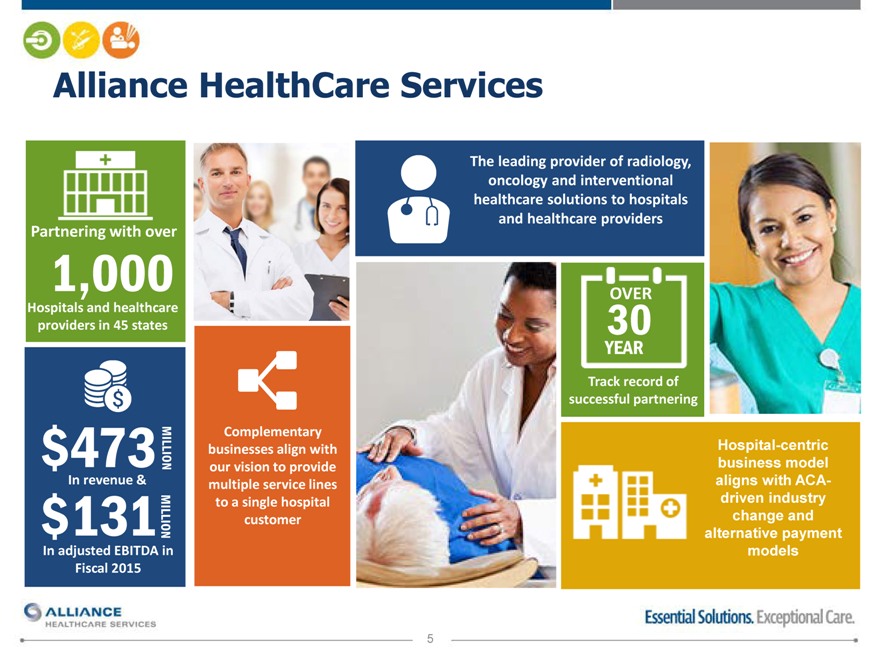
Alliance HealthCare Services
The leading provider of radiology,
oncology and interventional
healthcare solutions to hospitals
and healthcare providers
Partnering with over
1,000 OVER
Hospitals and healthcare
providers in 45 states 30
YEAR
Track record of
successful partnering
Complementary
$473 MILLION businesses align with Hospital-centric
our vision to provide business model
In revenue & multiple service lines aligns with ACA-
$131 to a single hospital driven industry
MILLION customer alternative change payment and
In adjusted EBITDA in models
Fiscal 2015
5
|
|
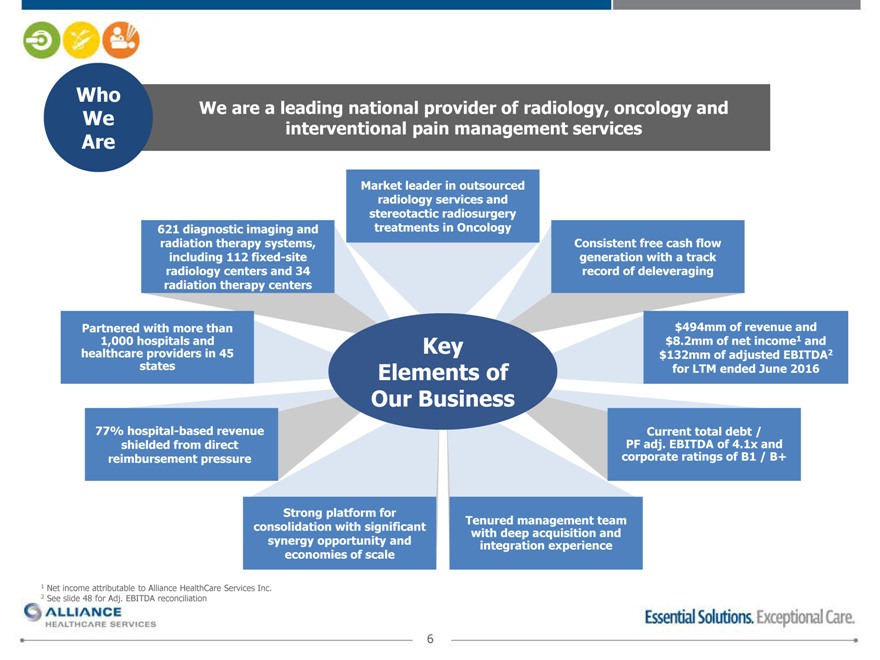
Who
We We are a leading national provider of radiology, oncology and
Are interventional pain management services
Market leader in outsourced
radiology services and
stereotactic radiosurgery
621 diagnostic imaging and treatments in Oncology
radiation therapy systems, Consistent free cash flow
including 112 fixed-site generation with a track
radiology centers and 34 record of deleveraging
radiation therapy centers
Partnered with more than $494mm of revenue and
1,000 hospitals and Key $8.2mm of net income1 and
healthcare providers in 45 $132mm of adjusted EBITDA2
states Elements offor LTM ended June 2016
Our Business
77% hospital-based revenue Current total debt /
shielded from direct PF adj. EBITDA of 4.1x and
reimbursement pressure corporate ratings of B1 / B+
Strong platform for
consolidation with significant Tenured management team
with deep acquisition and
synergy opportunity and integration experience
economies of scale
1 Net income attributable to Alliance HealthCare Services Inc.
2 See slide 48 for Adj. EBITDA reconciliation
6
|
|
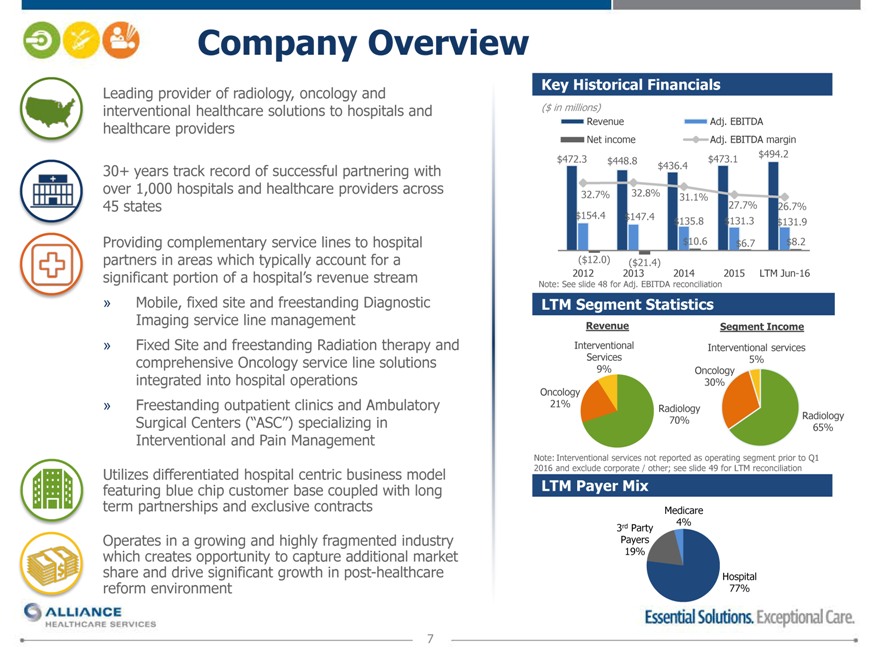
Company Overview
Leading provider of radiology, oncology and interventional healthcare solutions to hospitals and healthcare providers
30+ years track record of successful partnering with over 1,000 hospitals and healthcare providers across 45 states
Providing complementary service lines to hospital partners in areas which typically account for a significant portion of a hospital’s revenue stream
Mobile, fixed site and freestanding Diagnostic Imaging service line management
Fixed Site and freestanding Radiation therapy and comprehensive Oncology service line solutions integrated into hospital operations
Freestanding outpatient clinics and Ambulatory Surgical Centers (“ASC”) specializing in Interventional and Pain Management
Utilizes differentiated hospital centric business model featuring blue chip customer base coupled with long term partnerships and exclusive contracts
Operates in a growing and highly fragmented industry which creates opportunity to capture additional market share and drive significant growth in post-healthcare reform environment
Key Historical Financials
($ in millions)
Revenue Adj. EBITDA
Net income Adj. EBITDA margin
$472.3 $448.8 $473.1$494.2
$436.4
32.7% 32.8% 31.1%
27.7%26.7%
$154.4 $147.4 $135.8$131.3$131.9
$10.6$6.7$8.2
($12.0) ($21.4)
2012 2013 20142015LTM Jun-16
Note: See slide 48 for Adj. EBITDA reconciliation
LTM Segment Statistics
Revenue Segment Income
Interventional Interventional services
Services 5%
9% Oncology
30%
Oncology
21% Radiology
70%Radiology
65%
Note: Interventional services not reported as operating segment prior to Q1
2016 and exclude corporate / other; see slide 49 for LTM reconciliation
LTM Payer Mix
Medicare
3rd Party 4%
Payers
19%
Hospital
77%
7
|
|
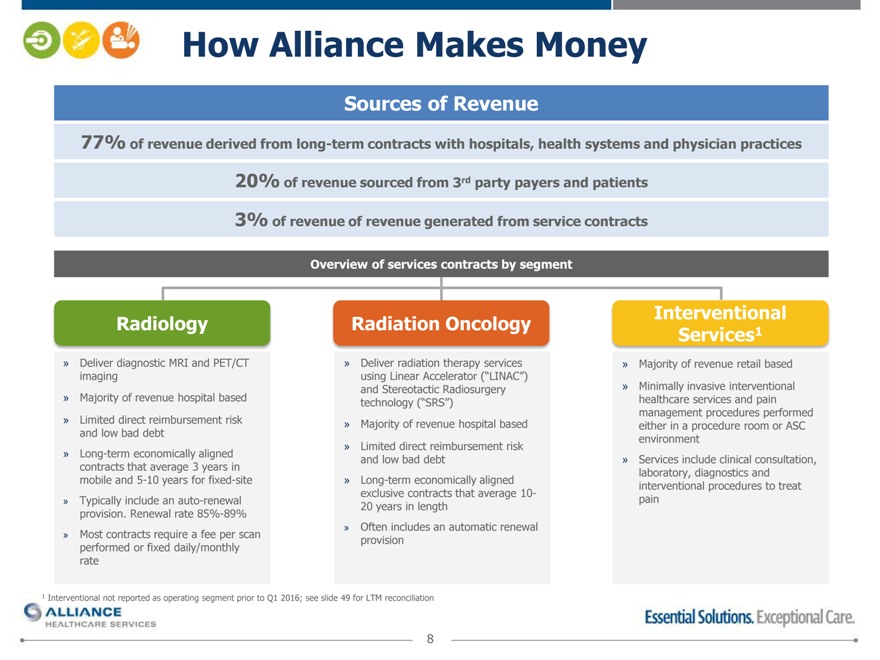
How Alliance Makes Money
Sources of Revenue
77% of revenue derived from long-term contracts with hospitals, health systems and physician practices 20% of revenue sourced from 3rd party payers and patients 3% of revenue of revenue generated from service contracts
Overview of services contracts by segment
Radiology Radiation Oncology Interventional
Services1
Deliver diagnostic MRI and PET/CT Deliver radiation therapy services
imaging using Linear Accelerator (“LINAC”)
and Stereotactic Radiosurgery
Majority of revenue hospital based technology (“SRS”)
Limited direct reimbursement risk Majority of revenue hospital based
and low bad debt
Limited direct reimbursement risk
Long-term economically aligned and low bad debt
contracts that average 3 years in
mobile and 5-10 years for fixed-site Long-term economically aligned
exclusive contracts that average 10-
Typically include an auto-renewal 20 years in length
provision. Renewal rate 85%-89%
Often includes an automatic renewal
Most contracts require a fee per scan provision
performed or fixed daily/monthly
rate
1 Interventional not reported as operating segment prior to Q1 2016; see slide 49 for LTM reconciliation
Minimally invasive interventional healthcare services and pain management procedures performed either in a procedure room or ASC environment
Services include clinical consultation, laboratory, diagnostics and interventional procedures to treat pain
8
|
|
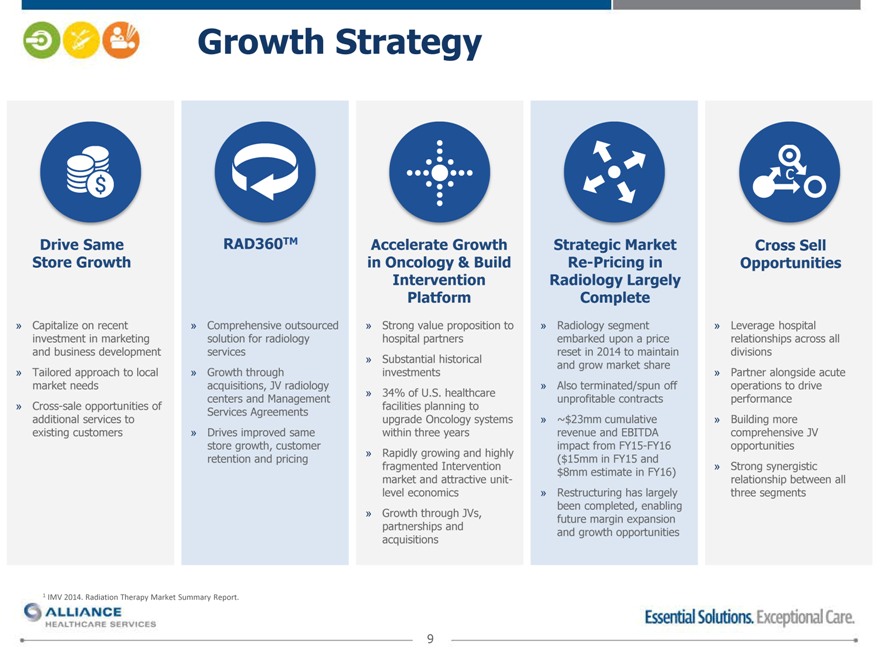
Growth Strategy Industry Leading Provider and Platforms
Drive Same Store Growth
Capitalize on recent investment in marketing and business development
Tailored approach to local market needs
Cross-sale opportunities of additional services to existing customers
RAD360TM
Comprehensive outsourced solution for radiology services
Growth through acquisitions, JV radiology centers and Management Services Agreements
Drives improved same store growth, customer retention and pricing
1 IMV 2014. Radiation Therapy Market Summary Report.
Accelerate Growth in Oncology & Build Intervention Platform
Strong value proposition to hospital partners
Substantial historical investments
34% of U.S. healthcare facilities planning to upgrade Oncology systems within three years
Rapidly growing and highly fragmented Intervention market and attractive unit- level economics
Growth through JVs, partnerships and acquisitions
Strategic Market Re-Pricing in Radiology Largely Complete
Radiology segment embarked upon a price reset in 2014 to maintain and grow market share
Also terminated/spun off unprofitable contracts
» ~$23mm cumulative
revenue and EBITDA
impact from FY15-FY16
($15mm in FY15 and
$8mm estimate in FY16)
Restructuring has largely been completed, enabling future margin expansion and growth opportunities
c
Cross Sell Opportunities
Leverage hospital relationships across all divisions
Partner alongside acute operations to drive performance
Building more comprehensive JV opportunities
Strong synergistic relationship between all three segments
9
|
|
Business Overview
10
|
|
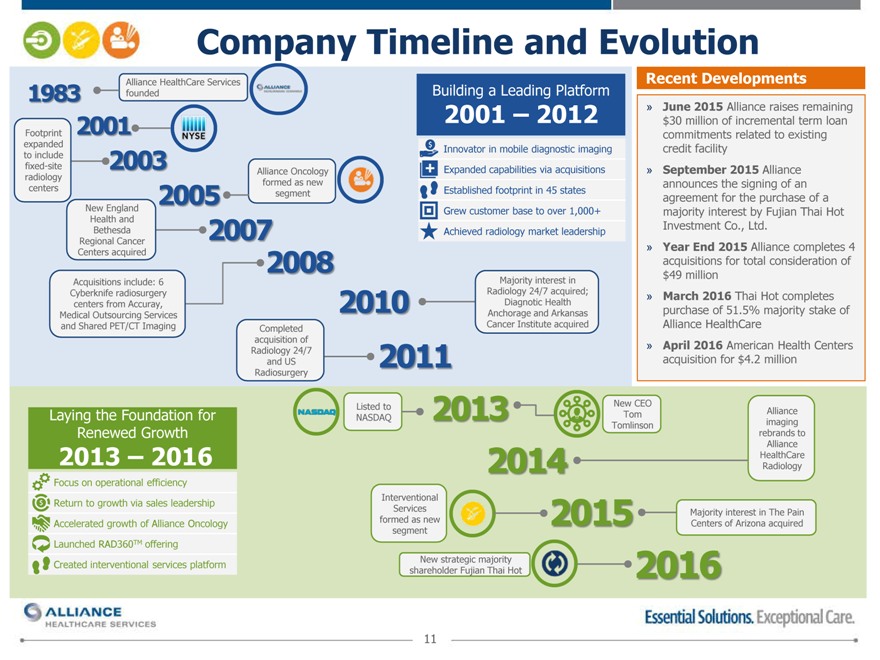
Company Timeline and Evolution
Alliance HealthCare Services
1983 founded Building a Leading Platform
2001 2001 – 2012
Footprint
expande Innovator in mobile diagnostic imaging
to include
fixed-site 2003 Alliance OncologyExpanded capabilities via acquisitions
radiology formed as new
centers 2005 segment Established footprint in 45 states
New England Grew customer base to over 1,000+
Health and
Bethesda 2007Achieved radiology market leadership
Regional Cancer
Centers acquired 2008
Acquisitions include: 6 Majority interest in
Cyberknife radiosurgery Radiology 24/7 acquired;
centers from Accuray, 2010Diagnotic Health
Medical Outsourcing Services Anchorage and Arkansas
and Shared PET/CT Imaging CompletedCancer Institute acquired
acquisition of
Radiology 24/7
and US2011
Radiosurgery
Recent Developments
June 2015 Alliance raises remaining $30 million of incremental term loan commitments related to existing credit facility
September 2015 Alliance announces the signing of an agreement for the purchase of a majority interest by Fujian Thai Hot Investment Co., Ltd.
Year End 2015 Alliance completes 4 acquisitions for total consideration of $49 million
March 2016 Thai Hot completes purchase of 51.5% majority stake of Alliance HealthCare
April 2016 American Health Centers acquisition for $4.2 million
Listed to 2013New CEO
Laying the Foundation for NASDAQ Tom imaging Alliance
Renewed Growth Tomlinsonrebrands to
Alliance
HealthCare
2013 – 2016 2014Radiology
Focus on operational efficiency
Interventional
Return to growth via sales leadership ServicesMajority interest in The Pain
Accelerated growth of Alliance Oncology formed as new 2015Centers of Arizona acquired
segment
Launched RAD360TM offering
Created interventional services platform New strategic majority
shareholder Fujian Thai Hot2016
11
|
|
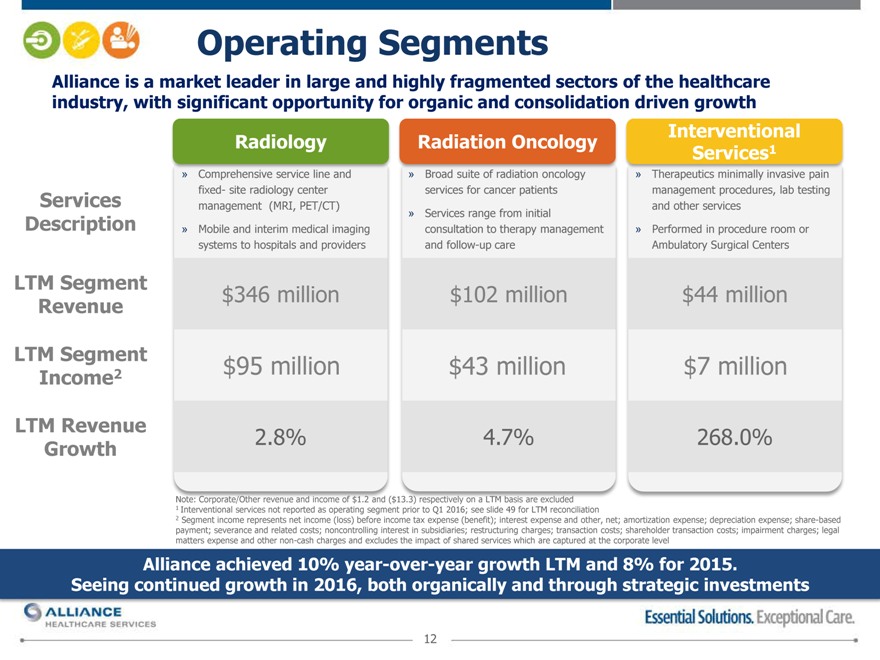
Operating Segments
Alliance is a market leader in large and highly fragmented sectors of the healthcare industry, with significant opportunity for organic and consolidation driven growth
RadiologyRadiation Oncology
» Comprehensive service line and” Broad suite of radiation oncology
fixed- site radiology centerservices for cancer patients
Services management (MRI, PET/CT)
Description » Mobile and interim medical imaging” consultation Services range to from therapy initial management
systems to hospitals and providers and follow-up care
LTM Segment $346 million$102 million
Revenue
Interventional Services1
Therapeutics minimally invasive pain management procedures, lab testing and other services
Performed in procedure room or Ambulatory Surgical Centers
$44 million
LTM Segment $95 million $43 million$7 million
Income2
LTM Revenue 2.8% 4.7%268.0%
Growth
Note: Corporate/Other revenue and income of $1.2 and ($13.3) respectively on a LTM basis are excluded 1 Interventional services not reported as operating segment prior to Q1 2016; see slide 49 for LTM reconciliation
2 Segment income represents net income (loss) before income tax expense (benefit); interest expense and other, net; amortization expense; depreciation expense; share-based payment; severance and related costs; noncontrolling interest in subsidiaries; restructuring charges; transaction costs; shareholder transaction costs; impairment charges; legal matters expense and other non-cash charges and excludes the impact of shared services which are captured at the corporate level
Alliance achieved 10% year-over-year growth LTM and 8% for 2015. Seeing continued growth in 2016, both organically and through strategic investments
12
|
|
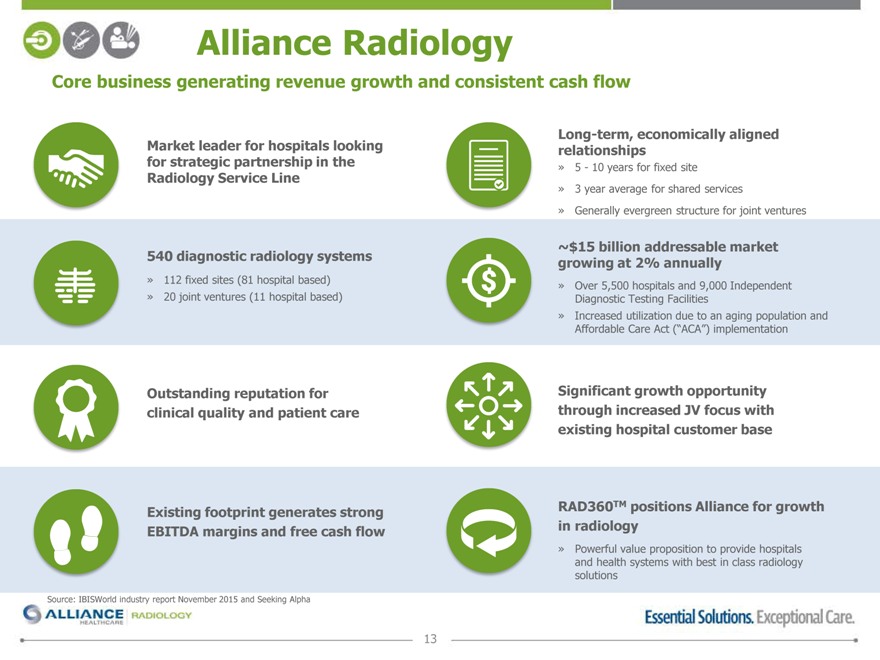
Alliance Radiology
Core business generating revenue growth and consistent cash flow
Long-term, economically aligned
Market leader for hospitals looking relationships
for strategic partnership in the » 5—10 years for fixed site
Radiology Service Line
» 3 year average for shared services
» Generally evergreen structure for joint ventures
~$15 billion addressable market
540 diagnostic radiology systems growing at 2% annually
» 112 fixed sites (81 hospital based) » Over 5,500 hospitals and 9,000 Independent
» 20 joint ventures (11 hospital based) Diagnostic Testing Facilities
» Increased utilization due to an aging population and
Affordable Care Act (“ACA”) implementation
Outstanding reputation for Significant growth opportunity
clinical quality and patient care through increased JV focus with
existing hospital customer base
Existing footprint generates strong
EBITDA margins and free cash flow
RAD360TM positions Alliance for growth
in radiology
Powerful value proposition to provide hospitals and health systems with best in class radiology solutions
Source: IBISWorld industry report November 2015 and Seeking Alpha
13
|
|
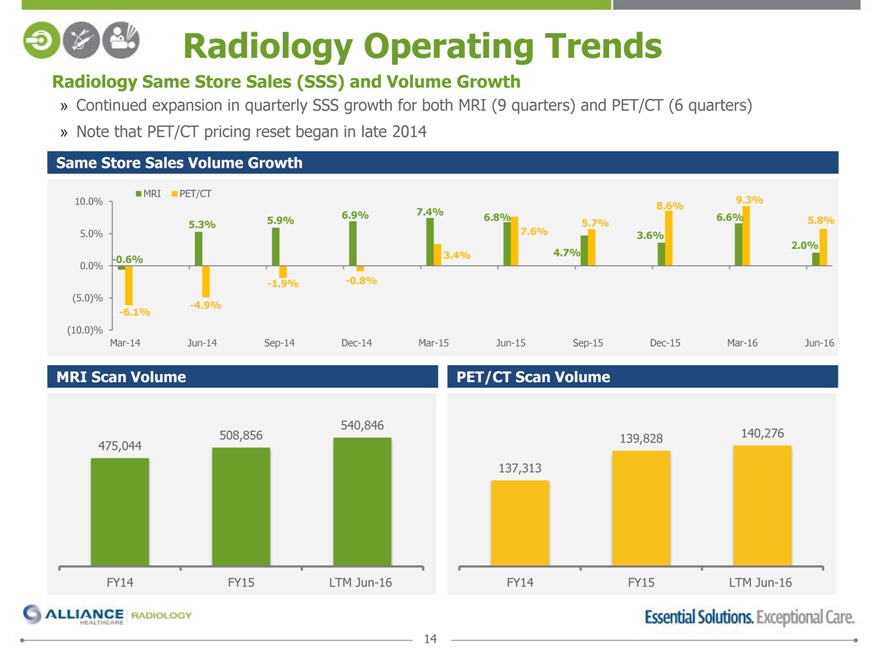
Radiology Operating Trends
Radiology Same Store Sales (SSS) and Volume Growth
Continued expansion in quarterly SSS growth for both MRI (9 quarters) and PET/CT (6 quarters)
Note that PET/CT pricing reset began in late 2014
Same Store Sales Volume Growth
MRI PET/CT
10.0% 8.6%9.3%
5.9%6.9%7.4%6.8%6.6%
5.3% 5.7%5.8%
5.0% 7.6%3.6%
2.0%
-0.6% 3.4%4.7%
0.0%
-1.9%-0.8%
(5.0)%
-6.1% -4.9%
(10.0)%
Mar-14 Jun-14 Sep-14Dec-14Mar-15Jun-15Sep-15Dec-15Mar-16Jun-16
MRI Scan Volume PET/CT Scan Volume
540,846
475,044 508,856139,828140,276
137,313
FY14
FY15
LTM Jun-16
FY14
FY15
LTM Jun-16
14
|
|
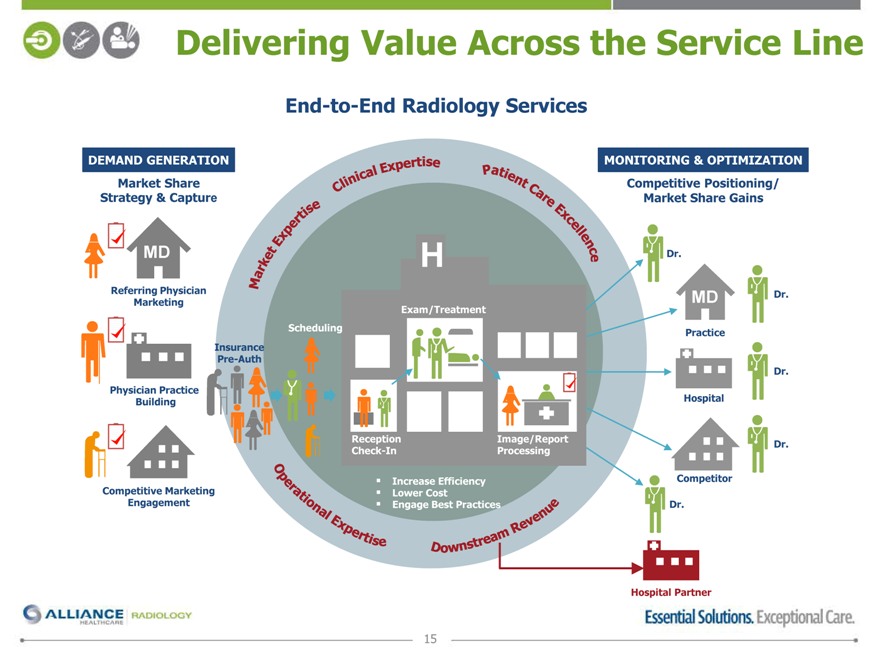
Delivering Value Across the Service Line
End-to-End Radiology Services
DEMAND GENERATION MONITORING & OPTIMIZATION
Market Share Competitive Positioning/
Strategy & Capture Market Share Gains
MD H Dr.
Referring Physician MDDr.
Marketing Exam/Treatment
Scheduling Practice
Insurance
Pre-Auth
Dr.
Physician Practice
Building Hospital
ReceptionImage/Report Dr.
Check-InProcessing
Increase EfficiencyCompetitor
Competitive Marketing Lower Cost
Engagement Engage Best Practices Dr.
Hospital Partner
15
|
|
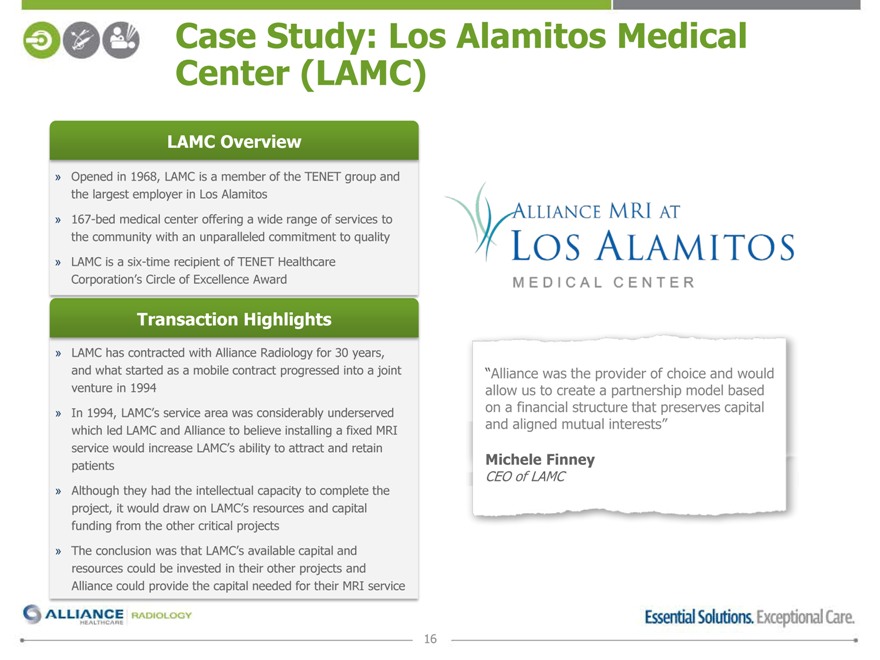
Case Center Study: (LAMC) Los Alamitos Medical
LAMC Overview
Opened in 1968, LAMC is a member of the TENET group and the largest employer in Los Alamitos
167-bed medical center offering a wide range of services to the community with an unparalleled commitment to quality
LAMC is a six-time recipient of TENET Healthcare Corporation’s Circle of Excellence Award
Transaction Highlights
LAMC has contracted with Alliance Radiology for 30 years, and what started as a mobile contract progressed into a joint venture in 1994
In 1994, LAMC’s service area was considerably underserved which led LAMC and Alliance to believe installing a fixed MRI service would increase LAMC’s ability to attract and retain patients
Although they had the intellectual capacity to complete the project, it would draw on LAMC’s resources and capital funding from the other critical projects
The conclusion was that LAMC’s available capital and resources could be invested in their other projects and Alliance could provide the capital needed for their MRI service
“Alliance was the provider of choice and would allow us to create a partnership model based on a financial structure that preserves capital and aligned mutual interests”
Michele Finney
CEO of LAMC
16
|
|
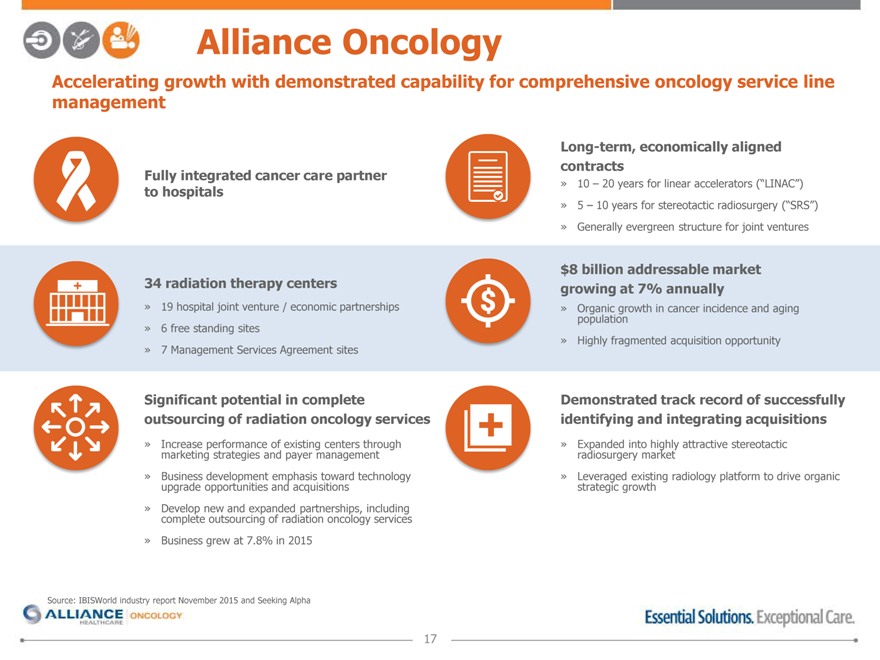
Alliance Oncology
Accelerating growth with demonstrated capability for comprehensive oncology service line management
Fully integrated cancer care partner to hospitals
34 radiation therapy centers
19 hospital joint venture / economic partnerships
6 free standing sites
7 Management Services Agreement sites
Significant potential in complete outsourcing of radiation oncology services
Increase performance of existing centers through marketing strategies and payer management
Business development emphasis toward technology upgrade opportunities and acquisitions
Develop new and expanded partnerships, including complete outsourcing of radiation oncology services
Business grew at 7.8% in 2015
Source: IBISWorld industry report November 2015 and Seeking Alpha
Long-term, economically aligned $99 .4 contracts
10 – 20 years for linear accelerators (“LINAC”)
5 – 10 years for stereotactic radiosurgery (“SRS”)
Generally evergreen structure for joint ventures
$8 billion addressable market
growing at 7% annually
Organic growth in cancer incidence and aging population
Highly fragmented acquisition opportunity
Demonstrated track record of successfully identifying and integrating acquisitions
Expanded into highly attractive stereotactic radiosurgery market
Leveraged existing radiology platform to drive organic strategic growth
17
|
|
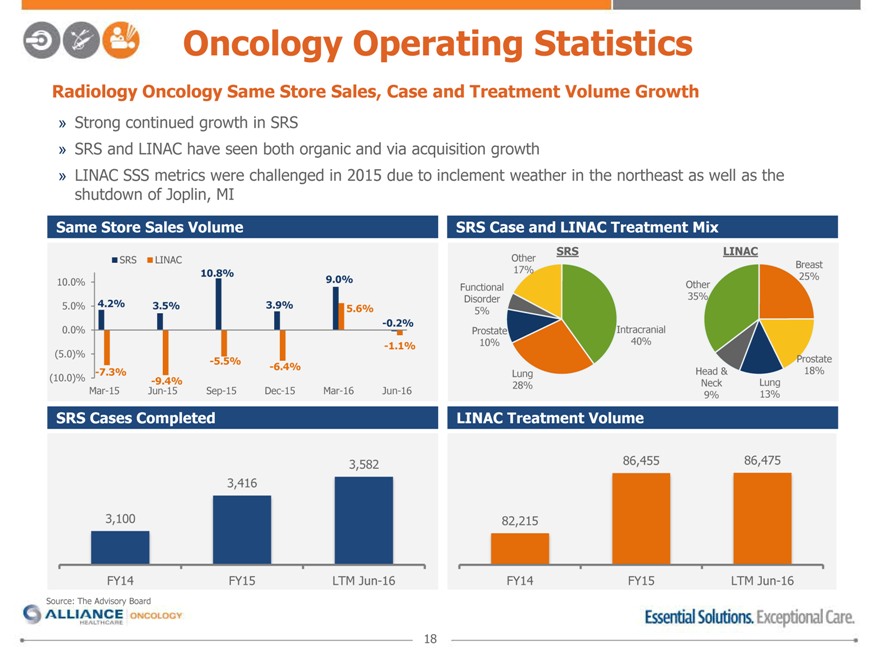
Oncology Operating Statistics
Radiology Oncology Same Store Sales, Case and Treatment Volume Growth
Strong continued growth in SRS
SRS and LINAC have seen both organic and via acquisition growth
LINAC SSS metrics were challenged in 2015 due to inclement weather in the northeast as well as the shutdown of Joplin, MI
Same Store Sales Volume SRS Case and LINAC Treatment Mix
SRSLINAC
SRS LINAC 10.8%Other 17%Breast 25%
10.0% 9.0%FunctionalOther
4.2% 3.5% 3.9%Disorder35%
5.0% 5.6%5%
-0.2%
0.0% ProstateIntracranial
-1.1%10%40%
(5.0)% -5.5%Prostate
-7.3% -6.4%LungHead &18%
(10.0)% -9.4% 28%NeckLung
Mar-15 Jun-15 Sep-15Dec-15Mar-16Jun-169%13%
SRS Cases Completed LINAC Treatment Volume
3,58286,45586,475
3,416
3,100 82,215
FY14 FY15LTM Jun-16FY14FY15LTM Jun-16
Source: The Advisory Board
18
|
|
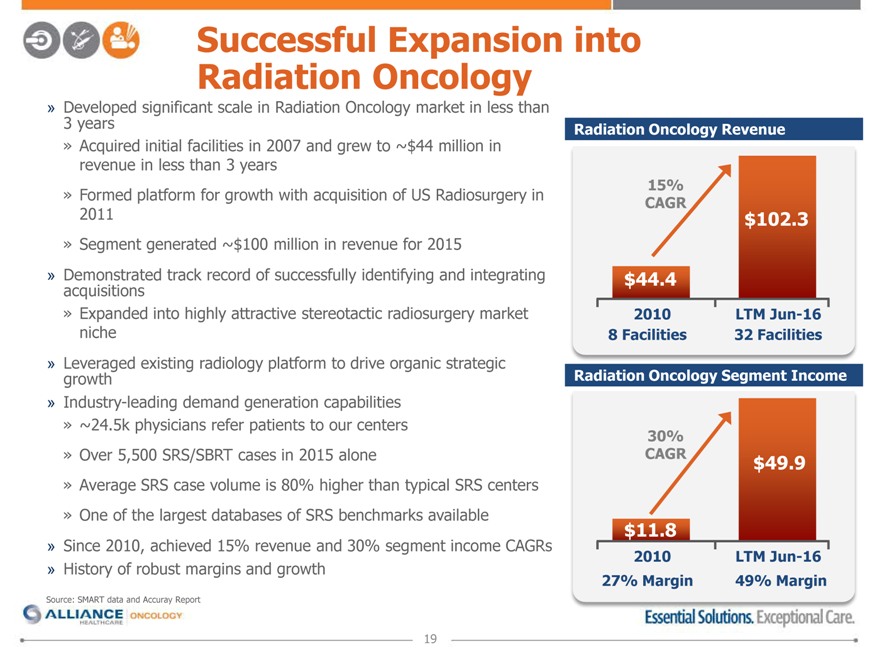
Radiation Successful Oncology Expansion into
Developed significant scale in Radiation Oncology market in less than 3 years » Acquired initial facilities in 2007 and grew to ~$44 million in
revenue in less than 3 years
» Formed platform for growth with acquisition of US Radiosurgery in 2011
» Segment generated ~$100 million in revenue for 2015
Demonstrated track record of successfully identifying and integrating acquisitions
Expanded into highly attractive stereotactic radiosurgery market niche
Leveraged existing radiology platform to drive organic strategic growth
Industry-leading demand generation capabilities
~24.5k physicians refer patients to our centers
Over 5,500 SRS/SBRT cases in 2015 alone
Average SRS case volume is 80% higher than typical SRS centers
One of the largest databases of SRS benchmarks available
Since 2010, achieved 15% revenue and 30% segment income CAGRs
History of robust margins and growth
Source: SMART data and Accuray Report
Radiation Oncology Revenue
15%
CAGR
$102.3
$44.4
2010 LTM Jun-16
8 Facilities 32 Facilities
Radiation Oncology Segment Income
30%
CAGR $49.9
$11.8
2010 LTM Jun-16
27% Margin 49% Margin
19
|
|
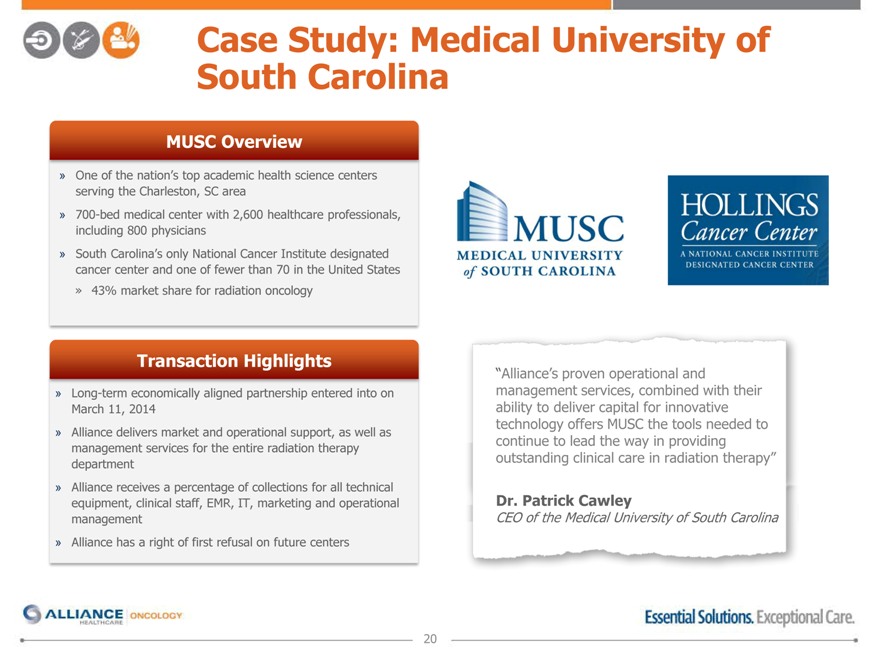
Case South Study: Carolina Medical University of
MUSC Overview
One of the nation’s top academic health science centers serving the Charleston, SC area
700-bed medical center with 2,600 healthcare professionals, including 800 physicians
South Carolina’s only National Cancer Institute designated cancer center and one of fewer than 70 in the United States » 43% market share for radiation oncology
Transaction Highlights
Long-term economically aligned partnership entered into on March 11, 2014
Alliance delivers market and operational support, as well as management services for the entire radiation therapy department
Alliance receives a percentage of collections for all technical equipment, clinical staff, EMR, IT, marketing and operational management
Alliance has a right of first refusal on future centers
“Alliance’s proven operational and management services, combined with their ability to deliver capital for innovative technology offers MUSC the tools needed to continue to lead the way in providing outstanding clinical care in radiation therapy”
Dr. Patrick Cawley
CEO of the Medical University of South Carolina
20
|
|
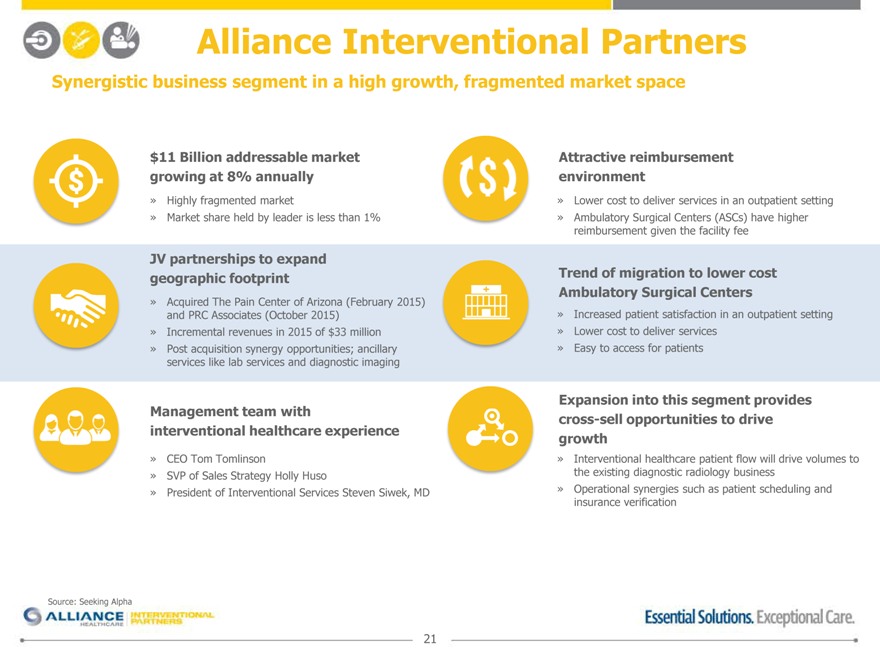
Alliance Interventional Partners
Synergistic business segment in a high growth, fragmented market space
$11 Billion addressable market growing at 8% annually
Highly fragmented market
Market share held by leader is less than 1%
JV partnerships to expand
geographic footprint
Acquired The Pain Center of Arizona (February 2015) and PRC Associates (October 2015)
Incremental revenues in 2015 of $33 million
Post acquisition synergy opportunities; ancillary services like lab services and diagnostic imaging
Management team with interventional healthcare experience
CEO Tom Tomlinson
SVP of Sales Strategy Holly Huso
President of Interventional Services Steven Siwek, MD
Source: Seeking Alpha
Attractive reimbursement
environment
Lower cost to deliver services in an outpatient setting
Ambulatory Surgical Centers (ASCs) have higher reimbursement given the facility fee
Trend of migration to lower cost Ambulatory Surgical Centers
Increased patient satisfaction in an outpatient setting
Lower cost to deliver services
Easy to access for patients
Expansion into this segment provides cross-sell opportunities to drive growth
Interventional healthcare patient flow will drive volumes to the existing diagnostic radiology business
Operational synergies such as patient scheduling and insurance verification
21
|
|
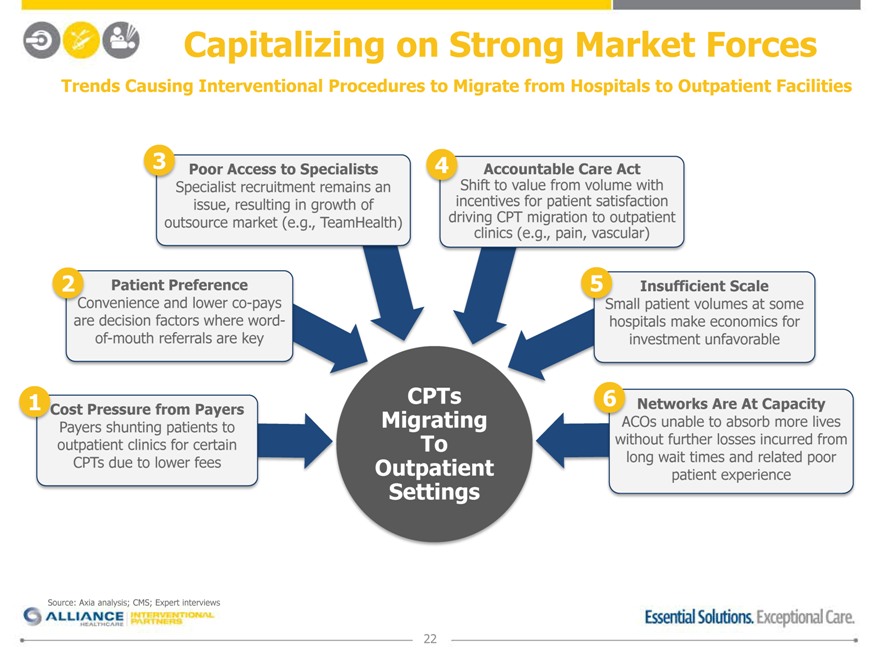
Capitalizing on Strong Market Forces
Trends Causing Interventional Procedures to Migrate from Hospitals to Outpatient Facilities
3 Poor Access to Specialists4Accountable Care Act
pecialist recruitment remains anhift to value from volume with
issue, resulting in growth ofincentives for patient satisfaction
outsource market (e.g., TeamHealth)driving CPT migration to outpatient
clinics (e.g., pain, vascular)
2 Patient Preference5Insufficient Scale
nvenience and lower co-paysall patient volumes at some
are decision factors where word- hospitals make economics for
of-mouth referrals are keyinvestment unfavorable
1 CPTs6 Networks Are At Capacity
Payers ost Pressure shunting from patients Payers to MigratingCOs unable to absorb more lives
outpatient clinics for certain Towithout further losses incurred from
CPTs due to lower fees Outpatient long wait patient times experience and related poor
Settings
Source: Axia analysis; CMS; Expert interviews
22
|
|
Industry Overview
23
|
|
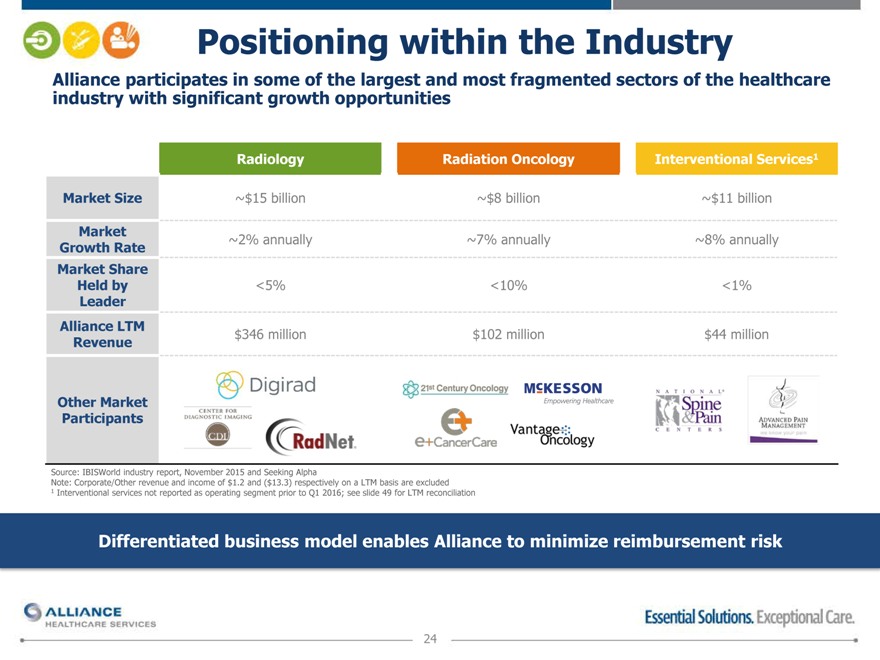
Positioning within the Industry
Alliance industry participates with significant in some growth of the opportunities largest and most fragmented sectors of the healthcare
Radiology Radiation Oncology Interventional Services1
Market Size ~$15 billion ~$8 billion~$11 billion
Market
Growth Rate ~2% annually ~7% annually~8% annually
Market Share
Held by <5% <10%<1%
Leader
Alliance LTM
Revenue $346 million $102 million$44 million
Other Market
Participants
Source: IBISWorld industry report, November 2015 and Seeking Alpha
Note: Corporate/Other revenue and income of $1.2 and ($13.3) respectively on a LTM basis are excluded
1 Interventional services not reported as operating segment prior to Q1 2016; see slide 49 for LTM reconciliation
Differentiated business model enables Alliance to minimize reimbursement risk
24
|
|
Diagnostic Imaging Industry Overview
Industry Characteristics
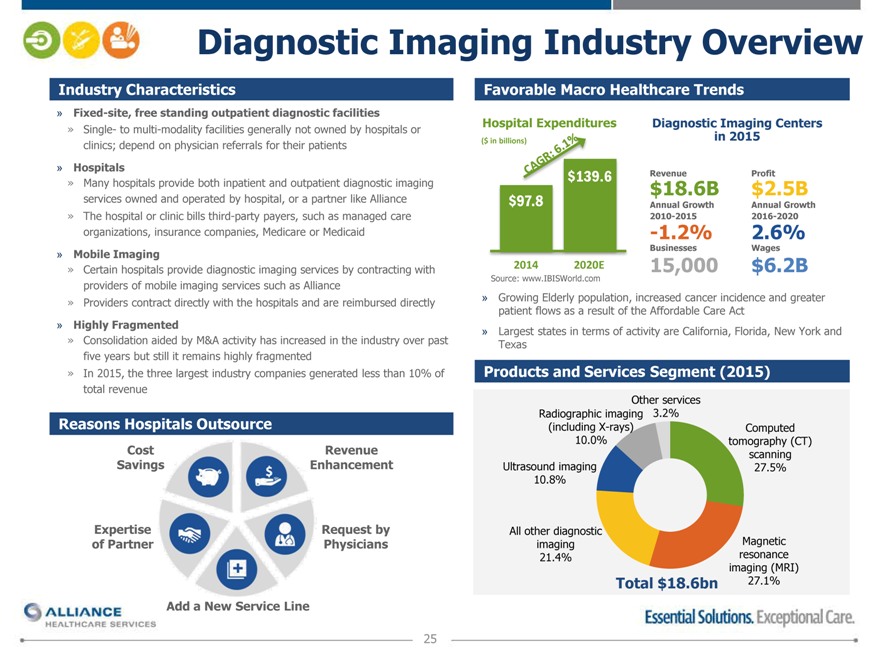
Fixed-site, free standing outpatient diagnostic facilities
Single- to multi-modality facilities generally not owned by hospitals or clinics; depend on physician referrals for their patients
Hospitals
Many hospitals provide both inpatient and outpatient diagnostic imaging services owned and operated by hospital, or a partner like Alliance
The hospital or clinic bills third-party payers, such as managed care organizations, insurance companies, Medicare or Medicaid
Mobile Imaging
Certain hospitals provide diagnostic imaging services by contracting with
providers of mobile imaging services such as Alliance
» Providers contract directly with the hospitals and are reimbursed directly
Highly Fragmented
Consolidation aided by M&A activity has increased in the industry over past five years but still it remains highly fragmented
In 2015, the three largest industry companies generated less than 10% of total revenue
Reasons Hospitals Outsource
Cost Revenue
Savings Enhancement
Expertise Request by
of Partner Physicians
Favorable Macro Healthcare Trends
Hospital Expenditures Diagnostic Imaging Centers
($ in billions) in 2015
.6 RevenueProfit
$18.6B$2.5B
$97.8 Annual Growth Annual Growth
2010-20152016-2020
-1.2%2.6%
Businesses Wages
2014 2020E 15,000$6.2B
Source: www.IBISWorld.com
Growing Elderly population, increased cancer incidence and greater patient flows as a result of the Affordable Care Act
Largest states in terms of activity are California, Florida, New York and Texas
Products and Services Segment (2015)
Other services
Radiographic imaging 3.2%
(including X-rays) Computed
10.0% tomography (CT)
scanning
Ultrasound imaging 27.5%
10.8%
All other diagnostic
imaging Magnetic
21.4% resonance
imaging (MRI)
Total $18.6bn 27.1%
Add a New Service Line
25
|
|
Oncology Industry Overview
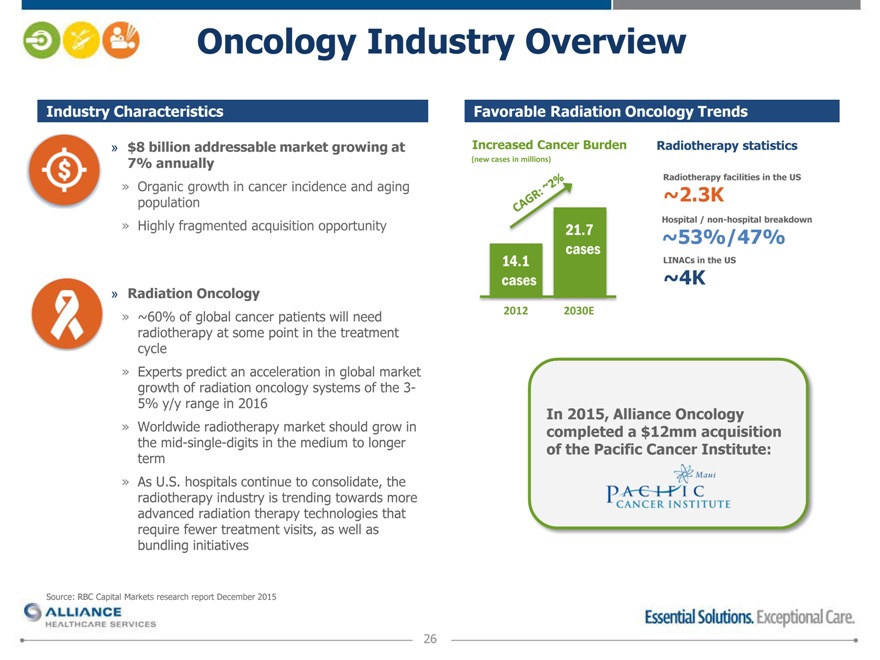
Industry Characteristics
$8 billion addressable market growing at 7% annually
Organic growth in cancer incidence and aging population
Highly fragmented acquisition opportunity
Radiation Oncology
~60% of global cancer patients will need radiotherapy at some point in the treatment cycle
Experts predict an acceleration in global market growth of radiation oncology systems of the 3- 5% y/y range in 2016
Worldwide radiotherapy market should grow in the mid-single-digits in the medium to longer term
As U.S. hospitals continue to consolidate, the radiotherapy industry is trending towards more advanced radiation therapy technologies that require fewer treatment visits, as well as bundling initiatives
Source: RBC Capital Markets research report December 2015
Favorable Radiation Oncology Trends
Increased Cancer Burden Radiotherapy statistics
(new cases in millions)
Radiotherapy facilities in the US
~2.3K
Hospital / non-hospital breakdown
7 ~53%/47%
cases
14.1 LINACs in the US
cases ~4K
2012 2030E
In 2015, Alliance Oncology
completed a $12mm acquisition
of the Pacific Cancer Institute:
26
|
|
Overview Interventional Services Industry
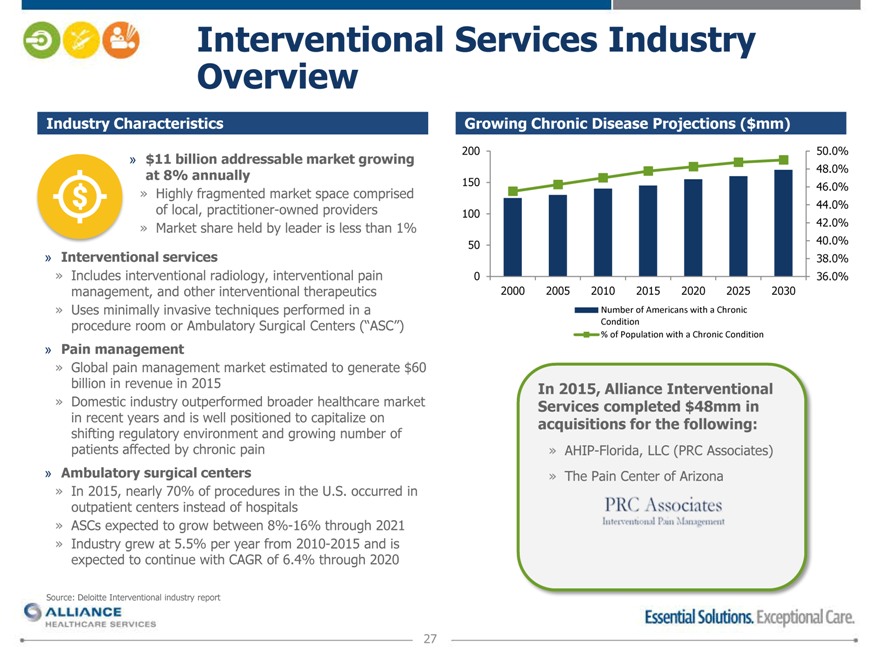
Industry Characteristics
» $11 billion addressable market growing at 8% annually
» Highly fragmented market space comprised of local, practitioner-owned providers
» Market share held by leader is less than 1%
Interventional services
Includes interventional radiology, interventional pain management, and other interventional therapeutics
Uses minimally invasive techniques performed in a procedure room or Ambulatory Surgical Centers (“ASC”)
Pain management
Global pain management market estimated to generate $60 billion in revenue in 2015
Domestic industry outperformed broader healthcare market in recent years and is well positioned to capitalize on shifting regulatory environment and growing number of patients affected by chronic pain
Ambulatory surgical centers
In 2015, nearly 70% of procedures in the U.S. occurred in outpatient centers instead of hospitals
ASCs expected to grow between 8%-16% through 2021
Industry grew at 5.5% per year from 2010-2015 and is expected to continue with CAGR of 6.4% through 2020
Source: Deloitte Interventional industry report
Growing Chronic Disease Projections ($mm)
200 50.0%
48.0%
150 46.0%
44.0%
100
42.0%
50 40.0%
38.0%
0 36.0%
2000 2005 2010 2015 2020 2025 2030
Number of Americans with a Chronic Condition % of Population with a Chronic Condition
In 2015, Alliance Interventional Services completed $48mm in acquisitions for the following:
AHIP-Florida, LLC (PRC Associates)
The Pain Center of Arizona
27
|
|
Key Investment Highlights
Compelling Entry Point for Investment
Industry Leading Provider and Platforms
Hospital Centric Model Aligns with Favorable Industry Trends Exclusive, Long-Term Partnerships Coupled with Outsourced Services Model Strong Free Cash Flow with History of Deleveraging Supportive and Growth Oriented Strategic Investor Experienced and Committed Management Team
28
|
|
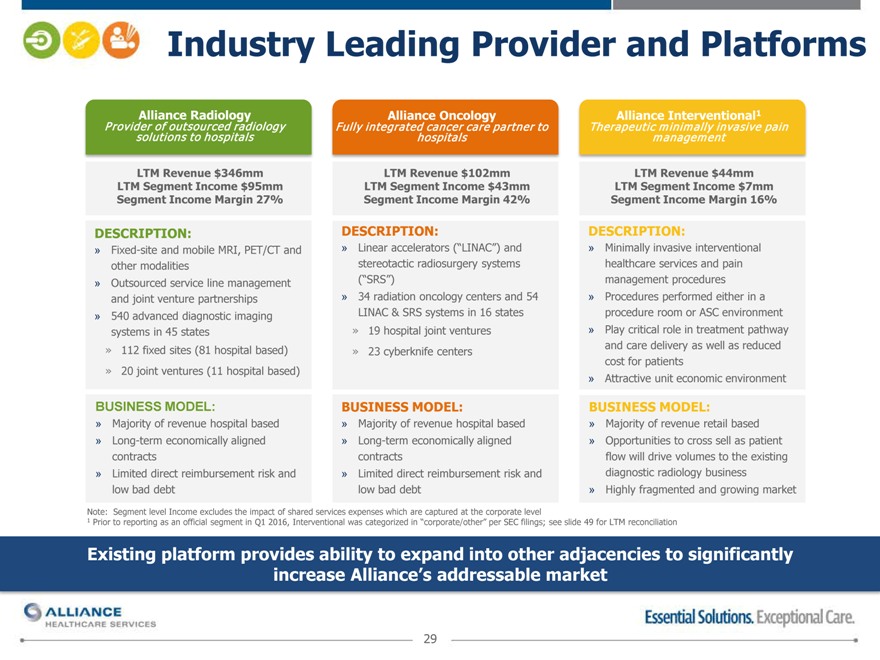
Industry Leading Provider and Platforms
Provider Alliance of outsourced Radiology radiology solutions to hospitals
LTM Revenue $346mm LTM Segment Income $95mm Segment Income Margin 27%
DESCRIPTION:
Fixed-site and mobile MRI, PET/CT and other modalities
Outsourced service line management and joint venture partnerships
540 advanced diagnostic imaging systems in 45 states
112 fixed sites (81 hospital based)
20 joint ventures (11 hospital based)
Fully integrated Alliance cancer Oncology care partner to
hospitals
LTM Revenue $102mm
LTM Segment Income $43mm
Segment Income Margin 42%
Alliance Interventional1
Therapeutic minimally invasive pain
management
LTM Revenue $44mm
LTM Segment Income $7mm
Segment Income Margin 16%
DESCRIPTION:
Linear accelerators (“LINAC”) and stereotactic radiosurgery systems (“SRS”)
34 radiation oncology centers and 54 LINAC & SRS systems in 16 states
19 hospital joint ventures
23 cyberknife centers
DESCRIPTION:
Minimally invasive interventional healthcare services and pain management procedures
Procedures performed either in a procedure room or ASC environment
Play critical role in treatment pathway and care delivery as well as reduced cost for patients
Attractive unit economic environment
BUSINESS MODEL: BUSINESS MODEL: BUSINESS MODEL:
» Majority of revenue hospital based » Majority of revenue hospital based » Majority of revenue retail based
» Long-term economically aligned » Long-term economically aligned » Opportunities to cross sell as patient
contracts contracts flow will drive volumes to the existing
» Limited direct reimbursement risk and » Limited direct reimbursement risk and diagnostic radiology business
low bad debt low bad debt » Highly fragmented and growing market
Note: Segment level Income excludes the impact of shared services expenses which are captured at the corporate level
1 Prior to reporting as an official segment in Q1 2016, Interventional was categorized in “corporate/other” per SEC filings; see slide 49 for LTM reconciliation
Existing platform provides ability to expand into other adjacencies to significantly increase Alliance’s addressable market
29
|
|
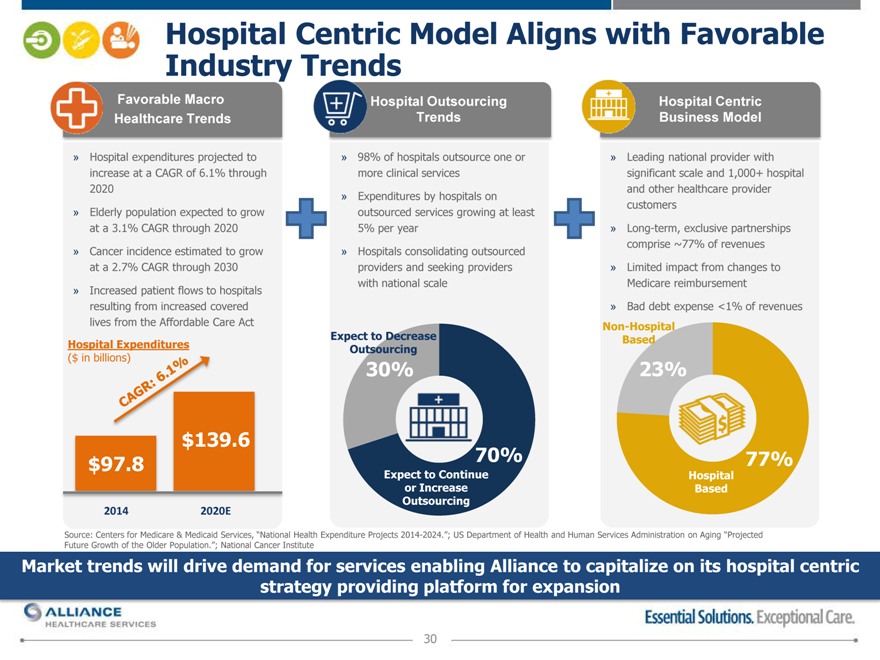
Hospital Industry Centric Trends Model Aligns with Favorable
Favorable Macro Hospital Outsourcing Hospital Centric
Healthcare Trends Trends Business Model
» Hospital expenditures projected to »98% of hospitals outsource one or»Leading national provider with
increase at a CAGR of 6.1% through more clinical servicessignificant scale and 1,000+ hospital
2020 and other healthcare provider
»Expenditures by hospitals on
» Elderly population expected to grow outsourced services growing at least customers
at a 3.1% CAGR through 2020 5% per year»Long-term, exclusive partnerships
» Cancer incidence estimated to grow »Hospitals consolidating outsourced comprise ~77% of revenues
at a 2.7% CAGR through 2030 providers and seeking providers»Limited impact from changes to
» Increased patient flows to hospitals with national scaleMedicare reimbursement
resulting from increased covered »Bad debt expense <1% of revenues
lives from the Affordable Care Act Non-Hospital
Expect to Decrease Based
Hospital Expenditures Outsourcing
($ in billions) 30%23%
$139.6
$97.8 70%77%
Expect to Continue Hospital
or Increase Based
Outsourcing
2014 2020E
Source: Centers for Medicare & Medicaid Services, “National Health Expenditure Projects 2014-2024.”; US Department of Health and Human Services Administration on Aging “Projected Future Growth of the Older Population.”; National Cancer Institute
Market trends will drive demand for services enabling Alliance to capitalize on its hospital centric strategy providing platform for expansion
30
|
|
Exclusive, Coupled with Long Outsourced -Term partnerships Service Contracts
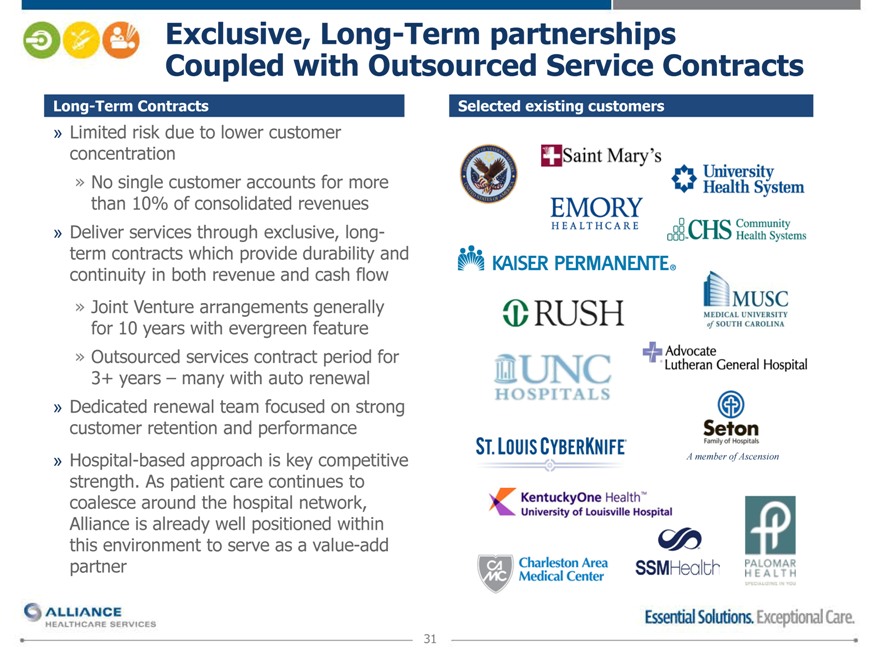
Long-Term Contracts Selected existing customers
» Limited risk due to lower customer
concentration
» No single customer accounts for more
than 10% of consolidated revenues
» Deliver services through exclusive, long-
term contracts which provide durability and
continuity in both revenue and cash flow
» Joint Venture arrangements generally
for 10 years with evergreen feature
» Outsourced services contract period for
3+ years – many with auto renewal
» Dedicated renewal team focused on strong
customer retention and performance
» Hospital-based approach is key competitive A member of Ascension
strength. As patient care continues to
coalesce around the hospital network,
Alliance is already well positioned within
this environment to serve as a value-add
partner
31
|
|
Exclusive, Coupled with Long Outsourced -Term partnerships Service Contracts
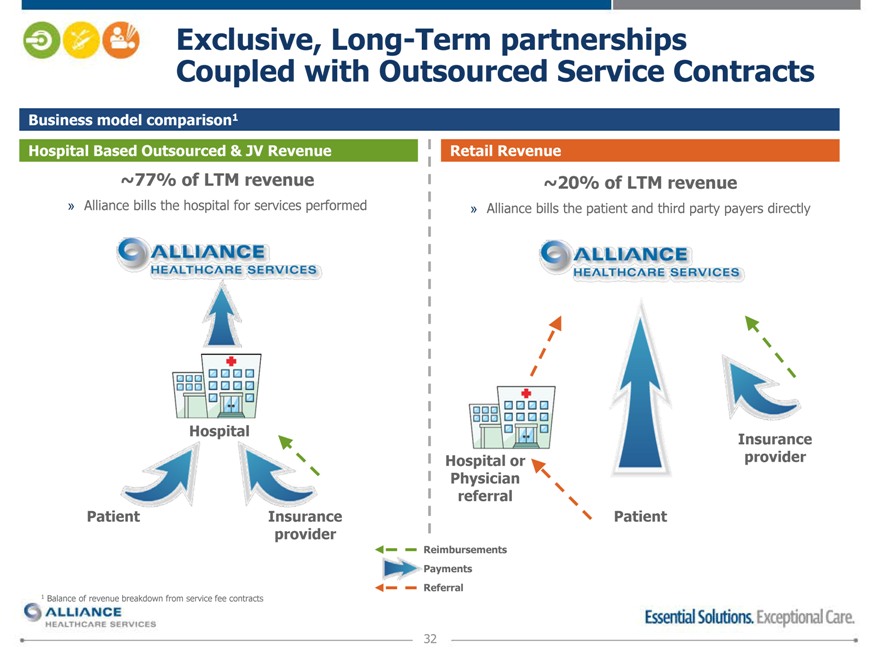
Business model comparison1
Hospital Based Outsourced & JV Revenue
~77% of LTM revenue
» Alliance bills the hospital for services performed
Retail Revenue
~20% of LTM revenue
Alliance bills the patient and third party payers directly
Hospital
Insurance Hospital or provider Physician referral Patient Insurance Patient provider
Reimbursements Payments Referral
1 Balance of revenue breakdown from service fee contracts
32
|
|
Supportive and Growth Oriented
Strategic Investor
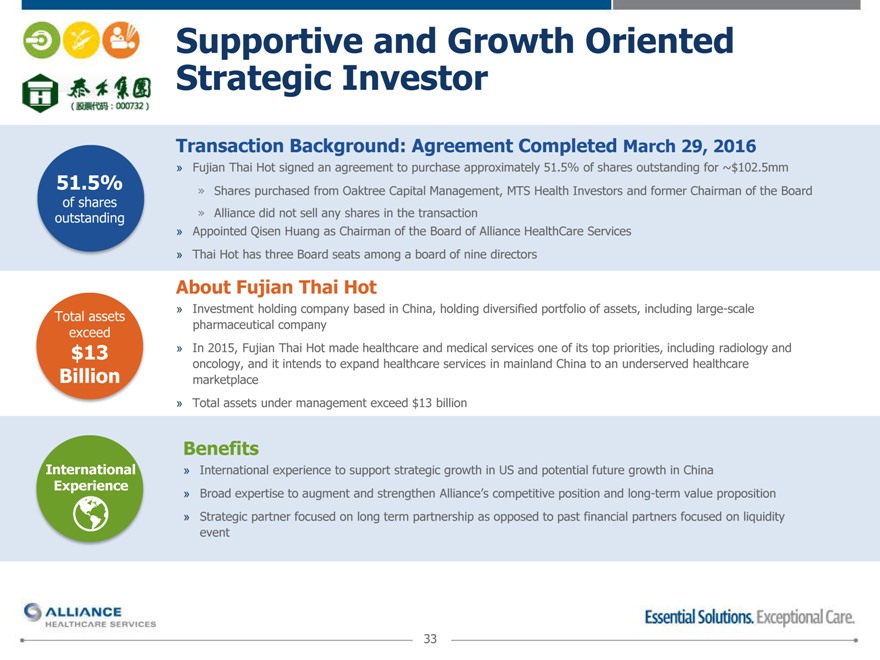
Transaction Background: Agreement Completed March 29, 2016
» Fujian Thai Hot signed an agreement to purchase approximately 51.5% of shares outstanding for ~$102.5mm
51.5% »Shares purchased from Oaktree Capital Management, MTS Health Investors and former Chairman of the Board
of shares
outstanding »Alliance did not sell any shares in the transaction
» Appointed Qisen Huang as Chairman of the Board of Alliance HealthCare Services
» Thai Hot has three Board seats among a board of nine directors
About Fujian Thai Hot
Total assets » Investment holding company based in China, holding diversified portfolio of assets, including large-scale
exceed pharmaceutical company
$13 » In 2015, Fujian Thai Hot made healthcare and medical services one of its top priorities, including radiology and
oncology, and it intends to expand healthcare services in mainland China to an underserved healthcare
Billion marketplace
» Total assets under management exceed $13 billion
Benefits
International » International experience to support strategic growth in US and potential future growth in China
Experience » Broad expertise to augment and strengthen Alliance’s competitive position and long-term value proposition
Strategic partner focused on long term partnership as opposed to past financial partners focused on liquidity event
33
|
|
Supportive and Growth Oriented
Strategic Investor
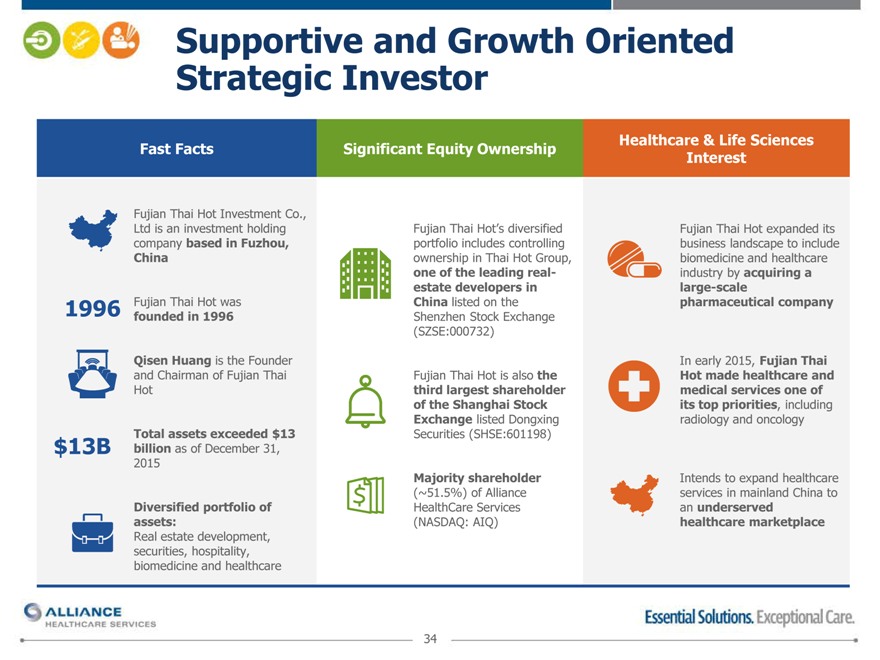
Fast Facts Significant Equity OwnershipHealthcare & Life Sciences
Interest
Fujian Thai Hot Investment Co.,
Ltd is an investment holding Fujian Thai Hot’s diversifiedFujian Thai Hot expanded its
company based in Fuzhou, portfolio includes controllingbusiness landscape to include
China ownership in Thai Hot Group,biomedicine and healthcare
one of the leading real-industry by acquiring a
estate developers inlarge-scale
1996 Fujian Thai Hot was China listed on thepharmaceutical company
founded in 1996 Shenzhen Stock Exchange
(SZSE:000732)
Qisen Huang is the Founder In early 2015, Fujian Thai
and Chairman of Fujian Thai Fujian Thai Hot is also theHot made healthcare and
Hot third largest shareholdermedical services one of
of the Shanghai Stock its top priorities, including
Exchange listed Dongxingradiology and oncology
Total assets exceeded $13 Securities (SHSE:601198)
$13B billion as of December 31,
2015
Majority shareholderIntends to expand healthcare
(~51.5%) of Allianceservices in mainland China to
Diversified portfolio of HealthCare Servicesan underserved
assets: (NASDAQ: AIQ)healthcare marketplace
Real estate development,
securities, hospitality,
biomedicine and healthcare
34
|
|
New AIQ Board Members
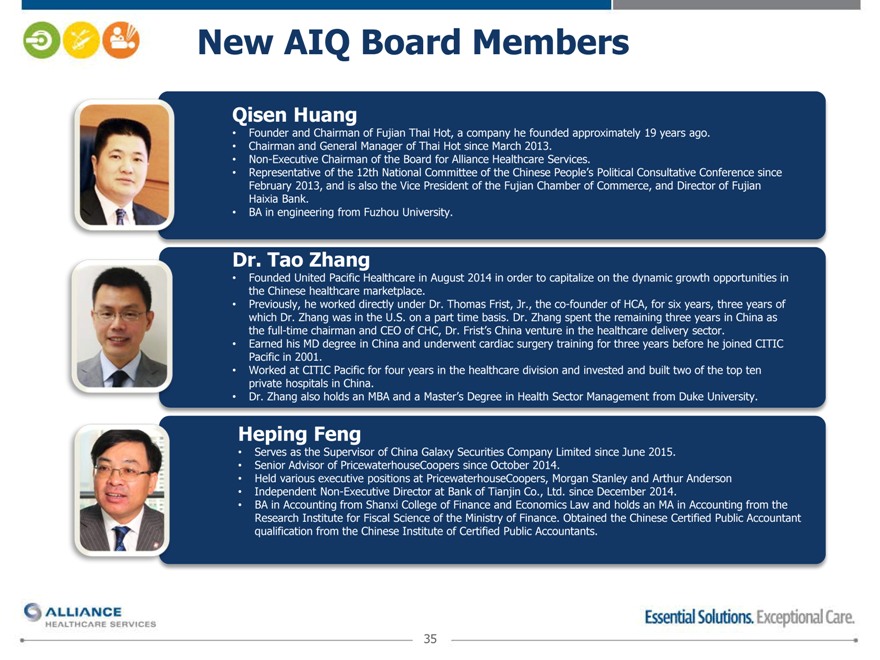
Qisen Huang
Founder and Chairman of Fujian Thai Hot, a company he founded approximately 19 years ago.
Chairman and General Manager of Thai Hot since March 2013.
Non-Executive Chairman of the Board for Alliance Healthcare Services.
Representative of the 12th National Committee of the Chinese People’s Political Consultative Conference since February 2013, and is also the Vice President of the Fujian Chamber of Commerce, and Director of Fujian Haixia Bank.
BA in engineering from Fuzhou University.
Dr. Tao Zhang
Founded United Pacific Healthcare in August 2014 in order to capitalize on the dynamic growth opportunities in the Chinese healthcare marketplace.
Previously, he worked directly under Dr. Thomas Frist, Jr., the co-founder of HCA, for six years, three years of which Dr. Zhang was in the U.S. on a part time basis. Dr. Zhang spent the remaining three years in China as the full-time chairman and CEO of CHC, Dr. Frist’s China venture in the healthcare delivery sector.
Earned his MD degree in China and underwent cardiac surgery training for three years before he joined CITIC Pacific in 2001.
Worked at CITIC Pacific for four years in the healthcare division and invested and built two of the top ten private hospitals in China.
Dr. Zhang also holds an MBA and a Master’s Degree in Health Sector Management from Duke University.
Heping Feng
Serves as the Supervisor of China Galaxy Securities Company Limited since June 2015.
Senior Advisor of PricewaterhouseCoopers since October 2014.
Held various executive positions at PricewaterhouseCoopers, Morgan Stanley and Arthur Anderson
Independent Non-Executive Director at Bank of Tianjin Co., Ltd. since December 2014.
BA in Accounting from Shanxi College of Finance and Economics Law and holds an MA in Accounting from the Research Institute for Fiscal Science of the Ministry of Finance. Obtained the Chinese Certified Public Accountant qualification from the Chinese Institute of Certified Public Accountants.
35
|
|
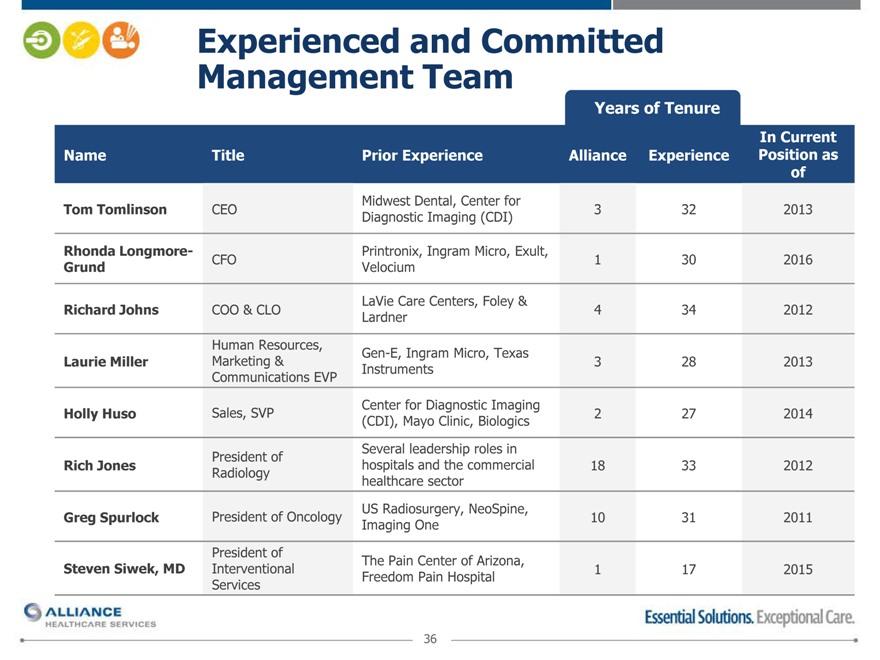
Experienced and Committed
Management Team
Years of Tenure
In Current
Name Title Prior ExperienceAllianceExperiencePosition as
of
Midwest Dental, Center for
Tom Tomlinson CEO 3322013
Diagnostic Imaging (CDI)
Rhonda Longmore- Printronix, Ingram Micro, Exult,
Grund CFO Velocium1302016
LaVie Care Centers, Foley &
Richard Johns COO & CLO 4342012
Lardner
Human Resources, Gen-E, Ingram Micro, Texas
Laurie Miller Marketing & 3282013
Communications EVP Instruments
Center for Diagnostic Imaging
Holly Huso Sales, SVP 2272014
(CDI), Mayo Clinic, Biologics
President of Several leadership roles in
Rich Jones hospitals and the commercial18332012
Radiology healthcare sector
US Radiosurgery, NeoSpine,
Greg Spurlock President of Oncology 10312011
Imaging One
President of The Pain Center of Arizona,
Steven Siwek, MD Interventional 1172015
Services Freedom Pain Hospital
36
|
|
Compelling Entry Point for Investment
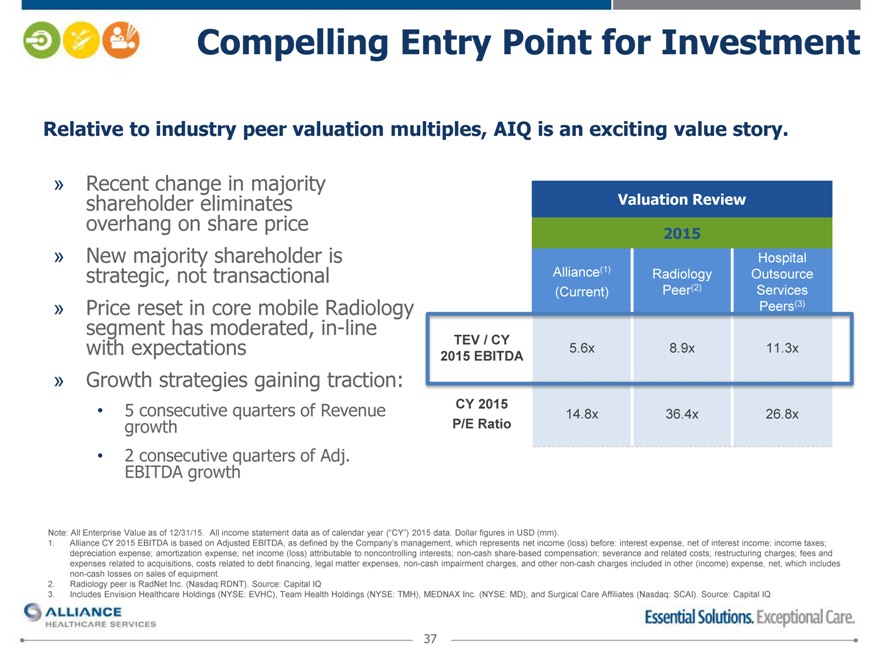
Relative to industry peer valuation multiples, AIQ is an exciting value story.
Recent change in majority shareholder eliminates overhang on share price
New majority shareholder is strategic, not transactional
Price reset in core mobile Radiology segment has moderated, in-line with expectations
Growth strategies gaining traction:
5 consecutive quarters of Revenue growth
2 consecutive quarters of Adj. EBITDA growth
Valuation Review
2015
Hospital
Alliance(1) Radiology Outsource
(Current) Peer(2) Services
Peers(3)
CY 2015
P/E Ratio 14.8x 36.4x26.8x
Note: All Enterprise Value as of 12/31/15. All income statement data as of calendar year (“CY”) 2015 data. Dollar figures in USD (mm).
Alliance CY 2015 EBITDA is based on Adjusted EBITDA, as defined by the Company’s management, which represents net income (loss) before: interest expense, net of interest income; income taxes; depreciation expense; amortization expense; net income (loss) attributable to noncontrolling interests; non-cash share-based compensation; severance and related costs; restructuring charges; fees and expenses related to acquisitions, costs related to debt financing, legal matter expenses, non-cash impairment charges, and other non-cash charges included in other (income) expense, net, which includes non-cash losses on sales of equipment.
Radiology peer is RadNet Inc. (Nasdaq:RDNT). Source: Capital IQ
Includes Envision Healthcare Holdings (NYSE: EVHC), Team Health Holdings (NYSE: TMH), MEDNAX Inc. (NYSE: MD), and Surgical Care Affiliates (Nasdaq: SCAI). Source: Capital IQ
37
|
|
Financial Performance
In adjusted EBITDA in
Fiscal 2015
38
|
|
Financial Strategy
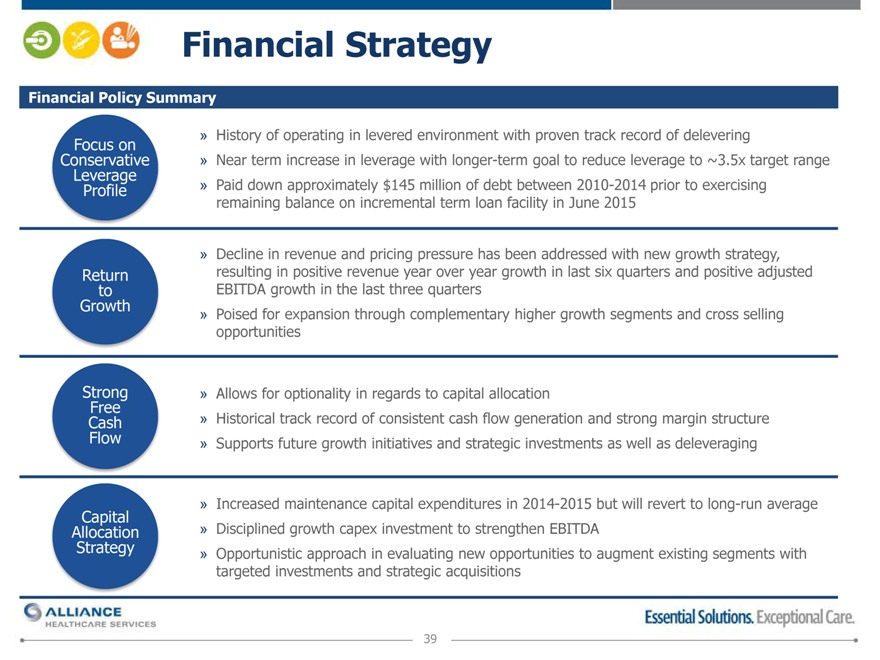
Financial Policy Summary
Focus on History of operating in levered environment with proven track record of delevering
Conservative Near term increase in leverage with longer-term goal to reduce leverage to ~3.5x target range
Leverage
Profile Paid down approximately $145 million of debt between 2010-2014 prior to exercising
remaining balance on incremental term loan facility in June 2015
Decline in revenue and pricing pressure has been addressed with new growth strategy,
Return resulting in positive revenue year over year growth in last six quarters and positive adjusted
to EBITDA growth in the last three quarters
Hos Growth rePoised for expansion through complementary higher growth segments and cross selling
pr sopportunities
Strong Allows for optionality in regards to capital allocation
Free
Cash Historical track record of consistent cash flow generation and strong margin structure
Flow Supports future growth initiatives and strategic investments as well as deleveraging
Increased maintenance capital expenditures in 2014-2015 but will revert to long-run average
Capital
Allocation Disciplined growth capex investment to strengthen EBITDA
Strategy inOpportunistic approach in evaluating new opportunities to augment existing segments with
targeted investments and strategic acquisitions
39
|
|
Return to Growth Strategy
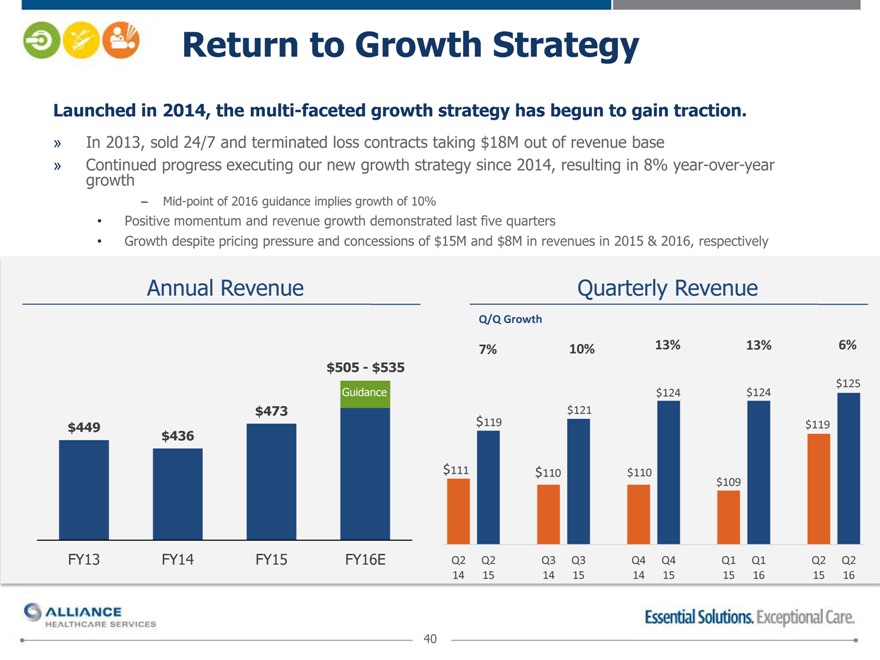
Launched in 2014, the multi-faceted growth strategy has begun to gain traction.
In 2013, sold 24/7 and terminated loss contracts taking $18M out of revenue base
Continued progress executing our new growth strategy since 2014, resulting in 8% year-over-year growth
– Mid-point of 2016 guidance implies growth of 10%
Positive momentum and revenue growth demonstrated last five quarters
Growth despite pricing pressure and concessions of $15M and $8M in revenues in 2015 & 2016, respectively
Annual Revenue
Quarterly Revenue
Q/Q Growth
7%
10%
13%
13%
6%
$505—$535
$125
Guidance
$124
$124
$473
$121
$449
$119
$119
$436
$111
$110
$110
$109
FY13 FY14 FY15FY16EQ2Q2Q3Q3Q4Q4Q1Q1Q2Q2
14151415141515161516
40
|
|
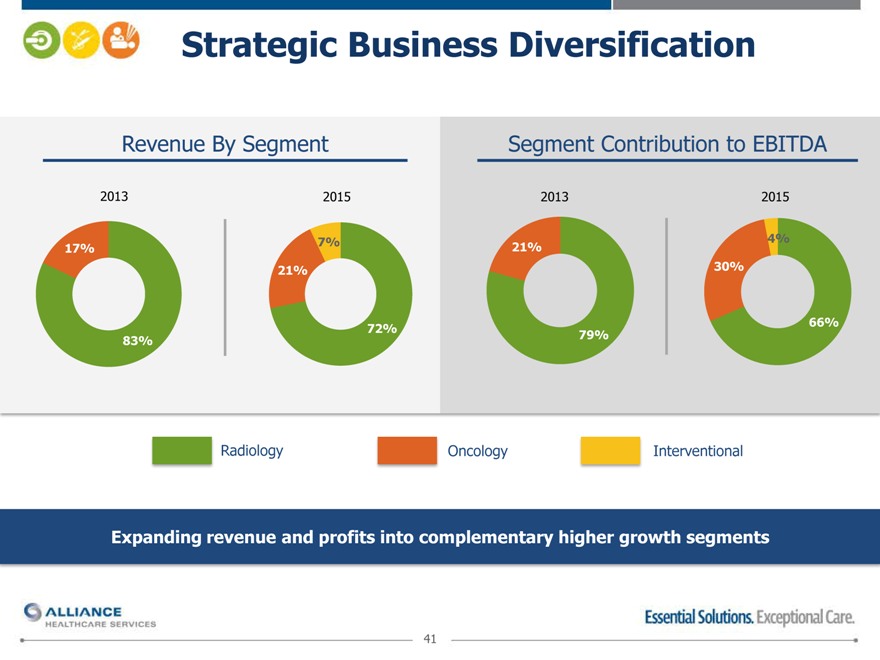
Strategic Business Diversification
Revenue By Segment Segment Contribution to EBITDA
2013 201520132015
17% 7%21%4%
21%30%
72%66%
83% 79%
RadiologyOncologyInterventional
Expanding revenue and profits into complementary higher growth segments
41
|
|
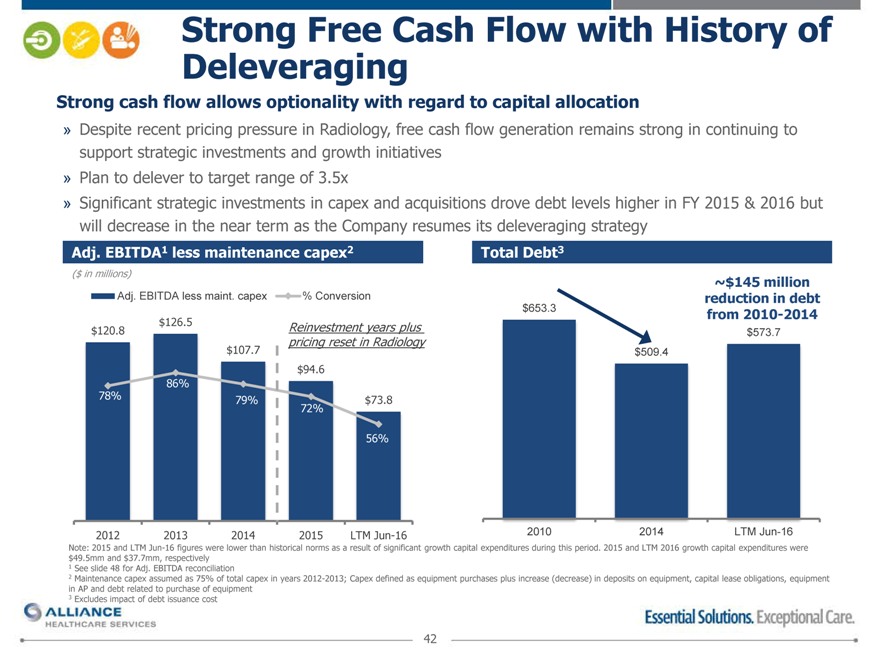
Strong Deleveraging Free Cash Flow with History of
Strong cash flow allows optionality with regard to capital allocation
Despite recent pricing pressure in Radiology, free cash flow generation remains strong in continuing to support strategic investments and growth initiatives
Plan to delever to target range of 3.5x
Significant strategic investments in capex and acquisitions drove debt levels higher in FY 2015 & 2016 but will decrease in the near term as the Company resumes its deleveraging strategy
2012
2013
2014
2015
LTM Jun-16
2010
2014
LTM Jun-16
Note: 2015 and LTM Jun-16 figures were lower than historical norms as a result of significant growth capital expenditures during this period. 2015 and LTM 2016 growth capital expenditures were
$49.5mm and $37.7mm, respectively
1 See slide 48 for Adj. EBITDA reconciliation
2 Maintenance capex assumed as 75% of total capex in years 2012-2013; Capex defined as equipment purchases plus increase (decrease) in deposits on equipment, capital lease obligations, equipment in AP and debt related to purchase of equipment
3 Excludes impact of debt issuance cost
42
|
|
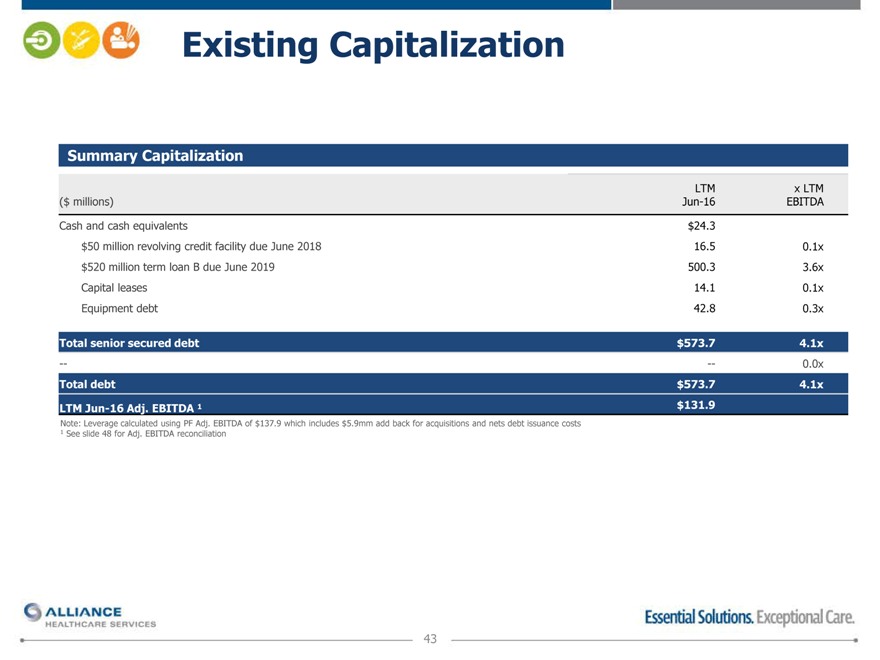
Existing Capitalization
Summary Capitalization
LTM x LTM
($ millions) Jun-16 EBITDA
Cash and cash equivalents $24.3
$50 million revolving credit facility due June 2018 16.5 0.1x
$520 million term loan B due June 2019 500.3 3.6x
Capital leases 14.1 0.1x
Equipment debt 42.8 0.3x
Total senior secured debt $573.7 4.1x
— — 0.0x
Total debt $573.7 4.1x
LTM Jun-16 Adj. EBITDA 1 $131.9
Note: Leverage calculated using PF Adj. EBITDA of $137.9 which includes $5.9mm add back for acquisitions and nets debt issuance costs
1 See slide 48 for Adj. EBITDA reconciliation
43
|
|
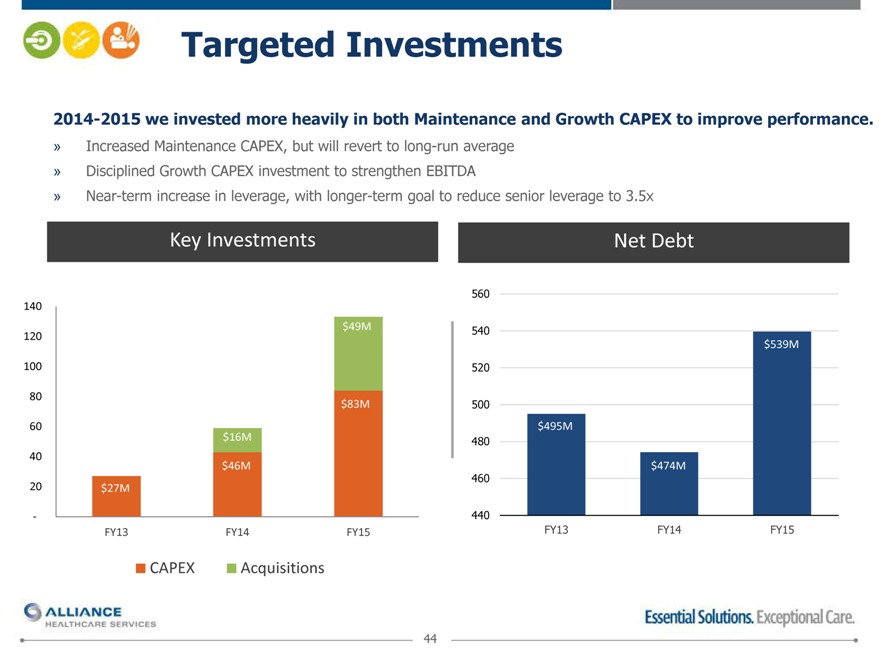
Targeted Investments
2014-2015 we invested more heavily in both Maintenance and Growth CAPEX to improve performance.
Increased Maintenance CAPEX, but will revert to long-run average
Disciplined Growth CAPEX investment to strengthen EBITDA
Near-term increase in leverage, with longer-term goal to reduce senior leverage to 3.5x
Key Investments
Net Debt
560
140
$49M540
120 $539M
100 520
80 $83M500
60 $495M
$16M480
40
$46M$474M
20 $27M 460
- 440
FY13 FY14FY15FY13FY14FY15
CAPEXAcquisitions
44
|
|
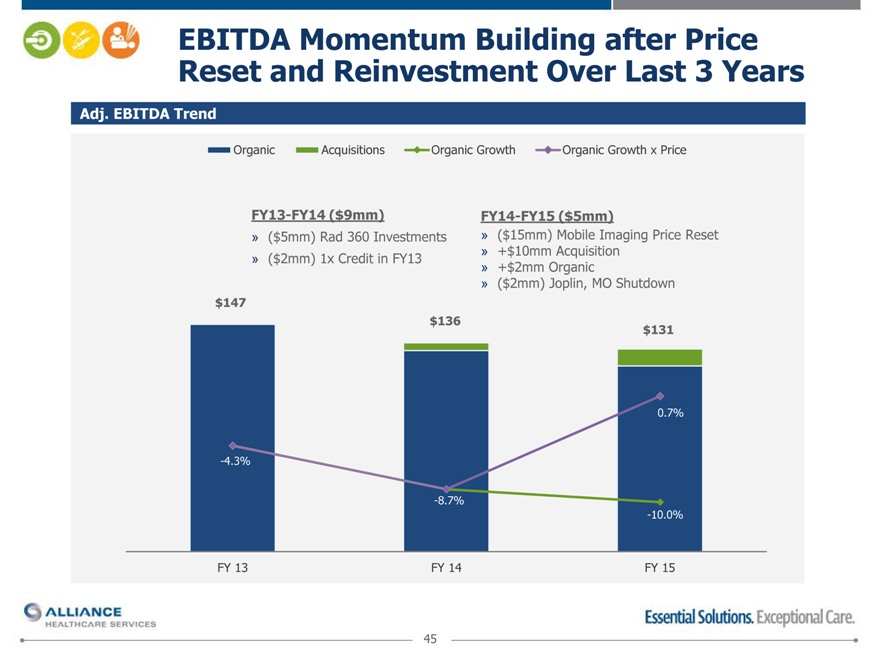
Reset EBITDA and Momentum Reinvestment Building Over after Last Price 3 Years
Adj. EBITDA Trend
Organic
Acquisitions
Organic Growth
Organic Growth x Price
FY13-FY14 ($9mm) FY14-FY15 ($5mm)
($5mm) Rad 360 Investments ($15mm) Mobile Imaging Price Reset
($2mm) 1x Credit in FY13 +$10mm Acquisition
+$2mm Organic
($2mm) Joplin, MO Shutdown
$147
$ 136$131
0.7%
-4.3%
-8.7%
-10.0%
FY 13 FY 14 FY 15
45
|
|
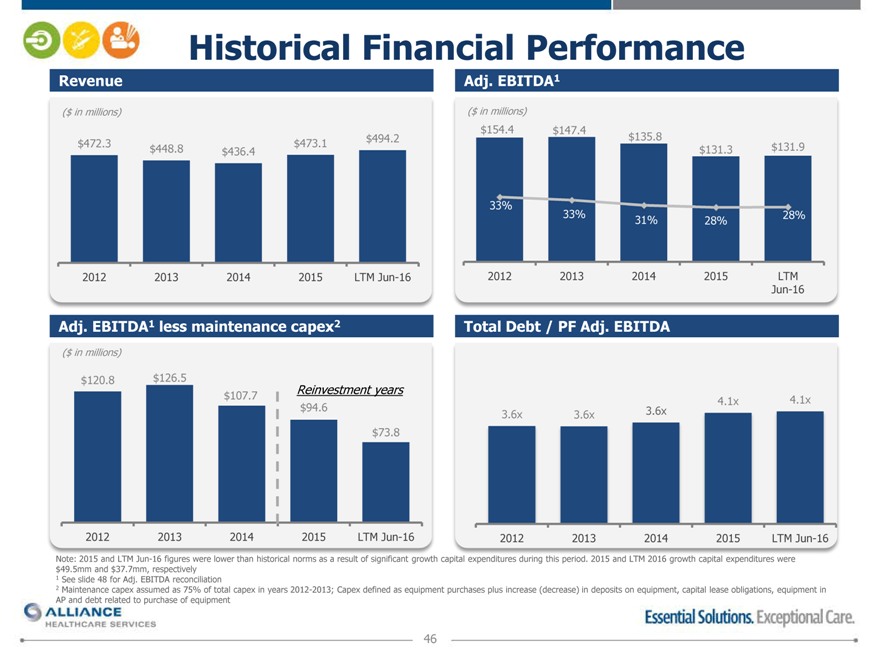
Historical Financial Performance
Revenue Adj. EBITDA1
($ in millions) ($ in millions)
$154.4$147.4
$494.2$135.8
$472.3 $448.8 $436.4$473.1$131.3$131.9
33%
33%31%28%28%
2012 2013 20142015LTM Jun-162012201320142015LTM
Jun-16
Adj. EBITDA1 less maintenance capex2 Total Debt / PF Adj. EBITDA
($ in millions)
$120.8 $126.5
Reinvestment years
$107.74.1x4.1x
$94.63.6x3.6x3.6x
$73.8
2012
2013
2014
2015
LTM Jun-16
2012
2013
2014
2015
LTM Jun-16
Note: 2015 and LTM Jun-16 figures were lower than historical norms as a result of significant growth capital expenditures during this period. 2015 and LTM 2016 growth capital expenditures were
$49.5mm and $37.7mm, respectively
1 See slide 48 for Adj. EBITDA reconciliation
2 Maintenance capex assumed as 75% of total capex in years 2012-2013; Capex defined as equipment purchases plus increase (decrease) in deposits on equipment, capital lease obligations, equipment in AP and debt related to purchase of equipment
46
|
|
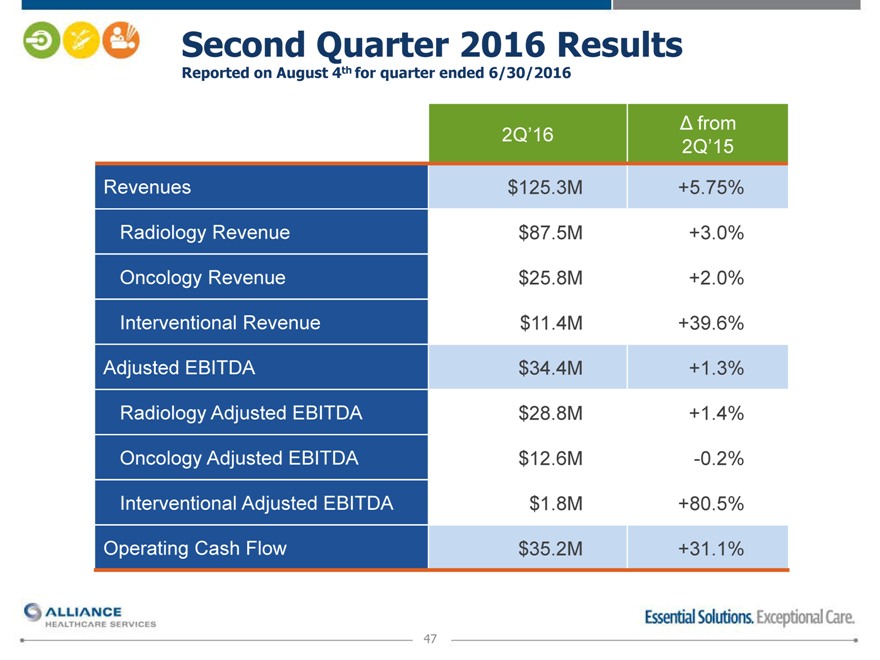
Second Quarter 2016 Results
Reported on August 4th for quarter ended 6/30/2016
? from
2Q’16 2Q’15
Revenues $125.3M +5.75%
Radiology Revenue $87.5M +3.0%
Oncology Revenue $25.8M +2.0%
Interventional Revenue $11.4M +39.6%
Adjusted EBITDA $34.4M +1.3%
Radiology Adjusted EBITDA $28.8M +1.4%
Oncology Adjusted EBITDA $12.6M -0.2%
Interventional Adjusted EBITDA $1.8M +80.5%
Operating Cash Flow $35.2M +31.1%
47
|
|
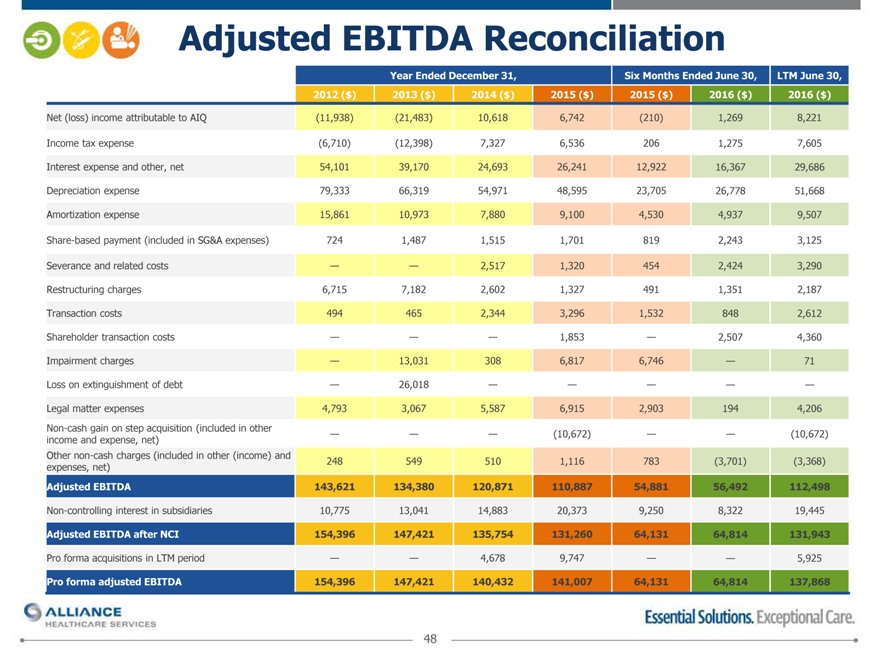
Adjusted EBITDA Reconciliation
Year Ended December 31,Six Months Ended June 30,LTM June 30,
2012 ($) 2013 ($)2014 ($)2015 ($)2015 ($)2016 ($)2016 ($)
Net (loss) income attributable to AIQ (11,938) (21,483)10,6186,742(210)1,2698,221
Income tax expense (6,710) (12,398)7,3276,5362061,2757,605
Interest expense and other, net 54,101 39,17024,69326,24112,92216,36729,686
Depreciation expense 79,333 66,31954,97148,59523,70526,77851,668
Amortization expense 15,861 10,9737,8809,1004,5304,9379,507
Share-based payment (included in SG&A expenses) 724 1,4871,5151,7018192,2433,125
Severance and related costs — —2,5171,3204542,4243,290
Restructuring charges 6,715 7,1822,6021,3274911,3512,187
Transaction costs 494 4652,3443,2961,5328482,612
Shareholder transaction costs — ——1,853—2,5074,360
Impairment charges — 13,0313086,8176,746—71
Loss on extinguishment of debt — 26,018—————
Legal matter expenses 4,793 3,0675,5876,9152,9031944,206
Non-cash gain on step acquisition (included in other
income and expense, net) — ——(10,672)——(10,672)
Other non-cash charges (included in other (income) and
expenses, net) 248 5495101,116783(3,701)(3,368)
Adjusted EBITDA 143,621 134,380120,871110,88754,88156,492112,498
Non-controlling interest in subsidiaries 10,775 13,04114,88320,3739,2508,32219,445
Adjusted EBITDA after NCI 154,396 147,421135,754131,26064,13164,814131,943
Pro forma acquisitions in LTM period — —4,6789,747——5,925
Pro forma adjusted EBITDA 154,396 147,421140,432141,00764,13164,814137,868
48
|
|
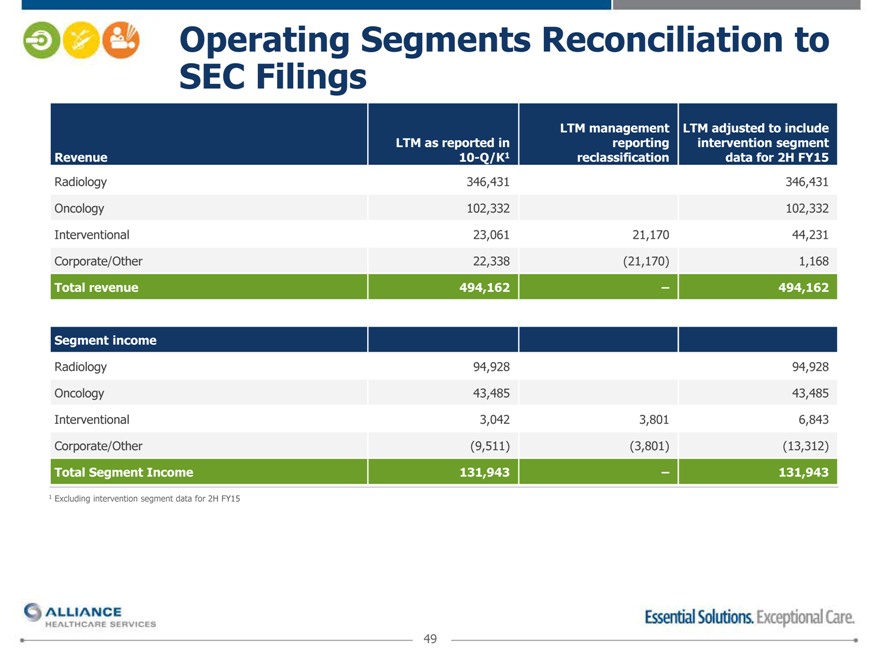
Operating SEC Filings Segments Reconciliation to
LTM managementLTM adjusted to include
LTM as reported in reportingintervention segment
Revenue 10-Q/K1 reclassificationdata for 2H FY15
Radiology 346,431 346,431
Oncology 102,332 102,332
Interventional 23,061 21,17044,231
Corporate/Other 22,338 (21,170)1,168
Total revenue 494,162 –494,162
Segment income
Radiology 94,928 94,928
Oncology 43,485 43,485
Interventional 3,042 3,8016,843
Corporate/Other (9,511) (3,801)(13,312)
Total Segment Income 131,943 –131,943
1 Excluding intervention segment data for 2H FY15
49
|
|
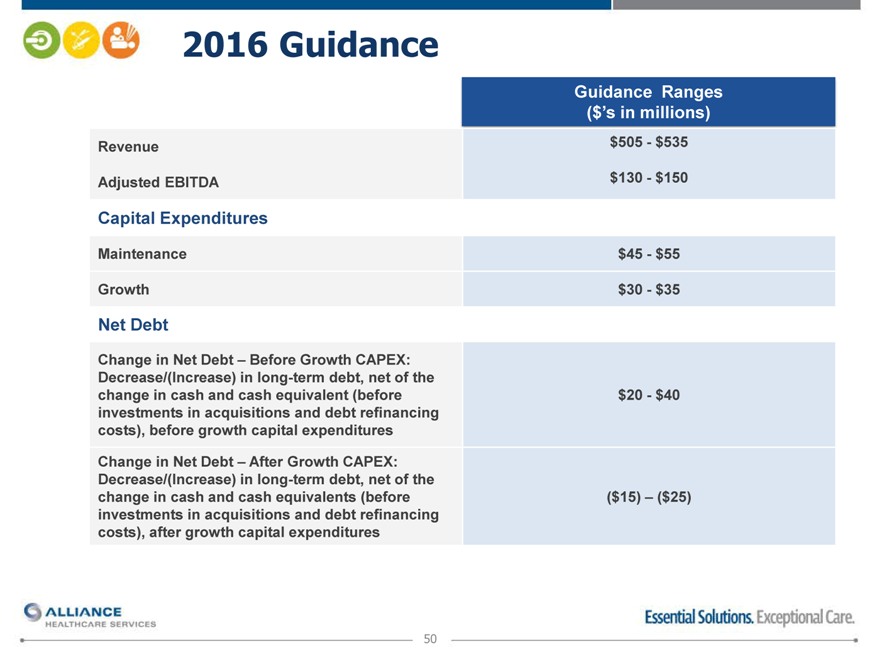
2016 Guidance
Guidance Ranges
($’s in millions)
Revenue $505—$535
Adjusted EBITDA $130—$150
Capital Expenditures
Maintenance $45—$55
Growth $30—$35
Net Debt
Change in Net Debt – Before Growth CAPEX:
Decrease/(Increase) in long-term debt, net of the
change in cash and cash equivalent (before $20—$40
investments in acquisitions and debt refinancing
costs), before growth capital expenditures
Change in Net Debt – After Growth CAPEX:
Decrease/(Increase) in long-term debt, net of the
change in cash and cash equivalents (before ($15) – ($25)
investments in acquisitions and debt refinancing
costs), after growth capital expenditures
50
|
|
investors@aiq-us.com