Attached files
| file | filename |
|---|---|
| EX-99.1 - EXHIBIT 99.1 - ALLIANCE DATA SYSTEMS CORP | exhibit_99-1.htm |
| 8-K - FORM 8-K - ALLIANCE DATA SYSTEMS CORP | form_8k.htm |
Exhibit 99.2

Alliance Data NYSE: ADS Third Quarter 2016 ResultsOctober 20, 2016
Agenda Speakers: Ed Heffernan President and CEO Charles Horn EVP and CFO Bryan Kennedy President of Epsilon Third Quarter Consolidated ResultsSegment ResultsThird Quarter and Full Year Outlook2017 Guidance 1 2
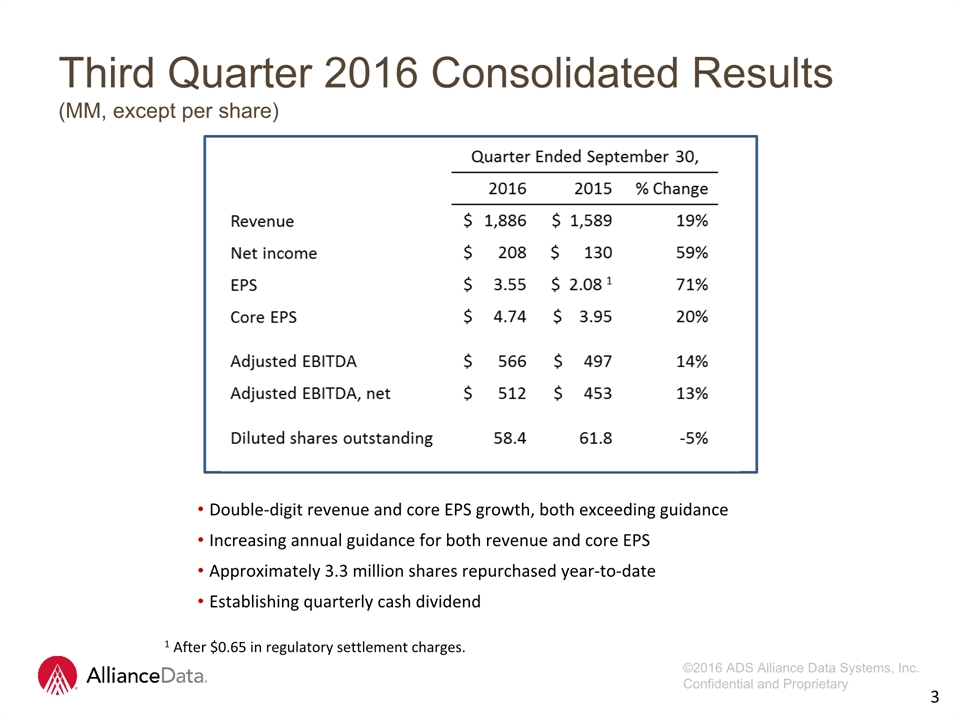
Third Quarter 2016 Consolidated Results(MM, except per share) Double-digit revenue and core EPS growth, both exceeding guidanceIncreasing annual guidance for both revenue and core EPSApproximately 3.3 million shares repurchased year-to-dateEstablishing quarterly cash dividend 2 1 After $0.65 in regulatory settlement charges. 3

LoyaltyOne® (MM) AIR MILES® revenue increased 43 percent on a constant currency basis, driven by higher than expected redemptions AIR MILES redeemed increased 74 percent ahead of the upcoming expiry dateA portion is likely due to timing. Pull-forward of redemptions from Q4 Q3BrandLoyalty revenue increased 5 percent on a constant currency basis Quarter Ended September 30, 2016 2015 % Change Revenue $ 384 $ 299 28% Adjusted EBITDA $ 82 $ 72 14% Non-controlling interest 0 -7 Adjusted EBITDA, net $ 82 $ 65 28% Adjusted EBITDA % 21% 24% -3% Constant Currency Revenue $ 383 $ 299 28% Adjusted EBITDA $ 82 $ 72 14% 3 4
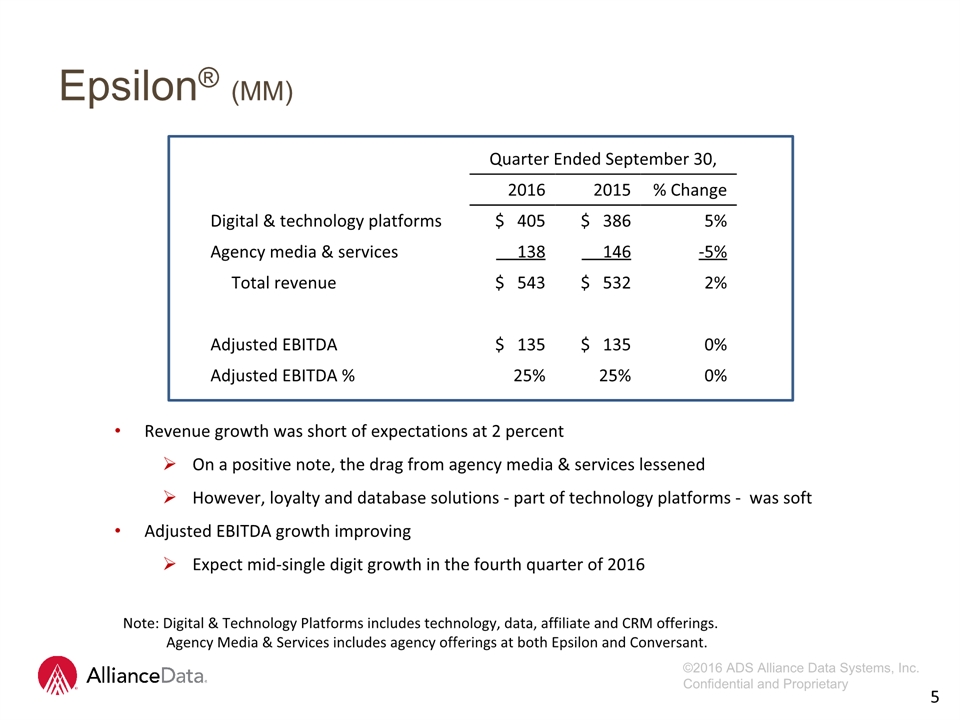
Epsilon® (MM) Revenue growth was short of expectations at 2 percentOn a positive note, the drag from agency media & services lessenedHowever, loyalty and database solutions - part of technology platforms - was softAdjusted EBITDA growth improvingExpect mid-single digit growth in the fourth quarter of 2016 Quarter Ended September 30, 2016 2015 % Change Digital & technology platforms $ 405 $ 386 5% Agency media & services 138 146 -5% Total revenue $ 543 $ 532 2% Adjusted EBITDA $ 135 $ 135 0% Adjusted EBITDA % 25% 25% 0% 4 Note: Digital & Technology Platforms includes technology, data, affiliate and CRM offerings. Agency Media & Services includes agency offerings at both Epsilon and Conversant. 5

Card Services (MM) Quarter Ended September 30, 2016 2015 % Change Revenue $ 966 $ 764 26% Operating expenses 330 266 24% Provision for loan losses 251 172 46% Funding costs 54 37 46% Adjusted EBITDA, net $ 331 $ 289 14% Adjusted EBITDA, net % 34% 38% -4% 5 Revenue increased 26 percent to $966 million driven by strong growth in average receivablesGross yields of 26.8 percent were essentially flat with last yearProvision expense increased 46 percent due to receivables growth and account seasoning$92 million build in allowance for loan loss during the quarter6.2 percent reserve on reservable card receivables of $14.1 billion 1 1 Excludes $65 million in regulatory settlement charges. 6

Card Services (MM) Growth of 3 percent in core cardholder spending driven by a 150 basis point tender share gain Operating expenses improved 30 bps expressed as a percentage of average card receivablesDelinquency rate trends tracking to loss rate guidance for full year Quarter Ended September 30, Key metrics: 2016 2015 Change Credit sales $ 6,986 $ 6,000 16% Average card receivables 1 $13,995 $ 11,369 23% Total gross yield 26.8% 26.9% -0.1% Operating expenses as % of average card receivables 9.1% 9.4%2 -0.3% Principal loss rates 4.7% 4.4% 0.3% Delinquency rate 5.0% 4.5% 0.5% 6 1 Excludes card receivables classified as held for sale. 7 2 Excludes $65 million in regulatory settlement charges.

ConsolidatedThird Quarter: revenue of $1.9 billion, +19 percent and core EPS of $4.74, +20 percentBoth exceeding guidance (business strength and timing)Raising annual guidance: revenue of $7.2 billion, +11 percent and core EPS of $16.90, +12 percentShare repurchase program: ~$700 million year-to-date Corporate leverage ratio remains manageable at less than 3xEstablishing quarterly dividend at 1 percentCard ServicesPortfolio growth over 20 percent for both third quarter and full yearTender share ↑150 basis points in third quarter and ↑180 basis points for full year (85 percent from mature accounts)Gross yields of 26.8 percent in third quarterYear-over-year compression abating: ↓210bps in Q1, ↓80bps in Q2, ↓10bps in Q3Delinquency rates and principal loss rates tracking to up ~50 bps for full yearQ3 loss rate ↓ guidance, Q4 loss rate ↑ guidance due to seasonality$2 billion vintage signedBoscovs, Hot Topic, Forever 21, The Children’s Place, Bed Bath & Beyond, Williams-Sonoma, Century 21, Ulta Beauty Third Quarter and Full Year Outlook 7 8

Third Quarter and Full Year Outlook EpsilonRevenue growth still choppy: -2 percent in Q1, +5 percent in Q2 and +2 percent in Q3Adjusted EBITDA benefitting from India initiative-22 percent in Q1, -9 percent in Q2, FLAT in Q3, up +5 percent in Q4 (estimate)LoyaltyOne BrandLoyalty: tracking to double-digit growth in revenue and adjusted EBITDA for full yearBrandLoyalty: Canada rollout successful (~$45 million in revenue); initial U.S. client rollout commencingAIR MILES: double-digit growth in revenue and mid-single digit growth in adjusted EBITDAAIR MILES: carefully monitoring brand impact of miles expiration 8 9
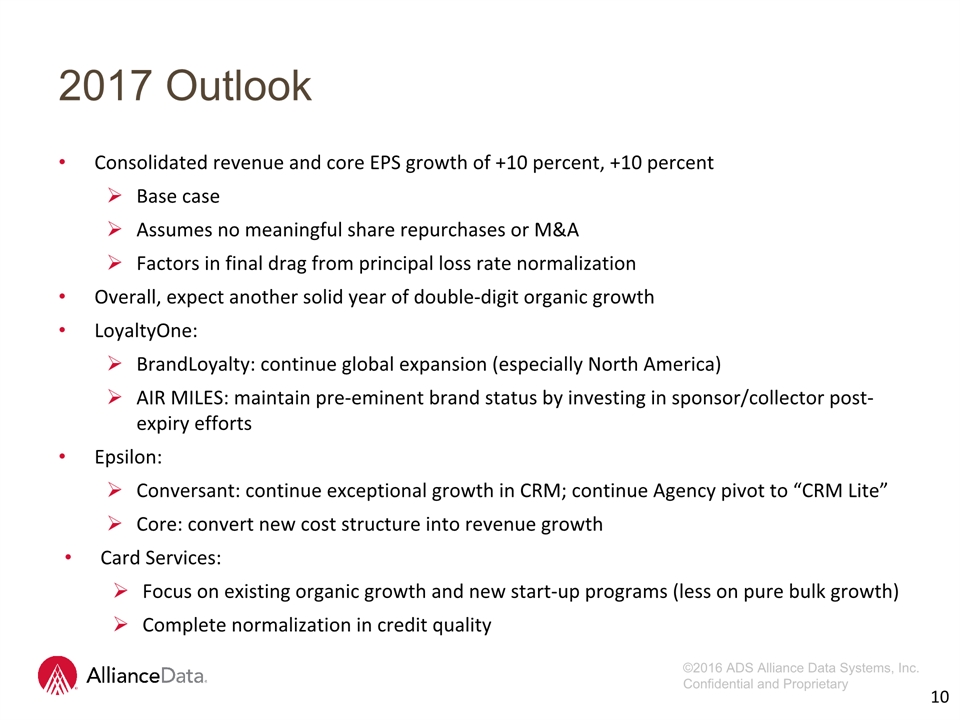
2017 Outlook Consolidated revenue and core EPS growth of +10 percent, +10 percentBase caseAssumes no meaningful share repurchases or M&AFactors in final drag from principal loss rate normalizationOverall, expect another solid year of double-digit organic growthLoyaltyOne:BrandLoyalty: continue global expansion (especially North America)AIR MILES: maintain pre-eminent brand status by investing in sponsor/collector post-expiry effortsEpsilon:Conversant: continue exceptional growth in CRM; continue Agency pivot to “CRM Lite”Core: convert new cost structure into revenue growthCard Services:Focus on existing organic growth and new start-up programs (less on pure bulk growth)Complete normalization in credit quality 10

OutlookDelinquency and Net Loss RatesDelinquency rates best predictor of forward loss rate90% Correlation 11

Delinquency rates have strong seasonality (Sep-Oct peak), but are very predictable.Delinquency rates are 90% correlated with net loss rates that come 3-6 months later (an account becomes a p&l loss after 180 days delinquent).2017 delinquency rates should narrow and become flat by the third quarter. Loss rates expected to follow and be flat to prior year.Long-term steady state loss rates should then settle in and remain stable.Earnings acceleration begins.We will update this chart each month when standard monthly card data are released. 2017 Outlook – Closing the “Wedge” 12
Summary Over the past 15 years Revenue: $770 million $7.2 billion* (16 percent CAGR)Core EPS: $0.52 $16.90* (26 percent CAGR)2016 – 2017Principal loss rates increase following uncharacteristically low levels during 2012 to 2015Knocks 10 points from core EPS growth each yearRevenue and core EPS still grow double-digit annuallyWhen the “wedge” closes, normalized run-rates achieved Earnings growth accelerates back into 20 percent rangeSecular trends towards data-driven personalized marketing should continue to favor ADS’ model 13 * Guidance for 2016.

Forward-Looking StatementsThis presentation contains forward-looking statements within the meaning of Section 27A of the Securities Act of 1933 and Section 21E of the Securities Exchange Act of 1934. Forward-looking statements give our expectations or forecasts of future events and can generally be identified by the use of words such as “believe,” “expect,” “anticipate,” “estimate,” “intend,” “project,” “plan,” “likely,” “may,” “should” or other words or phrases of similar import. Similarly, statements that describe our business strategy, outlook, objectives, plans, intentions or goals also are forward-looking statements. Examples of forward-looking statements include, but are not limited to, statements we make regarding our expected operating results, future economic conditions including currency exchange rates, future dividend declarations and the guidance we give with respect to our anticipated financial performance. We believe that our expectations are based on reasonable assumptions. Forward-looking statements, however, are subject to a number of risks and uncertainties that could cause actual results to differ materially from the projections, anticipated results or other expectations expressed in this presentation, and no assurances can be given that our expectations will prove to have been correct. These risks and uncertainties include, but are not limited to, factors set forth in the Risk Factors section in our Annual Report on Form 10-K for the most recently ended fiscal year, which may be updated in Item 1A of, or elsewhere in, our Quarterly Reports on Form 10-Q filed for periods subsequent to such Form 10-K. Our forward-looking statements speak only as of the date made, and we undertake no obligation, other than as required by applicable law, to update or revise any forward-looking statements, whether as a result of new information, subsequent events, anticipated or unanticipated circumstances or otherwise. 11 14

Financial MeasuresIn addition to the results presented in accordance with generally accepted accounting principles, or GAAP, the Company may present financial measures that are non-GAAP measures, such as constant currency financial measures, adjusted EBITDA, adjusted EBITDA margin, adjusted EBITDA, net of funding costs and non-controlling interest, core earnings and core earnings per diluted share (core EPS). The Company calculates constant currency by converting our current period local currency financial results using the prior period exchange rates. The Company believes that these non-GAAP financial measures, viewed in addition to and not in lieu of the Company’s reported GAAP results, provide useful information to investors regarding the Company’s performance and overall results of operations. Constant currency excludes the impact of fluctuations in foreign exchange rates. These metrics are an integral part of the Company’s internal reporting to measure the performance of reportable segments and the overall effectiveness of senior management. Reconciliations to comparable GAAP financial measures are available in the accompanying schedules and on the Company’s website. The financial measures presented are consistent with the Company’s historical financial reporting practices. Core earnings and core earnings per diluted share represent performance measures and are not intended to represent liquidity measures. The non-GAAP financial measures presented herein may not be comparable to similarly titled measures presented by other companies, and are not identical to corresponding measures used in other various agreements or public filings. 12 15

Q & A 16