Attached files
| file | filename |
|---|---|
| EX-99.1 - EX-99.1 - US BANCORP \DE\ | d87859dex991.htm |
| 8-K - FORM 8-K - US BANCORP \DE\ | d87859d8k.htm |
 U.S.
Bancorp 3Q16 Earnings
Conference Call Richard K. Davis Chairman and CEO October 19, 2016 Terry Dolan Vice Chairman and CFO Exhibit 99.2 |
 U.S. BANCORP | 2 Forward-looking Statements and Additional Information The following information appears in accordance with the Private Securities Litigation Reform Act of 1995:
This presentation contains forward-looking statements about U.S. Bancorp.
Statements that are not historical or current facts, including statements
about beliefs and expectations, are forward-looking statements and are based on the information available to, and assumptions and estimates made by, management as of the date hereof. These forward-looking statements cover, among other things, anticipated future
revenue and expenses and the future plans and prospects of U.S.
Bancorp. Forward-looking statements involve inherent risks and uncertainties, and important factors could cause actual results to differ materially from those anticipated. A reversal or slowing of the current economic
recovery or another severe contraction could adversely affect U.S.
Bancorp’s revenues and the values of its assets and liabilities. Global financial markets could experience a recurrence of significant turbulence, which could reduce the availability of funding to certain financial institutions and
lead to a tightening of credit, a reduction of business activity, and
increased market volatility. Stress in the commercial real estate markets, as well as a downturn in the residential real estate markets, could cause credit losses and deterioration in asset values. In addition, U.S. Bancorp’s business and financial performance is likely to be negatively impacted by recently enacted and future legislation and regulation. U.S.
Bancorp’s results could
also be adversely affected by deterioration in general business and economic conditions (which could result, in part, from the United Kingdom’s withdrawal from the European Union); changes in interest rates; deterioration in the credit quality of its loan portfolios
or in the value of the
collateral securing those loans; deterioration in the value of securities held in its investment securities portfolio; legal and regulatory developments; litigation; increased competition from both banks and non-banks; changes in customer behavior and preferences; breaches in data
security;
effects of mergers and acquisitions and related integration; effects of critical accounting policies and judgments; and management’s ability to effectively manage credit risk, market risk, operational risk, compliance risk, strategic risk, interest rate risk, liquidity risk and
reputational risk.
For discussion of these and other risks that may cause actual results to differ from
expectations, refer to U.S. Bancorp’s Annual Report on Form 10-K for the year ended December 31, 2015, on file with the Securities and Exchange Commission, including the sections entitled
“Risk Factors” and “Corporate Risk Profile” contained
in Exhibit 13, and all subsequent filings with the Securities and Exchange Commission under Sections 13(a), 13(c), 14 or 15(d) of the Securities Exchange Act of 1934. However, factors other than these also could adversely affect U.S.
Bancorp’s results, and the reader should not consider these factors
to be a complete set of all potential risks or uncertainties. Forward-looking statements speak only as of the date hereof, and U.S. Bancorp undertakes no obligation to update them in light of new information or future
events. This presentation includes non-GAAP financial measures to describe U.S. Bancorp’s performance. The calculations of these measures are provided in the Appendix. These disclosures should not be viewed as a substitute for operating results determined in accordance with GAAP,
nor are they necessarily comparable to non-GAAP performance measures
that may be presented by other companies. |
| U.S. BANCORP | 3 3Q16 Highlights • Net income of $1.5 billion; $0.84 per diluted common share • Average loans grew 1.1% vs. 2Q16 and 7.6% vs. 3Q15 – Loan growth of 6.4% vs. 3Q15 excluding the credit card portfolio acquisition at the end of 4Q15
and student loans which were transferred from held for sale to held for investment in
3Q15 •
Average deposits grew 3.6% vs. 2Q16 and 10.0% vs. 3Q15
• Net interest income grew 1.6%* vs. 2Q16 and 4.3%* vs. 3Q15 – Average earning assets increased 2.2% vs. 2Q16 and 6.6% vs. 3Q15 • Noninterest income increased 5.1% vs. 3Q15 – Mortgage banking revenue rose 31.9% vs. 2Q16 and 40.2% vs. 3Q15 • Nonperforming assets and net charge-offs decreased slightly on a linked quarter basis
• Returned 79% of earnings to shareholders through dividends and share buybacks * Taxable equivalent basis; increases of 1.7% and 4.5%, respectively, as reported on a GAAP basis; see slide 24 for reconciliation
|
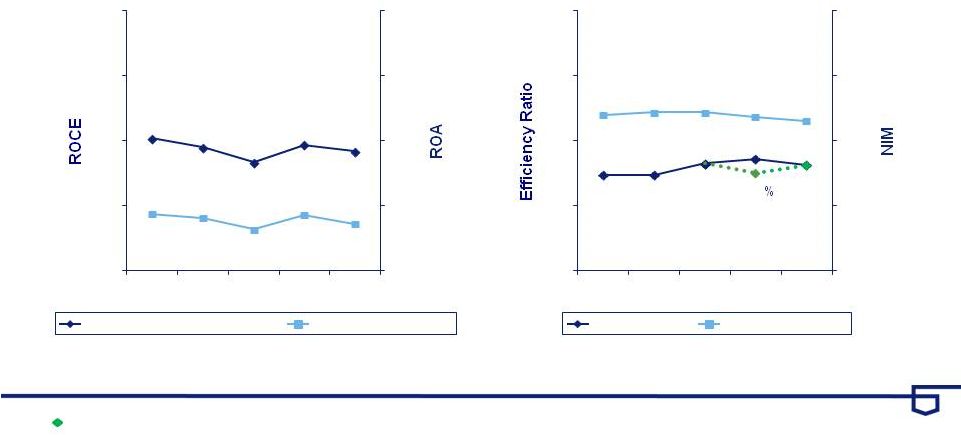 Performance
Ratios Return on Average Common Equity
and Return on Average Assets
Efficiency Ratio and Net Interest Margin Return on Avg Common Equity Return on Avg Assets Efficiency Ratio Net Interest Margin * Excludes notable items Efficiency ratio computed as noninterest expense divided by the sum of net interest income on a taxable-equivalent basis and noninterest
income excluding net securities gains (losses)
54.0% 1.0% 1.5% 2.0% 2.5% 3.0% 3Q15 4Q15 1Q16 2Q16 3Q16 14.1% 13.7% 13.0% 13.8% 13.5% 1.44% 1.41% 1.32% 1.43% 1.36% 8% 11% 14% 17% 20% 53.9% 53.9% 54.6% 54.9% 54.5% 3.04% 3.06% 3.06% 3.02% 2.98% 1.6% 2.2% 2.8% 3.4% 4.0% 48% 52% 56% 60% 64% 3Q15 4Q15 1Q16 2Q16 3Q16 U.S. BANCORP | 4 |
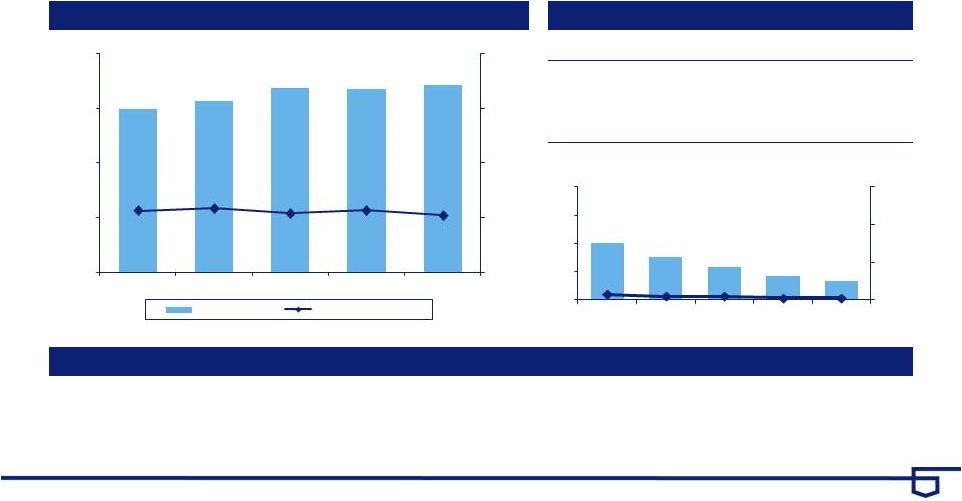
 Revenue
Growth * Notable item: 2Q16 Visa Europe sale gain $180
million Year-Over-Year Change
3.1% 0.8% 2.7% 8.1% 4.7% $ in millions 4.5% excluding 2Q16 notable item* U.S. BANCORP | 5 $5,147 $5,211 $5,037 $5,388 4,000 4,500 5,000 5,500 6,000 3Q15 4Q15 1Q16 2Q16 3Q16 $5,448 $180 |
 Loan and
Deposit Growth Year-Over-Year Growth
Average Balances 180 220 260 300 340 3Q15 4Q15 1Q16 2Q16 3Q16 Loans Deposits 6.5% * 6.4% * 5.8% $262.3 8.1% $266.6 2.7%
$250.5 4.2% $256.7 6.9% $294.5 6.3% $295.9 7.6% $307.4 6.9% $289.7 $ in billions 3.8% * * Adjusted for credit card portfolio acquisition and student loan classification
5.2% * 10.0% $318.5 7.6% $269.6 U.S. BANCORP | 6 |
 Credit
Quality Net Charge-offs
Nonperforming Assets Net Charge-offs (Left Scale) NCOs to Avg Loans (Right Scale) Nonperforming Assets (Left Scale) NPAs to Loans plus ORE (Right Scale) $ in millions U.S. BANCORP | 7 $292 $305 $315 $317 $315 0.46% 0.47% 0.48% 0.48% 0.46% 0.00% 0.75% 1.50% 2.25% 3.00% 0 130 260 390 520 3Q15 4Q15 1Q16 2Q16 3Q16 $1,567 $1,523 $1,719 $1,672 $1,664 0.61% 0.58% 0.65% 0.62% 0.61% 0.00% 0.75% 1.50% 2.25% 3.00% 0 700 1,400 2,100 2,800 3Q15 4Q15 1Q16 2Q16 3Q16 |
 Earnings
Summary $ and shares in millions, except per-share data
Notable Items 3Q16 2Q16 3Q15 vs 2Q16 vs 3Q15 2Q16 vs 2Q16 Net Interest Income 2,893 $ 2,845 $ 2,768 $ 1.7 4.5 - $ 1.7 Taxable-equivalent Adjustment 50 51 53 (2.0) (5.7) - (2.0) 2,943 2,896 2,821 1.6 4.3 - 1.6 Noninterest Income 2,445 2,552 2,326 (4.2) 5.1 180 3.1 Net Revenue 5,388 5,448 5,147 (1.1) 4.7 180 2.3 Noninterest Expense 2,931 2,992 2,775 2.0 (5.6) 150 (3.1) Operating Income 2,457 2,456 2,372 - 3.6 30 1.3 Net Charge-offs 315 317 292 0.6 (7.9) - 0.6 Excess Provision 10 10 (10) - NM - - Income before Taxes
2,132 2,129 2,090 0.1 2.0 30 1.6 Applicable Income Taxes 616 593 587 (3.9) (4.9) 8 (5.3) Noncontrolling Interests (14) (14) (14) - - - - Net Income
1,502 1,522 1,489 (1.3) 0.9 22 0.1 Preferred Dividends/Other 68 87 67 21.8 (1.5) - 21.8 NI to Common 1,434 $ 1,435 $ 1,422 $ (0.1) 0.8 22 $ 1.5 Diluted EPS 0.84 $ 0.83 $ 0.81 $ 1.2 3.7 $0.01 2.4 Average Diluted Shares 1,716 1,731 1,766 0.9 2.8 Excl Notable Net Interest Income (taxable-equivalent basis) % B/(W) Reported Items 3Q16 % B/(W) U.S. BANCORP | 8 |
 Net
Interest Income Net Interest Income
Key Points vs. 3Q15 • Average earning assets grew $24.5 billion, or 6.6% • Net interest margin lower 6 bps (2.98% vs. 3.04%) – Principally due to increased funding costs and higher average cash balances, along with lower reinvestment rates on investment securities, partially offset by higher rates on new loans vs. 2Q16 • Average earning assets grew $8.4 billion, or 2.2% • Net interest margin lower 4 bps (2.98% vs. 3.02%) – Primarily reflected higher average cash balances as well as lower reinvestment rates on securities partially offset by LIBOR rate benefit on loans Year-Over-Year Change 2.7% 2.6% 4.9% 4.5% 4.3% $ in millions Taxable-equivalent basis U.S. BANCORP | 9 $2,821 $2,871 $2,888 $2,896 $2,943 3.04% 3.06% 3.06% 3.02% 2.98% 0.0% 2.0% 4.0% 6.0% 8.0% 0 1,000 2,000 3,000 4,000 3Q15 4Q15 1Q16 2Q16 3Q16 Net Interest Income Net Interest Margin |
 Noninterest Income $505 $536 $424 $666 $442 $224 $211 $187 $238 $314 $409 $400 $390 $410 $426 $329 $336 $339 $358 $362 $859 $857 $809 $880 $901 0 750 1,500 2,250 3,000 3Q15 4Q15 1Q16 2Q16 3Q16 Noninterest Income Key Points vs. 3Q15 • Noninterest income increased $119 million, or 5.1% – Higher mortgage banking revenue (40.2% increase) driven by higher origination and sales volume in part due to refinancing activities in the marketplace – Higher trust and investment management fees (10.0% increase) reflecting lower money market fee waivers along with account growth and improved market conditions – Higher credit and debit card revenue (11.2% increase) due to higher transaction volumes, including acquired portfolios – Lower commercial products revenue (5.2% decrease) primarily driven by a large syndication transaction in 3Q15 vs. 2Q16 • Noninterest income decreased $107 million, or 4.2% (3.1% increase excluding the 2Q16 Visa Europe gain) – Higher mortgage banking revenue (31.9% increase) reflecting higher origination and sales volume and a favorable change in the valuation of mortgage servicing rights, net of hedging activities – Higher corporate payment products revenue (5.0% increase) due to seasonally higher transaction volumes – Lower commercial products revenue (8.0% decrease) primarily due to higher capital markets volume in 2Q16 given market conditions – Lower other income due to the notable item in 2Q16 ($180 million Visa Europe gain); excluding this, other noninterest income was lower (16.5% decrease) primarily due to lower end-of-term gains on auto leases Year-Over-Year Change 3.7% (1.3%) (0.2%) 12.3% 5.1% $2,552 $2,326 $2,340 $2,149 All Other Mortgage Service Charges Trust and Inv Mgmt Payments * Adjusted for notable item: 2Q16 Visa Europe sale gain $180 million Payments = credit and debit card, corporate payment products and merchant processing
Service charges = deposit service charges, treasury management and ATM
processing $ in millions
4.4% adjusted* $2,445 U.S. BANCORP | 10 |
 Noninterest Expense $501 $554 $465 $606 $520 $222 $230 $233 $241 $243 $291 $295 $254 $347 $309 $251 $246 $248 $243 $250 $1,510 $1,484 $1,549 $1,555 $1,609 0 900 1,800 2,700 3,600 3Q15 4Q15 1Q16 2Q16 3Q16 Noninterest Expense Key Points vs. 3Q15 • Noninterest expense increased $156 million, or 5.6% – Higher compensation (8.5% increase) principally due to the impact of hiring decisions to support business growth and compliance programs – Higher professional services expense (10.4% increase) primarily due to compliance programs – Higher technology and communications expense (9.5% increase) including the impact of capital investments and costs related to acquired card portfolios – Higher other noninterest expense (3.5% increase) reflecting the impact of the FDIC surcharge which began 3Q16 vs. 2Q16 • Noninterest expense decreased $61 million, or 2.0% (3.1% increase excluding notable expense items in 2Q16) – Higher compensation expense (4.1% increase) due to an additional business day in the quarter compared to 2Q16 and increased staffing – Excluding notable items in 2Q16, higher other noninterest expense (5.1% increase) due to seasonally higher costs related to tax-advantaged projects and the impact of the FDIC surcharge and lower marketing and business development expense (6.4% decrease) due to the timing of various marketing programs Year-Over-Year Change 6.2% 0.2% 3.2% 11.6% 5.6% $2,992 $2,775 $2,809 $2,749 All Other Tech and Communications Prof Svcs, Marketing and PPS Occupancy and Equipment Compensation and Benefits * Adjusted for notable items: 2Q16 related to accruals for legal and regulatory matters ($110 million) and charitable contribution ($40
million) $ in millions
$2,931 6.0% adjusted* U.S. BANCORP | 11 |
 Capital
Position * RWA = risk-weighted assets,
See slide 24 $ in billions 3Q16 2Q16 1Q16 4Q15 3Q15 Total U.S. Bancorp shareholders' equity 47.8 $ 47.4 $ 46.7 $ 46.1 $ 45.1 $ Standardized Approach Basel III transitional standardized approach Common equity tier 1 capital ratio 9.5% 9.5% 9.5% 9.6% 9.6% Tier 1 capital ratio 11.1% 11.1% 11.1% 11.3% 11.1% Total risk-based capital ratio 13.3% 13.4% 13.1% 13.3% 13.1% Leverage ratio 9.2% 9.3% 9.3% 9.5% 9.3% Common equity tier 1 capital to RWA* estimated for the Basel III fully implemented standardized approach 9.3% 9.3% 9.2% 9.1% 9.2% Advanced Approaches Common equity tier 1 capital to RWA for the Basel III transitional advanced approaches 12.4% 12.3% 12.3% 12.5% 13.0% Common equity tier 1 capital to RWA estimated for the Basel III fully implemented advanced approaches 12.1% 12.0% 11.9% 11.9% 12.4% Tangible common equity ratio 7.5% 7.6% 7.7% 7.6% 7.7% Tangible common equity as a % of RWA 9.3% 9.3% 9.3% 9.2% 9.3% U.S. BANCORP | 12 |
 Appendix U.S. BANCORP | 13 |
 Average
Loans 9.5%
9.0% 10.2% 10.7% 9.0% 3.6% 3.1% (0.6%) 1.3% 2.5% (0.3%) 2.1% 5.4% 8.6% 8.6% 1.1% 4.7% 5.2%* 5.8%* 5.9%* 4.0% 3.6% 4.1%* 5.2%* 0 80 160 240 320 3Q15 4Q15 1Q16 2Q16 3Q16 6.5%* Average Loans Key Points vs. 3Q15 • Average total loans increased by $19.1 billion, or 7.6% (6.4% growth excluding student loans and the credit card portfolio acquisition) • Average total commercial loans increased $7.7 billion, or 9.0% • Average residential mortgage loans increased $4.5 billion or 8.6% vs. 2Q16 • Average total loans increased by $3.1 billion, or 1.1% • Average residential mortgage loans increased $0.8 billion or 1.4% • Average credit card loans increased $0.5 billion or 2.4% Year-Over-Year Growth 2.7% 4.2% 5.8% 8.1% 7.6% Covered Commercial CRE Res Mtg Retail Credit Card $266.6 $250.5 $256.7 $262.3 $ in billions 3.8%* 5.2%* 0.3% 5.6%* $269.6 6.4%* U.S. BANCORP | 14 * Excluding student loans, which were transferred to held for sale at the end of 1Q15 and returned to held for investment during 3Q15, and the
acquisition of the Fidelity credit card portfolio at the end of 4Q15 |
 Average
Deposits Average Deposits
Key Points vs. 3Q15 • Average total deposits increased by $28.9 billion, or 10.0% • Average low-cost deposits (NIB, interest checking, money market and savings) increased by $30.4 billion, or 11.9% vs. 2Q16 • Average total deposits increased by $11.2 billion, or 3.6% • Average low-cost deposits increased by $12.9 billion, or 4.7% Year-Over-Year Growth 6.9% 6.9% 6.3% 7.6% 10.0% Time Money Market Checking and Savings Noninterest-bearing $289.7 $294.5 $295.9 $307.4 $ in billions $318.5 U.S. BANCORP | 15 (18.1%) (19.2%) (14.4%) (5.6%) (4.7%) 21.3% 20.2% 17.0% 16.3% 24.4% 5.9% 6.7% 7.1% 9.6% 10.4% 9.2% 9.0% 5.4% 2.4% 1.3% 0 90 180 270 360 3Q15 4Q15 1Q16 2Q16 3Q16 |
 Credit
Quality – Commercial Loans
Average Loans and Net Charge-offs Ratios
Key Statistics Key Points • Average year-over-year loan growth of 9.0% demonstrates continued momentum with customers
• Net charge-offs increased slightly on both a year-over-year and linked quarter basis, but remained at historically low
levels •
Nonperforming loans increased year-over-year and linked quarter primarily due
to weakness in energy •
Line utilization decreased slightly
3Q15 2Q16 3Q16 Average Loans $84,704 $92,154 $92,369 30-89 Delinquencies 0.24% 0.22% 0.24% 90+ Delinquencies 0.05% 0.05% 0.05% Nonperforming Loans 0.20% 0.53% 0.55% $ in millions U.S. BANCORP | 16 $84,704 $86,803 $89,820 $92,154 $92,369 0.33% 0.29% 0.37% 0.34% 0.37% 0.0% 0.5% 1.0% 1.5% 2.0% 0 30,000 60,000 90,000 120,000 3Q15 4Q15 1Q16 2Q16 3Q16 Average Loans Net Charge -offs Ratio 20% 24% 28% 32% 36% Revolving Line Utilization Trend |
 CRE
Construction A&D
Construction $837 Credit Quality – Commercial Real Estate Average Loans and Net Charge-offs Ratios Key Statistics Key Points • Average loans increased 2.5% year-over-year • Nonperforming loans remained stable at historically low levels • Recoveries within the CRE portfolio continued to offset loan charge-offs, resulting in net losses remaining near zero
3Q15 2Q16 3Q16 Average Loans $42,316 $42,988 $43,374 30-89 Delinquencies 0.15% 0.11% 0.08% 90+ Delinquencies 0.05% 0.03% 0.02% Nonperforming Loans 0.34% 0.24% 0.24% Performing TDRs* $218 $185 $274 $ in millions CRE Mortgage Investor $20,878 Owner Occupied $11,010 Multi-family $3,986 Retail $959 Residential Construction $2,352 Office $1,024 Other $2,328 * TDR = troubled debt restructuring U.S. BANCORP | 17 $42,316 $42,231 $42,401 $42,988 $43,374 -0.10% 0.00% -0.05% 0.00% 0.01% -0.5% 0.0% 0.5% 1.0% 1.5% 0 20,000 40,000 60,000 3Q15 4Q15 1Q16 2Q16 3Q16 Average Loans Net Charge -offs Ratio |
 Credit
Quality – Residential Mortgage
Average Loans and Net Charge-offs Ratios
Key Statistics Key Points • Originations continued to be high credit quality (weighted average FICO 759, weighted average LTV 69%)
• 89% of the balances have been originated since the beginning of 2009; the origination quality metrics and
performance to date have significantly outperformed prior vintages with similar
seasoning $ in millions
3Q15 2Q16 3Q16 Average Loans $51,831 $55,501 $56,284 30-89 Delinquencies 0.35% 0.28% 0.26% 90+ Delinquencies 0.33% 0.27% 0.28% Nonperforming Loans 1.40% 1.12% 1.09% *Excludes GNMA loans, whose repayments are insured by the FHA or guaranteed by the Department of VA ($1,344 million in 3Q16)
U.S. BANCORP | 18
$51,831 $52,970 $54,208 $55,501 $56,284 0.19% 0.12% 0.14% 0.12% 0.08% 0.0% 0.5% 1.0% 1.5% 2.0% 0 20,000 40,000 60,000 80,000 3Q15 4Q15 1Q16 2Q16 3Q16 Average Loans Net Charge -offs Ratio $1,903 $1,863 $1,827 $1,772 $1,749 0 800 1,600 2,400 3,200 3Q15 4Q15 1Q16 2Q16 3Q16 Residential Mortgage Performing TDRs* |
 Credit
Quality – Credit Card
Average Loans and Net Charge-offs Ratios
Key Statistics Key Points • Year-over-year average loan growth of 15% was driven, in part, by the portfolio acquisition at the end of 4Q15
• Origination credit quality remains strong, with a weighted average FICO of 759 $ in millions 3Q15 2Q16 3Q16 Average Loans $17,944 $20,140 $20,628 30-89 Delinquencies 1.27% 1.15% 1.27% 90+ Delinquencies 1.10% 0.98% 1.11% Nonperforming Loans 0.06% 0.02% 0.02% U.S. BANCORP | 19 $17,944 $18,838 $20,244 $20,140 $20,628 3.38% 3.50% 3.26% 3.39% 3.11% 0.0% 3.0% 6.0% 9.0% 12.0% 0 6,000 12,000 18,000 24,000 3Q15 4Q15 1Q16 2Q16 3Q16 Average Loans Net Charge -offs Ratio $12 $9 $7 $5 $4 0.06% 0.04% 0.04% 0.02% 0.02% 0.0% 0.4% 0.8% 1.2% 0 6 12 18 24 3Q15 4Q15 1Q16 2Q16 3Q16 Credit Card Nonperforming Loans |
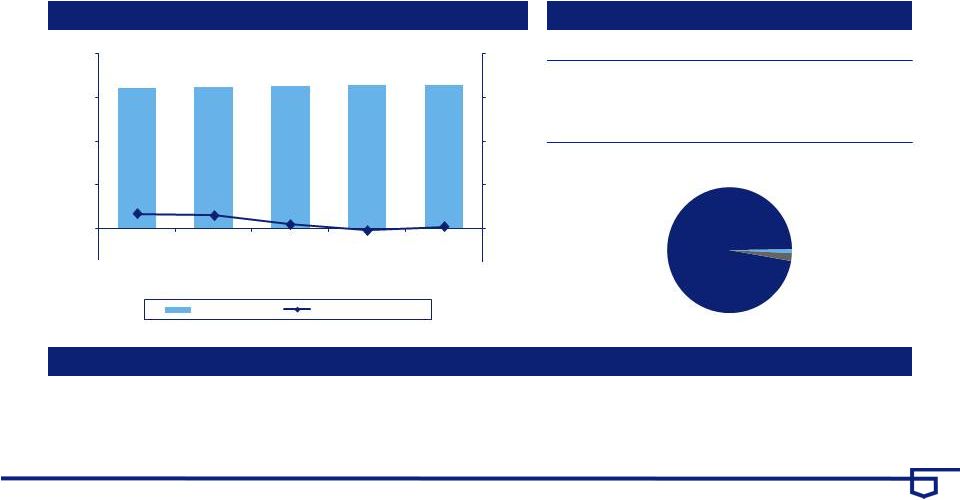 Credit
Quality – Home Equity
Average Loans and Net Charge-offs Ratios
Key Statistics Key Points • High-quality originations (weighted average FICO on commitments was 766, weighted average CLTV 72%)
originated primarily through the retail branch network to existing bank customers on
their primary residences •
Net charge-offs declined year-over-year due to strong
recoveries. $ in millions
3Q15 2Q16 3Q16 Average Loans $16,083 $16,394 $16,470 30-89 Delinquencies 0.36% 0.36% 0.41% 90+ Delinquencies 0.25% 0.24% 0.24% Nonperforming Loans 0.91% 0.78% 0.75% Home Equity Subprime: 1% Wtd Avg LTV*: 89% NCO: 0.00% Prime: 97% Wtd Avg LTV*: 72% NCO: 0.02% Other: 2% Wtd Avg LTV*: 70% NCO: 0.00% *LTV at origination U.S. BANCORP | 20 Average Loans Net Charge -offs Ratio $16,083 $16,241 $16,368 $16,394 $16,470 0.17% 0.15% 0.05% -0.02% 0.02% 0.0% 0.5% 1.0% 1.5% 2.0% 0 5,000 10,000 15,000 20,000 3Q15 4Q15 1Q16 2Q16 3Q16 |
 Credit
Quality – Retail Leasing
Average Loans and Net Charge-offs Ratios
Key Statistics Key Points • Continued high-quality originations (weighted average FICO 783) support the portfolio’s stable credit profile
• Delinquencies, nonperforming loans, and net charge-offs remained at very low levels
$5,480 $5,265 $5,179 $5,326 $5,773 0.14% 0.08% 0.08% 0.15% 0.07% 0.0% 0.2% 0.4% 0.6% 0.8% 0 2,000 4,000 6,000 8,000 3Q15 4Q15 1Q16 2Q16 3Q16 Average Loans $ in millions 3Q15 2Q16 3Q16 Average Loans $5,480 $5,326 $5,773 30-89 Delinquencies 0.18% 0.18% 0.21% 90+ Delinquencies 0.02% 0.00% 0.00% Nonperforming Loans 0.04% 0.04% 0.05% 100 110 120 130 140 Manheim Used Vehicle Index* U.S. BANCORP | 21 Net Charge -offs Ratio * Manheim Used Vehicle Value Index source: www.manheimconsulting.com, January 1995 = 100, quarter value = average monthly ending values |
 Credit
Quality – Other Retail
Average Loans and Net Charge-offs Ratios
Key Statistics Key Points • Overall growth continued to be driven by auto loans and installment, which were up 6.1% and 13.4%
year-over-year, respectively
• Delinquency rates, nonperforming loans, and net charge-offs remained stable
$27,286 $29,556 $29,550 $29,748 $30,608 0.65% 0.71% 0.69% 0.68% 0.68% 0.0% 0.5% 1.0% 1.5% 2.0% 0 10,000 20,000 30,000 40,000 3Q15 4Q15 1Q16 2Q16 3Q16 Average Loans $ in millions 3Q15 2Q16 3Q16 Average Loans $27,286 $29,748 $30,608 30-89 Delinquencies 0.46% 0.47% 0.56% 90+ Delinquencies 0.10% 0.10% 0.11% Nonperforming Loans 0.07% 0.09% 0.08% Auto Loans, $17,205 Installment, $7,783 Revolving Credit, $3,243 Student Loans, $2,377 Other Retail U.S. BANCORP | 22 Net Charge -offs Ratio |
 Credit
Quality – Auto Loans
Average Loans and Net Charge-offs Ratios
Key Statistics Key Points • Continued growth in auto loans driven by high-quality originations in the indirect channel (weighted average FICO 777)
• Net charge-offs stayed relatively flat on a linked quarter basis $ in millions 3Q15 2Q16 3Q16 Average Loans $16,220 $16,690 $17,205 30-89 Delinquencies 0.40% 0.48% 0.59% 90+ Delinquencies 0.02% 0.03% 0.05% Nonperforming Loans 0.05% 0.08% 0.08% Indirect and Direct Channel Direct: 6% Wtd Avg FICO: 748 NCO: 0.11% Indirect: 94% Wtd Avg FICO: 768 NCO: 0.34% Auto loans are included in Other Retail category U.S. BANCORP | 23 $16,220 $16,551 $16,623 $16,690 $17,205 0.22% 0.36% 0.41% 0.31% 0.32% 0.0% 0.5% 1.0% 1.5% 2.0% 0 5,000 10,000 15,000 20,000 3Q15 4Q15 1Q16 2Q16 3Q16 Average Loans Net Charge -offs Ratio |
 Non-GAAP Financial Measures
* Preliminary data. Subject to change prior to filings with applicable regulatory
agencies. (1) Includes goodwill related to certain investments in
unconsolidated financial institutions per prescribed regulatory requirements.
(2) Includes net losses on cash flow hedges included in accumulated other comprehensive
income (loss) and other adjustments. (3) Includes higher
risk-weighting for unfunded loan commitments, investment securities, residential mortgages, mortgage servicing rights and other adjustments. (4) Primarily reflects higher risk-weighting for mortgage servicing rights. (5) Utilizes a tax rate of 35 percent for those assets and liabilities whose income or expense is not included for federal income tax
purposes. September 30,
June 30, March 31, December 31, September 30, (Dollars in Millions, Unaudited) 2016 2016 2016 2015 2015 Total equity $48,399 $48,029 $47,393 $46,817 $45,767 Preferred stock (5,501) (5,501) (5,501) (5,501) (4,756) Noncontrolling interests (640) (639) (638) (686) (692) Goodwill (net of deferred tax liability) (1) (8,239) (8,246) (8,270) (8,295) (8,324) Intangible assets, other than mortgage servicing rights (756) (796) (820) (838) (779) Tangible common equity (a) 33,263 32,847 32,164 31,497 31,216 Tangible common equity (as calculated above) 33,263 32,847 32,164 31,497 31,216 Adjustments (2) 97 133 99 67 118 Common equity tier 1 capital estimated for the Basel III fully 33,360 implemented standardized and advanced approaches (b) 32,980 32,263 31,564 31,334 Total assets 454,134 438,463 428,638 421,853 415,943 Goodwill (net of deferred tax liability) (1) (8,239) (8,246) (8,270) (8,295) (8,324) Intangible assets, other than mortgage servicing rights (756) (796) (820) (838) (779) Tangible assets (c) 445,139 429,421 419,548 412,720 406,840 Risk-weighted assets, determined in accordance with prescribed transitional standardized approach regulatory requirements (d) 356,733 * 351,462 346,227 341,360 336,227 Adjustments (3) 3,165 * 3,079 3,485 3,892 3,532 Risk-weighted assets estimated for the Basel III fully implemented
standardized approach (e)
359,898 * 354,541 349,712 345,252 339,759 Risk-weighted assets, determined in accordance with prescribed transitional advanced approaches regulatory requirements 272,832 * 271,495 267,309 261,668 248,048 Adjustments (4) 3,372 * 3,283 3,707 4,099 3,723 Risk-weighted assets estimated for the Basel III fully implemented
advanced approaches (f)
276,204 * 274,778 271,016 265,767 251,771 Ratios* Tangible common equity to tangible assets (a)/(c) 7.5 %
7.6 % 7.7 % 7.6 % 7.7 % Tangible common equity to risk-weighted assets (a)/(d) 9.3 9.3 9.3 9.2 9.3 Common equity tier 1 capital to risk-weighted assets estimated for the
Basel III fully implemented standardized approach (b)/(e)
9.3 9.3 9.2 9.1 9.2 Common equity tier 1 capital to risk-weighted assets estimated for the Basel III fully implemented advanced approaches (b)/(f) 12.1 12.0 11.9 11.9 12.4 U.S. BANCORP | 24 September 30, June 30, September 30, September 30, September 30, 2016 2016 2015 2016 2015 Net interest income $2,893 $2,845 $2,768 $8,573 $8,182 Taxable-equivalent adjustment (5) 50 51 53 154 161 Net interest income, on a taxable-equivalent basis $2,943 $2,896 $2,821 $8,727 $8,343 Three Months Ended Nine Months Ended |
 U.S.
Bancorp 3Q16 Earnings
Conference Call October 19, 2016 |