Attached files
| file | filename |
|---|---|
| EX-99.1 - EXHIBIT 99.1 - POPULAR, INC. | a51439266_ex991.htm |
| 8-K - POPULAR, INC. 8-K - POPULAR, INC. | a51439266.htm |
Exhibit 99.2
2016 Annual Stress Test Disclosure Severely Adverse Scenario October 2016 POPULAR
Forward Looking Statements The information included in this presentation contains certain forward looking statements within the meaning of the Private Securities Litigation Reform Act of 1995. These forward-looking statements are based on management’s current expectations and are subject to risks and uncertainties. Please refer to our Annual Report on Form 10-K for the year ended December 31, 2015, the Quarterly Reports on Form 10-Q for the quarters ended March 31, 2016 and June 30, 2016, and our other filings with the SEC for a discussion of factors that may cause the Corporation’s actual results to differ materially from any future results expressed or implied by such forward-looking statements. Those filings are available on the Corporation’s website (www.popular.com) and on the Securities and Exchange Commission website (www.sec.gov). The Corporation undertakes no obligation to publicly update or revise any forward-looking statement to reflect events or circumstances after the date of such statements POPULAR
Index Page 3 8 13 2016 Supervisory Severely Adverse Scenario Results Risk Methodologies Macroeconomic Scenario POPULAR
Overview 3 Popular, Inc. (“Popular” or the “Corporation”) is the leading financial services provider in Puerto Rico (“P.R.”) and ranks among the 50 largest bank holding companies by assets in the United States (“U.S.”), with consolidated assets of $37.6 billion as of June 30, 2016. Popular operates 233 branches across its principal markets in Puerto Rico, the U.S. mainland and the Virgin Islands. In Puerto Rico, Popular provides retail, commercial, and mortgage banking services through its principal banking subsidiary Banco Popular de Puerto Rico (“BPPR”), as well as auto and equipment leasing and financing, investment banking, broker-dealer, and insurance services through specialized subsidiaries. BPPR represented approximately 77% of the Corporation’s total assets as of June 30, 2016. In the U.S. mainland, the Corporation operates Banco Popular North America (“BPNA”) under the trade name of Popular Community Bank (“PCB”). Currently, PCB operates in New York, New Jersey, and South Florida, providing a broad range of financial services and products for businesses and consumers including lending, cash management, consumer finance, mobile banking, and mobile check deposits. According to the Dodd-Frank Wall Street Reform and Consumer Protection Act (the “Dodd-Frank Act”), as a bank holding company and a state member bank with average total assets of between $10 billion and $50 billion, Popular and BPPR are required to submit an annual company-run stress test (“DFAST”) based on certain hypothetical economic scenarios (in addition to Puerto Rico specific economic scenarios developed internally). The DFAST is meant as a process to assess the potential impact of hypothetical macroeconomic and financial market scenarios on the consolidated earnings, losses, and capital of the organization over a defined planning horizon. The DFAST requires nine-quarter forecasted results under a base, adverse, and severely adverse economic scenarios, starting in the first quarter of 2016 and extending through the first quarter of 2018. These hypothetical scenarios are prescribed by the Board of Governors of the Federal Reserve System (“Federal Reserve”). Under the Federal Reserve’s regulations implementing the stress testing requirements of the Dodd-Frank Act, bank holding companies such as the Corporation must assume a standard set of capital actions over the forecast horizon to estimate the severely adverse scenario. In particular, the DoddFrank Act assumptions in the severely adverse scenario for the Corporation reflect actual capital actions for the first quarter of the forecast horizon (i.e., the first quarter of 2016), and incorporate over the remaining eight quarters of the forecast horizon the following capital actions: (1) dividends on outstanding preferred stock amounting to $3.7 million annually; (2) dividends on outstanding common stock amounting to $0.15 per share or $15.5 million quarterly; and (3) dividends from BPPR to the Corporation amounting to $19.7 million per quarter. Under the severely adverse scenario common stock dividends were continued for the first four quarters of the forecast horizon only, as BPPR and the Corporation’s results in the first year of the severely adverse scenario reflect a net loss. Federal Reserve regulation requires the disclosure of summary stress test results under the Federal Reserve’s Supervisory Severely Adverse Scenario. The disclosure in this presentation, including projections of our financial results and condition, are not intended to be our forecast of expected future economic or financial conditions or our forecast of the Corporation’s or BPPR’s expected future financial results or condition, but rather reflect possible results under the prescribed hypothetical, severely adverse scenario. Our future financial results and condition will be influenced by actual economic and financial conditions and various other factors as described in our reports filed with the Securities and Exchange Commission and available at www.sec.gov.

Capital and RWA Projections (Severely Adverse Scenario) Projected stressed capital ratios Common Equity Tier 1 Capital 16.21% 12.56% 12.56% 6.50% Tier 1 Risk-Based Capital 16.21% 12.78% 12.78% 8.00% Total Risk-Based Capital 18.78% 15.97% 15.97% 10.00% Tier 1 Leverage 11.82% 9.34% 9.34% 5.00% Common Equity Tier 1 Capital 16.98% 14.01% 14.01% 6.50% Tier 1 Risk-Based Capital 16.98% 14.01% 14.01% 8.00% Total Risk-Based Capital 18.27% 15.32% 15.32% 10.00% Tier 1 Leverage 12.21% 10.15% 10.15% 5.00% Popular BPPR Severely Adverse Capital Ratios Regulatory Well Capitalized Minimums Actual Q4 2015 *Q1 2018 represents the lowest level during the nine-quarter period Q1 2018 Lowest Level* Projected risk-weighted assets (in millions) Actual Q4 2015 Projected Q1 2018 Popular 24,982 22,494 BPPR 19,662 17,831 Projected risk weighted assets are impacted by lower loan origination within the Puerto Rico loan portfolio driven in part by a continued reduction in the forecasted economic activity in the hypothetical scenarios, chargeoffs in excess of $1 billion during the forecast horizon, and the expected continued run-off of previously acquired portfolios. POPULAR
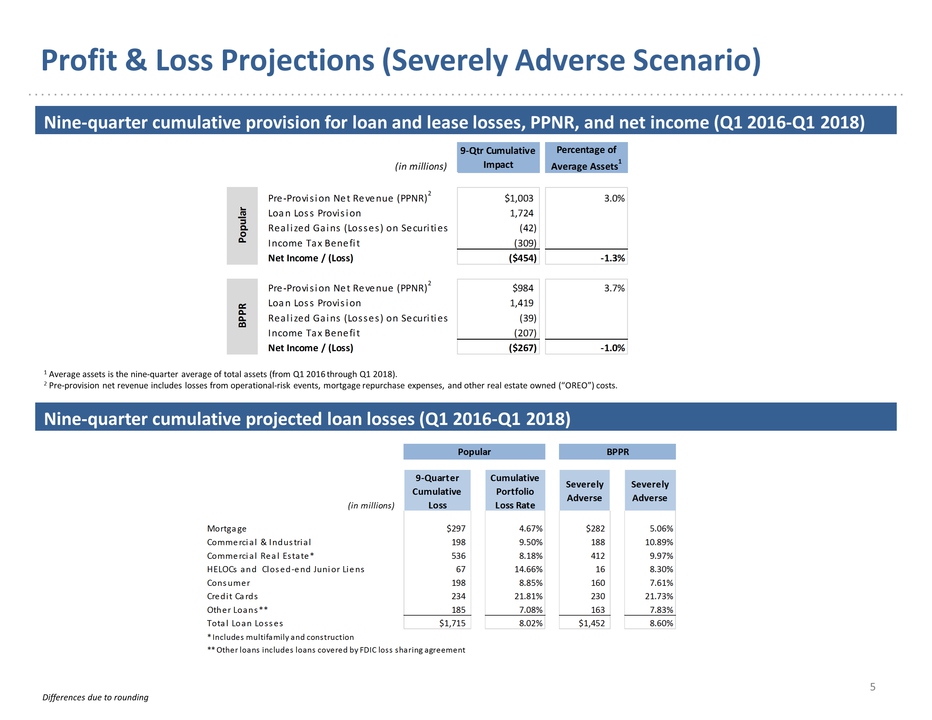
Profit & Loss Projections (Severely Adverse Scenario) 5 Nine-quarter cumulative provision for loan and lease losses, PPNR, and net income (Q1 2016-Q1 2018) 9-Qtr Cumulative Impact Percentage of Average Assets1 Pre-Provision Net Revenue (PPNR)2 $1,003 3.0% Loan Loss Provision 1,724 Realized Gains (Losses) on Securities (42) Income Tax Benefit (309) Net Income / (Loss) ($455) -1.3% Pre-Provision Net Revenue (PPNR)2 $984 3.7% Loan Loss Provision 1,419 Realized Gains (Losses) on Securities (39) Income Tax Benefit (207) Net Income / (Loss) ($267) -1.0% (in millions) Popular BPPR 1 Average assets is the nine-quarter average of total assets (from Q1 2016 through Q1 2018). 2 Pre-provision net revenue includes losses from operational-risk events, mortgage repurchase expenses, and other real estate owned (“OREO”) costs. Nine-quarter cumulative projected loan losses (Q1 2016-Q1 2018) (in millions) 9-Quarter Cumulative Loss Cumulative Portfolio Loss Rate Severely Adverse Severely Adverse Mortgage $297 4.67% $282 5.06% Commercial & Industrial 198 9.50% 188 10.89% Commercial Real Estate* 536 8.18% 412 9.97% HELOCs and Closed-end Junior Liens 67 14.66% 16 8.30% Consumer 198 8.85% 160 7.61% Credit Cards 234 21.81% 230 21.73% Other Loans** 185 7.08% 163 7.83% Total Loan Losses $1,715 8.02% $1,452 8.60% * Includes multifamily and construction ** Other loans includes loans covered by FDIC loss sharing agreement Popular BPPR Differences due to rounding
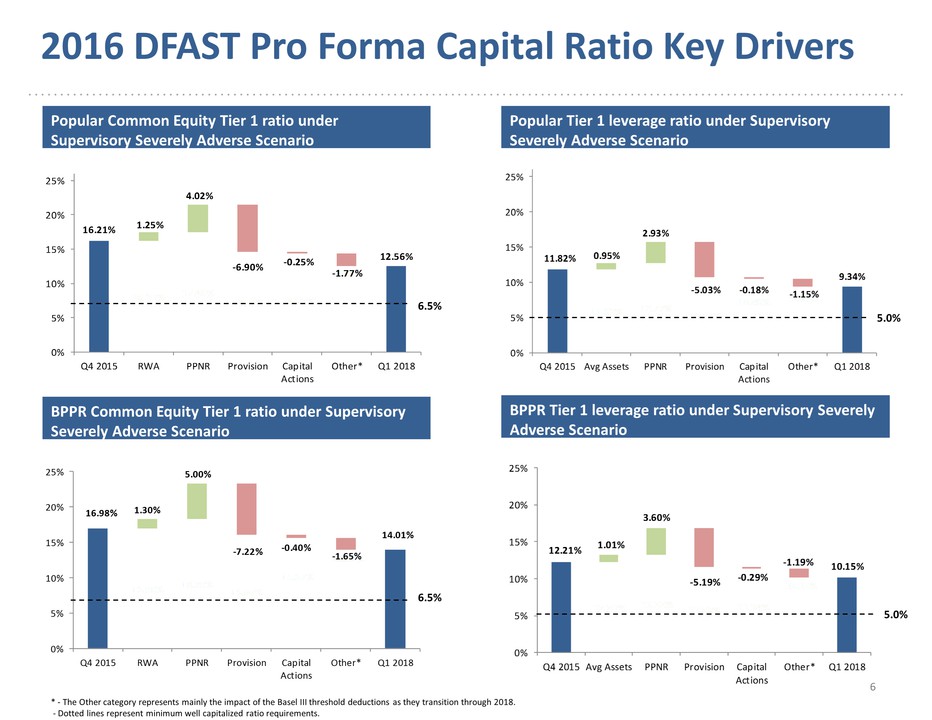
2016 DFAST Pro Forma Capital Ratio Key Drivers 6 Popular Common Equity Tier 1 ratio under Supervisory Severely Adverse Scenario Popular Tier 1 leverage ratio under Supervisory Severely Adverse Scenario BPPR Common Equity Tier 1 ratio under Supervisory Severely Adverse Scenario BPPR Tier 1 leverage ratio under Supervisory Severely Adverse Scenario 16.21% 16.21% 17.46% 14.57% 14.33% 12.56% 12.56% 1.25% 4.02% -6.90% -0.25% -1.77% 0 % 5 % 10% 15% 20% 25% Q4 2015 RWA PPNR Provision Capital Actions Other* Q1 2018 11.82% 11.82% 12.77% 10.67% 10.48% 9.34% 9.34% 0.95% 2.93% -5.03% -0.18% -1.15% 0 % 5 % 10% 15% 20% 25% Q4 2015 Avg Assets PPNR Provision Capital Actions Other* Q1 2018 6.5% 5.0% 16.98% 16.98% 18.29% 16.07% 15.67% 14.01% 14.01% 1.30% 5.00% -7.22% -0.40% -1.65% 0 % 5 % 10% 15% 20% 25% Q4 2015 RWA PPNR Provision Capital Actions Other* Q1 2018 6.5% 12.21% 12.21% 13.22% 11.63% 11.34% 10.15% 10.15% 1.01% 3.60% -5.19% -0.29% -1.19% 0 % 5 % 10% 15% 20% 25% Q4 2015 Avg Assets PPNR Provision Capital Actions Other* Q1 2018 5.0% * - The Other category represents mainly the impact of the Basel III threshold deductions as they transition through 2018. - Dotted lines represent minimum well capitalized ratio requirements.
Index 2015 Supervisory Severely Adverse Scenario Results 3 Page Risk Methodologies 8 Macroeconomic Scenario 13 POPULAR
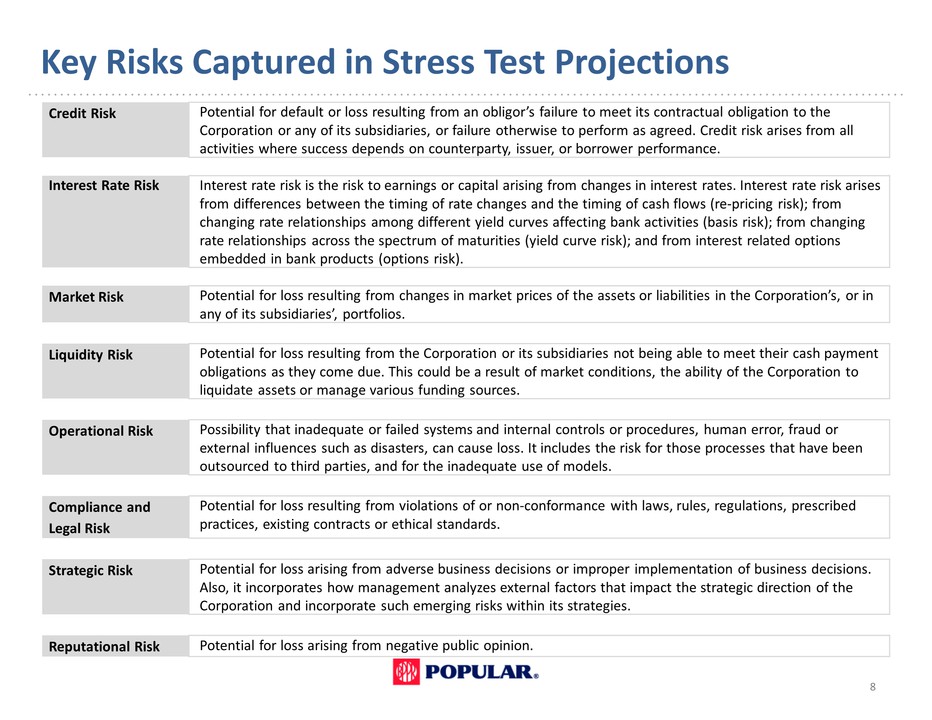
Key Risks Captured in Stress Test Projections 8 Credit Risk Potential for default or loss resulting from an obligor’s failure to meet its contractual obligation to the Corporation or any of its subsidiaries, or failure otherwise to perform as agreed. Credit risk arises from all activities where success depends on counterparty, issuer, or borrower performance. Interest Rate Risk Interest rate risk is the risk to earnings or capital arising from changes in interest rates. Interest rate risk arises from differences between the timing of rate changes and the timing of cash flows (re-pricing risk); from changing rate relationships among different yield curves affecting bank activities (basis risk); from changing rate relationships across the spectrum of maturities (yield curve risk); and from interest related options embedded in bank products (options risk). Market Risk Potential for loss resulting from changes in market prices of the assets or liabilities in the Corporation’s, or in any of its subsidiaries’, portfolios. Liquidity Risk Potential for loss resulting from the Corporation or its subsidiaries not being able to meet their cash payment obligations as they come due. This could be a result of market conditions, the ability of the Corporation to liquidate assets or manage various funding sources. Operational Risk Possibility that inadequate or failed systems and internal controls or procedures, human error, fraud or external influences such as disasters, can cause loss. It includes the risk for those processes that have been outsourced to third parties, and for the inadequate use of models. Compliance and Legal Risk Potential for loss resulting from violations of or non-conformance with laws, rules, regulations, prescribed practices, existing contracts or ethical standards. Strategic Risk Potential for loss arising from adverse business decisions or improper implementation of business decisions. Also, it incorporates how management analyzes external factors that impact the strategic direction of the Corporation and incorporate such emerging risks within its strategies. Reputational Risk Potential for loss arising from negative public opinion. POPULAR
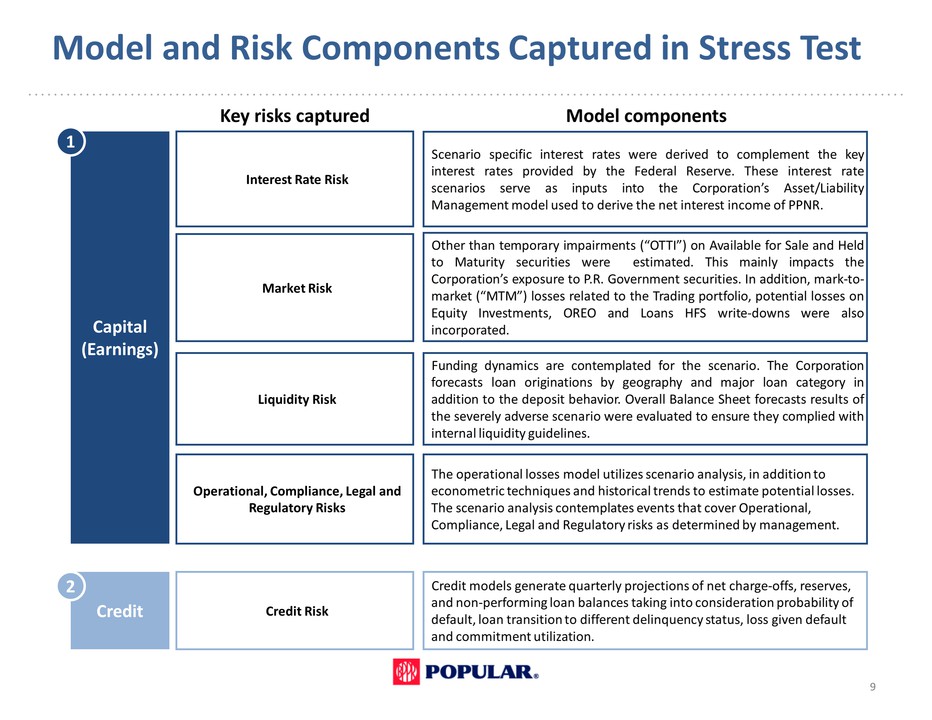
Model and Risk Components Captured in Stress Test 9 Interest Rate Risk Market Risk Liquidity Risk Operational, Compliance, Legal and Regulatory Risks Credit Risk Scenario specific interest rates were derived to complement the key interest rates provided by the Federal Reserve. These interest rate scenarios serve as inputs into the Corporation’s Asset/Liability Management model used to derive the net interest income of PPNR. Other than temporary impairments (“OTTI”) on Available for Sale and Held to Maturity securities were estimated. This mainly impacts the Corporation’s exposure to P.R. Government securities. In addition, mark-tomarket (“MTM”) losses related the Trading portfolio, potential losses on Equity Investments, OREO and Loans HFS write-downs were also incorporated. Funding dynamics are contemplated for the scenario. The Corporation forecasts loan originations by geography and major loan category in addition to the deposit behavior. Overall Balance Sheet forecasts results of the severely adverse scenario were evaluated to ensure they complied with internal liquidity guidelines. The operational losses model utilizes scenario analysis, in addition to econometric techniques and historical trends to estimate potential losses. The scenario analysis contemplates events that cover Operational, Compliance, Legal and Regulatory risks as determined by management. Credit models generate quarterly projections of net charge-offs, reserves, and non-performing loan balances taking into consideration probability of default, loan transition to different delinquency status, loss given default and commitment utilization. Key risks captured Model components Capital (Earnings) 1 Credit 2 Model and Risk Components Captured in Stress Test POPULAR
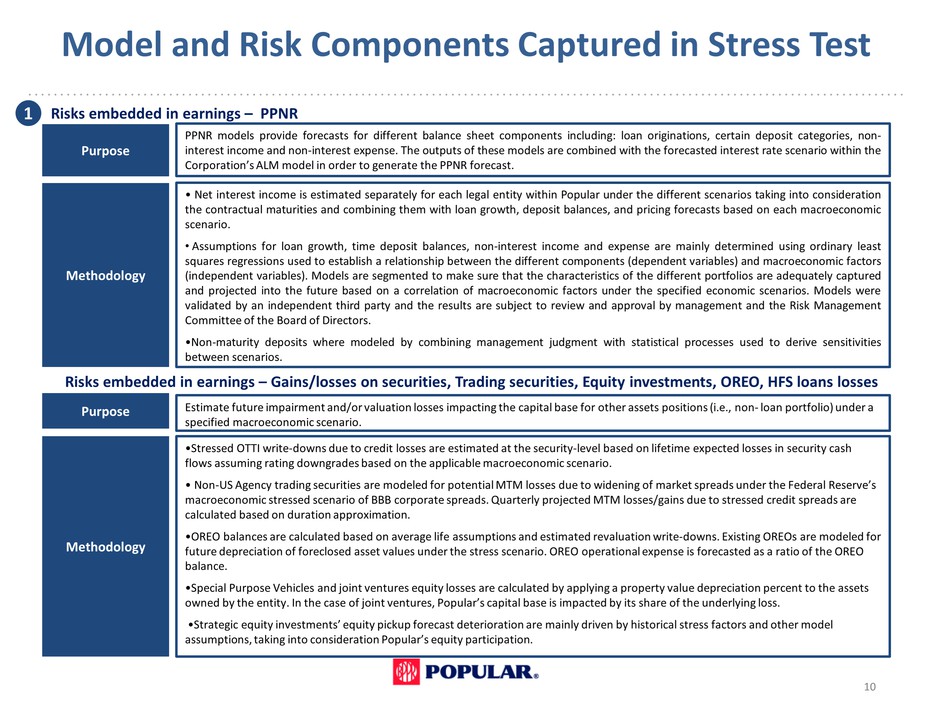
Model and Risk Components Captured in Stress Test 10 Risks embedded in earnings – Gains/losses on securities, Trading securities, Equity investments, OREO, HFS loans losses Purpose Estimate future impairment and/or valuation losses impacting the capital base for other assets positions (i.e., non- loan portfolio) under a specified macroeconomic scenario. Methodology •Stressed OTTI write-downs due to credit losses are estimated at the security-level based on lifetime expected losses in security cash flows assuming rating downgrades based on the applicable macroeconomic scenario. • Non-US Agency trading securities are modeled for potential MTM losses due to widening of market spreads under the Federal Reserve’s macroeconomic stressed scenario of BBB corporate spreads. Quarterly projected MTM losses/gains due to stressed credit spreads are calculated based on duration approximation. •OREO balances are calculated based on average life assumptions and estimated revaluation write-downs. Existing OREOs are modeled for future depreciation of foreclosed asset values under the stress scenario. OREO operational expense is forecasted as a ratio of the OREO balance. •Special Purpose Vehicles and joint ventures equity losses are calculated by applying a property value depreciation percent to the assets owned by the entity. In the case of joint ventures, Popular’s capital base is impacted by its share of the underlying loss. •Strategic equity investments’ equity pickup forecast deterioration are mainly driven by historical stress factors and other model assumptions, taking into consideration Popular’s equity participation. Purpose PPNR models provide forecasts for different balance sheet components including: loan originations, certain deposit categories, noninterest income and non-interest expense. The outputs of these models are combined with the forecasted interest rate scenario within the Corporation’s ALM model in order to generate the PPNR forecast. Methodology • Net interest income is estimated separately for each legal entity within Popular under the different scenarios taking into consideration the contractual maturities and combining them with loan growth, deposit balances, and pricing forecasts based on each macroeconomic scenario. • Assumptions for loan growth, time deposit balances, non-interest income and expense are mainly determined using ordinary least squares regressions used to establish a relationship between the different components (dependent variables) and macroeconomic factors (independent variables). Models are segmented to make sure that the characteristics of the different portfolio are adequately captured and projected into the future based on a correlation of macroeconomic factors under the specified economic scenarios. Models were validated by an independent third party and the results are subject to review and approval by management and the Risk Management Committee of the Board of Directors. •Non-maturity deposits where modeled by combining management judgment with statistical processes used to derive sensitivities between scenarios. 1 Risks embedded in earnings – PPNR POPULAR
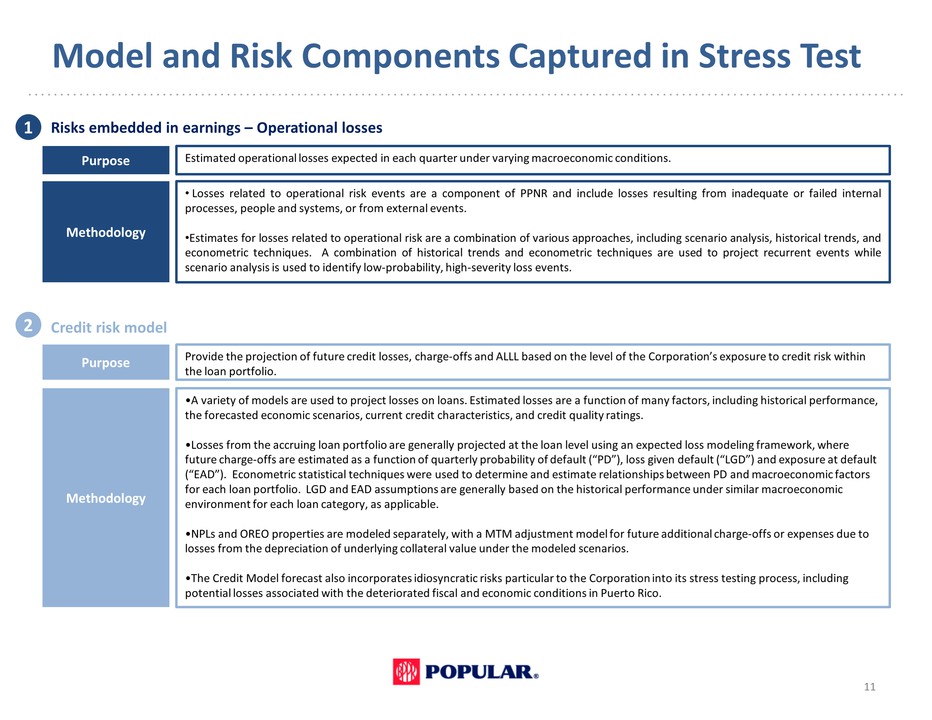
Model and Risk Components Captured in Stress Test 11 Risks embedded in earnings – Operational losses Purpose Estimated operational losses expected in each quarter under varying macroeconomic conditions. Methodology • Losses related to operational risk events are a component of PPNR and include losses resulting from inadequate or failed internal processes, people and systems, or from external events. •Estimates for losses related to operational risk are a combination of various approaches, including scenario analysis, historical trends, and econometric techniques. A combination of historical trends and econometric techniques are used to project recurrent events while scenario analysis is used to identify low-probability, high-severity loss events. Purpose Provide the projection of future credit losses, charge-offs and ALLL based on the level of the Corporation’s exposure to credit risk within the loan portfolio. Methodology •A variety of models are used to project losses on loans. Estimated losses are a function of many factors, including historical performance, the forecasted economic scenarios, current credit characteristics, and credit quality ratings. •Losses from the accruing loan portfolio are generally projected at the loan level using an expected loss modeling framework, where future charge-offs are estimated as a function of quarterly probability of default (“PD”), loss given default (“LGD”) and exposure at default (“EAD”). Econometric statistical techniques were used to determine and estimate relationships between PD and macroeconomic factors for each loan portfolio. LGD and EAD assumptions are generally based on the historical performance under similar macroeconomic environment for each loan category, as applicable. •NPLs and OREO properties are modeled separately, with a MTM adjustment model for future additional charge-offs or expenses due to losses from the depreciation of underlying collateral value under the modeled scenarios. •The Credit Model forecast also incorporates idiosyncratic risks particular to the Corporation into its stress testing process, including potential losses associated with the deteriorated fiscal and economic conditions in Puerto Rico. POPULAR
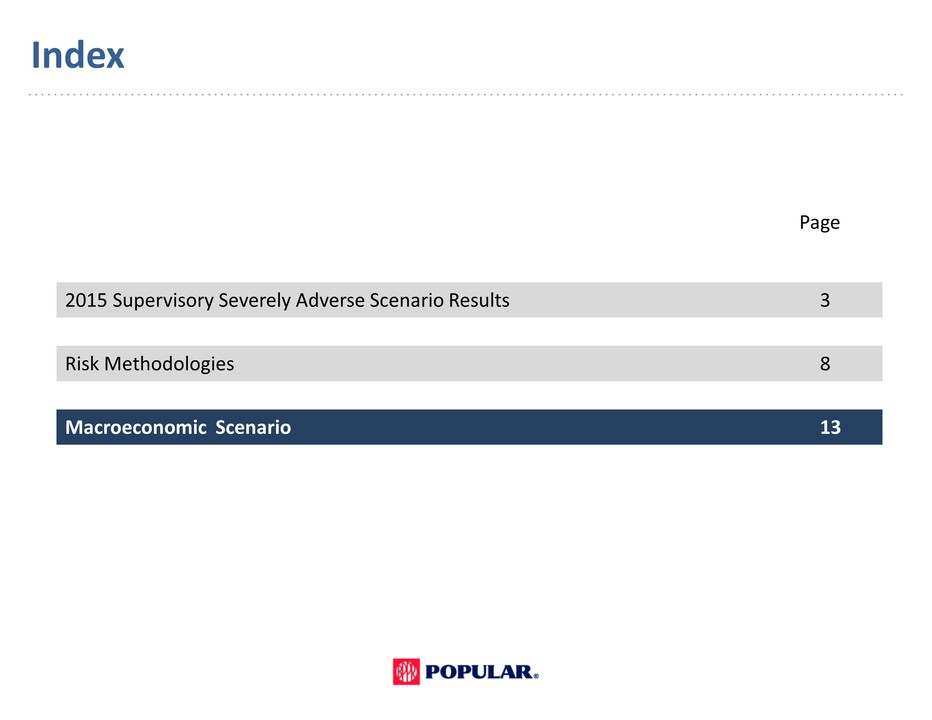
Index 2015 Supervisory Severely Adverse Scenario Results 3 Page Risk Methodologies 8 Macroeconomic Scenario 13 POPULAR
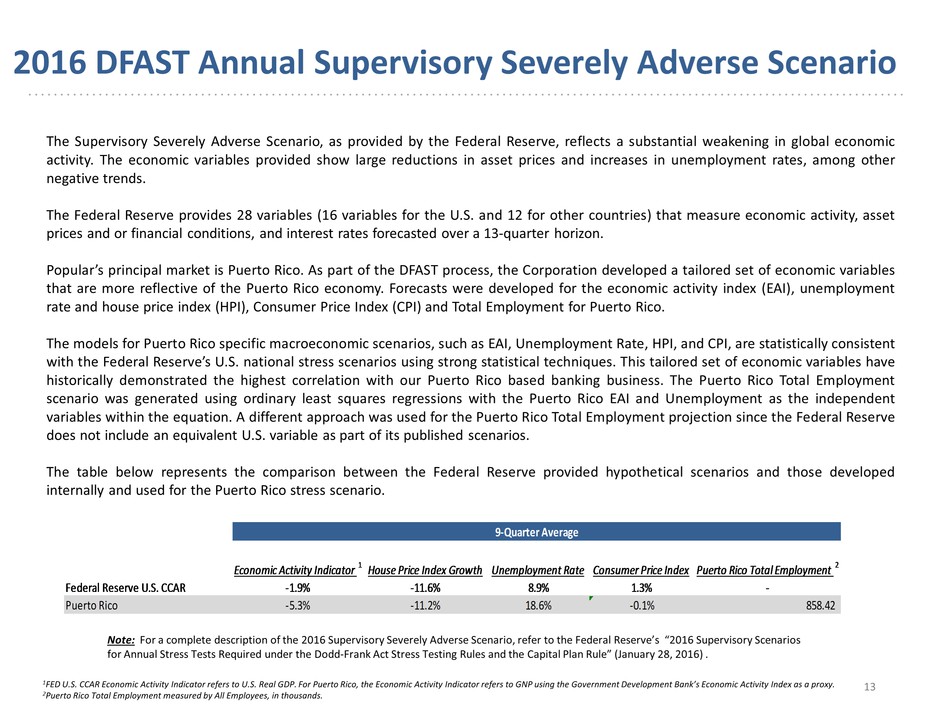
2016 DFAST Annual Supervisory Severely Adverse Scenario 13 The Supervisory Severely Adverse Scenario, as provided by the Federal Reserve, reflects a substantial weakening in global economic activity. The economic variables provided show large reductions in asset prices and increases in unemployment rates, among other negative trends. The Federal Reserve provides 28 variables (16 variables for the U.S. and 12 for other countries) that measure economic activity, asset prices and or financial conditions, and interest rates forecasted over a 13-quarter horizon. Popular’s principal market is Puerto Rico. As part of the DFAST process, the Corporation developed a tailored set of economic variables that are more reflective of the Puerto Rico economy. Forecasts were developed for the economic activity index (EAI), unemployment rate and house price index (HPI), Consumer Price Index (CPI) and Total Employment for Puerto Rico. The models for Puerto Rico specific macroeconomic scenarios, such as EAI, Unemployment Rate, HPI, and CPI, are statistically consistent with the Federal Reserve’s U.S. national stress scenarios using strong statistical techniques. This tailored set of economic variables have historically demonstrated the highest correlation with our Puerto Rico based banking business. The Puerto Rico Total Employment scenario was generated using ordinary least squares regressions with the Puerto Rico EAI and Unemployment as the independent variables within the equation. A different approach was used for the Puerto Rico Total Employment projection since the Federal Reserve does not include an equivalent U.S. variable as part of its published scenarios. The table below represents the comparison between the Federal Reserve provided hypothetical scenarios and those developed internally and used for the Puerto Rico stress scenario. Note: For a complete description of the 2016 Supervisory Severely Adverse Scenario, refer to the Federal Reserve’s “2016 Supervisory Scenarios for Annual Stress Tests Required under the Dodd-Frank Act Stress Testing Rules and the Capital Plan Rule” (January 28, 2016) . Economic Activity Indicator 1 House Price Index Growth Unemployment Rate Consumer Price Index Puerto Rico Total Employment 2 Federal Reserve U.S. CCAR -1.9% -11.6% 8.9% 1.3% - Puerto Rico -5.3% -11.2% 18.6% -0.1% 858.42 9-Quarter Average 1FED U.S. CCAR Economic Activity Indicator refers to U.S. Real GDP. For Puerto Rico, the Economic Activity Indicator refers to GNP using the Government Development Bank’s Economic Activity Index as a proxy. 2Puerto Rico Total Employment measured by All Employees, in thousands. 2016 Annual

2016 Annual Stress Test Disclosure Severely Adverse Scenario October 2016 POPULAR