Attached files
| file | filename |
|---|---|
| EX-99.1 - EXHIBIT 99.1 - Ameris Bancorp | v450594_ex99-1.htm |
| 8-K - FORM 8-K - Ameris Bancorp | v450594_8k.htm |
Exhibit 99.2

Ameris Bancorp 3 rd Quarter 2016 Financial Highlights

This presentation contains certain performance measures determined by methods other than in accordance with accounting principles generally accepted in the United States of America (“GAAP”) . Management of Ameris Bancorp (the “Company”) uses these non - GAAP measures in its analysis of the Company’s performance . These measures are useful when evaluating the underlying performance and efficiency of the Company’s operations and balance sheet . The Company’s management believes that these non - GAAP measures provide a greater understanding of ongoing operations, enhance comparability of results with prior periods and demonstrate the effects of significant gains and charges in the current period . The Company’s management believes that investors may use these non - GAAP financial measures to evaluate the Company’s financial performance without the impact of unusual items that may obscure trends in the Company’s underlying performance . These disclosures should not be viewed as a substitute for financial measures determined in accordance with GAAP, nor are they necessarily comparable to non - GAAP performance measures that may be presented by other companies . Tangible common equity and Tier 1 capital ratios are non - GAAP measures . The Company calculates the Tier 1 capital ratio using current call report instructions . The Company’s management uses these measures to assess the quality of capital and believes that investors may find them useful in their evaluation of the Company . These capital measures may, or may not be necessarily comparable to similar capital measures that may be presented by other companies . This presentation may contain statements that constitute “forward - looking statements” within the meaning of Section 27 A of the Securities Act of 1933 , as amended, and Section 21 E of the Securities Exchange Act of 1934 , as amended . The words “believe”, “estimate”, “expect”, “intend”, “anticipate” and similar expressions and variations thereof identify certain of such forward - looking statements, which speak only as of the dates which they were made . The Company undertakes no obligation to publicly update or revise any forward - looking statements, whether as a result of new information, future events or otherwise . Readers are cautioned that any such forward - looking statements are not guarantees of future performance and involve risks and uncertainties and that actual results may differ materially from those indicated in the forward - looking statements as a result of various factors . Readers are cautioned not to place undue reliance on these forward - looking statements and are referred to the Company’s periodic filings with the Securities and Exchange Commission for a summary of certain factors that may impact the Company’s results of operations and financial condition . Cautionary Statements
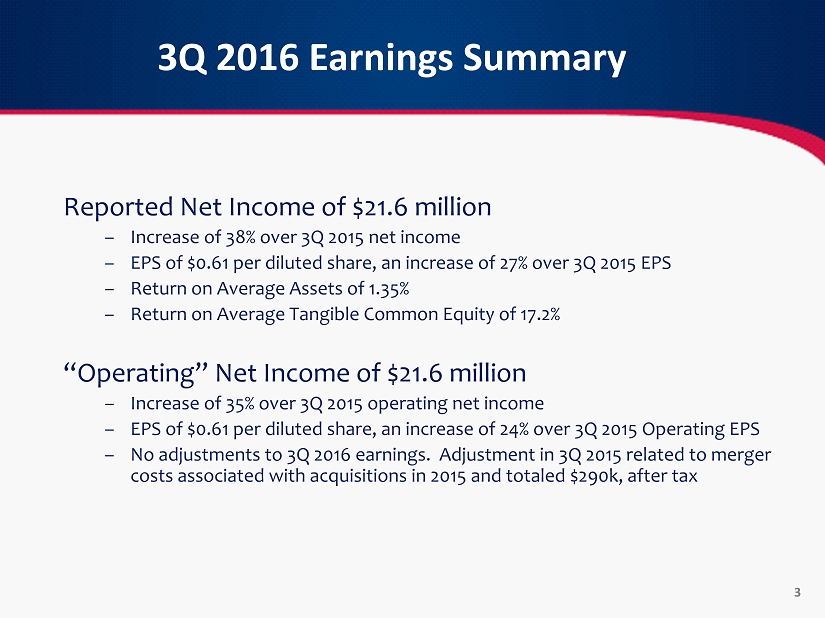
3Q 2016 Earnings Summary 3 Reported Net Income of $21.6 million – Increase of 38% over 3Q 2015 net income – EPS of $0.61 per diluted share, an increase of 27% over 3Q 2015 EPS – Return on Average Assets of 1.35% – Return on Average Tangible Common Equity of 17.2% “Operating” Net Income of $21.6 million – Increase of 35% over 3Q 2015 operating net income – EPS of $0.61 per diluted share, an increase of 24% over 3Q 2015 Operating EPS – No adjustments to 3Q 2016 earnings. Adjustment in 3Q 2015 related to merger costs associated with acquisitions in 2015 and totaled $290k, after tax

3Q 2016 Operating Highlights 4 • Organic Loan Growth of $223 million, or 23% annualized • Operating efficiency ratio of 60.08% compared to 63.9% in 3Q 2015 • Total Revenue of $86.9 million, growth of 18.9% compared to 3Q 2015 • Legacy NPAs declined to 0.41% of total assets • Non - acquired NCOs of only 0.05% of loans • Net income contribution from lines of business increased to $5.7 million or 22% of net income. Standalone efficiency ratio of 55.8% • Growth in TBV per share by 16.7% over last twelve months • Increased dividend to $0.10 per share

3Q 2016 Key Operating Ratios 5 3Q16 2Q16 1Q16 4Q15 3Q15 Operating ROAA 1.35% 1.31% 1.18% 1.12% 1.21% Operating ROTCE 17.18% 17.03% 15.42% 14.97% 16.23% Net Interest Margin 3.99% 4.05% 4.03% 3.98% 4.07% Net Interest Margin w/o Accretion 3.75% 3.74% 3.80% 3.74% 3.81% Efficiency Ratio 60.08% 60.42% 63.98% 69.71% 63.89% Net Overhead Ratio 1.46% 1.49% 1.72 % 2.01% 1.63% Tangible Equity / Tangible Assets 7.90% 7.96% 7.68% 7.44% 7.76% Tangible Book Value $14.38 $13.89 $13.13 $12.65 $12.31
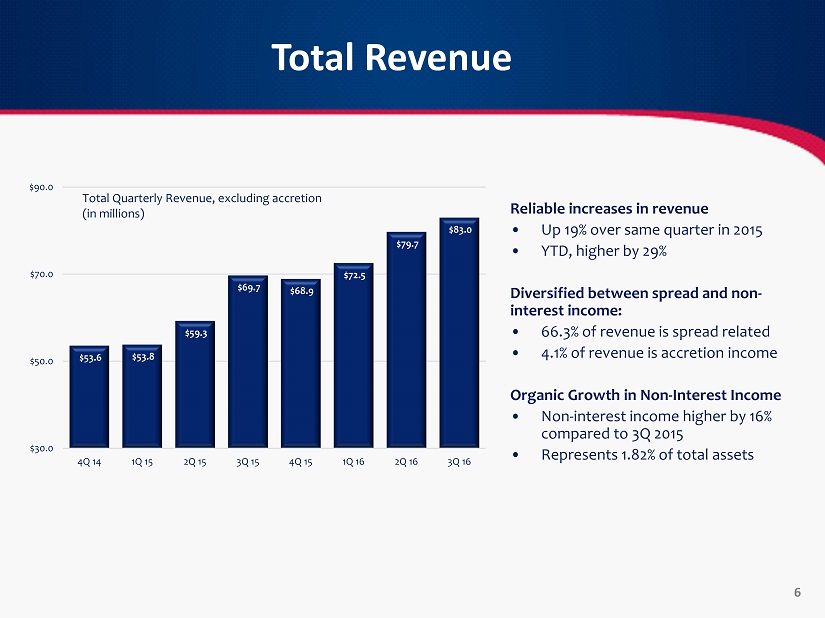
Total Revenue 6 Reliable increases in revenue • Up 19% over same quarter in 2015 • YTD, higher by 29% Diversified between spread and non - interest income: • 66.3% of revenue is spread related • 4.1% of revenue is accretion income Organic Growth in Non - Interest Income • Non - interest income higher by 16% compared to 3Q 2015 • Represents 1.82% of total assets $53.6 $53.8 $59.3 $69.7 $68.9 $72.5 $79.7 $83.0 $30.0 $50.0 $70.0 $90.0 4Q 14 1Q 15 2Q 15 3Q 15 4Q 15 1Q 16 2Q 16 3Q 16 Total Quarterly Revenue, excluding accretion (in millions)
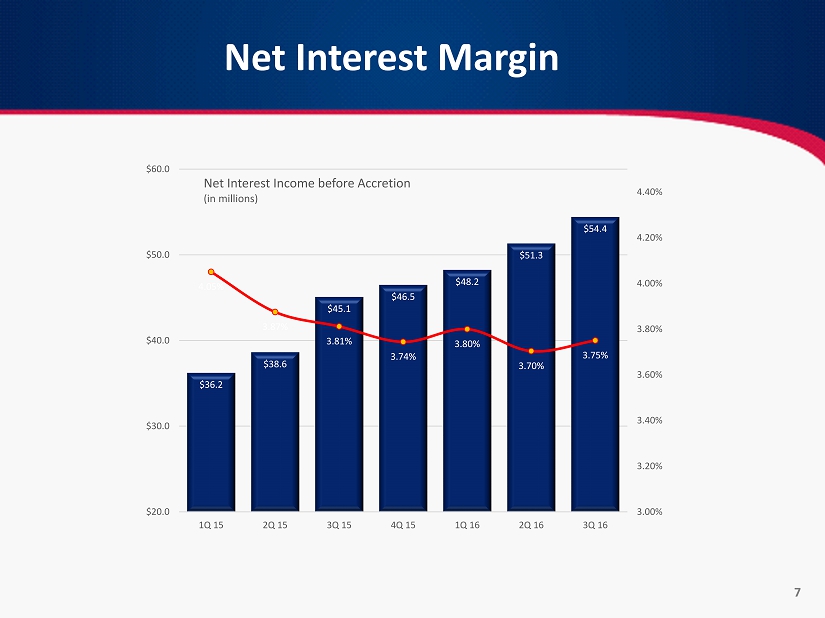
Net Interest Margin 7 $36.2 $38.6 $45.1 $46.5 $48.2 $51.3 $54.4 4.05% 3.87% 3.81% 3.74% 3.80% 3.70% 3.75% 3.00% 3.20% 3.40% 3.60% 3.80% 4.00% 4.20% 4.40% $20.0 $30.0 $40.0 $50.0 $60.0 1Q 15 2Q 15 3Q 15 4Q 15 1Q 16 2Q 16 3Q 16 Net Interest Income before Accretion (in millions)

Non - Interest Income 8 3Q 2016 3Q 2015 change Service Charges NSF Income 5,205 4,947 5.2% Debit Interchange 3,853 3,820 0.9% Service charges 2,024 1,663 21.7% Other 1,028 1,048 - 1.9% Total Deposit Related 12,110 11,478 5.5% Mortgage Revenues 13,197 9,694 36.1% SBA Revenues 1,162 1,308 - 11.2% BOLI 541 342 58.2% Other 1,539 2,156 - 28.6% Total Non - Int Income 28,549 24,978 14.3% As a % of total assets 1.76% 1.54% As a % of total revenue 32.31% 34.51%

3Q 2016 Expense Highlights Solving Our Efficiency Riddle: What is driving these results: • Leveraging our strong commercial lenders with larger portfolios • Restructure/re - engineering of administrative functions to support larger operations more efficiently • Operate lines of business for profit, not volume • Growth in non - CRE assets requires significantly less investment in overhead 9 YTD 2016 YTD 2015 Efficiency Ratio 61.39% 71.62% Net Overhead Ratio 1.55% 2.16% Relative to 2Q 2016: • Total Expenses grew during the quarter (when compared to linked quarter) by 6.4 % annualized • Higher S&B by $451k – mostly higher commissions and incentives • Higher Advertising and marketing by $ 344k – driven by Company’s annual sponsorship of the “Helping Fight Hunger” campaign and promotions in larger markets • Higher “Other” expenses by $855k driven by: – Increases in consulting and professional fees ($350k) on projects designed to re - engineer certain administrative divisions to support a $10 billion balance sheet. Should recur in 4Q 2016 but will not be a 2017 expense – Higher deposit oriented costs associated with a single fraud case ($220k )