Attached files
| file | filename |
|---|---|
| 8-K - 8-K - Matson, Inc. | a16-19492_18k.htm |
Exhibit 99.1
Pacific Northwest Analyst and Investor Tour – October 2016
Forward Looking Statements Statements made during this presentation that set forth expectations, predictions, projections or are about future events are based on facts and situations that are known to us as of October 6, 2016. We believe that our expectations and assumptions are reasonable. Actual results may differ materially, due to risks and uncertainties, such as those described on pages 8-15 of the 2015 Form 10-K filed on February 26, 2016, on pages 22-23 of the Form 10-Q filed on August 3, 2016, and other subsequent filings by Matson with the SEC. Statements made during this presentation are not guarantees of future performance. We do not undertake any obligation to update our forward-looking statements.

Introduction and Overview of Matson Growth Initiatives Hawaii Fleet Renewal Program Alaska Service Investments Acquisition and Organic Investment Framework Hawaii Fleet Renewal Program and Operations Span Alaska Overview and Facility Tour Financial Review Tacoma Terminal and Vessel Tour Event Agenda Matt Cox, President and CEO Ron Forest, SVP Operations Tom Souply, President, Span Alaska Joel Wine, SVP and CFO Ron Forest, SVP Operations
Introduction and Overview of Matson Growth Initiatives Matt Cox President and Chief Executive Officer

Matson Today: Connecting the Pacific OUR MISSION To move freight better than anyone OUR VISION To create shareholder value by: Being our customers’ first choice Leveraging our core strengths to drive growth and increase profitability Improving the communities in which we work and live Being an environmental leader in our industry Being a great place to work
Investment Highlights Leveraging the Matson brand and network into growth opportunities Well maintained fleet with leading on-time vessel arrivals and dedicated reserve vessels Fastest transit and cargo availability creates 5 to 10 day advantage and premium rates for China service Dedicated Hawaii Neighbor Island barge fleet and Micronesia feeder vessel Dedicated terminals with best in class truck turns Varied and ample equipment fleet across locations to meet customer needs World class operator and premium service provider Leading U.S. carrier in the Pacific providing lifeline to economies of Hawaii, Alaska and Guam Strong market positions in attractive niche markets with multi-decade customer relationships Dual head-haul economics on China service Unique network connecting the Pacific Financial strength to invest in fleet renewal and equipment, pursue strategic opportunities and return capital to shareholders Significant cash flow generation Investment grade credit metrics Strong balance sheet

Matson is the leading carrier into Oahu and Neighbor Islands, providing “just-in-time” supply lifeline 5 weekly USWC departures 11-ship fleet deployment offering most frequent and reliable service Only containership service from Pacific Northwest and only direct containership service from Oakland Competitor’s current vessel deployment No longer offers Pacific Northwest or Oakland direct service 3 weekly USWC containership departures 4 active steamships, 1 active diesel ConRo vessel, 1 active diesel RoRo vessel Hawaii Fleet Renewal Program
Hawaii Fleet Renewal Program Aloha Class Kanaloa Class November 2013, ordered two 3600 TEU dual fuel, LNG capable “Aloha Class” containerships from Philly Shipyard Delivery 3Q-18 and 1Q-19 August 2016, ordered two 3500 TEU platform, dual fuel, LNG capable “Kanaloa Class” ConRo’s from NASSCO Delivery 4Q-19 and 2Q-20 Expected fleet renewal benefits: Optimal Hawaii fleet size and vessel utilization Completes Hawaii fleet renewal and removes reliance on near-end-of-life steamships Improved fleet reliability Improved weekly capacity balance
Similarities with Hawaii Market Remote, non-contiguous economy dependent on reliable container service as part of vital supply lifeline A market that values premium service Loyal customer base; ~80% overlap with Matson’s Hawaii customers Long-term Stable Revenue Profile Northbound volume represents ~75% of total Southbound volume more seasonal, driven by seafood industry Kodiak and Dutch Harbor operations are strategic Critical lifeline to these communities Important terminal and slot charter services for Maersk, APL and NYK 2X Weekly 1X Weekly 2X Weekly Matson’s 3-Ship Deployment Competitor’s 2-Ship Deployment Alaska Service Investments
Alaska Service Investments Since closing the Horizon acquisition in May 2015, Matson has made several investments to improve services and capabilities New 65-ton gantry cranes for Kodiak terminal Installation of exhaust gas scrubbers Completed installation on two of the three diesel vessels (MV Kodiak and MV Tacoma) MV Anchorage installation in progress, estimate completion in December 2016 Purchased new ground equipment and a fleet of new dry and insulated containers
Matson’s Strategic Acquisition Framework Matson seeks to invest in niche businesses that: Have strong market positions Provide value-added services Demand high customer service differentiation Complement Matson’s core businesses and allow for geographic and/or key product offering expansion Generate strong cash flows and ROIC x x x x x x x x x x Acquisition of Alaska Service

Matson seeks to grow organically into markets that: Allow for geographic adjacencies or expansion Depend on value-added, fast, reliable, differentiated service Complement Matson’s existing service offerings Generate attractive ROIC Matson’s Organic Growth Framework SPX Service Launch – August 2016 Connects Matson’s US West Coast – Hawaii service to its South Pacific network Complements Matson’s fortnightly Polynesian islands service Same-day-of-the-week arrivals every 28 days is the fastest transit time from US West Coast Sole US carrier service reaching Fiji from North America Limited capital investment required Launch of South Pacific Express (SPX) service x x x x
Hawaii Fleet Renewal Program and Operations Ron Forest Senior Vice President Operations
Focus on Operational Excellence Our Mission: To Move Freight Better than Anyone Operations: Optimize network of assets to provide world-class service 1. Vessels 2. Terminals 3. Equipment Fleet Efficiency Terminal Productivity Varied and ample equipment fleet in required locations
Matson’s Hawaii Fleet –Today Of the 11 ships actively deployed today, three are steamships with an average age over 40 years Matson’s steamships are deployed in Hawaii turnaround service Matson’s reserve vessels are all near end-of-life steamships MATSON'S HAWAII FLEET - TODAY (11 SHIP DEPLOYMENT) Vessel Name Type Built Capacity (TEU) Capacity (Autos) Schedule NAVIGATOR Container - Steamship 1972 2,250 LA/HON MOKIHANA ConRo 1983 1,994 1,323 LA/HON KAUAI Container - Steamship 1980 1,644 44 OAK/HON MATSONIA ConRo - Steamship 1973 1,727 450 OAK/HON MANOA Container 1982 2,824 SEA/OAK/HON MAHIMAHI Container 1982 2,824 SEA/OAK/HON MANULANI Container 2005 2,378 LA/HON/GUAM/CHINA MANUKAI Container 2003 2,378 LA/HON/GUAM/CHINA MAUNAWILI Container 2004 2,378 LA/HON/GUAM/CHINA MAUNALEI Container 2006 1,992 LA/HON/GUAM/CHINA R.J. PFEIFFER Container 1992 2,245 LA/HON/GUAM/CHINA MAUI Container - Steamship 1978 1,644 Reserve PRODUCER Container - Steamship 1974 1,680 Reserve LIHUE Container - Steamship 1971 2,018 Reserve 26.7 AVERAGE VESSEL AGE (years) 14.0 37.3
Beginning January 1, 2020, Matson’s steamships will range in age from 40 to 49 years old and will not be able to comply with ECA emissions regulations, without substantial modification Matson’s fleet renewal plans need to replace steamships and provide for a diesel powered reserve fleet Two timelines considered for completing Hawaii fleet renewal: Build two Kanaloa Class ConRo’s for delivery in 2020 Build Kanaloa Class for delivery in 2025 and invest substantial capital pre-2020 to modify steamships to comply with ECA requirements Expected benefits to building Kanaloa Class for delivery by 2020: Avoid substantial capital spending on the modification of near-end-of-life steamships and additional dry-docking requirements Benefit from operating one fewer vessel for the five year period Benefit from the significantly lower operating costs of the Kanaloa Class vessels Generate incremental rolling stock earnings starting in 2020 Hawaii Fleet Renewal Considerations
Matson’s Hawaii Fleet Renewal Program Aloha Class Kanaloa Class November 2013, ordered two 3600 TEU dual fuel, LNG capable containerships from Philly Shipyard Average contract price $209 million per vessel Delivery 3Q-18 and 1Q-19 August 2016, ordered two 3500 TEU platform, dual fuel, LNG capable ConRo’s from NASSCO Average contract price $255.5 million per vessel Delivery 4Q-19 and 2Q-20
Aloha and Kanaloa Class – Purpose Built for Hawaii New vessel features to enhance Hawaii service Good speed / power characteristics for efficiency and timely arrivals Increased 45’ container capacity; Matson’s four new ships will have nearly double the 45’ capacity of the six ships they will be replacing Increased reefer stowage options both on deck and below deck Aloha Class will have cell guide spacing to permit over-wide flat rack stowage in two hatches Kanaloa Class will have 9,650 sq. meter garage structure and self-contained stern ramp providing for consistent weekly Ro/Ro capacity
Matson’s Hawaii Fleet – Pre and Post Renewal MATSON'S HAWAII FLEET Today 2019 (Post delivery of Aloha Class) 2020 (Post delivery of Kanaloa Class) # of Diesel Powered Vessels 8 8 5 # of Dual-fuel Capable Vessels 0 2 4 # of Steamships 3 0 0 # of Vessels Deployed 11 10 9 Total Capacity (TEU) Deployed 24,600 26,200 24,900 Average Age of Active Fleet (years) 27 20 13 Reserve Vessels 4 near end-of-life steamships 7 near end-of-life steamships 3 diesel powered vessels
Fleet Maintenance Focus on reliability, longevity and cost control Culture of safety In-service and preventative maintenance programs Knowledgeable engineering staff and crews Annual vessel down time has averaged less than 0.15% since 20101 Dry-docking requirements Hawaii Fleet Once in five years with Under Water Inspection in Lieu of Dry docking (UWILD) Alaska Fleet Twice in five years Mix of foreign and domestic shipyards used Highlights the importance of reserve vessels Average greater than 95% Average less than 5% 1 Vessel mechanical delay hours as a percent of total vessel operating hours YTD = Year to date as of September 23, 2016 Source: Management Estimates
Matson’s Terminals Honolulu Dutch Harbor Kodiak Anchorage Tacoma Seattle Guam Shanghai Ningbo Xiamen LA/Long Beach SSAT Matson State owned enterprise APMT Oakland
Strategic Benefits of Dedicated Terminals Guaranteed Berth/Cranes Work on arrival Quick turn of vessel Maintain vessel schedule Fast Truck Turns Customer satisfaction Considered best in class Wheeled Operations Immediate cargo availability Quick yard turns Own chassis Late Freight Receiving Customer satisfaction Expected in domestic trade YTD = Year to date as of September 23, 2016 Source: Management Estimates Industry Range
Matson provides customers with the equipment they need, when and where they need it Asset management considerations Amount of equipment Size / type equipment Own vs. lease Repair vs. replace Utilization / efficiency Location management considerations Port standards Balancing Repositioning Varied and Ample Equipment Fleet Source: Management Estimates Equipment Fleet Summary September 2016 Approx. % Owned Approx. % Leased Chassis 23,400 50% 50% Dry Containers 32,900 90% 10% Reefers 9,100 50% 50% Specialty 5,100 90% 10% Gen Sets 1,900 100% 0% Total 72,400 70% 30%
Industry Leading Fleet Performance On-time arrivals amongst best in world Based on 59-minute window vs. industry standard of 24 hours Weather = ~50% of misses Matson ranked #1 Ocean Carrier in 2014, 2015 and 2016 YTD = Year to date as of September 23, 2016 Source: Management Estimates
Span Alaska Overview and Facility Tour Tom Souply President, Span Alaska
Span Alaska Overview Market leader providing Less-than-Container Load (“LCL”) freight consolidation and forwarding services to the Alaska market Asset-light logistics business that aggregates LCL freight in Auburn, WA for consolidation and shipment to Alaska Moves freight through a network of terminals in Alaska, enabling the transport of freight to all major population centers Currently Matson’s largest northbound freight customer Has been a Horizon/Matson customer for over 30 years Excellent management team with longstanding strong reputation in the market Acquired Pacific Alaska Freightways, Inc. (“PAF”) in September 2015 which approximately doubled the size of the business Wasilla Anchorage (2) Kenai Kodiak Juneau Alaska Auburn Washington Fairbanks
Span Alaska’s Core Services LCL FREIGHT 80% of goods transported to the Auburn terminal by customer-owned vehicles Handles general cargo, keep-from-freezing, freeze & chill, and hazardous material handling for LCL shipments TRUCK SERVICES Complements core LCL services Drayage services to/from the Port of Tacoma Transportation services between Span Alaska’s deconsolidation facilities and customers’ final destinations in Alaska OTHER LOGISTICS SERVICES Brokered freight consolidation in the Lower 48 states through agent terminal in Chicago Source: Management estimates (1) Includes consolidations, Alaska delivery for LCL, FCL, freeze & chill, and barge; excludes air freight Less-than-Container Load (“LCL”) freight accounts for ~50% of the Alaska Northbound ocean freight market Diversified end market: Wholesale Distribution, Retail & Household Goods, Construction & Building Materials, Food & Beverage, Government, Oil, Vehicles
Span Alaska’s Operations State-of-the-art Auburn Facility has more direct loading capability than any other competitor Largest Alaska-based sales team in the industry Extensive network of non-union terminals spanning the PNW handling nearly 12,000 containers and 237 million pounds in 2015 Seven terminals with a total of 100,150 sq. feet, averaging ~75% maximum capacity utilization Full time employees ~213
Span Alaska Acquisition Cash purchase price of $197.6 million; no assumed debt Present value of tax benefit related to step-up in tax basis of assets estimated at approximately $35 million Purchase Price Transaction Multiples at Announcement ~9.4x estimated annual run-rate EBITDA as of July 18, 2016 of approximately $21 million ~7.7x estimated annual run-rate EBITDA net of estimated tax benefit EPS Accretion Immediate EPS accretion (excl. one-time items): Expect approximately $0.10 to $0.12 annual EPS accretion August 4, 2016 – Matson Logistics purchased 100% of Span Alaska Significantly expands Matson Logistics’ asset light platform and enhances service offering Solidifies Matson’s position as a critical freight transportation provider in the Alaska market
Span Alaska Acquisition – Financial Highlights Diversified customer base with no customer over 3% of annual revenue Top 25 customers account for less than 30% of annual revenue Long-standing relationships with limited customer turnover General cargo freight mix with less direct energy exposure Stable and Growing Revenue Base Efficient Operations With Strong Margins Excellent facility utilization across Auburn consolidation facility and Alaska deconsolidation facilities All facilities are leased, providing long-term flexibility for growth Attractive Free Cash Flow and Earnings Accretion Strong free cash flow generation with limited on-going capex needs As of July 18, 2016, estimated annual run-rate EBITDA of approximately $21 million Expect capex of approximately $1 million per year Expect business to trend somewhat lower over the next year or two based on the challenging macroeconomic and freight dynamics in Alaska Expect annual EPS accretion (excl. one-time items) of approximately $0.10 to $0.12 Stable Revenue Base Efficient Operations With Strong Margins
Financial Review Joel Wine Senior Vice President and Chief Financial Officer
Matson’s Financial Performance See Addendum for a reconciliation of GAAP to non-GAAP for Financial Metrics LTM = Last twelve months ended June 30, 2016 CAGR (2012-2015) Operating Income 26.6% Net Income 30.9% CAGR (2012-2015) Cash flow from operations 37.3% EBITDA 16.3%
Pro Forma Capitalization – Span Alaska Acquisition See the Addendum for a reconciliation of GAAP to non-GAAP for Financial Metrics Pro Forma Debt / EBITDA (Before Horizon acquisition SG&A and Molasses Settlement) below long-term targeted level of “low 2x’s” Approximately $345 million of unused capacity under $400 million revolving credit facility Pro Forma Capitalization as of 6/30/16 ($ in millions) MATX SPAN Transaction (3) September 14, 2016 Private Placement Financing (2) Pro Forma Revolving Credit Facility $44.0 $202.6 ($200.0) $46.6 Term Loans $359.3 $200.0 $559.3 Title XI Bonds $57.2 $57.2 Capital Leases $2.3 $1.3 $3.6 Total Debt $462.8 $666.7 Less: Cash and Cash Equivalents $19.2 $0.0 $0.0 $19.2 Net Debt $443.6 $647.5 LTM EBITDA (Before Horizon Acquisition SG&A and Molasses Settlement) (1) $355.3 $21.0 $376.3 Net Debt / EBITDA (Before Horizon Acquisition SG&A and Molasses Settlement) (1) 1.2x 1.7x Debt / EBITDA (Before Horizon Acquisition SG&A and Molasses Settlement) (1) 1.3x 1.8x (1) Based on Matson's LTM EBITDA (before Horizon acquisition related SG&A and Molasses Settlement) as of June 30, 2016 and current estimated annual run-rate EBITDA for SPAN (2) Excludes private placement transaction fees. Transaction closed and was funded on September 14, 2016 (3) Purchase price of $197.6 million plus estimated one-time pre-tax transaction closing and integration costs of approximately $5.0 million
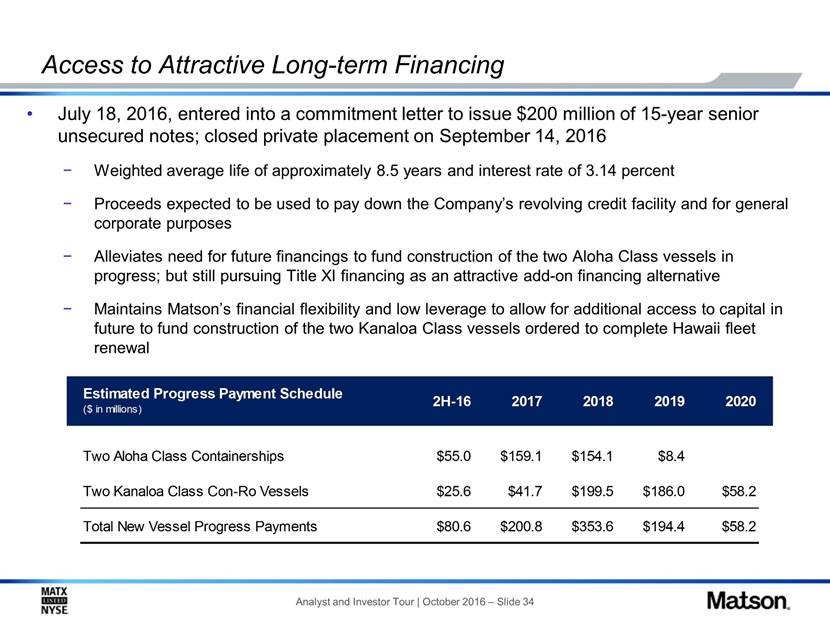
Access to Attractive Long-term Financing July 18, 2016, entered into a commitment letter to issue $200 million of 15-year senior unsecured notes; closed private placement on September 14, 2016 Weighted average life of approximately 8.5 years and interest rate of 3.14 percent Proceeds expected to be used to pay down the Company’s revolving credit facility and for general corporate purposes Alleviates need for future financings to fund construction of the two Aloha Class vessels in progress; but still pursuing Title XI financing as an attractive add-on financing alternative Maintains Matson’s financial flexibility and low leverage to allow for additional access to capital in future to fund construction of the two Kanaloa Class vessels ordered to complete Hawaii fleet renewal Estimated Progress Payment Schedule ($ in millions) 2H-16 2017 2018 2019 2020 Two Aloha Class Containerships $55.0 $159.1 $154.1 $8.4 Two Kanaloa Class Con-Ro Vessels $25.6 $41.7 $199.5 $186.0 $58.2 Total New Vessel Progress Payments $80.6 $200.8 $353.6 $194.4 $58.2
Recent Transpacific Market Developments Hanjin filed for bankruptcy on August 30th; created significant global market dislocation Hanjin operated 98 ships globally, many ships still not discharged Shanghai to LA/Long Beach capacity out of service Customer concerns regarding financial issues at other carriers Other international carriers responded with extra loaders through October 1 to replace dislocated capacity Maersk, MSC, and Hyundai announced new services to replace the capacity removed by Hanjin in the Transpacific trade lane Matson’s expedited China service differential returns to 5-10 day advantage Hanjin’s discontinued CAX service was the second fastest from Shanghai International containership market remains challenged by chronic overcapacity
Hawaii Volume – Trend Toward Larger Containers In Hawaii, Matson’s container mix has trended toward more 45’ containers 45’ containers increased from ~11% of total volume in 2005 to ~23% in 2015 24’ container decreased from ~12% of total volume in 2005 to ~2% in 2015 Matson’s Hawaii Container Mix by Size
Hawaii Volume – Trend Toward Larger Containers Matson’s Hawaii Container Volume # of Containers vs Forty-foot Equivalent Units (FEU) See the Addendum for historical container volume and FEU volume by service YTD 2016 as of June 30, 2016
Addendum
Addendum – Non-GAAP Measures Return on Invested Captial ($ in millions) 2012 (2) 2013 2014 2015 LTM Net Income $45.9 $53.7 $70.8 $103.0 $104.2 Add: Loss From Discontinued Operations $6.1 Add: Interest Expense (tax effected) (1) $7.2 $9.0 $10.0 $10.7 $13.1 Total Return $59.2 $62.7 $80.8 $113.7 $117.3 Average Total Debt $319.1 $302.6 $329.9 $401.8 $489.7 Average Shareholders' Equity $279.9 $309.1 $351.0 $407.1 $410.7 Total Invested Capital $599.0 $611.7 $680.9 $808.9 $900.4 ROIC 9.9% 10.3% 11.9% 14.1% 13.0% (1) The effective tax rate is 38.8% for 2012, 37.5% for 2013, 42.3% for 2014, 42.1% for 2015 and 37.8% for LTM (2) The 2012 calculation is based on total invested capital as of December 31, 2012 due to the timing of the Separation LTM = Last twelve months as of June 30, 2016 EBITDA ($ in millions) 2012 2013 2014 2015 LTM Net Income $45.9 $53.7 $70.8 $103.0 $104.2 Add: Loss From Discontinued Operations $6.1 Add: Income tax expense $33.0 $32.2 $51.9 $74.8 $63.2 Add: Interest expense $11.7 $14.4 $17.3 $18.5 $21.0 Add: Depreciation & amortization $95.4 $91.0 $90.1 $105.8 $124.0 EBITDA $192.1 $191.3 $230.1 $302.1 $312.4
Addendum – Non-GAAP Measures Last Twelve Months Ended 6/30/16 Net Income $104.2 Add: Income tax expense 63.2 Add: Interest expense 21.0 Add: Depreciation and amortization 94.8 Add: Dry-dock amortization 29.2 EBITDA $312.4 Add: Horizon Acquisition related SG&A in excess of run-rate target 29.6 Add: Molasses Settlement 13.3 $355.3 EBITDA (before Horizon Acquisition SG&A and Molasses Settlement) RECONCILIATION (In millions) EBITDA (before Horizon Acquisition SG&A and Molasses Settlement)
Addendum – Matson’s Historical Container Volume Year Container Volume FEU Volume Container Volume FEU Volume Container Volume FEU Volume Container Volume FEU Volume Container Volume FEU Volume 2005 175,800 175,900 16,600 16,000 2006 173,200 174,600 15,100 14,500 32,700 34,300 2007 167,500 169,800 14,600 14,600 51,200 54,100 2008 152,700 156,000 13,900 13,800 47,800 50,400 2009 136,100 139,500 14,100 13,900 46,600 49,100 2010 136,700 140,500 15,200 15,500 60,000 63,300 2011 140,000 145,000 15,200 15,500 59,000 62,100 2012 137,200 143,200 25,500 26,400 60,000 63,400 2013 138,500 145,500 24,100 25,400 61,300 64,400 12,800 11,201 2014 138,300 146,500 24,600 26,000 62,000 65,200 14,800 11,614 2015 149,500 159,200 24,200 25,400 59,200 62,700 14,000 13,056 39,100 40,300 YTD 2016* 73,600 78,200 11,400 12,000 25,700 27,100 6,600 6,637 31,600 34,300 *YTD as of June 30, 2016 FEU = Forty-foot equivalent unit Hawaii Guam China Micronesia & South Pacific Alaska
Addendum – Q&A relating to the Kanaloa Class vessel construction filed via 8-K on August 25, 2016 MATSON SIGNS CONTRACT WITH NASSCO TO BUILD TWO NEW CON-RO SHIPS FOR HAWAII SERVICE The following questions and answers provide supplementary information related to Matson’s news release issued on August 25, 2016: 1. Why is Matson ordering the Kanaloa Class vessels? What are the operational benefits? Matson is investing in new vessels to continue the Company’s long-standing commitment to serve Hawaii with the largest, most reliable, efficient and environmentally friendly fleet. The Company expects significant operational benefits upon the delivery of its two new Aloha Class containerships and its two new Kanaloa Class Con-Ro vessels, including: Optimal Hawaii fleet size and vessel utilization: The larger vessel capacities of the Aloha Class and the Kanaloa Class are expected to allow the Company to return to an optimal nine-ship deployment in its Hawaii service, which represents two fewer vessels than the 11 ships currently deployed. Improves fleet reliability: Upon delivery of the Aloha Class and the Kanaloa Class, the renewal of Matson’s Hawaii fleet will be complete and the Company expects to benefit from improved vessel reliability as the average age of the Hawaii fleet will have declined from 27 years old today to only 13 years old in 2020. Modernizes capacity capabilities: The new Aloha Class and Kanaloa Class vessels have been designed to reflect the modern cargo requirements of Hawaii with additional 45-foot capacity and additional reefer outlets which are expected to allow Matson to better transport perishable goods to the islands. These vessels have also been designed to carry construction materials more effectively and with a wider beam to provide enhanced stability and loadability while reducing ballast water requirements. Improves weekly capacity balance: The Company expects to benefit from a more balanced weekly deployment with consistent roll-on, roll-off capacity which is expected to generate incremental rolling stock earnings. Removes reliance on near-end-of-life steamships: Upon delivery of the Kanaloa Class vessels, the Company expects to have three diesel-powered containerships as reserve vessels and, therefore, will no longer be reliant upon near-end-of-life steamships that will no longer comply with environmental regulations in 2020 without substantial modifications.

2. How did Matson select the shipyard for the Kanaloa Class vessels construction contract? The Company was in discussions with a number of shipyards regarding the construction of these new Con-Ro vessels. Matson selected NASSCO as the successful shipyard based on an assessment of their proposal as the most competitive after taking into account several factors including contract price, vessel delivery dates, compliance with bid specifications, and other factors. 3. Why are the Kanaloa Class vessels more expensive than the Aloha Class vessels Matson ordered in November 2013? The two Kanaloa Class Con-Ro vessels have an average contract price of $255.5 million per vessel compared to the two Aloha Class containerships ordered in November 2013 which had an average contact price of $209.0 million per vessel. The higher contract price for the Kanaloa Class vessels is primarily driven by the inclusion of a 9,650 sq. meter roll-on/roll-off garage structure and self-contained stern ramp with capacity to load up to 800 automobiles and other wheeled cargo. In addition, since November 2013 there are more stringent and costly environmental regulations that impact hull form and engine specification requirements, and lastly, there has been modest inflation in U.S. shipyard construction costs. 4. What are the expected financial returns to Matson from this investment in the Kanaloa Class vessels? When complete, these new Kanaloa Class Con-Ro vessels are expected to have among the lowest operating cost per TEU of any ship in the U.S. domestic trades. The cost efficiencies are expected to be driven by our ability to return to an optimal nine-ship Hawaii fleet deployment and by significantly lower operating costs in areas such as fuel consumption, maintenance and repair, and dry-docking costs. In considering the completion of its Hawaii fleet renewal, the Company evaluated its investment in the Kanaloa Class on two alternative timelines: (i) building for delivery in 2020 or (ii) building five years later for delivery in 2025. By investing in building the Kanaloa Class vessels for delivery by 2020, the Company expects to (i) avoid substantial capital spending on the modification of near-end-of-life steamships and additional dry-docking requirements; (ii) benefit from operating one fewer vessel for the five year period; (iii) benefit from the significantly lower operating costs of the Kanaloa Class vessels; and (iv) generate incremental rolling stock earnings starting in 2020. The Company believes the 2020 delivery alternative to be financially superior as it is expected to result in: (i) a net present value benefit of approximately $50 million compared to building five years later; and (ii) modest increases to total annual return on invested capital and accretion to earnings per share in the first full year and the subsequent years following delivery of the Kanaloa Class vessels. Addendum – Q&A relating to the Kanaloa Class vessel construction filed via 8-K on August 25, 2016

5. Are the Kanaloa Class vessels being purchased for replacement purposes or expansion into new markets? The two new Kanaloa Class Con-Ro vessels will have a loaded container capacity of 2,750 TEUs plus the capacity to load up to 800 automobiles and other wheeled cargo. The Kanaloa Class vessels are expected to replace three diesel-powered ships that are currently deployed in Matson’s Hawaii service. Upon replacement, the Company expects those three diesel-powered ships would move to reserve status, allowing Matson to retire its seven steamship vessels that will no longer comply with environmental regulations in 2020 without substantial modifications. 6. How will the construction of the new Aloha Class containerships and the new Kanaloa Class Con-Ro vessels affect Matson’s fleet deployment in the Hawaii trade? Table 1. Today, Matson has 11-ships actively deployed in its Hawaii service including three steamships over 40 years old. In reserve, Matson currently has an additional four steamships over 40 years old. In 2019, Matson’s fleet deployment is expected to shrink to 10-ships with the delivery of two new Aloha Class containerships that will replace the three active steamships currently deployed. However, in 2019, Matson would still be relying on near-end-of-life steamships as its reserve fleet which would require substantial modifications to maintain these ships after 2020. Upon delivery of these Kanaloa Class vessels in 2020, Matson expects its Hawaii fleet deployment to return to an optimal nine-ship deployment when the two new Kanaloa Class Con-Ro vessels deliver and replace three diesel-powered ships in active duty. Those three diesel-powered ships would then move to reserve status, allowing Matson to retire its seven steamship vessels that will no longer comply with environmental regulations in 2020 without substantial modifications. Addendum – Q&A relating to the Kanaloa Class vessel construction filed via 8-K on August 25, 2016 MATSON'S HAWAII FLEET Today 2019 (Post delivery of Aloha Class) 2020 (Post delivery of Kanaloa Class) # of Diesel Powered Vessels 8 8 5 # of Dual-fuel Capable Vessels 0 2 4 # of Steamships 3 0 0 # of Vessels Deployed 11 10 9 Total Capacity (TEU) Deployed 24,600 26,200 24,900 Average Age of Active Fleet (years) 27 20 13 Reserve Vessels 4 near end-of-life steamships 7 near end-of-life steamships 3 diesel powered vessels

7. What will the average age of Matson’s Hawaii fleet be following the delivery of the Kanaloa class vessels? As shown in Table 1, the average age of Matson’s deployed fleet in Hawaii is expected to decrease from 27 years old today to 13 years old in 2020 after the delivery of the second Kanaloa Class vessel. 8. What will be the Company’s future expected vessel replacement needs after these ships are delivered? Upon delivery of the Aloha Class vessels and the Kanaloa Class vessels, the renewal of Matson’s Hawaii fleet will be complete and the Company does not expect to need to order additional new vessels for the Hawaii tradelane until sometime after 2030. The Company expects its next vessel replacement requirements to be for the Alaska service sometime after 2025 when the three diesel powered containerships in active service will be approaching 40 years old. 9. What are Matson’s total new vessel construction progress payments through the delivery of the Kanaloa Class vessels? The expected annual construction progress payments for both the Aloha Class vessels and the Kanaloa Class vessels are shown below in Table 2. Table 2. Addendum – Q&A relating to the Kanaloa Class vessel construction filed via 8-K on August 25, 2016 Estimated Progress Payment Schedule ($ in millions) 2H-16 2017 2018 2019 2020 Two Aloha Class Containerships $55.0 $159.1 $154.1 $8.4 Two Kanaloa Class Con-Ro Vessels $25.6 $41.7 $199.5 $186.0 $58.2 Total New Vessel Progress Payments $80.6 $200.8 $353.6 $194.4 $58.2

10. How does Matson expect to finance the Kanaloa Class vessels? Does the company expect to use the Capital Construction Fund Program for the Kanaloa Vessels? Matson expects to finance the Kanaloa Class vessels primarily through cash flows from operations, borrowing available under the Company’s unsecured revolving credit facility and additional debt financings, which could include U.S. Government guaranteed vessel finance bonds (Title XI). In addition, Matson intends to utilize the Capital Construction Fund (“CCF”) program as part of its funding strategy for the Kanaloa Class, which will allow the Company to benefit from lower cash tax payments in the years in which we make deposits to the CCF. (see Note 7 of the consolidated financial statements in the Company’s 2015 Form 10-K filed on February 26, 2016 for additional information about the CCF) 11. What are the expectations for the Company’s balance sheet leverage ratio between now and delivery? The Company expects its Debt/EBITDA ratio (disclosed at 1.8x pro forma for the Span Acquisition on August 2, 2016) to increase above its long-term targeted level of the “low 2x’s” during the new vessel construction period. However, following the delivery of the second Kanaloa Class Con-Ro vessel in mid-2020, the Company does not expect to order additional new vessels for any of its existing tradelanes for at least five years thereafter, during which time the Company expects its Debt/EBITDA ratio will decline to or below its long-term targeted level. (see Addendum for non-GAAP measures reconciliation) 12. What impact is the Kanaloa Class investment expected to have on Matson’s capital allocation strategy during the vessel construction period? The Company’s maintenance capital spending is expected to remain in the range of $40 to $50 million per year on average for the fiscal years 2017 to 2020. The Company expects to maintain its approach to quarterly dividend throughout the new vessel construction period. On share repurchases, the Company expects to take a slower pace for its remaining approximately 1.9 million shares authorized for repurchase than the pace executed since the inception of the program on November 4, 2015. Addendum – Q&A relating to the Kanaloa Class vessel construction filed via 8-K on August 25, 2016

Forward-Looking Statements Certain information set forth in this communication, including vessel delivery dates, financial results, increased fleet efficiency, fleet deployment, future vessel replacement expectations, financings, and anticipated long-term borrowing levels and capital allocation strategies, constitutes forward-looking statements within the meaning of the safe harbor provisions of the Private Securities Litigation Reform Act of 1995. These estimates, expectations and statements are based upon the current beliefs and expectations of the management of Matson and are subject to risks and uncertainties that could cause actual results to differ materially from those expected in or suggested by such statements, including but not limited to risks and uncertainties relating to: the occurrence of any event, change or other circumstances that could give rise to the termination of the agreement for the Kanaloa Class vessel construction; the ability of the shipyards to construct and deliver the Aloha Class and Kanaloa Class vessels on the contemplated timeframes; regional, national and international economic conditions; changes in general economic and/or industry-specific conditions; conditions in the financial markets; changes in our credit profile and our future financial performance; our ability to obtain future debt financings; continuation of the Title XI and CCF programs; the impact of future and pending legislation, including environmental legislation; government regulations and investigations; repeal, substantial amendment or waiver of the Jones Act or its application, or our failure to maintain our status as a United States citizen under the Jones Act; and the occurrence of marine accidents, poor weather or natural disasters. These forward-looking statements are not guarantees of future performance. This communication should be read in conjunction with our Annual Report on Form 10-K and our other filings with the SEC through the date of this release, which identify important factors that could affect the forward-looking statements in this release. We do not undertake any obligation to update our forward-looking statements. Addendum – Q&A relating to the Kanaloa Class vessel construction filed via 8-K on August 25, 2016