Attached files
| file | filename |
|---|---|
| EX-23.1 - EX-23.1 - Coupa Software Inc | d144637dex231.htm |
| EX-10.4 - EX-10.4 - Coupa Software Inc | d144637dex104.htm |
| EX-5.1 - EX-5.1 - Coupa Software Inc | d144637dex51.htm |
Table of Contents
As filed with the Securities and Exchange Commission on October 4, 2016.
Registration No. 333-213546
UNITED STATES
SECURITIES AND EXCHANGE COMMISSION
Washington, D.C. 20549
Amendment No. 2
to
Form S-1
REGISTRATION STATEMENT
Under
THE SECURITIES ACT OF 1933
COUPA SOFTWARE INCORPORATED
(Exact Name of Registrant as Specified in its Charter)
| Delaware (State or Other Jurisdiction of Incorporation or Organization) |
7372 (Primary Standard Industrial Classification Code Number) |
20-4429448 (I.R.S. Employer Identification Number) |
Coupa Software Incorporated
1855 S. Grant Street
San Mateo, CA 94402
(650) 931-3200
(Address, including zip code and telephone number, including
area code, of registrant’s principal executive offices)
Robert Bernshteyn
Chief Executive Officer
Coupa Software Incorporated
1855 S. Grant Street
San Mateo, CA 94402
(650) 931-3200
(Name, address, including zip code and telephone number, including
area code, of agent for service)
Copies to:
| Daniel E. O’Connor, Esq. Richard C. Blake, Esq. Gunderson Dettmer Stough Villeneuve Franklin & Hachigian, LLP 1200 Seaport Blvd. Redwood City, CA 94063 (650) 321-2400 |
Jonathan Stueve, Esq. Vice President and General Counsel Coupa Software Incorporated 1855 S. Grant Street San Mateo, CA 94402 (650) 931-3200 |
Sarah K. Solum, Esq. Davis Polk & Wardwell LLP 1600 El Camino Real Menlo Park, CA 94025 (650) 752-2000 |
Approximate date of commencement of proposed sale to the public: As soon as practicable after the effective date of this Registration Statement.
If any of the securities being registered on this Form are to be offered on a delayed or continuous basis pursuant to Rule 415 under the Securities Act of 1933, check the following box. ¨
If this Form is filed to register additional securities for an offering pursuant to Rule 462(b) under the Securities Act, please check the following box and list the Securities Act registration statement number of the earlier effective registration statement for the same offering. ¨
If this Form is a post-effective amendment filed pursuant to Rule 462(c) under the Securities Act, check the following box and list the Securities Act registration statement number of the earlier effective registration statement for the same offering. ¨
If this Form is a post-effective amendment filed pursuant to Rule 462(d) under the Securities Act, check the following box and list the Securities Act registration statement number of the earlier effective registration statement for the same offering. ¨
Indicate by check mark whether the registrant is a large accelerated filer, an accelerated filer, a non-accelerated filer, or a smaller reporting company. See the definitions of “large accelerated filer,” “accelerated filer” and “smaller reporting company” in Rule 12b-2 of the Exchange Act. (Check one):
| Large accelerated filer¨ Non-accelerated filerx (Do not check if a smaller reporting company) |
Smaller reporting company¨ Accelerated filer ¨ |
CALCULATION OF REGISTRATION FEE
|
| ||||||||
| Title of Each Class of Securities to be Registered |
Amount to be Registered(1) |
Proposed Maximum Offering Price Per Share |
Proposed Maximum Aggregate Offering Price(1) |
Amount of Registration Fee(2) | ||||
| Common Stock, $0.0001 par value |
8,510,000 shares | $18.00 | $153,180,000 | $15,879.71 | ||||
|
| ||||||||
|
| ||||||||
| (1) | Estimated solely for the purpose of calculating the amount of the registration fee in accordance with Rule 457(a) under the Securities Act of 1933, as amended. Includes shares that the underwriters have the option to purchase. |
| (2) | The Registrant previously paid $12,414.30 of this amount in connection with the initial filing of this Registration Statement. |
The Registrant hereby amends this Registration Statement on such date or dates as may be necessary to delay its effective date until the Registrant shall file a further amendment which specifically states that this Registration Statement shall thereafter become effective in accordance with Section 8(a) of the Securities Act of 1933, as amended, or until the Registration Statement shall become effective on such date as the Commission, acting pursuant to such Section 8(a), may determine.
Table of Contents
The information in this prospectus is not complete and may be changed. We may not sell these securities until the registration statement filed with the Securities and Exchange Commission is effective. This prospectus is not an offer to sell these securities and we are not soliciting offers to buy these securities in any jurisdiction where the offer or sale is not permitted.
PROSPECTUS (Subject to Completion)
Issued October 4, 2016
7,400,000 Shares

COMMON STOCK
Coupa Software Incorporated is offering 7,400,000 shares of its common stock. This is our initial public offering and no public market exists for our shares. We anticipate that the initial public offering price will be between $16.00 and $18.00 per share.
Our common stock has been approved for listing on the Nasdaq Global Select Market under the symbol “COUP.”
We are an “emerging growth company” as defined under the federal securities laws. Investing in our common stock involves risks. See “Risk Factors” beginning on page 14.
PRICE $ A SHARE
|
Price to |
Underwriting |
Proceeds to |
||||||||||
| Per share |
$ | $ | $ | |||||||||
| Total |
$ | $ | $ | |||||||||
(1) See “Underwriting” for a description of the compensation payable to the underwriters.
We have granted the underwriters the right to purchase up to an additional 1,110,000 shares of common stock at the initial public offering price less the underwriting discount.
The Securities and Exchange Commission and any state securities regulators have not approved or disapproved of these securities, or determined if this prospectus is truthful or complete. Any representation to the contrary is a criminal offense.
The underwriters expect to deliver the shares of common stock to purchasers on , 2016.
| MORGAN STANLEY | J.P. MORGAN | BARCLAYS | RBC CAPITAL MARKETS | |||||
| JMP SECURITIES | RAYMOND JAMES | |||||||
, 2016
Table of Contents

HUNDREDS OF CUSTOMERS
MILLIONS OF SUPPLIERS
coupa
VALUE AS A SERVICE
BILLIONS IN SAVINGS
coupa
ADOPTION BY ALL | UNIFIED CLOUD PLATFORM | MEASURABLE BUSINESS VALUE
Explanatory note:
As used above, “Customers” refers to our customers that are transacting on Coupa’s spend management platform as of the date of this prospectus.
“Suppliers” refers to the suppliers that are transacting on Coupa’s spend management platform as of the date of this prospectus.
“Savings” refers to the cumulative amount of savings that we estimate our customers have achieved to date by using our platform, which estimate is based on various industry benchmarks and does not directly correlate to our financial results.
Table of Contents

Avalon Health Care Group
$5,522,468
Amount of customer savings by using Coupa in the 12 months prior to the savings calculations.*
SCI
$6,660,603
Amount of customer savings by using Coupa in the 12 months prior to the savings calculations.*
STAPLES
Visibility and Control
Benefits achieved by using Coupa since March 2016 go live.
CONCENTRIX
5 WEEKS
Implemented the Coupa solution in five weeks, beginning in December 2013
MEASURABLE
BUSINESS VALUE
THE FRESH MARKET
$1,809,320
Amount of customer savings by using Coupa in the 12 months prior to the savings calculation.*
CapitalOne®
BUSINESS LEVER
Benefit achieved by using Coupa since June 2016 go live
NEC
$2,000,814
Amount of customer savings by using Coupa in the 12 months prior to the savings calculation.*
MOLINA
HEALTHCARE
360%
Improved operational efficiency by over 360% in four years of using Coupa.
COUPA
VALUE AS A SERVICE
* Savings is an estimate based on industry benchmarks and savings calculations were performed in 2015.
Table of Contents
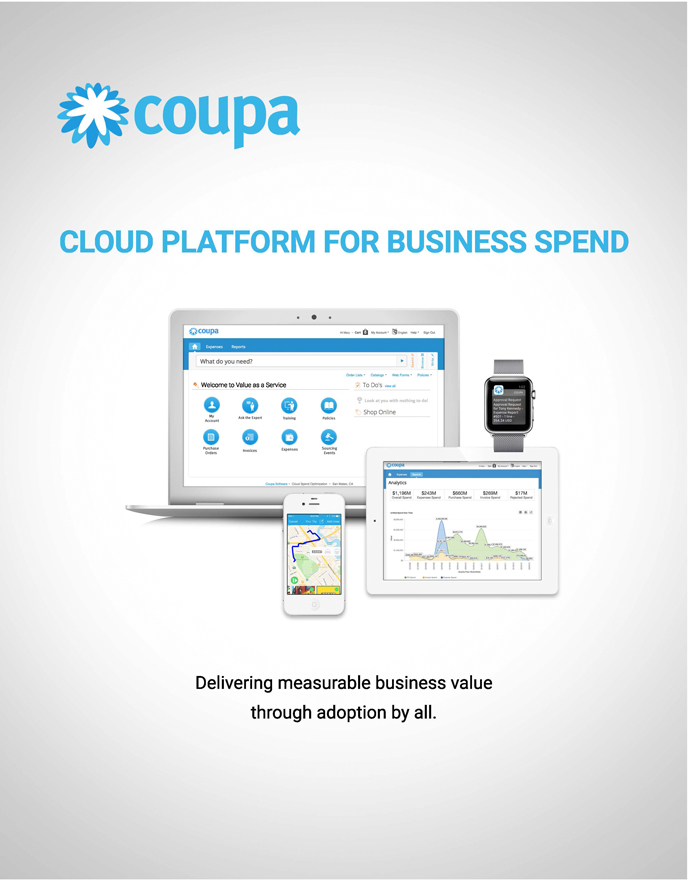
coupa
CLOUD PLATFORM FOR BUSINESS SPEND
Delivering measurable business value through adoption by all.
Table of Contents
Neither we nor the underwriters have authorized anyone to provide any information or to make any representations other than those contained in this prospectus or in any free writing prospectuses prepared by or on behalf of us or to which we have referred you. We and the underwriters take no responsibility for, and can provide no assurance as to the reliability of, any other information that others may give you. This prospectus is an offer to sell only the shares offered hereby, but only under circumstances and in jurisdictions where it is lawful to do so. The information contained in this prospectus or in any applicable free writing prospectus is current only as of its date, regardless of its time of delivery or any sale of shares of our common stock. Our business, financial condition, results of operations and prospects may have changed since that date.
Through and including , 2016 (25 days after commencement of this offering), all dealers that effect transactions in these securities, whether or not participating in this offering, may be required to deliver a prospectus. This is in addition to the dealers’ obligation to deliver a prospectus when acting as underwriters and with respect to their unsold allotments or subscriptions.
TRADEMARKS
Unless the context indicates otherwise, as used in this prospectus, the terms “Coupa” and “Open Business Network” and other trademarks or service marks of Coupa Software Incorporated appearing in this prospectus are the property of Coupa Software Incorporated. This prospectus contains additional trade names, trademarks, and service marks of ours and of other companies. We do not intend our use or display of other companies’ trade names, trademarks or service marks to imply a relationship with, or endorsement or sponsorship of us by, these other companies.
INVESTORS OUTSIDE THE UNITED STATES
Neither we nor the underwriters have done anything that would permit this offering or possession or distribution of this prospectus or any free writing prospectus we may provide to you in connection with this offering in any jurisdiction where action for that purpose is required, other than in the United States. You are required to inform yourselves about and to observe any restrictions relating to this offering and the distribution of this prospectus and any such free writing prospectus outside of the United States.
Table of Contents
This summary highlights certain information contained elsewhere in this prospectus. This summary is not complete and does not contain all of the information you should consider in making your investment decision. You should read the entire prospectus carefully before making an investment in our common stock. You should carefully consider, among other things, our consolidated financial statements and the related notes and the sections titled “Risk Factors” and “Management’s Discussion and Analysis of Financial Condition and Results of Operations” included elsewhere in this prospectus. Except as otherwise indicated herein or as the context otherwise requires, references in this prospectus to “Coupa,” “the company,” “we,” “us,” and “our” refer to Coupa Software Incorporated. Unless otherwise indicated, all data is as of or through July 31, 2016.
Mission
Our mission is to deliver “Value as a Service” by helping our customers maximize their spend under management, achieve significant cost savings and drive profitability.
Overview
We are the leading provider of a unified, cloud-based spend management platform that connects more than 460 organizations with more than 2 million suppliers globally. Our platform provides greater visibility into and control over how companies spend money. Using our platform, businesses are able to achieve real, measurable value and savings that drive their profitability. From our inception, our customers have used our platform to bring more than $250 billion of cumulative spend under management, which we estimate has resulted in more than $8 billion of customer savings to date, based on applying certain savings rates derived from industry benchmarks.
Our cloud-based platform has been designed for the modern global workforce that is mobile and expects real-time results, flexibility and agility from software solutions. We empower employees to acquire the goods and services they need to do their jobs by applying a distinctive user-centric approach that provides a mobile-enabled consumer Internet-like experience, drives widespread adoption of our platform and, therefore, significantly increases spend under management. We refer to the process companies use to purchase goods and services as spend management and to the money that they manage with this process as spend under management. Increased user adoption and spend under management drive better visibility and control of a company’s spend, resulting in greater savings and increased compliance.
Economic conditions, intense competition and the global regulatory environment are forcing businesses to find new ways to drive operational efficiencies, track processes, reduce costs, fund business growth and enhance profitability and cash flow. Therefore, managing spend has increasingly become a major strategic business imperative to help businesses achieve cost savings. Indirect spend, which refers to goods and services that support a company’s operations as opposed to direct spend that flows into the products a company manufactures, is particularly difficult to manage due to inefficient employee spending behavior and disparate systems that obstruct spend visibility.
We offer a unified, cloud-based spend management platform that is tightly integrated and delivers a broad range of capabilities that would otherwise require the purchase and use of multiple disparate point applications. The core of our platform consists of procurement, invoicing and expense management modules that form our transactional engine and capture a company’s spend. In addition, our platform offers supporting modules, including sourcing, analytics, contract management, supplier management, inventory management and storefront, that help companies further manage their spend. Moreover, through our free Coupa Open Business Network, suppliers of all sizes can easily interact with buyers electronically, thus significantly reducing paper, improving operating efficiencies and reducing costs.
1
Table of Contents
We have a strong results-driven and customer success-focused culture. Our focus is on delivering quantifiable business value to our customers by helping them maximize spend under management to achieve real, measurable value and savings. With a rapid time to deployment, typically ranging from a few weeks to several months, and an easy to use interface that shields users from complexity, our customers can achieve widespread user adoption quickly and generate savings within a short timeframe, thus benefitting from a rapid return on investment.
We benefit from powerful network effects. As more businesses subscribe to our platform, the collective spend under management on our platform grows. Greater aggregate spend under management on our platform attracts more suppliers, which in turn attracts more businesses that want to take advantage of the goods and services available through our platform, thereby creating powerful network effects. In addition, as more businesses and employees use our platform, the amount of spend under management continues to increase. This leads to more value and savings for customers and improves our ability to attract more businesses. The resulting increase in sales enables us to further invest in our platform and to improve our functionality and user interface to continue to attract more businesses and suppliers to our platform, which enhances the network effects that benefit all parties.
We have developed a rich partner ecosystem of systems integrators, implementation partners, resellers and technology partners. We work closely with several global systems integrators, including KPMG, Deloitte, Accenture, IBM, PwC and Wipro, that help us scale our business, extend our global reach and drive increased market penetration. We expect the number of our partner-led implementations to continue to increase over time, as well as sales referrals from our partners.
We have achieved rapid growth in customer adoption, cumulative spend under management and transactions conducted through our platform. We have more than 1.5 million licensed users who have driven an expansion in spend under management over time. These licensed users represent the employees among our base of more than 460 total customers who are authorized to use our solutions. Our cumulative spend under management and the transactions conducted through our platform are highlighted below:
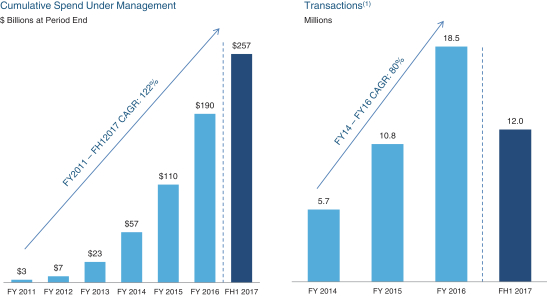
| (1) | Includes purchase orders, invoices, and expense reports processed in the period |
The metrics presented above do not directly correlate to our revenue or results of operations because we do not charge our customers based on actual usage of our platform. However, we believe the
2
Table of Contents
cumulative spend under management and total transactions metrics do illustrate the adoption, scale and value of our platform, which we believe enhances our ability to maintain existing customers and attract new customers.
For our fiscal years ended January 31, 2015 and 2016, our revenues were $50.8 million and $83.7 million and our net losses were $27.3 million and $46.2 million, respectively. For the six months ended July 31, 2015 and 2016, our revenues were $34.5 million and $60.3 million and our net losses were $25.1 million and $24.3 million, respectively.
Industry Background
Managing Spend has Become a Strategic Business Imperative
Economic conditions, intense competition and the global regulatory environment are forcing businesses to find new ways to drive operational efficiencies, track processes, reduce costs, fund business growth and enhance profitability and cash flow. Therefore, managing spend has increasingly become a major strategic business imperative to help businesses achieve cost savings that will enhance a company’s operating profit as well as free up monetary resources that can be reinvested in the company.
Indirect spend, which refers to goods and services that support a company’s operations such as office supplies, furniture, electronic equipment, IT services, marketing and recruiting, as opposed to direct spend that flows into the products a company manufactures, is particularly difficult to manage due to inefficient employee spending behavior and disparate systems that obstruct spend visibility. Businesses need a solution that will help them streamline their total spend, across all divisions and employees, not just the procurement department.
Businesses Lack Visibility Into Spend and Control Over their Spend
Few businesses have full visibility into what they spend, on which products and services they spend and with which vendors they spend, which leads to an inability to control spend as a result of several issues:
| • | Businesses typically employ inefficient manual procurement, invoicing, expensing and approval processes that cannot be managed across the organization in real time. |
| • | Businesses frequently utilize several fragmented systems for procurement, invoicing and expense management that do not integrate with each other and limit their ability to analyze and optimize spend. |
| • | Employee adoption of traditional procurement and other related offerings has typically been limited due to cumbersome user interfaces, need for training, lack of mobile capabilities and non-integrated point applications. |
| • | Inefficient processes result in “maverick spending” by employees who neglect to purchase from preferred suppliers or purchase goods and services without approval and outside of budgets, resulting in avoidable costs. |
| • | Businesses often struggle to manage risk and to ensure compliance with respect to frequently changing governmental regulations and internal control policies, as well as prevent potential fraud and corruption within the procurement process. |
Businesses Need a Unified Spend Management Solution that Enables Real-Time Spend Analysis
The abundance of fragmented point applications on the market today that address specific areas of spend management has resulted in increased complexity for businesses and their employees. Often employees have to access different systems or review electronic and paper files before they are able to make informed purchasing decisions. These time-consuming and non-integrated processes result in errors, frustrated employees and sub-optimal decision making with respect to spending of company resources.
3
Table of Contents
Businesses need a solution that not only provides seamless, cross-functional integration of process elements from advanced sourcing to purchase requisitioning to invoice payment, but also a single repository of data so that employees can see all the required information to make a prudent purchasing decision and to enable real-time spend analytics on this aggregated spend data.
Suppliers Want to Interact with Businesses Using a Solution that Maximizes their Revenues with Minimal Friction
Suppliers are increasingly seeking to collaborate with businesses electronically in an effort to eliminate inefficient paper-based processes, establish fast, accurate invoicing and enhance compliance. However, suppliers often face difficulty connecting to the buyers’ network technology due to incompatible systems, lengthy onboarding processes, cumbersome user interfaces and upfront or ongoing fees that are often associated with web-based business networks. As a result of the barriers related to cost, time and complexity, the supplier adoption of web-based business networks has been limited.
Advances in Technology Have Paved the Way for a Next Generation Cloud-Based Spend Management Platform
Advances in technology architectures have supported the rise of cloud-based applications that represent a compelling alternative to traditional on-premise solutions due to lower total cost of ownership, better functionality and flexibility. Cloud-based software applications with superior user interfaces and mobile capabilities have displaced legacy offerings in areas such as customer relationship management (CRM), human capital management (HCM) and IT management. However, while there are several software offerings that automate business processes related to spend management, most of these software offerings are based on on-premise technology or legacy architectures from the 1990s.
Today, advancements in cloud computing, mobile devices, storage and networking are converging to enable new capabilities previously difficult to implement. Technology is enabling the development of powerful, intricate software solutions that address users’ demands for mobility, simplicity, speed and real-time access to data. These recent trends have paved the way for a next generation cloud-based advanced spend management platform that meets the needs of modern businesses.
Legacy Offerings Do Not Meet the Needs of Businesses, Employees and Suppliers
Many automated procurement offerings that are in the market today were developed in the late 1990s. These offerings traditionally consist of either add-on modules to enterprise resource planning (ERP) software that have been organically developed or acquired, or standalone offerings that only enable automation of parts of the spend management process but do not offer holistic spend management solutions. Limitations of these legacy offerings include:
| • | insufficient or non-unified product functionality; |
| • | difficult to use and access; |
| • | expensive to deploy and maintain complex on-premise implementations; |
| • | long time to deployment; |
| • | lack of configurability; |
| • | lack of independence by larger ERP vendors; and |
| • | limited supplier adoption related to cost, time and complexity. |
4
Table of Contents
Coupa’s Unified Cloud-Based Spend Management Platform
We offer a unified, cloud-based spend management platform that can significantly improve savings for businesses. The core of our platform consists of procurement, invoicing and expense management modules that form our transactional engine and capture a company’s spend under management. In addition, our platform offers supporting modules, including sourcing, analytics, contract management, supplier management, inventory management and storefront, that help companies further manage their spend. Moreover, through our free Coupa Open Business Network, suppliers of all sizes can easily interact with buyers electronically, thus significantly reducing paper, improving operating efficiencies and reducing costs.
Our platform provides businesses with real-time visibility into spending that is occurring company-wide and enables businesses to drive adoption of the platform and capture, analyze and control this spend, achieve real measurable value and savings and directly improve their profitability:
| • | Drive Adoption. Our platform applies a distinctive user-centric approach that shields users from complexity and provides a mobile-enabled consumer Internet-like experience, thus enabling widespread adoption of our platform by users across the entire organization as well as suppliers. |
| • | Capture. At the core of our platform is our transactional engine that is comprised of our procurement, invoicing and expense management modules, which collectively capture spend within an organization. Given purchase orders, invoices and expense reports flow through our platform and the data is stored centrally in a clean and organized fashion, businesses are able to observe the company-wide spending activities in real time. |
| • | Analyze. Our spending analytics capabilities provide intuitive spend analysis dashboards and reports that deliver real-time analytical insights that help businesses identify problems and make better spending decisions. Real-time analytical insight is critical to helping identify savings opportunities and risks, as well as isolating problem areas in the spending process to target improvement efforts. |
| • | Control. We help our customers control and streamline their spending activity, as well as realize efficiencies that result in real savings. Our platform has extensive functionality that enables managers to prevent excessive spend and reduce spend through realizing efficiencies and cost savings associated with strategic sourcing and contract compliance. |
| • | Save. Within a short timeframe, we help our customers realize measurable value and savings by taking advantage of pre-negotiated supplier discounts, achieving contract compliance, improving process efficiencies and reducing redundant and wasteful spending, as well as enable strategic sourcing via reverse auctions in which suppliers bid down prices at which they are willing to sell their goods and services to businesses. |
Key Benefits to Businesses
| • | Rapid time to value through fast deployment cycles and low cost of ownership of cloud-based model. |
| • | Opportunity to achieve significant and sustainable savings that can translate into improved profitability. |
| • | High employee adoption of our easy-to-use unified platform, which enables better visibility into spend. |
| • | Strong supplier adoption as suppliers are motivated to join our network due to ease of enablement, flexibility and lack of supplier fees. |
5
Table of Contents
| • | Access to extensive spending data in real time, which leads to superior decision making that can result in significant cost savings. |
| • | Ability to stay agile and adapt to changes in operating and regulatory environments with our easily configurable platform. |
| • | Process efficiency improvements that allow businesses to free up valuable resources and staff who can be deployed effectively elsewhere in the organization. |
| • | Enhanced compliance with governmental regulations through greater auditability, documentation and control of spending activity. |
Key Benefits to Employees
| • | Intuitive and simple user experience that shields users from complexity and enables adoption of our platform with minimal training. |
| • | Efficiency improvements as employees are more rapidly able to procure the goods and services they need to fulfill their job responsibilities. |
| • | Mobile access from anywhere in the world from any device. |
| • | Convenience to employees, as our platform gathers data on historical activity and leverages the insights to help populate requests and minimize data entry. |
| • | Faster reimbursement to employees due to more efficient expense management processes. |
Key Benefits to Suppliers
| • | Minimal friction through lack of upfront or ongoing fees to participate in our Coupa Open Business Network. |
| • | Fast registration process and flexibility to interact with customers through Coupa Supplier Portal, direct integration or simply by use of direct email. |
| • | Elimination of manual processes and efficiency improvements through electronic invoicing and streamlined procurement and payment processes. |
| • | Real-time visibility into invoice status, often through direct push notifications without having to log in to a portal. |
| • | Seamless audit, documentation and archiving of electronic purchase orders and invoices that helps suppliers comply with changing government regulations, as well as avoid risks. |
| • | Opportunity to display supplier information and catalog of products and services on the Coupa Open Business Network for existing and prospective customers. |
Our Market Opportunity
Our cloud-based spend management platform unites the three core aspects of spend management—procurement, invoicing and expense management—and has the ability to manage both indirect and direct spend. The total market for direct and indirect spend management is estimated at $16.0 billion in 2016, based on research by the following industry sources. International Data Corporation (IDC) estimates that the global market for procurement and invoicing applications that automate processes related to purchasing supplies, material and services will reach $4.3 billion in 2016 and will grow to $5.3 billion by 2019. According to Technavio market research sourced from ISI Securities EMIS, the global Software-as-a-Service (SaaS)-based market for expense management will reach $2.2 billion in 2016 and will
6
Table of Contents
grow to $3.2 billion in 2018. In addition, IDC estimates that the market for supply chain management application software, which includes software related to logistics, production planning and inventory management, will reach $9.5 billion in 2016 and grow to $11.3 billion by 2019.
Our Competitive Strengths
| • | Easy and Intuitive User Interface that Enables Widespread Employee Adoption. Our focus on an intuitive and simple user experience shields our users from complexity and results in superior employee adoption. |
| • | Unified Platform With Powerful Functionality. We offer a unified platform that is tightly integrated and delivers a broad range of capabilities to manage different types of spend that would otherwise require the purchase and use of multiple disparate point applications. By offering a unified platform with powerful functionality that integrates different modules, we deliver a comprehensive platform for customers to drive adoption, and capture, analyze and control spend across their entire company, thus significantly enhancing savings potential. |
| • | Independence and Interoperability. We are agnostic as to the ERP system and other back-end systems used by our customers and our open architecture enables interoperability with numerous software applications, back-end systems and other third-party offerings. Customers can use our application programming interfaces (APIs), flat files, commerce eXtensible Markup Language (cXML) and electronic data interchange (EDI) data formats or custom code to make seamless connections between our platform and their ERP platform, supplier or other third-party system. |
| • | Powerful Network Effects. As more businesses subscribe to our platform, the collective spend under management on our platform grows. Greater aggregate spend under management on our platform attracts more suppliers, which in turn attracts more businesses that want to take advantage of the goods and services available through our platform, thereby creating powerful network effects. In addition, as more businesses and employees use our platform, the amount of spend under management continues to increase. This leads to more savings for customers and improves our ability to attract more businesses. The resulting increase in sales enables us to further invest in our platform and to improve our functionality and user interface to continue to attract more businesses and suppliers to our platform, which enhances the network effects that benefit all parties. |
| • | Cloud Platform. We are 100% built from the ground up as a SaaS application delivered via the cloud. As a result, our total cost of ownership is low, our deployment times are short and we can seamlessly deploy the latest updates and upgrades to all our customers via our cloud-based platform. |
| • | Rich Partner Ecosystem. We have developed strong strategic relationships with a number of leading partners including global systems integrators, implementation partners, resellers and technology partners. While implementation partners such as KPMG, Deloitte, Accenture, PwC and Wipro help us scale our business by extending our global reach and drive increased market penetration, our technology partners including Dell Boomi, IBM (Emptoris) and Trustweaver extend and enhance the capabilities of our platform by facilitating integrations that can deliver a higher level of value to customers. |
| • | Results-Driven Culture. We have a relentless focus on real measurable customer success and work extensively with customers to achieve significantly improved business value in the form of savings through the use of our platform. |
| • | Higher Supplier Adoption. We do not charge suppliers any upfront or ongoing fees to participate in our Coupa Open Business Network and offer suppliers an easy and flexible way to interact with customers with minimal friction. As a result, suppliers are motivated to join our network and adopt |
7
Table of Contents
| our platform, which represents a significant competitive advantage over legacy vendors that often struggle with supplier adoption. |
| • | Proprietary Data Enables Superior Insights. Our platform collects and presents spend activity data that managers can easily analyze using powerful built-in reports and dashboards. Using our proprietary data, we are able to provide benchmarking versus other companies and evaluate supplier performance that can help decision makers identify areas of improvement and realize cost savings. As the number of employees and amount of spend through our platform grows, we acquire more proprietary data that enables us to provide unique insights to our customers, thus strengthening our powerful value proposition. |
Growth Strategy
Key elements of our strategy include:
| • | expand our customer base, both domestically and internationally; |
| • | deepen existing customer relationships; |
| • | increase direct spend under management on our platform; |
| • | continue to innovate and further develop our platform; and |
| • | further expand and develop our partner ecosystem. |
Risks Associated With Our Business
Our business is subject to numerous risks and uncertainties including those highlighted in the section titled “Risk Factors” immediately following this prospectus summary. These risks include, among others, the following:
| • | We have a limited operating history, which makes it difficult to predict our future operating results. We have a history of cumulative losses, and we do not expect to be profitable for the foreseeable future. |
| • | If we are unable to attract new customers, the growth of our revenues will be adversely affected. |
| • | Because our platform is sold to large enterprises with complex operating environments, we encounter long and unpredictable sales cycles, which could adversely affect our operating results in a given period. |
| • | If we fail to develop widespread brand awareness cost-effectively, our business may suffer. |
| • | The markets in which we participate are intensely competitive, and if we do not compete effectively, our operating results could be adversely affected. |
| • | We do not have a long history with our subscription or pricing models and changes could adversely affect our operating results. |
| • | Our business depends substantially on our customers renewing their subscriptions and purchasing additional subscriptions from us. Any decline in our customer renewals would harm our future operating results. |
| • | Because we recognize subscription revenues over the term of the contract, fluctuations in new sales will not be immediately reflected in our operating results and may be difficult to discern. |
| • | Our reported quarterly results may fluctuate significantly. |
| • | We have experienced rapid growth in recent periods. If we fail to manage our growth effectively, we may be unable to execute our business plan, maintain high levels of service or adequately address competitive challenges. |
8
Table of Contents
If we are unable to adequately address these and other risks we face, our business, financial condition, operating results and prospects may be adversely affected.
Principal Stockholders
Our principal stockholders, executive officers and directors and their affiliates will beneficially hold approximately 72.4% of the voting power of our outstanding capital stock following this offering. See “Principal Stockholders” beginning on page 122.
Implications of Being an Emerging Growth Company
We qualify as an “emerging growth company” as defined in the Jumpstart Our Business Startups Act of 2012, or the JOBS Act. An emerging growth company may take advantage of relief from certain reporting requirements and other burdens that are otherwise applicable generally to public companies. These provisions include:
| • | reduced obligations with respect to financial data, including presenting only two years of audited financial statements and only two years of selected financial data; |
| • | an exception from compliance with the auditor attestation requirements of Section 404 of the Sarbanes-Oxley Act of 2002, or the Sarbanes-Oxley Act; |
| • | reduced disclosure about our executive compensation arrangements in our periodic reports, proxy statements and registration statements; and |
| • | exemptions from the requirements of holding non-binding advisory votes on executive compensation or golden parachute arrangements. |
We may take advantage of these provisions for up to five years or such earlier time that we no longer qualify as an emerging growth company. We would cease to be an emerging growth company if we have more than $1.0 billion in annual revenues, have more than $700 million in market value of our capital stock held by non-affiliates or issue more than $1.0 billion of non-convertible debt over a three-year period. We may choose to take advantage of some but not all of these reduced reporting burdens.
In addition, under the JOBS Act, emerging growth companies can delay adopting new or revised accounting standards until such time as those standards apply to private companies. We have irrevocably elected not to avail ourselves of this exemption from new or revised accounting standards. Accordingly, we will be subject to the same new or revised accounting standards as other public companies that are not emerging growth companies.
Reverse Stock Split
Our board of directors and stockholders approved a 1-for-4 reverse stock split of our capital stock, which was effected on September 21, 2016. All references to common stock, options to purchase common stock, restricted stock units, share data, per share data, warrants, convertible preferred stock and related information have been retroactively adjusted where applicable in this prospectus to reflect the reverse stock split of our capital stock as if it had occurred at the beginning of the earliest period presented.
Corporate Information
We were incorporated in February 2006 in Delaware. Our principal executive offices are located at 1855 S. Grant Street, San Mateo, CA 94402, and our telephone number is (650) 931-3200. Our website address is www.coupa.com. The information on, or that can be accessed through, our website is not part of this prospectus. We have included our website address as an inactive textual reference only.
9
Table of Contents
THE OFFERING
| Issuer |
Coupa Software Incorporated |
| Shares of common stock offered |
7,400,000 shares |
| Shares of common stock outstanding |
48,110,957 shares (49,220,957 shares if the underwriters exercise their option to purchase additional shares in full) |
| Option to purchase additional shares |
We have granted the underwriters the option, exercisable for 30 days from the date of this prospectus, to purchase up to 1,110,000 additional shares of our common stock. |
| Use of proceeds |
We estimate that the net proceeds from this offering will be approximately $112.1 million, or $129.6 million if the underwriters exercise their option to purchase additional shares in full, after deducting underwriting discounts and commissions and estimated offering expenses payable by us, assuming an initial public offering price of $17.00 per share, which is the midpoint of the price range set forth on the cover page of this prospectus. |
| The principal purposes of this offering are to increase our financial flexibility, increase our visibility in the marketplace and create a public market for our common stock. We expect to use the net proceeds from this offering for working capital and other general corporate purposes, which we currently expect will include continued investment in developing technology to support our growth, increased investment in our sales team and marketing activities, as well as overall growth in our international operations. However, we do not currently have specific planned uses of the proceeds. We may also use a portion of our net proceeds to acquire or invest in complementary products, technologies, or businesses; however, we currently have no agreements or commitments to complete any such transactions. See “Use of Proceeds” on page 41. |
| Risk factors |
See “Risk Factors” beginning on page 14 and the other information included in this prospectus for a discussion of factors you should consider carefully before deciding to invest in our common stock. |
| Nasdaq symbol |
“COUP” |
The number of shares of common stock to be outstanding after this offering is based on 40,710,957 shares of common stock outstanding as of July 31, 2016, and excludes the following:
| • | 12,395,877 shares of common stock issuable upon the exercise of options outstanding as of July 31, 2016, with a weighted average exercise price of $4.40 per share; |
| • | 1,679,885 shares of common stock issuable upon the exercise of options granted after July 31, 2016, with a weighted average exercise price of $12.66 per share; |
10
Table of Contents
| • | 36,971 shares of convertible preferred stock issuable upon the exercise of a warrant outstanding as of July 31, 2016, with an exercise price of $1.35 per share, that will convert into a warrant to purchase 36,971 shares of common stock upon completion of this offering; |
| • | 56,250 shares of common stock subject to restricted stock units outstanding as of July 31, 2016; and |
| • | 6,531,370 shares of common stock reserved for future issuance under our equity compensation plans, consisting of 1,212,620 shares of common stock that were reserved for issuance under our 2006 Stock Plan as of July 31, 2016, 4,500,000 shares of common stock reserved for issuance under the 2016 Equity Incentive Plan in effect following the completion of this offering and 818,750 shares of common stock reserved for issuance under the 2016 Employee Stock Purchase Plan in effect following the completion of this offering. On the date immediately prior to the date of this prospectus, we will cease granting awards under the 2006 Stock Plan. |
Unless otherwise indicated, all information in this prospectus assumes:
| • | a 1-for-4 reverse stock split of our capital stock that was effected on September 21, 2016; |
| • | the automatic conversion of 33,431,855 shares of our preferred stock outstanding as of July 31, 2016, into an aggregate of 34,610,979 shares of our common stock immediately prior to the closing of this offering; |
| • | the filing of our amended and restated certificate of incorporation and the effectiveness of our amended and restated bylaws immediately prior to the closing of this offering; |
| • | no exercise of the underwriters’ option to purchase additional shares; and |
| • | no exercise or cancellation of outstanding options or vesting of restricted stock units subsequent to July 31, 2016. |
11
Table of Contents
SUMMARY CONSOLIDATED FINANCIAL AND OTHER DATA
The following tables set forth a summary of our historical consolidated financial data as of, and for the periods ended on, the dates indicated. The consolidated statement of operations data for the fiscal years ended January 31, 2015 and 2016, are derived from our audited consolidated financial statements included elsewhere in this prospectus. The consolidated statement of operations data for the six months ended July 31, 2015 and 2016, and the consolidated balance sheet data as of July 31, 2016, are derived from our unaudited consolidated financial statements included elsewhere in this prospectus. We have prepared the unaudited consolidated financial statements on the same basis as the audited consolidated financial statements and have included all adjustments, consisting only of normal recurring adjustments that, in our opinion, are necessary to state fairly the financial information set forth in those statements. You should read this data together with our consolidated financial statements and related notes appearing elsewhere in this prospectus and the information in “Selected Consolidated Financial and Other Data” and “Management’s Discussion and Analysis of Financial Condition and Results of Operations.” Our historical results are not necessarily indicative of our future results, and the results of operations for the six months ended July 31, 2016, are not necessarily indicative of the results to be expected for the full fiscal year or any other period. The summary consolidated financial data in this section are not intended to replace the consolidated financial statements and are qualified in their entirety by the consolidated financial statements and related notes included elsewhere in this prospectus.
| Year ended January 31, |
Six months ended July 31, |
|||||||||||||||
| 2015 | 2016 | 2015 | 2016 | |||||||||||||
| (in thousands, except per share data) |
||||||||||||||||
| Consolidated Statements of Operations Data: |
||||||||||||||||
| Revenues: |
||||||||||||||||
| Subscription services |
$ | 43,051 | $ | 75,667 | $ | 31,622 | $ | 53,155 | ||||||||
| Professional services and other |
7,794 | 8,011 | 2,891 | 7,160 | ||||||||||||
|
|
|
|
|
|
|
|
|
|||||||||
| Total revenues |
50,845 | 83,678 | 34,513 | 60,315 | ||||||||||||
|
|
|
|
|
|
|
|
|
|||||||||
| Cost of revenues: |
||||||||||||||||
| Subscription services(1) |
8,813 | 16,804 | 7,545 | 12,079 | ||||||||||||
| Professional services and other(1) |
9,911 | 15,107 | 6,233 | 11,420 | ||||||||||||
|
|
|
|
|
|
|
|
|
|||||||||
| Total cost of revenues |
18,724 | 31,911 | 13,778 | 23,499 | ||||||||||||
|
|
|
|
|
|
|
|
|
|||||||||
| Gross profit |
32,121 | 51,767 | 20,735 | 36,816 | ||||||||||||
|
|
|
|
|
|
|
|
|
|||||||||
| Operating expenses: |
||||||||||||||||
| Research and development(1) |
11,887 | 22,767 | 10,223 | 15,046 | ||||||||||||
| Sales and marketing(1) |
33,724 | 54,713 | 24,211 | 35,088 | ||||||||||||
| General and administrative(1) |
13,146 | 19,540 | 11,199 | 10,173 | ||||||||||||
|
|
|
|
|
|
|
|
|
|||||||||
| Total operating expenses |
58,757 | 97,020 | 45,633 | 60,307 | ||||||||||||
|
|
|
|
|
|
|
|
|
|||||||||
| Loss from operations |
(26,636 | ) | (45,253 | ) | (24,898 | ) | (23,491 | ) | ||||||||
| Other expense, net |
(563 | ) | (568 | ) | (131 | ) | (523 | ) | ||||||||
|
|
|
|
|
|
|
|
|
|||||||||
| Loss before provision for income taxes |
(27,199 | ) | (45,821 | ) | (25,029 | ) | (24,014 | ) | ||||||||
| Provision for income taxes |
101 | 335 | 118 | 291 | ||||||||||||
|
|
|
|
|
|
|
|
|
|||||||||
| Net loss and comprehensive loss |
$ | (27,300 | ) | $ | (46,156 | ) | $ | (25,147 | ) | $ | (24,305 | ) | ||||
|
|
|
|
|
|
|
|
|
|||||||||
| Net loss per share attributable to common stockholders, basic and diluted(2) |
$ | (9.10 | ) | $ | (9.81 | ) | $ | (5.78 | ) | $ | (4.25 | ) | ||||
|
|
|
|
|
|
|
|
|
|||||||||
| Weighted-average number of shares used in computing net loss per share attributable to common stockholders, basic and diluted(2) |
2,999 | 4,704 | 4,351 | 5,721 | ||||||||||||
|
|
|
|
|
|
|
|
|
|||||||||
| Pro forma net loss per share attributable to common stockholders, basic and diluted(2) |
$ | (1.22 | ) | $ | (0.60 | ) | ||||||||||
|
|
|
|
|
|||||||||||||
| Weighted-average number of shares used in computing pro forma net loss per share attributable to common stockholders, basic and diluted(2) |
37,795 | 40,332 | ||||||||||||||
|
|
|
|
|
|||||||||||||
| Other Financial Data: |
||||||||||||||||
| Non-GAAP operating loss(3) |
$ | (17,818 | ) | $ | (32,355 | ) | $ | (15,296 | ) | $ | (19,644 | ) | ||||
|
|
|
|
|
|
|
|
|
|||||||||
12
Table of Contents
| (1) | Includes stock-based compensation expense as follows: |
| Year ended January 31, |
Six months ended July 31, |
|||||||||||||||
| 2015 | 2016 | 2015 | 2016 | |||||||||||||
| (in thousands) | ||||||||||||||||
| Cost of revenues: |
||||||||||||||||
| Subscription services |
$ | 109 | $ | 235 | $ | 99 | $ | 265 | ||||||||
| Professional services and other |
110 | 1,014 | 885 | 244 | ||||||||||||
| Research and development |
337 | 1,236 | 857 | 625 | ||||||||||||
| Sales and marketing |
433 | 1,347 | 386 | 911 | ||||||||||||
| General and administrative |
818 | 6,736 | 5,806 | 1,220 | ||||||||||||
|
|
|
|
|
|
|
|
|
|||||||||
| Total stock-based compensation |
$ | 1,807 | $ | 10,568 | $ | 8,033 | $ | 3,265 | ||||||||
|
|
|
|
|
|
|
|
|
|||||||||
| (2) | See Note 14 to our consolidated financial statements for an explanation of the method used to calculate basic, diluted and pro forma net loss per common share attributable to common stockholders. |
| (3) | We define non-GAAP operating loss as operating loss before stock-based compensation, litigation-related costs and amortization of acquired intangible assets. For more information about our non-GAAP operating loss and a reconciliation of our non-GAAP operating loss to loss from operations, the most directly comparable financial measure calculated and presented in accordance with U.S. generally accepted accounting principles, or GAAP, see the section titled “Selected Consolidated Financial Data—Non-GAAP Financial Measures.” |
| As of July 31, 2016 | ||||||||||||
| Actual | Pro Forma(1) | Pro Forma As Adjusted(2)(3) |
||||||||||
| (in thousands) | ||||||||||||
| Consolidated Balance Sheet Data: |
||||||||||||
| Cash and cash equivalents |
$ | 79,943 | $ | 79,943 | $ | 192,037 | ||||||
| Working capital |
25,105 | 25,105 | 137,199 | |||||||||
| Total assets |
129,208 | 129,208 | 241,302 | |||||||||
| Deferred revenue, current and non-current |
72,136 | 72,136 | 72,136 | |||||||||
| Convertible preferred stock |
164,950 | — | — | |||||||||
| Total stockholders’ equity (deficit) |
(126,414 | ) | 38,536 | 150,630 | ||||||||
| (1) | Reflects the automatic conversion of all outstanding shares of our preferred stock into an aggregate of 34,610,979 shares of common stock. |
| (2) | Reflects the pro forma adjustment described in footnote (1) above and the sale by us of 7,400,000 shares of common stock in this offering at an assumed initial public offering price of $17.00 per share, the midpoint of the price range set forth on the cover page of this prospectus, after deducting underwriting discounts and commissions and estimated offering expenses payable by us and the application of the net proceeds of this offering as described in “Use of Proceeds.” |
| (3) | A $1.00 increase (decrease) in the assumed initial public offering price of $17.00 per share, the midpoint of the price range set forth on the cover page of this prospectus, would increase (decrease) each of pro forma as adjusted cash and cash equivalents, working capital, total assets, and stockholders’ equity by $6.9 million, assuming the number of shares we are offering, as set forth on the cover page of this prospectus, remains the same, after deducting underwriting discounts and commissions and estimated offering expenses payable by us. We may also increase or decrease the number of shares we are offering. An increase (decrease) of 1,000,000 in the number of shares we are offering would increase (decrease) each of pro forma as adjusted cash and cash equivalents, working capital, total assets, and total stockholders’ equity by approximately $15.8 million, assuming the initial public offering price per share remains the same. The pro forma as adjusted information is illustrative only, and we will adjust this information based on the actual initial public offering price, number of shares offered, and other terms of this offering determined at pricing. |
13
Table of Contents
Investing in our common stock involves a high degree of risk. You should carefully consider the risks described below, as well as the other information in this prospectus, including our consolidated financial statements and the related notes and “Management’s Discussion and Analysis of Financial Condition and Results of Operations,” before deciding whether to invest in our common stock. The occurrence of any of the events or developments described below could materially and adversely affect our business, financial condition, results of operations and growth prospects. In such an event, the market price of our common stock could decline, and you may lose all or part of your investment. Additional risks and uncertainties not presently known to us or that we currently deem immaterial may also impair our business operations.
Risks Related to Our Business and Industry
We have a limited operating history, which makes it difficult to predict our future operating results.
We were incorporated in 2006 and introduced our first software module shortly thereafter and over time have invested in building our integrated platform. As a result of our limited operating history, our ability to forecast our future operating results is limited and subject to a number of uncertainties, including our ability to plan for and model future growth. We have encountered and will encounter risks and uncertainties frequently experienced by growing companies in rapidly changing industries, such as the risks and uncertainties described herein. If our assumptions regarding these risks and uncertainties (which we use to plan our business) are incorrect or change, or if we do not address these risks successfully, our operating and financial results could differ materially from our expectations and our business could suffer.
Any success that we may experience in the future will depend, in large part, on our ability to manage the risks discussed herein and to, among other things:
| • | retain and expand our customer base on a cost-effective basis; |
| • | successfully compete in our markets; |
| • | continue to add features and functionality to our platform to meet customer demand; |
| • | increase revenues from existing customers as they add users or purchase additional modules; |
| • | continue to invest in research and development; |
| • | scale our internal business operations in an efficient and cost-effective manner; |
| • | scale our global customer success organization to make our customers successful in their spend management deployments; |
| • | help our partners to be successful in deployments of our platform; |
| • | successfully expand our business domestically and internationally; |
| • | successfully protect our intellectual property and defend against intellectual property infringement claims; and |
| • | hire, integrate and retain professional and technical talent. |
If we are unable to attract new customers, the growth of our revenues will be adversely affected.
To increase our revenues, we must add new customers, increase the number of users at existing customers and sell additional modules to current customers. As our industry matures or if competitors introduce lower cost and/or differentiated products or services that are perceived to compete with ours, our ability to sell based on factors such as pricing, technology and functionality could be impaired. As a result, we may be unable to attract new customers at rates or on terms that would be favorable or comparable to prior periods, which could have an adverse effect on the growth of our revenues.
14
Table of Contents
Because our platform is sold to large enterprises with complex operating environments, we encounter long and unpredictable sales cycles, which could adversely affect our operating results in a given period.
Our ability to increase revenues and achieve profitability depends, in large part, on widespread acceptance of our platform by large enterprises. As we target our sales efforts at these customers, we face greater costs, longer sales cycles and less predictability in completing some of our sales. As a result of the variability and length of the sales cycle, we have only a limited ability to forecast the timing of sales. A delay in or failure to complete sales could harm our business and financial results, and could cause our financial results to vary significantly from period to period. Our sales cycle varies widely, reflecting differences in potential customers’ decision-making processes, procurement requirements and budget cycles, and is subject to significant risks over which we have little or no control, including:
| • | customers’ budgetary constraints and priorities; |
| • | the timing of customers’ budget cycles; |
| • | the need by some customers for lengthy evaluations; and |
| • | the length and timing of customers’ approval processes. |
In the large enterprise market, the customer’s decision to use our platform may be an enterprise-wide decision and, therefore, these types of sales require us to provide greater levels of education regarding the use and benefits of our platform, which causes us to expend substantial time, effort and money educating them as to the value of our platform. In addition, because we are a relatively new company with a limited operating history, our target customers may prefer to purchase software that is critical to their business from one of our larger, more established competitors. Our typical sales cycles can range from three to nine months, and we expect that this lengthy sales cycle may continue or increase. Longer sales cycles could cause our operating and financial results to suffer in a given period.
If we fail to develop widespread brand awareness cost-effectively, our business may suffer.
We believe that developing and maintaining widespread awareness of our brand in a cost-effective manner is critical to achieving widespread acceptance of our platform and attracting new customers. For example, widespread awareness of our brand is critical to ensuring that we are invited to participate in requests for proposals from prospective customers. Our success in this area will depend on a wide range of factors, some of which are beyond our control, including the following:
| • | the efficacy of our marketing efforts; |
| • | our ability to offer high-quality, innovative and error- and bug-free modules; |
| • | our ability to retain existing customers and obtain new customers; |
| • | the ability of our customers to achieve successful results by using our platform; |
| • | the quality and perceived value of our platform; |
| • | our ability to successfully differentiate our offerings from those of our competitors; |
| • | actions of competitors and other third parties; |
| • | our ability to provide customer support and professional services; |
| • | any misuse or perceived misuse of our platform and modules; |
| • | positive or negative publicity; |
| • | interruptions, delays or attacks on our platform or modules; and |
| • | litigation, legislative or regulatory-related developments. |
15
Table of Contents
Brand promotion activities may not generate customer awareness or increase revenues, and, even if they do, any increase in revenues may not offset the expenses we incur in building our brand. If we fail to successfully promote and maintain our brand, or incur substantial expenses, we may fail to attract or retain customers necessary to realize a sufficient return on our brand-building efforts or to achieve the widespread brand awareness that is critical for broad customer adoption of our platform.
Furthermore, negative publicity, whether or not justified, relating to events or activities attributed to us, our employees, our partners or others associated with any of these parties, may tarnish our reputation and reduce the value of our brand. Damage to our reputation and loss of brand equity may reduce demand for our platform and have an adverse effect on our business, operating results and financial condition. Moreover, any attempts to rebuild our reputation and restore the value of our brands may be costly and time consuming, and such efforts may not ultimately be successful.
We have a history of cumulative losses, and we do not expect to be profitable for the foreseeable future.
We have incurred significant losses in each period since our inception in 2006. We incurred net losses of $27.3 million, $46.2 million and $24.3 million, respectively, in the fiscal years ended January 31, 2015 and 2016 and for the six months ended July 31, 2016. We had an accumulated deficit of $147.2 million at July 31, 2016. Our losses and accumulated deficit reflect the substantial investments we made to acquire new customers and develop our platform. We expect our operating expenses to increase in the future due to anticipated increases in sales and marketing expenses, research and development expenses, operations costs and general and administrative costs, and, therefore, we expect our losses to continue for the foreseeable future. Furthermore, to the extent we are successful in increasing our customer base, we will also incur increased losses because costs associated with acquiring customers are generally incurred up front, while subscription revenues are generally recognized ratably over the terms of the agreements, which are typically three years, although some customers commit for shorter periods. You should not consider our recent growth in revenues as indicative of our future performance. Accordingly, we cannot assure you that we will achieve profitability in the future, or that, if we do become profitable, we will sustain profitability.
The markets in which we participate are intensely competitive, and if we do not compete effectively, our operating results could be adversely affected.
The market for spend management software is highly competitive, with relatively low barriers to entry for some software or services. Our competitors include Oracle Corporation (Oracle) and SAP AG (SAP), well-established providers of spend management software, which have long-standing relationships with many customers. Some customers may be hesitant to adopt cloud-based software such as ours and prefer to purchase from legacy software vendors. Oracle and SAP are larger and have greater name recognition, much longer operating histories, larger marketing budgets and significantly greater resources than we do. These vendors, as well as other competitors, may offer spend management software on a standalone basis at a low price or bundled as part of a larger product sale. In order to take advantage of customer demand for cloud-based software, legacy vendors are expanding their cloud-based software through acquisitions and organic development. For example, SAP acquired Ariba, Inc. and Concur Technologies, Inc. Legacy vendors may also seek to partner with other leading cloud providers. We also face competition from custom-built software vendors and from vendors of specific applications, some of which offer cloud-based solutions. We may also face competition from a variety of vendors of cloud-based and on-premise software products that address only a portion of our platform. In addition, other companies that provide cloud-based software in different target markets may develop software or acquire companies that operate in our target markets, and some potential customers may elect to develop their own internal software. With the introduction of new technologies and market entrants, we expect this competition to intensify in the future.
16
Table of Contents
Many of our competitors are able to devote greater resources to the development, promotion and sale of their products and services. Furthermore, our current or potential competitors may be acquired by third parties with greater available resources and the ability to initiate or withstand substantial price competition. In addition, many of our competitors have established marketing relationships, access to larger customer bases and major distribution agreements with consultants, system integrators and resellers. Our competitors may also establish cooperative relationships among themselves or with third parties that may further enhance their product offerings or resources. If our platform does not become more accepted relative to our competitors’, or if our competitors are successful in bringing their products or services to market earlier than ours, or if their products or services are more technologically capable than ours, then our revenues could be adversely affected. In addition, some of our competitors may offer their products and services at a lower price. If we are unable to achieve our target pricing levels, our operating results would be negatively affected. Pricing pressures and increased competition could result in reduced sales, reduced margins, losses or a failure to maintain or improve our competitive market position, any of which could adversely affect our business.
We do not have a long history with our subscription or pricing models and changes could adversely affect our operating results.
We have limited experience with respect to determining the optimal prices and contract length for our platform. As the markets for our software subscriptions grow, as new competitors introduce new products or services that compete with ours or as we enter into new international markets, we may be unable to attract new customers at the same price or based on the same pricing model as we have used historically. For example, customers may demand pricing models that include price adjustments that are correlated to the savings they realize using our products and services. While this is not and has not been our pricing model, we have discussed it with some customers in the past and may choose to implement it in the future. Moreover, regardless of pricing model used, large customers, which are the focus of our sales efforts, may demand higher price discounts than in the past. As a result, in the future we may be required to reduce our prices, offer shorter contract durations or offer alternative pricing models, which could adversely affect our revenues, gross margin, profitability, financial position and cash flow.
Our business depends substantially on our customers renewing their subscriptions and purchasing additional subscriptions from us. Any decline in our customer renewals would harm our future operating results.
In order for us to maintain or improve our operating results, it is important that our customers renew their subscriptions when the initial contract term expires and add additional authorized users and additional spend management modules to their subscriptions. Our customers have no obligation to renew their subscriptions, and we cannot assure you that our customers will renew subscriptions with a similar contract period or with the same or a greater number of authorized users and modules. Some of our customers have elected not to renew their agreements with us, and we may not be able to accurately predict renewal rates.
Our renewal rates may decline or fluctuate as a result of a number of factors, including our customers’ satisfaction with our subscription service, our professional services, our customer support, our prices and contract length, the prices of competing solutions, mergers and acquisitions affecting our customer base, the effects of global economic conditions or reductions in our customers’ spending levels. Our future success also depends in part on our ability to add additional authorized users and modules to the subscriptions of our current customers. If our customers do not renew their subscriptions, renew on less favorable terms or fail to add more authorized users or additional spend management modules, our revenues may decline, and we may not realize improved operating results from our customer base.
17
Table of Contents
Because we recognize subscription revenues over the term of the contract, fluctuations in new sales will not be immediately reflected in our operating results and may be difficult to discern.
We generally recognize subscription revenues from customers ratably over the terms of their contracts, which are typically three years, although some customers commit for shorter periods. As a result, most of the subscription revenues we report on each quarter are derived from the recognition of deferred revenue relating to subscriptions entered into during previous quarters. Consequently, a decline in new or renewed subscriptions in any single quarter will likely have only a small impact on our revenues for that quarter. However, such a decline will negatively affect our revenues in future quarters. Accordingly, the effect of significant downturns in sales and market acceptance of our platform, and potential changes in our pricing policies or rate of renewals, may not be fully apparent from our reported results of operations until future periods.
We may be unable to adjust our cost structure to reflect the changes in revenues. In addition, a significant majority of our costs are expensed as incurred, while subscription revenues are recognized over the life of the customer agreement. As a result, increased growth in the number of our customers could result in our recognition of more costs than revenues in the earlier periods of the terms of our agreements. Our subscription model also makes it difficult for us to rapidly increase our revenues through additional sales in any period, as revenues from new customers must be recognized over the applicable subscription term.
Professional services revenues are recognized as the services are performed or upon the completion of the project, depending on the type of professional services arrangement involved. Professional services engagements typically span from a few weeks to several months, which makes it somewhat difficult to predict the timing of revenue recognition for such services and the corresponding effects on our results of operations. Professional services revenues have and may continue to fluctuate significantly from period to period. In addition, because professional services expenses are recognized as the services are performed, professional services and total margins can significantly fluctuate from period to period.
Our quarterly results may fluctuate significantly and may not fully reflect the underlying performance of our business.
Our quarterly results of operations, as well as our key metrics discussed elsewhere in this prospectus, including the levels of our revenues, gross margin, profitability, cash flow and deferred revenue, may vary significantly in the future and period-to-period comparisons of our operating results and key metrics may not be meaningful. Accordingly, the results of any one quarter should not be relied upon as an indication of future performance. Our quarterly financial results and metrics may fluctuate as a result of a variety of factors, many of which are outside of our control and, as a result, may not fully reflect the underlying performance of our business. These fluctuations may negatively affect the value of our common stock. Factors that may cause these quarterly fluctuations include, without limitation, those listed herein, including:
| • | our ability to attract new customers; |
| • | the addition or loss of large customers, including through acquisitions or consolidations; |
| • | the timing of recognition of revenues; |
| • | the amount and timing of operating expenses; |
| • | network outages or security breaches; |
| • | general economic, industry and market conditions, both domestically and internationally; |
| • | customer renewal rates; |
| • | the amount and timing of completion of professional services engagements; |
18
Table of Contents
| • | increases or decreases in the number of users for our platform or pricing changes upon any renewals of customer agreements; |
| • | changes in our pricing policies or those of our competitors; |
| • | seasonal variations in sales of our software subscriptions, which has historically been highest in the fourth quarter of a calendar year but may vary in future quarters; |
| • | the timing and success of new module introductions by us or our competitors or any other change in the competitive dynamics of our industry, including consolidation among competitors, customers or strategic partners; and |
| • | the timing of expenses related to the development or acquisition of technologies or businesses and potential future charges for impairment of goodwill from acquired companies. |
The profitability of our customer relationships may fluctuate.
Our business model focuses on maximizing the lifetime value of our customer relationships and we need to make significant investments in order to add new customers to grow our customer base. The profitability of a customer relationship in any particular period depends in part on how long the customer has been a subscriber on our platform. In general, the upfront costs associated with new customers are higher in the first year than the aggregate revenues we recognize from those new customers in the first year.
We review the lifetime value and associated acquisition costs of our customers, as discussed further in “Management’s Discussion and Analysis of Financial Condition and Results of Operations—Our Business Model.” The lifetime value of our customers and customer acquisition costs has and will continue to fluctuate from one period to another depending upon the amount of our net new subscription revenues (which depends on the number of new customers in a period, upsells of additional modules to existing customers and changes in subscription fees charged to existing customers), gross margins (which depends on investments in and other changes to our cost of customer support and allocated overhead), sales and marketing expenses and renewal rates (which depend on our ability to maintain or grow subscription fees from customers). These amounts have fluctuated from quarter to quarter and will continue to fluctuate in the future. We may not experience lifetime value to customer acquisition cost ratios in future years or periods similar to those we have achieved to date. Other companies may calculate lifetime value and customer acquisition costs differently than our chosen method and, therefore, may not be directly comparable.
We have experienced rapid growth in recent periods. If we fail to manage our growth effectively, we may be unable to execute our business plan, maintain high levels of service or adequately address competitive challenges.
We have recently experienced a period of rapid growth in our headcount and operations. We have also significantly increased the size of our customer base. We anticipate that we will significantly expand our operations and headcount in the near term, including internationally. This growth has placed, and future growth will place, a significant strain on our management, administrative, operational and financial infrastructure. Our success will depend in part on our ability to manage this growth effectively. To manage the expected growth of our operations and personnel, we will need to continue to improve our operational, financial and management controls and our reporting systems and procedures. Failure to effectively manage growth could result in difficulty or delays in deploying customers, declines in quality or customer satisfaction, increases in costs, difficulties in introducing new features or other operational difficulties, and any of these difficulties could adversely affect our business performance and results of operations.
19
Table of Contents
If we are not able to provide successful and timely enhancements, new features and modifications for our platform and modules, we may lose existing customers or fail to attract new customers and our revenues and financial performance may suffer.
If we are unable to provide enhancements and new features for our existing modules or new modules that achieve market acceptance or that keep pace with rapid technological developments or to integrate technology, products and services that we acquire into our platform, our business could be adversely affected. The success of enhancements, new features and modules depends on several factors, including the timely completion, introduction and market acceptance of the enhancements or new features or modules. Failure in this regard may significantly impair the growth of our revenues. We have experienced, and may in the future experience, delays in the planned release dates of enhancements to our platform, and we have discovered, and may in the future discover, errors in new releases after their introduction. Either situation could result in adverse publicity, loss of sales, delay in market acceptance of our platform or customer claims, including, among other things, warranty claims against us, any of which could cause us to lose existing customers or affect our ability to attract new customers.
If our security measures are breached or unauthorized access to customer data is otherwise obtained, our platform may be perceived as not being secure, customers may reduce the use of or stop using our platform and we may incur significant liabilities.
Our platform involves the storage and transmission of our customers’ sensitive proprietary information, including their purchasing data. As a result, unauthorized access or security breaches could result in the loss of information, litigation, indemnity obligations and other liability. While we have security measures in place that are designed to protect customer information and prevent data loss and other security breaches, if these measures are breached as a result of third-party action, employee error, malfeasance or otherwise, and someone obtains unauthorized access to our customers’ data, our reputation could be damaged, we could be required to expend significant capital and other resources to alleviate the problem, our business may suffer and we could incur significant liability. Because the techniques used to obtain unauthorized access or sabotage systems change frequently and generally are not identified until they are launched against a target, we may be unable to anticipate these techniques or to implement adequate preventative measures. Any or all of these issues could negatively affect our ability to attract new customers, cause existing customers to elect to not renew their subscriptions, result in reputational damage or subject us to third-party lawsuits, regulatory fines or other action or liability, which could adversely affect our operating results.
If we fail to integrate our platform with a variety of third-party technologies, our platform may become less marketable and less competitive or obsolete and our operating results would be harmed.
Our platform must integrate with a variety of third-party technologies, and we need to continuously modify and enhance our platform to adapt to changes in cloud-enabled hardware, software, networking, browser and database technologies. Any failure of our platform to operate effectively with future technologies could reduce the demand for our platform, resulting in customer dissatisfaction and harm to our business. If we are unable to respond to these changes in a cost-effective manner, our platform may become less marketable and less competitive or obsolete and our operating results may be negatively affected. In addition, an increasing number of individuals within the enterprise are utilizing mobile devices to access the Internet and corporate resources and to conduct business. If we cannot continue to effectively make our platform available on these mobile devices and offer the information, services and functionality required by enterprises that widely use mobile devices, we may experience difficulty attracting and retaining customers.
20
Table of Contents
We rely heavily on Amazon Web Services to deliver our platform and modules to our customers, and any disruption in service from Amazon Web Services or material change to our arrangement with Amazon Web Services could adversely affect our business.
We rely upon Amazon Web Services (AWS) to operate certain aspects of our platform and any disruption of or interference with our use of AWS could impair our ability to deliver our platform and modules to our customers, resulting in customer dissatisfaction, damage to our reputation, loss of customers and harm to our business. AWS provides a distributed computing infrastructure platform for business operations, or what is commonly referred to as a cloud computing service. We have architected our software and computer systems to use data processing, storage capabilities and other services provided by AWS. Currently, our cloud service infrastructure is run on AWS. Given this, we cannot easily switch our AWS operations to another cloud provider, so any disruption of or interference with our use of AWS would affect our operations and our business could be adversely affected.
AWS provides us with computing and storage capacity pursuant to an agreement that continues until terminated by either party. AWS may terminate the agreement without cause by providing 30 days’ prior written notice and may terminate the agreement for cause with 30 days’ prior written notice, including any material default or breach of the agreement by us that we do not cure within the 30 day period. Additionally, AWS has the right to terminate the agreement immediately with notice to us in certain scenarios such as if AWS believes providing the services could create a substantial economic or technical burden or material security risk for AWS, or in order to comply with the law or requests of governmental entities. The agreement requires AWS to provide us their standard computing and storage capacity and related support in exchange for timely payment by us. If any of our arrangements with AWS were terminated, we could experience interruptions in our software as well as delays and additional expenses in arranging new facilities and services.
We utilize third-party data center hosting facilities operated by AWS, located in various sites within North America. For international customers, we utilize third-party data center hosting facilities operated by AWS located in Dublin, Ireland and Sydney, Australia. Our operations depend, in part, on AWS’s abilities to protect these facilities against damage or interruption from natural disasters, power or telecommunications failures, criminal acts and similar events. Despite precautions taken at these data centers, the occurrence of spikes in usage volume, a natural disaster, an act of terrorism, vandalism or sabotage, a decision to close a facility without adequate notice or other unanticipated problems at a facility could result in lengthy interruptions in the availability of our platform. Even with current and planned disaster recovery arrangements, our business could be harmed. Also, in the event of damage or interruption, our insurance policies may not adequately compensate us for any losses that we may incur. These factors in turn could further reduce our revenues, subject us to liability and cause us to issue credits or cause customers to fail to renew their subscriptions, any of which could harm our business.
Privacy concerns and laws or other domestic or foreign regulations may reduce the effectiveness of our platform and adversely affect our business.
Our customers can use our platform to collect, use and store certain types of personal or identifying information regarding their employees and suppliers. Federal, state and foreign government bodies and agencies have adopted, are considering adopting or may adopt laws and regulations regarding the collection, use, storage and disclosure of personal information obtained from consumers and individuals, such as compliance with the Health Insurance Portability and Accountability Act, or HIPAA, and the recently created EU-U.S. Privacy Shield. The costs of compliance with, and other burdens imposed by, such laws and regulations that are applicable to the businesses of our customers may limit the use and adoption of our platform and reduce overall demand or lead to significant fines, penalties or liabilities for any noncompliance with such privacy laws. Furthermore, privacy concerns may cause our customers’ employees to resist providing the personal data necessary to allow our customers to use our platform
21
Table of Contents
effectively. Even the perception of privacy concerns, whether or not valid, may inhibit market adoption of our platform in certain industries.
All of these domestic and international legislative and regulatory initiatives may adversely affect our customers’ ability to process, handle, store, use and transmit demographic and personal information from their employees, customers and suppliers, which could reduce demand for our platform. The European Union and many countries in Europe have stringent privacy laws and regulations, which may affect our ability to operate cost effectively in certain European countries. Moreover, the scope and application of some regulations, such as the recently enacted EU-U.S. Privacy Shield, is uncertain and complying with regulations may be more costly than we currently anticipate.
In addition to government activity, privacy advocacy groups and the technology and other industries are considering various new, additional or different self-regulatory standards that may place additional burdens on us. If the processing of personal information were to be curtailed in this manner, our platform would be less effective, which may reduce demand for our platform and adversely affect our business.
The loss of one or more of our key customers could negatively affect our ability to market our platform.
We rely on our reputation and recommendations from key customers in order to promote subscriptions to our platform. The loss of any of our key customers could have a significant impact on our revenues, reputation and our ability to obtain new customers. In addition, acquisitions of our customers could lead to cancellation of our contracts with those customers or by the acquiring companies, thereby reducing the number of our existing and potential customers.
Our business could be adversely affected if our customers are not satisfied with the implementation services provided by us or our partners.
Our business depends on our ability to satisfy our customers, both with respect to our platform and modules and the professional services that are performed to help our customers use features and functions that address their business needs. Professional services may be performed by our own staff, by a third-party partner or by a combination of the two. Our strategy is to work with partners to increase the breadth of capability and depth of capacity for delivery of these services to our customers, and we expect the number of our partner-led implementations to continue to increase over time. If a customer is not satisfied with the quality of work performed by us or a partner or with the type of professional services or modules delivered, then we could incur additional costs to address the situation, the profitability of that work might be impaired and the customer’s dissatisfaction with our services could damage our ability to expand the number of modules subscribed to by that customer. In addition, negative publicity related to our customer relationships, regardless of its accuracy, may further damage our business by affecting our ability to compete for new business with current and prospective customers.
We typically provide service level commitments under our customer contracts. If we fail to meet these contractual commitments, we could be obligated to provide credits or refunds for prepaid amounts related to unused subscription services or face contract terminations, which could adversely affect our revenues.
Our customer agreements typically provide service level commitments on a monthly basis. If we are unable to meet the stated service level commitments or suffer extended periods of unavailability for our platform, we may be contractually obligated to provide these customers with service credits, or we could face contract terminations, in which case we would be subject to refunds for prepaid amounts related to unused subscription services. Our revenues could be significantly affected if we suffer unexcused downtime under our agreements with our customers. Any extended service outages could adversely affect our reputation, revenues and operating results.
22
Table of Contents
Any failure to offer high-quality technical support services may adversely affect our relationships with our customers and our financial results.
Once our modules are implemented, our customers depend on our support organization to resolve technical issues relating to our modules. We may be unable to respond quickly enough to accommodate short-term increases in customer demand for support services. We also may be unable to modify the format of our support services to compete with changes in support services provided by our competitors. Increased customer demand for these services, without corresponding revenues, could increase costs and adversely affect our operating results. In addition, our sales process is highly dependent on our platform and business reputation and on positive recommendations from our existing customers. Any failure to maintain high-quality technical support, or a market perception that we do not maintain high-quality support, could adversely affect our reputation, our ability to sell subscriptions to our modules to existing and prospective customers and our business, operating results and financial position.
Sales to customers outside the United States or with international operations expose us to risks inherent in international sales.
A key element of our growth strategy is to expand our international operations and develop a worldwide customer base. The combined revenues from non-U.S. regions, as determined based on the billing address of our customers, constituted 25% and 28%, respectively, of our total revenues for the fiscal years ended January 31, 2015 and 2016, and 28% and 29%, respectively, of our total revenues for the six months ended July 31, 2015 and 2016. Operating in international markets requires significant resources and management attention and will subject us to regulatory, economic and political risks that are different from those in the United States. Because of our limited experience with international operations, our international expansion efforts may not be successful in creating additional demand for our platform outside of the United States or in effectively selling subscriptions to our platform in all of the international markets we enter. In addition, we will face risks in doing business internationally that could adversely affect our business, including:
| • | the need to localize and adapt our platform for specific countries, including translation into foreign languages and associated expenses; |
| • | data privacy laws that require customer data to be stored and processed in a designated territory; |
| • | difficulties in staffing and managing foreign operations and working with foreign partners; |
| • | different pricing environments, longer sales cycles and longer accounts receivable payment cycles and collections issues; |
| • | new and different sources of competition; |
| • | weaker protection for intellectual property and other legal rights than in the United States and practical difficulties in enforcing intellectual property and other rights outside of the United States; |
| • | laws and business practices favoring local competitors; |
| • | compliance challenges related to the complexity of multiple, conflicting and changing governmental laws and regulations, including employment, tax, privacy and data protection laws and regulations; |
| • | increased financial accounting and reporting burdens and complexities; |
| • | restrictions on the transfer of funds; |
| • | foreign exchange risk, as well as the risk that, because a majority of our international contracts are denominated in U.S. dollars, an increase in the strength of the U.S. dollar may make doing business with us less appealing to a non-U.S. customer; |
23
Table of Contents
| • | adverse tax consequences; and |
| • | unstable regional and economic political conditions. |
As we continue to expand our business globally, our success will depend, in large part, on our ability to anticipate and effectively manage these and other risks associated with our international sales and operations. Our failure to manage any of these risks successfully, or to comply with these laws and regulations, could harm our operations, reduce our sales and harm our business, operating results and financial condition. For example, in certain foreign countries, particularly those with developing economies, certain business practices that are prohibited by laws and regulations applicable to us, such as the Foreign Corrupt Practices Act, may be more commonplace. Although we have policies and procedures designed to ensure compliance with these laws and regulations, our employees, contractors and agents, as well as channel partners involved in our international sales, may take actions in violation of our policies. Any such violation could have an adverse effect on our business and reputation.
Some of our business partners also have international operations and are subject to the risks described above. Even if we are able to successfully manage the risks of international operations, our business may be adversely affected if our business partners are not able to successfully manage these risks.
We may face exposure to foreign currency exchange rate fluctuations.
Today, our international contracts are sometimes denominated in local currencies. However, the majority of our international costs are denominated in local currencies. Over time, an increasing portion of our international contracts may be denominated in local currencies. Therefore, fluctuations in the value of the U.S. dollar and foreign currencies may affect our operating results when translated into U.S. dollars. We do not currently engage in currency hedging activities to limit the risk of exchange rate fluctuations. However, in the future, we may use derivative instruments, such as foreign currency forward and option contracts, to hedge certain exposures to fluctuations in foreign currency exchange rates. The use of such hedging activities may not offset any or more than a portion of the adverse financial effects of unfavorable movements in foreign exchange rates over the limited time the hedges are in place. Moreover, the use of hedging instruments may introduce additional risks if we are unable to structure effective hedges with such instruments.
If the market for enterprise cloud software develops more slowly than we expect or declines, our business could be adversely affected.
The enterprise cloud software market is not as mature as the market for on-premise enterprise software, and it is uncertain whether cloud software will achieve and sustain high levels of customer demand and market acceptance. Our success will depend to a substantial extent on the widespread adoption of cloud computing in general, and of spend management services in particular. Many enterprises have invested substantial personnel and financial resources to integrate traditional enterprise software into their businesses and, therefore, may be reluctant or unwilling to migrate to cloud software. It is difficult to predict customer adoption rates and demand for our platform, the future growth rate and size of the cloud software market or the entry of competitive solutions. The expansion of the cloud software market depends on a number of factors, including the cost, performance and perceived value associated with cloud software, as well as the ability of cloud software companies to address security and privacy concerns. If other cloud software providers experience security incidents, loss of customer data, disruptions in delivery or other problems, the market for cloud software as a whole, including our platform, may be negatively affected. If cloud software does not achieve widespread adoption, or if there is a reduction in demand for cloud software caused by a lack of customer acceptance, technological challenges, weakening economic conditions, security or privacy concerns, competing technologies and products, decreases in corporate spending or otherwise, our business could be adversely affected.
24
Table of Contents
To date, most of our sales have involved our procurement and invoicing modules. Our efforts to increase use of these modules and our other modules may not succeed and may reduce the growth rate of our revenues.
To date, most of our sales have involved our procurement and invoicing modules, which are our most mature modules. Any factor adversely affecting sales of these modules, including software release cycles, market acceptance, product competition, performance and reliability, reputation, price competition and economic and market conditions, could adversely affect our business and operating results. Our participation in the markets for our other modules, including expense reporting, sourcing, inventory, contracts, analytics, supplier management and storefront, is relatively new, and it is uncertain whether these areas will ever result in significant revenues for us. Further, the introduction of new modules beyond these markets may not be successful.
Large customers often demand more configuration and integration services, or customized features and functions that we do not offer, which could adversely affect our business and operating results.
Large customers may demand more configuration and integration services, which increase our upfront investment in sales and deployment efforts, with no guarantee that these customers will increase the scope of their subscription. As a result of these factors, we must devote a significant amount of sales support and professional services resources to individual customers, increasing the cost and time required to complete sales. Additionally, our platform does not currently permit customers to modify our code. If prospective customers require customized features or functions that we do not offer and that would be difficult for them to deploy themselves, then the market for our platform will be more limited and our business could suffer.
If our platform fails to perform properly, our reputation could be adversely affected, our market share could decline and we could be subject to liability claims.
Our platform is inherently complex and may contain material defects or errors. Any defects in functionality or that cause interruptions in the availability of our platform could result in:
| • | loss or delayed market acceptance and sales; |
| • | breach of warranty claims; |
| • | sales credits or refunds for prepaid amounts related to unused subscription services; |
| • | loss of customers; |
| • | diversion of development and customer service resources; and |
| • | injury to our reputation. |
The costs incurred in correcting any material defects or errors might be substantial and could adversely affect our operating results.
Because of the large amount of data that we collect and manage, it is possible that hardware failures or errors in our systems could result in data loss or corruption or cause the information that we collect to be incomplete or contain inaccuracies that our customers regard as significant. Furthermore, the availability or performance of our platform could be adversely affected by a number of factors, including customers’ inability to access the Internet, the failure of our network or software systems, security breaches or variability in user traffic for our platform. We may be required to issue credits or refunds for prepaid amounts related to unused services or otherwise be liable to our customers for damages they may incur resulting from certain of these events. For example, our customers access our modules through their Internet service providers. If a service provider fails to provide sufficient capacity to support our modules or otherwise experiences service outages, such failure could interrupt our customers’ access to our modules, adversely affect their perception of our modules’ reliability and reduce our revenues. In addition
25
Table of Contents
to potential liability, if we experience interruptions in the availability of our platform, our reputation could be adversely affected and we could lose customers.
Our errors and omissions insurance may be inadequate or may not be available in the future on acceptable terms, or at all. In addition, our policy may not cover all claims made against us and defending a suit, regardless of its merit, could be costly and divert management’s attention.
If we fail to manage our technical operations infrastructure, our existing customers may experience service outages and our new customers may experience delays in the implementation of our platform.
We have experienced significant growth in the number of users, transactions and data that our operations infrastructure supports. We seek to maintain sufficient excess capacity in our operations infrastructure to meet the needs of all of our customers. We also seek to maintain excess capacity to facilitate the rapid provision of new customer implementations and the expansion of existing customer implementations. In addition, we need to properly manage our technological operations infrastructure in order to support version control, changes in hardware and software parameters and the evolution of our platform. However, the provision of new hosting infrastructure requires significant lead time. We have experienced, and may in the future experience, website disruptions, outages and other performance problems. These problems may be caused by a variety of factors, including infrastructure changes, human or software errors, viruses, security attacks, fraud, spikes in customer usage and denial of service issues. In some instances, we may not be able to identify the cause or causes of these performance problems within an acceptable period of time. If we do not accurately predict our infrastructure requirements, our existing customers may experience service outages that may subject us to financial penalties, financial liabilities and customer losses. If our operations infrastructure fails to keep pace with increased sales, customers may experience delays as we seek to obtain additional capacity, which could adversely affect our reputation and adversely affect our revenues.
Failure to adequately expand our direct sales force will impede our growth.
We will need to continue to expand and optimize our sales infrastructure in order to grow our customer base and our business. We plan to continue to expand our direct sales force, both domestically and internationally. Identifying and recruiting qualified personnel and training them in the use of our software requires significant time, expense and attention. It often takes six months or longer before our sales representatives are fully-trained and productive. Our business may be adversely affected if our efforts to expand and train our direct sales force do not generate a corresponding increase in revenues. In particular, if we are unable to hire, develop and retain talented sales personnel or if new direct sales personnel are unable to achieve desired productivity levels in a reasonable period of time, we may not be able to realize the expected benefits of this investment or increase our revenues.
Our growth depends in part on the success of our strategic relationships with third parties.
We have established strategic relationships with a number of other companies. In order to grow our business, we anticipate that we will continue to establish and maintain relationships with third parties, such as implementation partners, system integrator partners and technology providers. Identifying partners, and negotiating and documenting relationships with them, requires significant time and resources. Our competitors may be effective in providing incentives to third parties to favor their products or services or to prevent or reduce subscriptions to our services. In addition, acquisitions of our partners by our competitors could result in a decrease in the number of our current and potential customers, as our partners may no longer facilitate the adoption of our platform by potential customers.
If we are unsuccessful in establishing or maintaining our relationships with third parties, our ability to compete in the marketplace or to grow our revenues could be impaired and our operating results may suffer. Even if we are successful, we cannot assure you that these relationships will result in increased customer usage of our platform or increased revenues.
26
Table of Contents
Weakened global economic conditions may harm our industry, business and results of operations.
Our overall performance depends in part on worldwide economic conditions. Global financial developments and downturns seemingly unrelated to us or the enterprise software industry may harm us. The United States and other key international economies have been affected by falling demand for a variety of goods and services, restricted credit, poor liquidity, reduced corporate profitability, volatility in credit, equity and foreign exchange markets, bankruptcies, and overall uncertainty with respect to the economy. In particular, the economies of countries in Europe have been experiencing weakness associated with high sovereign debt levels, weakness in the banking sector and uncertainty over the future of the Euro zone, including instability surrounding “Brexit,” the United Kingdom’s decision to exit the European Union. We have operations, as well as current and potential new customers, throughout most of Europe. If economic conditions in Europe and other key markets for our platform continue to remain uncertain or deteriorate further, many customers may delay or reduce their information technology spending.
The growth of our revenues and potential profitability of our business depends on demand for platform and modules generally, and spend management specifically. In addition, our revenues are dependent on the number of users of our modules. Historically, during economic downturns there have been reductions in spending on enterprise software as well as pressure for extended billing terms or pricing discounts, which would limit our ability to grow our business and negatively affect our operating results. These conditions affect the rate of enterprise software spending and could adversely affect our customers’ ability or willingness to subscribe to our platform, delay prospective customers’ purchasing decisions, reduce the value or duration of their subscriptions or affect renewal rates, all of which could harm our operating results.
Any failure to protect our intellectual property rights could impair our ability to protect our proprietary technology and our brand.
Our success and ability to compete depend in part upon our intellectual property. We primarily rely on copyright, patent, trade secret and trademark laws, trade secret protection and confidentiality or contractual agreements with our employees, customers, partners and others to protect our intellectual property rights. However, the steps we take to protect our intellectual property rights may be inadequate.
In order to protect our intellectual property rights, we may be required to spend significant resources to monitor and protect these rights. Litigation brought to protect and enforce our intellectual property rights could be costly, time-consuming and distracting to management and could result in the impairment or loss of portions of our intellectual property. Furthermore, our efforts to enforce our intellectual property rights may be met with defenses, counterclaims and countersuits attacking the validity and enforceability of our intellectual property rights. Our failure to secure, protect and enforce our intellectual property rights could seriously adversely affect our brand and adversely affect our business.
We may be sued by third parties for alleged infringement of their proprietary rights.
There has been considerable activity in our industry to develop and enforce intellectual property rights. Our success depends upon our not infringing upon the intellectual property rights of others. Our competitors, as well as a number of other entities and individuals, may own or claim to own intellectual property relating to our industry. In the past third parties have claimed and in the future third parties may claim that we are infringing upon their intellectual property rights, and we may be found to be infringing upon such rights. For example, between March 2012 and August 2014 and between May 2014 and September 2015, we and Ariba, Inc. were involved in patent and trade secret litigation cases, each of which eventually resulted in a settlement agreement that requires us to maintain certain ongoing compliance measures that if challenged, could be costly, time-consuming and divert the attention of our management and key personnel from our business operations.
27
Table of Contents
In the future, others may claim that our platform and underlying technology infringe or violate their intellectual property rights. We may be unaware of the intellectual property rights that others may claim cover some or all of our technology or services. Any claims or litigation could cause us to incur significant expenses and, if successfully asserted against us, could require that we pay substantial damages or ongoing royalty payments, prevent us from offering our services or require that we comply with other unfavorable terms. We may also be obligated to indemnify our customers and business partners or to pay substantial settlement costs, including royalty payments, in connection with any such claim or litigation and to obtain licenses, modify our platform or refund fees, which could be costly. Even if we were to prevail in such a dispute, any litigation regarding our intellectual property could be costly and time-consuming and divert the attention of our management and key personnel from our business operations.
Our platform utilizes open source software, and any failure to comply with the terms of one or more of these open source licenses could negatively affect our business.
Our platform utilizes software governed by open source licenses, which may include, by way of example, the MIT License and the Apache License. The terms of various open source licenses have not been interpreted by United States courts, and there is a risk that such licenses could be construed in a manner that imposes unanticipated conditions or restrictions on our ability to market our platform. By the terms of certain open source licenses, we could be required to release the source code of our proprietary software, and to make our proprietary software available under open source licenses, if we combine our proprietary software with open source software in a certain manner. In the event that portions of our proprietary software are determined to be subject to an open source license, we could be required to publicly release the affected portions of our source code, or to re-engineer all or a portion of our technologies or otherwise be limited in the licensing of our technologies, each of which could reduce or eliminate the value of our technologies and services. In addition to risks related to license requirements, usage of open source software can lead to greater risks than use of third-party commercial software, as open source licensors generally do not provide warranties or controls on the origin of the software. Many of the risks associated with usage of open source software cannot be eliminated and could negatively affect our business.
We employ third-party licensed software for use in or with our platform, and the inability to maintain these licenses or errors in the software we license could result in increased costs, or reduced service levels, which could adversely affect our business.
Our platform incorporates certain third-party software obtained under licenses from other companies. We anticipate that we will continue to rely on such third-party software and development tools from third parties in the future. Although we believe that there are commercially reasonable alternatives to the third-party software we currently license, this may not always be the case, or it may be difficult or costly to replace. In addition, integration of the software used in our platform with new third-party software may require significant work and require substantial investment of our time and resources. Also, to the extent that our platform depends upon the successful operation of third-party software in conjunction with our software, any undetected errors or defects in this third-party software could prevent the deployment or impair the functionality of our platform, delay new module introductions, result in a failure of our modules and injure our reputation. Our use of additional or alternative third-party software would require us to enter into license agreements with third parties.
If we cannot maintain our company culture as we grow, we could lose the innovation, teamwork, passion and focus on execution that we believe contribute to our success and our business may be harmed.
We believe that a critical component to our success has been our company culture, which is based on our core values of ensuring customer success, focusing on results and striving for excellence. We have invested substantial time and resources in building our team within this company culture. If we fail to
28
Table of Contents
preserve our culture, our ability to retain and recruit personnel and to effectively focus on and pursue our corporate objectives could be harmed. As we grow and develop the infrastructure of a public company, we may find it difficult to maintain these important aspects of our company culture. If we fail to maintain our company culture, our business may be harmed.
We depend on our senior management team and the loss of our chief executive officer or one or more key employees or an inability to attract and retain highly skilled employees could adversely affect our business.
Our success depends largely upon the continued services of our key executive officers. In particular, our chief executive officer, Robert Bernshteyn, is critical to our vision, strategic direction, culture and overall business success. We also rely on our leadership team in the areas of research and development, marketing, sales, services and general and administrative functions, and on mission-critical individual contributors in research and development. From time to time, there may be changes in our executive management team resulting from the hiring or departure of executives, which could disrupt our business. We do not maintain key-man insurance for Mr. Bernshteyn or any other member of our senior management team. We do not have employment agreements with our executive officers or other key personnel that require them to continue to work for us for any specified period and, therefore, they could terminate their employment with us at any time. The loss of one or more of our executive officers or key employees could have a serious adverse effect on our business.
To execute our growth plan, we must attract and retain highly qualified personnel. Competition for these personnel is intense, especially for engineers with high levels of experience in designing and developing software for Internet-related services. We have, from time to time, experienced, and we expect to continue to experience, difficulty in hiring and retaining employees with appropriate qualifications. Many of the companies with which we compete for experienced personnel have greater resources than we have. If we hire employees from competitors or other companies, their former employers may attempt to assert that these employees or our company have breached their legal obligations, resulting in a diversion of our time and resources. In addition, job candidates and existing employees in the San Francisco Bay Area often consider the value of the stock awards they receive in connection with their employment. If the perceived value of our stock awards declines, it may adversely affect our ability to recruit and retain highly skilled employees. If we fail to attract new personnel or fail to retain and motivate our current personnel, our business and future growth prospects could be adversely affected.
We may acquire other companies or technologies, which could divert our management’s attention, result in additional dilution to our stockholders and otherwise disrupt our operations and adversely affect our operating results.
We have in the past acquired and may in the future seek to acquire or invest in businesses, products or technologies that we believe could complement or expand our platform, enhance our technical capabilities or otherwise offer growth opportunities. The pursuit of potential acquisitions may divert the attention of management and cause us to incur various expenses in identifying, investigating and pursuing suitable acquisitions, whether or not they are consummated.
In addition, we have limited experience in acquiring other businesses. If we acquire additional businesses, we may not be able to integrate the acquired personnel, operations and technologies successfully, or effectively manage the combined business following the acquisition. We also may not achieve the anticipated benefits from the acquired business due to a number of factors, including:
| • | inability to integrate or benefit from acquired technologies or services in a profitable manner; |
| • | unanticipated costs or liabilities associated with the acquisition; |
| • | incurrence of acquisition-related costs; |
| • | difficulty integrating the accounting systems, operations and personnel of the acquired business; |
29
Table of Contents
| • | difficulties and additional expenses associated with supporting legacy products and hosting infrastructure of the acquired business; |
| • | difficulty converting the customers of the acquired business onto our platform and contract terms, including disparities in the revenues, licensing, support or professional services model of the acquired company; |
| • | diversion of management’s attention from other business concerns; |
| • | adverse effects to our existing business relationships with business partners and customers as a result of the acquisition; |
| • | the potential loss of key employees; |
| • | use of resources that are needed in other parts of our business; and |
| • | use of substantial portions of our available cash to consummate the acquisition. |
In addition, a significant portion of the purchase price of companies we acquire may be allocated to acquired goodwill and other intangible assets, which must be assessed for impairment at least annually. In the future, if our acquisitions do not yield expected returns, we may be required to take charges to our operating results based on this impairment assessment process, which could adversely affect our results of operations.
Acquisitions could also result in dilutive issuances of equity securities or the incurrence of debt, which could adversely affect our operating results. In addition, if an acquired business fails to meet our expectations, our operating results, business and financial position may suffer.
We may not be able to secure additional financing on favorable terms, or at all, to meet our future capital needs.
We have funded our operations since inception primarily through equity financings and prepayments by customers. We do not know when or if our operations will generate sufficient cash to fund our ongoing operations. In the future, we may require additional capital to respond to business opportunities, challenges, acquisitions, a decline in the level of customer prepayments or unforeseen circumstances and may determine to engage in equity or debt financings or enter into credit facilities for other reasons, and we may not be able to timely secure additional debt or equity financing on favorable terms, or at all. Any debt financing obtained by us in the future could involve restrictive covenants relating to our capital raising activities and other financial and operational matters, which may make it more difficult for us to obtain additional capital and to pursue business opportunities, including potential acquisitions. If we raise additional funds through further issuances of equity, convertible debt securities or other securities convertible into equity, our existing stockholders could suffer significant dilution in their percentage ownership of our company, and any new equity securities we issue could have rights, preferences and privileges senior to those of holders of our common stock. If we are unable to obtain adequate financing or financing on terms satisfactory to us, when we require it, our ability to continue to grow or support our business and to respond to business challenges could be significantly limited.
Our customers may fail to pay us in accordance with the terms of their agreements, necessitating action by us to compel payment.
We typically enter into multiple year, non-cancelable arrangements with customers of our services. If customers fail to pay us under the terms of our agreements, we may be adversely affected both from the inability to collect amounts due and the cost of enforcing the terms of our contracts, including litigation. The risk of such negative effects increases with the term length of our customer arrangements. Furthermore, some of our customers may seek bankruptcy protection or other similar relief and fail to pay amounts due to us, or pay those amounts more slowly, either of which could adversely affect our operating results, financial position and cash flow.
30
Table of Contents
Contractual disputes with our customers could be costly, time-consuming and harm our reputation.
Our business is contract intensive and we are party to contracts with our customers all over the world. Our contracts can contain a variety of terms, including service levels, security obligations, indemnification and regulatory requirements. Contract terms may not always be standardized across our customers and can be subject to differing interpretations, which could result in disputes with our customers from time to time. If our customers notify us of a contract breach or otherwise dispute our contract, the resolution of such disputes in a manner adverse to our interests could negatively affect our operating results.
Pursuant to agreements with certain of our customers, we have placed, and in the future may be required to place, in escrow, the source code of some of our modules. Under these escrow arrangements, the source code pertaining to the modules may, in specified circumstances, be made available to our customers. This factor may increase the likelihood of misappropriation or other misuse of our modules.
Catastrophic events may disrupt our business.
Our corporate headquarters are located in San Mateo, California, and our data centers are located both in the United States and abroad. The west coast of the United States contains active earthquake zones. Additionally, we rely on our network and third-party infrastructure and enterprise applications, internal technology systems and our website for our development, marketing, operational support, hosted services and sales activities. In the event of a major earthquake, hurricane or catastrophic event such as fire, power loss, telecommunications failure, cyber-attack, war or terrorist attack, we may be unable to continue our operations and may endure system interruptions, reputational harm, delays in our product development, lengthy interruptions in our services, breaches of data security and loss of critical data, all of which could have an adverse effect on our future operating results.
Changes in laws and regulations related to the Internet or changes in the Internet infrastructure itself may diminish the demand for our platform and could have a negative impact on our business.
The future success of our business depends upon the continued use of the Internet as a primary medium for commerce, communication and business applications. Federal, state or foreign government bodies or agencies have in the past adopted, and may in the future adopt, laws or regulations affecting the use of the Internet as a commercial medium. Changes in these laws or regulations could require us to modify our modules in order to comply with these changes. In addition, government agencies or private organizations may begin to impose taxes, fees or other charges for accessing the Internet or commerce conducted via the Internet. These laws or charges could limit the growth of Internet-related commerce or communications generally and result in reductions in the demand for Internet-based software.
In addition, the use of the Internet as a business tool could be adversely affected due to delays in the development or adoption of new standards and protocols to handle increased demands of Internet activity, security, reliability, cost, ease of use, accessibility and quality of service. The performance of the Internet and its acceptance as a business tool has been adversely affected by “viruses,” “worms” and other malicious programs, and the Internet has experienced a variety of outages and other delays as a result of damage to portions of its infrastructure. If the use of the Internet is adversely affected by these issues, demand for our platform could suffer.
The forecasts of market growth included in this prospectus may prove to be inaccurate, and, even if the markets in which we compete achieve the forecasted growth, we cannot assure you our business will grow at similar rates, if at all.
Growth forecasts are subject to significant uncertainty and are based on assumptions and estimates that may not prove to be accurate. The forecasts in this prospectus relating to the expected growth in the enterprise software applications, enterprise spend management software and SaaS markets may prove to
31
Table of Contents
be inaccurate. Even if these markets experience the forecasted growth described in this prospectus, we may not grow our business at similar rates, or at all. Our growth is subject to many factors, including our success in implementing our business strategy, which is subject to many risks and uncertainties. Accordingly, the forecasts of market growth included in this prospectus should not be taken as indicative of our future growth.
In connection with the audit of our consolidated financial statements for fiscal 2014, a material weakness was identified in our systems, processes and internal control over financial reporting. While we remediated this material weakness in fiscal 2015, we cannot provide assurance that additional material weaknesses will not occur in the future. If we are unable to implement and maintain effective internal controls over financial reporting in the future, investors may lose confidence in the accuracy and completeness of our financial reports and the market price of our common stock may be negatively affected.
As a public company, we will be required to maintain internal controls over financial reporting and to report any material weaknesses in such internal controls. Section 404 of the Sarbanes-Oxley Act of 2002 (the Sarbanes-Oxley Act) requires that we evaluate and determine the effectiveness of our internal controls over financial reporting and, beginning with our second annual report, provide a management report on the internal controls over financial reporting, which must be attested to by our independent registered public accounting firm to the extent we are no longer an “emerging growth company,” as defined by The Jumpstart Our Businesses Act of 2012 (the JOBS Act). If we have a material weakness in our internal controls over financial reporting, we may not detect errors on a timely basis and our financial statements may be materially misstated. We are in the process of designing and implementing the internal controls over financial reporting required to comply with this obligation, which process will be time consuming, costly and complicated.
In connection with the audit of our consolidated financial statements for the year ended January 31, 2014, a material weakness was identified in our internal control over financial reporting. A “material weakness” is a deficiency, or a combination of deficiencies, in internal control over financial reporting such that there is a reasonable possibility that a material misstatement of our annual or interim financial statements will not be prevented or detected on a timely basis. The material weakness that was identified related to our lack of resources within our finance function that resulted in a lack of timely reconciliations and a number of post-closing audit adjustments. Following this identification, we hired additional finance resources to improve the timeliness of our account reconciliations and minimize the number of post-closing adjustments, which resulted in the remediation of the material weakness in connection with the audit of our consolidated financial statements for the year ended January 31, 2015. While we remediated this material weakness in fiscal 2015, we can provide no assurance that we will not have material weaknesses in the future.
If we identify material weaknesses in our internal controls over financial reporting, if we are unable to comply with the requirements of Section 404 in a timely manner, if we are unable to assert that our internal controls over financial reporting are effective or if our independent registered public accounting firm is unable to express an opinion as to the effectiveness of our internal controls over financial reporting, investors may lose confidence in the accuracy and completeness of our financial reports and the market price of our common stock could be negatively affected, and we could become subject to investigations by the SEC, stock exchange or other regulatory authorities, which could require additional financial and management resources.
We will incur significantly increased costs and devote substantial management time as a result of operating as a public company.
As a public company, we will incur significant legal, accounting and other expenses that we did not incur as a private company. For example, we will be subject to the reporting requirements of the Securities
32
Table of Contents
Exchange Act of 1934, as amended, and will be required to comply with the applicable requirements of the Sarbanes-Oxley Act and the Dodd-Frank Wall Street Reform and Consumer Protection Act, as well as rules and regulations subsequently implemented by the SEC and the Nasdaq Global Select Market, including the establishment and maintenance of effective disclosure and financial controls and changes in corporate governance practices. We expect that compliance with these requirements will increase our legal and financial compliance costs and will make some activities more time consuming and costly. In addition, we expect that our management and other personnel will need to divert attention from operational and other
business matters to devote substantial time to these public company requirements. In particular, we expect to incur significant expenses and devote substantial management effort toward ensuring compliance with the requirements of Section 404 of the Sarbanes-Oxley Act, which will increase when we are no longer an emerging growth company, as defined by the JOBS Act. We will need to hire additional accounting and financial staff with appropriate public company experience and technical accounting knowledge and maintain an internal audit function. We cannot predict or estimate the amount of additional costs we may incur as a result of becoming a public company or the timing of such costs.
We are an emerging growth company and we cannot be certain if the reduced disclosure requirements applicable to emerging growth companies will make our common stock less attractive to investors.
We are an emerging growth company. Under the JOBS Act, emerging growth companies can delay adopting new or revised accounting standards until such time as those standards apply to private companies. We have irrevocably elected not to avail ourselves of this exemption from new or revised accounting standards and, therefore, we will be subject to the same new or revised accounting standards as other public companies that are not “emerging growth companies.”
For as long as we continue to be an emerging growth company, we intend to take advantage of certain exemptions from various reporting requirements that are applicable to other public companies including, but not limited to, reduced disclosure obligations regarding executive compensation in our periodic reports and proxy statements and exemptions from the requirements of holding a nonbinding advisory vote on executive compensation and stockholder approval of any golden parachute payments not previously approved. We cannot predict if investors will find our common stock less attractive because we will rely on these exemptions. If some investors find our common stock less attractive as a result, there may be a less active trading market for our common stock and our stock price may be more volatile.
We will remain an emerging growth company until the earliest of (i) the end of the fiscal year in which the market value of our common stock that is held by non-affiliates exceeds $700 million as of July 31, (ii) the end of the fiscal year in which we have total annual gross revenues of $1 billion or more during such fiscal year, (iii) the date on which we issue more than $1 billion in non-convertible debt in a three-year period or (iv) the end of the fiscal year that is five years from the date of this prospectus.
We may not be able to utilize a significant portion of our net operating loss or research tax credit carryforwards, which could adversely affect our potential profitability.
We have federal and state net operating loss carryforwards due to prior period losses, which if not utilized will begin to expire in 2026 and 2017 for federal and state purposes, respectively. These net operating loss carryforwards could expire unused and be unavailable to offset future income tax liabilities, which could adversely affect our potential profitability.
In addition, under Sections 382 and 383 of the Internal Revenue Code of 1986, as amended (the Code), our ability to utilize net operating loss carryforwards or other tax attributes, such as research tax credits, in any taxable year may be limited if we experience an “ownership change.” Such an “ownership change” generally occurs if one or more stockholders or groups of stockholders who own at least 5% of our stock increase their ownership by more than 50 percentage points over their lowest ownership percentage
33
Table of Contents
within a rolling three-year period. Similar rules may apply under state tax laws. While this offering may result in an ownership change, we do not believe it will trigger any material limitation on the use of our tax attributes for purposes of Section 382 of the Code. However, future issuances of our stock could cause an “ownership change.” It is possible that an ownership change, or any future ownership change, could have a material effect on the use of our net operating loss carryforwards or other tax attributes, which could adversely affect our potential profitability.
Adverse tax laws or regulations could be enacted or existing laws could be applied to us or our customers, which could increase the costs of our services and adversely affect our business.
The application of federal, state, local and international tax laws to services provided electronically is evolving. New income, sales, use or other tax laws, statutes, rules, regulations or ordinances could be enacted at any time (possibly with retroactive effect) and could be applied solely or disproportionately to services provided over the Internet. These enactments could adversely affect our sales activity due to the inherent cost increase the taxes would represent and ultimately result in a negative impact on our operating results and cash flows.
In addition, existing tax laws, statutes, rules, regulations or ordinances could be interpreted, changed, modified or applied adversely to us (possibly with retroactive effect), which could require us or our customers to pay additional tax amounts, as well as require us or our customers to pay fines or penalties and interest for past amounts. If we are unsuccessful in collecting such taxes from our customers, we could be held liable for such costs, thereby adversely affecting our operating results and cash flows.
Our reported financial results may be adversely affected by changes in accounting principles generally accepted in the United States.
Generally accepted accounting principles in the United States are subject to interpretation by the Financial Accounting Standards Board (FASB), the SEC and various bodies formed to promulgate and interpret appropriate accounting principles. A change in these principles or interpretations could have a significant effect on our reported financial results for periods prior and subsequent to such change. For example, recent new standards issued by the FASB that could materially impact our financial statements include revenue from contracts with customers, certain improvements to employee share-based payment accounting and accounting for leases. We may adopt one or more of these standards retrospectively to prior periods and the adoption may result in an adverse change to previously reported results. Additionally, the adoption of these standards may potentially require enhancements or changes in our systems and will require significant time and cost on behalf of our financial management. The prescribed periods of adoption of these standards and other pending changes in accounting principles generally accepted in the United States, are further discussed in “Management’s Discussion and Analysis of Financial Condition and Results of Operations—Recent Accounting Pronouncements.”
Risks Related to Our Initial Public Offering and Ownership of Our Common Stock
There has been no prior public market for our common stock, the stock price of our common stock may be volatile or may decline regardless of our operating performance and you may not be able to resell your shares at or above the initial public offering price.
There has been no public market for our common stock prior to our initial public offering. The initial public offering price for our common stock was determined through negotiations between the underwriters and us and may vary from the market price of our common stock following our initial public offering. If you purchase shares of our common stock in our initial public offering, you may not be able to resell those shares at or above the initial public offering price. An active or liquid market in our common stock may not develop upon closing of our initial public offering or, if it does develop, it may not be sustainable. The
34
Table of Contents
market price of our common stock may fluctuate significantly in response to numerous factors, many of which are beyond our control, including:
| • | overall performance of the equity markets; |
| • | our operating performance and the performance of other similar companies; |
| • | changes in our projected operating results that we provide to the public, our failure to meet these projections or changes in recommendations by securities analysts that elect to follow our common stock; |
| • | announcements of technological innovations, new software or enhancements to services, acquisitions, strategic alliances or significant agreements by us or by our competitors; |
| • | disruptions in our services due to computer hardware, software or network problems; |
| • | announcements of customer additions and customer cancellations or delays in customer purchases; |
| • | recruitment or departure of key personnel; |
| • | the economy as a whole, market conditions in our industry and the industries of our customers; |
| • | trading activity by a limited number of stockholders who together beneficially own a majority of our outstanding common stock; |
| • | the expiration of market standoff or contractual lock-up agreements; |
| • | the size of our market float; and |
| • | any other factors discussed in this prospectus. |
In addition, the stock markets have experienced extreme price and volume fluctuations that have affected and continue to affect the market prices of equity securities of many technology companies. Stock prices of many technology companies have fluctuated in a manner unrelated or disproportionate to the operating performance of those companies. In the past, stockholders have filed securities class action litigation following periods of market volatility. If we were to become involved in securities litigation, it could subject us to substantial costs, divert resources and the attention of management from our business and adversely affect our business.
Substantial blocks of our total outstanding shares may be sold into the market when “lock-up” or “market standoff” periods end. If there are substantial sales of shares of our common stock, the price of our common stock could decline.
The price of our common stock could decline if there are substantial sales of our common stock, particularly sales by our directors, executive officers, and significant stockholders, or if there is a large number of shares of our common stock available for sale. After this offering, we will have outstanding 48,110,957 shares of our common stock, based on the number of shares outstanding as of July 31, 2016. All of the shares of common stock sold in this offering will be available for sale in the public market. Substantially all of our outstanding shares of common stock are currently restricted from resale as a result of market standoff and “lock-up” agreements, as more fully described in “Shares Eligible for Future Sale.” These shares will become available to be sold 181 days after the date of this prospectus. Shares held by directors, executive officers and other affiliates will be subject to volume limitations under Rule 144 under the Securities Act of 1933, as amended, or the Securities Act, and various vesting agreements.
After our initial public offering, certain of our stockholders will have rights, subject to some conditions, to require us to file registration statements covering their shares to include their shares in registration statements that we may file for ourselves or our stockholders, subject to market standoff and lockup agreements. We also intend to register shares of common stock that we have issued and may issue under our employee equity incentive plans. Once we register these shares, they will be able to be sold freely in the public market upon issuance, subject to existing market standoff or lock-up agreements.
35
Table of Contents
Morgan Stanley & Co. LLC may, in its discretion, permit our stockholders to sell shares prior to the expiration of the restrictive provisions contained in those lock-up agreements.
The market price of the shares of our common stock could decline as a result of the sale of a substantial number of our shares of common stock in the public market or the perception in the market that the holders of a large number of shares intend to sell their shares.
We have broad discretion in the use of the net proceeds from our initial public offering and may not use them effectively.
We cannot specify with any certainty the particular uses of the net proceeds that we will receive from our initial public offering, but we currently expect such uses will include continued investment in developing technology to support our growth, increased investment in our sales team and marketing activities, as well as overall growth in our international operations. We will have broad discretion in the application of the net proceeds, including working capital, possible acquisitions and other general corporate purposes, and we may spend or invest these proceeds in a way with which our stockholders disagree. The failure by our management to apply these funds effectively could adversely affect our business and financial condition. Pending their use, we may invest the net proceeds from our initial public offering in a manner that does not produce income or that loses value. These investments may not yield a favorable return to our investors.
If securities or industry analysts do not publish research or publish inaccurate or unfavorable research about our business, our stock price and trading volume could decline.
The trading market for our common stock will depend in part on the research and reports that securities or industry analysts publish about us or our business. If few securities analysts commence coverage of us, or if industry analysts cease coverage of us, the trading price for our common stock would be negatively affected. If one or more of the analysts who cover us downgrade our common stock or publish inaccurate or unfavorable research about our business, our common stock price would likely decline. If one or more of these analysts cease coverage of us or fail to publish reports on us regularly, demand for our common stock could decrease, which might cause our common stock price and trading volume to decline.
If you purchase shares of our common stock in our initial public offering, you will experience substantial and immediate dilution.
If you purchase shares of our common stock in our initial public offering, you will experience substantial and immediate dilution in the pro forma net tangible book value per share of $14.09 per share as of July 31, 2016, based on the initial public offering price of our common stock of $17.00 per share, the midpoint of the price range on the cover page of this prospectus, because the price that you pay will be substantially greater than the pro forma net tangible book value per share of the common stock that you acquire. This dilution is due in large part to the fact that our earlier investors paid substantially less than the initial public offering price when they purchased their shares of our capital stock. You will experience additional dilution upon exercise of options to purchase common stock under our equity incentive plans, upon vesting of options to purchase common stock under our equity incentive plans, if we issue restricted stock to our employees under our equity incentive plans or if we otherwise issue additional shares of our common stock.
We do not intend to pay dividends for the foreseeable future.
We have never declared nor paid cash dividends on our capital stock. We currently intend to retain any future earnings to finance the operation and expansion of our business, and we do not expect to declare or pay any dividends in the foreseeable future. Consequently, stockholders must rely on sales of
36
Table of Contents
their common stock after price appreciation, which may never occur, as the only way to realize any future gains on their investment.
The concentration of our stock ownership will likely limit your ability to influence corporate matters, including the ability to influence the outcome of director elections and other matters requiring stockholder approval.
Based upon shares outstanding as of July 31, 2016, prior to this offering, our executive officers, directors and the holders of more than 5% of our outstanding common stock, in the aggregate, beneficially owned approximately 84.6% of our common stock, and upon the closing of this offering, that same group, in the aggregate, will beneficially own approximately 72.4% of our common stock, assuming no exercise by the underwriters of their over-allotment option, no exercise of outstanding options or warrants, and after giving effect to the issuance of shares in this offering. As a result, these stockholders, acting together, will have significant influence over all matters that require approval by our stockholders, including the election of directors and approval of significant corporate transactions. Corporate actions might be taken even if other stockholders, including those who purchase shares in this offering, oppose them. This concentration of ownership might also have the effect of delaying or preventing a change of control of our company that other stockholders may view as beneficial.
Delaware law and provisions in our amended and restated certificate of incorporation and amended and restated bylaws that will be in effect at the closing of our initial public offering could make a merger, tender offer or proxy contest difficult, thereby depressing the trading price of our Common stock.
Following the closing of our initial public offering, our status as a Delaware corporation and the anti-takeover provisions of the Delaware General Corporation Law may discourage, delay or prevent a change in control by prohibiting us from engaging in a business combination with an interested stockholder for a period of three years after the person becomes an interested stockholder, even if a change of control would be beneficial to our existing stockholders. In addition, our amended and restated certificate of incorporation and amended and restated bylaws that will be in effect at the closing of our initial public offering will contain provisions that may make the acquisition of our company more difficult, including the following:
| • | a classified board of directors with three-year staggered terms, which could delay the ability of stockholders to change the membership of a majority of our board of directors; |
| • | the ability of our board of directors to issue shares of preferred stock and to determine the price and other terms of those shares, including preferences and voting rights, without stockholder approval, which could be used to significantly dilute the ownership of a hostile acquiror; |
| • | the exclusive right of our board of directors to elect a director to fill a vacancy created by the expansion of our board of directors or the resignation, death or removal of a director, which prevents stockholders from being able to fill vacancies on our board of directors; |
| • | a prohibition on stockholder action by written consent, which forces stockholder action to be taken at an annual or special meeting of our stockholders; |
| • | the requirement that a special meeting of stockholders may be called only by a majority vote of our entire board of directors, the chairman of our board of directors or our chief executive officer, which could delay the ability of our stockholders to force consideration of a proposal or to take action, including the removal of directors; |
| • | the requirement for the affirmative vote of holders of at least 66 2/3% of the voting power of all of the then-outstanding shares of the voting stock, voting together as a single class, to amend the provisions of our amended and restated certificate of incorporation relating to the management of our business or our amended and restated bylaws, which may inhibit the ability of an acquiror to effect such amendments to facilitate an unsolicited takeover attempt; and |
37
Table of Contents
| • | advance notice procedures with which stockholders must comply to nominate candidates to our board of directors or to propose matters to be acted upon at a stockholders’ meeting, which may discourage or deter a potential acquiror from conducting a solicitation of proxies to elect the acquiror’s own slate of directors or otherwise attempting to obtain control of us. |
In addition, as a Delaware corporation, we are subject to Section 203 of the Delaware General Corporation Law. These provisions may prohibit large stockholders, in particular those owning 15% or more of our outstanding voting stock, from merging or combining with us for a certain period of time.
A Delaware corporation may opt out of this provision by express provision in its original certificate of incorporation or by amendment to its certificate of incorporation or bylaws approved by its stockholders. However, we have not opted out of this provision.
These and other provisions in our amended and restated certificate of incorporation, amended and restated bylaws and Delaware law could make it more difficult for stockholders or potential acquirers to obtain control of our board of directors or initiate actions that are opposed by our then-current board of directors, including delay or impede a merger, tender offer, or proxy contest involving our company. The existence of these provisions could negatively affect the price of our common stock and limit opportunities for you to realize value in a corporate transaction.
For information regarding these and other provisions, see “Description of Capital Stock.”
Our amended and restated certificate of incorporation provides that the Court of Chancery of the State of Delaware is the exclusive forum for substantially all disputes between us and our stockholders, which could limit our stockholders’ ability to obtain a favorable judicial forum for disputes with us or our directors, officers or employees.
Our amended and restated certificate of incorporation will provide that the Court of Chancery of the State of Delaware is the exclusive forum for any derivative action or proceeding brought on our behalf, any action asserting a breach of fiduciary duty, any action asserting a claim against us arising pursuant to the Delaware General Corporation Law, our certificate of incorporation or our bylaws or any action asserting a claim against us that is governed by the internal affairs doctrine. This choice of forum provision may limit a stockholder’s ability to bring a claim in a judicial forum that it finds favorable for disputes with us or our directors, officers or other employees and may discourage these types of lawsuits. Alternatively, if a court were to find the choice of forum provision contained in our amended and restated certificate of incorporation to be inapplicable or unenforceable in an action, we may incur additional costs associated with resolving such action in other jurisdictions.
38
Table of Contents
INFORMATION REGARDING FORWARD-LOOKING STATEMENTS
This prospectus includes forward-looking statements. All statements other than statements of historical facts contained in this prospectus, including statements regarding our future results of operations and financial position, customer lifetime value, strategy and plans, market size and opportunity, competitive position, industry environment, potential growth opportunities and our expectations for future operations, are forward-looking statements. The words “believe,” “may,” “will,” “estimate,” “continue,” “anticipate,” “design,” “intend,” “expect,” “could,” “plan,” “potential,” “predict,” “seek,” “should,” “would” or the negative version of these words and similar expressions are intended to identify forward-looking statements. We have based these forward-looking statements on our current expectations and projections about future events and trends that we believe may affect our financial condition, results of operations, strategy, short- and long-term business operations and objectives, and financial needs. The forward-looking statements are contained principally in “Prospectus Summary,” “Risk Factors,” “Management’s Discussion and Analysis of Financial Condition and Result of Operations” and “Business.”
These forward-looking statements are subject to a number of risks, uncertainties and assumptions, including those described in “Risk Factors.” Moreover, we operate in a very competitive and rapidly changing environment. New risks emerge from time to time. It is not possible for our management to predict all risks, nor can we assess the impact of all factors on our business or the extent to which any factor, or combination of factors, may cause actual results to differ materially from those contained in any forward-looking statements we may make. In light of these risks, uncertainties and assumptions, the forward-looking events and circumstances discussed in this prospectus may not occur and actual results could differ materially and adversely from those anticipated or implied in the forward-looking statements.
You should not rely upon forward-looking statements as predictions of future events. Although we believe that the expectations reflected in the forward-looking statements are reasonable, we cannot guarantee that the future results, levels of activity, performance or events and circumstances reflected in the forward-looking statements will be achieved or occur. Moreover, except as required by law, neither we nor any other person assumes responsibility for the accuracy and completeness of the forward-looking statements. We undertake no obligation to update publicly any forward-looking statements for any reason after the date of this prospectus to conform these statements to actual results or to changes in our expectations.
You should read this prospectus and the documents that we reference in this prospectus and have filed with the Securities and Exchange Commission as exhibits to the registration statement of which this prospectus is a part with the understanding that our actual future results, levels of activity, performance and events and circumstances may be materially different from what we expect.
39
Table of Contents
MARKET, INDUSTRY, AND OTHER DATA
We obtained the industry, market and competitive position data used throughout this prospectus from our own internal estimates and research, as well as from industry and general publications, in addition to research, surveys and studies conducted by third parties. Internal estimates are derived from publicly-available information released by industry analysts and third-party sources, our internal research and our industry experience, and are based on assumptions made by us based on such data and our knowledge of our industry and market, which we believe to be reasonable. In addition, while we believe the industry, market and competitive position data included in this prospectus is reliable and is based on reasonable assumptions, such data involves risks and uncertainties and are subject to change based on various factors, including those discussed in “Risk Factors.” These and other factors could cause results to differ materially from those expressed in the estimates made by the independent parties and by us.
Information based on estimates, forecasts, projections, market research, or similar methodologies is inherently subject to uncertainties, and actual events or circumstances may differ materially from events and circumstances that are assumed in this information. In some cases, we do not expressly refer to the sources from which data is derived.
Certain information in this prospectus is contained in independent industry publications. The source of these independent industry publications is provided below:
| 1) | International Data Corporation, Worldwide Semiannual Software Tracker, November 2015. |
| 2) | Gartner, Forecast: Public Cloud Services, Worldwide 2013-2019 4Q15 Update, December 2015. |
| 3) | Magic Quadrant for Procure to Pay Suites, Gartner, 13 June 2016. |
| 4) | Technavio market research sourced from ISI Securities EMIS, Global SaaS-based Expense Management Market, December 2013. |
| 5) | Accenture, Procurement BPO: You’re Missing the Point, August 2014. |
The Gartner reports described herein, (the “Gartner Reports”) represent research opinion or viewpoints published, as part of a syndicated subscription service, by Gartner, Inc. (“Gartner”), and are not representations of fact. Each Gartner Report speaks as of its original publication date (and not as of the date of this prospectus) and the opinions expressed in the Gartner Reports are subject to change without notice.
40
Table of Contents
We estimate that the net proceeds from this offering will be approximately $112.1 million, or $129.6 million if the underwriters exercise their option to purchase additional shares in full, after deducting underwriting discounts and commissions and estimated offering expenses payable by us, assuming an initial offering price of $17.00 per share, which is the midpoint of the price range set forth on the cover page of this prospectus.
The principal purposes of this offering are to increase our financial flexibility, increase our visibility in the marketplace and create a public market for our common stock. We expect to use the net proceeds from this offering for working capital and other general corporate purposes, which we currently expect will include continued investment in developing technology to support our growth, increased investment in our sales team and marketing activities, as well as overall growth in our international operations. However, we do not currently have specific planned uses for the proceeds. We may also use a portion of our net proceeds to acquire or invest in complementary products, technologies, or businesses; however, we currently have no agreements or commitments to complete any such transactions.
Since we expect to use the net proceeds from this offering for working capital and other general corporate purposes, our management will have broad discretion over the use of the net proceeds from this offering. As of the date of this prospectus, we intend to invest the net proceeds in short-term interest-bearing investment-grade securities, certificates of deposit or government securities.
We have never declared or paid any cash dividends on our capital stock, and we do not currently intend to pay any cash dividends on our capital stock in the foreseeable future. We currently intend to retain all available funds and any future earnings to support operations and to finance the growth and development of our business. Any future determination to pay dividends will be made at the discretion of our board of directors subject to applicable laws and will depend upon, among other factors, our results of operations, financial condition, contractual restrictions and capital requirements. Our future ability to pay cash dividends on our capital stock may also be limited by the terms of any future debt or preferred securities or future credit facility.
41
Table of Contents
The following table sets forth our cash and cash equivalents and capitalization as of July 31, 2016:
| • | on an actual basis; |
| • | on a pro forma basis to reflect: (i) the automatic conversion of all outstanding shares of our preferred stock into an aggregate of 34,610,979 shares of common stock; and (ii) the filing and effectiveness of our amended and restated certificate of incorporation immediately prior to the closing of this offering; and |
| • | on a pro forma as adjusted basis to give effect to (i) the pro forma adjustments set forth above and (ii) the sale and issuance of 7,400,000 shares of our common stock by us in this offering, based upon the receipt by us of the estimated net proceeds from this offering at the assumed initial public offering price of $17.00 per share, the midpoint of the price range set forth on the cover page of this prospectus, and after deducting the underwriting discounts and commissions and estimated offering expenses payable by us and the application of the net proceeds from this offering as described in “Use of Proceeds.” |
You should read this information together with our consolidated financial statements and related notes appearing elsewhere in this prospectus and the information set forth in “Selected Consolidated Financial and Other Data” and “Management’s Discussion and Analysis of Financial Condition and Results of Operations.”
| As of July 31, 2016 | ||||||||||||
| Actual | Pro Forma | Pro Forma As Adjusted(1) |
||||||||||
| (in thousands, except for share and per share amounts) |
||||||||||||
| Cash and cash equivalents |
$ | 79,943 | $ | 79,943 | $ | 192,037 | ||||||
|
|
|
|
|
|
|
|||||||
| Convertible preferred stock, $0.0001 par value per share: 133,875,417 shares authorized, 33,431,855 shares issued and outstanding, actual; no shares authorized, issued, and outstanding, pro forma and pro forma as adjusted |
$ | 164,950 | $ | — | $ | — | ||||||
| Stockholders’ equity (deficit): |
||||||||||||
| Preferred stock, $0.0001 par value, no shares authorized, issued or outstanding, actual; 25,000,000 shares authorized, pro forma and pro forma as adjusted, no shares issued and outstanding, pro forma and pro forma as adjusted |
— | — | — | |||||||||
| Common stock, $0.0001 par value, 225,000,000 shares authorized, 6,099,978 shares issued and outstanding, actual; 625,000,000 shares authorized, 40,710,957 shares issued and outstanding, pro forma; 625,000,000 shares authorized, 48,110,957 shares issued and outstanding, pro forma as adjusted |
1 | 4 | 5 | |||||||||
| Additional paid-in capital |
20,759 | 185,706 | 297,799 | |||||||||
| Accumulated deficit |
(147,174 | ) | (147,174 | ) | (147,174 | ) | ||||||
|
|
|
|
|
|
|
|||||||
| Total stockholders’ equity (deficit) |
(126,414 | ) | 38,536 | 150,630 | ||||||||
|
|
|
|
|
|
|
|||||||
| Total capitalization |
$ | 38,536 | $ | 38,536 | $ | 150,630 | ||||||
|
|
|
|
|
|
|
|||||||
| (1) | Each $1.00 increase (decrease) in the assumed initial offering price of $17.00 per share, the midpoint of the price range set forth on the cover page of this prospectus, would increase (decrease) each of additional paid-in capital, total stockholders’ equity and total capitalization by approximately $6.9 million, assuming that the number of shares offered by us, as set forth on the cover page of this prospectus, remains the same, and after deducting underwriting discounts and commissions and estimated |
42
Table of Contents
| offering expenses payable by us. We may also increase or decrease the number of shares we are offering. Each increase (decrease) of 1,000,000 shares in the number of shares offered by us would increase (decrease) each of additional paid-in-capital, total stockholders’ equity and total capitalization by approximately $15.8 million, assuming that the initial public offering price to the public remains the same, and after deducting the underwriting discounts and commissions and estimated offering expenses payable by us. The pro forma as adjusted information discussed above is illustrative only and will adjust based on the actual initial price to the public and other terms of this offering determined at pricing. |
The number of shares of common stock to be outstanding after this offering is based on 40,710,957 shares of common stock outstanding as of July 31, 2016, and excludes the following:
| • | 12,395,877 shares of common stock issuable upon the exercise of options outstanding as of July 31, 2016, with a weighted average exercise price of $4.40 per share; |
| • | 1,679,885 shares of common stock issuable upon the exercise of options granted after July 31, 2016, with a weighted average exercise price of $12.66 per share; |
| • | 36,971 shares of convertible preferred stock issuable upon the exercise of a warrant outstanding as of July 31, 2016 with an exercise price of $1.35 per share, that will convert into a warrant to purchase 36,971 shares of common stock upon completion of this offering; |
| • | 56,250 shares of common stock subject to restricted stock units outstanding as of July 31, 2016; and |
| • | 6,531,370 shares of common stock reserved for future issuance under our equity compensation plans, consisting of 1,212,620 shares of common stock that were reserved for issuance under our 2006 Stock Plan as of July 31, 2016, 4,500,000 shares of common stock reserved for issuance under the 2016 Equity Incentive Plan in effect following the completion of this offering and 818,750 shares of common stock reserved for issuance under the 2016 Employee Stock Purchase Plan in effect following the completion of this offering. On the date immediately prior to the date of this prospectus, we will cease granting awards under the 2006 Stock Plan. |
43
Table of Contents
If you invest in our common stock in this offering, your ownership interest will be immediately diluted to the extent of the difference between the assumed initial public offering price per share and the pro forma as adjusted net tangible book value per share of our common stock after this offering.
Historical net tangible book value (deficit) per share represents our total tangible assets less our liabilities and preferred stock that is not included in equity divided by the total number of common shares outstanding. As of July 31, 2016, our historical net tangible book value (deficit) was approximately $(140.7) million, or $(23.1) per share. Our pro forma net tangible book value as of July 31, 2016, was approximately $24.2 million, or $0.59 per share, after giving effect to the automatic conversion of all outstanding shares of our preferred stock into an aggregate of 34,610,979 shares of common stock immediately prior to the closing of this offering.
After giving further effect to receipt of the net proceeds of our sale of 7,400,000 shares of common stock at an assumed initial offering price of $17.00 per share, the midpoint of the price range set forth on the cover page of this prospectus and after deducting underwriting discounts and commissions and estimated offering expenses, our pro forma as adjusted net tangible book value as of July 31, 2016 would have been approximately $139.8 million, or $2.91 per share. This represents an immediate increase in pro forma as adjusted net tangible book value of $2.32 per share to our existing stockholders and an immediate dilution of $14.09 per share to investors purchasing common stock in this offering.
The following table illustrates this dilution to new investors on a per share basis:
| Assumed initial public offering price per share |
$ | 17.00 | ||||||
| Pro forma net tangible book value per share as of July 31, 2016 |
$ | 0.59 | ||||||
| Increase in pro forma net tangible book value per share attributable to new investors in this offering |
2.32 | |||||||
|
|
|
|||||||
| Pro forma as adjusted net tangible book value per share immediately after this offering |
2.91 | |||||||
|
|
|
|||||||
| Dilution in pro forma net tangible book value per share to new investors in this offering |
$ | 14.09 | ||||||
|
|
|
If the underwriters’ option to purchase additional shares in this offering is exercised in full, the pro forma as adjusted net tangible book value would be $3.20 per share, the increase in the pro forma net tangible book value per share for existing stockholders would be $2.61 per share and the dilution to new investors participating in this offering would be $13.80 per share.
Each $1.00 increase (decrease) in the assumed initial public offering price of $17.00 per share, the midpoint of the price range set forth on the cover page of this prospectus, would increase (decrease) the pro forma as adjusted net tangible book value, by $0.14 per share and the dilution per share to new investors by $0.86 per share, assuming the number of shares offered by us, as set forth on the cover page of this prospectus, remains the same, after deducting underwriting discounts and commissions and estimated offering expenses.
We may also increase or decrease the number of shares we are offering. An increase of 1,000,000 shares in the number of shares we are offering would increase our pro forma as adjusted net tangible book value by approximately $15.8 million, or $0.26 per share, and the pro forma dilution per share to investors in this offering by $0.26 per share, assuming that the assumed initial public offering price remains the same, and after deducting underwriting discounts and commissions and estimated offering expenses. A decrease of 1,000,000 shares in the number of shares we are offering would decrease our pro forma as adjusted net tangible book value by approximately $15.8 million, or $0.27 per share, and the pro forma dilution per share to investors in this offering by $0.27 per share, assuming that the assumed initial public
44
Table of Contents
offering price remains the same, and after deducting underwriting discounts and commissions and estimated offering expenses. The pro forma information discussed above is illustrative only and will change based on the actual initial public offering price, number of shares and other terms of this offering determined at pricing.
The table below summarizes, as of July 31, 2016, on the pro forma basis described above, the number of shares of our common stock, the total consideration, and the average price per share (i) paid to us by our existing stockholders and (ii) to be paid by new investors participating in this offering at an assumed initial public offering price of $17.00 per share, the midpoint of the price range set forth on the cover page of this prospectus, before deducting underwriting discounts and commissions and estimated offering expenses payable by us.
| Shares Purchased | Total Consideration | Average Price Per Share |
||||||||||||||||||
| Number | Percent | Amount | Percent | |||||||||||||||||
| (in thousands, except share, per share and percentages) | ||||||||||||||||||||
| Existing stockholders |
40,710,957 | 84.6 | % | $ | 45,467,450 | 26.5 | % | $ | 1.12 | |||||||||||
| New investors |
7,400,000 | 15.4 | 125,800,000 | 73.5 | 17.00 | |||||||||||||||
|
|
|
|
|
|
|
|
|
|||||||||||||
| Total |
48,110,957 | 100.0 | % | $ | 171,267,450 | 100.0 | % | |||||||||||||
|
|
|
|
|
|
|
|
|
|||||||||||||
In addition, if the underwriters’ option to purchase additional shares is exercised in full, the number of shares held by existing stockholders will be reduced to 82.7% of the total number of shares of common stock to be outstanding upon completion of this offering, and the number of shares of common stock held by new investors participating in this offering will be further increased to 17.3% of the total number of shares of common stock to be outstanding upon completion of the offering.
Each $1.00 increase (decrease) in the assumed initial public offering price of $17.00 per share would increase (decrease) total consideration paid by new investors by $7,400,000 and increase (decrease) the percent of total consideration paid by new investors by 1.1%, assuming the number of shares we are offering, as set forth on the cover page of this prospectus, remains the same, after deducting underwriting discounts and commissions and estimated offering expenses payable by us. We may also increase or decrease the number of shares we are offering. An increase (decrease) of 1,000,000 in the number of shares offered by us would increase (decrease) total consideration paid by new investors by $17,000,000, assuming that the assumed initial price to the public remains the same, and after deducting the underwriting discounts and commissions and estimated offering expenses payable by us.
See “Prospectus Summary—The Offering” for a description of those shares that are or are not reflected in the foregoing tables or discussion.
To the extent that any outstanding options are or the warrant is exercised, the RSUs are settled or new awards are granted under our equity compensation plans, new investors will experience further dilution.
45
Table of Contents
SELECTED CONSOLIDATED FINANCIAL AND OTHER DATA
The following selected consolidated financial data should be read in conjunction with “Management’s Discussion and Analysis of Financial Condition and Results of Operations” and the consolidated financial statements and related notes included within this prospectus. The consolidated statement of operations data for the fiscal years ended January 31, 2015 and 2016, and the consolidated balance sheet data as of January 31, 2015 and 2016, are derived from our audited consolidated financial statements and related notes included elsewhere in this prospectus. The consolidated statement of operations data for the six months ended July 31, 2015 and 2016, and the consolidated balance sheet data as of July 31, 2016, are derived from our unaudited consolidated financial statements and related notes included elsewhere in this prospectus. We have prepared the unaudited consolidated financial statements on the same basis as the audited consolidated financial statements and have included all adjustments, consisting only of normal recurring adjustments that, in our opinion, are necessary to state fairly the financial information set forth in those statements. Our historical results are not necessarily indicative of our future results, and the results of operations for the six months ended July 31, 2016, are not necessarily indicative of the results to be expected for the full fiscal year or any other period. The selected consolidated financial data in this section are not intended to replace our consolidated financial statements and the related notes, and are qualified in their entirety by the consolidated financial statements and related notes included elsewhere in this prospectus.
| Year ended January 31, |
Six months ended July 31, |
|||||||||||||||
| 2015 | 2016 | 2015 | 2016 | |||||||||||||
| (in thousands, except per share data) | ||||||||||||||||
| Consolidated Statements of Operations Data: |
||||||||||||||||
| Revenues: |
||||||||||||||||
| Subscription services |
$ | 43,051 | $ | 75,667 | $ | 31,622 | $ | 53,155 | ||||||||
| Professional services and other |
7,794 | 8,011 | 2,891 | 7,160 | ||||||||||||
|
|
|
|
|
|
|
|
|
|||||||||
| Total revenues |
50,845 | 83,678 | 34,513 | 60,315 | ||||||||||||
|
|
|
|
|
|
|
|
|
|||||||||
| Cost of revenues: |
||||||||||||||||
| Subscription services(1) |
8,813 | 16,804 | 7,545 | 12,079 | ||||||||||||
| Professional services and other(1) |
9,911 | 15,107 | 6,233 | 11,420 | ||||||||||||
|
|
|
|
|
|
|
|
|
|||||||||
| Total cost of revenues |
18,724 | 31,911 | 13,778 | 23,499 | ||||||||||||
|
|
|
|
|
|
|
|
|
|||||||||
| Gross profit |
32,121 | 51,767 | 20,735 | 36,816 | ||||||||||||
|
|
|
|
|
|
|
|
|
|||||||||
| Operating expenses: |
||||||||||||||||
| Research and development(1) |
11,887 | 22,767 | 10,223 | 15,046 | ||||||||||||
| Sales and marketing(1) |
33,724 | 54,713 | 24,211 | 35,088 | ||||||||||||
| General and administrative(1) |
13,146 | 19,540 | 11,199 | 10,173 | ||||||||||||
|
|
|
|
|
|
|
|
|
|||||||||
| Total operating expenses |
58,757 | 97,020 | 45,633 | 60,307 | ||||||||||||
|
|
|
|
|
|
|
|
|
|||||||||
| Loss from operations |
(26,636 | ) | (45,253 | ) | (24,898 | ) | (23,491 | ) | ||||||||
| Other expense, net |
(563 | ) | (568 | ) | (131 | ) | (523 | ) | ||||||||
|
|
|
|
|
|
|
|
|
|||||||||
| Loss before provision for income taxes |
(27,199 | ) | (45,821 | ) | (25,029 | ) | (24,014 | ) | ||||||||
| Provision for income taxes |
101 | 335 | 118 | 291 | ||||||||||||
|
|
|
|
|
|
|
|
|
|||||||||
| Net loss and comprehensive loss |
$ | (27,300 | ) | $ | (46,156 | ) | $ | (25,147 | ) | $ | (24,305 | ) | ||||
|
|
|
|
|
|
|
|
|
|||||||||
| Net loss per share attributable to common stockholders, basic and diluted(2) |
$ | (9.10 | ) | $ | (9.81 | ) | $ | (5.78 | ) | $ | (4.25 | ) | ||||
|
|
|
|
|
|
|
|
|
|||||||||
| Weighted-average number of shares used in computing net loss per share attributable to common stockholders, basic and diluted(2) |
2,999 | 4,704 | 4,351 | 5,721 | ||||||||||||
|
|
|
|
|
|
|
|
|
|||||||||
| Pro forma net loss per share attributable to common stockholders, basic and diluted(2) |
$ | (1.22 | ) | $ | (0.60 | ) | ||||||||||
|
|
|
|
|
|||||||||||||
| Weighted-average number of shares used in computing pro forma net loss per share attributable to common stockholders, basic and diluted(2) |
37,795 | 40,332 | ||||||||||||||
|
|
|
|
|
|||||||||||||
46
Table of Contents
| (1) | Includes stock-based compensation expense as follows: |
| Year ended January 31, |
Six months ended July 31, |
|||||||||||||||
| 2015 | 2016 | 2015 | 2016 | |||||||||||||
| (in thousands) | ||||||||||||||||
| Cost of revenues: |
||||||||||||||||
| Subscription services |
$ | 109 | $ | 235 | $ | 99 | $ | 265 | ||||||||
| Professional services and other |
110 | 1,014 | 885 | 244 | ||||||||||||
| Research and development |
337 | 1,236 | 857 | 625 | ||||||||||||
| Sales and marketing |
433 | 1,347 | 386 | 911 | ||||||||||||
| General and administrative |
818 | 6,736 | 5,806 | 1,220 | ||||||||||||
|
|
|
|
|
|
|
|
|
|||||||||
| Total stock-based compensation |
$ | 1,807 | $ | 10,568 | $ | 8,033 | $ | 3,265 | ||||||||
|
|
|
|
|
|
|
|
|
|||||||||
| (2) | See Note 14 to our consolidated financial statements for an explanation of the method used to calculate basic and diluted and pro forma net loss per common share attributable to common stockholders. |
| As of January 31, | As of July 31, | |||||||||||
| 2015 | 2016 | 2016 | ||||||||||
| (in thousands) | ||||||||||||
| Consolidated Balance Sheet Data: |
||||||||||||
| Cash and cash equivalents |
$ | 41,974 | $ | 92,348 | $ | 79,943 | ||||||
| Working capital |
13,278 | 48,601 | 25,105 | |||||||||
| Total assets |
69,606 | 139,926 | 129,208 | |||||||||
| Deferred revenue, current and non-current |
40,739 | 64,926 | 72,136 | |||||||||
| Convertible preferred stock |
88,444 | 164,950 | 164,950 | |||||||||
| Total stockholders’ deficit |
(72,569 | ) | (106,239 | ) | (126,414 | ) | ||||||
Non-GAAP Financial Measures
In addition to our results determined in accordance with U.S. generally accepted accounting principles, or GAAP, we believe the following non-GAAP measure is useful in evaluating our operating performance. We regularly review the measure set forth below as we evaluate our business.
| Year ended January 31, |
Six months ended July 31, |
|||||||||||||||
| 2015 | 2016 | 2015 | 2016 | |||||||||||||
| (in thousands) | ||||||||||||||||
| Other Financial Data: |
||||||||||||||||
| Non-GAAP operating loss |
$ | (17,818 | ) | $ | (32,355 | ) | $ | (15,296 | ) | $ | (19,644 | ) | ||||
We define non-GAAP operating loss as operating loss before stock-based compensation, litigation-related costs and amortization of acquired intangible assets.
We believe non-GAAP operating loss provides investors and other users of our financial information consistency and comparability with our past financial performance and facilitates period to period comparisons of operations. We believe non-GAAP operating loss is useful in evaluating our operating performance compared to that of other companies in our industry, as this metric generally eliminates the effects of certain items that may vary for different companies for reasons unrelated to overall operating performance.
We use non-GAAP operating loss in conjunction with traditional GAAP measures as part of our overall assessment of our performance, including the preparation of our annual operating budget and quarterly forecasts, to evaluate the effectiveness of our business strategies and to communicate with our
47
Table of Contents
board of directors concerning our financial performance. Our definition may differ from the definitions used by other companies and therefore comparability may be limited. In addition, other companies may not publish this or similar metrics. Thus, our non-GAAP operating loss should be considered in addition to, not as substitutes for, or in isolation from, measures prepared in accordance with GAAP.
We compensate for these limitations by providing investors and other users of our financial information a reconciliation of non-GAAP operating loss to loss from operations, the related GAAP financial measure. We encourage investors and others to review our financial information in its entirety, not to rely on any single financial measure and to view non-GAAP operating loss in conjunction with loss from operations. The following table provides a reconciliation of loss from operations to non-GAAP operating loss:
| Year ended January 31, |
Six months ended July 31, |
|||||||||||||||
| 2015 | 2016 | 2015 | 2016 | |||||||||||||
| (in thousands) | ||||||||||||||||
| Loss from operations |
$ | (26,636 | ) | $ | (45,253 | ) | $ | (24,898 | ) | $ | (23,491 | ) | ||||
| Stock-based compensation |
1,807 | 10,568 | 8,033 | 3,265 | ||||||||||||
| Litigation-related costs |
6,958 | 1,943 | 1,490 | 150 | ||||||||||||
| Amortization of acquired intangible assets |
53 | 387 | 79 | 432 | ||||||||||||
|
|
|
|
|
|
|
|
|
|||||||||
| Non-GAAP operating loss |
$ | (17,818 | ) | $ | (32,355 | ) | $ | (15,296 | ) | $ | (19,644 | ) | ||||
|
|
|
|
|
|
|
|
|
|||||||||
48
Table of Contents
MANAGEMENT’S DISCUSSION AND ANALYSIS OF FINANCIAL CONDITION
AND RESULTS OF OPERATIONS
The following discussion and analysis of our financial condition and results of operations should be read in conjunction with the “Selected Consolidated Financial and Other Data” and our financial statements and related notes included elsewhere in this prospectus. This discussion contains forward-looking statements that involve risks and uncertainties. Our actual results could differ materially from those discussed below. Factors that could cause or contribute to such differences include, but are not limited to, those identified below and those discussed in “Risk Factors” and “Information Regarding Forward-Looking Statements” included elsewhere in this prospectus.
Overview
We are the leading provider of a unified, cloud-based spend management platform that connects more than 460 organizations with more than 2 million suppliers globally.
Our platform provides greater visibility into and control over how companies spend money. Using our platform, businesses are able to achieve real, measurable value and savings that drive their profitability; we call this “Value as a Service.” We refer to the process companies use to purchase goods and services as spend management and to the money that they manage with this process as spend under management. From our inception, our customers have used our platform to bring more than $250 billion of their spend under management, which we estimate has resulted in more than $8 billion of customer savings to date. We calculate this estimate by applying certain savings rates derived from industry benchmarks.
We offer a unified, cloud-based spend management platform that is tightly integrated and delivers a broad range of capabilities that would otherwise require the purchase and use of multiple disparate point applications. The core of our platform consists of procurement, invoicing and expense management modules that form our transactional engine and capture a company’s spend. In addition, our platform offers supporting modules, including sourcing, analytics, contract management, supplier management, inventory management and storefront, that help companies further manage their spend. Moreover, through our free Coupa Open Business Network, suppliers of all sizes can easily interact with buyers electronically, thus significantly reducing paper, improving operating efficiencies and reducing costs.
49
Table of Contents
Since our formation in 2006, we have invested in building an integrated platform to deliver cloud-based applications to global businesses. We believe we are enabling our industry and customers to experience a transformation from manual processes, antiquated networks and disparate point applications to our modern, unified, cloud-based solution. The amount of spend that we manage through our platform and the value and savings we enable our customers to achieve has rapidly grown over the past several years.
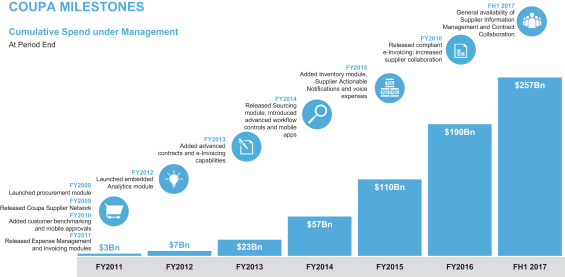
The cumulative spend under management metrics presented above do not directly correlate to our revenue or results of operations because we do not charge our customers based on actual usage of our platform. However, we believe the cumulative spend under management metrics do illustrate the adoption, scale and value of our platform, which we believe enhances our ability to maintain existing customers and attract new customers.
We also estimate the amount of value and savings that our platform has generated for our customers since we launched our platform. We calculate this estimate by applying certain savings rates, including those related to processing efficiency and early payment discounts, to the amount of spend managed through our platform. These savings rates are derived from industry benchmarks.
We offer access to our platform under a Software-as-a-Service (SaaS) business model. At the time of initial deployment, our customers often make a set of common functions available to the majority of their employees, as well as incremental modules for regular employees and procurement specialists, which we refer to as power users. Therefore, we are typically able to capture most of the expected annual recurring revenue opportunity at the inception of our customer relationships, rather than targeting specific power users at the outset of the customer relationship with the intention of expanding and getting more annual recurring revenue at later stages of the customer relationship. Customers can rapidly implement our platform, with implementation periods typically ranging from a few weeks to several months. Customers also benefit from automatic software updates with virtually no downtime.
We market and sell our solutions to a broad range of enterprises worldwide. We primarily focus our selling efforts on larger enterprises. Our diverse customer base includes large, global companies and our direct sales force targets organizations with more than 1,000 employees. As of July 31, 2016, we had more than 460 customers. We have a diverse, multi-national customer base spanning various industries and no significant customer concentration. No customer accounted for more than 10% of our total revenues for the fiscal years ended January 31, 2015 or 2016 or for the six months ended July 31, 2016.
50
Table of Contents
We market our platform primarily through a direct sales force and also benefit from leads driven by our partner ecosystem. Our initial contract terms are typically three years, although some customers commit for shorter periods. Substantially all of our customers pay annually, one year in advance. We provide a scaled pricing model based on the number of users per module—as the number of users increases, the subscription price per user decreases. Our subscription fee includes access to our service, technical support and management of the hosting infrastructure. We generally recognize revenues from our subscription fees ratably over the contractual term of the arrangement. We do not charge suppliers who are on our platform to transact with our customers. We believe this approach helps attract more suppliers to our platform and increases the value of our platform to customers. The number of suppliers on our platform has grown to more than 2 million.
We have continued to make significant expenditures and investments for long-term growth, including investment in our platform and infrastructure to deliver new functionality and modules to meet the evolving needs of our customers and to take advantage of our market opportunity. We intend to continue to increase our investment in sales and marketing, as we further expand our sales teams, increase our marketing activities, and grow our international operations. Internationally, we currently offer our platform in Europe, Middle East and Africa (EMEA) and Asia-Pacific (APAC). The combined revenues from non-U.S. regions, as determined based on the billing address of our customers, constituted 25% and 28%, respectively, of our total revenues for the fiscal years ended January 31, 2015 and 2016, and 28% and 29%, respectively, for the six months ended July 31, 2015 and 2016. We believe there is further opportunity to increase our international revenues in absolute dollars and as a percentage of our total revenues. As a result, we are increasingly investing in our international operations and we intend to expand our footprint in international markets.
Operating in international markets requires significant resources and management attention and will subject us to regulatory, economic and political risks that are different from those in the United States. Because of our limited experience with international operations, our international expansion efforts may not be successful in creating additional demand for our platform outside of the United States or in effectively selling subscriptions to our platform in all of the international markets we enter.
As a result of the broad adoption of our platform by a growing set of customers, we have grown rapidly in recent periods, with revenues for the fiscal years ended January 31, 2015 and 2016, of $50.8 million and $83.7 million, respectively, representing year-over-year growth of 65%. For the six months ended July 31, 2015 and 2016, our revenues were $34.5 million and $60.3 million, respectively, representing an increase of 75%. Our net losses were $27.3 million and $46.2 million, respectively, for the fiscal years ended January 31, 2015 and 2016. For the six months ended July 31, 2015 and 2016, our net losses were $25.1 million and $24.3 million, respectively.
Our Business Model
Our business model focuses on maximizing the lifetime value of a customer relationship, and we continue to make significant investments in order to grow our customer base. Due to our subscription model, we recognize subscription revenues ratably over the term of the subscription period. As a result, the profitability of a customer to our business in any particular period depends in part upon how long a customer has been a subscriber on our platform. In general, the associated upfront costs with respect to new customers are higher in the first year than the aggregate revenues we recognize from those new customers in the first year. We believe that, over time, as our customer base grows and a relatively higher percentage of our subscription revenues are attributable to renewals versus new customers or upsells to existing customers, associated sales and marketing expenses and other allocated upfront costs as a percentage of revenues will decrease, subject to investments we plan to make in our business. Over the lifetime of the customer relationship, we also incur sales and marketing costs to manage the account, renew or upsell the customer to more modules and more users. However, these costs are significantly less
51
Table of Contents
than the costs initially incurred to acquire the customer. We calculate the lifetime value of our customers and associated customer acquisition costs for a particular year by comparing (i) gross profit from net new subscription revenues for the year multiplied by the inverse of the estimated subscription renewal rate to (ii) total sales and marketing expense incurred in the preceding year. On this basis, we estimate that for each of fiscal 2014, 2015 and 2016, the calculated lifetime value of our customers has exceeded six times the associated cost of acquiring them.
To further illustrate the economics of our customer relationships, we are providing a contribution margin analysis of the customers we acquired during the fiscal year ended January 31, 2013, which we will refer to as the 2013 Cohort. We selected the 2013 Cohort as a representative set of customers for this analysis to help investors understand the potential long-term value of our customer base, and we believe the 2013 Cohort is a fair representation of our overall customer base. We define contribution margin for a period as the subscription revenue from the customer cohort in such period less the estimated, allocated variable costs for the period associated with such revenues. The costs allocated to customers include personnel costs associated with the sales and marketing teams that acquire the customer, such as salaries, sales commissions and marketing program expenses. As the majority of our sales and marketing costs are related to the acquisition of new customers, these costs are mainly allocated to the newest cohort in a given period, with the exception of ongoing account management costs, which are estimated based on the number of account managers as a percentage of our total sales headcount. Costs allocated to customers also include the costs associated with use of our technology infrastructure and web hosting, as well as personnel costs associated with our operations and customer success teams that support the customer.
The support, technology infrastructure and web hosting expenses, in any particular period, are allocated based on the 2013 Cohort revenue as a percentage of the total subscription revenue in the period. We exclude all research and development and general and administrative expenses from this analysis because these expenses support the growth of our business generally.
52
Table of Contents
We define contribution margin percentage as contribution margin divided by subscription revenue associated with such cohort in a given period. We have measured the 2013 Cohort with respect to contribution margin percentage. In the fiscal year ended January 31, 2013, we recognized $4.0 million in subscription revenue from the 2013 Cohort and incurred associated costs that resulted in a negative contribution margin percentage of (249%). Since we acquired this cohort through the course of the year, less than a full year’s subscription revenue is reflected in the fiscal year ended January 31, 2013. In the fiscal years ended January 31, 2014, 2015 and 2016 we realized $9.9 million, $10.0 million and $10.1 million in subscription revenues from the 2013 Cohort with contribution margin percentages of 75%, 75% and 74%, respectively. These metrics are highlighted below:
2013 Customer Cohort Contribution Margins
$ millions
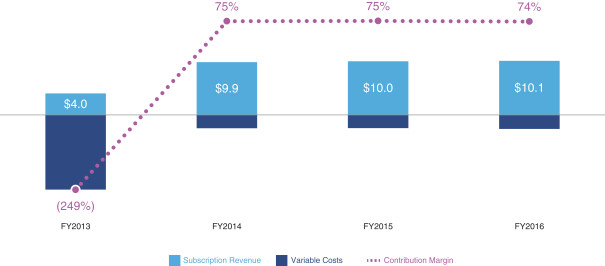
The contribution margin of our customer cohorts will fluctuate from one period to another depending upon the number of customers remaining in each cohort, upsells of additional features and modules, and changes in customer subscription fees, as well as changes in our variable costs. We may not experience similar financial outcomes from future customers who subscribe to our platform.
The allocated expenses or relationship of subscription revenues to variable costs is not necessarily indicative of future performance and we cannot predict whether future contribution margin analyses will be similar to the above analysis. Other companies may calculate contribution margin differently than our chosen method and, therefore, may not be directly comparable. We have not yet achieved profitability, and even if our revenues exceed these variable costs over time, we may not be able to achieve or maintain profitability.
53
Table of Contents
Key Metrics
We review the following key metrics to evaluate our business, measure our performance, identify trends affecting our business, formulate business plans and make strategic decisions:
| As of January 31, |
As of July 31, |
|||||||||||
| 2015 | 2016 | 2016 | ||||||||||
| Cumulative Spend Under Management ($ billions) |
$ | 110.1 | $ | 189.5 | $ | 256.8 | ||||||
| Backlog ($ millions) |
$ | 82.4 | $ | 131.8 | $ | 145.1 | ||||||
| Deferred Revenue ($ millions) |
$ | 40.7 | $ | 64.9 | $ | 72.1 | ||||||
| Total Customers |
312 | 414 | 465 | |||||||||
Cumulative Spend Under Management
Cumulative spend under management represents the aggregate amount of money that has been transacted through our platform for all of our customers collectively since we launched our platform. We calculate this metric by aggregating the actual transaction data, such as invoices or purchase orders, from customers on our platform. While we do not believe this metric is directly correlated to our financial results, we believe the adoption of our platform, as evidenced by growth in cumulative spend under management, drives additional value to our customers, which will enhance our ability to acquire new customers, to increase renewals and to increase upsells due to an increase in the number of authorized users and modules per customer.
Backlog and Deferred Revenue
Backlog represents future non-cancellable amounts to be invoiced under our agreements. We generally sign multiple-year subscription contracts and invoice an initial annual amount at contract signing followed by subsequent annual invoices. At any point in the contract term, there can be amounts that we have not yet been contractually able to invoice. Until such time as these amounts are invoiced, they are not recorded in revenues, deferred revenue, accounts receivable or elsewhere in our consolidated financial statements, and are considered by us to be backlog. We expect backlog to fluctuate up or down from period to period for several reasons, including the timing and duration of customer contracts, varying billing cycles and the timing and duration of customer renewals. We reasonably expect approximately half of our backlog as of January 31, 2016, will be invoiced during the fiscal year ended January 31, 2017, primarily due to the fact that our contracts are typically three years in length.
In addition, our deferred revenue consists of amounts that have been invoiced but that have not yet been recognized as revenues as of the end of a reporting period. The majority of our deferred revenue balance consists of subscription revenues that are recognized ratably over the contractual period. Together, the sum of deferred revenue and backlog represents the total billed and unbilled contract value yet to be recognized in revenues, and provides visibility into future revenue streams. Greater than 70% of the revenues recognized during each of the fiscal years ended January 31, 2016 and 2015 were comprised of (1) the short-term deferred revenue balance at the beginning of the year, plus (2) the backlog at the beginning of the year that was recognized during that year, plus (3) renewals that occurred during the year for customers in existence at the beginning of the year.
Total Customers
We define a customer as a separate and distinct buying entity, such as a company, an educational or government institution, or a distinct business unit of a large corporation that has an active contract with us or our partner to access our services. We believe the number of total customers is a key indicator of our market penetration, growth and future revenues. Our ability to attract new customers is primarily affected
54
Table of Contents
by the effectiveness of our marketing programs and our direct sales force. Accordingly, we have aggressively invested in and intend to continue to invest in our direct sales force. In addition, we are continuing to pursue additional partnerships with global systems integrators and other strategic partners.
Components of Results of Operations
Revenues
We offer subscriptions to our cloud-based spend management platform, including procurement, invoicing and expense management. We derive our revenues primarily from subscription fees and professional services fees. Subscription revenues consist primarily of fees to provide our customers access to our cloud-based platform, which includes routine customer support at no additional cost. Professional service fees include deployment services, optimization services, and training.
Subscription revenues accounted for approximately 85% and 90%, respectively, of our revenues for the fiscal years ended January 31, 2015 and 2016, and 92% and 88%, respectively, of our revenues for the six months ended July 31, 2015 and 2016. Subscription revenues are a function of the number of customers, the number of users at each customer, the number of modules subscribed to by each customer, the price of our modules, and renewal rates.
Subscription fees are recognized ratably as revenues over the contract term beginning on the date the application is made available to the customer. Our new business subscriptions typically have a term of three years, although some of our customers opt for a shorter period. We generally invoice our customers in annual installments at the beginning of each year in the subscription period. Amounts that have been invoiced are initially recorded as deferred revenue and are recognized ratably over the subscription period. Amounts that have not been invoiced are not reflected in our consolidated financial statements.
Professional services revenues consist primarily of fees associated with the implementation and configuration of our subscription service. Professional services are generally sold on a fixed-fee or time-and-materials basis. Revenue for time-and-material arrangements is recognized as the services are performed. For fixed-fee and other types of arrangements, revenue is generally deferred and recognized upon the completion of the project under the completed performance method of accounting.
Our professional services engagements typically span from a few weeks to several months, which makes it somewhat difficult to predict the timing of revenue recognition for such services. The terms of our typical professional services arrangements provide that our customers pay us within 30 days of invoice. Fixed-fee services arrangements are generally invoiced in advance. We have made significant investments in our professional services business that are designed to ensure customer success and adoption of our platform. We recently accelerated our investment in expanding our professional services partner ecosystem to further support our customers. As the professional services practices of our partner firms continue to develop, we expect them to increasingly contract directly with our subscription customers and we incentivize our sales force to further this objective.
Cost of Revenues
Subscription Services
Cost of subscription services consists primarily of expenses related to hosting our service and providing customer support. Significant expenses are comprised of data center capacity costs; personnel and related costs directly associated with our cloud infrastructure and customer support, including salaries, benefits, bonuses and stock-based compensation; allocated overhead; and amortization of developed technology.
Professional Services and Other Cost of Revenues
Cost of professional services and other cost of revenues consist primarily of personnel and related costs directly associated with our professional services and training departments, including salaries,
55
Table of Contents
benefits, bonuses and stock-based compensation; the costs of contracted third-party vendors; and allocated overhead. These costs are generally expensed in the period incurred; therefore, the costs associated with our professional services revenues often do not align with the period in which the corresponding professional services revenues are recognized because we are currently using the completed performance method of accounting for professional services revenues under fixed fee arrangements.
Professional services associated with the implementation and configuration of our subscription platform are performed directly by our services team, as well as by contracted third-party vendors. In cases in which third party vendors invoice Coupa for services performed for our customers, those fees are accrued over the requisite service period.
Operating Expenses
Research and Development
Research and development expenses consist primarily of personnel costs of our development team, including salaries, benefits, bonuses, stock-based compensation expense and allocated overhead costs. Our cycle of frequent updates has facilitated rapid innovation and the introduction of new modules throughout our history. We have aggressively invested, and intend to continue to invest, in developing technology to support our growth. We capitalize certain software development costs that are attributable to developing new modules, features and adding incremental functionality to our platform, and amortize such costs as costs of subscription revenues over the estimated life of the new application or incremental functionality, which is two years.
Sales and Marketing
Sales and marketing expenses consist primarily of personnel and related costs directly associated with our sales and marketing staff, including salaries, benefits, bonuses, commissions and stock-based compensation. Commissions earned by our sales force that can be associated specifically with a noncancellable subscription contract are deferred and amortized over the same period that revenues are to be recognized for the related noncancellable contract. Other sales and marketing costs include promotional events to promote our brand, including our INSPIRE conferences, advertising and allocated overhead.
General and Administrative
General and administrative expenses consist of personnel costs and related expenses for executive, finance, legal, human resources, recruiting, and employee-related information technology and administrative personnel, including salaries, benefits, bonuses and stock-based compensation expense; professional fees for external legal, accounting, recruiting and other consulting services; allocated overhead costs; and legal settlements.
Other Expense, Net
Other expense, net consists primarily of the change in the fair value of our preferred stock warrants, effect of exchange rates on our foreign currency-denominated asset and liability balances, and interest income earned on our cash and cash equivalents. All translation adjustments are recorded as foreign currency gains (losses) in the consolidated statements of operations. To date, we have had minimal interest income.
Provision for Income Taxes
Provision for income taxes consists primarily of income taxes related to foreign and state jurisdictions in which we conduct business. We maintain a full valuation allowance on our federal and state deferred tax assets as we have concluded that it is not more likely than not that the deferred assets will be utilized.
56
Table of Contents
Results of Operations
The following tables set forth selected consolidated statements of operations data and such data as a percentage of total revenues for each of the periods indicated:
| Year ended January 31, |
Six months ended July 31, |
|||||||||||||||
| 2015 | 2016 | 2015 | 2016 | |||||||||||||
| (in thousands) | ||||||||||||||||
| Revenues: |
||||||||||||||||
| Subscription services |
$ | 43,051 | $ | 75,667 | $ | 31,622 | $ | 53,155 | ||||||||
| Professional services and other |
7,794 | 8,011 | 2,891 | 7,160 | ||||||||||||
|
|
|
|
|
|
|
|
|
|||||||||
| Total revenues |
50,845 | 83,678 | 34,513 | 60,315 | ||||||||||||
|
|
|
|
|
|
|
|
|
|||||||||
| Cost of revenues: |
||||||||||||||||
| Subscription services |
8,813 | 16,804 | 7,545 | 12,079 | ||||||||||||
| Professional services and other |
9,911 | 15,107 | 6,233 | 11,420 | ||||||||||||
|
|
|
|
|
|
|
|
|
|||||||||
| Total cost of revenues |
18,724 | 31,911 | 13,778 | 23,499 | ||||||||||||
|
|
|
|
|
|
|
|
|
|||||||||
| Gross profit |
32,121 | 51,767 | 20,735 | 36,816 | ||||||||||||
|
|
|
|
|
|
|
|
|
|||||||||
| Operating expenses: |
||||||||||||||||
| Research and development |
11,887 | 22,767 | 10,223 | 15,046 | ||||||||||||
| Sales and marketing |
33,724 | 54,713 | 24,211 | 35,088 | ||||||||||||
| General and administrative |
13,146 | 19,540 | 11,199 | 10,173 | ||||||||||||
|
|
|
|
|
|
|
|
|
|||||||||
| Total operating expenses |
58,757 | 97,020 | 45,633 | 60,307 | ||||||||||||
|
|
|
|
|
|
|
|
|
|||||||||
| Loss from operations |
(26,636 | ) | (45,253 | ) | (24,898 | ) | (23,491 | ) | ||||||||
| Other expense, net |
(563 | ) | (568 | ) | (131 | ) | (523 | ) | ||||||||
|
|
|
|
|
|
|
|
|
|||||||||
| Loss before provision for income taxes |
(27,199 | ) | (45,821 | ) | (25,029 | ) | (24,014 | ) | ||||||||
| Provision for income taxes |
101 | 335 | 118 | 291 | ||||||||||||
|
|
|
|
|
|
|
|
|
|||||||||
| Net loss and comprehensive loss |
$ | (27,300 | ) | $ | (46,156 | ) | $ | (25,147 | ) | $ | (24,305 | ) | ||||
|
|
|
|
|
|
|
|
|
|||||||||
57
Table of Contents
| Year ended January 31, |
Six months ended July 31, |
|||||||||||||||
| 2015 | 2016 | 2015 | 2016 | |||||||||||||
| Revenues: |
||||||||||||||||
| Subscription services |
85 | % | 90 | % | 92 | % | 88 | % | ||||||||
| Professional services and other |
15 | 10 | 8 | 12 | ||||||||||||
|
|
|
|
|
|
|
|
|
|||||||||
| Total revenues |
100 | 100 | 100 | 100 | ||||||||||||
| Cost of revenues: |
||||||||||||||||
| Subscription services |
17 | 20 | 22 | 20 | ||||||||||||
| Professional services and other |
20 | 18 | 18 | 19 | ||||||||||||
|
|
|
|
|
|
|
|
|
|||||||||
| Total cost of revenues |
37 | 38 | 40 | 39 | ||||||||||||
| Gross profit |
63 | 62 | 60 | 61 | ||||||||||||
| Operating expenses: |
||||||||||||||||
| Research and development |
24 | 27 | 30 | 25 | ||||||||||||
| Sales and marketing |
66 | 65 | 70 | 58 | ||||||||||||
| General and administrative |
26 | 24 | 32 | 17 | ||||||||||||
|
|
|
|
|
|
|
|
|
|||||||||
| Total operating expenses |
116 | 116 | 132 | 100 | ||||||||||||
| Loss from operations |
(53 | ) | (54 | ) | (72 | ) | (39 | ) | ||||||||
| Other expense, net |
(1 | ) | (1 | ) | (1 | ) | (1 | ) | ||||||||
|
|
|
|
|
|
|
|
|
|||||||||
| Loss before provision for income taxes |
(54 | ) | (55 | ) | (73 | ) | (40 | ) | ||||||||
| Provision for income taxes |
— | — | — | — | ||||||||||||
|
|
|
|
|
|
|
|
|
|||||||||
| Net loss and comprehensive loss |
(54 | )% | (55 | )% | (73 | )% | (40 | )% | ||||||||
|
|
|
|
|
|
|
|
|
|||||||||
Six Months Ended July 31, 2015 and July 31, 2016
Revenues
| Six months ended July 31, |
||||||||||||
| 2015 | 2016 | % Change | ||||||||||
| (in thousands) | ||||||||||||
| Subscription services |
$ | 31,622 | $ | 53,155 | 68 | % | ||||||
| Professional services and other |
2,891 | 7,160 | 148 | |||||||||
|
|
|
|
|
|||||||||
| Total revenues |
$ | 34,513 | $ | 60,315 | 75 | % | ||||||
|
|
|
|
|
|||||||||
Total revenues were $60.3 million for the six months ended July 31, 2016 compared to $34.5 million for the six months ended July 31, 2015, an increase of $25.8 million, or 75%. Subscription services revenues were $53.2 million, or 88% of total revenues, for the six months ended July 31, 2016, compared to $31.6 million, or 92% of total revenues, for the six months ended July 31, 2015. The increase in subscription revenues was due primarily to the addition of new customers as compared to the same period of the prior year, as the number of customers increased from 363 as of July 31, 2015, to 465 as of July 31, 2016, representing a 28% increase. Also, we experienced large deployments of our solutions during the six months ended July 31, 2016, which is reflected in the increase of our average subscription revenue per customer from $87,000 for the six months ended July 31, 2015, to $114,000 for the six months ended July 31, 2016. Professional services revenues were $7.2 million for the six months ended July 31, 2016 compared to $2.9 million for the six months ended July 31, 2015. This represents an increase of $4.3 million, or 148%, primarily due to the increased number of projects completed during the six months ended July 31, 2016 compared to the six months ended July 31, 2015. Because the majority of professional services revenues are recognized upon completion of the project, professional services revenues have and may continue to fluctuate significantly from period to period.
58
Table of Contents
Cost of Revenues
| Six months ended July 31, |
||||||||||||
| 2015 | 2016 | % Change | ||||||||||
| (in thousands) | ||||||||||||
| Subscription services |
$ | 7,545 | $ | 12,079 | 60 | % | ||||||
| Professional services and other |
6,233 | 11,420 | 83 | |||||||||
|
|
|
|
|
|||||||||
| Total cost of revenues |
$ | 13,778 | $ | 23,499 | 71 | % | ||||||
|
|
|
|
|
|||||||||
Cost of subscription services was $12.1 million for the six months ended July 31, 2016, compared to $7.5 million for the six months ended July 31, 2015, an increase of $4.6 million, or 60%. The increase in cost of subscription services was primarily due to an increase of $1.5 million in employee compensation costs related to higher headcount, an increase of $1.3 million in hosting fees to accommodate customer growth, an increase of $1.0 million in amortization of capitalized software development costs and intangible assets, and an increase of $0.7 million related to allocated facilities and outside services costs driven by our overall growth.
Cost of professional services was $11.4 million for the six months ended July 31, 2016, compared to $6.2 million for the six months ended July 31, 2015, an increase of $5.2 million, or 83%. The increase in cost of professional services was primarily due to an increase of $2.7 million for work performed by subcontractors for engagements where we had contracted directly with the customer to perform the professional services, an increase of $1.8 million in employee compensation costs related to higher headcount, and an increase of $0.6 million related to allocated facilities and other costs driven by our overall growth. Most of our costs of professional services are recorded as period costs, and thus the costs are often reflected in our financial results sooner than the associated revenues.
Gross Profit
| Six months ended July 31, |
||||||||||||
| 2015 | 2016 | % Change | ||||||||||
| (in thousands) | ||||||||||||
| Gross Profit |
$ | 20,735 | $ | 36,816 | 78 | % | ||||||
Gross profit was $36.8 million for the six months ended July 31, 2016, compared to $20.7 million for the six months ended July 31, 2015, an increase of $16.1 million, or 78%. The increase in gross profit is the result of the increases in our subscription services revenues due primarily to the addition of new customers in the six months ended July 31, 2016. This was offset by negative professional services gross margins as our revenues related to fixed fee contracts are generally deferred and recognized upon completion of the project under the completed performance method of accounting, while the related costs are recognized as they are incurred. Gross margin percentage was 61% for the six months ended July 31, 2016, compared to 60% for the six months ended July 31, 2015.
Operating Expenses
Research and Development
| Six months ended July 31, |
||||||||||||
| 2015 | 2016 | % Change | ||||||||||
| (in thousands) | ||||||||||||
| Research and development |
$ | 10,223 | $ | 15,046 | 47 | % | ||||||
59
Table of Contents
Research and development expenses were $15.0 million for the six months ended July 31, 2016, compared to $10.2 million for the six months ended July 31, 2015, an increase of $4.8 million, or 47%. The increase was primarily due to an increase of $4.3 million in employee compensation costs related to higher headcount, an increase of $0.2 million related to consultants necessary to meet development needs until new hires were onboarded, and an increase of $0.9 million related to allocated facilities and travel costs driven by our overall growth. The increase in research and development costs has been partially offset by an increase in capitalized software development costs of $0.8 million.
Sales and Marketing
| Six months ended July 31, |
||||||||||||
| 2015 | 2016 | % Change | ||||||||||
| (in thousands) | ||||||||||||
| Sales and marketing |
$ | 24,211 | $ | 35,088 | 45 | % | ||||||
Sales and marketing expenses were $35.1 million for the six months ended July 31, 2016, compared to $24.2 million for the six months ended July 31, 2015, an increase of $10.9 million, or 45%. The increase was primarily due to an increase of $6.3 million in employee compensation costs related to higher headcount, an increase of $1.9 million in marketing and event costs, an increase of $1.0 million in costs due to additional travel expenses, and an increase of $1.5 million related to allocated facilities costs and other costs driven by our overall growth.
General and Administrative
| Six months ended July 31, |
||||||||||||
| 2015 | 2016 | % Change | ||||||||||
| (in thousands) | ||||||||||||
| General and administrative |
$ | 11,199 | $ | 10,173 | (9 | )% | ||||||
General and administrative expenses were $10.2 million for the six months ended July 31, 2016, compared to $11.2 million for the six months ended July 31, 2015, a decrease of $1.0 million, or 9%. The decrease was primarily due to $5.4 million of stock-based compensation charges during the six months ended July 31, 2015, which did not recur during the six months ended July 31, 2016. Additionally $1.3 million of litigation costs did not recur during the six months ended July 31, 2016, due to the resolution of an ongoing litigation. These decreases were partially offset by a $3.7 million increase in employee compensation costs related to higher headcount, an increase of $0.9 million for professional and outside services, and an increase of $0.7 million related to allocated facilities costs and other costs driven by our overall growth.
Years Ended January 31, 2015 and January 31, 2016
Revenues
| Year ended January 31, |
||||||||||||
| 2015 | 2016 | % Change | ||||||||||
| (in thousands) | ||||||||||||
| Subscription services |
$ | 43,051 | $ | 75,667 | 76 | % | ||||||
| Professional services and other |
7,794 | 8,011 | 3 | |||||||||
|
|
|
|
|
|||||||||
| Total revenues |
$ | 50,845 | $ | 83,678 | 65 | % | ||||||
|
|
|
|
|
|||||||||
60
Table of Contents
Total revenues were $83.7 million for the fiscal year ended January 31, 2016, compared to $50.8 million for the fiscal year ended January 31, 2015, an increase of $32.9 million, or 65%. Subscription services revenues were $75.7 million, or 90% of total revenues, for the fiscal ended January 31, 2016, compared to $43.1 million, or 85% of total revenues, for the fiscal year ended January 31, 2016. The increase in subscription revenues was due primarily to the addition of new customers as compared to the prior year, as the number of customers increased from 312 as of January 31, 2015, to 414 as of January 31, 2016, representing a 33% increase. Also, we experienced large deployments of our solutions during the fiscal year ended January 31, 2016, which is reflected in the increase of our average subscription revenue per customer of $138,000 for the year ended January 31, 2015 to $183,000 for the year ended January 31, 2016. Increased add-on subscription revenue for current customers during the fiscal year ended January 31, 2016 also contributed to the year-over-year result. Professional services revenues were $8.0 million for the fiscal year ended January 31, 2016 compared to $7.8 million for the fiscal year ended January 31, 2015. This represents an increase of $0.2 million, or 3%, in professional services revenues, but also represents a decline in professional services revenues as a percentage of total revenues from 15% to 10%. During the year ended January 31, 2015, we recognized $2.1 million in professional services revenues from the completion of one specific customer contract that had been deferred from prior periods. The remainder of the decline was driven by changes in the timing of project completion for various projects for which revenue is recognized under the completed performance method of accounting.
Cost of Revenues
| Year ended January 31, |
||||||||||||
| 2015 | 2016 | % Change | ||||||||||
| (in thousands) | ||||||||||||
| Subscription services |
$ | 8,813 | $ | 16,804 | 91 | % | ||||||
| Professional services and other |
9,911 | 15,107 | 52 | |||||||||
|
|
|
|
|
|||||||||
| Total cost of revenues |
$ | 18,724 | $ | 31,911 | 70 | % | ||||||
|
|
|
|
|
|||||||||
Costs of subscription services were $16.8 million for the fiscal year ended January 31, 2016, compared to $8.8 million for the fiscal year ended January 31, 2015, an increase of $8.0 million, or 91%. The increase in costs of subscription services was primarily due to an increase of $3.1 million in employee compensation costs related to higher headcount including an increase of $0.1 million attributable to stock-based compensation expense, an increase of $1.7 million in hosting fees due to customer growth, an increase of $1.2 million in amortization of capitalized software development costs and intangible assets, and an increase of $1.3 million related to allocated facilities and outside services costs driven by our overall growth.
Costs of professional services were $15.1 million for the fiscal year ended January 31, 2016, compared to $9.9 million for the fiscal year ended January 31, 2015, an increase of $5.2 million, or 52%. The increase in costs of professional services was primarily due to an increase of $4.5 million in employee compensation costs related to higher headcount including an increase of $0.9 million attributable to stock-based compensation expense, offset by a reduction of $0.5 million for work performed by subcontractors for engagements where we had contracted directly with the customer to perform the professional services. Most of our costs of professional services are recorded as period costs, and thus the costs may be reflected in our financial results sooner than the associated revenues.
61
Table of Contents
Gross Profit
| Year ended January 31, |
||||||||||||
| 2015 | 2016 | % Change | ||||||||||
| (in thousands) | ||||||||||||
| Gross Profit |
$ | 32,121 | $ | 51,767 | 61 | % | ||||||
Gross profit was $51.8 million for the fiscal year ended January 31, 2016, compared to $32.1 million for the fiscal year ended January 31, 2015, an increase of $19.7 million, or 61%. The increase in gross profit is the result of the increases in our subscription services revenues due primarily to the addition of new customers in the fiscal year. This was offset by negative professional services gross margins as our revenues related to fixed fee contracts are generally deferred and recognized upon completion of the project under the completed performance method of accounting, while the related costs are recognized as they are incurred. Gross margin percentage was 62% for the fiscal year ended January 31, 2016, compared to 63% for the fiscal year ended January 31, 2015.
Operating Expenses
Research and Development
| Year ended January 31, |
||||||||||||
| 2015 | 2016 | % Change | ||||||||||
| (in thousands) | ||||||||||||
| Research and development |
$ | 11,887 | $ | 22,767 | 92 | % | ||||||
Research and development expenses were $22.8 million for the fiscal year ended January 31, 2016, compared to $11.9 million for the fiscal year ended January 31, 2015, an increase of $10.9 million, or 92%. The increase was primarily due to an increase of $8.4 million in employee compensation costs related to higher headcount including an increase of $0.9 million attributable to stock-based compensation expense, an increase of $1.8 million related to consultants necessary to meet development needs until new hires were onboarded, and an increase of $1.3 million related to allocated facilities and travel costs driven by our overall growth. The increase in research and development costs has been partially offset by an increase in capitalized software development costs of $1.0 million.
Sales and Marketing
| Year ended January 31, |
||||||||||||
| 2015 | 2016 | % Change | ||||||||||
| (in thousands) | ||||||||||||
| Sales and marketing |
$ | 33,724 | $ | 54,713 | 62 | % | ||||||
Sales and marketing expenses were $54.7 million for the fiscal year ended January 31, 2016, compared to $33.7 million for the fiscal year ended January 31, 2015, an increase of $21.0 million, or 62%. The increase was primarily due to an increase of $12.8 million in employee compensation costs related to higher headcount including an increase of $0.9 million attributable to stock-based compensation expense, an increase of $3.2 million in marketing and event costs, an increase of $1.8 million in costs due to additional travel expenses and an increase of $2.3 million related to allocated facilities costs and other costs driven by our overall growth.
62
Table of Contents
General and Administrative
| Year ended January 31, |
||||||||||||
| 2015 | 2016 | % Change | ||||||||||
| (in thousands) | ||||||||||||
| General and administrative |
$ | 13,146 | $ | 19,540 | 49 | % | ||||||
General and administrative expenses were $19.5 million for the fiscal year ended January 31, 2016, compared to $13.1 million for the fiscal year ended January 31, 2015, an increase of $6.4 million, or 49%. The increase was primarily due to an increase in stock-based compensation expense of $5.9 million, which included $5.6 million of stock-based compensation charges resulting from the sale of common stock by certain employees and former employees, as well as an increase of $2.4 million in other employee compensation costs, an increase of $2.1 million in costs related to professional and outside services and an increase of $0.5 million related to allocated facilities costs driven by our overall growth. This increase was partially offset by a decrease of $5.0 million in litigation-related costs. The increase in other employee compensation costs and costs related to professional and outside services during the fiscal year ended January 31, 2016, was driven by efforts to support our overall growth.
63
Table of Contents
Quarterly Results of Operations
The following tables set forth selected unaudited quarterly consolidated statements of operations data for each of the eight quarters in the period ended July 31, 2016, as well as the percentage of revenues that each line item represents for each quarter. The information for each of these quarters has been prepared on the same basis as the audited annual consolidated financial statements included elsewhere in this prospectus and, in the opinion of management, includes all adjustments, which consist only of normal recurring adjustments, necessary for the fair presentation of the results of operations for these periods in accordance with GAAP. This data should be read in conjunction with our audited and unaudited consolidated financial statements and related notes included elsewhere in this prospectus. These quarterly operating results are not necessarily indicative of our operating results for a full year or any future period.
| Three months ended | ||||||||||||||||||||||||||||||||
| Oct. 31, 2014 |
Jan. 31, 2015 |
Apr. 30, 2015 |
Jul. 31, 2015 |
Oct. 31, 2015 |
Jan. 31, 2016 |
Apr. 30, 2016 |
Jul. 31, 2016 |
|||||||||||||||||||||||||
| (in thousands) | ||||||||||||||||||||||||||||||||
| Revenues: |
||||||||||||||||||||||||||||||||
| Subscription services |
$ | 11,661 | $ | 13,400 | $ | 14,289 | $ | 17,333 | $ | 20,757 | $ | 23,288 | $ | 25,372 | $ | 27,783 | ||||||||||||||||
| Professional services and other |
2,522 | 1,798 | 1,520 | 1,371 | 2,044 | 3,076 | 3,811 | 3,349 | ||||||||||||||||||||||||
|
|
|
|
|
|
|
|
|
|
|
|
|
|
|
|
|
|||||||||||||||||
| Total revenues |
14,183 | 15,198 | 15,809 | 18,704 | 22,801 | 26,364 | 29,183 | 31,132 | ||||||||||||||||||||||||
| Cost of revenues: |
||||||||||||||||||||||||||||||||
| Subscription services |
2,284 | 2,843 | 3,550 | 3,995 | 4,280 | 4,979 | 6,050 | 6,029 | ||||||||||||||||||||||||
| Professional services and other |
2,952 | 2,348 | 2,594 | 3,639 | 3,914 | 4,960 | 5,968 | 5,452 | ||||||||||||||||||||||||
|
|
|
|
|
|
|
|
|
|
|
|
|
|
|
|
|
|||||||||||||||||
| Total cost of revenues |
5,236 | 5,191 | 6,144 | 7,634 | 8,194 | 9,939 | 12,018 | 11,481 | ||||||||||||||||||||||||
|
|
|
|
|
|
|
|
|
|
|
|
|
|
|
|
|
|||||||||||||||||
| Gross profit |
8,947 | 10,007 | 9,665 | 11,070 | 14,607 | 16,425 | 17,165 | 19,651 | ||||||||||||||||||||||||
|
|
|
|
|
|
|
|
|
|
|
|
|
|
|
|
|
|||||||||||||||||
| Operating expenses: |
||||||||||||||||||||||||||||||||
| Research and development |
3,008 | 3,950 | 4,431 | 5,792 | 5,965 | 6,579 | 7,840 | 7,206 | ||||||||||||||||||||||||
| Sales and marketing |
8,959 | 10,198 | 10,679 | 13,532 | 14,306 | 16,196 | 15,836 | 19,252 | ||||||||||||||||||||||||
| General and administrative |
1,939 | 2,728 | 2,480 | 8,719 | 3,709 | 4,632 | 5,553 | 4,620 | ||||||||||||||||||||||||
|
|
|
|
|
|
|
|
|
|
|
|
|
|
|
|
|
|||||||||||||||||
| Total operating expenses |
13,906 | 16,876 | 17,590 | 28,043 | 23,980 | 27,407 | 29,229 | 31,078 | ||||||||||||||||||||||||
|
|
|
|
|
|
|
|
|
|
|
|
|
|
|
|
|
|||||||||||||||||
| Loss from operations |
(4,959 | ) | (6,869 | ) | (7,925 | ) | (16,973 | ) | (9,373 | ) | (10,982 | ) | (12,064 | ) | (11,427 | ) | ||||||||||||||||
| Other income (expense), net |
(114 | ) | (561 | ) | (26 | ) | (98 | ) | (70 | ) | (374 | ) | 323 | (846 | ) | |||||||||||||||||
|
|
|
|
|
|
|
|
|
|
|
|
|
|
|
|
|
|||||||||||||||||
| Loss before provision for income taxes |
(5,073 | ) | (7,430 | ) | (7,951 | ) | (17,071 | ) | (9,443 | ) | (11,356 | ) | (11,741 | ) | (12,273 | ) | ||||||||||||||||
| Provision for income taxes |
32 | 30 | 66 | 59 | 75 | 135 | 126 | 165 | ||||||||||||||||||||||||
|
|
|
|
|
|
|
|
|
|
|
|
|
|
|
|
|
|||||||||||||||||
| Net loss and comprehensive loss |
$ | (5,105 | ) | $ | (7,460 | ) | $ | (8,017 | ) | $ | (17,130 | ) | $ | (9,518 | ) | $ | (11,491 | ) | $ | (11,867 | ) | $ | (12,438 | ) | ||||||||
|
|
|
|
|
|
|
|
|
|
|
|
|
|
|
|
|
|||||||||||||||||
64
Table of Contents
| Three months ended | ||||||||||||||||||||||||||||||||
| Oct. 31, 2014 |
Jan. 31, 2015 |
Apr. 30, 2015 |
Jul. 31, 2015 |
Oct. 31, 2015 |
Jan. 31, 2016 |
Apr. 30, 2016 |
Jul. 31, 2016 |
|||||||||||||||||||||||||
| (as a percentage of total revenues) | ||||||||||||||||||||||||||||||||
| Revenues: |
||||||||||||||||||||||||||||||||
| Subscription services |
82 | % | 88 | % | 90 | % | 93 | % | 91 | % | 88 | % | 87 | % | 89 | % | ||||||||||||||||
| Professional services and other |
18 | 12 | 10 | 7 | 9 | 12 | 13 | 11 | ||||||||||||||||||||||||
|
|
|
|
|
|
|
|
|
|
|
|
|
|
|
|
|
|||||||||||||||||
| Total revenues |
100 | 100 | 100 | 100 | 100 | 100 | 100 | 100 | ||||||||||||||||||||||||
| Costs of revenues: |
||||||||||||||||||||||||||||||||
| Subscription services |
16 | 19 | 22 | 21 | 19 | 19 | 21 | 19 | ||||||||||||||||||||||||
| Professional services and other |
21 | 15 | 16 | 19 | 17 | 19 | 20 | 18 | ||||||||||||||||||||||||
|
|
|
|
|
|
|
|
|
|
|
|
|
|
|
|
|
|||||||||||||||||
| Total cost of revenues |
37 | 34 | 39 | 41 | 36 | 38 | 41 | 37 | ||||||||||||||||||||||||
|
|
|
|
|
|
|
|
|
|
|
|
|
|
|
|
|
|||||||||||||||||
| Gross profit |
63 | 66 | 61 | 59 | 64 | 62 | 59 | 63 | ||||||||||||||||||||||||
|
|
|
|
|
|
|
|
|
|
|
|
|
|
|
|
|
|||||||||||||||||
| Operating expenses: |
||||||||||||||||||||||||||||||||
| Research and development |
21 | 26 | 28 | 31 | 26 | 25 | 27 | 23 | ||||||||||||||||||||||||
| Sales and marketing |
63 | 67 | 67 | 72 | 63 | 61 | 54 | 62 | ||||||||||||||||||||||||
| General and administrative |
14 | 18 | 16 | 47 | 16 | 18 | 19 | 15 | ||||||||||||||||||||||||
|
|
|
|
|
|
|
|
|
|
|
|
|
|
|
|
|
|||||||||||||||||
| Total operating expenses |
98 | 111 | 111 | 150 | 105 | 104 | 100 | 100 | ||||||||||||||||||||||||
|
|
|
|
|
|
|
|
|
|
|
|
|
|
|
|
|
|||||||||||||||||
| Loss from operations |
(35 | ) | (45 | ) | (50 | ) | (91 | ) | (41 | ) | (42 | ) | (41 | ) | (37 | ) | ||||||||||||||||
| Other income (expense), net |
(1 | ) | (4 | ) | — | — | — | (1 | ) | 1 | (3 | ) | ||||||||||||||||||||
|
|
|
|
|
|
|
|
|
|
|
|
|
|
|
|
|
|||||||||||||||||
| Loss before provision for income taxes |
(36 | ) | (49 | ) | (50 | ) | (91 | ) | (41 | ) | (43 | ) | (40 | ) | (40 | ) | ||||||||||||||||
| Provision for income taxes |
— | — | — | — | — | 1 | — | 1 | ||||||||||||||||||||||||
|
|
|
|
|
|
|
|
|
|
|
|
|
|
|
|
|
|||||||||||||||||
| Net loss and comprehensive loss |
(36 | )% | (49 | )% | (50 | )% | (91 | )% | (41 | )% | (44 | )% | (40 | )% | (41 | )% | ||||||||||||||||
|
|
|
|
|
|
|
|
|
|
|
|
|
|
|
|
|
|||||||||||||||||
| Three months ended | ||||||||||||||||||||||||||||||||
| Oct. 31, 2014 |
Jan. 31, 2015 |
Apr. 30, 2015 |
Jul. 31, 2015 |
Oct. 31, 2015 |
Jan. 31, 2016 |
Apr. 30, 2016 |
Jul. 31, 2016 |
|||||||||||||||||||||||||
| (in thousands) | ||||||||||||||||||||||||||||||||
| Other Financial Data: |
||||||||||||||||||||||||||||||||
| Non-GAAP operating loss(1) |
$ | (4,158 | ) | $ | (5,469 | ) | $ | (6,711 | ) | $ | (8,585 | ) | $ | (7,401 | ) | $ | (9,658 | ) | $ | (10,014 | ) | $ | (9,630 | ) | ||||||||
| (1) | We define non-GAAP operating loss as operating loss before stock-based compensation, litigation-related costs and amortization of acquired intangible assets. |
65
Table of Contents
The following table provides a reconciliation of loss from operations to non-GAAP operating loss:
| Three months ended | ||||||||||||||||||||||||||||||||
| Oct. 31, 2014 |
Jan. 31, 2015 |
Apr. 30, 2015 |
Jul. 31, 2015 |
Oct. 31, 2015 |
Jan. 31, 2016 |
Apr. 30, 2016 |
Jul. 31, 2016 |
|||||||||||||||||||||||||
| (in thousands) | ||||||||||||||||||||||||||||||||
| Loss from operations |
$ | (4,959 | ) | $ | (6,869 | ) | $ | (7,925 | ) | $ | (16,973 | ) | $ | (9,373 | ) | $ | (10,982 | ) | $ | (12,064 | ) | $ | (11,427 | ) | ||||||||
| Stock-based compensation |
427 | 777 | 559 | 7,474 | 1,526 | 1,009 | 1,706 | 1,559 | ||||||||||||||||||||||||
| Litigation-related costs |
360 | 610 | 642 | 848 | 327 | 126 | 123 | 27 | ||||||||||||||||||||||||
| Amortization of acquired intangible assets |
14 | 13 | 13 | 66 | 119 | 189 | 221 | 211 | ||||||||||||||||||||||||
|
|
|
|
|
|
|
|
|
|
|
|
|
|
|
|
|
|||||||||||||||||
| Non-GAAP operating loss |
$ | (4,158 | ) | $ | (5,469 | ) | $ | (6,711 | ) | $ | (8,585 | ) | $ | (7,401 | ) | $ | (9,658 | ) | $ | (10,014 | ) | $ | (9,630 | ) | ||||||||
|
|
|
|
|
|
|
|
|
|
|
|
|
|
|
|
|
|||||||||||||||||
Quarterly Revenues Trends
Our quarterly revenues increased sequentially for all periods presented due primarily to increases in the number of new customers, average selling prices and expanded relationships with existing customers. In some cases, revenues for professional services decreased period over period because revenues are generally deferred and recognized upon completion of the project. Further, certain implementation projects are contracted directly between partners and end customers, certain of which projects are of greater significance than others. As a result, our professional services revenues have experienced significant volatility in the past and we expect this volatility to continue.
Quarterly Costs and Expenses Trends
Costs of subscription services generally increased across all quarters presented due primarily to the continued expansion of our technical infrastructure and increased employee headcount. Costs of professional services generally increased across the quarters presented due primarily to increased employee headcount and increased consultant costs. For the three month periods ended January 31, 2015 and July 31, 2016, costs of professional services decreased compared to the preceding three month period, as the preceding three month period included higher subcontractor costs necessary to sufficiently resource our deployment projects ongoing during those periods. Most of our costs are recorded as period costs, and thus the costs may be reflected in our financial results sooner than the associated revenues.
Our research and development costs generally increased sequentially across the quarters presented, primarily due to the addition of personnel to support expanded operations. For the three month period ended July 31, 2016, research and development costs decreased compared to the preceding three month period, as the preceding three month period included increased employee compensation and consulting costs. Sales and marketing costs generally increased sequentially across the quarters presented, primarily due to the addition of personnel, increased event costs and increased marketing campaigns to support the growth of the business. For the three month period ended April 30, 2016, sales and marketing costs decreased, primarily due to a reduction in advertising costs. This was followed by an increase in sales and marketing costs for the three month period ended July 31, 2016, mainly due to increased costs associated with our annual INSPIRE user conference. General and administrative costs increased significantly in the three months ended July 31, 2015, primarily due to stock-based compensation charges resulting from the sale of common stock by certain employees. For the three month periods ended January 31, 2016 and April 31, 2016, general and administrative costs increased primarily due to the addition of personnel to support our growth, as well as increased outside consulting services used during the periods. For the three
66
Table of Contents
month period ended July 31, 2016, general and administrative costs decreased compared to the previous period due to a reduction in outside consulting services used.
Our quarterly operating results may fluctuate due to various factors affecting our performance. In addition, we recognize revenues from subscription fees ratably over the term of the contract. Therefore, changes in our contracting activity in the near term may not impact changes to our reported revenues until future periods.
Liquidity and Capital Resources
As of July 31, 2016, our principal sources of liquidity were cash and cash equivalents totaling $79.9 million, which were held for working capital purposes. Our cash equivalents are comprised primarily of bank deposits and money market funds.
Since our inception, we have financed our operations primarily through private sales of equity securities. We believe our existing cash and cash equivalents will be sufficient to meet our projected operating requirements for at least the next 12 months. Our future capital requirements will depend on many factors, including our pace of growth, subscription renewal activity, the timing and extent of spend to support development efforts, the expansion of sales and marketing activities, the introduction of new and enhanced services offerings, and the continuing market acceptance of our services. We may in the future enter into arrangements to acquire or invest in complementary businesses, services and technologies, and intellectual property rights. We may be required to seek additional equity or debt financing. In the event that additional financing is required from outside sources, we may not be able to raise it on terms acceptable to us or at all. If we are unable to raise additional capital when desired, our business, operating results, and financial condition would be adversely affected.
Operating Activities
Cash used in operating activities of $7.7 million for the six months ended July 31, 2016, was primarily due to a net loss of $24.3 million, partially offset by stock-based compensation of $3.3 million, depreciation and amortization, including deferred commissions, of $4.1 million, and a change in working capital of $9.1 million. The net change in operating assets and liabilities was primarily due to a favorable change in the deferred revenue balance of $7.2 million and accounts receivable and payables, including accrued and other liabilities, of $4.4 million, partially offset by an unfavorable variance due to the increase of capitalized deferred commissions of $1.5 million and increase of prepaid and other current and long term assets, for $1.0 million.
Cash used in operating activities of $6.8 million for the six months ended July 31, 2015, was primarily due to a net loss of $25.1 million, partially offset by stock-based compensation of $8.0 million, depreciation and amortization, including deferred commissions, of $2.2 million, and a change in working capital of $8.1 million. The net change in operating assets and liabilities was primarily due to a favorable change in the deferred revenue and accounts receivable balance, offset by an unfavorable variance due to the increase of capitalized deferred commissions and prepaid and other current and long term assets.
Cash used in operating activities of $22.1 million for the fiscal year ended January 31, 2016, was primarily due to a net loss of $46.2 million, partially offset by stock-based compensation of $10.6 million and depreciation and amortization, including deferred commissions, of $5.6 million. Changes in working capital were favorable to cash flows from operations due to a change in the deferred revenue balance of $24.2 million, partially offset by an increase in accounts receivable of $8.3 million, an increase of capitalized deferred commissions of $5.4 million, and other operating assets and liabilities changes.
Cash used in operating activities of $11.9 million for the fiscal year ended January 31, 2015, was primarily due to a net loss of $27.3 million, partially offset by stock-based compensation of $1.8 million, depreciation and amortization, including deferred commissions, of $2.8 million, and a change in working
67
Table of Contents
capital of $10.8 million. The net change in operating assets and liabilities was primarily due to a favorable change in the deferred revenue balance, offset by an unfavorable variance in accounts receivable, since the growth in amounts due from our customers exceeded cash collections for the period.
Investing Activities
Cash used in investing activities for the six months ended July 31, 2016, of $2.5 million was primarily related to purchases of property and equipment.
Cash used in investing activities for the six months ended July 31, 2015, of $2.7 million was primarily related to $1.9 million for purchases of property and equipment, as well as $0.8 million for business acquisitions.
Cash used in investing activities for the fiscal year ended January 31, 2016, of $5.3 million was primarily related to $3.9 million for purchases of property and equipment, as well as $1.4 million for business acquisitions.
Cash used investing activities for the fiscal year ended January 31, 2015, of $2.4 million was primarily related to purchases of property and equipment.
Financing Activities
Cash used in financing activities for the six months ended July 31, 2016, of $2.2 million was due to the costs paid in connection with our planned initial public offering, partially offset by proceeds from the exercise of stock options.
Cash provided by financing activities for the fiscal year ended July 31, 2015, of $76.4 million consisted primarily of net proceeds from the issuance of Series G convertible preferred stock of $75.7 million, and $0.7 million in proceeds from the exercise of stock options and preferred stock warrants.
Cash provided by financing activities for the fiscal year ended January 31, 2016, of $77.7 million consisted primarily of net proceeds from the issuance of Series G convertible preferred stock of $75.7 million, and $2.1 million in proceeds from the exercise of stock options and preferred stock warrants.
Cash provided by financing activities for the fiscal year ended January 31, 2015, of $40.4 million consisted primarily of net proceeds from the issuance of Series F convertible preferred stock of $40.0 million, and $0.5 million in proceeds from the exercise of stock options.
Commitments and Contractual Obligations
Our principal commitments and contractual obligations consist of obligations under operating leases for office facilities. The following table summarizes our non-cancelable contractual obligations as of January 31, 2016.
| Payments due by period | ||||||||||||||||||||
| Total | Less Than 1 Year |
1-3 Years | 3-5 Years | More Than 5 Years |
||||||||||||||||
| (in thousands) | ||||||||||||||||||||
| Operating lease obligations |
$ | 10,986 | $ | 3,131 | $ | 6,247 | $ | 1,608 | $ | — | ||||||||||
|
|
|
|
|
|
|
|
|
|
|
|||||||||||
| Total contractual obligations |
$ | 10,986 | $ | 3,131 | $ | 6,247 | $ | 1,608 | $ | — | ||||||||||
|
|
|
|
|
|
|
|
|
|
|
|||||||||||
68
Table of Contents
As of July 31, 2016, our non-cancelable contractual obligations are as follows:
| Payments due by period | ||||||||||||||||||||
| Total | Less Than 1 Year |
1-3 Years | 3-5 Years | More Than 5 Years |
||||||||||||||||
| (in thousands) | ||||||||||||||||||||
| Operating lease obligations |
$ | 10,053 | $ | 3,424 | $ | 5,979 | $ | 650 | $ | — | ||||||||||
|
|
|
|
|
|
|
|
|
|
|
|||||||||||
| Total contractual obligations |
$ | 10,053 | $ | 3,424 | $ | 5,979 | $ | 650 | $ | — | ||||||||||
|
|
|
|
|
|
|
|
|
|
|
|||||||||||
We lease our primary facility under a long-term operating lease, which expires in 2019.
Off-Balance Sheet Arrangements
Through July 31, 2016, we did not have any relationships with unconsolidated organizations or financial partnerships, such as structured finance or special purpose entities, that would have been established for the purpose of facilitating off-balance sheet arrangements or other contractually narrow or limited purposes.
Critical Accounting Policies and Estimates
Our management’s discussion and analysis of our financial condition and results of operations is based on our financial statements, which have been prepared in accordance with GAAP. The preparation of these financial statements requires us to make estimates and assumptions that affect the reported amounts of assets and liabilities and the disclosure of contingent assets and liabilities at the date of the financial statements, as well as the reported revenues generated and expenses incurred during the reporting periods. Our estimates are based on our historical experience and on various other factors that we believe are reasonable under the circumstances, the results of which form the basis for making judgments about the carrying value of assets and liabilities that are not readily apparent from other sources. Actual results may differ from these estimates under different assumptions or conditions. We believe that the accounting policies discussed below are critical to understanding our historical and future performance, as these policies relate to the more significant areas involving management’s judgments and estimates.
Revenue Recognition
We derive our revenues primarily from subscription services fees and professional services fees. We offer subscriptions to our cloud modules through contracts that are typically three years in length. The arrangements do not contain general rights of return. The subscription contracts do not provide customers with the right to take possession of the software supporting the modules and, as a result, are accounted for as service contracts.
We commence revenue recognition for our subscription services and professional services when all of the following criteria are met:
| • | there is persuasive evidence of an arrangement; |
| • | the service has been or is being provided to the customer; |
| • | collection of the fees is reasonably assured; and |
| • | the amount of fees to be paid by the customer is fixed or determinable. |
Subscription Services Revenues
Subscription services revenues are recognized ratably over the contractual term of the arrangement beginning on the date that the service is made available to the customer, assuming all other revenue recognition criteria have been met.
69
Table of Contents
Professional Services Revenues
Professional services are generally sold on a fixed-fee or time-and-materials basis. Revenues for time-and-material arrangements are recognized as the services are performed. For fixed-fee and other types of arrangements, revenues are generally deferred and recognized upon the completion of the project under the completed performance method of accounting.
Multiple Deliverable Arrangements
For arrangements with multiple deliverables, we evaluate whether the individual deliverables qualify as separate units of accounting. In order to treat deliverables in a multiple deliverable arrangement as separate units of accounting, the deliverables must have standalone value upon delivery. If the deliverables have standalone value upon delivery, we account for each deliverable separately, recognizing the respective revenues as the services are delivered. If one or more of the deliverables does not have standalone value upon delivery, the deliverables without standalone value are combined with the final deliverable within the arrangement and treated as a single unit of accounting. Revenues for arrangements treated as a single unit of accounting are generally recognized over the subscription services period, which is typically the final deliverable.
We have determined that our subscription services have standalone value, as we sell our subscriptions separately. The professional services related to our subscription services also have standalone value as numerous partners are trained to perform these professional services and these partners have a history of successfully completing significant deployments of our software platform.
When multiple deliverables included in an arrangement are separable into different units of accounting, the arrangement consideration is allocated to the identified separate units of accounting based on the relative selling price of each unit of accounting. Multiple deliverable arrangement accounting guidance provides a hierarchy when determining the relative selling price for each unit of accounting. Vendor-specific objective evidence (VSOE) of selling price, based on the price at which the item is regularly sold by the vendor on a standalone basis, should be used if it exists. If VSOE of selling price is not available, third-party evidence (TPE) of selling price is used to establish the selling price if it exists. VSOE and TPE do not currently exist for any of our deliverables. Accordingly, for arrangements with multiple deliverables that can be separated into different units of accounting, the relative selling price of each unit of accounting is based on best estimate of selling price (BESP).
We determine the BESP for deliverables based on overall pricing objectives, market conditions and entity-specific factors. This includes a review of historical data taking into consideration the size of the arrangements, the cloud applications being sold, customer demographics and the numbers and types of users within the arrangements.
Deferred Commissions
We capitalize commission costs that are incremental and directly related to the acquisition of customer contracts. Commissions are earned by sales personnel upon the execution of the sales contracts, and commission payments are made shortly after they are earned. Deferred commissions are amortized over the term of the related non-cancelable customer contract. We capitalized commission costs of $3.2 million and amortized $1.4 million to expense during the fiscal year ended January 31, 2015. We capitalized commission costs of $5.4 million and amortized $2.8 million to expense during the fiscal year ended January 31, 2016. We capitalized commission costs of $1.8 million and $1.5 million and amortized $1.1 million and $2.0 million during the six months ended July 31, 2015 and 2016, respectively.
Capitalized Software Development Costs
We capitalize certain development costs incurred in connection with software development for our cloud-based platform. Costs incurred in the preliminary stages of development are expensed as incurred.
70
Table of Contents
Once software has reached the development stage, internal and external costs, if direct and incremental, are capitalized until the software is substantially complete and ready for its intended use. Capitalization ceases upon completion of all substantial testing. These software development costs are recorded as part of property and equipment. Capitalized software development costs are amortized on a straight-line basis over the technology’s estimated useful life, which is two years. We capitalized software development costs of $2.1 million and amortized $1.2 million to expense during the fiscal year ended January 31, 2015. We capitalized software development costs of $3.2 million and amortized $2.2 million to expense during the fiscal year ended January 31, 2016. During the six months ended July 31, 2015 and 2016, we capitalized $1.4 million and $2.2 million, respectively, in software development costs. Amortization expense related to software development costs was approximately $1.0 million and $1.5 million for the six months ended July 31, 2015 and 2016, respectively.
Software development costs incurred in the maintenance and minor upgrade and enhancement of internal-use software are expensed as incurred.
Stock-Based Compensation
Stock-based compensation expense is measured and recognized in the financial statements based on the fair value of the awards granted. The fair value of a stock option is estimated on the grant date using the Black-Scholes option-pricing model. The fair value of an RSU is measured using the fair value of our common stock on the date of the grant. Stock-based compensation expense is recognized, net of forfeitures, over the requisite service periods of the awards, which is generally four years.
Our use of the Black-Scholes option-pricing model requires the input of highly subjective assumptions, including the fair value of our underlying common stock, expected term of the option, expected volatility of the price of our common stock, risk-free interest rates, and the expected dividend yield of our common stock. The assumptions used in our option-pricing model represent management’s best estimates. These estimates involve inherent uncertainties and the application of management’s judgment. If factors change and different assumptions are used, our stock-based compensation expense could be materially different in the future.
These assumptions and estimates are as follows:
| • | Fair Value of Common Stock. As our stock is not publicly traded, we estimate the fair value of common stock as discussed in “—Common Stock Valuations” below. |
| • | Expected Term. The expected term of employee stock options represents the weighted-average period that the stock options are expected to remain outstanding. To determine the expected term, we generally apply the simplified approach in which the expected term of an award is presumed to be the mid-point between the vesting date and the expiration date of the award as we do not have sufficient historical exercise data to provide a reasonable basis for an estimate of expected term. |
| • | Risk-Free Interest Rate. We base the risk-free interest rate on the yields of U.S. Treasury securities with maturities approximately equal to the term of employee stock option awards. |
| • | Expected Volatility. As we do not have a trading history for our common stock, the expected volatility for our common stock was estimated by taking the average historic price volatility for industry peers based on daily price observations over a period equivalent to the expected term of the stock option awards. Industry peers consist of several public companies in our industry which are either similar in size, stage of life cycle or financial leverage. |
| • | Dividend Rate. We have never declared or paid any cash dividends and do not presently plan to pay cash dividends in the foreseeable future. As a result, we use a dividend rate of zero. |
We must also estimate a forfeiture rate to calculate the stock-based compensation expense for our awards. Our forfeiture rate is based on an analysis of our actual forfeitures. We will continue to evaluate
71
Table of Contents
the appropriateness of the forfeiture rate based on actual forfeiture experience, analysis of employee turnover and other factors. Quarterly changes in the estimated forfeiture rate can have a significant impact on our stock-based compensation expense as the cumulative effect of adjusting the rate is recognized in the period the forfeiture estimate is changed. A higher revised forfeiture rate than previously estimated will result in an adjustment that will decrease the stock-based compensation expense recognized in the consolidated statement of operations. A lower revised forfeiture rate than previously estimated will result in an adjustment that will increase the stock-based compensation expense recognized in the consolidated statement of operations.
We will continue to use judgment in evaluating the assumptions related to our stock-based compensation on a prospective basis. As we continue to accumulate additional data related to our common stock, we may have refinements to our estimates, which could materially impact our future stock-based compensation expense.
Common Stock Valuations
The fair value of the common stock underlying our stock options was determined by our board of directors. The valuations of our common stock were determined in accordance with the guidelines outlined in the American Institute of Certified Public Accountants Practice Aid, Valuation of Privately-Held-Company Equity Securities Issued as Compensation. In the absence of a public trading market, our board of directors, with input from management, exercised significant judgment and considered numerous objective and subjective factors to determine the fair value of our common stock as of the date of each option grant, including the following factors:
| • | contemporaneous valuations performed by third-party valuation firms; |
| • | the prices, rights, preferences and privileges of our convertible preferred stock relative to those of our common stock; |
| • | the prices of preferred stock sold by us to third-party investors in arms-length transactions; |
| • | the lack of marketability of our common stock; |
| • | our actual operating and financial performance; |
| • | current business conditions and projections; |
| • | our history and the timing of the introduction of new modules and services; |
| • | our stage of development; |
| • | the likelihood of achieving a liquidity event, such as an initial public offering or a merger or acquisition of our business given prevailing market conditions; |
| • | the illiquidity of stock-based awards involving securities in a private company; |
| • | the market performance of comparable publicly-traded companies; |
| • | recent secondary stock sales transactions; and |
| • | U.S. and global capital market conditions. |
In valuing our common stock, the fair value of our business, or Enterprise Value, was determined using an income approach and a market approach, which are both considered highly complex and subjective valuation methodologies. The income approach estimates the fair value of a company based on the present value of our future estimated cash flows and our residual value beyond the forecast period. These future cash flows, including the cash flows beyond the forecast period for the residual value, are discounted to their present values using an appropriate discount rate, to reflect the risks inherent in our
72
Table of Contents
achieving these estimated cash flows. We used the guideline public company method in applying the market approach. The guideline public company method is based upon the premise that indications of value for a given entity can be estimated based upon the observed valuation multiples of comparable public companies, the equity of which is freely traded by investors in the public securities markets. The Enterprise Value determined was then adjusted to: (i) add back cash on hand and tax benefits from NOLs and (ii) remove certain long-term liabilities in order to determine an equity value, or Equity Value.
The resulting Equity Value was then allocated to the common stock using a combination of the option pricing method, or OPM, and a Probability Weighted Expected Return Method, or PWERM. The PWERM approach involves the estimation of multiple future potential outcomes for us, and estimates of the probability of each respective potential outcome. The common stock per share value determined using this approach is ultimately based upon probability-weighted per share values resulting from the various future scenarios, which include an initial public offering, merger or sale, or continued operation as a private company. Additionally, the OPM uses the preferred stockholders’ liquidation preferences, participation rights, dividend rights, and conversion rights to determine the value of each share class in specific potential future outcomes considered in the PWERM approach.
After the Equity Value is determined and allocated to the various classes of shares, a discount for lack of marketability, or DLOM, is applied to arrive at the fair value of the common stock. A DLOM is applied based on the theory that as a private company, an owner of the stock has limited opportunities to sell this stock and any such sale would involve significant transaction costs, thereby reducing overall fair market value. Our assessments of the fair value of the common stock for grant dates between the dates of the valuations were based in part on the current available financial and operational information and the common stock value provided in the most recent valuation as compared to the timing of each grant. For financial reporting purposes, we considered the amount of time between the valuation date and the grant date to determine whether to use the latest common stock valuation or a straight-line interpolation between the two valuation dates. This determination included an evaluation of whether the subsequent valuation indicated that any significant change in valuation had occurred between the previous valuation and the grant date.
Once we are operating as a public company, we will rely on the closing price of our common stock as reported on the date of grant to determine the fair value of our common stock.
Based on the assumed initial public offering price of $17.00 per share, the midpoint of the price range set forth on the cover page of this prospectus, the aggregate intrinsic value of our outstanding stock awards as of July 31, 2016 was $157.2 million, of which $72.6 million related to vested awards and $84.6 million related to unvested awards.
Quantitative and Qualitative Disclosures about Market Risk
Foreign Currency Exchange Risk
Our results of operations and cash flows are subject to fluctuations due to changes in foreign currency exchange rates, particularly changes in the Euro and British Pound Sterling. Due to the relative size of our international operations to date, our foreign currency exposure has been fairly limited and thus we have not instituted a hedging program. We expect our international operations to continue to grow in the near term and we are continually monitoring the foreign currency exposure to determine when we should begin a hedging program. The substantial majority of our agreements have been and we expect will continue to be denominated in U.S. dollars.
Interest Rate Sensitivity
We are exposed to market risks in the ordinary course of our business. These risks primarily include interest rate sensitivities. As of July 31, 2016, we had cash and cash equivalents of $79.9 million, which
73
Table of Contents
consisted primarily of bank deposits and money market funds. Such interest-earning instruments carry a degree of interest rate risk; however, historical fluctuations of interest income have not been significant.
We have not been exposed nor do we anticipate being exposed to material risks due to changes in interest rates. A hypothetical 100 basis point change in interest rates during any of the periods presented would not have had a material impact on our financial statements.
Recent Accounting Pronouncements
In May 2014, the Financial Accounting Standards Board (“FASB”) issued ASU No. 2014-09, Revenue from Contracts with Customers, which provides guidance for revenue recognition. This ASU affects any entity that either enters into contracts with customers to transfer goods or services or enters into contracts for the transfer of non-financial assets. This ASU will supersede the revenue recognition requirements in Topic 605, Revenue Recognition, and most industry-specific guidance. This ASU also supersedes some cost guidance included in Subtopic 605-35, Revenue Recognition-Construction-Type and Production-Type Contracts. ASU No. 2014-09 is effective for public entities for annual reporting periods, and interim periods within those annual reporting periods, beginning after December 31, 2017. Early adoption is permitted for all public entities only as of annual reporting periods, and interim periods within those annual reporting periods, beginning after December 15, 2016. The guidance allows for the amendment to be applied either retrospectively to each prior reporting period presented or retrospectively as a cumulative-effect adjustment as of the date of adoption. We are currently in the process of evaluating the effect this guidance will have on our consolidated financial statements and related disclosures.
In September 2015, the FASB issued ASU No. 2015-16, Simplifying the Accounting for Measurement-Period Adjustments. The new guidance simplifies the accounting for measurement period adjustments in connection with business combinations by requiring that an acquirer recognize adjustments to provisional amounts that are identified during the measurement period in the reporting period in which the adjustment amounts are determined. This guidance is effective for financial statements issued for fiscal years beginning after December 15, 2015, and interim periods within those fiscal years, with early adoption permitted. There was no impact from the application of the new guidance in the six months ended July 31, 2016.
In April 2015, the FASB issued ASU No. 2015-05, Intangibles—Goodwill and Other—Internal-Use Software (Subtopic 350-40): Customer’s Accounting for Fees Paid in a Cloud Computing Arrangement (“ASU 2015-05”). ASU 2015-05 provides guidance to clarify the customer’s accounting for fees paid in a cloud computing arrangement. ASU 2015-05 was effective for us in the first quarter of the year ending January 31, 2017 with early adoption permitted. There was no impact from the application of the new guidance in the six months ended July 31, 2016.
In August 2014, the FASB issued ASU No. 2014-15, Disclosures of Uncertainties About an Entity’s Ability to Continue as a Going Concern. This standard provides guidance on how and when reporting entities must disclose going-concern uncertainties in their financial statements. The guidance is effective for us in the year ending January 31, 2017. There was no impact from the application of the new guidance in the six months ended July 31, 2016.
In November 2015, the FASB issued ASU 2015-17, Balance Sheet Classification of Deferred Taxes, related to balance sheet classification of deferred taxes. The ASU requires that deferred tax assets and liabilities be classified as noncurrent in the statement of financial position, thereby simplifying the current guidance that requires an entity to separate deferred assets and liabilities into current and noncurrent amounts. The ASU will be effective for us beginning in the first quarter of fiscal year 2018 though early adoption is permitted. We have early-adopted the ASU as of January 31, 2015 and its statement of financial position as of this date reflects the revised classification of all deferred tax assets and liabilities as noncurrent. There is no other impact on our financial statements of early-adopting the ASU.
74
Table of Contents
In February 2016, the FASB issued ASU 2016-02, Leases. The new standard establishes a right-of-use (“ROU”) model that requires a lessee to record a ROU asset and a lease liability on the balance sheet for all leases with terms longer than 12 months. Leases will be classified as either finance or operating, with classification affecting the pattern of expense recognition in the income statement. The new standard is effective for fiscal years beginning after December 15, 2018, including interim periods within those fiscal years. Early adoption is permitted. A modified retrospective transition approach is required for lessees for capital and operating leases existing at, or entered into after, the beginning of the earliest comparative period presented in the financial statements, with certain practical expedients available. We are currently evaluating the impact of adopting ASU 2016-02 on our consolidated financial statements.
In March 30, 2016, the FASB issued ASU 2016-09, Improvements to Employee Share-Based Payment Accounting, which simplifies the accounting for share-based payment transactions, including accounting for income taxes, forfeitures, and classification in the statement of cash flows. The guidance is effective for public entities for annual periods beginning after December 15, 2016 and for all other entities for annual periods beginning after December 15, 2017. Early adoption is permitted. We are evaluating the accounting, transition and disclosure requirements of the standard and cannot currently estimate the financial statement impact of adoption.
75
Table of Contents
Mission
Our mission is to deliver “Value as a Service” by helping our customers maximize their spend under management, achieve significant cost savings and drive profitability.
Overview
We are the leading provider of a unified, cloud-based spend management platform that connects more than 460 organizations with more than 2 million suppliers globally. Our platform provides greater visibility into and control over how companies spend money. Using our platform, businesses are able to achieve real, measurable value and savings that drive their profitability. From our inception, our customers have used our platform to bring more than $250 billion of cumulative spend under management, which we estimate has resulted in more than $8 billion of customer savings to date, based on applying certain savings rates derived from industry benchmarks.
Our cloud-based platform has been designed for the modern global workforce that is mobile and expects real-time results, flexibility and agility from software solutions. We empower employees to acquire the goods and services they need to do their jobs, while significantly improving compliance with company policies in a seamless manner to employees. We do this by applying a distinctive user-centric approach that provides a mobile-enabled consumer Internet-like experience and drives widespread adoption of our platform by users in various departments, and, therefore, significantly increases spend under management. We refer to the process companies use to purchase goods and services as spend management and to the money that they manage with this process as spend under management. Increased user adoption and spend under management drive better visibility and control of a company’s spend, resulting in greater savings and increased compliance.
Economic conditions, intense competition and the global regulatory environment are forcing businesses to find new ways to drive operational efficiencies, track processes, reduce costs, fund business growth and enhance profitability and cash flow. Therefore, managing spend has increasingly become a major strategic business imperative to help businesses achieve cost savings. Indirect spend, which refers to goods and services that support a company’s operations, as opposed to direct spend that flows into the products a company manufactures, is particularly difficult to manage due to inefficient employee spending behavior and disparate systems that obstruct spend visibility.
We offer a unified, cloud-based spend management platform that is tightly integrated and delivers a broad range of capabilities that would otherwise require the purchase and use of multiple disparate point applications. The core of our platform consists of procurement, invoicing and expense management modules that form our transactional engine and capture a company’s spend. In addition, our platform offers supporting modules, including sourcing, analytics, contract management, supplier management, inventory management and storefront, that help companies further manage their spend. Moreover, through our free Coupa Open Business Network, suppliers of all sizes can easily interact with buyers electronically, thus significantly reducing paper, improving operating efficiencies and reducing costs. Our unified platform is also able to aggregate company-wide spend data and enable in-depth real-time spend analytics. Our open architecture and application programming interfaces (APIs) allow customers to integrate with several third-party software applications, including various enterprise resource planning (ERP) and financial systems, human capital management (HCM), inventory management and customer relationship management (CRM).
We have a strong results-driven and customer success-focused culture. Our focus is on delivering quantifiable business value to our customers by helping them maximize spend under management to achieve real, measurable value and savings. With a rapid time to deployment, typically ranging from a few weeks to several months, and an easy to use interface that shields users from complexity, our customers
76
Table of Contents
can achieve widespread user adoption quickly and generate savings within a short timeframe, thus benefitting from a rapid return on investment.
We benefit from powerful network effects. As more businesses subscribe to our platform, the collective spend under management on our platform grows. Greater aggregate spend under management on our platform attracts more suppliers, which in turn attracts more businesses that want to take advantage of the goods and services available through our platform, thereby creating powerful network effects. In addition, as more businesses and employees use our platform, the amount of spend under management continues to increase. This leads to more savings for customers and improves our ability to attract more businesses. The resulting increase in sales enables us to further invest in our platform and to improve our functionality and user interface to continue to attract more businesses and suppliers to our platform, which enhances the network effects that benefit all parties.
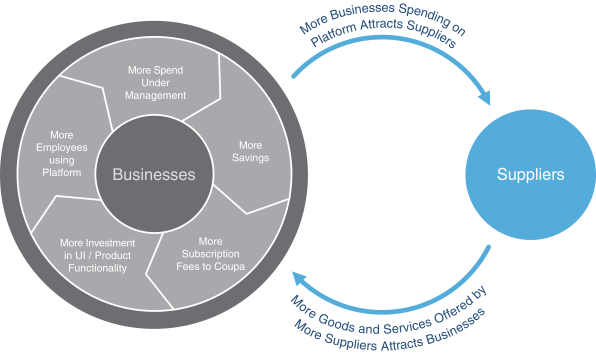
We have developed a rich partner ecosystem of systems integrators, implementation partners, resellers and technology partners. We work closely with several global systems integrators, including KPMG, Deloitte, Accenture, IBM, PwC and Wipro, that help us scale our business, extend our global reach and drive increased market penetration. We have trained more than 720 consultants to date who offer or implement spend management solutions powered by Coupa. We expect the number of our partner led implementations to continue to increase over time, as well as sales referrals from our partners.
77
Table of Contents
We have achieved rapid growth in customer adoption, cumulative spend under management and transactions conducted through our platform. We have more than 1.5 million licensed users who have driven an expansion in spend under management over time. These licensed users represent the employees among our base of more than 460 total customers who are authorized to use our solutions. Our cumulative spend under management and the transactions conducted through our platform are highlighted below:
| (1) | Includes purchase orders, invoices, and expense reports processed in the period |
The metrics presented above do not directly correlate to our revenue or results of operations because we do not charge our customers based on actual usage of our platform. However, we believe the cumulative spend under management and total transactions metrics do illustrate the adoption, scale and value of our platform, which we believe enhances our ability to maintain existing customers and attract new customers.
For our fiscal years ended January 31, 2015 and 2016, our revenues were $50.8 million and $83.7 million, respectively. Our net losses were $27.3 million and $46.2 million, respectively, for the fiscal years ended January 31, 2015 and 2016. For the six months ended July 31, 2015 and 2016, our revenues were $34.5 million and $60.3 million and our net losses were $25.1 million and $24.3 million, respectively.
Industry Background
Managing Spend has Become a Strategic Business Imperative
Economic conditions, intense competition and the global regulatory environment are forcing businesses to find new ways to drive operational efficiencies, track processes, reduce costs, fund business growth and enhance profitability and cash flow. Therefore, managing spend has increasingly become a major strategic business imperative to help businesses achieve cost savings that will enhance a company’s operating profit as well as free up monetary resources that can be reinvested in the company.
Businesses have two major categories of spend: direct and indirect. While direct spend refers to goods and services that are incorporated into products that a company manufactures, indirect spend refers to categories of goods and services that support a company’s business processes and are consumed by internal stakeholders. Indirect goods examples include office supplies, furniture, electronic equipment and consumables, while indirect services examples include telecommunication services, catering,
78
Table of Contents
transportation, lodging, marketing, consulting, information technology (IT) services, recruiting and temporary contract labor.
Indirect spend on goods and services is often more difficult to manage because of cumbersome, inefficient processes or disparate point applications used by different departments that lead to a lack of full spending visibility and inefficient spending behavior among employees. Businesses need a solution that will help them streamline their total spend, across all divisions and employees, not just the procurement department.
Businesses Lack Visibility Into Spend and Control Over their Spend
According to a 2014 report on indirect spend management published by Accenture, few businesses have full visibility into what they spend, on which products and services they spend and with which vendors they spend. Many businesses lack ways to track indirect spend and as a result typically control only 51% of their indirect spend according to the report. This lack of visibility, which leads to an inability to control spend, is due to several issues:
| • | Manual and Inefficient Processes. Businesses typically employ inefficient manual procurement, invoicing, expensing and approval processes that cannot be managed across the organization in real time. Employees are overwhelmed by manual processes and need to dig through significant amounts of data to find problem areas and process approvals. |
| • | Fragmented Systems That Limit Ability to Analyze And Optimize Spend. Businesses face different types of spend within their organizations: pre-approved spend, which refers to procurement of goods and services that is authorized by individual managers or predefined policies in advance of purchasing; post-approved spend, which refers to employee business expenses that are reimbursed subsequent to the expenditure; and unapproved spend, which denotes ongoing spend such as invoices for utilities or unauthorized spend by employees. In order to manage the different types of spend, businesses frequently utilize several point applications for procurement, invoicing, expense management and other functions. These point applications do not always integrate with each other, which makes it difficult to access, organize and analyze aggregated spend data across systems and to provide a Chief Procurement Officer, Chief Financial Officer or other decision maker with the analytics they need to optimize spend. |
| • | Lack of Employee Adoption of Existing Tools. Employee adoption of traditional procurement and other related offerings has typically been limited due to cumbersome user interfaces, need for training, lack of mobile capabilities and non-integrated point applications. Employees become frustrated because non-integrated and complex systems lead to delays and errors, resulting in inefficiencies, lost productivity and an inability to timely purchase the right goods or services that the employee needs to get his or her job done. This lack of employee adoption makes it more difficult for businesses to achieve visibility of aggregated spend and to influence employee spend behavior. |
| • | Maverick Spending. In many cases, because processes related to procurement, invoicing, expense management or inventory management are cumbersome, time-consuming and have unclear policies and guidelines, employees engage in “maverick spending” neglecting to purchase from preferred suppliers or purchasing without approval and outside of budgets. This maverick spending results in purchasing of goods and services at unfavorable prices or duplicative spending on previously purchased items stocked in inventory. |
| • | Lack of Compliance. Businesses often struggle to manage risk, to ensure compliance with respect to frequently changing governmental regulations and internal control policies (such as archiving, approval history and tax compliance) and to prevent potential fraud and corruption within the procurement process. |
79
Table of Contents
Businesses Need a Unified Spend Management Solution that Enables Real-Time Spend Analysis
The abundance of fragmented point applications on the market today that address specific areas of spend management has resulted in increased complexity for businesses and their employees.
Often employees have to access different systems or review electronic and paper files before they are able to make informed purchasing decisions. For example, employees need to check inventory to find out if the desired item is available, look through paper contract files to determine whether fixed prices with preferred suppliers have been negotiated, and review internal spreadsheets to identify whether the item is within budget. Subsequently, an employee typically accesses procurement software to make a purchasing order and receives an invoice after the item has been delivered. For the invoice to be validated, the quantities, price per unit and other terms appearing on the vendor’s invoice have to be compared to the information on the purchase order and to the quantities actually received. This is often a manual process, with the information dispersed across siloed systems, electronic files and paper files. In addition, spend behavior and adherence to internal policies cannot be analyzed easily since the transaction data is not stored in a central depository. These time-consuming and non-integrated processes result in errors, frustrated employees and sub-optimal decision making with respect to spending of company resources.
Businesses need a solution that not only provides seamless, cross-functional integration of process elements from advanced sourcing to purchase requisitioning to invoice payment, but also a single repository of data so that employees can see all the required information to make a prudent purchasing decision and to enable real-time spend analytics on this aggregated spend data.
Suppliers Want to Interact with Businesses Using a Solution that Maximizes their Revenues with Minimal Friction
Suppliers are increasingly seeking to collaborate with businesses electronically in an effort to eliminate inefficient paper-based processes, establish fast, accurate invoicing, and minimize errors that can cause disputes and delays resulting in lost revenues. In addition, the ability to transact electronically helps suppliers more easily comply with government regulations pertaining to the auditability and documentation of transactions as well as taxation, thus reducing risks. Suppliers often face difficulty connecting to the buyers’ network technology due to incompatible systems, lengthy onboarding processes and cumbersome web portals and web catalog features that are difficult to use. At the same time, suppliers are reluctant to pay access or membership fees often associated with web-based business networks given the increased cost of doing business for little perceived incremental value. As a result of the barriers related to cost, time and complexity, the supplier adoption of web-based business networks has been limited.
Advances in Technology Have Paved the Way for a Next Generation Cloud-Based Spend Management Platform
Advances in technology architectures have supported the rise of cloud computing. Mission-critical applications can be delivered reliably, securely and cost-effectively to customers over the Internet, without the need to purchase supporting hardware, software or ongoing maintenance. The lower total cost of ownership, better functionality and flexibility of cloud applications represents a compelling alternative to traditional on-premise solutions. In a December 2015 report, Gartner, Inc. indicated that it expects total cloud spending to increase from $204 billion worldwide in 2016 to $318 billion in 2019.
At the same time, with the widespread adoption of mobile devices and the use of consumer-oriented web and mobile applications that simplify and accelerate day-to-day activities, employees now expect their organizations to embrace more easy to use, intuitive, fast and collaborative business applications that are accessible anytime, anywhere and from a wide range of mobile devices.
As a result, cloud-based software applications with superior user interfaces and mobile capabilities have increasingly displaced legacy offerings in areas such as CRM, HCM and IT management. However, while there are several software offerings that automate business processes related to spend management,
80
Table of Contents
most of these software offerings are based on on-premise technology or legacy architectures from the 1990s.
Today, advancements in cloud computing, mobile devices, storage and networking are converging to enable new capabilities previously difficult to implement. Technology is enabling the development of powerful, intricate software solutions that address users’ demands for mobility, simplicity, speed and real-time access to data. These recent trends have paved the way for a next generation cloud-based advanced spend management platform that meets the needs of modern businesses.
Legacy Offerings Do Not Meet the Needs of Businesses, Employees and Suppliers
Many automated procurement offerings that are in the market today were developed in the late 1990s. These offerings traditionally consist of either add-on modules to ERP software that have been organically developed or acquired, or standalone offerings that only enable automation of parts of the spend management process but do not offer holistic spend management solutions. Limitations of these legacy offerings include:
| • | Insufficient or Non-Unified Product Functionality. Many vendors offer point applications that solve a specific business problem. Others have acquired different product suites that do not seamlessly integrate with each other. Many legacy offerings do not offer a comprehensive cloud-based spend management solution that provides procurement, invoicing and expense management, as well as sourcing, inventory management, contract management and other supporting modules in a single unified platform. In addition, some legacy offerings lack auditability and fail to provide effective functionality to promote compliance with business policies and governmental regulations. |
| • | Difficult to Use and Access. Legacy offerings lack a modern, easy to navigate user interface and were not originally designed to be accessed from multiple devices, including mobile devices. These offerings require a significant amount of user training. |
| • | Expensive to Deploy and Maintain Complex On-Premise Implementations. Several legacy offerings have traditionally been deployed on-premise, requiring substantial investments in IT infrastructure in order to implement, upgrade and maintain these offerings. |
| • | Long Time to Deployment. Legacy software implementations often can take several years to be deployed given the complexity of the software and training requirements. In addition, long upgrade cycles often result in outdated versions of applications running across different departments within organizations, making it difficult for businesses to respond to changes in their competitive and regulatory environments. |
| • | Lack of Configurability. Businesses also face challenges in configuring their legacy systems to meet their specific needs, as well as integrating them with third-party software applications. Due to their rigid architectures, legacy offerings are often inflexible and cannot be easily customized to meet customers’ business requirements so that businesses are often forced to adapt their business processes to the capabilities of the software. |
| • | Lack of Independence. Some legacy offerings are provided by vendors that have significant operations selling ERP systems or professional services. These vendors are naturally incentivized to promote their own ERP systems as opposed to providing seamless interoperability with a variety of ERP and other back-end systems that may exist in a customer environment. As a result, product implementation cycles can be long, costly and require significant training, support and services. |
| • | Limited Supplier Adoption. Many legacy systems come with built-in barriers to supplier adoption, including participation or transaction fees (usually to continue to receive orders on contracts they already had), which leads to friction as suppliers face an increased cost of doing business. In addition to the supplier network fees, suppliers often face difficulty connecting to the buyers’ |
81
Table of Contents
| network technology as a result of incompatible systems, lengthy onboarding processes and cumbersome web portals and web catalog features that can be difficult to use. Therefore, over time many legacy systems experience diminished supplier participation and involvement, resulting in manual and inefficient processes. |
| • | Pricing Models Discourage Adoption. Some legacy software providers charge businesses based on the number of processes or transactions the users complete. These pricing mechanisms, however, may disincentivize the use of the software technology instead of promoting it, thereby undermining adoption. |
Coupa’s Unified Cloud-Based Spend Management Platform
We offer a unified, cloud-based spend management platform that can significantly improve savings for businesses. The core of our platform consists of procurement, invoicing and expense management modules that form our transactional engine and capture a company’s spend. In addition, our platform offers supporting modules, including sourcing, analytics, contract management, supplier management, inventory management and storefront, that help companies further manage their spend. Moreover, through our free Coupa Open Business Network, suppliers of all sizes can easily interact with buyers electronically, thus significantly reducing paper, improving operating efficiencies and reducing costs.
Our platform provides businesses with real-time visibility into spending that is occurring company-wide and enables businesses to drive adoption of the platform and capture, analyze and control this spend, achieve real, measurable value and savings and directly improve their profitability:
| • | Drive Adoption. Our platform engages employees across the organization, not just in the procurement department. Our platform applies a distinctive user-centric approach that shields users from complexity and provides a mobile-enabled consumer Internet-like experience, thus enabling widespread adoption of our platform by employees as well as suppliers. By simplifying and automating various processes, our platform draws employees to purchase goods and services or expense items through the platform and attracts suppliers that want to seamlessly connect with buyers, thus significantly increasing spend that is flowing through the platform and can be managed. |
| • | Capture. Our transactional engine captures and has visibility into spend across an organization—pre-approved, post-approved and unapproved spend. The procurement module streamlines purchasing requisition and purchase order processes, allowing businesses to track and manage purchases in real time. Once approved, employee purchase orders are automatically sent to suppliers for fulfillment and invoicing. The invoicing module makes it easy for suppliers to send electronic invoices, while customers can easily configure invoice approval and matching rules so that invoices can be processed with little effort from the accounts payable team. Moreover, our expense management module that leverages mobile capabilities empowers employees to create expense reports on-the-go with minimal data entry requirements. Given purchase orders, invoices and expense reports flow through our platform and the data is stored centrally in a clean and organized fashion, businesses are able to observe the company-wide spending activities in real time. |
| • | Analyze. Our spending analytics capabilities provide intuitive spend analysis dashboards and reports that deliver real-time analytical insights that help businesses identify problems and make better spending decisions. Real-time analytical insight is critical to helping identify savings opportunities and risks, as well as isolating problem areas in the spending process to target improvement efforts. |
| • | Control. We help our customers control and streamline their spending activity, as well as realize efficiencies that result in real savings. For example, our contracts module makes negotiated contracts available across the organization, so that employees purchase from preferred suppliers and comply with negotiated rates. Through our sourcing module, customers can invite suppliers to real-time bidding and thus control how much they spend on goods and services. With our platform, |
82
Table of Contents
| customers can easily configure business rules that enable managers to approve or reject employee spending requests, as well as prevent excessive spend through built-in functionality that enables employees to review their spending against budget in real time. In addition, through intelligent features that benchmark employees’ spending, our platform incentivizes more frugal and responsible spending behavior and drives business expense compliance. |
| • | Save. Within a short timeframe, we help our customers realize measurable value and savings by taking advantage of pre-negotiated supplier discounts, achieving contract compliance, improving process efficiencies and reducing redundant and wasteful spending, as well as enable strategic sourcing via reverse auctions in which suppliers bid down prices at which they are willing to sell their goods and services to businesses. |
The modules of our unified platform are tightly integrated with each other. For example, our sourcing module can alert a manager that a contract in place for a product is about to expire. We can recommend that the manager conduct a reverse auction and invite a few preferred suppliers. After the auction, the business is awarded to a supplier pending contractual agreement. Through our contract module and our recent acquisition of Contractually, the manager is able to negotiate the details and agree on service level agreements before executing the contract. The supplier can take advantage of our storefront capabilities to make their product catalog available to the buyer via our Coupa Open Business Network. Next, the manager is able to either procure the product and receive an e-invoice from the supplier or expense the product while adhering to the negotiated contract terms, all via our transactional engine with procurement, invoicing and expense modules. In addition, our platform would prompt any employee trying to procure or expense the same product that a new contract with discounted rates from a preferred supplier is available, thereby driving behavioral change. Our inventory module helps the company track the product quantity stored in company warehouses and offices so that employees do not re-order items already in inventory. Our supplier management module helps a manager track the performance of the supplier in delivering the product on time and in meeting quality requirements. Lastly, our analytics module can help managers review spending trends associated with this specific product and analyze data on a per geography, per office location or even employee cost center level.
Key Benefits to Businesses
| • | Rapid Time to Value and Low Cost of Ownership. Our cloud-based model allows customers to quickly access and deploy our platform without the need to install and maintain costly infrastructure hardware and software necessary for on-premise deployment. This enables our customers to achieve fast time to value, with deployment times typically ranging from a few weeks to several months, compared to significantly longer deployment times for legacy offerings. In addition, we can seamlessly update our platform via the cloud and customers do not have to pay for expensive upgrades. The ease of use of our platform enables business users to quickly learn and use our platform without the need for expensive IT involvement for configuration and training. |
| • | Significant Savings Opportunity. Our platform enables businesses to achieve significant and sustainable savings that can translate into improved profitability. Our customers often start realizing benefits in a matter of days or weeks. For example, by taking advantage of automated order and invoice processing, early payment discounts, effective contract management and strategic sourcing, typical customers have achieved savings of 1% to 10% of their annual spend under management. Customers can achieve even higher savings through our Coupa Advantage program that leverages the collective buying power of hundreds of our global customers to pre-negotiate discounts and favorable contract terms with top suppliers. |
| • | High Employee Adoption Enables Better Visibility into Spend. Employee adoption is critical to the success of any company-wide roll-out of a spend management solution. The ease of use of our unified platform enables high adoption across users whether they are users in the procurement and |
83
Table of Contents
| finance department or employees in other departments. High employee adoption is the key to bringing more spend under management, which in turn leads to better spend visibility, increased compliance and auditability, tighter control and measurable value and savings. |
| • | Higher Supplier Adoption. Traditional procurement systems typically exhibit low supplier adoption due to barriers associated with cost, time and complexity, thus reducing the spend captured through the system. Complex, fee-based networks often engage only the largest suppliers with high transaction volumes and fail to attract smaller, local suppliers that may account for a substantial portion of an organization’s spend. With our platform, customers achieve strong supplier adoption as suppliers are motivated to join our network due to ease of enablement, flexibility and lack of supplier fees. As a result, customers benefit from better long-term relationships with suppliers of all sizes, realize process efficiencies, bring more spend under management and achieve higher savings. |
| • | Real-Time and Rich Data Leads to Superior Decision Making. Our platform aggregates spend data from disparate sources and translates the data into easy-to-understand yet powerful dashboards and reports, thus offering real-time visibility into a company’s spend and key process data. Chief Financial Officers and Chief Procurement Officers can utilize our analytics and reporting capabilities to review spend data by geography, by department, by supplier, by product or service or other relevant metrics. In addition, we provide benchmarking versus other companies and an ability to evaluate supplier performance that can help decision makers evaluate areas of improvement and make decisions that can lead to significant cost savings. We also identify opportunities for early payment discounts that lead to further cost savings for our customers. |
| • | Agility. Our unified spend management platform is designed for leading global businesses seeking highly flexible software that allows them to embrace changes in their operating and regulatory environments. Our configuration model allows customers to configure complex business rules and adapt our applications to meet their specific and changing requirements without having to write custom code or use expensive consultants. For example, our users can quickly and easily change the approval workflow processes that underlie their Coupa applications to support changes to delegation of authority in response to the organic growth of their business, acquisitions or different operating conditions. |
| • | Efficiency. Our platform can automate approval request processes that meet certain pre-defined rules set up by businesses, without the need to obtain additional approvals. For those requests that require additional approvals, we enable push notifications for decision makers who can approve or reject purchases quickly on their mobile devices or by pressing an icon within an e-mail, without the need to log in to any website or other software applications. This simplifies the lives of managers and leads to significant process efficiencies within the company as employees can quickly get the goods and services they need to be productive. Efficiency improvements with respect to placing procurement orders, as well as invoice and expense report processing, allow businesses to free up valuable resources and staff who can be deployed effectively elsewhere in the organization. |
| • | Enhanced Compliance. We drive enhanced compliance for businesses by providing greater spend visibility and control, effective approval processes and effortless spend documentation. Our solution offers enhanced auditability of spend with streamlined approval workflows and integrated archiving and documentation features. Our unique configurability enables customers to stay agile and respond quickly to changing government regulations. |
Key Benefits to Employees
| • | Consumer Internet-Like Experience Encourages Use of Platform. Our focus on an intuitive and simple user experience shields users from complexity and enables adoption of our platform by users with minimal training. As opposed to legacy systems that cause employee frustration and resistance, our |
84
Table of Contents
| web interface and mobile application provide employees with a user experience that is similar to that provided by consumer Internet leaders. As a result, employees are incentivized to use the platform more frequently since they are easily and quickly able to purchase or expense goods and services they require. Our applications are designed to minimize the number of steps needed to perform a task, thus simplifying the jobs of employees and their managers. Our platform can be pre-configured for a variety of personas within an organization, such as for Finance, Procurement, IT or Accounts Payable roles who each have different responsibilities and use cases. Those personas are only presented with the functionality needed for their role, thus removing unnecessary complexity and driving user adoption of the platform. In addition, we have the capability to automate expense approvals below a certain threshold, to save managers time and allow them to focus on expenses that truly need their attention. |
| • | Efficiently Acquire Goods and Services Needed to Fulfill Job Responsibilities. Complex software applications, needing to use multiple systems, inefficient approval processes and lack of knowledge regarding how to obtain approvals can lead to frustrating delays for employees. Using our spend management platform, employees are more efficiently able to procure the goods and services they need, while the complexities of compliance, budgeting, making sure existing stock items are not re-ordered, making sure approved vendors are used, are addressed by our platform in the background without needing to involve the employee. |
| • | Mobility. Our platform delivers an end user experience that can be accessed from anywhere in the world from any mobile device with an easy to use and intuitive user interface. Our platform is compatible with a number of mobile operating systems, including iOS (both iPhone and AppleWatch) and Android (including Blackberry support). |
| • | Convenience. Our platform leverages insights it gathers regarding procurement patterns and helps populate requests. As an example, if a lab technician frequently orders certain supplies, our platform makes it easy to populate their order to enable a more efficient shopping experience. As another example, our mobile app allows employees to capture receipts via their mobile device and eliminates the need to carry paper receipts for expense reimbursement. We also enable voice entry of expense items. |
| • | Faster Reimbursement. More efficient processes for expense management lead to faster reimbursement for employees. |
Key Benefits to Suppliers
| • | No Upfront or Ongoing Fees. Suppliers can join and transact on our Coupa Open Business Network for no fee, thus minimizing friction when interacting with businesses using our platform and reducing the cost of doing business. In addition, by connecting with a large number of buyers seamlessly through a single platform, suppliers can sell more volume, thus maximizing their revenues. |
| • | Speed and Flexibility. Suppliers can quickly register and connect with customers who invite them to the platform. Suppliers have the flexibility to choose whether they want to connect through the Coupa Supplier Portal or integrate directly through commerce eXtensible Markup Language (cXML) or electronic data interchange (EDI). They can also use Coupa Supplier Actionable Notifications, which are smart e-mail tools through which suppliers can transact with no registration required. |
| • | Eliminate Manual Processes. Our platform enables suppliers to eliminate manual invoicing and saves costs and improves efficiency by offering electronic invoicing to their customers. In addition, we help avoid errors and streamline the procurement and payment process. |
85
Table of Contents
| • | Real-Time Visibility into Invoice Status. Suppliers can use our platform to quickly get updates on invoice payment and processing status to manage and plan their finances, often through direct push notifications without having to log in to a portal. |
| • | Enhanced Compliance. Seamless audit, documentation and archiving of electronic purchase orders and invoices helps suppliers comply with changing government regulations, as well as avoid risks. |
| • | Manage Profile and Online Catalog. Suppliers have an opportunity to profile themselves on the Coupa Open Business Network and make their catalog of products and services available online not only for existing customers but also for prospective customers. |
Our Market Opportunity
Our unified, cloud-based spend management platform unites the three core aspects of spend management—procurement, invoicing and expense management—and has the ability to manage both direct and indirect spend. The total market for indirect and direct spend management is estimated at $16.0 billion in 2016, based on research by the following industry sources. International Data Corporation (IDC) estimates that the global market for procurement and invoicing applications that automate processes related to purchasing supplies, material and services will reach $4.3 billion in 2016 and will grow to $5.3 billion by 2019. According to Technavio market research sourced from ISI Securities EMIS, the global Software-as-a-Service (SaaS)-based market for expense management will reach $2.2 billion in 2016 and will grow to $3.2 billion in 2018. In addition, IDC estimates the market for supply chain management application software, which includes software related to logistics, production planning and inventory management, will reach $9.5 billion in 2016 and grow to $11.3 billion in 2019.
We believe that the market for unified spend management is largely untapped. For indirect spend alone, we estimate that the world’s largest 5,000 companies spend approximately $13 trillion. Based on industry benchmarks, we believe the annual savings opportunity is approximately 5% of total indirect spend or $650 billion per year. For the fiscal year ended January 31, 2016, we estimate that our customers have achieved approximately $2.89 billion in savings using our platform. We believe that the total number of companies addressable by our solution amounts to more than 187,000, which represents the number of worldwide companies with more than 500 employees, as estimated by the Capital IQ database. We believe we have a significant opportunity to continue to attract new customers and increase our sales by helping customers increase their spend under management, benefit from the value we create and realize significant cost savings.
Our Competitive Strengths
| • | Easy and Intuitive User Interface that Enables Widespread Employee Adoption. We deliver a user experience that is similar to the experience delivered by leading consumer Internet sites. Our focus on an intuitive and simple user experience shields our users from complexity and enables adoption of our platform by users with minimal training. Our applications are designed for use by the entire workforce, including senior managers and non-finance employees. |
| • | Unified Platform With Powerful Functionality. We offer a unified platform that is tightly integrated and delivers a broad range of capabilities to manage pre-approved spend, post-approved spend and unapproved spend that would otherwise require the purchase and use of multiple disparate point applications, such as procurement, invoicing, expense management, sourcing and contract management applications. By offering a unified platform with powerful functionality that integrates different modules, we deliver a comprehensive platform for customers to see, analyze and control spend across their entire company, thus significantly enhancing savings potential. In addition, our platform has the same user interface across all of our modules and users can go to the same front-end to fulfill their needs. This enables users to have a consistent experience and to only have to learn to use the platform once. |
86
Table of Contents
| • | Independence and Interoperability. We are exclusively focused on spend management software that increases savings for our customers. We are agnostic as to the ERP system and other back-end systems used by our customers and our open architecture enables interoperability with numerous software applications, back-end systems and other third-party offerings. Customers can use our API, flat files, cXML and EDI data formats or custom code to make seamless connections between our platform and their ERP platform, supplier or other third party-system. Millions of API transactions run through the platform on a daily basis. In addition, we work with a variety of services partners and are not incentivized to increase the size of our professional services business, which enables us to work with partners with whom our customers want us to work. |
| • | Powerful Network Effects. As more businesses subscribe to our platform, the collective spend under management on our platform grows. Greater aggregate spend under management on our platform attracts more suppliers, which in turn attracts more businesses that want to take advantage of the goods and services available through our platform, thereby creating powerful network effects. In addition, as more businesses and employees use our platform, the amount of spend under management continues to increase. This leads to more savings for customers and improves our ability to attract more businesses. The resulting increase in sales enables us to further invest in our platform and to improve our functionality and user interface to continue to attract more businesses and suppliers to our platform, which enhances the network effects that benefit all parties. |
| • | Architected from the Ground up as a Cloud Platform. We are 100% built from the ground up as a SaaS application delivered via the cloud. We did not transition a legacy offering to the cloud and we do not offer hybrid options. As a result, our total cost of ownership is low, our deployment times are short, and we can seamlessly deploy the latest updates and upgrades to all our customers via our cloud-based platform. We have partnered with Amazon Web Services (AWS) to ensure scalability and that we always have the computing power required to support our spend management platform and ensure rapid response times. We have delivered superior performance and reliability, with historical uptime consistently in excess of 99.9%. |
| • | Rich Partner Ecosystem. We have developed strong strategic relationships with a number of leading partners including global systems integrators, implementation partners and technology partners. We have partnerships with several global systems integrators, including KPMG, Deloitte, Accenture, IBM, PwC and Wipro, who help us scale our business, extend our global reach and drive increased market penetration. We have trained hundreds of consultants who offer and implement spend management solutions powered by our platform. We expect the number of our partner led implementations to continue to increase over time, as well as sales referred from our partners. We also have more than 30 technology partners including Dell Boomi, IBM (Emptoris) and Trustweaver. These alliances extend and enhance the capabilities of our platform by enabling us and the third parties to create integrations that can deliver a higher level of value to customers. |
| • | Results-Driven Culture. We have a relentless focus on real measurable customer success and work extensively with customers to achieve significantly improved business value in the form of savings through the use of our platform. We assist customers in identifying key performance indicators and utilize benchmark analysis with anonymized customer data from our cloud platform to help them measure their relative spend optimization performance against the overall market. We help businesses improve employee adoption, increase spend under management, bring suppliers on board and measure ourselves on how we can help businesses maximize their savings. |
| • | Higher Supplier Adoption. We do not charge suppliers any upfront or ongoing fees to participate in our Coupa Open Business Network and offer suppliers an easy and flexible way to interact with customers with minimal friction. As a result, suppliers are motivated to join our network and adopt our platform, which represents a significant competitive advantage over legacy vendors that often struggle with supplier adoption. |
87
Table of Contents
| • | Proprietary Data Enables Superior Insights. We aggregate all of a company’s transactions in a master data store that processes and automatically classifies it to provide clean, complete and cohesive data that can be immediately analyzed. Managers can use powerful built-in reports and dashboards to analyze spending behavior, find bottlenecks in workflows and view granular reports by commodity, supplier, location, cost center. In addition, we provide benchmarking versus other companies and an ability to evaluate supplier performance that can help decision makers evaluate areas of improvement and make decisions that can lead to significant cost savings. As the number of employees and amount of spend through our platform grows, we acquire more proprietary data that enables us to provide unique insights to our customers, thus strengthening our powerful value proposition. |
Growth Strategy
Key elements of our strategy include:
Expand Global Customer Base. We believe that there is a substantial opportunity for us to continue to increase the size of our customer base across a broad range of industries and companies. We estimate that our customer base of more than 460 customers represents less than 1% of the approximately 100,000 businesses worldwide with greater than 1,000 employees according to industry sources. As of July 31, 2016, we had offices in 12 countries and plan to expand our operations in Asia, Latin America and Australia. We plan to continue to invest in our sales force and strategic resellers to grow our customer base, both domestically and internationally.
Deepen Existing Customer Relationships. We plan to deepen our relationships with existing customers by driving additional employee adoption, selling to additional departments and divisions of the company and increasing spend under management. As we demonstrate value in the form of measurable value and savings, we may have opportunities to upsell additional modules and capture additional value from our existing customers.
Increase Direct and Services Spend Under Management on our Platform. Most of our spend management has historically focused on indirect spend. We have expanded our capabilities to offer spend management solutions that address direct spend and plan to increase direct spend transacted via our platform. We believe that we can build out our platform to successfully address direct spend in the future and achieve similar success as we have demonstrated in the indirect spend market. In addition, we plan to expand our services procurement capabilities to better cover contingent labor spending.
Continue to Innovate and Further Develop our Cloud Platform and Open Business Network. We have made significant investments in research and development and plan to continue extending the functionality and breadth of our applications in the future. We plan to continue our rapid innovation cycle.
Further Expand and Develop our Partner Ecosystem. We intend to further develop our existing partner ecosystem by establishing agreements with more systems integrators and implementation partners to provide broader customer and geographic coverage. We plan to continue our strategy of working with partners that will source and implement spend management opportunities that can be powered by our software.
88
Table of Contents
Our Platform’s Capabilities
Our unified, cloud-based spend management platform includes the following capabilities:
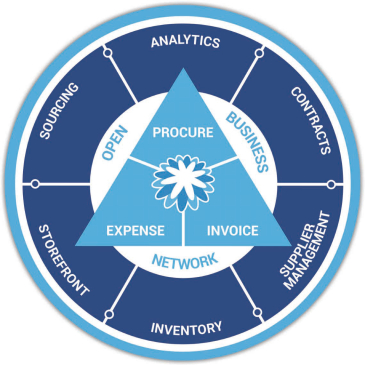
Coupa’s Transactional Engine
The core of our platform is our transactional engine, which is comprised of the following modules:
| • | Procurement. Our procurement module enables customers to strategically establish spend policies and approval rules to govern company spending. The application provides a consumerized e-commerce shopping experience so that employees can easily and quickly find the goods and services they need to do their jobs. Our procurement module streamlines purchasing requisition and purchase order processes, allowing businesses to track and manage purchases in real time, thus reducing time and cost. Upon approval of an employee request, purchase orders are automatically sent to suppliers for fulfillment and invoicing. Benchmark data allows customers to spot process inefficiencies, while configuration ease enables businesses to effortlessly adjust business processes to meet continually changing business requirements. |
| • | Invoicing. Our invoicing module enables customers to improve cash management through the effective management of supplier invoices via embedded dashboards and work queues that prioritize invoices with early payment discount opportunities. Customers may quickly configure invoice approval and matching rules so invoices can be routed without accounts payable team member effort and cost. Easy, no-cost means for suppliers to create electronic invoices that comply with government regulations allow businesses to eliminate paper and further reduce their invoice processing costs, all while reducing invoice payment fraud risk. |
| • | Expense Management. Our expense management module enables customers to gain control of the expenses incurred by employees. Innovative mobile capabilities such as GPS and geo-location make it easy for travelers to create expense reports on-the-go so businesses gain real-time expense |
89
Table of Contents
| visibility. Frugal meter capabilities automatically assess the appropriateness of employee charges based on the customer’s configured business processes. Seamless connectivity to credit card providers feed charges into our expense management module for added visibility and reporting ease. |
Supporting Modules
Our platform offers the following supporting modules that help companies further manage their spend:
| • | Sourcing. Our sourcing module enables customers to find the best suppliers for the goods or services they need to run their businesses. Customers easily create sourcing events containing the specifics of their business needs and invite suppliers to participate. Suppliers are able to review and bid effortlessly and without any fees to participate. Collaboration capabilities enable employees to review bids and provide feedback that is automatically compiled and scored. |
| • | Inventory. Our inventory module enables customers to manage spending by effectively managing physical goods and virtual licenses. Employees searching for goods see inventory on hand balances in the search results, which eliminates redundant spending. Embedded dashboards facilitate the move of inventory from warehouse to warehouse and predict item shortages so inventory managers can easily manage goods and licenses. The application automates fulfillment and keeps inventory in sync through regular cycle counts, discrepancy reports, and asset tags. |
| • | Contracts. Our contracts module enables customers to operationalize contracts and make them easily available for purchasing by employees across the organization. Contract compliance increases savings as employees make purchases using negotiated rates. Real-time contract enforcement and spend visibility is provided through embedded dashboards at both the contract and summary level. Full text search capabilities and automatic alerts remind employees to review contracts prior to expiration or auto-renewal dates. |
| • | Supplier Management. Our supplier management module enables customers to collect supplier information required to manage and pay their suppliers. Customers can quickly create unlimited data collection web forms using a drag and drop interface. Web forms may be tailored for country specific rules or supplier types. To make data collection easy, web forms are embedded as part of the natural business processes for procurement and invoicing. Real-time dashboards and reports show supplier data freshness and upcoming expirations. |
| • | Analytics. Our analytics module provides managers a large set of built-in reports and dashboards that allow users to see spending activity, find bottlenecks in workflows, analyze granular data by commodity, supplier, location and cost center, and drill-down into the spend transactions. We have created more than one hundred out-of-the-box reports covering some of the most important business metrics, such as unified spend for purchase orders, invoices or expense reports, spend trends over time, spend by commodity, supplier and contract; however, users can also create new metrics, reports and dashboards with our intuitive user interface, as well as include external data like corporate and travel expenses or integrate with third-party systems, to get a holistic view of their spend patterns. |
| • | Storefront. Our storefront module enables customers with a third-party procurement system to use our consumerized catalog search experience so employees can easily and quickly find the goods and services they need to do their jobs. Our storefront module works with third party procurement systems that support open catalog interface or cXML for catalog integration. |
Coupa Open Business Network
Our Coupa Open Business Network instantly connects businesses and suppliers without any setup or transaction fees, providing businesses with a platform that is accessible to suppliers of all sizes—even those
90
Table of Contents
typically ignored by fee-based closed networks—to drive success. Suppliers have a variety of options to connect with businesses including:
| • | Coupa Supplier Portal. This portal is a free tool for suppliers to easily do business with our customers. The Supplier Portal lets suppliers manage content and settings on a customer-by-customer basis, including managing company information, setting up purchase order transmission preferences, creating and managing online catalogs, managing procurement orders and invoices across multiple customers and gaining visibility to the status of invoices. |
| • | Coupa Supplier Actionable Notifications. These notifications enable suppliers to receive HTML purchaser orders and convert these purchase orders into invoices right from the procurement order e-mail, which represents the easiest way to submit electronic invoices through our platform. |
| • | Direct Connection via cXML and EDI. Our platform supports various communication formats such as cXML or EDI for suppliers that want to automate their invoicing through a tighter integration with our platform. |
| • | Direct E-mail. Suppliers can choose to send PDF invoices simply through e-mail. |
By using our Coupa Open Business Network, companies can become compliant with government mandates, increase profitability and reduce costs by driving electronic transactions from purchase order through e-invoice and payment visibility. Our Coupa Open Business Network user interface is easy to navigate and requires little to no training for suppliers to instantly manage transactions. Businesses are able to interact with thousands of suppliers already using our Supplier Portal, onboard new suppliers in minutes, integrate directly or simply use our smart e-mail tools. Businesses can also use the Coupa Open Business Network to layer on top of their existing technology, including third-party systems such as Oracle iProcurement, SAP SRM and others. All options are available to suppliers in a fee free model, with no supplier paid fees for signup or transactions. Suppliers of all sizes benefit, as they are able to join the networked economy without changing their technology or spending money on transaction fees.
Coupa Advantage
Coupa Advantage is a program available for all of our customers and leverages the collective buying power of more than 460 organizations and $250 billion in cumulative spend under management. This program helps drive immediate savings by offering pre-negotiated contracts with top suppliers across multiple categories and making that content available immediately in our environment. A portion of the savings generated from the Coupa Advantage program are donated to support humanitarian efforts by select charities, thus seamlessly embedding corporate social responsibility into B2B commerce and encouraging and enabling suppliers and their customers to give back to society.
Our Customers
As of July 31, 2016, we served more than 460 customers doing business in more than 100 countries and our platform was offered in more than 20 languages. We define a customer as a separate and distinct buying entity, such as a company, an educational or government institution, or a distinct business unit of a large corporation that has an active contract with us or our partner to access our platform.
Our customers include leading businesses in a diverse set of industries, including healthcare and pharmaceuticals, retail, financial services, manufacturing, and technology, amongst others. No individual customer represented more than 10% of revenues in the fiscal years ended January 31, 2015 or 2016 or for the six months ended July 31, 2016.
91
Table of Contents
The following table shows a representative list of our customers by industry category:
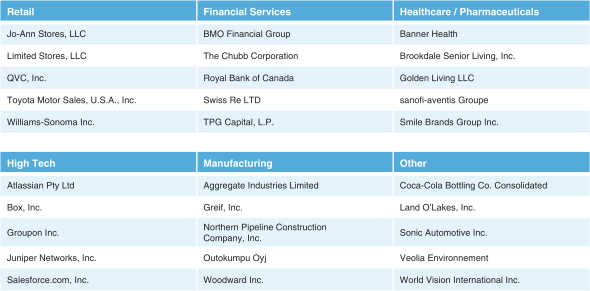
Note: Each customer listed in the table above generated revenue of at least $50,000 for Coupa during the fiscal year ended January 31, 2016.
Customer Case Studies
Avalon Health Care Group
Situation: Avalon, a premier provider of post acute and long-term medical care, needed to improve control of their business spend. The healthcare system was going through a challenging time and Avalon’s profit margins were reduced to less than 1%; however, only 40% of the company’s spend was being actively managed. They did not believe that legacy systems would afford them the ability to make better spend decisions at the time of the purchase. They felt that an easy to learn, intuitive system that would drive savings for the company and get employees back to patient care instead of back office processing was critical.
Solution and Benefits: Avalon selected Coupa because the platform provided employees the real time budget visibility required to make informed decisions at the time of purchase. In addition, the Coupa Open Business Network replaced an alternate supplier network that charged supplier fees. Coupa Spend Management was first provided to Avalon in January 2012. Avalon reported the following benefits:
| • | Realization of significant business savings of over $5,000,000* in the 12 months prior to the date of savings calculation. |
| • | Automated invoice processing that reduced Accounts Payable department invoice processing resources by over 70% and reduced typical time to approve purchase requests by 88% (from 48 hours to 8 hours). |
| • | Delivered real-time budget visibility at time of purchase request while providing contract compliance that increased company savings. |
| • | Achieved additional spend control through the adoption of Coupa Expenses, which was deployed in a rapid implementation of three weeks. |
| • | Consolidated financial processes across contract, procurement, invoicing and expense management, which delivered spend visibility across 60 locations. |
92
Table of Contents
The Fresh Market
Situation: The Fresh Market is a chain of gourmet supermarkets based in Greensboro, North Carolina. The company operates 168 stores in 27 states across the United States. The company lacked control and visibility into its distributed spend. An improved purchase and invoice system was needed that would require little to no employee training and one that would allow employees to stay on the sales floor instead of working on back office functions.
Solution and Benefits: The Fresh Market selected Coupa contracts, invoicing and procurement to consolidate spending and increase controls across their distributed grocery locations and improve accounts payable processes. Coupa Spend Management was first provided to The Fresh Market in April 2012. The Fresh Market reported the following benefits:
| • | Realization of significant business savings of over $1,000,000* in the 12 months prior to the date of savings calculation. |
| • | Reduced overpayments to suppliers through fully automated purchase order, receipt, and invoice matching. |
| • | An estimated 65% reduction in time required to create purchase requests, freeing up grocery related staff to return to sales floor. |
| • | Reduced typical invoice approval time from weeks to hours resulting in improved supplier relations. |
Molina Healthcare, Inc.
Situation: Molina, a Fortune 500 company, provides managed health care services under the Medicaid and Medicare programs and through the state insurance marketplaces. The company was expanding rapidly through acquisition and needed a centralized procurement solution. This would replace the functions being handled within individual business units and give the company consolidated visibility to sourcing, contracts, budgets, purchasing and invoicing.
Solution and Benefits: Molina selected Coupa contracts, invoicing and procurement to better leverage spending across the organization for increased savings. Coupa’s subscription-based SaaS delivery model played a significant part in Molina’s decision to choose Coupa over other solutions that required more resources to manage and maintain while decreasing supplier participation due to supplier fees and supplier contracts. Coupa was first provided to Molina in September 2011. Molina reported the following benefits:
| • | Improved operational efficiency by over 360% since September 2011. |
| • | Decreased risk through spend visibility and contract compliance. |
| • | Processed 3x the invoice volume with only 17% accounts payable headcount growth. |
| • | Mobile capability usage that reduced requisition approval times to under 48 hours on average. |
NEC Europe Ltd.
Situation: NEC Europe is a subsidiary of NEC Corporation, a leader in the integration of IT network technologies that benefit businesses and people around the world. The company faced a challenge to improve visibility and control of its European operation’s spending. The requirements for a new system were better controls and a more complete understanding of how NEC was spending money. In addition, the solution would need to be consistent with its IT strategy to put as much into the cloud as possible to reduce IT and total ownership costs.
Solution and Benefits: NEC Europe selected Coupa to enable better control and report on spend throughout Europe. The solution was chosen for its current feature set, rapid innovation cycles and
93
Table of Contents
commitment to customer success. NEC utilized Coupa capabilities across procurement, contracts, invoicing and sourcing to gain spend visibility and contract compliance. Coupa’s cloud-based, configurable technology provided enterprise-class operations, helping free up IT from expensive and unnecessary customization projects. Coupa was first provided to NEC Europe in December 2012. NEC Europe reported the following benefits:
| • | Realization of significant business savings of over $2,000,000* in the 12 months prior to the date of savings calculation. |
| • | Rapid implementation with full integration to its ERP within 3 months of project start and results within weeks of implementation. |
| • | Improved reporting of purchasing spend with visualization of expenditures on a daily, weekly, or monthly basis and full self-service spend report creation and scheduling. |
| • | More than 50% reduction in typical time to approve purchase requests. |
Service Corporation International
Situation: Service Corporation International, the largest provider of deathcare products and services in North America, employs over 25,000 people in more than 2,000 locations across the US, Canada and Puerto Rico. Business spending was distributed across individual locations and visibility to all spend from a centralized location was lacking. The workforce also required a solution which would require little training and offer full mobility in order to support their on the go work style. In addition, the localized business model required hundreds of thousands of small to medium sized suppliers with little technology savvy to connect and work with SCI electronically.
Solution and Benefits: Service Corporation International selected Coupa contracts, invoicing and procurement to get visibility of spending across their entire organization. The Coupa Open Business Network provided a no cost to supplier model that allowed suppliers to do business with SCI quickly and via email interface. In addition, Coupa’s 100% mobile solutions allowed 99% of SCIs employee base to process all purchases and approvals through Coupa while on the go, allowing employees to get back to family care instead of back office functions. Coupa was first provided to Service Corporation International in February 2012. Service Corporation International reported the following benefits:
| • | Realization of significant business savings of over $6,000,000* in the 12 months prior to the date of savings calculation. |
| • | Increased early payment discount capture rate and reduced overpayments to suppliers through full electronic invoice automation. |
| • | Processed 100% of direct and indirect spend through the Coupa platform, with approximately $1 billion in spend under management over the first 12 months of system use. |
| • | Negotiated additional supplier contract savings in sourcing events (saving over $390,000 in first sourcing event alone). |
| * | The foregoing calculations in the case studies were completed by the customers and Coupa using previous 12 month (from date of calculation) Coupa platform spend throughput applied against industry benchmark data. Measurement is of effectiveness and efficiency gained through spend processing using Coupa. |
Concentrix, a Wholly Owned Subsidiary of SYNNEX
Situation: In 2013, IBM and SYNNEX announced an agreement in which SYNNEX would acquire IBM’s worldwide customer care services business for $505 million. The acquisition would be combined with Concentrix, a wholly owned subsidiary of SYNNEX. As such, Concentrix might use and pay for IBM’s
94
Table of Contents
existing spend management platform or evaluate and select a new spend management platform. Concentrix considered rapid implementation and broad global capabilities to support the Concentrix’s worldwide operations to be key requirements.
Solution and Benefits: Concentrix selected Coupa as the platform that offered rapid implementation, global functionality with broad suite offerings for procurement, invoicing, expenses, and contracts, and could scale as the business grew both organically and through future acquisitions. Coupa was first provided to Concentrix in December 2013. Concentrix reported the following benefits:
| • | Realization of several million dollars in business savings since the implementation. |
| • | Achieved fast implementation, with an implementation covering 29 internal entities in 20 countries only five weeks from the effective date of its contract with Coupa. |
| • | Demonstrated agility through extending use of Coupa platform as Concentrix integrated IBM’s $1.2 billion CRM BPO Business. |
| • | Rapid end user and supplier adoption of new business processes covering expenses, procurement and invoices, which resulted in document processing savings, increased efficiencies and improved supplier relationships. |
Capital One
Situation: Capital One, an American financial services holding company specializing in credit cards, home loans, auto loans, banking and savings products, established a corporate initiative in 2015 to digitize its source-to-pay process. While Capital One’s customer-facing applications had long been known for their intuitive design and ease of use, its back office operations were still heavily manual and complex. Understanding that both external and internal customers expect and deserve the same degree of speed, digital capability and innovation, Capital One sought a solution that would transform its business processes in three ways: (i) to seamlessly integrate upstream and downstream functions from sourcing to invoicing; (ii) to provide a very intuitive, easily adopted system for tens of thousands of employees and suppliers; and (iii) to digitize routine and manual processes to increase efficiency and quality.
Solution and Benefits: Capital One selected Coupa as its platform for business spend, including expense management, sourcing, procurement, invoicing, contract management and spend analytics in September 2015. From a product standpoint, Capital One determined that Coupa’s unified cloud platform and open business network provided the required end-to-end integration across all facets of its procurement value chain, while the user-centric design would speed adoption and minimize training time. It also sought a partner that would challenge established practices, and it valued Coupa’s track record of innovation. Capital One is in the initial phases of its U.S. rollout and plans to expand internationally next year. Its goals for the global initiative include:
| • | 100% of spend captured in Coupa and 100% of purchases orders sent electronically. |
| • | 90% of addressable spend going through approved contracts. |
| • | 99% of invoices received electronically. |
| • | 80% of invoicing resources focused on strategic activities. |
Staples
Situation: Staples, a leading office supply company with more than 1,900 stores worldwide in 25 countries, is engaged in a procurement digital transformation process that is designed to generate savings on its approximately $3,000,000,000 of non-merchandise spend, which savings can then be reinvested into several strategic corporate growth initiatives. A key element of this transformation was selecting and deploying a global procure-to-pay system. The lack of such a system had previously limited its visibility and control over much of its spending and had been overloading its accounts payable department.
95
Table of Contents
Solution and Benefits: The evaluation team at Staples sought a cloud-based business spend platform that was more flexible and less expensive than traditional enterprise systems and would be easily and widely adopted by employees and suppliers. It concluded that Coupa was the most user-friendly of all the procure-to-pay systems it evaluated, and Staples accordingly implemented Coupa as the single platform for all its non-merchandise procurement in the United States and Europe in June 2015. In Europe, Staples plans to use Coupa to provide a unified view into its spend across many different ERP systems. Initial results from its deployment include:
| • | Digitalization of all purchasing contracts into a single system for complete visibility, including paper-based contracts that had been sitting in “desk drawers” or were otherwise hidden from view. |
| • | Increased collaboration and communication between its teams in procurement, accounts payable, finance and global technology – what Staples considered an “unexpected benefit” of the Coupa implementation. |
| • | Increased employee self-service, reducing the strain on its limited procurement resources. |
| • | Expanded adoption of digital purchase and invoice processes by its smaller suppliers. |
Procter & Gamble
Situation: Procter & Gamble (P&G), a global leader in consumer packaged goods with operations in approximately 70 countries worldwide, desired to automate and reduce complexity in its source-to-pay process. Its existing infrastructure, which included multiple customized instances of legacy offerings, had become inefficient and difficult to maintain, which resulted in increased business costs.
Solution and Benefits: In June 2015, P&G selected Coupa as the spend management platform to modernize and replace its existing sourcing, procurement, invoicing and contracts systems and to digitize its corporate spending processes. Its evaluation criteria focused on three business goals: (i) improving services to stakeholders (through a better user experience), (ii) creating process efficiencies (with a unified, transparent end-to-end platform) and (iii) reducing the overall cost of its solution support (by consolidating and simplifying systems). P&G went live on the Coupa spend management platform in February 2016. Since that time, the platform has expanded to cover all of its planned users across the United States and its worldwide suppliers. P&G plans to continue its rollout and be live with over 50,000 users across the majority of countries in which they operate by the middle to end of calendar 2017.
Our Culture and Employees
Our product development, employee behavior, performance reviews and interactions with customers are all driven by three guiding principles:
| • | ensure customer success; |
| • | focus on results; and |
| • | strive for excellence. |
We know that building and maintaining a remarkable culture benefits our customers and employees, who together make up the Coupa community. This strong focus on customer success, as defined by measurable business results, serves as the foundation for the successful execution of our strategy and, as a result, is critical for our growth agenda.
As of July 31, 2016, we employed 590 people. We also engage temporary employees and consultants. None of our employees is represented by a labor union. We have not experienced any work stoppages, and we consider our relations with our employees to be very good.
96
Table of Contents
Sales and Marketing
We sell our software applications through our direct sales organization and our partner program, Coupa Partner Connect. Our direct sales team is global and comprised of inside sales and field sales personnel who are organized by geography, account size and application type.
We generate customer leads, accelerate sales opportunities and build brand awareness through our marketing programs, including such programs with our strategic relationships. For example, we have joint marketing programs and sponsorship agreements with KPMG, Accenture and Wipro.
Our principal marketing programs include:
| • | use of our website to provide application and company information, as well as learning opportunities for potential customers; |
| • | field marketing events for customers and prospective customers; |
| • | territory development representatives who respond to incoming leads to convert them into new sales opportunities; |
| • | participation in, and sponsorship of, user conferences, executive events, trade shows and industry events; |
| • | customer programs, including regional user group meetings; |
| • | integrated marketing campaigns, including direct e-mail, online web advertising, blogs and webinars; |
| • | public relations, analyst relations and social media initiatives; |
| • | cooperative marketing efforts with partners, including joint press announcements, joint trade show activities, channel marketing campaigns and joint seminars; and |
| • | our annual INSPIRE user conference, which is held over two and a half days to connect customers, disseminate best practices, and reinforce our brand among existing and new customers. |
Partnerships and Strategic Relationships
As a core part of our strategy, we have developed an ecosystem of partners to extend our sales capabilities and coverage, to broaden and complement our application offerings and to provide a broad array of services that lie outside of our primary areas of focus.
Our partnerships increase our ability to grow and scale quickly and efficiently and allow us to maintain greater focus on executing against our strategy.
| • | Advisory and Referral Partners. Our Advisory and Referral partners provide global, national and regional expertise in spend management, procurement and expense management. They help organizations through operational transformation by leveraging process, best practices and new technology. These partners may refer customer prospects to us and assist us in selling to them. In return, we typically pay these partners a percentage of the first-year subscription revenue generated by the customers they refer. |
| • | Implementation Partners. In order to offer the full breadth of implementation services, change management, and strategic consulting services to our customers, we work with leading global and boutique consulting firms. We work closely with global leaders such as KPMG, Deloitte, Accenture, IBM, PwC and Wipro, as well as with boutique service providers that focus primarily on delivering implementation services for our applications, like The Hackett Group, Armanino, Xoomworks and Shelby Group. Our strategy is to enable the majority of our projects to be led by implementation partners with additional specialized support from us. Our implementation partners are highly |
97
Table of Contents
| skilled and trained by our team. When working with implementation partners, we are typically in a “co-sell” arrangement where we will sell our subscription directly to the customer and our partner will sell its implementation services directly to the customer. |
| • | Reseller Partners. Our reseller partners enhance our customer impact and extend our global presence with integrated technologies, applications, business process outsourcing (BPO) services and region-specific offerings. All of our reseller partners have been trained to demonstrate and promote our applications suites. Our reseller channel ranges from large, global players like IBM, to regional resellers in new markets and territories. Our reseller partners typically purchase our software solutions from us and resell them, integrated with their offerings to provide additional value to their customers. |
| • | Technology Partners. Our technology partners provide market-leading technology, complementary products and infrastructure-related services that power and extend our suite of cloud-based spend management applications. Our technology partners span a wide range of solutions providers including Dell Boomi, IBM (Emptoris) and Trustweaver that enhance the capabilities of our platform by facilitating integrations that can deliver a higher level of value to customers. |
Technology Infrastructure and Operations
The technologies used to build our platform and modules are native cloud and designed to scale to millions of users. We utilize a modern technology stack to take advantage of advancements in web-design, open source technologies, scalability and security. We have implemented industry-standard security practices to help us protect our servers and our customers’ critical information.
We have partnered with AWS to provide the hardware and infrastructure to support our spend management platform. With this partnership, we are able to easily scale the service during peak load periods, allowing us to continuously add users and customers without significant downtime or lead-time to procure new capacity. We also have the ability to offer our solutions globally across different physical locations, with hosting currently available in the U.S., Ireland and Australia.
Research and Development
Our ability to compete depends in large part on our continuous commitment to research and development and our ability to rapidly introduce new applications, technologies, features and functionality. Our research and development organization is responsible for the design, development, testing and certification of our applications. We focus our efforts on developing new applications and core technologies and further enhancing the usability, functionality, reliability, performance and flexibility of existing applications.
Research and development expenses were $11.9 million, $22.8 million and $15.0 million for the fiscal years ended January 31, 2015 and 2016 and for the six months ended July 31, 2016, respectively.
Competition
We believe the overall market for spend management software is highly competitive, marked by rapid consolidation, fragmented and rapidly evolving due to technological innovations. We have been recognized as a technology and market leader. For the second consecutive year, we have been recognized as a leader in Gartner’s 2016 Magic Quadrant for Procure-to-Pay Suites™ research report. Gartner evaluated full-suite procure-to-pay solutions from 12 different software vendors on 15 criteria, and recognized Coupa in the Leaders quadrant based on its ‘‘ability to execute’’ and ‘‘completeness of vision.’’ This year Coupa is positioned the highest for ability to execute.
98
Table of Contents
Our competitors fall into the following categories:
| • | Large enterprise software vendors such as Oracle Corporation and SAP AG that predominantly focus on database and ERP software solutions. SAP acquired both Ariba, Inc. and Concur Technologies, Inc. in 2012 and 2014, respectively, to form the core of their cloud offerings that compete with us. |
| • | Niche software vendors that either address only a portion of the capabilities we provide or predominantly focus on narrow industry verticals. |
We believe the principal competitive factors in our market include the following:
| • | focus on customer success; |
| • | ability to deliver measurable value and savings; |
| • | ability to offer a unified spend management platform; |
| • | ease of use; |
| • | widespread adoption by users; |
| • | time to deployment; |
| • | cloud-based architecture; |
| • | total cost of ownership; |
| • | configurability and agility; |
| • | rich reporting capabilities; |
| • | product extensibility and ability to integrate with other technology infrastructures; |
| • | independence; and |
| • | adoption by suppliers. |
We believe that we compare favorably on the basis of these factors. However, many of our competitors have greater financial, technical and other resources, greater name recognition and larger sales and marketing budgets; therefore, we may not compare favorably with respect to some or all of the factors above.
Source: Gartner, Magic Quadrant for Procure-to-Pay Suites, 13 June 2016
Gartner does not endorse any vendor, product or service depicted in its research publications, and does not advise technology users to select only those vendors with the highest ratings or other designation. Gartner research publications consist of the opinions of Gartner’s research organization and should not be construed as statements of fact. Gartner disclaims all warranties, expressed or implied, with respect to this research, including any warranties of merchantability or fitness for a particular purpose.
Intellectual Property
We rely on a combination of trade secrets, patents, copyrights and trademarks, as well as contractual protections, to establish and protect our intellectual property rights. While we have obtained or applied for patent protection for some of our intellectual property, we do not believe that we are materially dependent on any one or more of our patents. We require our employees, consultants and other third parties to enter into confidentiality and proprietary rights agreements and control access to software, documentation and other proprietary information.
99
Table of Contents
We pursue the registration of domain names, trademarks and service marks in the United States and in various jurisdictions outside the United States. We also actively seek patent protection covering inventions originating from our company.
We control access to and use of our proprietary technology and other confidential information through the use of internal and external controls, including contractual protections with employees, contractors, customers, and partners, and our software is protected by U.S. and international intellectual property laws. Our policy is to require employees and independent contractors to sign agreements assigning to us any inventions, trade secrets, works of authorship, developments and other processes generated by them on our behalf and agreeing to protect our confidential information. In addition, we generally enter into confidentiality agreements with our vendors and customers. We also control and monitor access to, and distribution of our software, documentation and other proprietary information.
Despite our efforts to protect our proprietary technology and our intellectual property rights, unauthorized parties may attempt to copy or obtain and use our technology to develop applications with the same functionality as our applications. Policing unauthorized use of our technology and intellectual property rights is difficult. In addition, we intend to expand our international operations, and effective protection of our technology and intellectual property rights may not be available to us in every country in which our software or services are available.
We and others in our industry have been, and we expect that we will continue to be, subject to third-party infringement claims as the number of competitors grows and the functionality of applications in different industry segments overlaps. Moreover, many of our competitors and other industry participants have been issued patents and/or have filed patent applications, and have asserted claims and related litigation regarding patent and other intellectual property rights. From time to time, third parties, including certain of these companies, have asserted patent, copyright, trademark, trade secret and other intellectual property rights within the industry. Any of these third parties might make a claim of infringement against us at any time.
Legal Proceedings
From time to time, we are party to litigation and subject to claims incident to the ordinary course of business. As our growth continues, we may become party to an increasing number of litigation matters and claims. The outcome of litigation and claims cannot be predicted with certainty, and the resolution of these matters could materially affect our future results of operations, cash flows or financial position. We are not presently party to any legal proceedings that in the opinion of management, if determined adversely to us, would individually or taken together have a material adverse effect on our business, operating results, financial condition or cash flows.
Regulatory
The legal environment of cloud-based businesses is evolving rapidly in the United States and elsewhere. The manner in which existing laws and regulations are applied in this environment, and how they will relate to our business in particular, both in the United States and internationally, is often unclear. For example, we sometimes cannot be certain which laws will be deemed applicable to us given the global nature of our business, including with respect to such topics as data privacy and security, taxation and intellectual property ownership and infringement.
Our customers, and those with whom they communicate using our applications, upload and store customer data onto our platform. This presents legal challenges to our business and operations, such as rights of privacy or intellectual property rights related to the content loaded onto our platform. Both in the United States and internationally, we must monitor and comply with a wide variety of laws and regulations regarding the data stored and processed on our platform as well as the operation of our business.
100
Table of Contents
In particular, data privacy and security with respect to the collection of personally identifiable information (PII) continues to be the focus of worldwide legislation and regulation. In recent years, there have been a number of well-publicized data breaches involving the unauthorized use and disclosure of individuals’ PII.
Many states have responded to these incidents by enacting laws requiring holders of personal information to maintain safeguards and to take certain actions in response to a data breach, such as providing prompt notification of the breach to affected individuals and state officials or amending existing laws to expand compliance obligations. Federal laws are also under consideration that may create additional compliance obligations and penalties. In the European Union, where companies must meet specified privacy and security standards, the Data Protection Directive and data protection laws of each of the European Member countries require comprehensive information privacy and security protections for consumers with respect to PII collected about them. As a result of the October 6, 2015 European Union Court of Justice (ECJ) opinion in Case C-362/14 (Schrems v. Data Protection Commissioner), the U.S.-EU Safe Harbor Framework is now considered, within the European Union (EU), to be an invalid means of legitimizing data transfers to the United States under the Data Protection Directive and its implementations into EU member state national law. In light of this ECJ opinion, we must now legitimize data transfers from the European Economic Area through the use of so-called ‘model contract clauses’ developed by the European Commission.
Certifications
We voluntarily obtain third-party security examinations relating to security and data privacy. Statement on Standards for Attestation Engagements (SSAE) No. 16 (Reporting on Controls at a Service Organization) replaced SAS-70 Type II examinations as the authoritative standard for reporting on service organizations. An independent third-party auditor conducts our SSAE examination every 12 months and addresses, among other areas, our physical and environmental safeguards for production data centers, data availability and integrity procedures, change management procedures, and logical security procedures.
We also obtain independent third-party audit opinions related to security and data privacy annually. Service Organization Controls (SOC) reports are covered under SSAE No. 16. We obtain an SOC 1 Type II and SOC 2 Type II report. The SOC 1 report includes a third-party assessment and opinion on our description of our system for processing transactions. The SOC 2 report is based on a set of standards related to security with a focus on internal controls related to unauthorized physical and logical access to systems and data.
Facilities
We lease approximately 48,000 square feet of space for our corporate headquarters in San Mateo, California pursuant to a master lease that expires in April 2019 and a sublease that expires in March 2017.
We have additional domestic offices in Chicago, New York and San Diego. We also have international offices in Australia, Canada, Germany, France, the Netherlands, Singapore, Sweden, Switzerland and the United Kingdom. We also lease offices for our support operations in Reno, Nevada; Dublin, Ireland; and Pune, India. We may further expand our facilities capacity as our employee base grows. We believe that we will be able to obtain additional space on commercially reasonable terms.
101
Table of Contents
Executive Officers, Key Employees and Directors
The following table sets forth information regarding our executive officers, key employees and directors, as of September 8, 2016:
| Name |
Age | Position(s) | ||||
| Executive Officers and Key Employees |
||||||
| Robert Bernshteyn(E) |
43 | Chief Executive Officer, Director and Chairman of the Board | ||||
| Todd Ford(E) |
50 | Chief Financial Officer | ||||
| Ravi Thakur(E) |
41 | Senior Vice President, Customer Success and Service Delivery | ||||
| Steven Winter(E) |
55 | Chief Revenue Officer | ||||
| Tom Aitchison |
55 | Executive Vice President, Global Sales | ||||
| Roger Goulart |
48 | Vice President, Business Development and Alliances | ||||
| Raja Hammoud |
45 | Vice President, Product Management | ||||
| JP Krishnamoorthy |
48 | Vice President, Engineering | ||||
| Ray Martinelli |
58 | Executive Vice President, People | ||||
| Tara Ryan |
50 | Chief Marketing Officer | ||||
| Jonathan Stueve |
40 | Vice President and General Counsel | ||||
| David Williams |
39 | Vice President, Technology | ||||
| Non-Employee Directors |
||||||
| Neeraj Agrawal(1) |
43 | Director | ||||
| Charles Beeler(2) |
45 | Director | ||||
| Leslie Campbell(3) |
58 | Director | ||||
| Roger Siboni(1)(3) |
61 | Lead Independent Director | ||||
| Tayloe Stansbury(2)(3) |
55 | Director | ||||
| Scott Thompson(1) |
58 | Director | ||||
| Frank van Veenendaal(2) |
57 | Director | ||||
| (1) | Member of the audit committee. |
| (2) | Member of the compensation committee. |
| (3) | Member of the nominating and corporate governance committee. |
| (E) | Executive Officer. |
Executive Officers
Robert Bernshteyn has served as our Chief Executive Officer and as a member of our board of directors since February 2009. Mr. Bernshteyn has also served as our Chairman of the Board since February 2009. From June 2004 to February 2009, Mr. Bernshteyn served in various positions, most recently as VP, Global Product Marketing & Management of SuccessFactors Inc., a provider of cloud-based HCM solutions. From June 2001 to May 2004, Mr. Bernshteyn served in various positions, most recently as a Director of Product Management at Siebel Systems, Inc. From June 1994 to March 1999, Mr. Bernshteyn served as Project Manager and Systems Integration Consultant of Accenture plc, a professional services company. Mr. Bernshteyn holds a B.S. in Information Systems from the State University of New York at Albany and an M.B.A. from Harvard Business School. We believe Mr. Bernshteyn should serve as a director based on his position as our Chief Executive Officer, his extensive experience in general management and software and platform development and his experience in the software industry.
102
Table of Contents
Todd Ford has served as our Chief Financial Officer since May 2015. Mr. Ford served as the Chief Financial Officer of MobileIron, Inc., a mobile IT platform company for enterprises, from December 2013 to May 2015. From June 2012 to July 2013, Mr. Ford served as the co-Chief Executive Officer and Chief Operating Officer of Canara, Inc., a provider of power systems infrastructure and predictive services. From July 2007 to December 2013, Mr. Ford also served as the Managing Director of Broken Arrow Capital, a venture capital firm he founded in July 2007. From April 2006 to May 2007, Mr. Ford served as President of Rackable Systems, Inc., a manufacturer of server and storage products for large-scale data center deployments (subsequently named Silicon Graphics International Corporation) and from December 2002 to April 2006, he served as Chief Financial Officer of Rackable Systems. Mr. Ford has served on the board of directors of Performant Financial Corporation since October 2011. Mr. Ford holds a B.S. in Accounting from Santa Clara University.
Ravi Thakur has served in a variety of roles since first joining Coupa in July 2007 and currently serves as our Senior Vice President, Customer Success and Service Delivery. From May 1997 to July 2007, Mr. Thakur served in a variety of roles at Oracle Corporation, an enterprise software company, most recently as Director of Application Development, Purchasing. Mr. Thakur holds a B.S. in Material Science Engineering from the University of California at Berkeley and an M.B.A. from University of California at Los Angeles Anderson School of Business.
Steven Winter has served as our Chief Revenue Officer since September 2016. From October 2014 to July 2016, Mr. Winter served as Executive Vice President, Worldwide Field Operations at Marketo, Inc. From January 2005 to September 2014, Mr. Winter served in a variety of executive roles at SAP AG, most recently as SAP’s Global Head of its Emerging Solutions organization. Mr. Winter holds a B.A. in Business Administration from Georgia State University.
Key Employees
Tom Aitchison has served as our Executive Vice President, Global Sales since January 2014. From 2012 to 2014, Mr. Aitchison served as Executive Vice President, Worldwide Sales at Watchdox, Inc. From 2008 to 2011, Mr. Aitchison served as Executive Vice President of Worldwide Sales of InQuira, Inc., a provider of enterprise knowledge applications. From 2007 to 2008, Mr. Aitchison served as Senior Vice President of Sales for the Americas of Sterling Commerce. From 2005 to 2008 Mr. Aitchison served as VP of Worldwide Sales at Comergent Technologies, Inc., a CPQ application company. From 2002 to 2005 Mr. Aitchison served as Senior Vice President of Sales & General Manager of webMethods, Inc., an enterprise integration company. Mr. Aitchison holds a B.S. in Finance from Arizona State University in Tempe, Arizona.
Roger Goulart has served as our Vice President, Business Development & Alliances since June 2012. From April 2010 to June 2012, Mr. Goulart served as Vice President of Strategic Accounts and Business Development at Okta Inc., a SaaS company. From November 2004 to April 2009, Mr. Goulart served as VP of Alliances of SuccessFactors Inc., a provider of cloud-based HCM solutions. From June 2002 to October 2004, Mr. Goulart served as Vice President of Alliances at Salesforce.com, Inc. a provider of cloud-based CRM solutions. Mr. Goulart holds a B.S. in Economics from Santa Clara University and an M.B.A. from Santa Clara University.
Raja Hammoud has served as our Vice President of Product Marketing and Management since March 2014, after first joining Coupa in April 2012 as our Vice President, Product Management. From July 2007 to November 2011, Ms. Hammoud served in the roles of Group Product Marketing Manager and Principal Product Manager at Adobe Systems, a software company. From December 2000 to July 2007, Ms. Hammoud served in various engineering and product management roles, most recently as Senior Director of Product Management at webMethods, an enterprise integration company. From May 2000 to
December 2000, Ms Hammoud served as Senior Software Engineer for Ventro Corporation, an enterprise
software company. Ms. Hammoud holds a B.S. in Computer Science with high distinction from the American University of Beirut, Lebanon.
103
Table of Contents
JP Krishnamoorthy has served as our Vice President, Engineering since August 2013. From September 2006 to August 2013, Mr. Krishnamoorthy served as Vice President of Product Development at Oracle Corporation, an enterprise software company. From December 1996 to August 2006, Mr. Krishnamoorthy held various positions, including Chief Technology Officer and Vice President of Engineering at Portal Software Inc. until its acquisition by Oracle Corporation. Mr. Krishnamoorthy holds an M.S. in Computer Science from Iowa State University and a B.S. in Computer Science and Engineering from Anna University in India.
Ray Martinelli has served as our Executive Vice President, People since November 2015. From September 2013 to October 2015, Mr. Martinelli served as Chief People Officer of Alfresco Software, an enterprise software company. From May 2006 to May 2013, Mr. Martinelli served as Chief People Officer of ServiceSource, a cloud-based managed services company. From February 2005 to January 2006, Mr. Martinelli served as Senior Vice President of Human Resources of Macromedia, a graphics, multimedia and web development software company that was acquired by Adobe Systems. From July 2000 to January 2005, Mr. Martinelli served as Vice President of Human Resources of Juniper Networks, a provider of networking products. Mr. Martinelli holds a B.A. in Organizational Communications from Sacramento State University and an M.A. in Organizational Development from Golden Gate University.
Tara Ryan has served as our Chief Marketing Officer since October 2014. From July 2011 to September 2014, Ms. Ryan served as Senior Vice President of Marketing at Proofpoint, Inc., a security company. From January 2008 to April 2011, Ms. Ryan served as Vice President of Marketing at Zebra Technologies Corporation, a tracking technology and solutions company. From March 2007 to January 2008, Ms. Ryan served as Vice President of Marketing at Navis Inc., a technology company. From March 2007 to January 2008, Ms. Ryan also served as Vice President of Marketing at SmartTurn, Inc., a SaaS company. From January 2004 to January 2006, Ms. Ryan served as Senior Vice President of Marketing at Ketera Technologies, Inc., an on-demand spend management solutions company. From January 2002 to June 2004, Ms. Ryan served as Senior Vice President of Marketing at NetSuite Inc., an enterprise software company. Ms. Ryan holds a B.A. in History from the University of California at Los Angeles and an M.A. in Transformative Leadership from the California Institute of Integral Studies in San Francisco.
Jonathan Stueve has served as our Vice President and General Counsel since January 2014. From December 2011 to January 2014, Mr. Stueve served as Vice President and General Counsel of Glam Media, Inc., a media and technology company. From January 2008 to December 2011, Mr. Stueve served in the roles of Director of Legal Affairs and Vice President and General Counsel of Ning, Inc., a social networking company that was acquired by Glam Media. From May 2005 to January 2008, Mr. Stueve served as Corporate Counsel at Opsware Inc., a provider of enterprise software that was acquired by Hewlett-Packard Company. From November 2001 to May 2005, Mr. Stueve was an attorney at Fenwick & West LLP. Mr. Stueve holds a J.D. from the University of Pennsylvania and a B.S. in Accounting from the University of Florida.
David Williams has served as our Vice President, Technology since March 2011 and has served in the roles of Director of Engineering and Senior Director of Technology since our inception in 2006. From August 1999 to February 2006, Mr. Williams served in a variety of roles, most recently as Group Manager of Application Development, Financials at Oracle Corporation, an enterprise software company. Mr. Williams holds a B.S. in Engineering & Applied Science and Literature from the California Institute of Technology.
Non-Employee Directors
Neeraj Agrawal has served as a member of our board of directors since January 2014. Since August 2007, Mr. Agrawal has served in the roles of managing member and general partner of Battery Ventures, a venture capital firm. He is a member of the board of directors of Wayfair, Inc. and previously served as a member of the board of directors of Marketo, Inc. and Bazaarvoice, Inc. Mr. Agrawal holds a B.S. in
104
Table of Contents
Computer Science from Cornell University and an M.B.A. from Harvard Business School. We believe Mr. Agrawal should serve as a director based on his extensive business experience in the software and web services industries, his experience in venture capital, and his service as a director of various public and private companies.
Charles Beeler has served as a member of our board of directors since August 2009. Since March 2013, Mr. Beeler has been a partner of Rally Ventures, and since December 1999, Mr. Beeler has been a general partner of El Dorado Ventures. Mr. Beeler holds an A.B. in Economics from Colby College and an M.B.A. from the University of Pennsylvania’s Wharton School. We believe Mr. Beeler should serve as a director based on his extensive business experience in the software and web services industries, his experience in venture capital, and his service as a director of various private companies.
Leslie Campbell has served as a member of our board of directors since May 2016. Ms. Campbell previously served as the Chief Procurement Officer for Reed Elsevier, Inc., from September 2007 to December 2012. Ms. Campbell served as the Vice President of Worldwide Procurement, from February 2003 to September 2007, and as Vice President and General Manager, Global Segment EMEA, from March 1998 to February 2003, at Dell, Inc. Ms. Campbell was Vice President, Corporate Purchasing at Oracle Corporation from May 1990 to January 1998, and a Senior Manager at KPMG Peat Marwick LLP, a member firm of KPMG International from August 1982 to May 1990. Since March 2013, Ms. Campbell has served as a member of the board of directors of Bideawee, Inc. Ms. Campbell holds a B.A. in Business Administration from the University of Washington. We believe Ms. Campbell is qualified to serve as a member of our Board of Directors because of her extensive experience in procurement and general management, her international experience in the technology industry, and her financial expertise.
Roger Siboni has served as a member of our board of directors since September 2014 and as our lead independent director since August 2016. Mr. Siboni previously served as the Chairman of the board of directors of E.piphany, Inc. from 2003 to 2005, and served as President and Chief Executive Officer of E.piphany from August 1998 to July 2003. From July 1996 to August 1998, Mr. Siboni was Deputy Chairman and Chief Operating Officer of KPMG Peat Marwick LLP, a member firm of KPMG International. From July 1993 to June 1996, Mr. Siboni was managing partner of KPMG Peat Marwick LLP’s information, communication and entertainment practice. Mr. Siboni also serves on the boards of directors of Dolby Laboratories, Inc. and Cadence Design Systems, Inc., and previously served on the board of directors of Marketo, Inc. Mr. Siboni holds a B.S. in Business Administration from the University of California at Berkeley. We believe Mr. Siboni is qualified to serve as a member of our Board of Directors because of his substantial corporate governance, operational and financial expertise gained as an executive at several companies in the technology and finance industries, including his experience as deputy Chairman and Chief Operating Officer at KPMG and his experience serving on the boards of directors of several public companies.
Tayloe Stansbury has served as a member of our board of directors since December 2015. Since May 2009, Mr. Stansbury has served in various roles at Intuit Inc., most recently as Executive Vice President and Chief Technology Officer. From December 2007 to May 2009, Mr. Stansbury served as Chief Information Officer of VMware Inc. From February 2001 to December 2007, Mr. Stansbury served in various roles at Ariba, Inc., most recently as Executive Vice President of Products and Operations. Mr. Stansbury holds an A.B. in Applied Mathematics from Harvard University. We believe Mr. Stansbury should serve as a director based on his extensive experience in general management and software and platform development and his experience in the software industry.
Scott Thompson has served as a member of our board of directors since May 2013. From July 2012 to July 2016, Mr. Thompson served as the Chief Executive Officer of ShopRunner, Inc. From January 2012 to May 2012, Mr. Thompson served as the Chief Executive Officer of Yahoo!, Inc. From February 2005 to February 2008, Mr. Thompson served as Chief Technology Officer, and from March 2008 to January 2012 served as President of PayPal, Inc. From September 1998 to January 2005, Mr. Thompson served as
105
Table of Contents
Executive Vice President of Inovant, LLC. From September 1993 to September 1998, Mr. Thompson served as Chief Information Officer of Barclays Global Investors. Mr. Thompson previously served on the board of directors of F5 Networks, Inc., Splunk Inc. and Yahoo! Inc. Mr. Thompson holds a B.S. in Accounting from Stonehill College. We believe Mr. Thompson should serve as a director based on his extensive experience in general management and software and platform development, his experience in the software industry, his financial expertise, and his service as a director of various private companies.
Frank van Veenendaal has served as a member of our board of directors since December 2015. Since February 2015, Mr. van Veenendaal has served as a member of the board of directors of Vlocity, Inc. From February 2012 to February 2015, Mr. van Veenendaal served as Vice Chairman of Salesforce.com, Inc. From February 2007 to February 2012, Mr. van Veenendaal served as Chief Sales Officer and President, Worldwide Sales at Salesforce.com, Inc. Mr. van Veenendaal has served on the board of directors of New Voice Media, Inc. since May 2015. We believe Mr. van Veenendaal should serve as a director based on his extensive experience in general management and software and platform development and his experience in the software industry.
Family Relationships
There are no family relationships among any of our directors or executive officers.
Director Independence
Our common stock has been approved for listing on the Nasdaq Global Select Market. Our board of directors has determined that none of our non-employee directors has a relationship that would interfere with the exercise of independent judgment in carrying out the responsibilities of a director and that each of these directors is “independent” as that term is defined under the rules of the Nasdaq Global Select Market.
Audit committee members must also satisfy the independence rules in Securities and Exchange Commission, or SEC, Rule 10A-3 adopted under the Securities Exchange Act of 1934, as amended. In order to be considered independent for purposes of Rule 10A-3, a member of an audit committee of a public company may not, other than in his or her capacity as a member of the audit committee, the board of directors, or any other board committee: accept, directly or indirectly, any consulting, advisory or other compensatory fee from the listed company or any of its subsidiaries, or be an affiliated person of the listed company or any of its subsidiaries. Each of Roger Siboni, Scott Thompson and Neeraj Agrawal qualify as an independent director pursuant to Rule 10A-3. We also intend to satisfy the audit committee independence requirement of the Nasdaq Global Select Market.
Board Composition
Our board of directors currently consists of eight members, who were elected pursuant to the amended and restated voting agreement that we entered into with certain holders of our common stock and certain holders of our preferred stock and the related provisions of our amended and restated certificate of incorporation.
The provisions of this voting agreement will terminate upon the completion of this offering, after which there will be no further contractual obligations regarding the election of our directors. Our directors hold office until their successors have been elected and qualified or appointed, or the earlier of their death, resignation or removal.
Immediately after the completion of this offering, our board of directors will be divided into three classes with staggered three-year terms. At each annual meeting of stockholders, the successors to directors whose terms then expire will be elected to serve from the time of election and qualification until the third annual meeting following election. Our directors will be divided among the three classes as follows:
| • | the Class I directors will be Neeraj Agrawal, Charles Beeler and Scott Thompson, and their terms will expire at the annual meeting of stockholders to be held in 2017; |
106
Table of Contents
| • | the Class II directors will be Roger Siboni and Tayloe Stansbury, and their terms will expire at the annual meeting of stockholders to be held in 2018; and |
| • | the Class III directors will be Robert Bernshteyn, Leslie Campbell and Frank van Veenendaal, and their terms will expire at the annual meeting of stockholders to be held in 2019. |
Directors in a particular class will be elected for three-year terms at the annual meeting of stockholders in the year in which their terms expire. As a result, only one class of directors will be elected at each annual meeting of our stockholders, with the other classes continuing for the remainder of their respective three-year terms. Each director’s term continues until the election and qualification of his or her successor, or the earlier of his or her death, resignation or removal.
Our amended and restated certificate of incorporation and amended and restated bylaws that will be in effect upon the completion of this offering provide that only our board of directors can fill vacant directorships, including newly-created seats. Any additional directorships resulting from an increase in the authorized number of directors would be distributed pro rata among the three classes so that, as nearly as possible, each class would consist of one-third of the authorized number of directors.
The classification of our board of directors may have the effect of delaying or preventing changes in our control or management. See “Description of Capital Stock—Anti-Takeover Provisions—Certificate of Incorporation and Bylaws Provisions.”
Board Oversight of Risk
One of the key functions of our board of directors is informed oversight of our risk management process. In particular, our board of directors is responsible for monitoring and assessing strategic risk exposure. Our executive officers are responsible for the day-to-day management of the material risks we face. Our board of directors administers its oversight function directly as a whole, as well as through various standing committees of our board of directors that address risks inherent in their respective areas of oversight. For example, our audit committee is responsible for overseeing the management of risks associated with our financial reporting, accounting and auditing matters; our compensation committee oversees the management of risks associated with our compensation policies and programs; and our nominating and corporate governance committee oversees the management of risks associated with director independence, conflicts of interest, composition and organization of our board of directors and director succession planning.
Board Committees
Our board of directors has established an audit committee, a compensation committee and a nominating and corporate governance committee. Our board of directors may establish other committees to facilitate the management of our business. Our board of directors and its committees set schedules for meeting throughout the year and can also hold special meetings and act by written consent from time to time, as appropriate. Our board of directors has delegated various responsibilities and authority to its committees as generally described below. The committees will regularly report on their activities and actions to the full board of directors. Each member of each committee of our board of directors qualifies as an independent director in accordance with the listing standards of the Nasdaq Global Select Market. Each committee of our board of directors has a written charter approved by our board of directors. Upon the completion of this offering, copies of each charter will be posted on our website at www.coupa.com under the Investor Relations section. The inclusion of our website address in this prospectus does not include or incorporate by reference the information on our website into this prospectus. Members serve on these committees until their resignation or until otherwise determined by our board of directors.
107
Table of Contents
Audit Committee
The members of our audit committee are Roger Siboni, Scott Thompson and Neeraj Agrawal, each of whom can read and understand fundamental financial statements. Each of Messrs. Siboni, Thompson and Agrawal is independent under the rules and regulations of the SEC and the listing standards of the Nasdaq Global Select Market applicable to audit committee members. Mr. Siboni is the chair of the audit committee. Our board of directors has determined that each of Messrs. Siboni and Thompson qualify as an audit committee financial expert within the meaning of SEC regulations and meet the financial sophistication requirements of the Nasdaq Global Select Market.
Our audit committee assists our board of directors with its oversight of the integrity of our financial statements; our compliance with legal and regulatory requirements; the qualifications, independence and performance of the independent registered public accounting firm; the design and implementation of our internal audit function and risk assessment and risk management. Among other things, our audit committee is responsible for reviewing and discussing with our management the adequacy and effectiveness of our disclosure controls and procedures. The audit committee also discusses with our management and independent registered public accounting firm the annual audit plan and scope of audit activities, scope and timing of the annual audit of our financial statements, and the results of the audit, quarterly reviews of our financial statements and, as appropriate, initiates inquiries into certain aspects of our financial affairs. Our audit committee is responsible for establishing and overseeing procedures for the receipt, retention and treatment of any complaints regarding accounting, internal accounting controls or auditing matters, as well as for the confidential and anonymous submissions by our employees of concerns regarding questionable accounting or auditing matters. In addition, our audit committee has direct responsibility for the appointment, compensation, retention and oversight of the work of our independent registered public accounting firm. Our audit committee has sole authority to approve the hiring and discharging of our independent registered public accounting firm, all audit engagement terms and fees and all permissible non-audit engagements with the independent auditor. Our audit committee will review and oversee all related person transactions in accordance with our policies and procedures.
Compensation Committee
The members of our compensation committee are Frank van Veenendaal, Charles Beeler and Tayloe Stansbury. Mr. van Veenendaal is the chair of the compensation committee. Each member of our compensation committee is independent under the rules and regulations of the SEC and the listing standards of the Nasdaq Global Select Market applicable to compensation committee members. Our compensation committee assists our board of directors with its oversight of the forms and amount of compensation for our executive officers, and the administration of our incentive plans for employees and other service providers, including our equity incentive plans, and certain other matters related to our compensation programs.
Nominating and Corporate Governance Committee
The members of our nominating and corporate governance committee are Leslie Campbell, Roger Siboni and Tayloe Stansbury. Our nominating and corporate governance committee assists our board of directors with its oversight of and identification of individuals qualified to become members of our board of directors, consistent with criteria approved by our board of directors, and selects, or recommends that our board of directors selects, director nominees; develops and recommends to our board of directors a set of corporate governance guidelines and oversees the evaluation of our board of directors.
Code of Conduct
Our board of directors has adopted a Code of Conduct, or the Code. The Code applies to all of our employees, officers, directors, contractors, consultants, suppliers, and agents. Upon the completion of this offering, the full text of our code of conduct will be posted on our website at www.coupa.com under the Investor Relations section. We intend to disclose future amendments to, or waivers of, our Code, as and to
108
Table of Contents
the extent required by SEC regulations, at the same location on our website identified above or in public filings. Information contained on our website is not incorporated by reference into this prospectus, and you should not consider information contained on our website to be part of this prospectus or in deciding whether to purchase shares of our common stock.
Compensation Committee Interlocks and Insider Participation
During the fiscal year ended January 31, 2016, the following directors served on our compensation committee: Charles Beeler, Robert Bernshteyn, Jonathan Ebinger, Roger Siboni and Tayloe Stansbury. Mr. Bernshteyn is our Chief Executive Officer. None of our executive officers serves, or served during the fiscal year ended January 31, 2016, as a member of the board of directors or compensation committee of any other entity that has or has had one or more executive officers serving as a member of our board of directors or our compensation committee. Each of Charles Beeler and Jonathan Ebinger may be deemed to have an interest in certain transactions requiring disclosure under Item 404 of Regulation S-K under the Securities Act of 1933, as amended, or the Securities Act, that are disclosed in “Certain Relationships and Related Party Transactions,” which disclosure is hereby incorporated by reference in this section.
Director Compensation
Prior to this offering, we have generally not provided any cash compensation to our non-employee directors for their service on our board. We have a policy of reimbursing all of our non-employee directors for their reasonable out-of-pocket expenses in connection with attending board of directors and committee meetings. From time to time we have granted stock options to certain of our non-employee directors, typically in connection with a non-employee director’s initial appointment to our board.
We have approved a compensation program for non-employee directors to become effective following our initial public offering. Pursuant to this program, non-employee directors will receive the following cash compensation:
| Position |
Annual Retainer | |||
| Board Member |
$ | 30,000 | ||
| plus (as applicable): |
||||
| Lead Director |
$ | 11,000 | ||
| Audit Committee Chair |
$ | 25,000 | ||
| Other Audit Committee Member |
$ | 10,000 | ||
| Compensation Committee Chair |
$ | 15,000 | ||
| Other Compensation Committee Member |
$ | 5,000 | ||
| Nominating/Corporate Governance Chair |
$ | 7,000 | ||
| Other Nominating/Corporate Governance Committee Member |
$ | 3,500 | ||
We will continue to reimburse our non-employee directors for their reasonable expenses incurred in connection with attending board of directors and committee meetings.
In addition, on the date of each annual meeting of stockholders, each non-employee director who will continue to serve on our board of directors will be granted an “annual equity award” under our 2016 Equity Incentive Plan consisting of restricted stock units with a value of $150,000. Each person who first becomes a non-employee director will receive a pro-rated annual equity award under our 2016 Equity Incentive Plan consisting of restricted stock units with a value of $150,000 multiplied by a fraction (i) the numerator of which is the number of whole months remaining until the one-year anniversary of the most recent annual meeting of stockholders and (ii) the denominator of which is 12. Each annual equity award and pro-rated annual equity award will be converted into a number of restricted stock units using the average closing price of our common stock over the 30-trading day period ending on the date of grant.
109
Table of Contents
Each award will vest in full on the earlier of the one-year anniversary of the date of grant or on the date of the next annual meeting of stockholders. The awards will also vest in full in the event of a “change in control” (as defined in our 2016 Equity Incentive Plan).
Fiscal 2016 Director Compensation Table
The following table sets forth information regarding the compensation of our directors during our fiscal year ended January 31, 2016, other than a director who is also one of our named executive officers.
| Name |
Option Awards ($)(1)(2) | Total ($) | ||||||
| Neeraj Agrawal |
— | — | ||||||
| Charles Beeler |
— | — | ||||||
| Roger Siboni |
— | — | ||||||
| Tayloe Stansbury |
447,217 | 447,217 | ||||||
| Scott Thompson |
50,984 | 50,984 | ||||||
| Frank van Veenendaal |
516,732 | 516,732 | ||||||
| Jonathan Ebinger(3) |
— | — | ||||||
| Bryan Stolle(3) |
— | — | ||||||
| (1) | Messrs. Stansbury and van Veenendaal each received an option to purchase 171,847 shares of our common stock in connection with their appointment to our board of directors, and Mr. Thompson received an option to purchase 27,500 shares of our common stock. These options vest monthly over 36 months of service and fully vest in the event of a change in control before the director’s service terminates. |
| (2) | The amounts in this column represent the aggregate grant date fair value of option awards granted to the director in the applicable fiscal year, computed in accordance with FASB ASC Topic 718. For a discussion of the assumptions made in determining the grant date fair value of our equity awards, see Note 12 to our audited financial statements included elsewhere in this prospectus. As of January 31, 2016, Mr. Siboni held options to purchase 140,093 shares of our common stock, Mr. Stansbury held options to purchase 171,847 shares of our common stock, Mr. Thompson held options to purchase 127,263 shares of our common stock and Mr. van Veenendaal held 167,074 unvested shares of our common stock which were early exercised and are subject to our right of repurchase. |
| (3) | Messrs. Ebinger and Stolle each resigned effective December 1, 2015. |
110
Table of Contents
Fiscal 2016 Summary Compensation Table
The following table sets forth information regarding the compensation of our chief executive officer and our two other most highly compensated executive officers during the fiscal year ended January 31, 2016. We refer to these individuals as our “named executive officers.”
| Name and Principal Position |
Year | Salary ($) |
Bonus ($)(1) |
Option Awards ($)(2) |
Non-Equity Incentive Plan Compensation ($) |
All Other Compensation ($) |
Total ($) |
|||||||||||||||||||||
| Robert Bernshteyn |
2016 | 320,833 | 341,000 | 866,732 | — | 10,600 | (5) | 1,539,165 | ||||||||||||||||||||
| Chief Executive Officer |
||||||||||||||||||||||||||||
| Tom Aitchison |
2016 | 250,000 | — | — | 246,979 | (3) | — | 496,979 | ||||||||||||||||||||
| Executive Vice President, Global Sales |
||||||||||||||||||||||||||||
| Todd Ford(4) |
2016 | 205,369 | 90,788 | 1,277,764 | — | 8,750 | (5) | 1,582,671 | ||||||||||||||||||||
| Chief Financial Officer |
||||||||||||||||||||||||||||
| (1) | Reflects cash bonuses pursuant to our annual bonus program, in the case of Mr. Ford pro-rated based to reflect his partial year of employment. |
| (2) | The amounts in this column represent the aggregate grant date fair value of option awards granted to the officer in the applicable fiscal year, computed in accordance with FASB ASC Topic 718. For a discussion of the assumptions made in determining the grant date fair value of our equity awards, see Note 12 to our audited financial statements included elsewhere in this prospectus. |
| (3) | Reflects sales commissions. |
| (4) | Mr. Ford’s first day of employment was May 4, 2015. |
| (5) | Reflects a 401(k) matching contribution made by us under a matching program available to all participating employees. |
Narrative Disclosure to Summary Compensation Table
The compensation of our named executive officers generally consists of base salary, annual cash incentive compensation and equity compensation.
The salaries of our named executive officers are typically reviewed annually and adjusted when our board of directors or compensation committee determines an adjustment is appropriate.
Messrs. Bernshteyn and Ford are eligible for cash bonuses pursuant to our annual bonus program. Each officer has a target bonus stated either as a fixed amount or as a percentage of the officer’s base salary. For fiscal 2016, actual bonuses were discretionary and depended on both company and individual performance. A portion of each officer’s bonus was determined and awarded in December 2015. The remaining portion was determined in March 2016, after the close of our fiscal year and in connection with our annual employee review process. These amounts are reflected in the “Bonus” column of the Fiscal 2016 Summary Compensation Table above. For fiscal 2016, Mr. Aitchison’s cash incentive compensation consisted of commissions based on sales. These amounts are reflected in the “Non-Equity Incentive Plan Compensation” column of the Fiscal 2016 Summary Compensation Table above.
Prior to this offering, the equity compensation granted to our named executive officers has generally consisted of stock options. For a description of the options granted to our named executive officers in fiscal 2016, please see the “Outstanding Equity Awards at 2016 Fiscal Year-End” table below.
In February 2016, we granted Mr. Bernshteyn an option to purchase 545,000 shares of our common stock and granted Mr. Ford an option to purchase 120,500 shares of our common stock. Each of these
111
Table of Contents
options has an exercise price of $7.88 per share and vests as follows: 1/36 of the option shares vest on February 1, 2017, with 1/36th of the option shares vesting monthly thereafter. These options are eligible to vest on an accelerated basis as described in “Severance and Change in Control Benefits” below.
In September 2016, we granted Mr. Bernshteyn an option to purchase 544,127 shares of our common stock and granted Mr. Ford an option to purchase 82,500 shares of our common stock. Each of these options has an exercise price of $13.04 per share. The option granted to Mr. Ford vests over four years of service following the date of grant, with 1/48th of the option shares vesting monthly. The option granted to Mr. Bernshteyn is eligible to vest based on the achievement of stock price appreciation targets after we consummate an initial public offering, as well as Mr. Bernshteyn’s continuous service over a four year period following the date of grant. These options are also eligible to vest on an accelerated basis as described in “Severance and Change in Control Benefits” below.
In making executive compensation decisions, our board of directors and compensation committee consider such factors as they deem appropriate in their exercise of discretion and business judgement, including a subjective assessment of the named executive officer’s performance, the amount of vested and unvested equity held by the officer, amounts paid to our other executive officers and competitive market conditions.
Employment Arrangements with Named Executive Officers
We have entered into offer letters with each of our named executive officers setting forth the initial terms of the officer’s employment with us and providing that the officer’s employment will be “at will” and may be terminated at any time. The severance benefits that our named executive officers are entitled to are described in “Severance and Change in Control Benefits” below.
Outstanding Equity Awards at 2016 Fiscal Year-End
The following table sets forth information regarding each unexercised stock option held by each of our named executive officers as of January 31, 2016. Unless otherwise indicated below, all of these awards were made pursuant to our 2006 Stock Plan.
The vesting schedule applicable to each outstanding award is described in the footnotes to the table below. For information regarding the vesting acceleration provisions applicable to our named executive officers’ equity awards, see “Severance and Change in Control Benefits” below.
Some of the options granted to our named executive officers are immediately exercisable with respect to all of the option shares, subject to our repurchase right in the event the officer’s service terminates prior to vesting in the shares. We refer to option shares that are subject to our right of repurchase as “unvested shares” and those that are no longer subject to our right of repurchase as “vested” shares.
| Option Awards | ||||||||||||||||||||
| Name |
Vesting Commencement Date |
Number of Securities Underlying Unexercised Options (#) Vested |
Number of Securities Underlying Unexercised Options (#) Unvested |
Option Exercise Price ($) |
Option Expiration Date |
|||||||||||||||
| Robert Bernshteyn |
2/8/2011 | 25,000 | (1) | — | 0.20 | 7/11/2021 | ||||||||||||||
| 1/31/2012 | 67,018 | (2) | — | 0.20 | 1/26/2022 | |||||||||||||||
| 7/18/2012 | 487,111 | (2) | 69,588 | 0.76 | 7/29/2022 | |||||||||||||||
| 3/26/2014 | 354,062 | (2) | 418,438 | 2.32 | 3/25/2024 | |||||||||||||||
| 3/4/2015 | 97,395 | (2) | 370,105 | 3.92 | 3/3/2025 | |||||||||||||||
| Tom Aitchison |
1/6/2014 | 249,043 | (1) | 249,042 | 1.96 | 1/6/2024 | ||||||||||||||
| Todd Ford |
5/4/2015 | — | (1) | 505,139 | 5.52 | 6/10/2025 | ||||||||||||||
112
Table of Contents
| (1) | Option vests over four years of service from the vesting commencement date specified above, with 25% of the option shares vesting after one year of service and an additional 1/48th of the option shares vesting monthly thereafter. |
| (2) | Option vests over four years of service from the vesting commencement date specified above, with 1/48th of the option shares vesting monthly. |
Severance and Change in Control Benefits
Severance Benefits
We have entered into severance and change in control agreements with each of our named executive officers. These agreements will have a three-year term from consummation of this offering and will supersede any severance provisions in the officers’ offer letters. Pursuant to these agreements, if Mr. Bernshteyn’s employment is terminated by us without cause or he resigns for good reason, he is eligible to receive a lump sum cash payment equal to 12 months of his base salary and target annual bonus plus $33,000 in lieu of continued benefits. If the employment of one of our other named executive officers is terminated by us without cause, other than as described below in connection with a change in control, the officer will be eligible to receive a lump sum cash payment equal to 6 months of officer’s base salary plus $16,500 in lieu of continued benefits. If the officer’s employment is terminated by us without cause or the officer resigns for good reason, in either case within 3 months prior to or 12 months after a change in control, the officer will be eligible to receive a lump sum cash payment equal to 12 months of the officer’s base salary plus $33,000 in lieu of continued benefits. In addition, in the event of a qualifying termination within 3 months prior to, or 12 months after a change in control, our named executive officers’ outstanding equity awards will accelerate as described in “Equity Acceleration” below. These severance benefits are contingent on the officer’s execution of a release of claims and, if requested, resignation from our board of directors.
Equity Acceleration
Unless we provide otherwise when an equity award is granted, vesting of the equity awards granted to our named executive officers will accelerate in the event the officer is terminated without cause or resigns for good reason, in either case within 3 months prior to or 12 months after a change in control. In such event, the equity awards held by Messrs. Bernshteyn and Ford will fully vest, and 50% of the unvested equity awards held by Mr. Aitchison will vest. In addition, the option granted to Mr. Bernshteyn on February 4, 2016 will accelerate with respect to 50% of the then-unvested shares if Mr. Bernshteyn’s employment is terminated by us without cause or he resigns for good reason at any time.
In general equity awards granted under our 2016 Equity Incentive Plan will vest in full to the extent they are not continued, assumed or substituted for in connection with a change in control.
For purposes of the severance and acceleration benefits described above, the terms “cause,” “change in control” and “good reason” have the following meanings:
“Cause” means an officer’s unauthorized use or disclosure of our confidential information or trade secrets which causes material harm, material breach of any agreement with us, material failure to comply with our written policies or rules, conviction of a felony, gross negligence or willful misconduct, continuing failure to perform assigned duties or failure to cooperate in good faith with a governmental or internal investigation.
“Good Reason” means a substantial adverse change in the officer’s responsibilities, authority, powers, functions or duties, a material reduction in the officer’s base salary, a substantial reduction in benefits other than certain across-the-board reductions, or a requirement that the officer relocate more than 50 miles.
“Change in control” means any person acquires ownership of more than 50% of our voting stock, a sale of all or substantially all our assets, consummation of a merger of the company with or into another
113
Table of Contents
entity if our capital stock represents less than 50% of the voting power of the surviving entity or its parent, or certain changes in the composition of our board of directors.
Equity Plans
The principal features of our equity plans are summarized below. These summaries are qualified in their entirety by reference to the actual verbiage of the plans, which are filed as exhibits to the registration statement of which this prospectus is a part.
2016 Equity Incentive Plan
General. Our board of directors adopted the 2016 Equity Incentive Plan, or 2016 Plan, in September 2016 and it has been approved by our shareholders. The 2016 Plan provides for the grant of incentive stock options, nonstatutory stock options, restricted stock, restricted stock units, stock appreciation rights and performance cash awards. Awards may be granted under the 2016 Plan beginning on the effective date of the registration statement to which this prospectus is a part. The 2016 Plan will replace our 2006 Stock Plan, however awards outstanding under the 2006 Stock Plan will continue to be governed by their existing terms.
Share Reserve. The number of shares of our common stock reserved for issuance under the 2016 Plan is equal to 4,500,000 shares plus up to 13,750,000 shares subject to awards outstanding under our 2006 Plan on the effective date of the registration statement to which this prospectus is a part that subsequently expire, lapse unexercised, are forfeited or are repurchased by us. The number of shares reserved for issuance under our 2016 Plan will automatically increase on the first day of each fiscal year during the term of the 2016 Plan by a number of shares of our common stock equal to 5% of our outstanding shares on the last day of the prior fiscal year. No more than 18,250,000 shares may be issued under the 2016 Plan upon exercise of incentive stock options. The 2016 Plan also limits the grant date fair value of equity awards we may grant to a non-employee director in any fiscal year to $500,000 and the number of shares subject to equity awards granted under the 2016 Plan to any person to 1,250,000 shares per fiscal year, increased to 3,750,000 shares in the fiscal year an employee is hired.
In general, if awards granted under the 2016 Plan are forfeited, cancelled, repurchased or expire, if an award is settled in cash or if shares subject to an award are applied to the exercise price or tax withholding obligations related to the award, the corresponding shares will be available for future issuance under our 2016 Plan.
Administration. The 2016 Plan will be administered by our board of directors or one or more committees to which our board of directors delegates such administration (as applicable, the “administrator”). Subject to the terms of the 2016 Plan, the administrator has the complete discretion to determine the eligible individuals who are to receive awards under the plan, to determine the terms and conditions of awards granted under the 2016 Plan and to make all decisions related to the 2016 Plan and awards granted thereunder. Our board of directors has delegated full authority to administer the 2016 Plan to its compensation committee.
Eligibility. Employees, non-employee directors and consultants are eligible to participate in the 2016 Plan.
Stock Options and Stock Appreciation Rights. The exercise price of stock options and stock appreciation rights granted under the 2016 Plan may not be less than 100% of the fair market value of our common stock on the date of grant. Subject to limited exceptions, options and SARs may have a maximum term of up to 10 years and will generally expire sooner if the optionee’s service terminates. The vesting schedule of each option and SAR is determined by the administrator, however, in general, we grant options that vest over four years. An optionee may pay the exercise price of an option in cash, or, with the administrator’s consent, with shares of common stock the optionee already owns, with proceeds from an
114
Table of Contents
immediate sale of the option shares through a broker approved by us, through a net exercise procedure or by any other method permitted by applicable law. The administrator has full authority to re-reprice (reduce the exercise price of) options and stock appreciation rights or to approve programs in which options and stock appreciation rights are exchanged for cash or other equity awards on terms the administrator determines.
Restricted Stock and restricted stock units. Restricted stock may be awarded under the 2016 Plan for such consideration as the administrator determines, including cash or services provided to us. Typically no payment is required in connection with the grant of restricted stock units. Each award of restricted stock or restricted stock units may or may not be subject to vesting and vesting, if any, shall occur upon the satisfaction of the conditions specified by the administrator. Settlement of vested restricted stock units may be made in the form of cash, common stock or a combination of both.
Performance Cash Awards. A performance cash award is a cash award that may be granted upon the attainment of performance goals for a specified performance period, as determined by the administrator.
Transferability of Awards. Unless the administrator determines otherwise, an award generally will not be transferable other than by beneficiary designation, a will or the laws of descent and distribution.
Corporate Transactions. If we are party to a merger or certain change in control transactions, each outstanding award will be treated as described in the definitive transaction agreement or as the administrator determines, which may include the continuation, assumption or substitution of an outstanding equity award, the cancellation of an outstanding equity award after an opportunity to exercise or the cancellation of an outstanding equity award in exchange for a payment equal to the value of the shares subject to such award less any applicable exercise price. In general, if an equity award held by a participant who remains in service at the effective time of a change in control transaction is not continued, assumed or substituted, then the award will vest in full. The administrator has discretion to provide that an award granted under the 2016 Plan will vest on an accelerated basis if we are subject to a change in control, or if the participant is subject to an involuntary termination.
Changes in Capitalization. In the event of certain changes in our capitalization, including a stock split, reverse stock split or stock dividend, proportionate adjustments will be made in the number and kind of shares available for issuance under the 2016 Plan and the number and kind of shares subject to each outstanding award and/or the exercise price of outstanding award.
Amendment or Termination. The administrator may amend or terminate the 2016 Plan at any time. Any such amendment or termination will not affect outstanding awards. If not sooner terminated, the 2016 Plan will terminate automatically in 2026. Shareholder approval is not required for any amendment of the 2016 Plan, unless required by applicable law.
2016 Employee Stock Purchase Plan
General. Our board of directors adopted the 2016 Employee Stock Purchase Plan, or ESPP, in September 2016 and it has been approved by our shareholders. The ESPP allows eligible employees to purchase shares of our common stock through payroll deductions and is intended to qualify under Section 423 of the Internal Revenue Code.
Share Reserve. We have reserved 818,750 shares of our common stock for issuance under the ESPP. The number of shares reserved for issuance under the ESPP will automatically increase on the first day of each fiscal year during the term of the ESPP by a number of shares equal to the least of (i) 1% of our outstanding shares of common stock on the last day of the prior fiscal year, (ii) 1,250,000 shares or (iii) a lesser number of shares determined by our board of directors. The number and class of shares reserved under the ESPP will be adjusted in the event of a stock split, stock dividend or other changes in our capitalization.
115
Table of Contents
Administration. Our board of directors or its compensation committee may administer the ESPP.
Eligibility. All of our employees or of any participating subsidiary are eligible to participate in the ESPP if they satisfy the eligibility requirements.
Offering Periods. Each offering period will last a number of months determined by the administrator, up to a maximum of 27 months. Unless otherwise determined by the administrator, the initial offering period will begin on the effective date of the registration statement to which this prospectus is a part and end on September 15, 2018, and new 24 month offering periods will begin on each March 16 and September 16 thereafter. Currently each offering period consists of 4 consecutive purchase periods, of approximately 6 months duration, at the end of which payroll contributions are used to purchase shares of our common stock.
Amount of Contributions. Participants may purchase our common stock through payroll deductions, up to a maximum of 15% of their eligible compensation. Participants may withdraw from the ESPP and receive a refund of their accumulated payroll contributions at any time prior to a purchase date.
Purchase Price. Unless changed by the administrator, the purchase price for each share of our common stock purchased under the ESPP will be 85% of the lower of the fair market value per share on the first day of the applicable offering period (or, in the case of the initial offering period, the price at which one share of common stock is offered to the public in this offering) or the fair market value per share on the applicable purchase date.
Corporate Transactions. In the event of certain corporate transactions, any offering periods then in progress may be continued, assumed or substituted for by the acquiring corporation. If the acquiring corporation refuses to do so, a new purchase date will be set for each offering period prior to the effective time of the transaction and such offering periods will terminate.
Amendment or Termination. The administrator may amend, suspend or terminate the ESPP at any time. If not sooner terminated, the ESPP will automatically terminate in 2036. With the exception of increasing the number of shares reserved for issuance, shareholder approval is generally not required for any amendment of the ESPP unless required by applicable law.
2006 Stock Plan
General. Our board of directors adopted the 2006 Stock Plan on November 29, 2006, and it was approved by our stockholders. We have subsequently amended the 2006 Stock Plan several times in the ordinary course. No further awards will be made under the 2006 Stock Plan following this offering; however, awards outstanding under the 2006 Stock Plan will continue in full effect in accordance with their existing terms.
Share Reserve. As of July 31, 2016, we have reserved 17,717,257 shares of our common stock for issuance under the 2006 Stock Plan. As of July 31, 2016, options to purchase 12,395,877 shares of common stock, at exercise prices ranging from $0.16 to $8.36 per share, or a weighted-average exercise price of $4.40 per share, and restricted stock units covering 56,250 shares of our common stock were outstanding under the 2006 Stock Plan, and 1,212,620 shares of common stock remained available for future issuance under the 2006 Stock Plan. Unissued shares subject to awards that expire or are cancelled, award shares reacquired by us and shares withheld in payment of the purchase price or exercise price of an award or in satisfaction of withholding taxes will again become available for issuance under the 2006 Stock Plan or, following consummation of this offering, under our 2016 Equity Incentive Plan.
Administration. Our board of directors has administered the 2006 Stock Plan since its adoption, however, following this offering, the compensation committee of our board of directors will generally administer the 2006 Stock Plan. The administrator has complete discretion to make all decisions relating to the 2006 Stock Plan and the outstanding awards.
116
Table of Contents
Types of Awards. The 2006 Stock Plan provides for the grant of options to purchase shares of our common stock, the direct grant or sale of shares of our common stock and the grant of restricted stock units. The 2006 Stock Plan allows for the grant of both incentive and nonstatutory stock options.
Eligibility. Employees, non-employee members of our board of directors and consultants are eligible to participate in the 2006 Stock Plan. However, only employees are eligible to receive incentive stock options.
Options. The exercise price of options granted under the 2006 Stock Plan may not be less than 100% of the fair market value of our common stock on the grant date. Optionees may pay the exercise price in cash or cash equivalents or by one, or any combination of, the following forms of payment, as permitted by the administrator in its sole discretion:
| • | By delivery of a full-recourse promissory note, with the option shares pledged as security against the principal and accrued interest on the note; |
| • | By surrender of shares of common stock that the optionee already owns; |
| • | By an immediate sale through a company-approved broker of the option shares and delivery of the sale proceeds to us, if shares of our common stock are publicly traded; or |
| • | By other methods permitted by applicable law. |
The administrator determines the vesting schedule of options granted under the 2006 Stock Plan. In general, we have granted options that vest over a four-year period following the date of grant. In some cases, with respect to grants to our non-employee directors, executive officers and other key employees, the options were immediately exercisable, subject to our right of repurchase of any unvested shares upon an optionee’s termination of service. Options expire at the time determined by the administrator, but in no event more than ten years after they are granted, and generally expire earlier if the optionee’s service terminates.
Corporate Transactions. In the event that we are a party to a merger or consolidation or in the event of a sale of all or substantially all of our stock or our assets, awards granted under the 2006 Stock Plan will be subject to the agreement governing such transaction. Such agreement may provide for one or more of the following with respect to outstanding awards:
| • | The continuation, assumption or substitution of an award by the surviving entity or its parent; |
| • | Cancellation of an award in exchange for a payment equal to the excess, if any, of the value of the shares subject to the award over any exercise price per share applicable to the award; or |
| • | The cancellation of an option if not exercised prior to the transaction. |
The administrator is not obligated to treat all awards in the same manner. The administrator has the discretion, at any time, to provide that an award granted under the 2006 Stock Plan will vest on an accelerated basis if we are subject to a change of control or if the participant is subject to an involuntary termination.
Changes in Capitalization. In the event of certain specified changes in the capital structure of our common stock, such as a stock split, reverse stock split, stock dividend, reclassification or any other increase or decrease in the number of issued shares of stock effective without receipt of consideration by us, proportionate adjustments will automatically be made in each of (i) the number of shares available for future grants under the 2006 Stock Plan, (ii) the number of shares covered by each outstanding award and (iii) the exercise price per share subject to each outstanding option. In the event of an extraordinary cash dividend that has a material effect on the fair market value of our common stock, a recapitalization, spin-off, or other similar occurrence, the administrator at its sole discretion may make appropriate adjustments to one or more of the foregoing.
Amendments or Termination. The administrator may at any time amend, suspend or terminate the 2006 Stock Plan, subject to stockholder approval in the case of an amendment if the amendment
117
Table of Contents
(i) increases the number of shares available for issuance or (ii) materially changes the class of persons eligible to receive incentive stock options. The 2006 Stock Plan will terminate automatically on November 29, 2021 and in any event, upon closing of this offering.
Incentive Bonus Plan
Our incentive bonus plan was adopted by our compensation committee and provides for incentive bonuses to our employees on the terms and conditions adopted by the administrator.
401(k) Plan
We maintain a 401(k) plan for employees. The 401(k) is intended to qualify under Section 401(k) of the Internal Revenue Service Code, so that contributions to the 401(k) plan by employees or by us, and the investment earnings thereon, are not taxable to the employees until withdrawn, and so that contributions made by us, if any, will be deductible by us when made. Employees may elect to reduce their current compensation by up to the statutorily prescribed annual limits and to have the amount of such reduction contributed to their 401(k) plans. The 401(k) plan permits us to make contributions up to the limits allowed by law on behalf of all eligible employees. Currently, Coupa matches 100% of an employee’s contributions, up to the first 4% of an employee’s base salary with a maximum of $4,000 per year.
118
Table of Contents
CERTAIN RELATIONSHIPS AND RELATED PARTY TRANSACTIONS
The following is a description of transactions since February 1, 2013 to which we have been a party in which the amount involved exceeded $120,000 and in which any of our executive officers, directors or beneficial holders of more than 5% of our capital stock had or will have a direct or indirect material interest, other than compensation arrangements which are described in “Management—Director Compensation” and “Executive Compensation.”
Sale of Series F Preferred Stock
In February 2014, we issued 4,944,371 shares of our Series F preferred stock at a purchase price of $8.09 per share for an aggregate purchase price of approximately $40.0 million.
The following table summarizes purchases of shares of our Series F preferred stock by our executive officers, directors and holders of more than 5% of our capital stock.
| Shares of Series F Preferred Stock | ||||||||
| Purchaser |
Number of Shares |
Aggregate Gross Consideration ($) |
||||||
| Battery Ventures VIII, L.P.(1) |
1,087,762 | 8,800,000 | ||||||
| BlueRun Ventures, L.P. |
618,047 | 5,000,000 | ||||||
| Entities affiliated with Crosslink Ventures(2) |
494,437 | 4,000,000 | ||||||
| Entities affiliated with El Dorado Ventures(3) |
556,241 | 4,500,000 | ||||||
| MDV IX, L.P. as nominee for MDV IX, L.P. and MDV ENF IX, L.P. |
86,526 | 700,000 | ||||||
|
|
|
|
|
|||||
| Total |
2,843,013 | 23,000,000 | ||||||
|
|
|
|
|
|||||
| (1) | Neeraj Agrawal, a member of our board of directors, is a Managing Member of Battery Partners VIII, LLC and an officer of Battery Management Corp. |
| (2) | Consists of (i) 232,383 shares held by Crosslink Ventures VI, L.P. (“CV VI”), (ii) 64,383 shares held by Crosslink Ventures VI-B, L.P. (“CV VI-B”), (iii) 6,806 shares held by Crosslink Bayview VI, LLC (“CB VI”), (iv) 173,053 shares held by Crosslink Crossover Fund VI, L.P. (“CCF VI”), and (v) 17,812 shares held by Offshore Crosslink Ventures VI Unit Trust (“OCV”). |
| (3) | Charles Beeler, a member of our board of directors, is a Managing Member at El Dorado Ventures. Consists of (i) 9,355 shares held by El Dorado Technology ‘05 L.P. (“EDT”), (ii) 299,668 shares held by El Dorado Ventures VII L.P. (“EDV”), (iii) 57,468 shares held by Rally Technology Partners Fund I, L.P. (“RTPF”), and (iv) 189,750 shares held by Rally Ventures Fund I, L.P. (“RVF”). |
Sale of Series G Preferred Stock
In May 2015, we issued 4,783,762 shares of our Series G preferred stock at a purchase price of $16.7232 per share for an aggregate purchase price of approximately $80.0 million.
119
Table of Contents
The following table summarizes purchases of shares of our Series G preferred stock by our executive officers, directors and holders of more than 5% of our capital stock:
| Shares of Series G Preferred Stock | ||||||||
| Purchaser |
Number of Shares |
Aggregate Gross Consideration ($) |
||||||
| Battery Ventures VIII, L.P.(1) |
150,954 | 2,524,000 | ||||||
| Entities affiliated with Crosslink Ventures(2) |
150,951 | 2,524,000 | ||||||
| Entities affiliated with El Dorado Ventures(3) |
149,039 | 2,492,000 | ||||||
| Entities affiliated with ICONIQ(4) |
1,860,355 | 31,111,000 | ||||||
| Entities affiliated with T. Rowe Price(5) |
1,860,354 | 31,111,000 | ||||||
|
|
|
|
|
|||||
| Total |
4,171,653 | 69,762,000 | ||||||
|
|
|
|
|
|||||
| (1) | Neeraj Agrawal, a member of our board of directors, is a Managing Member of Battery Partners VIII, LLC and an officer of Battery Management Corp. |
| (2) | Consists of (i) 70,948 shares held by CV VI, (ii) 19,655 shares held by CV VI-B, (iii) 2,078 shares held by CB VI, (iv) 27,345 shares held by CCF VI, (v) 24,614 shares held by Crosslink Crossover Fund VII-A, L.P., (vi) 874 shares held by Crosslink Crossover Fund VII-B, L.P., and (vii) 5,437 shares held by OCV. |
| (3) | Charles Beeler, a member of our board of directors, is a Managing Member at El Dorado Ventures. Consists of (i) 3,046 shares held by EDT, (ii) 97,604 shares held by EDV, (iii) 11,248 shares held by RTPF, and (iv) 37,141 shares held by RVF. |
| (4) | Consists of (i) 1,043,503 shares held by ICONIQ Strategic Partners II, L.P. and (ii) 816,852 shares held by ICONIQ Strategic Partners II-B, L.P. |
| (5) | Consists of (i) 154,617 shares held by T. Rowe Price Global Technology Fund, Inc., (ii) 253,293 shares held by T. Rowe Price Media & Telecommunications Fund, Inc., (iii) 1,265,416 shares held by T. Rowe Price New Horizons Fund, Inc., (iv) 143,503 shares held by T. Rowe Price New Horizons Trust, (v) 2,597 shares held by T. Rowe Price U.S. Equities Trust, (vi) 19,317 shares held by TD Mutual Funds—TD Science & Technology Fund, and (vii) 21,611 shares held by TD Mutual Funds—TD Entertainment & Communications Fund. |
Commercial Agreement
One of our customers, T. Rowe Associates, Inc., is an investment adviser of certain of our stockholders. For the year ended January 31, 2016, we recognized subscription revenue of $284,000 from this customer, and as of January 31, 2016, we had an outstanding receivable for $3,000 from this customer. For the year ended January 31, 2015, we did not recognize any revenue from this customer, and as of January 31, 2015, we did not have any outstanding receivables from this customer. For the six months ended July 31, 2016, we recognized subscription revenue of $247,000, and, as of July 31, 2016, we did not have any outstanding receivables from this customer.
Amended and Restated Investors’ Rights Agreement
We have entered into an investors’ rights agreement with certain holders of our preferred stock, including entities with which certain of our directors are affiliated. These stockholders are entitled to rights with respect to the registration of their shares following this offering under the Securities Act of 1933, as amended, or the Securities Act. For a description of these registration rights, see “Description of Capital Stock—Registration Rights.”
Indemnification Agreements
Our amended and restated certificate of incorporation, which will be effective upon the completion of this offering, will contain provisions limiting the liability of directors, and our amended and restated bylaws, which will be effective upon the completion of this offering, will provide that we will indemnify
120
Table of Contents
each of our directors to the fullest extent permitted under Delaware law. Our amended and restated certificate of incorporation and amended and restated bylaws will also provide our board of directors with discretion to indemnify our officers and employees when determined appropriate by our board of directors.
We have entered into indemnification agreements with each of our directors and executive officers and certain other key employees. The indemnification agreements provide that we will indemnify each of our directors, executive officers and such other key employees against any and all expenses incurred by that director, executive officer or other key employee because of his or her status as one of our directors, executive officers or other key employees, to the fullest extent permitted by Delaware law, our amended and restated certificate of incorporation and our amended and restated bylaws. In addition, the indemnification agreements provide that, to the fullest extent permitted by Delaware law, we will advance all expenses incurred by our directors, executive officers and other key employees in connection with a legal proceeding involving his or her status as a director, executive officer or key employee.
Policies and Procedures for Related Party Transactions
Our audit committee has the primary responsibility for the review, approval and oversight of any “related party transaction,” which is any transaction, arrangement, or relationship (or series of similar transactions, arrangements, or relationships) in which we are, were, or will be a participant and the amount involved exceeds $120,000, and in which the related person has, had, or will have a direct or indirect material interest. We intend to adopt a written related party transaction policy to be effective upon the completion of this offering. Under our related party transaction policy, our management will be required to submit any related person transaction not previously approved or ratified by our audit committee to our audit committee. In approving or rejecting the proposed transactions, our audit committee will take into account all of the relevant facts and circumstances available.
121
Table of Contents
The following table sets forth certain information with respect to the beneficial ownership of our common stock as of July 31, 2016, and as adjusted to reflect the sale of common stock offered by us in this offering, for:
| • | each of our named executive officers; |
| • | each of our directors; |
| • | all of our executive officers and directors as a group; and |
| • | each stockholder known by us to be the beneficial owner of more than 5% of our outstanding shares of common stock. |
We have determined beneficial ownership in accordance with the rules of the Securities and Exchange Commission. Except as indicated in the footnotes below, we believe, based on the information furnished to us, that the persons and entities named in the table below have sole voting and investment power with respect to all shares of common stock that they beneficially own, subject to applicable community property laws.
Applicable percentage ownership is based on 40,710,957 shares of common stock outstanding at July 31, 2016, after giving effect to the conversion of all outstanding shares of preferred stock as of that date into an aggregate of 34,610,979 shares of our common stock. For purposes of computing percentage ownership after this offering, we have assumed that (i) 7,400,000 shares of common stock will be issued by us in this offering; and (ii) that the underwriters will not exercise their option to purchase 1,110,000 additional shares in full. In computing the number of shares of common stock beneficially owned by a person or entity and the percentage ownership of that person or entity, we deemed to be outstanding all shares of common stock subject to options held by that person or entity that are currently exercisable or that will become exercisable within 60 days of July 31, 2016. We did not deem these shares outstanding, however, for the purpose of computing the percentage ownership of any other person or entity. Unless otherwise indicated, the address of each beneficial owner listed in the table below is c/o Coupa Software Incorporated, 1855 S. Grant Street, San Mateo, CA 94402.
| Number of Shares Beneficially Owned |
Percent of Shares Beneficially Owned |
|||||||||||
| Name of Beneficial Owner |
Before the Offering |
After the Offering |
||||||||||
| Named Executive Officers and Directors: |
||||||||||||
| Robert Bernshteyn(1) |
2,450,805 | 5.8 | % | 4.9 | % | |||||||
| Tom Aitchison(2) |
498,085 | 1.2 | % | 1.0 | % | |||||||
| Todd Ford |
168,379 | * | * | |||||||||
| Neeraj Agrawal(3) |
6,594,220 | 16.2 | % | 13.7 | % | |||||||
| Charles Beeler(4) |
5,649,546 | 13.9 | % | 11.7 | % | |||||||
| Roger Siboni(5) |
257,771 | * | * | |||||||||
| Leslie Campbell(6) |
181,325 | * | * | |||||||||
| Tayloe Stansbury(7) |
171,847 | * | * | |||||||||
| Scott Thompson(8) |
171,847 | * | * | |||||||||
| Frank van Veenendaal(9) |
171,847 | * | * | |||||||||
| All Executive Officers and Directors as a Group (11 persons)(10) |
16,684,152 | 37.9 | % | 32.5 | % | |||||||
| 5% Stockholders: |
||||||||||||
| Battery Ventures VIII, L.P.(11) |
6,594,220 | 16.2 | % | 13.7 | % | |||||||
| Entities affiliated with BlueRun Ventures, L.P.(12) |
5,190,438 | 12.7 | % | 10.8 | % | |||||||
| Entities affiliated with Crosslink Ventures(13) |
4,516,828 | 11.1 | % | 9.4 | % | |||||||
| Entities affiliated with El Dorado Ventures(14) |
5,347,891 | 13.1 | % | 11.1 | % | |||||||
| Entities affiliated with ICONIQ(15) |
2,092,899 | 5.1 | % | 4.4 | % | |||||||
| Entities advised by T. Rowe Price(16) |
2,092,896 | 5.1 | % | 4.4 | % | |||||||
| MDV IX, L.P. as nominee for MDV IX, L.P. and MDV ENF IX, L.P.(17) |
6,648,700 | 16.3 | % | 13.8 | % | |||||||
122
Table of Contents
| * | Less than 1 percent. |
| (1) | Consists of (i) 854,276 shares of common stock held by Mr. Bernshteyn, all of which are vested, and (ii) 1,596,529 shares of common stock issuable to Mr. Bernshteyn pursuant to options exercisable within 60 days of July 31, 2016, of which 1,306,841 of the shares would be vested as of such date. |
| (2) | Consists of 498,085 shares of common stock issuable to Mr. Aitchison pursuant to options exercisable within 60 days of July 31, 2016, of which 332,057 of the shares would be vested as of such date. |
| (3) | Consists of (i) 350,380 shares of common stock held by Battery Ventures VIII, L.P. (“Battery Ventures VIII”) and (ii) 6,243,840 shares of common stock issuable to Battery Ventures VIII upon the deemed conversion of shares of our preferred stock, as reflected in footnote 11 below. Battery Partners VIII, LLC (“BP VIII”) is the sole general partner of Battery Ventures VIII. BP VIII’s investment adviser is Battery Management Corp. (together with BP VIII, the “Battery Companies”). Mr. Agrawal, a member of our board of directors, is a managing member and officer of the Battery Companies, and may be deemed to share voting and dispositive power with regard to the shares directly held by Battery Ventures VIII. |
| (4) | Consists of (i) 3,996 shares of common stock held by El Dorado Technology ‘05 L.P. (“EDT”) and 157,902 shares of common stock issuable to EDT upon the deemed conversion of shares of our preferred stock, (ii) 128,016 shares of common stock held by El Dorado Ventures VII L.P. (“EDV”) and 5,057,977 shares of common stock issuable to EDV upon the deemed conversion of shares of our preferred stock, as reflected in footnote 14 below, (iii) 1,406 shares of common stock held by Rally Technology Partners Fund I, L.P. (“RTPF”) and 68,716 shares of common stock issuable to RTPF upon the deemed conversion of shares of our preferred stock, and (iv) 4,642 shares of common stock held by Rally Ventures Fund I, L.P. (“RVF”) and 226,891 shares of common stock issuable to RVF upon the deemed conversion of shares of our preferred stock. Mr. Beeler, a member of our board of directors, is (a) a Managing Member at El Dorado Venture Partners VI, LLC, the general partner of EDT and EDV, and has shared voting and dispositive power with regard to the shares directly held by EDT and EDV, and (b) a Managing Member at Rally Ventures GP I, LLC, the general partner of RTPF and RVF, and has shared voting and dispositive power with regard to the shares directly held by RTPF and RVF. |
| (5) | Consists of 257,771 shares of common stock issuable to Mr. Siboni pursuant to options exercisable within 60 days of July 31, 2016, of which 120,167 of the shares would be vested as of such date. |
| (6) | Consists of 181,325 shares of common stock issuable to Ms. Campbell pursuant to options exercisable within 60 days of July 31, 2016, of which 20,147 of the shares would be vested as of such date. |
| (7) | Consists of 171,847 shares of common stock issuable to Mr. Stansbury pursuant to options exercisable within 60 days of July 31, 2016, of which 57,282 of the shares would be vested as of such date. |
| (8) | Consists of 171,847 shares of common stock issuable to Mr. Thompson pursuant to options exercisable within 60 days of July 31, 2016, of which 122,182 of the shares would be vested as of such date. |
| (9) | Consists of (i) 134,347 shares of common stock issued to Mr. van Veenendaal pursuant to options that were early exercised, of which 42,961 of the shares would be unvested within 60 days of July 31, 2016 and are subject to our right of repurchase, (ii) 18,750 shares of common stock held by Frank van Veenendaal 2016 Grantor Retained Annuity Trust, and (iii) 18,750 shares of common stock held by Leslie van Veenendaal 2016 Grantor Retained Annuity Trust. |
| (10) | Includes 3,293,662 shares of common stock issuable pursuant to options exercisable within 60 days of July 31, 2016 held by 11 executive officers and directors as a group who, as a group, beneficially own 38% of the outstanding common stock prior to this offering. |
| (11) | Consists of (i) 350,380 shares of common stock held by Battery Ventures VIII and (ii) 6,243,840 shares of common stock issuable to Battery Ventures VIII upon the deemed conversion of shares of our preferred stock. Neeraj Agrawal, Michael M. Brown, Thomas J. Crotty, Richard D. Frisbie, Kenneth P. Lawler, R. David Tabors, Scott R. Tobin and Roger H. Lee are the managing members and officers of the Battery Companies and may be deemed to share voting and dispositive power with respect to the shares held by Battery Ventures VIII. The address of each of the entities identified in this footnote is One Marina Park Drive, Suite 1100, Boston, MA 02210. |
| (12) | Consists of (i) 85,308 shares of common stock held by BlueRun Ventures, L.P. (“BRV”), and 5,043,880 shares of common stock issuable to BRV upon the deemed conversion of shares of our preferred stock and (ii) 61,250 shares of common stock held by BRV Opportunities Fund, L.P. (“BRVOF”). The general partner of BRV is BRV Partners, L.L.C. (“BRV GP”). The general partner of BRVOF is BRV Opportunities Fund GP, LLC (“BRVOF GP”). John Malloy and Jonathan Ebinger are the managing members of each of BRV GP and BRVOF GP. These individuals share voting and investment power over the shares held by BRV and BRVOF. The address of each of the entities identified in this footnote is 545 Middlefield Road, Suite 250, Menlo Park, CA 94025. |
| (13) | Consists of (i) 8,868 shares of common stock held by Crosslink Ventures VI, L.P. (“CV VI”) and 2,114,021 shares of common stock issuable to CV VI upon the deemed conversion of shares of our preferred stock, (ii) 2,457 shares of common stock held by Crosslink Ventures VI-B, L.P. (“CV VI-B”) and 585,698 shares of common stock issuable to CV VI-B upon the deemed conversion of shares of our preferred stock, (iii) 260 shares of common stock held by Crosslink Bayview VI, LLC (“CB VI”) and 61,917 shares of common stock issuable to CB VI upon the deemed conversion of shares of our preferred stock, (iv) 3,418 |
123
Table of Contents
| shares of common stock held by Crosslink Crossover Fund VI, L.P. (“CCF VI”) and 1,548,799 shares of common stock issuable to CCF VI upon the deemed conversion of shares of our preferred stock, (v) 3,077 shares of common stock held by Crosslink Crossover Fund VII-A, L.P. (“CCF VII-A”) and 24,614 shares of common stock issuable to CCF VII-A upon the deemed conversion of shares of our preferred stock, (vi) 109 shares of common stock held by Crosslink Crossover Fund VII-B, L.P. (“CCF VII-B”) and 874 shares of common stock issuable to CCF VII-B upon the deemed conversion of shares of our preferred stock and (vii) 679 shares of common stock held by Offshore Crosslink Ventures VI Unit Trust (“OCV”) and 162,037 shares of common stock issuable to OCV upon the deemed conversion of shares of our preferred stock. Crosslink Capital, Inc. (“Crosslink Capital”) serves as the investment advisor of CV VI, CV VI-B, CB VI, CCF VI, CCF VII-A, CCF VII-B, and OCV and has shared voting and investment control over the shares owned by such entities and may be deemed to beneficially own the shares owned by such entities. Crosslink Ventures VI Holdings, L.L.C. (“CV VI Holdings”) serves as the general partner of CV VI, CV VI-B, and OCV and has shared voting and investment control with Crosslink Capital over the shares owned such entities, and may be deemed to beneficially own the shares owned by such entities. Crossover Fund VII Management, L.L.C. serves as the general partner of CCF VII-A and CCF VII-B and has shared voting and investment control with Crosslink Capital over the shares owned such entities, and may be deemed to beneficially own the shares owned by such entities. Crossover Fund VI Management, L.L.C. serves as the general partner of CCF VI and has shared voting and investment control with Crosslink Capital over the shares owned such entities, and may be deemed to beneficially own the shares owned by such entities. Michael J. Stark is the control person of Crosslink Capital. In that capacity, he shares voting and dispositive power over the shares held by CV VI, CV VI-B, CB VI, CCF VI, CCF VII-A, CCF VII-B, and OCV, and may be deemed to beneficially own the shares held by such entities. The address for Crosslink Capital and its affiliated entities is Two Embarcadero Center, Suite 2200, San Francisco, CA 94111. |
| (14) | Consists of (i) 3,996 shares of common stock held by EDT and 157,902 shares of common stock issuable to EDT upon the deemed conversion of shares of our preferred stock, and (ii) 128,016 shares of common stock held by EDV and 5,057,977 shares of common stock issuable to EDV upon the deemed conversion of shares of our preferred stock. The general partner of EDT and EDV is El Dorado Venture Partners VII, LLC (“EDVP”). Charles D. Beeler, Thomas H. Peterson and M. Scott Irwin are the managing members of EDVP. These individuals share voting and investment power over the shares owned by EDT and EDV. The address for EDT and EDV and their affiliated entities is 702 Oak Grove Avenue, Menlo Park, CA 94025. |
| (15) | Consists of (i) 130,438 shares of common stock held by ICONIQ Strategic Partners II, L.P. (“ISPII”), and 1,043,503 shares of common stock issuable to ISPII upon the deemed conversion of shares of our preferred stock, and (ii) 102,106 shares held by ICONIQ Strategic Partners II-B, L.P. (“ISPII-B” and together with ISPII, the “ICONIQ Entities”), and 816,852 shares of common stock issuable to ISPII-B upon the deemed conversion of shares of our preferred stock. Divesh Makan and William Griffith are the Directors of the General Partner of the General Partner of the ICONIQ Entities. These individuals share voting and investment power over the shares owned by the ICONIQ Entities. The address of the ICONIQ Entities is 394 Pacific Ave., 2nd Floor, San Francisco, CA 94111. |
| (16) | Consists of (i) 19,327 shares of common stock held by T. Rowe Price Global Technology Fund, Inc. (“TRPGTF”), and 154,617 shares of common stock issuable to TRPGTF upon the deemed conversion of shares of our preferred stock, (ii) 31,661 shares of common stock held by T. Rowe Price Media & Telecommunications Fund, Inc. (“TRPMTF”), and 253,293 shares of common stock issuable to TRPMTF upon the deemed conversion of shares of our preferred stock, (iii) 158,177 shares of common stock held by T. Rowe Price New Horizons Fund, Inc. (“TRPNHF”), and 1,265,416 shares of common stock issuable to TRPNHF upon the deemed conversion of shares of our preferred stock, (iv) 17,938 shares of common stock held by T. Rowe Price New Horizons Trust (“TRPNHT”), and 143,503 shares of common stock issuable to TRPNHT upon the deemed conversion of shares of our preferred stock, (v) 324 shares of common stock held by T. Rowe Price U.S. Equities Trust (“TRPUSET”), and 2,597 shares of common stock issuable to TRPUSET upon the deemed conversion of shares of our preferred stock, (vi) 2,414 shares of common stock held by TD Mutual Funds—TD Science & Technology Fund (“TDSTF”), and 19,317 shares of common stock issuable to TDSTF upon the deemed conversion of shares of our preferred stock, and (vii) 2,701 shares of common stock held by TD Mutual Funds—TD Entertainment & Communications Fund (“TDECF” and together with TRPGTF, TRPMTF, TRPNHF, TRPNHT, TRPUSET, and TDSTF, the “TRP Entities”), and 21,611 shares of common stock issuable to TDECF upon the deemed conversion of shares of our preferred stock. T. Rowe Price Associates, Inc. (“TRPA”) may be deemed to be the beneficial owner of all of such shares. TRPA is a wholly owned subsidiary of T. Rowe Price Group, Inc., a publicly traded financial services holding company. T. Rowe Price Investment Services, Inc. (“TRPIS”), a registered broker-dealer, is a subsidiary of TRPA, the investment adviser to the accounts listed above. TRPIS was formed primarily for the limited purpose of acting as the principal underwriter and distributor of shares of the TRP Entities. TRPIS does not engage in underwriting or market-making activities involving individual securities. TRPA provides brokerage services through TRPIS primarily to complement the other services provided to shareholders of the TRP Entities. The address of the TRP Entities is 100 E. Pratt Street, Baltimore, MD 21202. |
| (17) | Consists of 6,648,700 shares of common stock issuable to MDV IX, L.P. as nominee for MDV IX, L.P. and MDV ENF IX, L.P. (“MDV IX”) upon the deemed conversion of shares of our preferred stock. The general partner of MDV IX is Ninth MDV Partners, L.L.C. (“Ninth MDV”). Jonathan D. Fieber and William Ericson are managing members of Ninth MDV. These individuals share voting and investment power over the shares held by MDV IX. The address of each of the entities identified in this footnote is 3000 Sand Hill Road, Bldg. 3, Suite 290, Menlo Park, CA 94025. |
124
Table of Contents
A description of our capital stock and the material terms and provisions of our amended and restated certificate of incorporation and amended and restated bylaws that will be in effect upon the completion of this offering and affecting the rights of holders of our capital stock is set forth below. The forms of our amended and restated certificate of incorporation and our amended and restated bylaws to be adopted in connection with this offering are filed as exhibits to the registration statement relating to this prospectus.
Upon the completion of this offering, our amended and restated certificate of incorporation will authorize shares of undesignated preferred stock, the rights, preferences and privileges of which may be designated from time to time by our board of directors.
Upon the completion of this offering, our authorized capital stock will consist of 650,000,000 shares, all with a par value of $0.0001 per share, of which:
| • | 625,000,000 shares are designated common stock; and |
| • | 25,000,000 shares are designated preferred stock. |
As of July 31, 2016, and after giving effect to the automatic conversion of all of our outstanding preferred stock into common stock immediately prior to the closing of this offering, there were outstanding:
| • | 40,710,957 shares of our common stock held of record by 257 stockholders; |
| • | 12,395,877 shares of our common stock issuable upon exercise of outstanding stock options; |
| • | 36,971 shares of our common stock issuable upon exercise of the outstanding warrant to purchase 36,971 shares of preferred stock; and |
| • | 56,250 shares of our common stock subject to outstanding restricted stock units. |
Common Stock
Dividend Rights
Subject to preferences that may apply to shares of preferred stock outstanding at the time, the holders of outstanding shares of our common stock are entitled to receive dividends out of funds legally available if our board of directors, in its discretion, determines to issue dividends and only then at the times and in the amounts that our board of directors may determine. See “Dividend Policy” for more information.
Voting Rights
The holders of our common stock are entitled to one vote per share. Stockholders do not have the ability to cumulate votes for the election of directors. Our amended and restated certificate of incorporation and amended and restated bylaws that will be in effect upon the completion of this offering will provide for a classified board of directors consisting of three classes of approximately equal size, each serving staggered three-year terms. Only one class of directors will be elected at each annual meeting of our stockholders, with the other classes continuing for the remainder of their respective three-year terms.
No Preemptive or Similar Rights
Our common stock is not entitled to preemptive rights and is not subject to conversion, redemption or sinking fund provisions.
125
Table of Contents
Right to Receive Liquidation Distributions
Upon our dissolution, liquidation or winding-up, the assets legally available for distribution to our stockholders are distributable ratably among the holders of our common stock, subject to prior satisfaction of all outstanding debt and liabilities and the preferential rights and payment of liquidation preferences, if any, on any outstanding shares of preferred stock.
Preferred Stock
Upon the completion of this offering, no shares of preferred stock will be outstanding, but we will be authorized, subject to limitations prescribed by Delaware law, to issue preferred stock in one or more series, to establish from time to time the number of shares to be included in each series and to fix the designation, powers, preferences and rights of the shares of each series and any associated qualifications, limitations or restrictions. Our board of directors also can increase or decrease the number of shares of any series, but not below the number of shares of that series then outstanding, without any further vote or action by our stockholders. Our board of directors may authorize the issuance of preferred stock with voting or conversion rights that could adversely affect the voting power or other rights of the holders of the common stock. The issuance of preferred stock, while providing flexibility in connection with possible acquisitions and other corporate purposes, could, among other things, have the effect of delaying, deferring or preventing a change in control of our company and may adversely affect the market price of our common stock and the voting and other rights of the holders of common stock. We have no current plan to issue any shares of preferred stock.
Options
As of July 31, 2016, there were options to purchase 12,395,877 shares of our common stock outstanding under our 2006 Stock Plan.
Restricted Stock Units
As of July 31, 2016, we had 56,250 shares of our common stock subject to outstanding restricted stock units under our 2006 Stock Plan.
Warrants
As of July 31, 2016, there were outstanding immediately exercisable warrants to purchase an aggregate of 36,971 shares of our Series D preferred stock at an exercise price of $1.3524 per share, which will become exercisable to purchase the same number of shares of our common stock upon the automatic conversion of the Series D preferred stock before the closing of this offering. The Series D warrant expires on the anniversary of this offering.
Registration Rights
After this offering, the holders of 37,462,660 shares of our common stock issued upon the conversion of our preferred stock will be entitled to contractual rights to require us to register those shares under the Securities Act of 1933, as amended, or the Securities Act. These rights are provided under the terms of our amended and restated investors’ rights agreement. If we propose to register any of our securities under the Securities Act for our own account, holders of shares having registration rights are entitled to include their shares in our registration statement, provided, among other conditions, that the underwriters of any such offering have the right to limit the number of shares included in the registration.
We will pay all expenses relating to any demand, piggyback or Form S-3 registration described below, other than underwriting discounts and commissions. The registration rights terminate upon the earliest to occur of: (i) the fifth anniversary of the completion of this offering; (ii) a liquidation event; or (iii) with
126
Table of Contents
respect to the registration rights of an individual holder, such earlier time after this offering at which the holder holds one percent or less of our outstanding common stock and all shares held by the holder can be sold in any three-month period without registration in compliance with Rule 144 and without the requirement for us to be in compliance with the current public information required under Rule 144(c)(1).
Demand Registration Rights
The holders of 35,689,280 of the registrable securities will be entitled to certain demand registration rights. At any time beginning on the earlier of May 26, 2018 or six months following the effectiveness of this offering, the holders of 40% or more of such registrable securities then outstanding, may make a written request that we register at least 20% of such registrable securities, subject to certain specified conditions and exceptions. Such request for registration must cover securities with an aggregate offering price of at least $15,000,000, net of underwriting discounts and commissions if the proposed number of securities to be registered is less than 20% of the total number of such registrable securities. We are not obligated to effect more than one of these registrations.
Piggyback Registration Rights
If we propose to register any of our securities under the Securities Act either for our own account or for the account of other stockholders, the holders of 37,462,660 shares having registration rights will, subject to certain exceptions, be entitled to include their shares in our registration statement. These registration rights are subject to specified conditions and limitations, including, but not limited to, the right of the underwriters to limit the number of shares included in any such offering under certain circumstances, but not below 30% of the total amount of securities included in such offering.
Form S-3 Registration Rights
At any time after we are qualified to file a registration statement on Form S-3, and subject to limitations and conditions specified in the amended and restated investors’ rights agreement, the holders of at least 20% of 35,689,280 of the registrable securities may make a written request that we prepare and file a registration statement on Form S-3 under the Securities Act covering their shares, so long as the aggregate price to the public, net of any underwriters’ discounts and commissions, is at least $2,000,000. We are not obligated to effect more than two of these Form S-3 registrations in any 12-month period.
Anti-Takeover Provisions
Delaware Law
Upon the completion of this offering, we will be governed by the provisions of Section 203 of the Delaware General Corporation Law regulating corporate takeovers. This section prevents some Delaware corporations from engaging, under some circumstances, in a business combination, which includes a merger or sale of at least 10% of the corporation’s assets with any interested stockholder, meaning a stockholder who, together with affiliates and associates, owns or, within three years prior to the determination of interested stockholder status, did own 15% or more of the corporation’s outstanding voting stock, unless:
| • | the transaction is approved by the board of directors prior to the time that the interested stockholder became an interested stockholder; |
| • | upon closing of the transaction that resulted in the stockholder becoming an interested stockholder, the interested stockholder owned at least 85% of the voting stock of the corporation outstanding at the time the transaction began, excluding for purposes of determining the voting stock outstanding those shares owned (i) by persons who are directors and also officers and (ii) employee stock plans in which employee participants do not have the right to determine confidentially whether shares held subject to the plan will be tendered in a tender or exchange offer; or |
127
Table of Contents
| • | subsequent to such time that the stockholder became an interested stockholder the business combination is approved by the board of directors and authorized at an annual or special meeting of stockholders by at least two-thirds of the outstanding voting stock which is not owned by the interested stockholder. |
A Delaware corporation may “opt out” of these provisions with an express provision in its original certificate of incorporation or an express provision in its certificate of incorporation or amended and restated bylaws resulting from a stockholders’ amendment approved by at least a majority of the outstanding voting shares. We have not opted out of these provisions. As a result, mergers or other takeover or change in control attempts of us may be discouraged or prevented.
Certificate of Incorporation and Bylaws Provisions
Upon the completion of this offering, our amended and restated certificate of incorporation and our amended and restated bylaws will include a number of provisions that may have the effect of deterring hostile takeovers or delaying or preventing changes in control of our management team, including the following:
| • | Board of Directors Vacancies. Our amended and restated certificate of incorporation and amended and restated bylaws will authorize our board of directors to fill vacant directorships, including newly-created seats. In addition, the number of directors constituting our board of directors will be set only by resolution adopted by a majority vote of our entire board of directors. These provisions will prevent a stockholder from increasing the size of our board of directors and gaining control of our board of directors by filling the resulting vacancies with its own nominees. |
| • | Classified Board. Our amended and restated certificate of incorporation and amended and restated bylaws will provide that our board of directors will be classified into three classes of directors, each of which will hold office for a three-year term. In addition, directors may only be removed from the board of directors for cause and only by the approval of 66 2/3% of our then-outstanding shares of our common stock. A third party may be discouraged from making a tender offer or otherwise attempting to obtain control of us as it is more difficult and time consuming for stockholders to replace a majority of the directors on a classified board of directors. |
| • | Stockholder Action; Special Meeting of Stockholders. Our amended and restated certificate of incorporation will provide that stockholders will not be able to take action by written consent, and will only be able to take action at annual or special meetings of our stockholders. Stockholders will not be permitted to cumulate their votes for the election of directors. Our amended and restated bylaws will further provide that special meetings of our stockholders may be called only by a majority vote of our entire board of directors, the chairman of our board of directors or our chief executive officer. |
| • | Advance Notice Requirements for Stockholder Proposals and Director Nominations. Our amended and restated bylaws will provide advance notice procedures for stockholders seeking to bring business before our annual meeting of stockholders, or to nominate candidates for election as directors at any meeting of stockholders. Our amended and restated bylaws will also specify certain requirements regarding the form and content of a stockholder’s notice. These provisions may preclude our stockholders from bringing matters before our annual meeting of stockholders or from making nominations for directors at our meetings of stockholders. |
| • | Issuance of Undesignated Preferred Stock. Our board of directors will have the authority, without further action by the holders of common stock, to issue up to 25,000,000 shares of undesignated preferred stock with rights and preferences, including voting rights, designated from time to time by the board of directors. The existence of authorized but unissued shares of preferred stock will enable our board of directors to render more difficult or discourage an attempt to obtain control of us by means of a merger, tender offer, proxy contest or otherwise. |
128
Table of Contents
Choice of Forum
Upon the completion of this offering, our amended and restated certificate of incorporation will provide that the Court of Chancery of the State of Delaware will be the exclusive forum for any derivative action or proceeding brought on our behalf; any action asserting a breach of fiduciary duty; any action asserting a claim against us arising pursuant to the Delaware General Corporation Law, our amended and restated certificate of incorporation or our amended and restated bylaws or any action asserting a claim against us that is governed by the internal affairs doctrine. The enforceability of similar choice of forum provisions in other companies’ certificates of incorporation has been challenged in legal proceedings, and it is possible that a court could find these types of provisions in our certificate of incorporation to be inapplicable or unenforceable.
Transfer Agent and Registrar
Upon the completion of this offering, the transfer agent and registrar for our common stock will be Computershare Trust Company, N.A. The transfer agent’s address is 250 Royall Street, Canton, Massachusetts 02021, and its telephone number is (800) 662-7232.
Listing
Our common stock has been approved for listing on the Nasdaq Global Select Market under the symbol “COUP.”
129
Table of Contents
SHARES ELIGIBLE FOR FUTURE SALE
Before this offering, there has not been a public market for shares of our common stock. Future sales of substantial amounts of shares of our common stock, including shares issued upon the exercise of outstanding options, in the public market following this offering or the possibility of these sales occurring, could cause the prevailing market price for our common stock to fall or impair our ability to raise equity capital in the future.
Following this offering, we will have outstanding 48,110,957 shares of our common stock, based on the number of shares outstanding as of July 31, 2016. This includes 7,400,000 shares of common stock that we are selling in this offering, which shares may be resold in the public market immediately unless purchased by our affiliates, and assumes no additional exercise of outstanding options other than as described elsewhere in this prospectus.
The remaining 40,710,957 shares of common stock that are not sold in this offering will be “restricted securities,” as that term is defined in Rule 144 under the Securities Act of 1933, as amended, or the Securities Act. These restricted securities are eligible for public sale only if they are registered under the Securities Act or if they qualify for an exemption from registration under Rule 144 or Rule 701 under the Securities Act, which are summarized below.
In addition, we, our executive officers and directors, and substantially all of our security holders have entered into market standoff agreements with us or lock-up agreements with the underwriters under which they have agreed, subject to specific exceptions, not to sell any of our capital stock until at least 181 days after the date of this prospectus, as described below. As a result of these agreements and the provisions of our investors’ rights agreement disclosed in “Description of Capital Stock—Registration Rights,” subject to the provisions of Rule 144 or Rule 701, shares will be available for sale in the public market as follows:
| • | beginning on the date of this prospectus, the 7,400,000 shares sold in this offering will be immediately available for sale in the public market, unless purchased by our affiliates; |
| • | beginning 181 days after the date of this prospectus, 40,710,957 additional shares will become eligible for sale in the public market, of which 25,229,628 shares will be held by officers, directors and greater than 10% stockholders and subject to the volume and other restrictions of Rule 144, as described below; and |
| • | the remainder of the shares will be eligible for sale in the public market from time to time thereafter, subject in some cases to the volume and other restrictions of Rule 144, as described below. |
130
Table of Contents
Rule 144
In general, under Rule 144 as currently in effect, a person who has beneficially owned shares of our restricted common stock for at least six months would be entitled to sell their securities provided that such person is not deemed to have been one of our affiliates at the time of, or at any time during the 90 days preceding, a sale, and we are subject to the periodic reporting requirements of the Securities Exchange Act of 1934, as amended, or the Exchange Act, for at least 90 days before the sale. In addition, under Rule 144, any person who is not an affiliate of ours and has held their shares for at least one year, including the holding period of any prior owner other than one of our affiliates, would be entitled to sell an unlimited number of shares immediately upon the completion of this offering without regard to whether current public information about us is available. Persons who have beneficially owned shares of our restricted common stock for at least six months but who are our affiliates at the time of, or any time during the 90 days preceding, a sale, would be subject to additional restrictions, by which such person would be entitled to sell within any three-month period only a number of securities that does not exceed the greater of either of the following:
| • | 1% of the number of common shares then outstanding, which will equal approximately 481,110 shares immediately after this offering assuming no exercise of the underwriters’ option to purchase additional shares, based on the number of common shares outstanding as of July 31, 2016; or |
| • | the average weekly trading volume of our common shares during the four calendar weeks preceding the filing of a notice on Form 144 with respect to the sale; |
provided, in each case, that we have been subject to the Exchange Act periodic reporting requirements for at least 90 days before the sale. Such sales both by affiliates and by non-affiliates must also comply with the manner of sale, current public information and notice provisions of Rule 144.
Rule 701
Any of our service providers who purchased shares under a written compensatory plan or contract prior to this offering may be entitled to rely on the resale provisions of Rule 701. Rule 701, as currently in effect, permits resales of shares, including by affiliates, in reliance upon Rule 144 but without compliance with certain restrictions, including the holding period requirement, of Rule 144. Rule 701 further provides that non-affiliates may sell such shares in reliance on Rule 144 without having to comply with the public information, volume limitation or notice provisions of Rule 144. All holders of Rule 701 shares are required to wait until 90 days after the date of this prospectus before selling such shares if such resale is pursuant to Rule 701. All Rule 701 shares are, however, subject to lock-up agreements and will only become eligible for sale upon the expiration of these lock-up agreements.
Lock-Up Agreements
In connection with this offering, we and all directors and officers and the holders of substantially all of our outstanding stock and stock options have agreed with the underwriters, subject to certain exceptions, not to offer, pledge, sell, contract to sell, sell any option or contract to purchase, purchase any option or contract to sell, grant any option, right or warrant to purchase, lend, or otherwise transfer or dispose of, directly or indirectly, shares of our common stock or any securities convertible into or exchangeable for shares of our common stock or enter into any swap or other arrangement that transfers to another any of the economic consequences of ownership of our common stock during the period from the date of this prospectus continuing through the date 180 days after the date of this prospectus, except with the prior written consent of Morgan Stanley & Co. LLC. These agreements are subject to certain exceptions, as set forth in “Underwriting.”
Certain of our employees, including our executive officers, and directors may enter into written trading plans that are intended to comply with Rule 10b5-1 under the Exchange Act. Sales under these
131
Table of Contents
trading plans would not be permitted until the expiration of the lock-up agreements relating to our initial public offering described above.
Registration Rights
Upon completion of this offering, the holders of 37,462,660 shares of our common stock will be entitled to rights with respect to the registration of the sale of such shares of common stock under the Securities Act. See “Description of Capital Stock—Registration Rights.” All such shares are covered by lock-up agreements. Following the expiration of the lock-up period, registration of these shares under the Securities Act would result in the shares becoming freely tradable without restriction under the Securities Act immediately upon the effectiveness of the registration.
Equity Plans
We intend to file a registration statement on Form S-8 under the Securities Act covering all of the shares of our common stock subject to options outstanding or reserved for issuance under our equity plans. We expect to file this registration statement as soon as practicable after the completion of this offering. This registration statement will become effective immediately upon filing, and shares covered by this registration statement will thereupon be eligible for sale in the public markets, subject to vesting restrictions, the lock-up agreements described above and Rule 144 limitations applicable to affiliates. For a more complete discussion of our stock plans, see “Executive Compensation—Equity Plans.”
132
Table of Contents
MATERIAL U.S. FEDERAL INCOME TAX CONSIDERATIONS
FOR NON-U.S. HOLDERS OF COMMON STOCK
The following is a general discussion of the material U.S. federal income tax considerations with respect to the ownership and disposition of shares of common stock acquired in this offering by non-U.S. holders who hold such shares as a capital asset within the meaning of Section 1221 of the Internal Revenue Code of 1986, as amended (the “Code”), (generally, property held for investment). For purposes of this discussion, a “non-U.S. holder” means a beneficial owner of our common stock (other than an entity or arrangement that is treated as a partnership for U.S. federal income tax purposes) that is not, for U.S. federal income tax purposes, any of the following:
| • | a citizen or resident of the United States; |
| • | a corporation (or other entity treated as a corporation for U.S. federal income tax purposes) created or organized in the United States or under the laws of the United States, any state thereof or the District of Columbia; |
| • | an estate, the income of which is includable in gross income for U.S. federal income tax purposes regardless of its source; or |
| • | a trust if (i) a court within the United States is able to exercise primary supervision over the administration of the trust and one or more “U.S. persons,” as defined under the Code, have the authority to control all substantial decisions of the trust or (ii) such trust has made a valid election to be treated as a U.S. person for U.S. federal income tax purposes. |
This discussion is based on current provisions of the Code, Treasury regulations promulgated thereunder (“Treasury Regulations”), judicial opinions, published positions of the Internal Revenue Service and other applicable authorities, all of which are subject to change (possibly with retroactive effect). This discussion does not address all aspects of U.S. federal income taxation that may be important to a particular non-U.S. holder in light of that non-U.S. holder’s individual circumstances, nor does it address any aspects of the unearned income Medicare contribution tax pursuant to the Health Care and Education Reconciliation Act of 2010, any U.S. federal estate and gift taxes, any U.S. alternative minimum taxes or any state, local or non-U.S. taxes. This discussion may not apply, in whole or in part, to particular non-U.S. holders in light of their individual circumstances or to holders subject to special treatment under the U.S. federal income tax laws (such as insurance companies, tax-exempt organizations, financial institutions, brokers or dealers in securities, “controlled foreign corporations,” “passive foreign investment companies,” non-U.S. holders that hold our common stock as part of a straddle, hedge, conversion transaction or other integrated investment and certain U.S. expatriates).
If a partnership (or other entity or arrangement treated as a partnership for U.S. federal income tax purposes) holds our common stock, the tax treatment of a partner therein will generally depend on the status of the partner and the activities of the partnership. Partners of a partnership holding our common stock should consult their tax advisors as to the particular U.S. federal income tax consequences applicable to them.
THIS SUMMARY IS NOT INTENDED TO CONSTITUTE A COMPLETE DESCRIPTION OF ALL TAX CONSEQUENCES FOR NON-U.S. HOLDERS RELATING TO THE OWNERSHIP AND DISPOSITION OF OUR COMMON STOCK. PROSPECTIVE HOLDERS OF OUR COMMON STOCK SHOULD CONSULT WITH THEIR TAX ADVISORS REGARDING THE TAX CONSEQUENCES TO THEM (INCLUDING THE APPLICATION AND EFFECT OF ANY STATE, LOCAL, NON-U.S. INCOME AND OTHER TAX LAWS) OF THE OWNERSHIP AND DISPOSITION OF OUR COMMON STOCK.
133
Table of Contents
Dividends
We have no present intention to make distributions on our common stock. In general, the gross amount of any distribution we make to a non-U.S. holder with respect to its shares of common stock will be subject to U.S. federal withholding tax at a rate of 30% to the extent the distribution constitutes a dividend for U.S. federal income tax purposes, unless the non-U.S. holder is eligible for a reduced rate of withholding tax under an applicable income tax treaty and the non-U.S. holder provides proper certification of its eligibility for such reduced rate. A distribution will constitute a dividend for U.S. federal income tax purposes to the extent of our current or accumulated earnings and profits as determined for U.S. federal income tax purposes. To the extent any distribution does not constitute a dividend, it will be treated first as reducing the adjusted basis in the non-U.S. holder’s shares of common stock and then, to the extent it exceeds the adjusted basis in the non-U.S. holder’s shares of common stock, as gain from the sale or exchange of such stock. Any such gain will be subject to the treatment described below under “—Gain on Sale or Other Disposition of Common Stock.”
Dividends we pay to a non-U.S. holder that are effectively connected with its conduct of a trade or business within the United States (and, if required by an applicable tax treaty, are attributable to a U.S. permanent establishment of such non-U.S. holder) will not be subject to U.S. federal withholding tax, as described above, if the non-U.S. holder complies with applicable certification and disclosure requirements. Instead, such dividends generally will be subject to U.S. federal income tax on a net income basis, at regular U.S. federal income tax rates. Dividends received by a foreign corporation that are effectively connected with its conduct of a trade or business within the United States may be subject to an additional branch profits tax at a rate of 30% (or such lower rate as may be specified by an applicable income tax treaty).
Gain on Sale or Other Disposition of Common Stock
In general, a non-U.S. holder will not be subject to U.S. federal income tax on any gain realized upon the sale or other disposition of the non-U.S. holder’s shares of common stock unless:
| • | the gain is effectively connected with a trade or business carried on by the non-U.S. holder within the United States (and, if required by an applicable income tax treaty, is attributable to a U.S. permanent establishment of such non-U.S. holder); |
| • | the non-U.S. holder is an individual and is present in the United States for 183 days or more in the taxable year of disposition and certain other conditions are met; or |
| • | we are or have been a U.S. real property holding corporation for U.S. federal income tax purposes at any time within the shorter of the five-year period preceding such disposition or such non-U.S. holder’s holding period of our common stock, and, provided that our common stock is regularly traded in an established securities market within the meaning of applicable Treasury Regulations, the non-U.S. holder has held, directly or constructively, at any time during said period, more than 5% of our common stock. |
Gain that is effectively connected with the conduct of a trade or business in the United States (or so treated) generally will be subject to U.S. federal income tax on a net income tax basis, at regular U.S. federal income tax rates. If the non-U.S. holder is a foreign corporation, the branch profits tax described above also may apply to such effectively connected gain. An individual non-U.S. holder who is subject to U.S. federal income tax because the non-U.S. holder was present in the United States for 183 days or more during the year of sale or other disposition of our common stock will be subject to a flat 30% tax on the gain derived from such sale or other disposition, which may be offset by U.S. source capital losses. We believe that we are not and we do not anticipate becoming a U.S. real property holding corporation for U.S. federal income tax purposes.
134
Table of Contents
Withholdable Payments to Foreign Financial Entities and Other Foreign Entities
The Foreign Account Tax Compliance Act, or FATCA, imposes a U.S. federal withholding tax of 30% on certain payments to foreign financial institutions, investment funds and certain other non-U.S. persons that fail to comply with certain information reporting and certification requirements pertaining to their direct and indirect U.S. securityholders and/or U.S. accountholders. Such payments include dividends on and (to the extent described below) the gross proceeds from the sale or other disposition of our common stock. Under applicable Treasury Regulations and Internal Revenue Service guidance, this withholding currently applies to payments of dividends, if any, on our common stock and will apply to payments of gross proceeds from a sale or other disposition of our common stock made on or after January 1, 2019. An intergovernmental agreement between the U.S. and a foreign country may modify the requirements described in this paragraph. Prospective investors are encouraged to consult with their own tax advisors regarding the possible implications of this legislation on their investment in our common stock.
Backup Withholding, Information Reporting and Other Reporting Requirements
We must report annually to the Internal Revenue Service and to each non-U.S. holder the amount of dividends paid to, and the tax withheld with respect to, each non-U.S. holder. These reporting requirements apply regardless of whether withholding was reduced or eliminated by an applicable income tax treaty. Copies of this information reporting may also be made available under the provisions of a specific income tax treaty or agreement with the tax authorities in the country in which the non-U.S. holder resides or is established.
A non-U.S. holder will generally be subject to backup withholding for dividends on our common stock paid to such holder unless such holder certifies under penalties of perjury that, among other things, it is a non-U.S. holder (provided that the payor does not have actual knowledge or reason to know that such holder is a U.S. person) or otherwise establishes an exemption.
Information reporting and backup withholding generally are not required with respect to the amount of any proceeds from the sale or other disposition of our common stock by a non-U.S. holder outside the United States through a foreign office of a foreign broker that does not have certain specified connections to the United States. However, if a non-U.S. holder sells or otherwise disposes of its shares of common stock through a U.S. broker or the U.S. offices of a foreign broker, the broker will generally be required to report the amount of proceeds paid to the non-U.S. holder to the Internal Revenue Service and also backup withhold on that amount unless such non-U.S. holder provides appropriate certification to the broker of its status as a non-U.S. person (and the payor does not have actual knowledge or reason to know that such holder is a U.S. person) or otherwise establishes an exemption. Information reporting will also apply if a non-U.S. holder sells its shares of common stock through a foreign broker deriving more than a specified percentage of its income from U.S. sources or having certain other connections to the United States, unless such broker has documentary evidence in its records that such non-U.S. holder is a non-U.S. person (and the payor does not have actual knowledge or reason to know that such holder is a U.S. person) and certain other conditions are met, or such non-U.S. holder otherwise establishes an exemption.
Backup withholding is not an additional income tax. Any amounts withheld under the backup withholding rules from a payment to a non-U.S. holder generally can be credited against the non-U.S. holder’s U.S. federal income tax liability, if any, or refunded, provided that the required information is furnished to the Internal Revenue Service in a timely manner. Non-U.S. holders should consult their tax advisors regarding the application of the information reporting and backup withholding rules to them.
135
Table of Contents
Under the terms and subject to the conditions in an underwriting agreement dated the date of this prospectus, the underwriters named below, for whom Morgan Stanley & Co. LLC, J.P. Morgan Securities LLC and Barclays Capital Inc. are acting as representatives, have severally agreed to purchase, and we have agreed to sell to them, severally, the number of shares indicated below:
| Name |
Number of Shares |
|||
| Morgan Stanley & Co. LLC |
||||
| J.P. Morgan Securities LLC |
||||
| Barclays Capital Inc. |
||||
| RBC Capital Markets, LLC |
||||
| JMP Securities LLC |
||||
| Raymond James & Associates, Inc. |
||||
|
|
|
|||
| Total |
7,400,000 | |||
|
|
|
|||
The underwriters and the representatives are collectively referred to as the “underwriters” and the “representatives,” respectively. The underwriters are offering the shares of common stock subject to their acceptance of the shares from us and subject to prior sale. The underwriting agreement provides that the obligations of the several underwriters to pay for and accept delivery of the shares of common stock offered by this prospectus are subject to the approval of certain legal matters by their counsel and to certain other conditions. The underwriters are obligated to take and pay for all of the shares of common stock offered by this prospectus if any such shares are taken. However, the underwriters are not required to take or pay for the shares covered by the underwriters’ option to purchase additional shares described below.
The underwriters initially propose to offer part of the shares of common stock directly to the public at the offering price listed on the cover page of this prospectus and part to certain dealers at a price that represents a concession not in excess of $ a share under the public offering price. After the initial offering of the shares of common stock, the offering price and other selling terms may from time to time be varied by the representatives. Sales of common stock made outside of the United States may be made by affiliates of the underwriters.
We have granted to the underwriters an option, exercisable for 30 days from the date of this prospectus, to purchase up to 1,110,000 additional shares of common stock at the public offering price listed on the cover page of this prospectus, less underwriting discounts and commissions. To the extent the option is exercised, each underwriter will become obligated, subject to certain conditions, to purchase about the same percentage of the additional shares of common stock as the number listed next to the underwriter’s name in the preceding table bears to the total number of shares of common stock listed next to the names of all underwriters in the preceding table.
The following table shows the per share and total public offering price, underwriting discounts and commissions, and proceeds before expenses to us. These amounts are shown assuming both no exercise and full exercise of the underwriters’ option to purchase up to an additional 1,110,000 shares of common stock.
| Total | ||||||||||||
| Per Share | No Exercise | Full Exercise | ||||||||||
| Public offering price |
$ | $ | $ | |||||||||
| Underwriting discounts and commissions to be paid by us |
||||||||||||
| Proceeds, before expenses, to us |
||||||||||||
136
Table of Contents
The estimated offering expenses payable by us, exclusive of the underwriting discounts and commissions, are approximately $4,900,000. We have agreed to reimburse the underwriters for their expenses, up to $50,000, relating to clearance of this offering with the Financial Industry Regulatory Authority.
The underwriters have informed us that they do not intend sales to discretionary accounts to exceed 5% of the total number of shares of common stock offered by them.
Our common stock has been approved for listing on the Nasdaq Global Select Market under the symbol “COUP.”
We and all directors and officers and the holders of substantially all of our outstanding stock, stock options, and warrants have agreed that, without the prior written consent of Morgan Stanley & Co. LLC, on behalf of the underwriters, we and they will not, during the period ending 180 days after the date of this prospectus (the “restricted period”):
| • | offer, pledge, sell, contract to sell, sell any option or contract to purchase, purchase any option or contract to sell, grant any option, right or warrant to purchase, lend or otherwise transfer or dispose of, directly or indirectly, any shares of common stock or any securities convertible into or exercisable or exchangeable for shares of common stock; |
| • | file any registration statement with the Securities and Exchange Commission relating to the offering of any shares of common stock or any securities convertible into or exercisable or exchangeable for common stock; or |
| • | enter into any swap or other arrangement that transfers to another, in whole or in part, any of the economic consequences of ownership of the common stock |
whether any such transaction described above is to be settled by delivery of common stock or such other securities, in cash or otherwise. In addition, we and each such person agrees that, without the prior written consent of Morgan Stanley & Co. LLC, on behalf of the underwriters, we or such other person will not, during the restricted period, make any demand for, or exercise any right with respect to, the registration of any shares of common stock or any security convertible into or exercisable or exchangeable for common stock.
The restrictions in the immediately preceding paragraph do not apply in certain circumstances, including sales of shares purchased in the open market after this offering; transfers pursuant to qualified domestic orders and transfers pursuant to a bona fide third-party tender offer, merger or other similar transaction made to all holders of our securities involving a “change of control” occurring after this offering that has been approved by our board of directors. The restrictions also do not apply to our issuance of up to 5% of our outstanding shares in acquisitions or other similar transactions provided that the recipients will be bound by the foregoing restrictions.
Morgan Stanley & Co. LLC, in its sole discretion, may release the common stock and other securities subject to the lock-up agreements described above in whole or in part at any time.
In order to facilitate the offering of the common stock, the underwriters may engage in transactions that stabilize, maintain or otherwise affect the price of the common stock. Specifically, the underwriters may sell more shares than they are obligated to purchase under the underwriting agreement, creating a short position. A short sale is covered if the short position is no greater than the number of shares available for purchase by the underwriters under the option to purchase additional shares described above. The underwriters can close out a covered short sale by exercising such option or purchasing shares in the open market. In determining the source of shares to close out a covered short sale, the underwriters will consider, among other things, the open market price of shares compared to the price available under such option. The underwriters may also sell shares in excess of such option, creating a naked short position. The underwriters must close out any naked short position by purchasing shares in the open market. A naked short position is more likely to be created if the underwriters are concerned that there may be downward
137
Table of Contents
pressure on the price of the common stock in the open market after pricing that could adversely affect investors who purchase shares of common stock in this offering. As an additional means of facilitating this offering, the underwriters may bid for, and purchase, shares of common stock in the open market to stabilize the price of the common stock. These activities may raise or maintain the market price of the common stock above independent market levels or prevent or retard a decline in the market price of the common stock. The underwriters are not required to engage in these activities and may end any of these activities at any time.
We and the underwriters have agreed to indemnify each other against certain liabilities, including liabilities under the Securities Act of 1933, as amended, or the Securities Act.
A prospectus in electronic format may be made available on websites maintained by one or more underwriters, or selling group members, if any, participating in this offering. The representatives may agree to allocate a number of shares of common stock to underwriters for sale to their online brokerage account holders. Internet distributions will be allocated by the representatives to underwriters that may make Internet distributions on the same basis as other allocations.
Other Relationships
The underwriters and their respective affiliates are full service financial institutions engaged in various activities, which may include securities trading, commercial and investment banking, financial advisory, investment management, investment research, principal investment, hedging, financing and brokerage activities. Certain of the underwriters and their respective affiliates may in the future perform various financial advisory and investment banking services for us, for which they will receive customary fees and expenses.
In addition, in the ordinary course of their various business activities, the underwriters and their respective affiliates may make or hold a broad array of investments and actively trade debt and equity securities (or related derivative securities) and financial instruments (including bank loans) for their own account and for the accounts of their customers and may at any time hold long and short positions in such securities and instruments. Such investment and securities activities may involve our securities and instruments. The underwriters and their respective affiliates may also make investment recommendations or publish or express independent research views in respect of such securities or instruments and may at any time hold, or recommend to clients that they acquire, long or short positions in such securities and instruments.
Pricing of the Offering
Prior to this offering, there has been no public market for our common stock. The initial public offering price will be determined by negotiations between us and the representatives. Among the factors to be considered in determining the initial public offering price will be our future prospects and those of our industry in general, our results from operations and certain other financial and operating information in recent periods, and the price-earnings ratios, price-sales ratios, market prices of securities, and certain financial and operating information of companies engaged in activities similar to ours. The estimated initial public offering price range set forth on the cover page of this preliminary prospectus is subject to change as a result of market conditions and other factors. Neither we nor the underwriters can assure investors that an active trading market for the shares will develop, or that after the offering the shares will trade in the public market at or above the initial public offering price.
138
Table of Contents
Selling Restrictions
European Economic Area
In relation to each Member State of the European Economic Area which has implemented the Prospectus Directive (each, a “Relevant Member State”), an offer to the public of any shares of our common stock may not be made in that Relevant Member State, except that an offer to the public in that Relevant Member State of any shares of our common stock may be made at any time under the following exemptions under the Prospectus Directive, if they have been implemented in that Relevant Member State:
| (i) | to any legal entity which is a qualified investor as defined in the Prospectus Directive; |
| (ii) | to fewer than 100 or, if the Relevant Member State has implemented the relevant provision of the 2010 PD Amending Directive, 150, natural or legal persons (other than qualified investors as defined in the Prospectus Directive), as permitted under the Prospectus Directive, subject to obtaining the prior consent of the representatives for any such offer; or |
| (iii) | in any other circumstances falling within Article 3(2) of the Prospectus Directive, provided that no such offer of shares of our common stock shall result in a requirement for the publication by us or any underwriter of a prospectus pursuant to Article 3 of the Prospectus Directive. |
For the purposes of this provision, the expression an “offer to the public” in relation to any shares of our common stock in any Relevant Member State means the communication in any form and by any means of sufficient information on the terms of the offer and any shares of our common stock to be offered so as to enable an investor to decide to purchase any shares of our common stock. As the same may be varied in that Member State by any measure implementing the Prospectus Directive in that Member State, the expression “Prospectus Directive” means Directive 2003/71/EC (and amendments thereto, including the 2010 PD Amending Directive, to the extent implemented in the Relevant Member State) and includes any relevant implementing measure in the Relevant Member State and the expression “2010 PD Amending Directive” means Directive 2010/73/EU.
United Kingdom
Each underwriter has represented and agreed that:
| (a) | it has only communicated or caused to be communicated and will only communicate or cause to be communicated an invitation or inducement to engage in investment activity (within the meaning of Section 21 of the Financial Services and Markets Act 2000, or FSMA) received by it in connection with the issue or sale of the shares of our common stock in circumstances in which Section 21(1) of the FSMA does not apply to us; and |
| (b) | it has complied and will comply with all applicable provisions of the FSMA with respect to anything done by it in relation to the shares of our common stock in, from or otherwise involving the United Kingdom. |
Switzerland
The shares of common stock may not be publicly offered in Switzerland and will not be listed on the SIX Swiss Exchange, or SIX, or on any other stock exchange or regulated trading facility in Switzerland. This document has been prepared without regard to the disclosure standards for issuance prospectuses under art. 652a or art. 1156 of the Swiss Code of Obligations or the disclosure standards for listing prospectuses under art. 27 ff. of the SIX Listing Rules or the listing rules of any other stock exchange or regulated trading facility in Switzerland. Neither this document nor any other offering or marketing material relating to the shares or the offering may be publicly distributed or otherwise made publicly
139
Table of Contents
available in Switzerland. Neither this document nor any other offering or marketing material relating to the offering, us, or the shares have been or will be filed with or approved by any Swiss regulatory authority. In particular, this document will not be filed with, and the offer of shares will not be supervised by, the Swiss Financial Market Supervisory Authority FINMA, or FINMA, and the offer of shares has not been and will not be authorized under the Swiss Federal Act on Collective Investment Schemes, or CISA. The investor protection afforded to acquirers of interests in collective investment schemes under the CISA does not extend to acquirers of shares.
Dubai International Financial Centre
This prospectus relates to an Exempt Offer in accordance with the Offered Securities Rules of the Dubai Financial Services Authority, or DFSA. This prospectus is intended for distribution only to persons of a type specified in the Offered Securities Rules of the DFSA. It must not be delivered to, or relied on by, any other person. The DFSA has no responsibility for reviewing or verifying any documents in connection with Exempt Offers. The DFSA has not approved this prospectus nor taken steps to verify the information set forth herein and has no responsibility for the prospectus. The shares to which this prospectus relates may be illiquid and/or subject to restrictions on their resale. Prospective purchasers of the shares offered should conduct their own due diligence on the shares. If you do not understand the contents of this prospectus you should consult an authorized financial advisor.
Australia
No placement document, prospectus, product disclosure statement or other disclosure document has been lodged with the Australian Securities and Investments Commission, or ASIC, in relation to the offering. This prospectus does not constitute a prospectus, product disclosure statement or other disclosure document under the Corporations Act 2001, or the Corporations Act, and does not purport to include the information required for a prospectus, product disclosure statement or other disclosure document under the Corporations Act.
Any offer in Australia of the shares may only be made to persons, or the Exempt Investors, who are “sophisticated investors” (within the meaning of section 708(8) of the Corporations Act), “professional investors” (within the meaning of section 708(11) of the Corporations Act) or otherwise pursuant to one or more exemptions contained in section 708 of the Corporations Act so that it is lawful to offer the shares without disclosure to investors under Chapter 6D of the Corporations Act.
The shares applied for by Exempt Investors in Australia must not be offered for sale in Australia in the period of 12 months after the date of allotment under the offering, except in circumstances where disclosure to investors under Chapter 6D of the Corporations Act would not be required pursuant to an exemption under section 708 of the Corporations Act or otherwise or where the offer is pursuant to a disclosure document which complies with Chapter 6D of the Corporations Act. Any person acquiring shares must observe such Australian on-sale restrictions.
This prospectus contains general information only and does not take into account the investment objectives, financial situation or particular needs of any particular person. It does not contain any securities recommendations or financial product advice. Before making an investment decision, investors need to consider whether the information in this prospectus is appropriate for their needs, objectives and circumstances, and, if necessary, seek expert advice on those matters.
140
Table of Contents
New Zealand
The shares of common stock offered hereby have not been offered or sold, and will not be offered or sold, directly or indirectly in New Zealand and no offering materials or advertisements have been or will be distributed in relation to any offer of shares in New Zealand, in each case other than:
(a) to persons whose principal business is the investment of money or who, in the course of and for the purposes of their business, habitually invest money; or
(b) to persons who in all the circumstances can properly be regarded as having been selected otherwise than as members of the public; or
(c) to persons who are each required to pay a minimum subscription price of at least NZ$500,000 for the shares before the allotment of those shares (disregarding any amounts payable, or paid, out of money lent by the issuer or any associated person of the issuer); or
(d) in other circumstances where there is no contravention of the Securities Act 1978 of New Zealand (or any statutory modification or re-enactment of, or statutory substitution for, the Securities Act 1978 of New Zealand).
Canada
The shares of common stock may be sold only to purchasers purchasing, or deemed to be purchasing, as principal that are accredited investors, as defined in National Instrument 45-106 Prospectus Exemptions or subsection 73.3(1) of the Securities Act (Ontario), and are permitted clients, as defined in National Instrument 31-103 Registration Requirements, Exemptions and Ongoing Registrant Obligations. Any resale of the shares of common stock must be made in accordance with an exemption from, or in a transaction not subject to, the prospectus requirements of applicable securities laws.
Securities legislation in certain provinces or territories of Canada may provide a purchaser with remedies for rescission or damages if this prospectus (including any amendment thereto) contains a misrepresentation, provided that the remedies for rescission or damages are exercised by the purchaser within the time limit prescribed by the securities legislation of the purchaser’s province or territory. The purchaser should refer to any applicable provisions of the securities legislation of the purchaser’s province or territory for particulars of these rights or consult with a legal advisor.
Pursuant to section 3A.3 (or, in the case of securities issued or guaranteed by the government of a non-Canadian jurisdiction, section 3A.4) of National Instrument 33-105 Underwriting Conflicts (NI 33-105), the underwriters are not required to comply with the disclosure requirements of NI 33-105 regarding underwriter conflicts of interest in connection with this offering.
Hong Kong
The shares of common stock have not been offered or sold and will not be offered or sold in Hong Kong, by means of any document, other than (a) to “professional investors” as defined in the Securities and Futures Ordinance (Cap. 571) of Hong Kong and any rules made under that Ordinance; or (b) in other circumstances which do not result in the document being a “prospectus” as defined in the Companies (Winding Up and Miscellaneous Provisions) Ordinance (Cap. 32) of Hong Kong or which do not constitute an offer to the public within the meaning of that Ordinance. No advertisement, invitation or document relating to the shares of common stock has been or may be issued or has been or may be in the possession of any person for the purposes of issuance, whether in Hong Kong or elsewhere, which is directed at, or the contents of which are likely to be accessed or read by, the public of Hong Kong (except if permitted to do so under the securities laws of Hong Kong) other than with respect to shares of common stock which are or are intended to be disposed of only to persons outside Hong Kong or only to “professional investors” as defined in the Securities and Futures Ordinance and any rules made under that Ordinance.
141
Table of Contents
Japan
No registration pursuant to Article 4, paragraph 1 of the Financial Instruments and Exchange Law of Japan (Law No. 25 of 1948, as amended), or the FIEL, has been made or will be made with respect to the solicitation of the application for the acquisition of the shares of common stock.
Accordingly, the shares of common stock have not been, directly or indirectly, offered or sold and will not be, directly or indirectly, offered or sold in Japan or to, or for the benefit of, any resident of Japan (which term as used herein means any person resident in Japan, including any corporation or other entity organized under the laws of Japan) or to others for re-offering or re-sale, directly or indirectly, in Japan or to, or for the benefit of, any resident of Japan except pursuant to an exemption from the registration requirements, and otherwise in compliance with, the FIEL and the other applicable laws and regulations of Japan.
For Qualified Institutional Investors, or QII
Please note that the solicitation for newly-issued or secondary securities (each as described in Paragraph 2, Article 4 of the FIEL) in relation to the shares of common stock constitutes either a “QII only private placement” or a “QII only secondary distribution” (each as described in Paragraph 1, Article 23-13 of the FIEL). Disclosure regarding any such solicitation, as is otherwise prescribed in Paragraph 1, Article 4 of the FIEL, has not been made in relation to the shares of common stock. The shares of common stock may only be transferred to QIIs.
For Non-QII Investors
Please note that the solicitation for newly-issued or secondary securities (each as described in Paragraph 2, Article 4 of the FIEL) in relation to the shares of common stock constitutes either a “small number private placement” or a “small number private secondary distribution” (each as is described in Paragraph 4, Article 23-13 of the FIEL). Disclosure regarding any such solicitation, as is otherwise prescribed in Paragraph 1, Article 4 of the FIEL, has not been made in relation to the shares of common stock. The shares of common stock may only be transferred en bloc without subdivision to a single investor.
Singapore
This prospectus has not been registered as a prospectus with the Monetary Authority of Singapore. Accordingly, this prospectus and any other document or material in connection with the offer or sale, or invitation for subscription or purchase, of the shares of common stock may not be circulated or distributed, nor may the shares of common stock be offered or sold, or be made the subject of an invitation for subscription or purchase, whether directly or indirectly, to persons in Singapore other than (i) to an institutional investor under Section 274 of the Securities and Futures Act, Chapter 289 of Singapore, or the SFA, (ii) to a relevant person pursuant to Section 275(1), or any person pursuant to Section 275(1A), and in accordance with the conditions specified in Section 275, of the SFA, or (iii) otherwise pursuant to, and in accordance with the conditions of, any other applicable provision of the SFA.
Where the shares of common stock are subscribed or purchased under Section 275 of the SFA by a relevant person which is:
| (a) | a corporation (which is not an accredited investor (as defined in Section 4A of the SFA)) the sole business of which is to hold investments and the entire share capital of which is owned by one or more individuals, each of whom is an accredited investor; or |
| (b) | a trust (where the trustee is not an accredited investor) the sole purpose of which is to hold investments and each beneficiary of the trust is an individual who is an accredited investor, |
securities (as defined in Section 239(1) of the SFA) of that corporation or the beneficiaries’ rights and interest (howsoever described) in that trust shall not be transferred within six months after that
142
Table of Contents
corporation or that trust has acquired the shares of common stock pursuant to an offer made under Section 275 of the SFA except:
| (a) | to an institutional investor or to a relevant person defined in Section 275(2) of the SFA, or to any person arising from an offer referred to in Section 275(1A) or Section 276(4)(i)(B) of the SFA; |
| (b) | where no consideration is or will be given for the transfer; |
| (c) | where the transfer is by operation of law; |
| (d) | as specified in Section 276(7) of the SFA; or |
| (e) | as specified in Regulation 32 of the Securities and Futures (Offers of Investments) (Shares and Debentures) Regulations 2005 of Singapore. |
Chile
The shares of common stock are not registered in the Securities Registry (Registro de Valores) or subject to the control of the Chilean Securities and Exchange Commission (Superintendencia de Valores y Seguros de Chile). This prospectus supplement and other offering materials relating to the offer of the shares do not constitute a public offer of, or an invitation to subscribe for or purchase, the shares in the Republic of Chile, other than to individually identified purchasers pursuant to a private offering within the meaning of Article 4 of the Chilean Securities Market Act (Ley de Mercado de Valores) (an offer that is not “addressed to the public at large or to a certain sector or specific group of the public”).
143
Table of Contents
The validity of the shares of common stock offered by this prospectus will be passed upon for us by Gunderson Dettmer Stough Villeneuve Franklin & Hachigian, LLP, Redwood City, California. Davis Polk & Wardwell LLP, Menlo Park, California is representing the underwriters in this offering.
Ernst & Young LLP, independent registered public accounting firm, has audited our consolidated financial statements at January 31, 2016 and 2015, and for each of the two years in the period ended January 31, 2016, as set forth in their report. We have included our financial statements in the prospectus and elsewhere in the registration statement in reliance on Ernst & Young LLP’s report, given on their authority as experts in accounting and auditing.
CHANGE IN INDEPENDENT ACCOUNTANTS
On or about July 4, 2015, we dismissed BDO USA, LLP, or BDO, and on August 13, 2015, Ernst & Young LLP, or EY, was engaged as our independent auditors. The decision to change our independent auditors was approved by our board of directors.
BDO audited our consolidated financial statements for the year ended January 31, 2014. The audit report issued by BDO on November 3, 2014, did not contain an adverse opinion or a disclaimer of opinion and was not qualified or modified as to uncertainty, audit scope, or accounting principles. BDO did not provide an audit opinion on our consolidated financial statements for any period subsequent to the year ended January 31, 2014. BDO did inform our management of a material weakness in our internal control over financial reporting. The material weakness related to our having insufficient accounting resources which led to a lack of timely account reconciliations and numerous audit adjusting entries.
During the fiscal years ended January 31, 2013 and January 31, 2014 and in the subsequent interim period through July 4, 2015, there were no “disagreements” between us and BDO (as that term is defined in Item 304(a)(1)(iv) of Regulation S-K). We requested BDO to provide us with a letter addressed to the Securities and Exchange Commission stating whether or not BDO agrees with the above disclosures. A copy of BDO’s letter, dated February 12, 2016, is attached as Exhibit 16.1 to the registration statement of which this prospectus is a part.
During the fiscal years ended January 31, 2013 and 2014 and the subsequent interim period through July 4, 2015, we did not consult with EY regarding any of the matters described in Items 304(a)(2)(i) or 304(a)(2)(ii) of Regulation S-K.
WHERE YOU CAN FIND ADDITIONAL INFORMATION
We have filed with the Securities and Exchange Commission a registration statement on Form S-1 under the Securities Act of 1933, as amended, with respect to the shares of common stock offered by this prospectus. This prospectus, which constitutes a part of the registration statement, does not contain all of the information set forth in the registration statement or the exhibits and schedules to the registration statement. Please refer to the registration statement and exhibits for further information with respect to the common stock offered by this prospectus. Statements contained in this prospectus regarding the contents of any contract or other document are only summaries. With respect to any contract or document that is filed as an exhibit to the registration statement, you should refer to the exhibit for a copy of the contract or document, and each statement in this prospectus regarding that contract or document is qualified by reference to the exhibit. You may read and copy the registration statement and its exhibits and schedules at the SEC’s public reference room, located at 100 F Street, N.E., Room 1580, Washington, D.C. 20549. You may obtain information on the operation of the public reference room by calling the SEC at 1-800-SEC-0330. The SEC also maintains a website that contains reports, proxy and
144
Table of Contents
information statements and other information regarding issuers, like us, that file documents electronically with the SEC. The address of that website is www.sec.gov. The information on the SEC’s web site is not part of this prospectus, and any references to this web site or any other web site are inactive textual references only.
Upon completion of this offering, we will become subject to the information and reporting requirements of the Securities Exchange Act of 1934, as amended, and, in accordance with this law, will be required to file periodic reports, proxy statements and other information with the SEC. These periodic reports, proxy statements and other information will be available for inspection and copying at the SEC’s public reference facilities and the website of the SEC referred to above. We also maintain a website at www.coupa.com, at which you may access these materials free of charge as soon as reasonably practicable after they are electronically filed with, or furnished to, the SEC. The information contained on, or that can be accessed through, our website is not a part of this prospectus. Investors should not rely on any such information in deciding whether to purchase our common stock. We have included our website address in this prospectus solely as an inactive textual reference.
145
Table of Contents
INDEX TO CONSOLIDATED FINANCIAL STATEMENTS
| Page | ||||
| F-2 | ||||
| Consolidated Financial Statements: |
||||
| F-3 | ||||
| Consolidated Statements of Operations and Comprehensive Loss |
F-4 | |||
| Consolidated Statements of Convertible Preferred Stock and Stockholders’ Deficit |
F-5 | |||
| F-6 | ||||
| F-7 | ||||
F-1
Table of Contents
Report of Independent Registered Public Accounting Firm
The Board of Directors and Stockholders of
Coupa Software Incorporated
We have audited the accompanying consolidated balance sheets of Coupa Software Incorporated as of January 31, 2015 and 2016, and the related consolidated statements of operations and comprehensive loss, convertible preferred stock and stockholders’ deficit, and cash flows for each of the two years in the period ended January 31, 2016. These financial statements are the responsibility of the Company’s management. Our responsibility is to express an opinion on these financial statements based on our audits.
We conducted our audits in accordance with the standards of the Public Company Accounting Oversight Board (United States). Those standards require that we plan and perform the audit to obtain reasonable assurance about whether the consolidated financial statements are free of material misstatement. We were not engaged to perform an audit of the Company’s internal control over financial reporting. Our audits included consideration of internal control over financial reporting as a basis for designing audit procedures that are appropriate in the circumstances, but not for the purpose of expressing an opinion on the effectiveness of the Company’s internal control over financial reporting. Accordingly, we express no such opinion. An audit also includes examining, on a test basis, evidence supporting the amounts and disclosures in the financial statements, assessing the accounting principles used and significant estimates made by management, and evaluating the overall financial statement presentation. We believe that our audits provide a reasonable basis for our opinion.
In our opinion, the financial statements referred to above present fairly, in all material respects, the consolidated financial position of Coupa Software Incorporated at January 31, 2015 and 2016, and the consolidated results of its operations and its cash flows for each of the two years in the period ended January 31, 2016, in conformity with U.S. generally accepted accounting principles.
/s/ Ernst & Young LLP
San Jose, California
March 25, 2016, except as to the third paragraph of Note 2,
as to which the date is September 22, 2016
F-2
Table of Contents
COUPA SOFTWARE INCORPORATED
(In thousands, except share and per share amounts)
|
January 31, |
July 31, | Pro Forma Stockholders’ Equity as of July 31, 2016 |
||||||||||||||
| 2015 | 2016 | 2016 | ||||||||||||||
| (unaudited) | ||||||||||||||||
| Assets |
||||||||||||||||
| Current assets: |
||||||||||||||||
| Cash and cash equivalents |
$ | 41,974 | $ | 92,348 | $ | 79,943 | ||||||||||
| Accounts receivable, net of allowances |
19,612 | 27,979 | 26,706 | |||||||||||||
| Prepaid expenses and other current assets |
1,974 | 4,549 | 4,656 | |||||||||||||
| Deferred commissions, current portion |
1,491 | 3,137 | 2,786 | |||||||||||||
|
|
|
|
|
|
|
|||||||||||
| Total current assets |
65,051 | 128,013 | 114,091 | |||||||||||||
| Property and equipment, net |
2,064 | 3,775 | 4,523 | |||||||||||||
| Deferred commissions, net of current portion |
1,482 | 2,386 | 2,243 | |||||||||||||
| Goodwill |
174 | 1,605 | 1,605 | |||||||||||||
| Intangible assets, net |
63 | 1,369 | 936 | |||||||||||||
| Other assets |
772 | 2,778 | 5,810 | |||||||||||||
|
|
|
|
|
|
|
|||||||||||
| Total assets |
$ | 69,606 | $ | 139,926 | $ | 129,208 | ||||||||||
|
|
|
|
|
|
|
|||||||||||
| Liabilities, Convertible Preferred Stock and Stockholders’ Equity (Deficit) |
||||||||||||||||
| Current liabilities: |
||||||||||||||||
| Accounts payable |
$ | 770 | $ | 1,096 | $ | 2,428 | ||||||||||
| Accrued expenses and other current liabilities |
11,703 | 14,446 | 15,261 | |||||||||||||
| Deferred revenue, current portion |
39,300 | 63,870 | 71,297 | |||||||||||||
|
|
|
|
|
|
|
|||||||||||
| Total current liabilities |
51,773 | 79,412 | 88,986 | |||||||||||||
| Deferred revenue, net of current portion |
1,439 | 1,056 | 839 | |||||||||||||
| Other liabilities |
519 | 747 | 847 | |||||||||||||
|
|
|
|
|
|
|
|||||||||||
| Total liabilities |
53,731 | 81,215 | 90,672 | |||||||||||||
|
|
|
|
|
|
|
|||||||||||
| Commitments and contingencies (Note 8) |
||||||||||||||||
| Convertible preferred stock, $0.0001 par value per share; 114,740,323, 133,875,417 and 133,875,417 shares authorized at January 31, 2015 and 2016 and July 31, 2016 (unaudited); 28,487,570, 33,431,855 and 33,431,855 issued and outstanding at January 31, 2015 and 2016 and July 31, 2016 (unaudited), respectively; aggregate liquidation preference $88,747, $169,247, $169,247 at January 31, 2015 and 2016 and July 31, 2016 (unaudited), respectively; no shares issued or outstanding pro forma (unaudited) |
88,444 | 164,950 | 164,950 | $ | — | |||||||||||
| Stockholders’ equity (deficit): |
||||||||||||||||
| Common stock, $0.0001 par value per share; 172,000,000, 225,000,000 and 225,000,000 shares authorized at January 31, 2015 and 2016 and July 31, 2016 (unaudited); 4,203,646, 5,758,338 and 6,099,978 shares issued and outstanding as of January 31, 2015 and 2016 and July 31, 2016 (unaudited), respectively; 40,710,957 shares issued and outstanding pro forma (unaudited) |
1 | 1 | 1 | 4 | ||||||||||||
| Additional paid-in capital |
4,143 | 16,629 | 20,759 | 185,706 | ||||||||||||
| Accumulated deficit |
(76,713 | ) | (122,869 | ) | (147,174 | ) | (147,174 | ) | ||||||||
|
|
|
|
|
|
|
|
|
|||||||||
| Total stockholders’ equity (deficit) |
(72,569 | ) | (106,239 | ) | (126,414 | ) | 38,536 | |||||||||
|
|
|
|
|
|
|
|
|
|||||||||
| Total liabilities, convertible preferred stock and stockholders’ equity (deficit) |
$ | 69,606 | $ | 139,926 | $ | 129,208 | $ | 38,536 | ||||||||
|
|
|
|
|
|
|
|
|
|||||||||
See notes to consolidated financial statements.
F-3
Table of Contents
COUPA SOFTWARE INCORPORATED
CONSOLIDATED STATEMENTS OF OPERATIONS AND COMPREHENSIVE LOSS
(In thousands, except per share amounts)
| Year ended January 31, |
Six months ended July 31, |
|||||||||||||||
| 2015 | 2016 | 2015 | 2016 | |||||||||||||
| (unaudited) | ||||||||||||||||
| Revenues: |
||||||||||||||||
| Subscription services |
$ | 43,051 | $ | 75,667 | $ | 31,622 | $ | 53,155 | ||||||||
| Professional services and other |
7,794 | 8,011 | 2,891 | 7,160 | ||||||||||||
|
|
|
|
|
|
|
|
|
|||||||||
| Total revenues |
50,845 | 83,678 | 34,513 | 60,315 | ||||||||||||
|
|
|
|
|
|
|
|
|
|||||||||
| Cost of revenues: |
||||||||||||||||
| Subscription services |
8,813 | 16,804 | 7,545 | 12,079 | ||||||||||||
| Professional services and other |
9,911 | 15,107 | 6,233 | 11,420 | ||||||||||||
|
|
|
|
|
|
|
|
|
|||||||||
| Total cost of revenues |
18,724 | 31,911 | 13,778 | 23,499 | ||||||||||||
|
|
|
|
|
|
|
|
|
|||||||||
| Gross profit |
32,121 | 51,767 | 20,735 | 36,816 | ||||||||||||
|
|
|
|
|
|
|
|
|
|||||||||
| Operating expenses: |
||||||||||||||||
| Research and development |
11,887 | 22,767 | 10,223 | 15,046 | ||||||||||||
| Sales and marketing |
33,724 | 54,713 | 24,211 | 35,088 | ||||||||||||
| General and administrative |
13,146 | 19,540 | 11,199 | 10,173 | ||||||||||||
|
|
|
|
|
|
|
|
|
|||||||||
| Total operating expenses |
58,757 | 97,020 | 45,633 | 60,307 | ||||||||||||
|
|
|
|
|
|
|
|
|
|||||||||
| Loss from operations |
(26,636 | ) | (45,253 | ) | (24,898 | ) | (23,491 | ) | ||||||||
| Other expense, net |
(563 | ) | (568 | ) | (131 | ) | (523 | ) | ||||||||
|
|
|
|
|
|
|
|
|
|||||||||
| Loss before provision for income taxes |
(27,199 | ) | (45,821 | ) | (25,029 | ) | (24,014 | ) | ||||||||
| Provision for income taxes |
101 | 335 | 118 | 291 | ||||||||||||
|
|
|
|
|
|
|
|
|
|||||||||
| Net loss and comprehensive loss |
$ | (27,300 | ) | $ | (46,156 | ) | $ | (25,147 | ) | $ | (24,305 | ) | ||||
|
|
|
|
|
|
|
|
|
|||||||||
| Net loss per share attributable to common stockholders, basic and diluted |
$ | (9.10 | ) | $ | (9.81 | ) | $ | (5.78 | ) | $ | (4.25 | ) | ||||
|
|
|
|
|
|
|
|
|
|||||||||
| Weighted-average number of shares used in computing net loss per share attributable to common stockholders, basic and diluted |
2,999 | 4,704 | 4,351 | 5,721 | ||||||||||||
|
|
|
|
|
|
|
|
|
|||||||||
| Pro forma net loss per share attributable to common stockholders, basic and diluted (unaudited) |
$ | (1.22 | ) | $ | (0.60 | ) | ||||||||||
|
|
|
|
|
|||||||||||||
| Weighted-average number of shares used in computing pro forma net loss per share attributable to common stockholders, basic and diluted (unaudited) |
37,795 | 40,332 | ||||||||||||||
|
|
|
|
|
|||||||||||||
See notes to consolidated financial statements.
F-4
Table of Contents
CONSOLIDATED STATEMENTS OF CONVERTIBLE PREFERRED STOCK AND STOCKHOLDERS’ DEFICIT
(In thousands, except share amounts)
| Convertible Preferred Stock |
Common Stock | Additional Paid-In Capital |
Accumulated Deficit |
Total Stockholders’ Deficit |
||||||||||||||||||||||||||||
| Shares | Amount | Shares | Amount | |||||||||||||||||||||||||||||
| Balance at January 31, 2014 |
23,543,199 | $ | 48,472 | 3,067,348 | $ | 1 | $ | 1,793 | $ | (49,413 | ) | $ | (47,619 | ) | ||||||||||||||||||
| Issuance of Series F convertible preferred stock, net of issuance costs of $28 |
4,944,371 | 39,972 | — | — | — | — | — | |||||||||||||||||||||||||
| Exercise of stock options |
— | — | 1,136,298 | — | 410 | — | 410 | |||||||||||||||||||||||||
| Vesting of early exercised stock options |
— | — | — | — | 86 | — | 86 | |||||||||||||||||||||||||
| Stock-based compensation expense |
— | — | — | — | 1,854 | — | 1,854 | |||||||||||||||||||||||||
| Net loss |
— | — | — | — | — | (27,300 | ) | (27,300 | ) | |||||||||||||||||||||||
|
|
|
|
|
|
|
|
|
|
|
|
|
|
|
|||||||||||||||||||
| Balance at January 31, 2015 |
28,487,570 | 88,444 | 4,203,646 | 1 | 4,143 | (76,713 | ) | (72,569 | ) | |||||||||||||||||||||||
| Issuance of Series G convertible preferred stock, net of issuance costs of $4,269 |
4,783,762 | 75,731 | — | — | — | — | — | |||||||||||||||||||||||||
| Exercise of Series E preferred stock warrants |
160,523 | 775 | — | — | — | — | — | |||||||||||||||||||||||||
| Issuance of common stock for acquisitions |
— | — | 314,386 | — | 1,269 | — | 1,269 | |||||||||||||||||||||||||
| Exercise of stock options |
— | — | 1,240,306 | — | 477 | — | 477 | |||||||||||||||||||||||||
| Vesting of early exercised stock options |
— | — | — | — | 142 | — | 142 | |||||||||||||||||||||||||
| Stock-based compensation expense |
— | — | — | — | 10,598 | — | 10,598 | |||||||||||||||||||||||||
| Net loss |
— | — | — | — | — | (46,156 | ) | (46,156 | ) | |||||||||||||||||||||||
|
|
|
|
|
|
|
|
|
|
|
|
|
|
|
|||||||||||||||||||
| Balance at January 31, 2016 |
33,431,855 | 164,950 | 5,758,338 | 1 | 16,629 | (122,869 | ) | (106,239 | ) | |||||||||||||||||||||||
| Exercise of stock options (unaudited) |
— | — | 341,640 | — | 577 | — | 577 | |||||||||||||||||||||||||
| Vesting of early exercised stock options (unaudited) |
— | — | — | — | 212 | — | 212 | |||||||||||||||||||||||||
| Stock-based compensation expense (unaudited) |
— | — | — | — | 3,324 | — | 3,324 | |||||||||||||||||||||||||
| Excess income tax benefit (unaudited) |
— | — | — | — | 17 | — | 17 | |||||||||||||||||||||||||
| Net loss (unaudited) |
— | — | — | — | — | (24,305 | ) | (24,305 | ) | |||||||||||||||||||||||
|
|
|
|
|
|
|
|
|
|
|
|
|
|
|
|||||||||||||||||||
| Balance at July 31, 2016 (unaudited) |
33,431,855 | $ | 164,950 | 6,099,978 | $ | 1 | $ | 20,759 | $ | (147,174 | ) | $ | (126,414 | ) | ||||||||||||||||||
|
|
|
|
|
|
|
|
|
|
|
|
|
|
|
|||||||||||||||||||
See notes to consolidated financial statements.
F-5
Table of Contents
CONSOLIDATED STATEMENTS OF CASH FLOWS
(In thousands)
| Year ended January 31, |
Six months ended July 31, |
|||||||||||||||
| 2015 | 2016 | 2015 | 2016 | |||||||||||||
| (unaudited) | ||||||||||||||||
| Cash flows from operating activities |
||||||||||||||||
| Net loss |
$ | (27,300 | ) | $ | (46,156 | ) | $ | (25,147 | ) | $ | (24,305 | ) | ||||
| Adjustments to reconcile net loss to net cash used in operating activities: |
||||||||||||||||
| Depreciation and amortization |
1,377 | 2,758 | 1,120 | 2,104 | ||||||||||||
| Amortization of deferred commissions |
1,384 | 2,834 | 1,063 | 2,024 | ||||||||||||
| Stock-based compensation |
1,807 | 10,568 | 8,033 | 3,265 | ||||||||||||
| Change in fair value of preferred stock warrant liability |
50 | 190 | 111 | 108 | ||||||||||||
| Other non-cash items |
— | — | — | 9 | ||||||||||||
| Changes in operating assets and liabilities net of effects from acquisitions: |
||||||||||||||||
| Accounts receivable |
(8,659 | ) | (8,314 | ) | 2,966 | 1,247 | ||||||||||
| Prepaid expenses and other current assets |
(807 | ) | (1,289 | ) | (335 | ) | (107 | ) | ||||||||
| Other assets |
(591 | ) | (2,006 | ) | (528 | ) | (879 | ) | ||||||||
| Deferred commissions |
(3,161 | ) | (5,384 | ) | (1,783 | ) | (1,530 | ) | ||||||||
| Accounts payable |
368 | (121 | ) | 917 | 1,101 | |||||||||||
| Accrued and other liabilities |
7,277 | 696 | 565 | 2,034 | ||||||||||||
| Deferred revenue |
16,326 | 24,155 | 6,256 | 7,210 | ||||||||||||
|
|
|
|
|
|
|
|
|
|||||||||
| Net cash used in operating activities |
(11,929 | ) | (22,069 | ) | (6,762 | ) | (7,719 | ) | ||||||||
|
|
|
|
|
|
|
|
|
|||||||||
| Cash flows from investing activities |
||||||||||||||||
| Purchase of property and equipment |
(2,370 | ) | (3,868 | ) | (1,862 | ) | (2,456 | ) | ||||||||
| Acquisitions, net of cash acquired |
— | (1,426 | ) | (860 | ) | — | ||||||||||
|
|
|
|
|
|
|
|
|
|||||||||
| Net cash used in investing activities |
(2,370 | ) | (5,294 | ) | (2,722 | ) | (2,456 | ) | ||||||||
|
|
|
|
|
|
|
|
|
|||||||||
| Cash flows from financing activities |
||||||||||||||||
| Proceeds from issuance of convertible preferred stock, net of issuance costs |
39,972 | 75,731 | 75,731 | — | ||||||||||||
| Proceeds from the exercise of preferred stock warrant |
— | 500 | 500 | — | ||||||||||||
| Payments of deferred offering costs |
— | (64 | ) | — | (2,824 | ) | ||||||||||
| Excess tax effect from shared-based compensation |
— | — | — | 17 | ||||||||||||
| Proceeds from the exercise of common stock options |
466 | 1,570 | 223 | 577 | ||||||||||||
|
|
|
|
|
|
|
|
|
|||||||||
| Net cash provided by (used in) financing activities |
40,438 | 77,737 | 76,454 | (2,230 | ) | |||||||||||
|
|
|
|
|
|
|
|
|
|||||||||
| Net increase (decrease) in cash and cash equivalents |
26,139 | 50,374 | 66,970 | (12,405 | ) | |||||||||||
| Cash and cash equivalents at beginning of year |
15,835 | 41,974 | 41,974 | 92,348 | ||||||||||||
|
|
|
|
|
|
|
|
|
|||||||||
| Cash and cash equivalents at end of year |
$ | 41,974 | $ | 92,348 | $ | 108,944 | $ | 79,943 | ||||||||
|
|
|
|
|
|
|
|
|
|||||||||
| Supplemental disclosure of cash flow data |
||||||||||||||||
| Cash paid for income taxes |
$ | 8 | $ | 17 | $ | 7 | $ | 80 | ||||||||
|
|
|
|
|
|
|
|
|
|||||||||
| Supplemental disclosure of non-cash investing and financing activities |
||||||||||||||||
| Issuance of common stock in connection with acquisitions |
$ | — | $ | 1,269 | $ | 233 | $ | — | ||||||||
|
|
|
|
|
|
|
|
|
|||||||||
| Vesting of early exercised stock options |
$ | 86 | $ | 142 | $ | 81 | $ | 212 | ||||||||
|
|
|
|
|
|
|
|
|
|||||||||
| Property and equipment included in accounts payable and accrued expenses and other current liabilities |
$ | 43 | $ | 184 | $ | 111 | $ | 132 | ||||||||
|
|
|
|
|
|
|
|
|
|||||||||
| Deferred offering costs included in accounts payable and accrued expenses and other current liabilities |
$ | — | $ | 1,254 | $ | — | $ | 544 | ||||||||
|
|
|
|
|
|
|
|
|
|||||||||
See notes to consolidated financial statements.
F-6
Table of Contents
NOTES TO CONSOLIDATED FINANCIAL STATEMENTS
(Unaudited as of July 31, 2016 and for the six months ended July 31, 2015 and 2016)
1. Organization and Description of Business
Coupa Software Incorporated (the “Company”) was incorporated in the state of Delaware in 2006. The Company provides a unified, cloud-based spend management platform that provide greater visibility into and control over how companies spend money. The platform enables businesses to achieve savings that drive profitability. The Company is based in San Mateo, California.
The Company’s fiscal year ends on January 31.
2. Significant Accounting Policies
Basis of Presentation
The accompanying consolidated financial statements have been prepared using accounting principles generally accepted in the United States of America (“GAAP”). The consolidated financial statements include the results of the Company and its wholly owned subsidiaries. All significant intercompany transactions and balances have been eliminated during consolidation.
Use of Estimates
The preparation of consolidated financial statements in conformity with GAAP requires management to make estimates and assumptions that affect the reported amounts of assets and liabilities and disclosure of contingent assets and liabilities as of the date of the consolidated financial statements and the reported amounts of revenue and expenses during the reporting period. On an ongoing basis, management evaluates its significant estimates including the valuation of accounts receivable, the lives of tangible and intangible assets, stock-based compensation, stock warrants, revenue recognition, the valuation of acquired intangible assets, and provisions for income taxes. Management bases its estimates on historical experience and on various other market-specific and relevant assumptions that management believes to be reasonable under the circumstances. Actual results could differ from those estimates and such differences could be material to the financial position and results of operations.
Stock Split
On September 21, 2016, the Company amended its amended and restated certificate of incorporation to effect a four-to-one reverse stock split of its common stock and convertible preferred stock. On the effective date of the reverse stock split, (i) each four shares of outstanding convertible preferred stock and common stock were reduced to one share of convertible preferred stock and common stock, respectively; (ii) the number of shares of common stock issuable under each outstanding option to purchase common stock and issuable upon vesting under each restricted stock unit was proportionately reduced on a four-to-one basis; (iii) the exercise price of each outstanding option to purchase common stock was proportionately increased on a four-to-one basis; (iv) the number of shares of convertible preferred stock issuable under the outstanding warrant was proportionally reduced on a four-to-one basis and the exercise price of the warrant was proportionally increased on a four-to-one basis; and (v) corresponding adjustments in the per share conversion prices, dividend rates and liquidation preferences of the convertible preferred stock were made. All of the share and per share information referenced throughout the consolidated financial statements and notes to the consolidated financial statements have been retroactively adjusted to reflect this reverse stock split.
F-7
Table of Contents
COUPA SOFTWARE INCORPORATED
NOTES TO CONSOLIDATED FINANCIAL STATEMENTS (CONTINUED)
2. Significant Accounting Policies (Continued)
Unaudited Interim Consolidated Financial Information
The accompanying interim consolidated balance sheet as of July 31, 2016, the interim consolidated statements of operations and comprehensive loss, and cash flows for the six months ended July 31, 2015 and 2016, and the interim consolidated statement of convertible preferred stock and stockholders’ deficit for the six months ended July 31, 2016 are unaudited. The unaudited interim financial statements have been prepared on the same basis as the audited consolidated financial statements, and in management’s opinion, include all adjustments, consisting of only normal recurring adjustments, necessary for the fair presentation of the Company’s financial position as of July 31, 2016 and its results of operations and cash flows for the six months ended July 31, 2015 and 2016. The financial data and the other financial information disclosed in the notes to these consolidated financial statements related to the six-month periods are also unaudited. The results of operations for the six months ended July 31, 2016 are not necessarily indicative of the results to be expected for the full fiscal year or any other period.
Unaudited Pro Forma Balance Sheet Information
The unaudited pro forma balance sheet information as of July 31, 2016 presents the Company’s stockholders’ equity as though all of the Company’s convertible preferred stock outstanding had automatically converted into shares of common stock upon the completion of a qualifying initial public offering (“IPO”) of the Company’s common stock. The shares of common stock issuable and the proceeds expected to be received by the Company upon the completion of a qualifying IPO are excluded from such pro forma financial information.
Segment Information
The Company’s chief operating decision maker is the Chief Executive Officer (“CEO”). The CEO reviews the financial information presented on a consolidated basis for purposes of allocating resources and evaluating the Company’s financial performance. Accordingly, the Company has determined that it operates in a single reporting segment; cloud platform.
Foreign Currency Translation
The functional currency for the Company’s foreign operations is the U.S. dollar. Foreign currency transaction gains and losses are included in the consolidated statements of operations for the period in other expense, net. All assets and liabilities denominated in a foreign currency are translated into U.S. dollars at the exchange rate prevailing on the balance sheet date. Revenues and expenses are translated at the transaction spot rate. For the years ended January 31, 2015 and 2016, foreign currency transaction gains and losses were comprised of a net loss of $166,000 and $789,000, respectively. The net loss resulting from foreign exchange transaction was $283,000 and $118,000, respectively, for the six months ended July 31, 2015 and 2016.
Risks and Uncertainties
The Company’s services are concentrated in an industry which is characterized by significant competition, rapid technological advances and changes in customer requirements and industry standards. The success of the Company depends on management’s ability to anticipate and respond quickly and adequately to technological developments in the industry and changes in customer requirements and industry standards. Any significant delays in the development or introduction of services could have a
F-8
Table of Contents
COUPA SOFTWARE INCORPORATED
NOTES TO CONSOLIDATED FINANCIAL STATEMENTS (CONTINUED)
2. Significant Accounting Policies (Continued)
material adverse effect on the Company’s business and operating results. Furthermore, the effects of potential legal activity that could be brought against the Company, including costs incurred to defend legal cases, relationships with customers and market perception, and the financial impact of any judicial decisions, could have a material adverse effect on the Company’s business and operating results.
The Company serves customers and users from data center facilities operated by a single third party, located in the U.S., Ireland and Australia. The Company has internal procedures to restore services in the event of disasters at the current data center facilities. Even with these procedures for disaster recovery in place, cloud applications could be significantly interrupted during the procedures to restore services.
Concentration of Risk and Significant Customers
Financial instruments that potentially subject the Company to a concentration of credit risk consist of cash and cash equivalents and accounts receivable. Cash deposits may, at times, exceed amounts insured by the Federal Deposit Insurance Corporation (“FDIC”) and the Securities Investor Protection Corporation (“SIPC”). The Company has not experienced any losses on its deposits of cash and cash equivalents to date.
One customer balance, which comprised 10% of accounts receivable, was the only customer balance comprising 10% or more of total accounts receivable at January 31, 2015. No customer balance comprised 10% or more of total accounts receivable at January 31, 2016 or July 31, 2016.
During the years ended January 31, 2015, and 2016 and for the six months ended July 31, 2015, and 2016, revenues by geographic area, based on billing addresses of the customers, was as follows.
| Year ended January 31, |
Six months ended July 31, |
|||||||||||||||
| 2015 | 2016 | 2015 | 2016 | |||||||||||||
| (unaudited) | ||||||||||||||||
| United States |
$ | 38,091 | $ | 60,411 | $ | 24,910 | $ | 42,610 | ||||||||
| Foreign countries |
12,754 | 23,267 | 9,603 | 17,705 | ||||||||||||
|
|
|
|
|
|
|
|
|
|||||||||
| Total revenues |
$ | 50,845 | $ | 83,678 | $ | 34,513 | $ | 60,315 | ||||||||
|
|
|
|
|
|
|
|
|
|||||||||
No single foreign country represented more than 10% of the Company’s revenues in either period.
Additionally, no single customer represented more than 10% of the Company’s revenues in either period.
Fair Value of Financial Instruments
The Company’s financial instruments include cash and money market funds, trade receivables, accounts payable and preferred stock warrants. Cash and cash equivalents and warrants are reported at fair value. The recorded carrying amount of trade receivables and accounts payable approximates their fair value due to their short-term nature.
Cash and Cash Equivalents
The Company considers all highly liquid investments purchased with original maturities of less than three months from the date of purchase to be cash equivalents. The Company’s cash and cash equivalents consist of monies held in bank demand deposits and money market funds and are presented at fair market value based on quoted market prices.
F-9
Table of Contents
COUPA SOFTWARE INCORPORATED
NOTES TO CONSOLIDATED FINANCIAL STATEMENTS (CONTINUED)
2. Significant Accounting Policies (Continued)
Accounts Receivable and Allowance for Doubtful Accounts
The Company extends credit to its customers in the normal course of business, and does not require cash collateral or other security to support the collection of customer receivables. The Company estimates the amount of uncollectible accounts receivable at the end of each reporting period based on the aging of the receivable balance, historical experience, and communications with customers, and provides a reserve when needed. Accounts receivable are written off when deemed uncollectible. The allowance for doubtful accounts was $189,000, $115,000 and $127,000 at January 31, 2015 and 2016 and July 31, 2016, respectively. The movements in the allowance for doubtful accounts were not significant for any of the periods presented.
Deferred Commissions
The Company capitalizes commission costs that can be associated specifically with a non-cancelable subscription contract. Commissions are earned by sales personnel upon the execution of the sales contract by the customer, and commission payments are made shortly after they are earned. Deferred commissions are amortized over the term of the related non-cancelable customer contract. The Company capitalized commission costs of $3.2 million and $5.4 million and amortized $1.4 million and $2.8 million to sales and marketing expense in the accompanying consolidated statements of operations during the years ended January 31, 2015 and 2016, respectively. The Company capitalized commission costs of $1.8 million and $1.5 million and amortized $1.1 million and $2.0 million to sales and marketing expense in the accompanying consolidated statements of operations during the six months ended July 31, 2015 and 2016, respectively.
Research and Development Costs
Research and development costs are expensed as incurred. Research and development costs consist primarily of compensation related costs incurred for the maintenance and bug fixing of the Company’s software platform, as well as planning, predevelopment and post implementation costs associated with the development of enhancements to the Company’s software platform.
Advertising Costs
Advertising costs are expensed as incurred and are included in sales and marketing expense in the accompanying consolidated statements of operations. Advertising expense totaled $360,000 and $1.7 million for the years ended January 31, 2015 and 2016 and $136,000 and $149,000 during the six months ended July 31, 2015 and 2016, respectively.
Capitalized Software Development Costs
The Company capitalizes certain development costs incurred in connection with software development for its cloud-based platform. Costs incurred in the preliminary stages of development are expensed as incurred. Once the software has reached the development stage, internal and external costs, if direct and incremental, are capitalized until the software is substantially complete and ready for its intended use. Capitalization ceases upon completion of all substantial testing. These software development costs are recorded as part of property and equipment.
Capitalized software development costs are amortized on a straight-line basis to cost of revenues—subscription services over the technology’s estimated useful life, which is two years. During the years ended
F-10
Table of Contents
COUPA SOFTWARE INCORPORATED
NOTES TO CONSOLIDATED FINANCIAL STATEMENTS (CONTINUED)
2. Significant Accounting Policies (Continued)
January 31, 2015 and 2016, the Company capitalized $2.1 million and $3.2 million, respectively, in software development costs. During the six months ended July 31, 2015 and 2016, the Company capitalized $1.4 million and $2.2 million, respectively, in software development costs.
Software development costs incurred in the maintenance and minor upgrade and enhancement of software without adding additional functionality are expensed as incurred.
Property and Equipment
Property and equipment are stated at cost net of accumulated depreciation and amortization. Depreciation is calculated using the straight-line method over the estimated useful lives of the assets. Furniture and equipment is amortized over an estimated useful life of three to five years. Leasehold improvements are amortized over the shorter of their useful life, estimated at five years, or the remaining term of the lease. Upon retirement or sale of assets, the cost and related accumulated depreciation and amortization are removed from the balance sheet and the resulting gain or loss is reflected in the statement of operations. Maintenance and repair costs are expensed as incurred.
Goodwill and Other Intangible Assets
Goodwill is the excess of costs over fair value of net assets of the business acquired. Goodwill and other intangible assets acquired that are determined to have an indefinite useful life are not amortized but are tested for impairment at least annually.
Other intangible assets, which consist of acquired developed technology and customer relationships, are recorded at fair value, net of accumulated amortization, and are amortized using the straight-line method. The Company assesses the impairment of long-lived intangible assets whenever events or changes in circumstances indicate that the carrying amount may not be recoverable.
The Company has not recorded impairment charges on goodwill and other intangible assets for the periods presented in these consolidated financial statements.
Revenue Recognition
The Company derives its revenues primarily from subscription services fees and professional services fees. The Company sells subscriptions to its cloud platform through contracts that are typically three years in length. The arrangements do not contain general rights of return. The subscription contracts do not provide customers with the right to take possession of the software supporting the applications and, as a result, are accounted for as service contracts.
The Company commences revenue recognition for its subscription services and professional services when all of the following criteria are met:
| • | There is persuasive evidence of an arrangement; |
| • | The service has been or is being provided to the customer; |
| • | Collection of the fees is reasonably assured; and |
| • | The amount of fees to be paid by the customer is fixed or determinable. |
F-11
Table of Contents
COUPA SOFTWARE INCORPORATED
NOTES TO CONSOLIDATED FINANCIAL STATEMENTS (CONTINUED)
2. Significant Accounting Policies (Continued)
Subscription Services Revenues
Subscription services revenues are recognized ratably over the contractual term of the arrangement beginning on the date that the service is made available to the customer, provided revenue recognized does not exceed amounts that are able to be invoiced, assuming all other revenue recognition criteria have been met.
Professional Services Revenues
Professional services are generally sold on a fixed-fee or time-and-materials basis. Revenue for time-and-material arrangements is recognized as the services are performed. For fixed-fee and other types of arrangements, revenue is generally deferred and recognized upon the completion of the project under the completed performance method of accounting.
Multiple Deliverable Arrangements
For arrangements with multiple deliverables, the Company evaluates whether the individual deliverables qualify as separate units of accounting. In order to treat deliverables in a multiple deliverable arrangement as separate units of accounting, the deliverables must have standalone value upon delivery. If the deliverables have standalone value upon delivery, the Company accounts for each deliverable separately, recognizing the respective revenue as the services are delivered.
The Company has determined that its subscription services have standalone value, as the Company sells its subscriptions separately. The professional services related to the Company’s subscription services also have standalone value as numerous partners are trained to perform these professional services and these partners have a history of contracting directly with customers and successfully completing deployments of the Company’s software platform.
When multiple deliverables included in an arrangement are separable into different units of accounting, the arrangement consideration is allocated to the identified units of accounting based on the relative selling price of each unit of accounting. Multiple deliverable arrangement accounting guidance provides a hierarchy when determining the relative selling price for each unit of accounting. Vendor-specific objective evidence (“VSOE”) of selling price, based on the price at which the item is regularly sold by the vendor on a standalone basis, should be used if it exists. If VSOE of selling price is not available, third-party evidence (“TPE”) of selling price is used to establish the selling price if it exists. VSOE and TPE do not currently exist for any of the Company’s deliverables. Accordingly, for arrangements with multiple deliverables that can be separated into different units of accounting, the relative selling price of each unit of accounting is based on best estimate of selling price (“BESP”).
The Company determines the BESP for deliverables based on overall pricing objectives, which take into consideration market conditions and entity-specific factors. This includes a review of historical data related to the size of arrangements, the cloud applications being sold, customer demographics and the numbers and types of users within the arrangements.
Cost of Subscription Services Revenue
Cost of subscription services revenue consist primarily of expenses related to the hosting of the Company’s subscription service and supporting the Company’s customers. These expenses are comprised of third-party hosting expenses and personnel and related costs directly associated with the Company’s
F-12
Table of Contents
COUPA SOFTWARE INCORPORATED
NOTES TO CONSOLIDATED FINANCIAL STATEMENTS (CONTINUED)
2. Significant Accounting Policies (Continued)
cloud infrastructure and cloud operations, including salaries, benefits, bonuses and stock-based compensation and allocated overhead.
Overhead associated with facilities, information technology and depreciation, excluding depreciation related to the Company’s data center infrastructure, is allocated to the cost of revenue and operating expenses based on headcount by cost center.
Cost of Professional Services Revenue
Cost of professional services revenue consist primarily of personnel costs directly associated with deployment of the Company’s solution, including salaries, benefits, bonuses and stock-based compensation, travel costs and allocated overhead, and costs of subcontractors.
Deferred Revenue
Deferred revenue consists of customer billings or payments received in advance of the recognition of revenue and is recognized as revenue as the revenue recognition criteria are met. The Company generally invoices its customers annually for the forthcoming year of service. Accordingly, the Company’s deferred revenue balance does not include revenue for future years of multiple year non-cancellable contracts that have not yet been billed.
Deferred Offering Costs
Deferred offering costs, which consist of direct incremental legal, consulting and accounting fees relating to the IPO, are capitalized. The deferred offering costs will be offset against IPO proceeds upon the consummation of the offering. In the event the offering is terminated, the deferred offering costs will be expensed. As of January 31, 2016 and July 31, 2016, the Company had capitalized approximately $1.3 million and $3.5 million, respectively, of deferred offering costs in other assets on the consolidated balance sheets. No amounts were deferred as of January 31, 2015.
Income Taxes
The Company accounts for income taxes under the asset and liability method, which requires that deferred income taxes be provided for temporary differences between the financial reporting and tax basis of the Company’s assets and liabilities. In addition, deferred tax assets are recorded for the future benefit from the utilization of net operating losses and research and development credit carryforwards. A valuation allowance is provided against deferred tax assets unless it is more likely than not that they will be realized.
The Company’s policy for accounting for uncertainty in income taxes requires the evaluation of tax positions taken or expected to be taken in the course of the preparation of tax returns to determine whether the tax positions are “more-likely-than-not” of being sustained by the applicable tax authority. Tax positions not deemed to meet the more-likely-than-not threshold would be recorded as a tax expense in the current year. The Company recognizes interest and penalties related to unrecognized tax benefits as income tax expense. Since the date of adoption of accounting for uncertain tax positions, there have been neither accrued interest nor penalties associated with any unrecognized tax benefits, nor was any interest expense recognized during any of the periods presented.
F-13
Table of Contents
COUPA SOFTWARE INCORPORATED
NOTES TO CONSOLIDATED FINANCIAL STATEMENTS (CONTINUED)
2. Significant Accounting Policies (Continued)
Preferred Stock Warrant Liability
The Company’s freestanding warrants to purchase the Company’s convertible preferred stock are classified as liabilities on the consolidated balance sheets and recorded at fair value because these warrants may obligate the Company to transfer assets to the warrant holders at a future date under certain circumstances, such as a change in control, and because of a clause that modifies the number of shares of the warrants to compensate the holder in the event that the Company issues certain securities below the warrant exercise price per share. The warrants are subject to remeasurement to fair value at each balance sheet date, and any change in fair value is recognized in the consolidated statements of operations as other income (expense), net. The Company will continue to adjust the liability for changes in fair value until the earlier of the exercise or expiration of the warrants. Upon an IPO and the conversion of the underlying class of preferred stock, the outstanding warrants terminate twelve months after the IPO should they not be exercised prior to that date. Upon exercise, the related warrant liability will be reclassified to additional paid-in capital.
Stock-Based Compensation
The Company measures and recognizes stock-based compensation expense for all stock-based awards, including grants of stock, restricted stock units (“RSU”) and options to purchase stock, made to employees and directors based on estimated fair values.
The Company uses the Black-Scholes option pricing model to value its options at the date of grant based on certain assumptions. The Company recognizes stock-based compensation for grants that vest based on only a service condition using the straight-line single-option approach. Recognized stock-based compensation expense has been reduced for estimated forfeitures of options granted, which is revised, if necessary, in subsequent periods if actual forfeitures differ from those estimates.
The Company granted RSUs during the year ended January 31, 2016, that vest upon satisfaction of both a service condition and a performance condition. Stock-based compensation expense is not recognized unless the performance condition is probable and is recognized net of estimated forfeitures, using the accelerated attribution method.
The Company records stock-based compensation expense from stock-based awards granted to non-employees at the estimated fair value of the awards upon vesting. The Company values options granted to non-employees using the Black-Scholes option pricing model. These awards are remeasured over their term until vested, exercised, cancelled or expired.
Comprehensive Loss
Comprehensive loss is defined as the change in equity of a business enterprise during a period from transactions and other events and circumstances from non-owner sources. The Company’s comprehensive loss is composed only of net loss.
Recent Accounting Pronouncements
In May 2014, the Financial Accounting Standards Board (“FASB”) issued ASU No. 2014-09, Revenue from Contracts with Customers, which provides guidance for revenue recognition. This ASU affects any entity that either enters into contracts with customers to transfer goods or services or enters into contracts for the transfer of non-financial assets. This ASU will supersede the revenue recognition requirements in Topic 605, Revenue Recognition, and most industry-specific guidance. This ASU also supersedes some cost
F-14
Table of Contents
COUPA SOFTWARE INCORPORATED
NOTES TO CONSOLIDATED FINANCIAL STATEMENTS (CONTINUED)
2. Significant Accounting Policies (Continued)
guidance included in Subtopic 605-35, Revenue Recognition-Construction-Type and Production-Type Contracts. ASU No. 2014-09 is effective for public entities for annual reporting periods, and interim periods within those annual reporting periods, beginning after December 31, 2017. Early adoption is permitted for all public entities only as of annual reporting periods, and interim periods within those annual reporting periods, beginning after December 15, 2016. The guidance allows for the amendment to be applied either retrospectively to each prior reporting period presented or retrospectively as a cumulative-effect adjustment as of the date of adoption. The Company is currently evaluating the impact of adopting ASU 2014-09 on its consolidated financial statements.
In September 2015, the FASB issued ASU No. 2015-16, Simplifying the Accounting for Measurement-Period Adjustments. The new guidance simplifies the accounting for measurement period adjustments in connection with business combinations by requiring that an acquirer recognize adjustments to provisional amounts that are identified during the measurement period in the reporting period in which the adjustment amounts are determined. This guidance is effective for financial statements issued for fiscal years beginning after December 15, 2015, and interim periods within those fiscal years. There was no impact from the application of the new guidance in the six months ended July 31, 2016.
In April 2015, the FASB issued ASU No. 2015-05, Intangibles—Goodwill and Other—Internal-Use Software (Subtopic 350-40): Customer’s Accounting for Fees Paid in a Cloud Computing Arrangement (“ASU 2015-05”). ASU 2015-05 provides guidance to clarify the customer’s accounting for fees paid in a cloud computing arrangement. ASU 2015-05 is effective for the Company in the first quarter of the year ending January 31, 2017. There was no impact from the application of the new guidance in the six months ended July 31, 2016.
In August 2014, the FASB issued ASU No. 2014-15, Disclosures of Uncertainties About an Entity’s Ability to Continue as a Going Concern. This standard provides guidance on how and when reporting entities must disclose going-concern uncertainties in their financial statements. The guidance is effective for the Company in the year ending January 31, 2017. There was no impact from the application of the new guidance in the six months ended July 31, 2016.
In November 2015, the FASB issued ASU 2015-17, Balance Sheet Classification of Deferred Taxes, related to balance sheet classification of deferred taxes. The ASU requires that deferred tax assets and liabilities be classified as noncurrent in the statement of financial position, thereby simplifying the current guidance that requires an entity to separate deferred assets and liabilities into current and noncurrent amounts. The ASU will be effective for the Company beginning in the first quarter of fiscal year 2018 though early adoption is permitted. The Company has early-adopted the ASU as of January 31, 2015 and its statement of financial position as of this date and thereafter reflects the revised classification of all deferred tax assets and liabilities as noncurrent. There is no other impact on the Company’s financial statements of early-adopting the ASU.
In February 2016, the FASB issued ASU 2016-02, Leases. The new standard establishes a right-of-use (“ROU”) model that requires a lessee to record a ROU asset and a lease liability on the balance sheet for all leases with terms longer than 12 months. Leases will be classified as either finance or operating, with classification affecting the pattern of expense recognition in the income statement. The new standard is effective for fiscal years beginning after December 15, 2018, including interim periods within those fiscal years. Early adoption is permitted. A modified retrospective transition approach is required for lessees for capital and operating leases existing at, or entered into after, the beginning of the earliest comparative
F-15
Table of Contents
COUPA SOFTWARE INCORPORATED
NOTES TO CONSOLIDATED FINANCIAL STATEMENTS (CONTINUED)
2. Significant Accounting Policies (Continued)
period presented in the financial statements, with certain practical expedients available. The Company is currently evaluating the impact of adopting ASU 2016-02 on its consolidated financial statements.
In March 30, 2016, the FASB issued ASU 2016-09, Improvements to Employee Share-Based Payment Accounting, which simplifies the accounting for share-based payment transactions, including accounting for income taxes, forfeitures, and classification in the statement of cash flows. The guidance is effective for public entities for annual periods beginning after December 15, 2016 and for all other entities for annual periods beginning after December 15, 2017. Early adoption is permitted. We are evaluating the accounting, transition and disclosure requirements of the standard and cannot currently estimate the financial statement impact of adoption.
3. Acquisitions
During the year ended January 31, 2016, the Company completed acquisitions which were accounted for as business combinations. The total purchase consideration of $2.9 million (paid in 213,050 shares of the Company’s common stock having a total fair value of $1.3 million, cash of $1.4 million, net of cash acquired, and $150,000 due between twelve and eighteen months after each respective acquisition date) for the acquisitions was preliminarily allocated as follows: $1.6 million to developed technologies and $74,000 to customer relationships based on their estimated fair values on the acquisition date. The excess $1.4 million of the purchase consideration over the fair value of net assets acquired was recorded as goodwill. One of the acquisitions had a net liabilities assumed amount of $242,000 at its acquisition date and the others had no acquired net tangible assets on the acquisition dates. Tax deductible goodwill resulting from one of these acquisitions was $91,000, with the remaining amounts not tax deductible for U.S. income tax purposes. Developed technologies and customer relationships will be amortized on a straight-line basis over their estimated useful lives of two years. These acquisitions generally enhance the breadth and depth of the Company’s offerings, as well as expanding the Company’s expertise in engineering and other functional areas.
In connection with the acquisitions completed during the year ended January 31, 2016, the Company issued 101,336 shares of the Company’s restricted common stock with a total fair value of $572,000, which have service-based vesting requirements and are therefore excluded from the purchase consideration. The related values will be recognized on a straight-line basis as compensation expense over the requisite service period of two years from the acquisition dates. As of January 31, 2016 and July 31, 2016, 26,444 and 51,155 of the 101,336 restricted shares of common stock have vested, respectively. As part of one of the acquisitions, the Company will pay up to $400,000 dependent on the revenue earned through September 2016 by the acquired business. The Company determined that there is an in-substance service period for an employee related to the potential future payment and therefore will record this amount as compensation expense if it becomes payable.
The results of operations for each of the acquisitions have been included in the Company’s consolidated statements of operations since the respective dates of acquisition. Actual and pro forma revenue and results of operations for the acquisitions have not been presented because they do not have a material impact to the consolidated revenue and results of operations, either individually or in aggregate.
F-16
Table of Contents
COUPA SOFTWARE INCORPORATED
NOTES TO CONSOLIDATED FINANCIAL STATEMENTS (CONTINUED)
4. Goodwill and Other Intangible Assets
Goodwill
The following table represents the changes in goodwill (in thousands):
| Balance at January 31, 2014 |
$ | 174 | ||
| Additions from acquisitions |
— | |||
|
|
|
|||
| Balance at January 31, 2015 |
174 | |||
| Additions from acquisitions |
1,431 | |||
|
|
|
|||
| Balance at January 31, 2016 |
1,605 | |||
| Additions from acquisitions (unaudited) |
— | |||
|
|
|
|||
| Balance at July 31, 2016 (unaudited) |
$ | 1,605 | ||
|
|
|
Other Intangible Assets
The following table summarizes the other intangible asset balances (in thousands):
| January 31, | July 31, | |||||||||||||||||||||||||||||||||||
| 2015 | 2016 | 2016 | ||||||||||||||||||||||||||||||||||
| (unaudited) | ||||||||||||||||||||||||||||||||||||
| Gross Carrying Amount |
Accumulated Amortization |
Net Carrying Amount |
Gross Carrying Amount |
Accumulated Amortization |
Net Carrying Amount |
Gross Carrying Amount |
Accumulated Amortization |
Net Carrying Amount |
||||||||||||||||||||||||||||
| Developed technology |
$ | 160 | $ | (97 | ) | $ | 63 | $ | 1,779 | $ | (478 | ) | $ | 1,301 | $ | 1,779 | $ | (892 | ) | $ | 887 | |||||||||||||||
| Customer relationships |
— | — | — | 74 | (6 | ) | 68 | 74 | (25 | ) | 49 | |||||||||||||||||||||||||
|
|
|
|
|
|
|
|
|
|
|
|
|
|
|
|
|
|
|
|||||||||||||||||||
| Total other intangible assets |
$ | 160 | $ | (97 | ) | $ | 63 | $ | 1,853 | $ | (484 | ) | $ | 1,369 | $ | 1,853 | $ | (917 | ) | $ | 936 | |||||||||||||||
|
|
|
|
|
|
|
|
|
|
|
|
|
|
|
|
|
|
|
|||||||||||||||||||
Amortization expense related to other intangible assets was approximately $53,000 and $387,000 for the years ended January 31, 2015 and 2016, respectively, and $79,000 and $432,000 for the six months ended July 31, 2015 and 2016, respectively.
As of January 31, 2016, the future amortization expense of other intangible assets is as follows (in thousands):
| Year ending January 31, |
||||
| 2017 |
$ | 856 | ||
| 2018 |
513 | |||
|
|
|
|||
| Total |
$ | 1,369 | ||
|
|
|
|||
F-17
Table of Contents
COUPA SOFTWARE INCORPORATED
NOTES TO CONSOLIDATED FINANCIAL STATEMENTS (CONTINUED)
4. Goodwill and Other Intangible Assets (Continued)
As of July 31, 2016, the future amortization expense of other intangible assets is as follows (in thousands):
| Six months ending July 31, (unaudited) |
||||
| 2017 (for the remaining six months) |
$ | 423 | ||
| 2018 |
513 | |||
|
|
|
|||
| Total |
$ | 936 | ||
|
|
|
|||
The Company, which has one reporting unit, performed an annual test for goodwill impairment during the fourth quarter of the years ended January 31, 2015 and 2016 and determined that goodwill was not impaired. In addition, there have been no significant events or circumstances affecting the valuation of goodwill subsequent to the Company’s annual assessment. Furthermore, no events or changes in circumstances have occurred to suggest that the carrying amounts for any of the Company’s long-lived assets or identifiable intangible assets may be non-recoverable. As such, the Company was not required to reevaluate the recoverability of its long-lived assets.
5. Property and Equipment, Net
Property and equipment consisted of the following (in thousands):
| January 31, | July 31, | |||||||||||
| 2015 | 2016 | 2016 | ||||||||||
| (unaudited) | ||||||||||||
| Furniture and equipment |
$ | 338 | $ | 870 | $ | 1,288 | ||||||
| Software development costs |
4,893 | 8,077 | 10,233 | |||||||||
| Leasehold improvements |
180 | 414 | 454 | |||||||||
| Construction in progress |
— | 238 | 114 | |||||||||
|
|
|
|
|
|
|
|||||||
| Total property and equipment |
5,411 | 9,599 | 12,089 | |||||||||
| Less: accumulated depreciation and amortization |
(3,347 | ) | (5,824 | ) | (7,566 | ) | ||||||
|
|
|
|
|
|
|
|||||||
| Property and equipment, net |
$ | 2,064 | $ | 3,775 | $ | 4,523 | ||||||
|
|
|
|
|
|
|
|||||||
Depreciation and amortization expense related to property and equipment, excluding software development costs, was approximately $105,000 and $256,000 for the years ended January 31, 2015 and 2016, respectively, and $117,000 and $202,000 for the six months ended July 31, 2015 and 2016, respectively. Amortization expense related to software development costs was approximately $1.2 million and $2.2 million for the years ended January 31, 2015 and 2016, respectively, and $1.0 million and $1.5 million for the six months ended July 31, 2015 and 2016, respectively.
6. Fair Value Measurements
Fair value is the exchange price that would be received for an asset or paid to transfer a liability (an exit price) in the principal or most advantageous market for the asset or liability in an orderly transaction between market participants on the measurement date. Subsequent changes in fair value of these financial assets and liabilities are recognized in earnings or other comprehensive income when they occur. When determining the fair value measurements for assets and liabilities which are required to be recorded at fair
F-18
Table of Contents
COUPA SOFTWARE INCORPORATED
NOTES TO CONSOLIDATED FINANCIAL STATEMENTS (CONTINUED)
6. Fair Value Measurements (Continued)
value, the Company considers the principal or most advantageous market in which the Company would transact and the market-based risk measurement or assumptions that market participants would use in pricing the assets or liabilities, such as inherent risk, transfer restrictions and credit risk.
The Company applies the following fair value hierarchy, which prioritizes the inputs used to measure fair value into three levels and bases the categorization within the hierarchy upon the lowest level of input that is available and significant to the fair value measurement:
| • | Level 1—Quoted prices in active markets for identical assets or liabilities. |
| • | Level 2—Observable inputs other than quoted price in active markets for identical assets or similar assets or liabilities in inactive markets, or other inputs that are observable or can be corroborated by observable market data for substantially full term of assets or liabilities. |
| • | Level 3—Inputs that are generally unobservable and typically reflect management’s estimates of assumptions that market participants would use in pricing the assets or liabilities. |
The following table summarizes the Company’s fair value hierarchy for its financial assets and liabilities measured at fair value on a recurring basis as of January 31, 2015 and 2016 and July 31, 2016 (in thousands):
| January 31, 2015 |
Level 1 | Level 2 | Level 3 | Total | ||||||||||||
| Financial assets: |
||||||||||||||||
| Money market funds(1) |
$ | 30,023 | $ | — | $ | — | $ | 30,023 | ||||||||
|
|
|
|
|
|
|
|
|
|||||||||
| Financial liabilities: |
||||||||||||||||
| Preferred stock warrant liability(2) |
$ | — | $ | — | $ | 332 | $ | 332 | ||||||||
|
|
|
|
|
|
|
|
|
|||||||||
| January 31, 2016 |
Level 1 | Level 2 | Level 3 | Total | ||||||||||||
| Financial assets: |
||||||||||||||||
| Money market funds(1) |
$ | 50,044 | $ | — | $ | — | $ | 50,044 | ||||||||
|
|
|
|
|
|
|
|
|
|||||||||
| Financial liabilities: |
||||||||||||||||
| Preferred stock warrant liability(2) |
$ | — | $ | — | $ | 247 | $ | 247 | ||||||||
|
|
|
|
|
|
|
|
|
|||||||||
| July 31, 2016 (unaudited) |
Level 1 | Level 2 | Level 3 | Total | ||||||||||||
| Financial assets: |
||||||||||||||||
| Money market funds(1) |
$ | 50,137 | $ | — | $ | — | $ | 50,137 | ||||||||
|
|
|
|
|
|
|
|
|
|||||||||
| Financial liabilities: |
||||||||||||||||
| Preferred stock warrant liability(2) |
$ | — | $ | — | $ | 355 | $ | 355 | ||||||||
|
|
|
|
|
|
|
|
|
|||||||||
| (1) | Included in cash and cash equivalents |
| (2) | Included in accrued expenses and other current liabilities and other liabilities |
The preferred stock warrants were valued using a Black-Scholes option pricing model. See Note 10 for further discussion.
F-19
Table of Contents
COUPA SOFTWARE INCORPORATED
NOTES TO CONSOLIDATED FINANCIAL STATEMENTS (CONTINUED)
6. Fair Value Measurements (Continued)
The following table represents the change in the fair value of the preferred stock warrant liability (in thousands):
| Balance at January 31, 2014 |
$ | 282 | ||
| Change in fair value |
50 | |||
|
|
|
|||
| Balance at January 31, 2015 |
332 | |||
| Exercise of convertible preferred stock warrant |
(275 | ) | ||
| Change in fair value |
190 | |||
|
|
|
|||
| Balance at January 31, 2016 |
247 | |||
| Change in fair value (unaudited) |
108 | |||
|
|
|
|||
| Balance at July 31, 2016 (unaudited) |
$ | 355 | ||
|
|
|
7. Accrued Expenses and Other Current Liabilities
Accrued expenses and other current liabilities consisted of the following (in thousands):
| January 31, | July 31, | |||||||||||
| 2015 | 2016 | 2016 | ||||||||||
| (unaudited) | ||||||||||||
| Accrued compensation |
$ | 3,753 | $ | 6,605 | $ | 7,541 | ||||||
| Accrued other current liabilities |
7,950 | 7,841 | 7,720 | |||||||||
|
|
|
|
|
|
|
|||||||
| Total accrued expenses and other current liabilities |
$ | 11,703 | $ | 14,446 | $ | 15,261 | ||||||
|
|
|
|
|
|
|
|||||||
8. Commitments and Contingencies
Commitments
The Company leases office space under non-cancelable operating leases with various expiration dates through September 2020. Rent expense, which is being recognized on a straight-line basis over the lease term, was $1.4 million and $2.4 million during the years ended January 31, 2015 and 2016, respectively, and $932,000 and $1.9 million for the six months ended July 31, 2015 and July 2016, respectively. The difference between the lease payments made and the lease expense recognized to date using the straight-line method is recorded as a liability and included within accrued expenses and other current liabilities in the accompanying consolidated balance sheet.
Future minimum lease payments required under these agreements as of January 31, 2016 are as follows (in thousands):
| Year ending January 31, |
||||
| 2017 |
$ | 3,131 | ||
| 2018 |
3,112 | |||
| 2019 |
3,135 | |||
| 2020 |
1,277 | |||
| 2021 |
331 | |||
|
|
|
|||
| Total |
$ | 10,986 | ||
|
|
|
|||
F-20
Table of Contents
COUPA SOFTWARE INCORPORATED
NOTES TO CONSOLIDATED FINANCIAL STATEMENTS (CONTINUED)
8. Commitments and Contingencies (Continued)
As of July 31, 2016, remaining future minimum lease payments required under these agreements are as follows (in thousands):
| Six months ending July 31, |
||||
| 2017 |
$ | 1,735 | ||
| 2018 |
3,322 | |||
| 2019 |
3,330 | |||
| 2020 |
1,332 | |||
| 2021 |
334 | |||
|
|
|
|||
| Total |
$ | 10,053 | ||
|
|
|
|||
Contingencies
On May 14, 2014, Ariba, Inc. (“Ariba”), filed a lawsuit in the Santa Clara Superior Court that alleged that the Company misappropriated trade secrets of Ariba, and requested a permanent injunction and the award of certain damages. On September 23, 2015, the Company and Ariba entered into a confidential settlement agreement to resolve the trade secret litigation. The amount incurred for the settlement of the litigation is included in accrued expenses and other current liabilities in the Company’s consolidated balance sheet as of January 31, 2015, and the related expense is included in general and administrative expenses in the accompanying consolidated statement of operations for the year ended January 31, 2015. The one-time payment of the cash settlement between the two parties for this liability occurred on September 28, 2015.
The Company may be subject to other various claims and legal proceedings which arise in the normal course of business. Management believes that the ultimate resolution of such matters will not have a material adverse effect on the financial position or results of operations of the Company.
Warranties and Indemnifications
The Company’s cloud-based software platform and applications are typically warranted to perform in a manner consistent with general industry standards and in accordance with the Company’s on-line documentation under normal use and circumstances.
The Company includes service level commitments to its customers warranting certain levels of uptime reliability and performance and permitting those customers to receive credits in the event that the Company fails to meet those levels. To date, the Company has not incurred any material costs as a result of such commitments and has not accrued any liabilities related to such obligations in the accompanying consolidated financial statements.
The Company generally agrees to defend and indemnify its customers against legal claims that the Company’s platform infringes certain United States patents or copyrights. To date, the Company has not been required to make any payment resulting from such infringement claims and has not recorded any related liabilities.
F-21
Table of Contents
COUPA SOFTWARE INCORPORATED
NOTES TO CONSOLIDATED FINANCIAL STATEMENTS (CONTINUED)
9. Convertible Preferred Stock
The following table summarizes the authorized, issued and outstanding convertible preferred stock of the Company as of January 31, 2016 (in thousands, except share and per share data):
| Class |
Issuance Price per Share |
Shares Authorized |
Shares Issued and Outstanding |
Net Carrying Value |
Liquidation Preference |
|||||||||||||||
| Series A |
$ | 1.9000 | 2,389,475 | 597,367 | $ | 1,093 | $ | 1,135 | ||||||||||||
| Series B |
$ | 5.3600 | 4,559,698 | 1,139,923 | 6,054 | 6,110 | ||||||||||||||
| Series C |
$ | 1.2780 | 23,474,174 | 5,868,542 | 7,433 | 7,500 | ||||||||||||||
| Series D |
$ | 1.3524 | 35,645,162 | 8,874,318 | 11,972 | 12,002 | ||||||||||||||
| Series E |
$ | 3.1148 | 28,894,310 | 7,223,572 | 22,695 | 22,500 | ||||||||||||||
| Series F |
$ | 8.0900 | 19,777,504 | 4,944,371 | 39,972 | 40,000 | ||||||||||||||
| Series G |
$ | 16.7232 | 19,135,094 | 4,783,762 | 75,731 | 80,000 | ||||||||||||||
|
|
|
|
|
|
|
|
|
|||||||||||||
| 133,875,417 | 33,431,855 | $ | 164,950 | $ | 169,247 | |||||||||||||||
|
|
|
|
|
|
|
|
|
|||||||||||||
The rights, preferences and privileges of the convertible preferred stock are as follows:
Voting—The holders of the convertible preferred stock are entitled to vote, together with the holders of common stock, on all matters submitted to the stockholders for a vote. Each convertible preferred stockholder is entitled to the number of votes equal to the number of shares of common stock into which each preferred share is convertible at the time of such vote.
The holders of Series A through Series D convertible preferred stock are each entitled to elect one director, as long as each of these series of preferred stock have at least 250,000 originally issued shares which remain outstanding (as adjusted for stock splits, combinations, recapitalizations or the like) and the holders of outstanding common stock are entitled to elect a single director. Any remaining directors are to be elected by the holders of preferred stock and common stock (voting together as a single class and on an as converted basis).
Dividends—The holders of the outstanding shares of Series A, Series B, Series C, Series D, Series E, Series F and Series G convertible preferred stock are entitled to receive, out of assets legally available therefor, prior and in preference to any cash dividend payment to common stockholders, when, as and if declared by the board of directors, a noncumulative dividend at the rate of $0.1520, $0.4288, $0.1024, $0.1084, $0.2492, $0.6472 and $1.3380 per share per annum, respectively. The dividend rates are subject to appropriate adjustment in the event of any stock dividend, stock split, combination, or similar recapitalization affecting such shares. After payment of such dividend, any additional dividends shall be distributed among all holders of common stock and preferred stock in proportion to the number of shares of common stock that would be held by each such holder if all shares of preferred stock were converted to common stock at the then effective conversion rate. No dividends have been declared or paid to date.
Conversion—Each share of preferred stock is convertible, at the option of the holder, into fully paid shares of common stock determined by dividing the original issue price by the conversion price. The conversion prices for Series A, Series B, Series C, Series D, Series E, Series F and Series G convertible preferred stock is $1.5132, $2.8204, $1.278, $1.3524, $3.1148, $8.09 and $16.7232 per share, respectively, and are subject to adjustment for recapitalizations, as defined by the restated Certification of Incorporation. Additionally, the conversion prices of Series C, Series D, Series E, Series F and Series G convertible preferred stock are subject to adjustment upon certain sales of shares of common or preferred stock below their then effective conversion price, as well as upon certain sales of rights, options or
F-22
Table of Contents
COUPA SOFTWARE INCORPORATED
NOTES TO CONSOLIDATED FINANCIAL STATEMENTS (CONTINUED)
9. Convertible Preferred Stock (Continued)
convertible securities whereupon the price of shares of common stock issuable upon exercise of such rights, options or convertible securities is below their then effective conversion prices. The conversion prices of Series A and Series B convertible preferred stock are similarly subject to adjustment but only when the price of the shares of common stock issuable is below the then effective conversion price of Series C convertible preferred stock. The issuance of common shares in an underwritten public offering upon which all preferred stock automatically converts to common stock does not result in adjustments to the conversion price of preferred stock. As of January 31, 2016, each share of preferred stock will convert into common stock on a one-to-one basis, except for Series A and Series B shares which convert into common stock on a 1-to-1.25561723 and 1-to-1.90043965 basis, respectively.
Each share of Series A, Series B, Series C, Series D and Series E convertible preferred stock will automatically convert into shares of common stock at the then-effective conversion rate for each such share immediately upon the earlier of (i) the Company’s sale of its common stock in a firm commitment of an underwritten public offering pursuant to a registration statement under the Securities Act of 1933, as amended, or the Securities Act, which results in aggregate gross proceeds to the Company of at least $50,000,000 (net of underwriting discounts and commissions) or (ii) the date specified by the written consent or agreement of the Series A, Series B, Series C, Series D and Series E preferred stock holders of at least 70% of the then-outstanding shares of Series A, Series B, Series C, Series D and Series E convertible preferred stock (voting together as a single class and not as separate series, and on an as-converted basis). For Series F and Series G preferred stock, they also convert automatically upon the same public offering conditions or by written consent or agreement of the holders of 75% and 55% of the outstanding shares of Series F and Series G preferred stock, respectively (each voting as a separate series).
Liquidation—In the event of any liquidation, dissolution or winding up of the Company, either voluntarily or involuntarily, the holders of the then outstanding convertible preferred stock are first entitled to receive, prior and in preference to any payment or distribution of any available funds and assets to the holders of common stock, payment or distribution of funds and assets equal to the greater of original issue price plus declared and unpaid dividends or the per share amount that would have been paid if the preferred share had been converted to common stock. The full preferential amount is first paid to the holders of the series of convertible preferred stock with the highest level of liquidation preference, then to the stockholders of the next level of preference in order (Series G convertible preferred stock, Series F convertible preferred stock, Series E convertible preferred stock, Series D convertible preferred stock, Series C convertible preferred stock, Series B convertible preferred stock and Series A convertible preferred stock; listed in the order of highest liquidation preference to the lowest). If the available funds and assets are insufficient to satisfy the full preferential payment for the stockholders of a particular series of convertible preferred stock in order, then all of the available funds and assets shall be distributed among the holders of that series of convertible preferred stock pro-rata based on the amounts to which such holders would otherwise be entitled.
Unless otherwise approved by a vote of 60% of holders of the outstanding convertible preferred stock (voting together as a single class and not as separate series, and on an as-converted basis), at least 75% of the outstanding shares of Series F convertible preferred stock (voting as a separate series), and at least 55% of the outstanding shares of Series G convertible preferred stock (voting as a separate series), a deemed liquidation event will occur upon (i) the sale, transfer or other disposition of all or substantially all of the assets of the Company; (ii) the merger or consolidation of the Company with or into another entity (except where at least the majority of the voting power of the surviving entity is held by the stockholders of
F-23
Table of Contents
COUPA SOFTWARE INCORPORATED
NOTES TO CONSOLIDATED FINANCIAL STATEMENTS (CONTINUED)
9. Convertible Preferred Stock (Continued)
the Company in the same proportion as immediately prior to the merger of consolidation); or (iii) the transfer or issuance of securities to a person or group of affiliates that would hold the majority of the outstanding voting stock.
If there are any available funds and assets remaining after the payment or distribution to holders of convertible preferred stock of their full preferential amount described above, then all such remaining available funds and assets shall be distributed among the holders of the then outstanding common stock pro rata according to the number of common stock held by each holder thereof.
Although the convertible preferred stock is not mandatorily or currently redeemable, a liquidation or winding up of the Company, a greater than 50% change in control or a sale of substantially all of the Company’s assets would constitute a redemption event not solely within the Company’s control. Therefore, all shares of convertible preferred stock have been presented outside of permanent equity.
10. Preferred Stock Warrants
The following convertible preferred stock warrants were outstanding with the related fair values as of January 31, 2015 and 2016 and July 31, 2016 (in thousands, except for share and per share data):
| January 31, | July 31, | |||||||||||||||||||||||||||
| 2015 | 2016 | 2016 | ||||||||||||||||||||||||||
| Series |
Price per Share |
Warrant Shares Outstanding |
Fair Value |
Warrant Shares Outstanding |
Fair Value |
Warrant Shares Outstanding |
Fair Value |
|||||||||||||||||||||
| (unaudited) | ||||||||||||||||||||||||||||
| D |
$ | 1.3524 | 36,971 | $ | 115 | 36,971 | $ | 247 | 36,971 | $ | 355 | |||||||||||||||||
| E |
$ | 3.1148 | 160,523 | 217 | — | — | — | — | ||||||||||||||||||||
|
|
|
|
|
|
|
|
|
|
|
|
|
|||||||||||||||||
| Total |
197,494 | $ | 332 | 36,971 | $ | 247 | 36,971 | $ | 355 | |||||||||||||||||||
|
|
|
|
|
|
|
|
|
|
|
|
|
|||||||||||||||||
The Series D warrants were issued during the year ended January 31, 2012, in connection with a line of credit facility that expired prior to the beginning of 2014. The warrants expire on the earlier of the date of warrant expiration, October 12, 2021, or in the event of certain acquisitions of the Company, or one year after an initial public offering. As of January 31, 2016 and July 31, 2016, the Series D warrants have not been exercised.
The Series E warrant was issued during the year ended January 31, 2013 and was set to expire on May 21, 2015. During the year ended January 31, 2016, the Series E warrant was exercised for 160,523 shares of Series E convertible preferred stock. The related preferred stock warrant liability was remeasured to fair value through the exercise date, and the remaining liability was reclassified to convertible preferred stock.
To determine the fair value of the convertible preferred stock warrants, the Company first derived the business enterprise value (“BEV”) of the Company using valuation methods, including a combination of methods, as deemed appropriate under the circumstances applicable at each valuation date. Once the Company determined an estimated BEV, the option pricing method (“OPM”) or a hybrid of the probability weighted expected return method (“PWERM”) and OPM was used to allocate the BEV to the various classes of the Company’s equity, including the Company’s preferred stock. Once the per share value of preferred stock was determined, the concluded per share value was the fair value of the shares
F-24
Table of Contents
COUPA SOFTWARE INCORPORATED
NOTES TO CONSOLIDATED FINANCIAL STATEMENTS (CONTINUED)
10. Preferred Stock Warrants (Continued)
input within the Black-Scholes option pricing model that was utilized to determine the fair value of the convertible preferred stock warrants. In addition to the fair value of the shares input, the Black-Scholes option pricing model includes assumptions related to the exercise price, expected volatility, expected term, risk-free interest rate, and the expected dividend yield. The estimated expected volatility was derived from historical volatilities of several unrelated publicly listed peer companies over a period approximately equal to the remaining term of the warrants. When making the selections of the Company’s industry peer companies to be used in the volatility calculation, the Company considered the size and operational and economic similarities to the Company’s principle business operations. The estimated expected term represents either the lesser of (i) the remaining contractual term of the warrants or (ii) the remaining term under probable scenarios used to determine the fair value of the underlying stock. The risk-free interest rate was based on the U.S. Treasury yield for a term consistent with the estimated expected term. The significant unobservable inputs used in the fair value measurement of the convertible preferred stock warrant liability are the fair value of the underlying stock at the valuation date, the expected volatility, and the estimated term of the warrants. Generally, increases (decreases) in the fair value of the underlying stock, expected volatility and expected term would result in a directionally similar impact to the fair value measurement.
The warrants were valued using the Black-Scholes option pricing model which included the following assumptions:
| January 31, | July 31, | |||||
| 2015 | 2016 | 2016 | ||||
| (unaudited) | ||||||
| Term in years |
0.3 to 6.7 | 1.50 to 5.69 | 0.17 to 5.2 | |||
| Risk-free interest rate |
0.03% to 1.44% | 0.61 to 1.45% | 0.24 to 1.06% | |||
| Volatility |
30 to 49% | 48% | 48% | |||
| Dividend yield |
0% | 0% | 0% | |||
The Company recognized an expense of $50,000 and $190,000, included in other expense, net, on the consolidated statements of operations, as a result of the fair value remeasurement for these warrants during the years ended January 31, 2015 and 2016, respectively, and $111,000 and $108,000 during the six months ended July 31, 2015 and 2016, respectively.
11. Common Stock
Each share of common stock has the right to one vote. The holders of the common stock are also entitled to receive dividends whenever funds are legally available and when declared by the Board of Directors, subject to the prior rights of holders of all classes of stock outstanding having priority rights as to dividends. No dividends have been declared or paid since inception.
F-25
Table of Contents
COUPA SOFTWARE INCORPORATED
NOTES TO CONSOLIDATED FINANCIAL STATEMENTS (CONTINUED)
11. Common Stock (Continued)
At January 31, 2016, the Company had reserved shares of common stock, on an as-converted basis, for future issuance as follows:
| Conversion of convertible preferred stock |
34,610,979 | |||
| Warrants to purchase convertible preferred stock |
36,971 | |||
| Stock options and RSUs outstanding |
9,606,466 | |||
| Shares available for future grants of equity awards |
1,727,419 | |||
|
|
|
|||
| Total |
45,981,835 | |||
|
|
|
At July 31, 2016, the Company had reserved shares of common stock, on an as-converted basis, for future issuance as follows:
| Conversion of convertible preferred stock (unaudited) |
34,610,979 | |||
| Warrants to purchase convertible preferred stock (unaudited) |
36,971 | |||
| Stock options and RSUs outstanding (unaudited) |
12,452,127 | |||
| Shares available for future grants of equity awards (unaudited) |
1,212,620 | |||
|
|
|
|||
| Total (unaudited) |
48,312,697 | |||
|
|
|
12. Stock Option Plans
Stock-Based Compensation Plans
In 2006, the Company adopted the 2006 Stock Plan (“2006 Stock Plan”), which was most recently amended in May 2015. The 2006 Stock Plan provides for the direct award or sale of shares, the grant of options to purchase shares and the grant of RSUs to employees, consultants, and outside directors of the Company. Options granted under the 2006 Stock Plan may be either incentive stock options (“ISOs”) or non-qualified stock options (“NSOs”). ISOs may be granted only to Company employees (including officers and directors who are also employees). NSOs may be granted to Company employees, outside directors, and consultants. At July 31, 2016, the Company has reserved 1,212,620 shares of its common stock for future share based awards under its stock option plan.
Under the 2006 Stock Plan, the exercise price of any option shall not be less than 100% of the estimated fair value of the shares on the date of grant. Stock options generally vest over four years and have a maximum term of ten years.
Under the 2006 Stock Plan, the Company has granted RSUs to certain international employees during the year ended January 31, 2016. No additional RSUs have been granted during the six months ended July 31, 2016. These RSUs vest upon the satisfaction of both a service condition and a performance condition. The service condition for these awards is generally satisfied over four years. The performance condition is satisfied on the earlier to occur of (i) an IPO or (ii) a sales event, in either case within seven years of the grant date.
F-26
Table of Contents
COUPA SOFTWARE INCORPORATED
NOTES TO CONSOLIDATED FINANCIAL STATEMENTS (CONTINUED)
12. Stock Option Plans (Continued)
Stock Option Activity
The following table summarizes stock option activity under the 2006 Stock Plan during the year ended January 31, 2016 and for the six months ended July 31, 2016 (aggregate intrinsic value in thousands):
| Options Outstanding | ||||||||||||||||
| Outstanding Stock Options |
Weighted- Average Exercise Price |
Weighted- Average Remaining Contractual Life (in years) |
Aggregate Intrinsic Value |
|||||||||||||
| Balance, January 31, 2015 |
7,591,950 | $ | 1.56 | 7.99 | $ | 18,013 | ||||||||||
| Option grants |
3,791,333 | $ | 5.48 | |||||||||||||
| Options exercised |
(1,240,306 | ) | $ | 1.28 | ||||||||||||
| Options forfeited |
(599,011 | ) | $ | 3.28 | ||||||||||||
|
|
|
|||||||||||||||
| Balance, January 31, 2016 |
9,543,966 | $ | 2.84 | 8.08 | $ | 47,658 | ||||||||||
|
|
|
|||||||||||||||
| Option grants (unaudited) |
3,786,211 | $ | 7.96 | |||||||||||||
| Options exercised (unaudited) |
(341,640 | ) | $ | 1.68 | ||||||||||||
| Options forfeited (unaudited) |
(592,660 | ) | $ | 3.68 | ||||||||||||
|
|
|
|||||||||||||||
| Balance, July 31, 2016 (unaudited) |
12,395,877 | $ | 4.40 | 8.18 | $ | 76,894 | ||||||||||
|
|
|
|||||||||||||||
| Vested and expected to vest at January 31, 2016 |
8,354,888 | $ | 2.76 | 8.00 | $ | 42,544 | ||||||||||
| Exercisable at January 31, 2016 |
5,222,173 | $ | 1.68 | 7.27 | $ | 32,177 | ||||||||||
| Vested and expected to vest at July 31, 2016 (unaudited) |
11,389,914 | $ | 4.24 | 8.00 | $ | 72,655 | ||||||||||
| Exercisable at July 31, 2016 (unaudited) |
5,660,879 | $ | 2.20 | 7.07 | $ | 47,484 | ||||||||||
The options exercisable as of January 31, 2016 and July 31, 2016 include options that are exercisable prior to vesting. The aggregate intrinsic value of options vested and expected to vest and exercisable as of January 31, 2016 and July 31, 2016 is calculated based on the difference between the exercise price and the fair value of the Company’s common stock as of January 31, 2016 and July 31, 2016. The aggregate intrinsic value of exercised options for the years ended January 31, 2015 and 2016 and for the six months ended July 31, 2015 and 2016 was $2.6 million, $5.5 million, $3.5 million and $2.2 million, respectively, and is calculated based on the difference between the exercise price and the fair value of the Company’s common stock as of the exercise date.
The weighted-average grant date fair value of options granted during the years ended January 31, 2015 and 2016 and for the six months ended July 31, 2015 and 2016 was $1.24, $2.28, $1.92 and $3.72 per share, respectively.
During the year ended January 31, 2016 and for the six months ended July 31, 2016, 16,250 and 52,250 options were granted to non-employees, respectively.
Early Exercises of Stock Options
Certain option grants under the 2006 Stock Plan are allowed to be exercised prior to vesting. The unvested shares of common stock exercised are subject to the Company’s right to repurchase at the lower of the original exercise price or the fair market value of the share at the time the repurchase right is
F-27
Table of Contents
COUPA SOFTWARE INCORPORATED
NOTES TO CONSOLIDATED FINANCIAL STATEMENTS (CONTINUED)
12. Stock Option Plans (Continued)
exercised. Early exercises of options are not deemed to be substantive exercises for accounting purposes and accordingly, amounts received for early exercises are initially recorded in accrued expenses and other current liabilities and reclassified to additional paid-in capital as the underlying shares vest. At January 31, 2015 and 2016, the Company had $143,000 and $1.1 million, respectively, recorded in accrued expenses and other current liabilities related to early exercises of stock options, and the related number of unvested shares subject to repurchase was 219,793 and 208,008, respectively. At July 31, 2016, the Company had $880,000 recorded in accrued expenses and other current liabilities related to early exercises of stock options, and the related number of unvested shares subject to repurchase was 138,433.
RSU Activity
The following table summarizes the activity related to the Company’s RSUs:
| Number of RSUs Outstanding |
Weighted-Average Grant Date Fair Value |
|||||||
| Awarded and unvested at January 31, 2015 |
— | $ | — | |||||
| Awards granted |
65,000 | $ | 5.16 | |||||
| Awards vested |
— | $ | — | |||||
| Awards forfeited |
(2,500 | ) | $ | 3.92 | ||||
|
|
|
|||||||
| Awarded and unvested at January 31, 2016 |
62,500 | $ | 5.20 | |||||
|
|
|
|||||||
| Awards granted (unaudited) |
— | $ | — | |||||
| Awards vested (unaudited) |
— | $ | — | |||||
| Awards forfeited (unaudited) |
(6,250 | ) | $ | 3.92 | ||||
|
|
|
|||||||
| Awarded and unvested at July 31, 2016 (unaudited) |
56,250 | $ | 5.36 | |||||
|
|
|
|||||||
Stock-Based Compensation
The Company’s total stock-based compensation expense was as follows (in thousands):
| Year ended January 31, |
Six months ended July 31, |
|||||||||||||||
| 2015 | 2016 | 2015 | 2016 | |||||||||||||
| (unaudited) | ||||||||||||||||
| Cost of revenue: |
||||||||||||||||
| Subscription services |
$ | 109 | $ | 235 | $ | 99 | $ | 265 | ||||||||
| Professional services and other |
110 | 1,014 | 885 | 244 | ||||||||||||
| Research and development |
337 | 1,236 | 857 | 625 | ||||||||||||
| Sales and marketing |
433 | 1,347 | 386 | 911 | ||||||||||||
| General and administrative |
818 | 6,736 | 5,806 | 1,220 | ||||||||||||
|
|
|
|
|
|
|
|
|
|||||||||
| Total |
$ | 1,807 | $ | 10,568 | $ | 8,033 | $ | 3,265 | ||||||||
|
|
|
|
|
|
|
|
|
|||||||||
Stock-based compensation capitalized in capitalized software development costs was $96,000 at January 31, 2015 and $125,000 at January 31, 2016. At July 31, 2015 and 2016, stock-based compensation capitalized in capitalized software development costs was $109,000 and $184,000, respectively.
F-28
Table of Contents
COUPA SOFTWARE INCORPORATED
NOTES TO CONSOLIDATED FINANCIAL STATEMENTS (CONTINUED)
12. Stock Option Plans (Continued)
Of the total stock-based compensation expense recognized, $87,000 and $52,000 were related to options granted to non-employees for the years ended January 2015 and 2016 and $17,000 and $52,000 for the six months ended July 31, 2015 and 2016, respectively.
As of January 31, 2016 and July 31, 2016 there was approximately $7.6 million and $16.9 million of total unrecognized compensation cost related to unvested stock options granted to employees and non-employee service providers under the 2006 Stock Plan. This unrecognized compensation cost is expected to be recognized over an estimated weighted-average amortization period of approximately three years.
The fair values of the Company’s stock options granted during the years ended January 31, 2015 and 2016 and for the six months ended July 31, 2015 and 2016 was estimated using the following assumptions:
| Year ended January 31, | Six months ended July 31, | |||||||
| 2015 | 2016 | 2015 | 2016 | |||||
| (unaudited) | ||||||||
| Expected term (years) |
6.08 | 5.70 - 6.00 | 6.0 | 6.0 | ||||
| Volatility |
48% - 52% | 48% | 48% | 48% | ||||
| Weighted average volatility |
50.85% | 48% | 48% | 48% | ||||
| Risk-free interest rate |
1.80% - 2.00% | 1.62% - 1.94% | 1.77% - 1.94% | 1.43 - 1.55% | ||||
| Dividend yield |
0% | 0% | 0% | 0% | ||||
Fair Value of Common Stock—The fair value of the shares of common stock underlying stock options has historically been established by the Company’s board of directors, which is responsible for these estimates, and has been based in part upon a valuation provided by a third-party valuation firm. Because there has been no public market for the Company’s common stock, its board of directors considered this independent valuation and other factors, including, but not limited to, revenue growth, the current status of the technical and commercial success of its operations, its financial condition, the stage of development and competition to establish the fair value of the Company’s common stock at the time of grant of the option. The fair value of the underlying common stock will be determined by the board of directors until such time as its common stock is listed on a stock exchange.
Expected Term—The expected term represents the period over which the Company anticipates stock-based awards to be outstanding. The Company does not have sufficient historical exercise data to provide a reasonable basis upon which to estimate expected term due to the limited period of time stock-based awards have been exercisable. As a result, for stock options, the Company used the simplified method to calculate the expected term estimate based on the vesting and contractual terms of the option. Under the simplified method, the expected term is equal to the average of the stock-based award’s weighted-average vesting period and its contractual term.
Volatility—Expected volatility is a measure of the amount by which the stock price is expected to fluctuate. The Company estimates the expected volatility of the common stock underlying its stock options at the grant date by considering the historical volatility of the common stock of a group of comparable publicly traded companies over a period equal to the expected life of the options.
Risk-Free Rate—The risk-free interest rate is the estimated average interest rate based on U.S. Treasury zero-coupon notes with terms consistent with the expected term of the awards.
F-29
Table of Contents
COUPA SOFTWARE INCORPORATED
NOTES TO CONSOLIDATED FINANCIAL STATEMENTS (CONTINUED)
12. Stock Option Plans (Continued)
Dividend Yield—The Company has never declared or paid any cash dividends and does not presently plan to pay cash dividends in the foreseeable future. Consequently, it used an expected dividend yield of zero.
During the year ended January 31, 2016, certain common stockholders who were employees or former employees sold an aggregate of 659,220 shares of common stock to third parties for $11.0 million, at an average price of $16.72 per share. The incremental value between the sale price and the estimated fair value of common stock at each date of sale resulted in stock-based compensation expense which aggregated to $7.5 million for the year ended January 31, 2016.
As part of an acquisition completed on March 25, 2013, the Company issued 231,416 of restricted shares of the Company’s common stock valued at $389,000. The restricted common shares had service-based vesting requirements and therefore were excluded from the purchase consideration. The related value was recognized as compensation expense over the requisite service period of two years. At January 31, 2015, 115,708 shares of the 231,416 restricted shares of common stock had vested. As of March 25, 2015, all of the 231,416 restricted shares of common stock had vested.
Modification of Stock Awards
During the year ended January 31, 2015, the Company entered into Separation Agreements with two employees which resulted in the acceleration of the vesting for stock options. As a result of the modification, the Company recorded a stock-based compensation charge of $368,000 during the year ended January 31, 2015 to reflect the revised service period for the stock options and related vesting of shares that would otherwise not have vested.
RSUs
As of January 31, 2016, no stock-based compensation expense had been recognized for the RSUs granted during the year ended January 31, 2016 because the qualifying events for the awards’ vesting are not probable. In the quarter in which the Company’s IPO is completed, the Company will record a cumulative stock-based compensation expense for the RSUs using the accelerated attribution method, net of estimated forfeitures, based on the grant-date fair value of the RSUs. The unrecognized stock-based compensation expense relating to RSU’s was $290,000 and $277,000 as of January 31, 2016 and July 31, 2016, respectively, after giving effect to estimated forfeitures. If an IPO had occurred on January 31, 2016 or July 31, 2016, the Company would have recorded a stock-based compensation charge related to the RSUs of $172,000 or $210,000, respectively.
13. Income Taxes
The following table presents the domestic and foreign components of loss before provision for income taxes for the periods presented (in thousands):
| Year ended January 31, |
||||||||
| 2015 | 2016 | |||||||
| United States |
$ | (27,541 | ) | $ | (46,850 | ) | ||
| Foreign |
342 | 1,029 | ||||||
|
|
|
|
|
|||||
| Loss before provision for income taxes |
$ | (27,199 | ) | $ | (45,821 | ) | ||
|
|
|
|
|
|||||
F-30
Table of Contents
COUPA SOFTWARE INCORPORATED
NOTES TO CONSOLIDATED FINANCIAL STATEMENTS (CONTINUED)
13. Income Taxes (Continued)
The provision for income taxes is composed of the following (in thousands):
| Year ended January 31, |
||||||||
| 2015 | 2016 | |||||||
| Current income taxes: |
||||||||
| Federal |
$ | — | $ | — | ||||
| State |
17 | 22 | ||||||
| Foreign |
80 | 308 | ||||||
|
|
|
|
|
|||||
| Total current income taxes |
97 | 330 | ||||||
| Deferred income taxes: |
||||||||
| Federal |
4 | 5 | ||||||
| State |
— | — | ||||||
| Foreign |
— | — | ||||||
|
|
|
|
|
|||||
| Total deferred income taxes |
4 | 5 | ||||||
|
|
|
|
|
|||||
| Total provision for income taxes |
$ | 101 | $ | 335 | ||||
|
|
|
|
|
|||||
The effective tax rate of the provision for income taxes differs from the federal statutory rate as follows:
| Year ended January 31, |
||||||||
| 2015 | 2016 | |||||||
| Federal statutory income tax rate |
34.0 | % | 34.0 | % | ||||
| State tax, net of federal benefit |
2.7 | % | 2.7 | % | ||||
| Change in valuation allowance |
(35.4 | )% | (32.0 | )% | ||||
| Stock-based compensation |
(0.4 | )% | (6.3 | )% | ||||
| Other non-deductible items |
(1.3 | )% | (0.8 | )% | ||||
| Tax credits |
— | 1.7 | % | |||||
|
|
|
|
|
|||||
| Total |
(0.4 | )% | (0.7 | )% | ||||
|
|
|
|
|
|||||
The Company recorded a tax provision of $118,000 and $291,000 for the six months ended July 31, 2015 and 2016, respectively, representing effective tax rates of (0.74)% and (1.22)% for the six months ended July 31, 2015 and 2016, respectively. The difference between the U.S. federal statutory tax rate of 34% and our effective tax rate in all periods is primarily due to a full valuation allowance related to the Company’s U.S. and Canada deferred tax assets offset by foreign tax expense on the Company’s profitable foreign operations.
F-31
Table of Contents
COUPA SOFTWARE INCORPORATED
NOTES TO CONSOLIDATED FINANCIAL STATEMENTS (CONTINUED)
13. Income Taxes (Continued)
Deferred income taxes reflect the net tax effects of temporary differences between the carrying amounts of assets and liabilities for financial reporting purposes and the amounts used for income tax purposes. The following table presents the significant components of the Company’s deferred tax assets and liabilities for the periods presented (in thousands):
| January 31, | ||||||||
| 2015 | 2016 | |||||||
| Deferred tax assets: |
||||||||
| Net operating loss carryforwards |
$ | 25,993 | $ | 38,049 | ||||
| Accruals and reserves |
765 | 2,196 | ||||||
| Stock-based compensation |
696 | 1,256 | ||||||
| Tax credits |
65 | 1,074 | ||||||
|
|
|
|
|
|||||
| Gross deferred tax assets |
27,519 | 42,575 | ||||||
|
|
|
|
|
|||||
| Valuation allowance |
(26,928 | ) | (41,484 | ) | ||||
|
|
|
|
|
|||||
| Total deferred tax assets, net of valuation allowance |
591 | 1,091 | ||||||
| Deferred tax liabilities: |
||||||||
| Fixed assets and intangibles assets |
(599 | ) | (1,104 | ) | ||||
|
|
|
|
|
|||||
| Gross deferred tax liabilities |
(599 | ) | (1,104 | ) | ||||
|
|
|
|
|
|||||
| Net deferred tax assets (liabilities) |
$ | (8 | ) | (13 | ) | |||
|
|
|
|
|
|||||
A valuation allowance is provided for deferred tax assets where the recoverability of the assets is uncertain. The determination to provide a valuation allowance is dependent upon the assessment of whether it is more likely than not that sufficient future taxable income will be generated to utilize the deferred tax assets. Based on the weight of the available evidence, which includes the Company’s historical operating losses, lack of taxable income, and the accumulated deficit, the Company provided a full valuation allowance against the U.S. and Canada deferred tax assets resulting from the tax loss and credits carried forward. The valuation allowance increased by $14.6 million during the year ended January 31, 2016.
The Company has not provided for withholding taxes on the undistributed earnings of its foreign subsidiaries because the Company intends to reinvest such earnings indefinitely.
The Company had net operating loss carryforwards as follows (in thousands):
| January 31, | ||||||||
| 2015 | 2016 | |||||||
| Federal |
$ | 69,324 | $ | 113,397 | ||||
| California |
30,960 | 40,294 | ||||||
| Other states |
14,174 | 23,922 | ||||||
The federal and state net operating losses include $12.0 million and $6.5 million of excess stock-based compensation that will result in increases to additional paid-in capital, when realized.
Net operating loss carryforwards are available to offset future federal and state taxable income. Federal and state net operating loss carryforwards begin to expire in 2026 and 2017, respectively.
F-32
Table of Contents
COUPA SOFTWARE INCORPORATED
NOTES TO CONSOLIDATED FINANCIAL STATEMENTS (CONTINUED)
13. Income Taxes (Continued)
Federal and state laws impose restrictions on the utilization of net operating loss carryforwards and R&D credit carryforwards in the event of a change in ownership of the Company, which constitutes an ‘ownership change’ as defined by Internal Revenue Code Section 382 and 383. The Company experienced an ownership change in the past that does not materially impact the availability of its net operating losses and tax credits. The amounts indicated in the above tables reflect reduction of approximately $3.5 million of net operating losses as a result of previous ownership changes that the Company experienced. Nevertheless, should there be ownership change in the future, the Company’s ability to utilize existing carryforwards could be substantially restricted.
Uncertain Tax Positions
The Company accounts for uncertainty in income taxes in accordance with ASC 740. Tax positions are evaluated in a two-step process, whereby the Company first determines whether it is more likely than not that a tax position will be sustained upon examination by the tax authority, including resolutions of any related appeals or litigation processes, based on technical merit. If a tax position meets the more-likely-than-not recognition threshold it is then measured to determine the amount of benefit to recognized in the financial statements. The tax position is measured as the largest amount of benefit that is greater than 50% likely of being realized upon ultimate settlement.
The following table summarizes the activity related to unrecognized tax benefits (in thousands):
| Year ended January 31, |
||||||||
| 2015 | 2016 | |||||||
| Unrecognized benefit—beginning of year |
$ | — | $ | 2,846 | ||||
| Gross increases (decreases)—prior year tax positions |
1,351 | 6 | ||||||
| Gross increases (decreases)—current year tax positions |
1,495 | 452 | ||||||
|
|
|
|
|
|||||
| Unrecognized benefit—end of year |
$ | 2,846 | $ | 3,304 | ||||
|
|
|
|
|
|||||
All of the unrecognized tax benefits as of January 31, 2016 are accounted for as a reduction in the Company’s deferred tax assets. Due to the Company’s valuation allowance, none of the $3.3 million of unrecognized tax benefits would affect the Company’s effective tax rate, if recognized. The Company does not believe it is reasonably possible that its unrecognized tax benefits will significantly change in the next twelve months.
The Company recognizes interest and penalties related to unrecognized tax benefits as income tax expense. There was no interest or penalties accrued related to unrecognized tax benefits for 2015 and 2016 and no liability for accrued interest and penalties related to unrecognized tax benefit as of January 31, 2016.
The Company does not expect any significant change in its unrecognized tax benefits during the next twelve months.
The Company’s material income tax jurisdictions are the United States (federal) and California. As a result of net operating loss carryforwards, the Company is subject to audit for tax years 2007 and forward for federal purposes and 2010 and forward for California purposes. There are tax years which remain subject to examination in various other jurisdictions that are not material to the Company’s financial statements.
F-33
Table of Contents
COUPA SOFTWARE INCORPORATED
NOTES TO CONSOLIDATED FINANCIAL STATEMENTS (CONTINUED)
14. Net Loss per Share Attributable to Common Stockholders and Unaudited Pro Forma Net Loss per Share
Basic net loss per share attributable to common stockholders is calculated by dividing the net loss attributable to common stockholders by the weighted-average number of shares of common stock outstanding during the period, without consideration for potentially dilutive securities as they do not share in losses. During periods when the Company is in a net loss position, basic net loss per share attributable to common stockholders is the same as diluted net loss per share attributable to common stockholders as the effects of potentially dilutive securities are antidilutive given the net loss of the Company.
The following table sets forth the computation of the basic and diluted net loss per share attributable to common stockholders during the years ended January 31, 2015 and 2016 and for the six months ended July 31, 2015 and 2016 (in thousands, except share and per share amounts):
| Year ended January 31, | Six months ended July 31, | |||||||||||||||
| 2015 | 2016 | 2015 | 2016 | |||||||||||||
| (unaudited) | ||||||||||||||||
| Numerator: |
||||||||||||||||
| Net loss attributable to common stockholders |
$ | (27,300 | ) | $ | (46,156 | ) | $ | (25,147 | ) | $ | (24,305 | ) | ||||
|
|
|
|
|
|
|
|
|
|||||||||
| Denominator: |
||||||||||||||||
| Weighted-average common shares outstanding |
2,998,714 | 4,704,452 | 4,351,383 | 5,720,559 | ||||||||||||
|
|
|
|
|
|
|
|
|
|||||||||
| Net loss per share attributable to common stockholders, basic and diluted |
$ | (9.10 | ) | $ | (9.81 | ) | $ | (5.78 | ) | $ | (4.25 | ) | ||||
|
|
|
|
|
|
|
|
|
|||||||||
Since the Company was in a loss position for all periods presented, basic net loss per share attributable to common stockholders is the same as diluted net loss per share for all periods as the inclusion of all potential common shares outstanding would have been anti-dilutive. Potentially dilutive securities that were not included in the diluted per share calculations because they would be anti-dilutive were as follows:
| Year ended January 31, | Six months ended July 31, | |||||||||||||||
| 2015 | 2016 | 2015 | 2016 | |||||||||||||
| (unaudited) | ||||||||||||||||
| Convertible preferred stock as converted |
29,666,693 | 34,610,979 | 34,610,979 | 34,610,979 | ||||||||||||
| Options to purchase common stock |
7,591,950 | 9,543,966 | 9,217,379 | 12,395,877 | ||||||||||||
| RSUs |
— | 62,500 | 62,500 | 56,250 | ||||||||||||
| Unvested common shares subject to repurchase |
335,502 | 283,524 | 164,666 | 188,628 | ||||||||||||
| Convertible preferred stock warrants |
197,494 | 36,971 | 36,971 | 36,971 | ||||||||||||
|
|
|
|
|
|
|
|
|
|||||||||
| Total |
37,791,639 | 44,537,940 | 44,092,495 | 47,288,705 | ||||||||||||
|
|
|
|
|
|
|
|
|
|||||||||
Unaudited Pro Forma Net Loss Per Share
The unaudited pro forma basic and diluted net income per share attributable to common stockholders, which has been computed to give effect to the assumed automatic conversion of the convertible preferred stock into shares of common stock using the if converted method upon the completion of a qualifying IPO as though the conversion had occurred as of the beginning of the period, or original date of issuance if later.
F-34
Table of Contents
COUPA SOFTWARE INCORPORATED
NOTES TO CONSOLIDATED FINANCIAL STATEMENTS (CONTINUED)
14. Net Loss per Share Attributable to Common Stockholders and Unaudited Pro Forma Net Loss per Share (Continued)
The following table sets forth the computation of the Company’s unaudited pro forma basic and diluted net loss per share attributable to common stockholders for the periods indicated (in thousands, except share and per share amounts):
| Year ended January 31, 2016 |
Six months July 31, 2016 |
|||||||
| (unaudited) | ||||||||
| Numerator: |
||||||||
| Pro forma net loss attributable to common stockholders, basic and diluted |
$ | (46,156 | ) | $ | (24,305 | ) | ||
|
|
|
|
|
|||||
| Denominator: |
||||||||
| Weighted-average shares used in computing net loss per share attributable to common stockholders, basic and diluted |
4,704,452 | 5,720,559 | ||||||
| Pro forma adjustment to reflect assumed conversion of convertible preferred stock into common stock |
33,090,925 | 34,610,979 | ||||||
|
|
|
|
|
|||||
| Weighted-average number of shares used in computing pro forma net loss per share, attributable to common stockholders, basic and diluted |
37,795,377 | 40,331,538 | ||||||
|
|
|
|
|
|||||
| Pro forma net loss per share, basic and diluted |
$ | (1.22 | ) | $ | (0.60 | ) | ||
|
|
|
|
|
|||||
15. Employee Benefit Plan
On January 1, 2015, the Company adopted a qualified defined contribution plan under Section 401(k) of the Internal Revenue Code. Under the 401(k) Plan, participating employees may elect to contribute up to 90% of their eligible compensation, subject to certain limitations. The Company matches certain percentages of employee contributions. Both employee and employer contributions vest immediately upon contribution. During the years ended January 31, 2015 and 2016, the Company’s contributions to the 401(k) Plan amounted to approximately $85,000 and $1.5 million, respectively and for the six months ended July 31, 2015 and 2016, amounted to approximately $684,000 and $819,000, respectively.
16. Related Party Transactions
One of the Company’s customers is an affiliate of certain of the Company’s stockholders that are affiliated with T. Rowe Price. For the year ended January 31, 2016, the Company recognized subscription revenue of $284,000 from this customer, and as of January 31, 2016, the Company had an outstanding receivable for $3,000 from this customer. For the year ended January 31, 2015, the Company did not recognize any revenue from this customer, and as of January 31, 2015, the Company did not have any outstanding receivables from this customer. During the six months ended July 31, 2016, we recognized subscription revenue of $247,000 and, as July 31, 2016, we did not have any outstanding receivables from this customer.
17. Subsequent Events
For its consolidated financial statement as of January 31, 2016 and 2015, and for each of the two years in the period ended January 31, 2016, the Company has evaluated all events occurring through March 25, 2016, the date the consolidated financial statements were available for issuance.
F-35
Table of Contents
COUPA SOFTWARE INCORPORATED
NOTES TO CONSOLIDATED FINANCIAL STATEMENTS (CONTINUED)
17. Subsequent Events (Continued)
Between February 1, 2016 and March 25, 2016, the Company granted in total 3,232,262 options with a weighted-average exercise price of $7.88 per share to employees and outside directors of the Company. These stock option grants resulted in unrecognized stock-based compensation of $9.7 million, net of estimated forfeitures, which is expected to be recognized over an estimated weighted average amortization period of four years from the grant date. In February 2016, the Company increased the number of common shares reserved for issuance under the amended 2006 Stock Plan by 2,672,500 shares.
18. Subsequent Events (unaudited)
The Company has evaluated subsequent events through September 2, 2016, the date the unaudited interim consolidated financial statements were available for issuance, except for the last paragraph of this note as to which the date is September 22, 2016.
Between August 1, 2016 and September 2, 2016, the Company granted in total 261,000 options with an exercise price of $10.60 per share to employees of the Company. These stock option grants resulted in unrecognized stock-based compensation of $1.0 million, net of estimated forfeitures, which is expected to be recognized over an estimated weighted average amortization period of four years from the grant date.
On September 8, 2016, the Company granted in total 1,418,885 options with an exercise price of $13.04 per share to employees and non-employees of the Company, some of which vest in part based on certain market conditions. In addition, the Company increased the number of common shares reserved for issuance under the 2006 Plan by 412,500 shares. These stock option grants resulted in unrecognized stock-based compensation of $7.0 million, net of estimated forfeitures, which is expected to be recognized over an estimated weighted average amortization period of four years from the grant date.
F-36
Table of Contents

VALUE AS A SERVICE
coupa
Table of Contents
Table of Contents
PART II
INFORMATION NOT REQUIRED IN PROSPECTUS
Item 13. Other Expenses of Issuance and Distribution
The following table sets forth the various expenses expected to be incurred and payable by us in connection with the sale and distribution of our common stock, other than underwriting discounts and commissions. All amounts are estimates except for the Securities and Exchange Commission (SEC) registration fee, the Financial Industry Regulatory Authority (FINRA) filing fee and the Nasdaq Global Select Market listing fee.
| Payable by us |
||||
| SEC registration fee |
$ | 15,880 | ||
| FINRA filing fee |
23,477 | |||
| Nasdaq Global Select Market listing fee |
150,000 | |||
| Blue sky fees and expenses |
50,000 | |||
| Accounting fees and expenses |
2,555,000 | |||
| Legal fees and expenses |
1,550,000 | |||
| Printing and engraving expenses |
257,000 | |||
| Registrar and transfer agent fees and expenses |
5,000 | |||
| Miscellaneous fees and expenses |
293,643 | |||
|
|
|
|||
| Total |
$ | 4,900,000 | ||
|
|
|
|||
Item 14. Indemnification of Directors and Officers
Section 145 of the Delaware General Corporation Law authorizes a court to award, or a corporation’s board of directors to grant, indemnity to directors and officers under certain circumstances and subject to certain limitations. The terms of Section 145 of the Delaware General Corporation Law are sufficiently broad to permit indemnification under certain circumstances for liabilities, including reimbursement of expenses incurred, arising under the Securities Act.
As permitted by the Delaware General Corporation Law, our amended and restated certificate of incorporation and amended and restated bylaws contain provisions relating to the limitation of liability and indemnification of directors and officers. The amended and restated certificate of incorporation provides that our directors will not be personally liable to us or our stockholders for monetary damages for any breach of fiduciary duty as a director, except for liability:
| • | for any breach of the director’s duty of loyalty to us or our stockholders; |
| • | for acts or omissions not in good faith or that involve intentional misconduct or a knowing violation of law; |
| • | in respect of unlawful payments of dividends or unlawful stock repurchases or redemptions as provided in Section 174 of the Delaware General Corporation Law; or |
| • | for any transaction from which the director derives any improper personal benefit. |
Our amended and restated certificate of incorporation also provides that if Delaware law is amended after the approval by our stockholders of the certificate of incorporation to authorize corporate action further eliminating or limiting the personal liability of directors, then the liability of our directors will be eliminated or limited to the fullest extent permitted by Delaware law.
II-1
Table of Contents
Our amended and restated bylaws provide that we will indemnify our directors and officers to the fullest extent permitted by Delaware law, as it now exists or may in the future be amended, against all expenses and liabilities reasonably incurred in connection with their service for or on our behalf. Our amended and restated bylaws provide that we shall advance the expenses incurred by a director or officer in advance of the final disposition of an action or proceeding, and permit us to secure insurance on behalf of any director, officer, employee, or other enterprise agent for any liability arising out of his or her action in that capacity, whether or not Delaware law would otherwise permit indemnification.
We intend to enter into indemnification agreements with each of our directors and executive officers and certain other key employees, a form of which is attached as Exhibit 10.1. The form of agreement provides that we will indemnify each of our directors, executive officers and such other key employees against any and all expenses incurred by that director, executive officer, or other key employee because of his or her status as one of our directors, executive officers or other key employees, to the fullest extent permitted by Delaware law, our amended and restated certificate of incorporation and our amended and restated bylaws. In addition, the form agreement provides that, to the fullest extent permitted by Delaware law, we will advance all expenses incurred by our directors, executive officers and other key employees in connection with a legal proceeding.
Reference is made to the underwriting agreement contained in Exhibit 1.1 to this registration statement, indemnifying our directors and officers against limited liabilities. In addition, Section 1.9 of our amended and restated investors’ rights agreement, or IRA, contained in Exhibit 4.2 to this registration statement provides for indemnification of certain of our stockholders against liabilities described in our IRA.
We maintain insurance policies that indemnify our directors and officers against various liabilities under the Securities Act of 1933, as amended, and the Securities Exchange Act of 1934, as amended, that might be incurred by any director or officer in his or her capacity as such.
Item 15. Recent Sales of Unregistered Securities
The following sets forth information regarding all unregistered securities sold from August 1, 2013 to September 30, 2016, giving effect to a 1-for-4 reverse stock split of our capital stock that was effected on September 21, 2016:
| • | We have granted options to purchase 13,663,862 shares of our common stock to directors, officers, employees and consultants under our 2006 Stock Plan, with per share exercise prices ranging from $1.96 to $13.04. |
| • | We have issued and sold an aggregate of 3,529,738 shares of our common stock upon exercise of options issued under our 2006 Stock Plan for aggregate consideration of approximately $6,115,075, with per share exercise prices ranging from $0.16 to $13.04. |
| • | From February 24, 2014 to February 25, 2014, we issued and sold an aggregate of 4,944,371 shares of our Series F preferred stock to 15 accredited investors at $8.09 per share for an aggregate consideration of approximately $40,000,000. |
| • | On May 26, 2015, we issued and sold an aggregate of 4,783,762 shares of our Series G preferred stock to 23 accredited investors at $16.7232 per share for an aggregate consideration of approximately $80,000,000. |
| • | On April 1, 2015, we issued and sold 160,523 shares of our Series E preferred stock to 1 accredited investor, pursuant to a warrant exercise with a per share exercise price of $3.11. |
| • | From March 4, 2015 to June 11, 2015, we granted 65,000 shares of restricted stock units of our common stock to employees under our 2006 Stock Plan for aggregate consideration of approximately $335,000. |
II-2
Table of Contents
| • | From June 15, 2015 to December 2, 2015, we issued an aggregate of 314,386 shares of our common stock in connection with our acquisitions of certain companies or their assets and as consideration to individuals and entities who were former service providers and/or stockholders of such companies. |
None of the foregoing transactions involved any underwriters, underwriting discounts or commissions, or any public offering. We believe that the offers, sales and issuances of the above securities were exempt from registration under the Securities Act by virtue of Section 4(a)(2) of the Securities Act or Regulation D promulgated thereunder as transactions by an issuer not involving any public offering, or in reliance on Rule 701 promulgated under Section 3(b) of the Securities Act because the transactions were pursuant to compensatory benefit plans or contracts relating to compensation as provided under Rule 701. The recipients of the securities in each of these transactions represented their intentions to acquire the securities for investment only and not with a view to or for sale in connection with any distribution thereof, and appropriate legends were placed upon the stock certificates issued in these transactions. We believe all recipients had adequate information about us or had adequate access, through their relationships with us, to information about us.
Item 16. Exhibits and Financial Statement Schedules
| • | Exhibits. We have filed the exhibits listed on the accompanying Exhibit Index, which is incorporated herein by reference. |
| • | Financial Statement Schedules. All schedules have been omitted because the information required to be presented in them is not applicable or is shown in the financial statements or related notes, which is incorporated herein by reference. |
Item 17. Undertakings
The undersigned registrant hereby undertakes to provide to the underwriters at the closing specified in the underwriting agreements certificates in such denominations and registered in such names as required by the underwriters to permit prompt delivery to each purchaser.
Insofar as indemnification for liabilities arising under the Securities Act may be permitted to directors, officers and controlling persons of the registrant pursuant to the foregoing provisions, or otherwise, the registrant has been advised that in the opinion of the Securities and Exchange Commission such indemnification is against public policy as expressed in the Securities Act and is, therefore, unenforceable. In the event that a claim for indemnification against such liabilities (other than the payment by the registrant of expenses incurred or paid by a director, officer or controlling person of the registrant in the successful defense of any action, suit or proceeding) is asserted by such director, officer or controlling person in connection with the securities being registered, the registrant will, unless in the opinion of its counsel the matter has been settled by controlling precedent, submit to a court of appropriate jurisdiction the question whether such indemnification by it is against public policy as expressed in the Securities Act and will be governed by the final adjudication of such issue.
The undersigned registrant hereby undertakes that:
(1) For purposes of determining any liability under the Securities Act, the information omitted from the form of prospectus filed as part of this registration statement in reliance upon Rule 430A and contained in a form of prospectus filed by the registrant pursuant to Rule 424(b) (1) or (4) or 497(h) under the Securities Act shall be deemed to be part of this registration statement as of the time it was declared effective.
(2) For the purpose of determining any liability under the Securities Act, each post-effective amendment that contains a form of prospectus shall be deemed to be a new registration statement relating to the securities offered therein, and the offering of such securities at that time shall be deemed to be the initial bona fide offering thereof.
II-3
Table of Contents
SIGNATURES
Pursuant to the requirements of the Securities Act of 1933, as amended, the registrant has duly caused this registration statement to be signed on its behalf by the undersigned, thereunto duly authorized, in the City of San Mateo, State of California, on the 4th day of October, 2016.
| COUPA SOFTWARE INCORPORATED | ||
| By: | /s/ Robert Bernshteyn | |
| Robert Bernshteyn Chief Executive Officer | ||
POWER OF ATTORNEY
Pursuant to the requirements of the Securities Act of 1933, as amended, this registration statement has been signed by the following persons on behalf of the registrant and in the capacities and on the dates indicated.
| Name |
Title |
Date | ||
| /s/ Robert Bernshteyn Robert Bernshteyn |
Chief Executive Officer and Director (Principal Executive Officer) |
October 4, 2016 | ||
| /s/ Todd Ford Todd Ford |
Chief Financial Officer (Principal Financial and Accounting Officer) | October 4, 2016 | ||
| * Neeraj Agrawal |
Director | October 4, 2016 | ||
| * Charles Beeler |
Director | October 4, 2016 | ||
| * Leslie Campbell |
Director | October 4, 2016 | ||
| * Roger Siboni |
Director | October 4, 2016 | ||
| * Tayloe Stansbury |
Director | October 4, 2016 | ||
| * Scott Thompson |
Director | October 4, 2016 | ||
| * Frank van Veenendaal |
Director | October 4, 2016 | ||
| *By: | /s/ Robert Bernshteyn | |
| Attorney-in-Fact | ||
II-4
Table of Contents
EXHIBIT INDEX
| Exhibit No. |
Description | |
| 1.1† | Form of Underwriting Agreement. | |
| 3.1† | Restated Certificate of Incorporation of Registrant, as amended, as currently in effect. | |
| 3.2† | Form of Amended and Restated Certificate of Incorporation of Registrant, to be effective upon completion of this offering. | |
| 3.3† | Amended and Restated Bylaws of Registrant, as currently in effect. | |
| 3.4† | Form of Amended and Restated Bylaws of Registrant, to be effective upon completion of this offering. | |
| 4.1† | Amended and Restated Investors’ Rights Agreement, dated May 26, 2015, by and among the Registrant and the parties thereto. | |
| 4.2† | Form of Series D Preferred Warrant to Purchase Stock. | |
| 5.1 | Opinion of Gunderson Dettmer Stough Villeneuve Franklin & Hachigian, LLP. | |
| 10.1† | Form of Indemnification Agreement between the Registrant and each of its directors and executive officers. | |
| 10.2† | 2006 Stock Plan, as amended, and forms of agreements thereunder. | |
| 10.3† | Registrant’s 2016 Equity Incentive Plan and forms of agreements thereunder, to be effective upon completion of this offering. | |
| 10.4 | Registrant’s 2016 Employee Stock Purchase Plan and form of Participation Agreement thereunder to be effective upon the completion of this offering. | |
| 10.5† | Incentive Bonus Plan. | |
| 10.6† | Offer Letter, dated May 19, 2016, and Severance and Change in Control Agreement, between the Registrant and Robert Bernshteyn. | |
| 10.7† | Offer Letter, dated May 19, 2016, and Severance and Change in Control Agreement, between the Registrant and Tom Aitchison. | |
| 10.8† | Offer Letter, dated May 19, 2016, and Severance and Change in Control Agreement, between the Registrant and Todd Ford. | |
| 10.9† | Offer Letter, dated May 19, 2016, and Severance and Change in Control Agreement, between the Registrant and Ravi Thakur. | |
| 10.10† | Offer Letter, dated August 25, 2016, between the Registrant and Steven Winter. | |
| 10.11† | Lease Agreement, dated March 20, 2014, among the Registrant and Crossroads Associates and Clocktower Associates, as amended. | |
| 10.12† | Compensation Program for Non-Employee Directors. | |
| 16.1† | Letter from BDO USA, LLP. | |
| 21.1† | List of Subsidiaries of Registrant. | |
| 23.1 | Consent of Independent Registered Public Accounting Firm. | |
| 23.2 | Consent of Gunderson Dettmer Stough Villeneuve Franklin & Hachigian, LLP (contained in Exhibit 5.1). | |
| 24.1† | Power of Attorney. | |
| † | Previously filed. |