Attached files
| file | filename |
|---|---|
| EX-32.2 - EXHIBIT 32.2 - NextSource Materials Inc. | exh32_2.htm |
| EX-32.1 - EXHIBIT 32.1 - NextSource Materials Inc. | exh32_1.htm |
| EX-31.2 - EXHIBIT 31.2 - NextSource Materials Inc. | exh31_2.htm |
| EX-31.1 - EXHIBIT 31.1 - NextSource Materials Inc. | exh31_1.htm |
SECURITIES AND EXCHANGE COMMISSION
Washington, D.C. 20549
FORM 10-K
[X] ANNUAL REPORT PURSUANT TO SECTION 13 OR 15(d) OF THE
SECURITIES EXCHANGE ACT OF 1934
For the Fiscal Year Ended June 30, 2016
[ ] TRANSITION REPORT UNDER SECTION 13 OR 15 (d) OF THE
SECURITIES EXCHANGE ACT OF 1934
SECURITIES EXCHANGE ACT OF 1934
Commission File Number: 000-51151
ENERGIZER RESOURCES INC.
(Name of small business issuer as specified in its charter)
|
Minnesota
|
20-0803515
|
|
|
(State or other jurisdiction of incorporation or organization)
|
(I.R.S. Employer Identification No.)
|
520 – 141 Adelaide Street West, Toronto, Ontario, Canada M5H 3L5
(Address of principal executive offices)
(Address of principal executive offices)
(416) 364-4911
(Issuer’s telephone number)
(Issuer’s telephone number)
_______________________
(Former name or former address, if changed since last report)
Securities Registered under Section 12(b) of the Exchange Act:
None
Securities Registered Under Section 12(g) of the Exchange Act:
Common Stock, $0.001
Indicate by check mark if the registrant is a well-known seasoned issuer, as defined in Rule 405 of the Securities Act. Yes [ ] No [ X ]
Indicate by check mark if the registrant is not required to file reports pursuant to Section 13 or 15(d) of the Exchange Act. Yes [ ] No [ X ]
Indicate by check mark whether the registrant (1) has filed all reports required to be filed by Section 13 or 15(d) of the Exchange Act during the past 12 months (or for such shorter period that the registrant was required to file such reports), and (2) has been subject to such filing requirements for the past 90 days. Yes [ X ] No [ ]
Indicate by check mark whether the registrant has submitted electronically and posted on its corporate Web site, if any, every Interactive Data File required to be submitted and posted pursuant to Rule 405 of Regulation S-T (§232.405 of this chapter) during the preceding 12 months (or for such shorter period that the registrant was required to submit and post such files). Yes [ ] No [ X ]
Indicate by check mark if disclosure of delinquent filers pursuant to Item 405 of Regulation S-K (§ 229.405 of this chapter) is not contained herein, and will not be contained, to the best of registrant’s knowledge, in definitive proxy or information statements incorporated by reference in Part III of this Form 10K or any amendment to this Form 10-K or any amendment to this Form 10-K. [ X ]
1
Indicate by check mark whether the registrant is a large accelerated filer, an accelerated filer, a non-accelerated filer or a smaller reporting company. See definition of “accelerated filer and large accelerated filer” in Rule 12b-2 of the Exchange Act. (Check one):
|
Large accelerated filer o
Non-accelerated filer o
|
Accelerated filer o
Smaller reporting company x
|
Indicate by checkmark whether the registrant is a shell company (as defined in Rule 12b-2 of the Exchange Act).
Yes [ ] No [ X ]
The aggregate market value of the voting and non-voting common equity held by non-affiliates computed by reference to the price at which the common equity was last sold, or the average bid and asked price of such common equity, as of the last business day of the registrant's most recently completed fiscal year was $16,230,310. For purposes of the above statement only, all directors, executive officers and 10% shareholders are assumed to be affiliates. This determination of affiliate status is not necessarily a conclusive determination for other purposes.
The number of shares outstanding of the registrant’s Common Stock, par value $0.01 per share (the "Common Stock"), as of September 28, 2016, was 460,995,711.
Documents Incorporated By Reference: None

Energizer Resources Inc.
|
PART I
|
||
|
ITEM 1
|
Business
|
3
|
|
ITEM 1A.
|
Risk Factors
|
35
|
|
ITEM 1B
|
Unresolved Staff Comments
|
44
|
|
ITEM 2.
|
Properties
|
45
|
|
ITEM 3.
|
Legal Proceedings
|
46
|
|
ITEM 4
|
Mine Safety Disclosures
|
47
|
|
PART II
|
||
|
ITEM 5.
|
Market for Registrant’s Common Equity, Related Stockholder Matters and Issuer
|
|
|
Purchases of Equity Securities
|
48
|
|
|
ITEM 6.
|
Selected Financial Data
|
50
|
|
ITEM 7.
|
Management’s Discussion and Analysis of Financial Condition and of Results Operations
|
51
|
|
ITEM 7.A
|
Quantitative and Qualitative Disclosures about Market Risk
|
57
|
|
ITEM 8
|
Financial Statements
|
58
|
|
ITEM 9.
|
Changes in and Disagreements with Accountants on Accounting and Financial Disclosure
|
59
|
|
ITEM 9A.
|
Controls and Procedures
|
59
|
|
ITEM 9B.
|
Other Information
|
60
|
|
PART III
|
||
|
ITEM 10.
|
Directors, Executive Officers, and Corporate Governance
|
61
|
|
ITEM 11.
|
Executive Compensation
|
65
|
|
ITEM 12.
|
Security Ownership of Certain Beneficial Owners and Management and Related
|
|
|
Stockholder Matters
|
71
|
|
|
ITEM 13.
|
Certain Relationships and Related Transactions, and Director Independence
|
72
|
|
ITEM 14.
|
Principal Accounting Fees and Services
|
73
|
|
PART IV
|
||
|
ITEM 15.
|
Exhibits, Financial Statement Schedules
|
74
|
|
SIGNATURES
|
||
|
Report Signatures
|
|
76
|
|
APPENDIX
|
||
|
Financial Statements
|
|
77
|
| CERTIFICATIONS | ||
|
Exhibit 31
|
Management certifications
|
104
|
|
Exhibit 32
|
Sarbanes-Oxley Act
|
106
|
1
FORWARD-LOOKING STATEMENTS
This Annual Report contains certain forward-looking statements within the meaning of the Private Securities Litigation Reform Act of 1995 ("PSLRA") regarding management’s plans and objectives for future operations including plans and objectives relating to our planned marketing efforts and future economic performance. The forward-looking statements and associated risks set forth in this Annual Report include or relate to, among other things, (a) our growth strategies, (b) anticipated trends in the mining industry, (c) currency fluctuations, (d) our ability to obtain and retain sufficient capital for future operations, and (e) our anticipated needs for working capital. These statements may be found under “Management’s Discussion and Analysis of Financial Condition and Results of Operations” and “Description of Business,”. Actual events or results may differ materially from those discussed in forward-looking statements as a result of various factors, including, without limitation, the risks outlined under “Risk Factors”. In light of these risks and uncertainties, there can be no assurance that the forward-looking statements contained in this report will in fact occur.
The forward-looking statements herein are based on current expectations that involve a number of risks and uncertainties. Such forward-looking statements are based on assumptions described herein. The assumptions are based on judgments with respect to, among other things, future economic, competitive and market conditions, and future business decisions, all of which are difficult or impossible to predict accurately and many of which are beyond our control. Accordingly, although we believe that the assumptions underlying the forward-looking statements are reasonable, any such assumption could prove to be inaccurate and therefore there can be no assurance that the results contemplated in forward-looking statements will be realized. In addition, as disclosed in “Risk Factors”, there are a number of other risks inherent in our business and operations, which could cause our operating results to vary markedly, and adversely from prior results or the results contemplated by the forward-looking statements. Management decisions, including budgeting, are subjective in many respects and periodic revisions must be made to reflect actual conditions and business developments, the impact of which may cause us to alter marketing, capital investment and other expenditures, which may also materially adversely affect our results of operations. In light of significant uncertainties inherent in the forward-looking information included in the report statement, the inclusion of such information should not be regarded as a representation by us or any other person that our objectives or plans will be achieved.
Any statement in this report that is not a statement of an historical fact constitutes a “forward-looking statement”. Further, when we use the words “may”, “expect”, “anticipate”, “plan”, “believe”, “seek”, “estimate”, “internal”, and similar words, we intend to identify statements and expressions that may be forward- looking statements. We believe it is important to communicate certain of our expectations to our investors. Forward-looking statements are not guarantees of future performance. They involve risks, uncertainties and assumptions that could cause our future results to differ materially from those expressed in any forward-looking statements. Many factors are beyond our ability to control or predict. You are accordingly cautioned not to place undue reliance on such forward-looking statements. Important factors that may cause our actual results to differ from such forward-looking statements include, but are not limited to, the risks outlined under “Risk Factors” herein. The reader is cautioned that our Company does not have a policy of updating or revising forward-looking statements and thus the reader should not assume that silence by management of our Company over time means that actual events are bearing out as estimated in such forward-looking statements.
All references to “dollars”, “$” or “US$” are to United States dollars and all references to “CAD$” are to Canadian dollars. United States dollar equivalents of Canadian dollar figures are based on the noon exchange rate as reported by the Bank of Canada on the applicable date. All references to “common shares” refer to the common shares in our capital stock.
2
PART I
FINANCIAL INFORMATION
As used in these footnotes, “we”, “us”, “our”, “Energizer Resources”, “Energizer”, “Company” or “our company” refers to Energizer Resources Inc. and all of its subsidiaries.
All references to “dollars”, “$” or “US$” are to United States dollars and all references to “CAD$” are to Canadian dollars. United States dollar equivalents of Canadian dollar figures are based on the exchange rate as reported by the Bank of Canada on the applicable date.
ITEM 1. – BUSINESS
Cautionary Note
Based on the nature of our business, we anticipate incurring operating losses for the foreseeable future. We base this expectation, in part, on the fact that very few mineral properties in the exploration stage are ultimately developed into producing and profitable mines. Our future financial results are uncertain due to a number of factors, some of which are outside the Company’s control. These factors include, but are not limited to: (1) our ability to raise additional funding; (2) the market price for graphite and vanadium; (3) the results of the exploration programs and metallurgical analysis of our mineral properties; (4) the political instability and/or environmental regulations that may adversely impact costs and ability to operate in Madagascar; and (5) our ability to find joint venture and/or off-take partners in order to advance the development of our mineral properties.
Any future equity financing will cause existing shareholders to experience dilution of their ownership interest in the Company. In the event the Company is not successful in raising additional financing, we anticipate the Company will not be able to proceed with its existing business plan. In such a case, the Company may decide to discontinue or modify its business plan and seek other business opportunities in the resource sector.
During this period, the Company will need to maintain periodic filings with the appropriate regulatory authorities and will incur legal, accounting, administrative and exchange listing costs. In the event no other such opportunities are available and the Company cannot raise additional funding to sustain operations, the Company may be forced to discontinue the business. The Company does not have any specific alternative business opportunities under consideration and has not planned for any such contingency.
Due to accumulated losses and present inability to generate revenues, the Company auditors have stated in their opinion in the footnotes to our audited financial statements in this annual report on Form 10-K and the Company has included in Note 1 of this financial statements that there currently exists doubt as to the Company’s ability to continue as a going concern.
BACKGROUND – COMPANY OVERVIEW
We are incorporated in the State of Minnesota, USA and have a fiscal year end of June 30. We were originally incorporated in the State of Nevada on March 1, 2004 and reincorporated in the State of Minnesota on May 14, 2008. Our principal business is the acquisition, exploration and development of mineral resources. We have not generated operating revenues or paid dividends since inception on March 1, 2004 to the period ended June 30, 2016 and we are unlikely to do so in the immediate or foreseeable future. Our business activities have been entirely financed from the proceeds of securities subscriptions.
During fiscal 2008, we incorporated Energizer Resources (Mauritius) Ltd. (“ERMAU”), a Mauritius subsidiary, and Energizer Resources Madagascar Sarl. (“ERMAD”), a Madagascar subsidiary of ERMAU. During fiscal 2009, the Company incorporated THB Ventures Ltd. (“THB”), a Mauritius subsidiary of ERMAU, and Energizer Resources Minerals Sarl. (“ERMIN”), a Madagascar subsidiary of THB, which holds the 100% ownership interest of the Green Giant Property in Madagascar (see note 7). During fiscal 2012, the Company incorporated Madagascar‑ERG Joint Venture (Mauritius) Ltd. (“ERGJVM”), a Mauritius subsidiary of ERMAU, and ERG (Madagascar) Sarl. (“ERGMAD”), a Madagascar subsidiary of ERGJVM, which holds the Malagasy Joint Venture Ground. During fiscal 2014, the Company incorporated 2391938 Ontario Inc., an Ontario, Canada subsidiary.
On December 16, 2014, our authorized capital was increased from an aggregate of four hundred fifty million (450,000,000) shares to six hundred fifty million (650,000,000) shares, with a par value of $0.001 per share, of which 640,000,000 will be deemed common shares and the remaining 10,000,000 will be deemed eligible to be divisible into classes, series and types with rights and preferences as designated by our Board of Directors.
3
We have not had any bankruptcy, receivership or similar proceeding since incorporation. Except as described below, there have been no material reclassifications, mergers, consolidations or purchases or sales of any significant amount of assets not in the ordinary course of business since the date of incorporation.
Summary of Our Business
We are an exploration stage company primarily engaged in the advancement of the Molo Graphite Project, consisting of a commercially minable graphite deposit situated in the African country of Madagascar. We have additional exploration stage properties situated in Madagascar and in the Province of Québec, Canada.
Our executive offices are situated at 520–141 Adelaide Street West, Toronto, Ontario, Canada, M5H 3L5 and the primary telephone number is (416) 364-7024. Our website is www.energizerresources.com (which website is expressly not incorporated by reference into this filing).
Further details regarding each of our Madagascar properties, although not incorporated by reference, including the comprehensive geological report prepared in accordance Canada’s National Instrument 43-101 - Standards of Disclosure for Mineral Properties (“NI 43-101”) for the Molo Graphite Property and separately the technical report on the Green Giant Property in Madagascar can be found on the Company’s website at www.energizerresources.com (which website is expressly not incorporated by reference into this filing) or in the Company’s Canadian regulatory filings at www.sedar.com (which website and content is expressly not incorporated by reference into this filing). We report mineral reserve estimates in accordance with the Securities and Exchange Commission’s Industry Guide 7 (“Guide 7”) under the Securities Act of 1933, as amended (the “U.S. Securities Act”). As a reporting issuer in Canada with our primary trading market in Canada, we are also required to prepare reports on our mineral properties in accordance with NI 43-101. The technical reports referenced in this document uses the terms “mineral resource,” “measured mineral resource,” “indicated mineral resource” and “inferred mineral resource”. These terms are defined in and required to be disclosed by NI 43-101; however, these terms are not defined terms under Guide 7 and are normally not permitted to be used in reports filed with the Securities and Exchange Commission. As a result, information in respect of our resources determined in accordance with NI 43-101 are not contained in this document.
Summary of Milestones
We are pursuing negotiations in respect of potential off-take agreements with graphite end-users and intermediaries with the intention of securing project financing alternatives, which may include debt, equity and derivative instruments. Discussions in respect of these matters have been ongoing for the past 24 months and are expected to continue during the coming months with no assurances as to the conclusion or results of these discussions.
In July 2016, we appointed UK-based HCF International Advisers Limited ("HCF") as advisor in negotiating and structuring strategic partnerships, off take agreements and debt financing for its Molo Graphite project.
In August 2016, we initiated a Front End Engineering Design Study (the “FEED Study”) for the Company's Molo graphite project in Madagascar. The FEED Study is being undertaken in order to determine potential development path options that have been presented to the Company by prospective strategic partners.
Our management continues to assess project optimization strategies with the intention of reducing the capital and operating costs relating to the Molo Graphite Property with no assurances as to the conclusion and results of these assessments.
Future Plans
With the completion of the Molo Feasibility Study, potential financiers and strategic partners have been approached, and the Company is seeking funding for the development of the Molo Deposit into a mine. In parallel, the Company has initiated a FEED Study, which is anticipated to continue through to the end of October, 2016.
From the date of this annual report, and subject to availability of capital, our plan is to incur between $250,000 and $13,250,000 on further engineering, exploration, testing and permitting to advance the Molo Graphite Property and on the potential creation of a pilot plant, subject to the availability of capital and any other unforeseen delays, by June 30, 2017. No assurances can be provided that we will achieve our objective by that date.
4
The following is a summary of the amounts budgeted to be incurred (presuming all $13,500,000 is required):
|
Front End Engineering Design (FEED) Study
|
$
|
250,000
|
||
|
Detailed engineering study
|
$
|
5,500,000
|
||
|
Bulk sampling program to secure off-take agreement
|
$
|
4,000,000
|
||
|
Value engineering study
|
$
|
2,500,000
|
||
|
Metallurgy
|
$
|
500,000
|
||
|
Permitting fees
|
$
|
750,000
|
||
|
Total
|
$
|
13,500,000
|
The above amounts may be revised based on actual costs and the timing may be delayed based on several factors, including the availability of capital to fund the budget. We anticipate that the source of funds required to complete the budgeted items disclosed above will come from private placements in the capital markets, but there can be no assurance that financing will be available on terms favorable to the Company or at all.
Although no assurances can be provided, the FEED Study is currently ongoing and is anticipated to continue through to the end of October 2016. This will be followed by a decision to pursue a bulk sample and/or the construction of a pilot plant.
Other Expenses
Management anticipates spending approximately $250,000 - $450,000 in ongoing general office and administration expenses and professional fees per quarter for the next twelve months. Expenses will vary in direct proportion with the level of activity relating to future acquisitions and exploration programs.
Employees
As of the date of this annual report, we have 3 full-time employees and in addition, we engage several consultants to serve important managerial and non-managerial functions.
Competitive Conditions in our Industry
The mineral exploration and mining industry is competitive in all phases of exploration, development and production. We compete with a number of other entities and individuals in the search for, and acquisition of, attractive mineral properties. As a result of this competition, the majority of which is with companies with greater financial resources than us, we may not in the future be able to acquire attractive properties on terms our management considers acceptable. Furthermore, we compete with other resource companies, many of whom have greater financial resources and/or more advanced properties that are better able to attract equity investments and other capital. Factors beyond our control may affect the marketability of minerals mined or discovered by us.
5
Mineral Properties
Cautionary Note Regarding Resource and Reserve Calculation – We report mineral reserve estimates in accordance with the Securities and Exchange Commission (the “SEC”) Industry Guide 7 (“Guide 7”) under the Securities Act of 1933, as amended (the “U.S. Securities Act”). As a reporting issuer in Canada with our primary trading market in Canada, we are also required to prepare reports on our mineral properties in accordance with NI 43-101. The technical reports referenced in this document uses the terms “mineral resource,” “measured mineral resource,” “indicated mineral resource” and “inferred mineral resource”. We advise investors that these terms are defined in and required to be disclosed by NI 43-101; however, these terms are not defined terms under Guide 7 and are normally not permitted to be used in reports filed with the SEC. As a result, information in respect of our resources determined in accordance with NI 43-101 are not contained in this document. We reference these reports in this document for informational purposes only and such reports are not incorporated herein by reference. Investors are cautioned not to assume that any part or all of mineral deposits in the above categories will ever be converted into Guide 7 compliant reserves. “Inferred mineral resources” have a great amount of uncertainty as to their existence, and great uncertainty as to their economic and legal feasibility. It cannot be assumed that all or any part of an inferred mineral resource will ever be upgraded to a higher category. Under Canadian rules, estimates of inferred mineral resources may not form the basis of feasibility or pre-feasibility studies, except in rare cases. Investors are cautioned not to assume that all or any part of an inferred mineral resource exists or is economically or legally mineable. Disclosure of “contained” minerals in a resource is permitted disclosure under Canadian regulations; however, the SEC normally only permits issuers to report mineralization that does not constitute “reserves” by SEC standards as in place tonnage and grade without reference to unit measures. Canadian investors should review the Molo Graphite Project Feasibility Study (and the other technical reports filed by the Company, with the securities regulators in Canada), including the mineral resource estimates (which are not permitted to be disclosed under Industry Guide 7) for further details regarding our material mineral properties.
As used in this document, the terms “mineral reserve”, “proven mineral reserve” and “probable mineral reserve” are Canadian mining terms as defined in accordance with NI 43-101 and the Canadian Institute of Mining, Metallurgy and Petroleum (the “CIM”)—CIM Definition Standards on Mineral Resources and Mineral Reserves, adopted by the CIM Council, as amended. These definitions differ from the definitions in Guide 7. Under Guide 7 standards, a “final” or “bankable” feasibility study is required to report reserves, the three-year historical average price is used in any reserve or cash flow analysis to designate reserves and the primary environmental analysis or report must be filed with the appropriate governmental authority. The reserves disclosed in this document also comply with the requirements of Guide 7.
Proven and probable reserves are based on extensive drilling, sampling, mine modeling and metallurgical testing from which we determined economic feasibility. The term “proven reserves” means mineral reserves for which (i) quantity is computed from dimensions revealed in outcrops, trenches, workings or drill holes; (ii) grade and/or quality are computed from the results of detailed sampling; and (iii) the sites for inspection, sampling and measurements are spaced so closely and the geologic character is sufficiently defined that size, shape, depth and mineral content of reserves are well established. The term “probable reserves” means mineral reserves for which quantity and grade are computed from information similar to that used for proven reserves, but the sites for sampling are farther apart or are otherwise less adequately spaced. The degree of assurance, although lower than that for proven reserves, is high enough to assume continuity between points of observation. The price sensitivity of reserves depends upon several factors including grade, metallurgical recovery, operating cost, waste-to-ore ratio and ore type. Metallurgical recovery rates vary depending on the metallurgical properties of each deposit and the production process used.
The proven and probable reserve figures presented herein are estimates based on information available at the time of calculation. No assurance can be given that the indicated levels of recovery of minerals will be realized. Minerals included in the proven and probable reserves are those contained prior to losses during metallurgical treatment. Reserve estimates may require revision based on actual production. Market fluctuations in the price of minerals, as well as increased production costs or reduced metallurgical recovery rates, could render certain proven and probable reserves containing lower grades of mineralization uneconomic to exploit and might result in a reduction of reserves
Mr. Craig Scherba, President and CEO of the Company, is designated as the “qualified person” who reviewed and approved the technical disclosure contained in this document.
6
Molo Graphite Project, Southern Madagascar, Africa
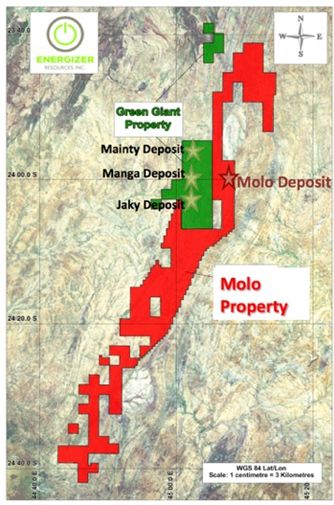
On December 14, 2011, we entered into a Definitive Joint Venture Agreement ("JVA") with Malagasy Minerals Limited ("Malagasy"), a public company on the Australian Stock Exchange, to acquire a 75% interest to explore and develop a group of industrial minerals, including graphite, vanadium and approximately 25 other minerals. The land position covers 2,119 permits and 827.7 square kilometres and is mostly adjacent to the south and east of the Company's 100% owned Green Giant Property. We paid $2,261,690 and issued 7,500,000 common shares valued at $1,350,000.
On April 16, 2014, we signed a Sale and Purchase Agreement and a Mineral Rights Agreement with Malagasy to acquire the remaining 25% interest. We made the following payments at that time: $364,480 (CAD$400,000); issued 2,500,000 common shares subject to a 12 month voluntary vesting period and valued at $325,000; and issued 3,500,000 common share purchase warrants, valued at $320,950 using the Black Scholes pricing model with an exercise price of $0.14 and an expiry date of April 15, 2019.
On May 20, 2015 we paid $546,000 (CAD$700,000), and issued 1,000,000 common shares due to the completion of a bankable feasibility study (“BFS”) for the Molo Graphite Property. Further, a cash payment of $801,584 (CAD$1,000,000) will be due within five days of the commencement of commercial production. Malagasy retains a 1.5% net smelter return royalty ("NSR") on the property. We also acquired a 100% interest to the industrial mineral rights on approximately 1 1/2 additional claim blocks comprising 10,811 hectares to the east and adjoining the Molo Graphite Property.
7
The following is the extracted summary section from the Feasibility Study prepared by Dr. John Hancox, PhD. Geology, Pri.Sc.Nat, Mr. Desmond Subramani, B.Sc. Honours Geology, Pri.Sc.Nat, Dave Thompson, B.Tech Mining, Pr.Cert.Eng, Oliver Peters, M.Sc. Mineral Processing, Pr.Eng, Doug Heher, B.Sc. Mechanical Engineering, Pr.Eng, and John Stanbury, B.Sc. Industrial Engineering, Pr.Eng, each of whom is a “qualified person” and “independent”, as such terms are defined in NI 43-101. The following summary does not purport to be a complete summary of the Molo Graphite Project and is subject to all the assumptions, qualifications and procedures set out in the Feasibility Study and is qualified in its entirety with reference to the full text of the Feasibility Study. It is advised that this summary should be read in conjunction with the Feasibility Study (which is not incorporated by reference into this filing).
The summary includes an important modification from the original Feasibility Study, whereby the project’s economic indicators are now presented under two scenarios with equal prominence: (i) using the historical three-year average graphite price (not included in the Feasibility Study), and (ii) using a projected and escalating graphite basket price (as per the Feasibility Study).
Introduction
The Molo deposit is situated 160 kilometres (“km”) southeast of the city of Toliara, in the Tulear region of south-western Madagascar. The deposit occurs in a sparsely populated, dry savannah grassland region, which has easy access via a network of seasonal secondary roads radiating outward from the village of Fotadrevo. Fotadrevo in turn has an all-weather airstrip and access to a road system that leads to the regional capital (and port city) of Toliara and the Port of Ehoala at Fort Dauphin via the RN10, or RN13.
Geologically Molo is situated in the Bekikiy block (Tolagnaro-Ampanihy high grade metamorphic province) of southern Madagascar. The Molo deposit is underlain predominantly by moderately to highly metamorphosed and sheared graphitic (biotite, chlorite and garnet-rich) quartzo-feldspathic schists and gneisses, which are variably mineralised. Near surface rocks are oxidised, and saprolitic to a depth, usually of less than 5m.
Molo is one of several surficial graphite trends discovered by Energizer in late 2011 and announced in early January 2012. The deposit was originally drill tested in 2012, with an initial seven holes being completed. Resource delineation, drilling and trenching on Molo took place between May and November of 2012, and allowed for a maiden Indicated and Inferred Resource to be stated in early December of the same year. This maiden mineral resource estimate formed the basis for a Preliminary Economic Assessment (the “PEA”), which was undertaken by DRA Mineral Projects in 2013.
The positive outcome of this assessment lead Energizer to undertake another phase of exploratory drilling and sampling in 2014, which was done under the supervision of Caracle Creek International Consulting (Pty) Limited (“Caracle Creek” or “CCIC”). This phase of exploration was aimed at improving the geological confidence of the deposit and its contained mineral resources, and included an additional 32 diamond drill holes (totalling 2,063 metres) and 9 trenches (totalling 1,876 metres). Caracle Creek were subsequently engaged to update the geological model and resource estimate. The entire database on which this new model and resource estimate is based contains 80 drill holes (totalling 11,660 metres) and 35 trenches (totalling 8,492 metres). This new resource forms the basis for this Molo 2015 FS.
8
Project Location
The Molo deposit is located some 160 km SE of Madagascar’s administrative capital (and port city) of Toliara, in the Tulear region and about 220 km NW of Fort Dauphin. It is approximately 13 km NE of the local village of Fotadrevo. See Figure 1 below.
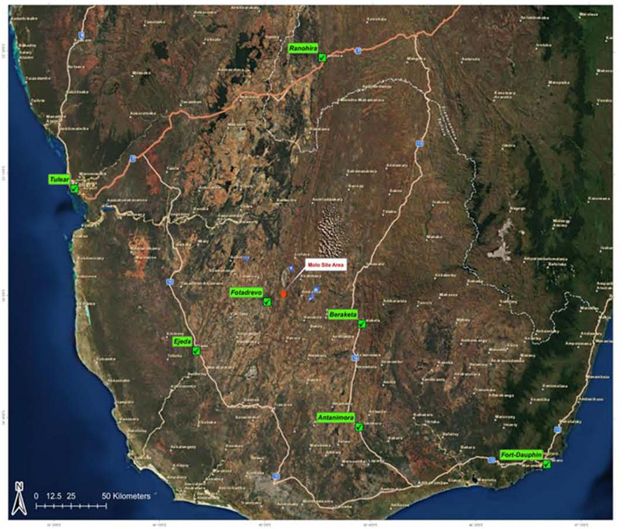
Figure 1: Project Location in Southern Madagascar
9
Project Description
The proposed development of the Molo Graphite Project includes the construction of a green fields open pit mine, a processing plant with a capacity of 862,000 tonnes of ore per annum and all supporting infrastructure including water, fuel, power, tailings, buildings and permanent accommodation.
The mine will utilize four 2 megawatt diesel generators, with three running and one standby and water is supplied from a well field which has been defined by drilling and detailed geo-hydrological modelling. The processing plant will consist of conventional crushing, milling and flotation circuits followed by concentrate filtering, drying and screening. The waste heat generated by the power station will be utilized for the drying of the concentrate.
The tailings storage facility, in the form of a valley dam layout, is located approximately 1.5 kilometers to the west of the process plant and is designed to accommodate the run-of-mine tonnage for the 26 year Life of Mine (“LOM”).
See Figure 2 below for the proposed layout of the site.
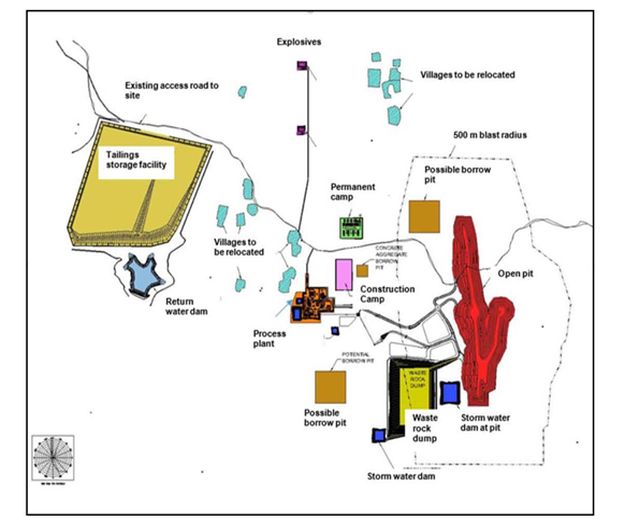
Figure 2: Site layout
10
Summary of financial results
Table 1A, 1B and 1C below summarizes the financial results of the Molo 2015 FS. Table 2 below summarizes key mine and process data. These are based on a discounted flow analysis of the project using nominal cash flows, which include the effect of inflation.
Table 1A: Summary of Financial Results – Projected Escalating Basket Price
|
Category
|
Value
|
|
|
Average price / tonne of concentrate
|
US$1,867
|
|
|
Post-tax: NPV (10% Discount Cash Flow)(1)(2)
|
US$389,797,113
|
|
|
Post-tax: IRR (1)(2)
|
31.2%
|
|
|
Payback (2)
|
4.84 years
|
|
Table 1B: Economic Analysis of the Project – Historical Three-Year Average Price
|
Category
|
Value
|
|
Average price / tonne of concentrate
|
US$1,867
|
|
Post-tax: NPV (10% Discount Cash Flow)(1)(2)
|
25.6%
|
|
NPV @ 10% Discounted Cash Flow
|
US$168,138,467
|
|
Payback (2)
|
5.84 years
|
Table 1C: Summary of Financial Results
|
Category
|
Value
|
|
|
Capital cost (“CAPEX”)
|
US$149.9 million
|
|
|
Design Development Allowance (to cover potential quantity and rate changes during detailed design and execution)
|
US$13.8 million
|
|
|
Owners Contingency
|
US$24.6 million
|
|
|
On-site Operating Costs (“OPEX”) per tonne of concentrate, (year 3 onward)
|
US$353
|
|
|
Transportation per tonne of concentrate (from mine site to Madagascar Port year 3 onward)
|
US$182
|
|
|
Transportation per tonne of concentrate (from Madagascar Port to European Customer Port from year 3 onward)
|
US$155
|
|
|
Average annual production of concentrate
|
53,017 tonnes
|
|
|
Life of Mine
|
26 years
|
|
|
Graphite concentrate sale price (US$/tonne at Start Up - 2017)
|
US$1,689 per tonne
|
|
|
Average Head Grade
|
7.04%
|
|
|
Average ore mined per annum over Life of Mine
|
856,701 tonnes
|
|
|
Average stripping ratio
|
0.81:1
|
|
|
Average carbon recovery
|
87.80%
|
|
|
|
|
|
Notes
Note 1: Assumes project is financed with a 50% debt and 50% equity.
Note 2: Values shown are based on nominal cash flows, which include the effect of inflation. Costs are increased on an annual basis by the relevant inflation index.
Table 2: Mine & Process Data
|
Proven reserves
|
14,170,000
|
Tonnes @ 7.0% C grade
|
|
Probable reserves
|
8,367,000
|
Tonnes @ 7.04% C grade
|
|
Grade (graphitic carbon)
|
7.04%
|
Average plant head feed over LOM
|
|
Waste to ore ratio
|
0.81:1
|
|
|
Processing rate
|
856,701
|
Tonnes per annum
|
|
Mine life
|
26 years
|
|
|
Recovery
|
87.8%
|
|
|
Average annual product tonnes
|
53,017
|
|
11
Property Description and Ownership
Property description
The Molo Graphite Project is contained in a portion of Exploration Permit #3432. The Project is centred on UTM coordinates 413,390 Easting 7,345,713 Northing (UTM 38S, WGS 84 datum). The Molo Graphite Project is located 11.5 km ENE of the town of Fotadrevo and covers an area of 62.5 hectares (“ha”). The Government of Madagascar designates individual claims by a central LaBorde UTM location point, comprising a square with an area of 6.25 km2.
Ownership
On December 14, 2011, the Company entered into a Definitive Joint Venture Agreement (“JVA”) with Malagasy Minerals Limited (“Malagasy”), a public company on the Australian Stock Exchange, to acquire a 75% interest to explore and develop a group of industrial minerals, including graphite, vanadium and approximately 25 other minerals. On October 24, 2013, the Company signed a Memorandum of Understanding (“MOU”) with Malagasy to acquire the remaining 25% interest in the land position. On April 16, 2014, Energizer signed a Sale and Purchase Agreement and a Mineral Rights Agreement with Malagasy to acquire the remaining 25% interest. Malagasy retained a 1.5% net smelter return royalty (“NSR”).
The Molo Graphite Project is located within Exploration Permit #3432 as issued by the Bureau de Cadastre Minier de Madagascar pursuant to the Mining Code 1999 (as amended) and its implementing decrees.
CCIC has reviewed a copy of the Contrat d’amodiation pertaining to this right and are satisfied that the rights to explore this permit have been ceded to Energizer or one of its Madagascar subsidiaries.
Energizer holds the exclusive right to explore for a defined group of industrial minerals within the permits listed above. These industrial minerals include the following: Graphite, Vanadium, Lithium, Aggregates, Alunite, Barite, Bentonite, Vermiculite, Carbonatites, Corundum, Dimensional stone (excluding labradorite), Feldspar (excluding labradorite), Fluorspar, Granite, Gypsum, Kaolin, Kyanite, Limestone / Dolomite, Marble, Mica, Olivine, Perlite, Phosphate, Potash- Potassium minerals, Pumice Quartz, Staurolite, and Zeolites.
Reporting requirements of exploration activities carried out by the titleholder on a Research Permit are minimal. A titleholder must maintain a diary of events and record the names and dates present of persons active on the project. In addition, a site plan with a scale between 1/100 and 1/10,000 showing “a map of the work completed” must be presented. Upon establishment of a mineral resource, Research Permits may be converted into Exploitation Permits by application. CCIC is of the opinion that Energizer is compliant in terms of its commitments under these reporting requirements.
The Molo Graphite Project has not been legally surveyed; however, since all claim boundaries conform to the predetermined rectilinear LaBorde Projection grid, these can be readily located on the ground by use of Global Positioning System (“GPS”) instruments. Most current GPS units and software packages do not however offer LaBorde among their available options, and therefore defined shifts have to be employed to display LaBorde data in the WGS 84 system. For convenience, all Energizer positional data is collected in WGS 84, and if necessary converted back to LaBorde.
Royalties
There is a 1.5% net smelter return royalty on the Molo Graphite Project.
Permits
Exploration Permit #3432 is currently held under the name of a subsidiary of Malagasy Minerals called, Mada-Aust Sarl. The transformation or amendment of exploration and research mining permits within the country continues to be suspended from the time that Madagascar was run by a president who was not democratically elected. This current permit expired on August 17, 2011.
Energizer’s Madagascar domiciled subsidiary companies and Mada-Aust Sarl has continued to pay all taxes and administrative fees to the Madagascan government and its mining ministry with respect to all the mining permits held in country. These taxes and administrative fee payments have been acknowledged and accepted by the Madagascan government. In addition, Energizer management continues to diligently work with the Madagascan government to obtain the necessary permits in its name as the country clears its backlog of applications and amendments.
12
The research permit will be converted into an exploitation permit in due course. When the permit is transformed from a research permit to an exploitation permit, the exploitation permit will be issued in the name of Energizer. The exploitation permit is required to advance the Molo Graphite Project to the developmental stage.
Exploration
No further exploration is currently planned.
1.8 Mineral Reserve Estimate
As a result of the Molo 2015 FS, the following maiden proven and probable mineral reserves are declared, see Table 4 below.
Table 4: Mineral Reserves
|
Category
|
Tonnage
|
C Grade (%)
|
|
Proven
|
14,170,000
|
7.00
|
|
Probable
|
8,367,000
|
7.04
|
|
Proven and Probable
|
22,437,000
|
7.02
|
Proven Reserves are reported as the Measured Resources inside the designed open pit and above the grade cut off of 4.5% C. Similarly, the Probable Reserves are reported as the Indicated Resources inside the designed open pit and above the grade cut-off of 4.5% C.
Metallurgical Test Work
The Molo 2015 FS is based on a full suite of metallurgical test work performed by SGS Canada Metallurgical Services Inc. (“SGS”) which is based in Lakefield, Ontario, Canada. These tests included laboratory scale metallurgical work and a 200 tonne bulk sample / pilot plant program. The laboratory scale work included comminution tests, process development and optimization tests, variability flotation, and concentrate upgrading tests.
Comminution test results place the Molo ore into the very soft to soft category with low abrasivity. A simple reagent regime consists of fuel oil number 2 and methyl isobutyl carbinol at dosages of approximately 120 g/t and 195 g/t, respectively. A total of approximately 150 open circuit and locked cycle flotation tests were completed on almost 70 composites as part of the process development, optimization, and variability flotation program. The metallurgical programs culminated in a process flowsheet that is capable of treating the Molo ore using proven mineral processing techniques and extraction has been successfully demonstrated in the laboratory and pilot plant campaigns.
The tests indicated that variability exists with regards to the metallurgical response of the ore across the deposit, which resulted in a range of concentrate grades between 88.8% total carbon and 97.8% total carbon. Optical mineralogy on representative concentrate samples identified interlayered graphite and non- sulphide gangue minerals as the primary source of impurities. The process risk was mitigated with the design of an upgrading circuit, which improved the grade of a concentrate representing the average mill product of the first five years of operation from 92.1% total carbon to 97.1% total carbon.
The overall graphitic carbon recovery into the final concentrate of the first 5 years of operation is 87.8% based on the metallurgical response of composites using samples from all drill holes within the five year pit design. The average composition of the combined concentrate grade is presented in the table below.
The area composites were generated by splitting the footprint of the five year mine plan into five zones of approximately the same size. All drill holes within one specific zone were then combined to form an area composite. A total of fifteen area composites were generated for metallurgical evaluation, (five zones with three depth intervals per zone). All assays were completed using control quality analysis and cross checks were completed during the mass balancing process to verify that the results were within the estimated measurement uncertainly of up to 1.7% relative for graphite concentrate grades greater than 90% total carbon.
13
Table 5: Metallurgical Data - Flake Size Distribution and Product Grade
|
Product Size
|
Mass Distribution %
|
Product Grade(%) Carbon
|
|
+48 mesh (jumbo flake)
|
23.6
|
96.9
|
|
+65 mesh (coarse flake)
|
14.6
|
97.1
|
|
+80 mesh (large flake)
|
8.2
|
97.0
|
|
+100 mesh (medium flake)
|
6.9
|
97.2
|
|
+150 mesh (medium flake)
|
15.5
|
97.3
|
|
+200 mesh (small flake)
|
10.1
|
98.1
|
|
-200 mesh (fine flake)
|
21.1
|
97.5
|
Table 6: Pricing Matrix - Flake Size Distribution Grouping and Product Grade
|
Product Size
|
Mass Distribution %
|
Product Grade (%) Carbon
|
|
>50 mesh
|
23.6
|
96.9
|
|
-50 to +80 mesh
|
22.7
|
97.1
|
|
-80 to +100 mesh
|
6.9
|
97.2
|
|
-100 mesh
|
46.8
|
97.6
|
Vendor testing including solid-liquid separation of tailings and concentrate, screening and dewatering of concentrate, and drying of concentrate was completed successfully.
1.10 Recovery methods
The process design is based on an annual production capacity of 862 kilotonnes of plant feed material at a nominal head grade of 7.04% C(t) producing an estimated average of 53 kilotonnes per annum (“ktpa”) of final concentrate.
The ore processing circuit consists of three-stage crushing followed by primary milling and classification, a flotation separation and concentrate upgrading circuit, and graphite product and tailings effluent handling facilities.
The crushing circuit is designed to operate 365 days per annum for 24 hours per day at ±68% utilization and comprises a primary jaw crusher, a secondary cone crusher and a tertiary cone crusher in closed-circuit with a double-deck classifying screen. The crushed product (P80 of approximately 13 mm) passes through a surge bin from where it is fed to the milling circuit.
The milling and flotation circuits are designed to operate 365 days per annum for 24 hours per day at 91% utilization. A single stage primary ball milling circuit is employed, incorporating a closed circuit linear classifying screen and a scalping screen ahead of the mill. The scalping screen undersize feeds a single flash flotation cell before combining with the mill discharge material. Scalping and linear screen oversize are the feed to the primary mill. The primary ball mill size is 4.3m diameter (inside new liners) x 4.6m (EGL) with an installed motor power of 1000 kW.
Primary milling is followed by rougher flotation which, along with flash flotation, recovers the graphite to concentrate from the main stream. Rougher flotation employs seven forced-draught trough cells.
The primary, fine-flake and attritioning cleaning circuits upgrade the concentrate to the final product grade of above 94% C(t). Concentrate from the main stream feeds into the primary cleaning circuit consisting essentially of a dewatering screen, a polishing ball mill, a column flotation cell and flotation cleaner/cleaner scavenger trough cells.
The primary cleaner column cell concentrate gravitates to a 65 mesh classifying screen, from where the large-flake oversize is directed to a high rate thickener located ahead of a final concentrate attritioning circuit. Primary cleaner classifying screen undersize is pumped to the fine-flake cleaning circuit.
The fine flake cleaning circuit consists primarily of a dewatering screen, a polishing ball mill, a column flotation cell and flotation cleaner/cleaner scavenger trough cells. The attritioning cleaning circuit employs a high rate thickener, an attritioning stirred mill, a column flotation cell and flotation cleaner/cleaner scavenger trough cells. Fine flake column concentrate merges with the +65 mesh primary cleaner classifying screen oversize as it feeds the attritioning circuit thickener. Attritioning circuit column concentrate comprises the final concentrate stream feeding the final concentrate thickener.
14
Combined rougher and cleaner flotation final tailings are pumped to a guard de- gritting cyclone installation ahead of a high rate final tailings thickener. Cyclone overflow feeds the thickener. Cyclone and thickener underflows combine and are pumped for final disposal to the tailings storage facility (“TSF”).
Thickened final concentrate is pumped to a linear vacuum belt filter for further dewatering before the filter cake is fed into a rotary kiln drying circuit.
A three-stage, twin stream sifting plant screens the dry concentrate (dryer product) into the pre-determined size classes. A bagging plant is employed to weigh, sample and bag the different size fractions discretely for loading into sea freight containers for shipment.
Chemical reagents are used throughout the primary recovery and upgrading processes. Diesel fuel collector and liquid frother are added to various points-of- use within the flotation circuits.
Diesel collector is pumped from the main tank farm to a bulk tank at the plant, from where it enters a manifold system which supplies multiple variable speed peristaltic pumps which discretely pump the collector at set rates to the various points-of-use within the flotation circuits.
MIBC (methyl isobutyl carbinol) frother is delivered by road to a plant reagent store in 1m3 IBC’s, or 210 litre steel drums. The drums are collected by forklift as required and the contents pumped into a frother storage tank. A manifold system on the storage tank supplies multiple variable speed peristaltic pumps, which discretely pump the frother at set rates to the various points-of-use within the flotation circuits.
Flocculant powder (Magnafloc 919 and Magnafloc 24 for concentrate and tailings thickening facilitation respectively) is delivered by road to the plant reagent store in 25 kg bags. The bags are collected by forklift as required and delivered to a flocculant mixing and dosing area. Here the flocculant is diluted as required using parallel, duplicate vendor-package automated make-up plants, one each being dedicated to supplying the concentrate and tailings thickeners due to the flocculant types required being different for each application. Variable speed peristaltic pumps discretely pump the flocculant at set rates to the thickeners’ points-of-use.
Coagulant powder (Magnafloc 1707) for thickening enhancement is handled similarly to the flocculant as described above, the exception being that a single make-up system is provided to supply both the concentrate and tailings thickeners. Again, variable speed peristaltic pumps discretely pump the coagulant at set rates to the thickeners’ points-of-use.
15
Figure 3 below gives a high level overview of the project and Figure 4 below provides a block diagram depicting the basic process flow.
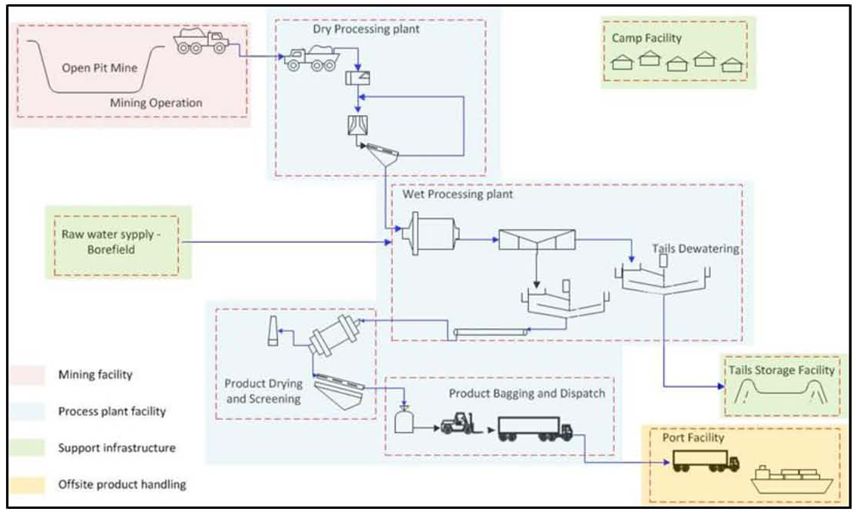
Figure 3: Project summary
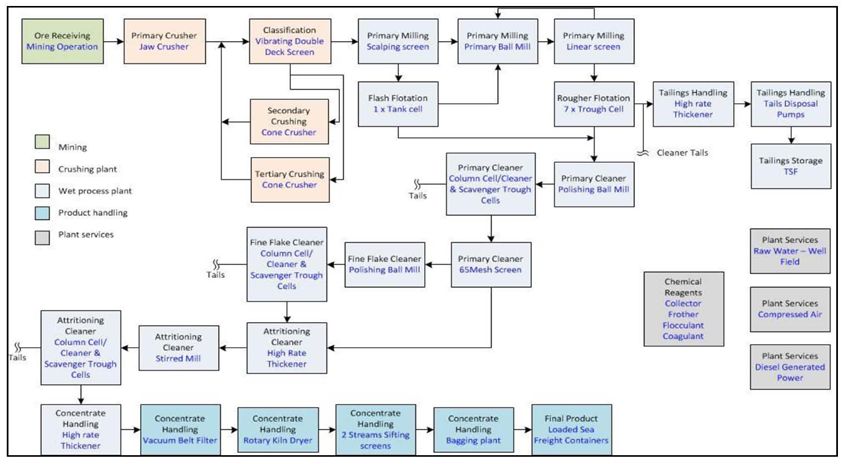
Figure 4: Block Flow Diagram
16
Infrastructure
The project is located in a relatively remote part of South Western Madagascar, approximately 13 km NE of the local village of Fotadrevo. There is currently no infrastructure on site and everything will have to be constructed.
The following elements are all part of the project scope:
| · | Raw water supply (from a network of bore holes extracting ground water) |
| · | Power supply (temporary during construction) and then a permanent diesel power station to supply the plant and permanent camp |
| · | Sanitation for the plant, permanent camp, and temporary during construction) |
| · | Storm water control and management |
| · | Temporary accommodation during construction |
| · | Permanent accommodation (340 people) |
| · | All permanent buildings (offices, workshops, stores, laboratory) |
| · | All buried services (potable water, sewage, stormwater, electrical reticulation) |
| · | In plant roads |
| · | Haul road |
| · | Tailings Storage Facility |
| · | Tailings pipe line to the TSF |
| · | Return water pipe line from the TSF back to the plant |
| · | Rock dumps and Run of Mine Ore (“ROM”) pads |
See Figure 2 in section 1.3 for the site layout.
Raw Water Supply
Water is supplied by a network of boreholes. A detailed water demand and supply analysis was done as part of the Molo 2015 FS, and this has shown that the water demands of the plant can be accommodated by boreholes within a radius of 5km from the plant. The daily steady state raw water make up requirement is estimated to be 561m3 per day.
Power Supply
Power is supplied by four 2 MW diesel generators. The running load for the plant is estimated to be 2.7 MW with an additional 0.8 MW for the permanent camp and all mine infrastructure. Under normal operation there will only be two units running, with a third allowed to assist with mill starting, and the fourth unit as a spare for maintenance.
1.12 Product Pricing
Graphite prices are based on current quotes and projected estimates provided by UK-based Roskill Consulting Group Ltd (“Roskill”), recognized as a leader in providing independent and unbiased market research, pricing trends, and demand and supply analysis for the natural flake graphite market.
The historical 3 year average price in December 2014 was $1,867 per tonne. The weighted average price per tonne of graphite concentrate in December 2014 was US$1,375 per tonne. This is a basket price and reflects the contribution of the different flake sizes and carbon grades to the overall price.
The start-up price (in 2017 terms) for a tonne of Molo graphite concentrate is a projection based on Roskill information using the weighted average price per tonne. The graphite price then escalates in the financial model based on Roskill’s forecasts for supply and demand. The reader is cautioned that these are forecasts and may change subject to market dynamics.
17
1.13 Logistics
The cost to transport one tonne of dry concentrate (0.5% moisture content) from Molo to Rotterdam via Fort Dauphin, Madagascar, in December 2014 terms is 337 US$ / tonne. This is based on shipping 26 tonnes of concentrate in 1 m3 bags placed inside a 40 ft. container.
The route from Molo to Fort Dauphin runs either via the RN 10 or the RN 13. Both these routes vary from reasonable to poor condition and trucks are expected to take between four and five days to make the round trip. A truck was run over the route by a Madagascan trucking contractor to gauge cycle times and they managed to complete the journey in two long days each way. This was in the dry season and in the wet season there may be periods of time when the roads become impassable. No money has been budgeted for roads repairs or upgrades.
The Port of Ehoala at Fort Dauphin is a modern (2009) port developed by Rio Tinto for the QMM project. It has a 15m draft with shipping lines calling on a regular basis. There are however no crane facilities and vessels require their own cranes.
Figure 5 below shows a picture of the Port of Ehoala at Fort Dauphin.
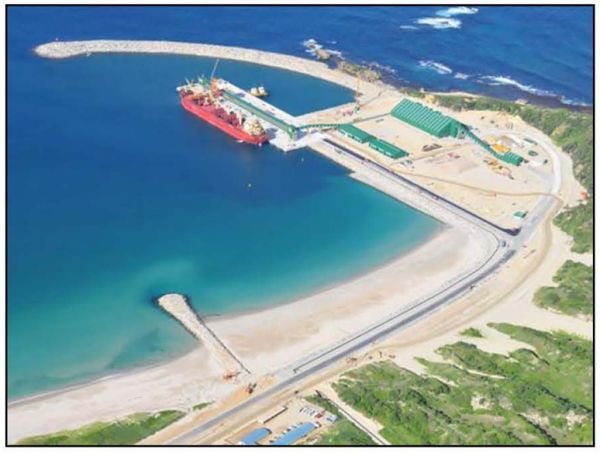
Figure 5: Port of Ehoala at Fort Dauphin
18
Figure 6, Figure 7, and Figure 8 below give some insight into the varying road conditions between Molo and Fort Dauphin.
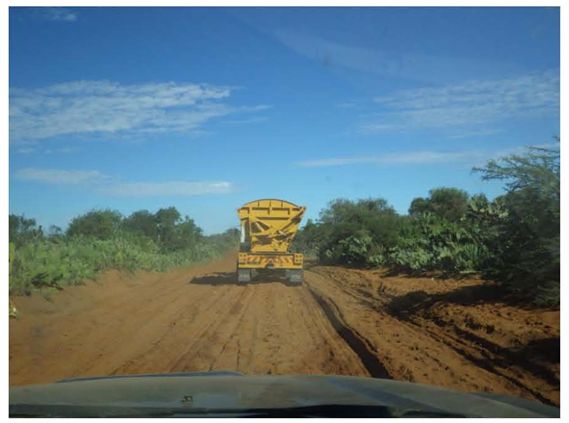
Figure 6: Road Conditions (1)
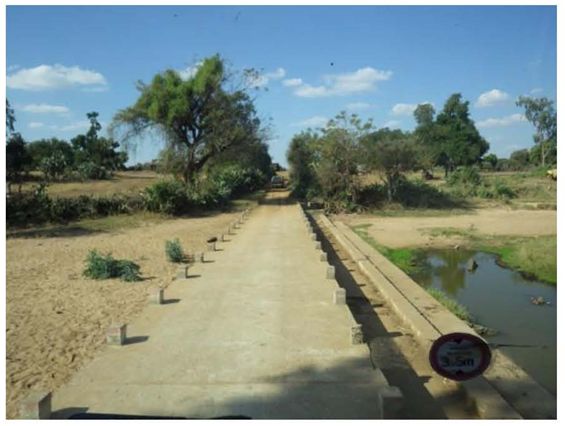
Figure 7: Road Conditions (2)
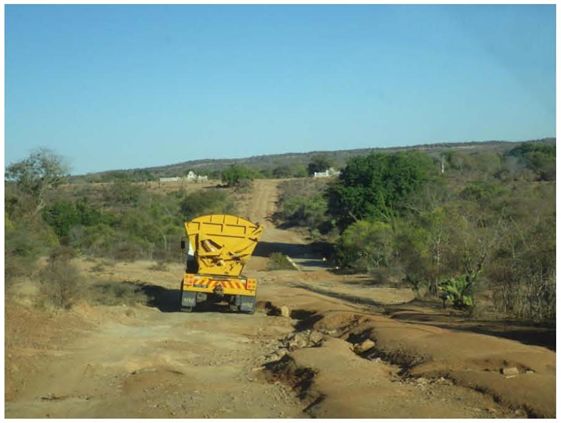
Figure 8: Road Conditions (3)
19
1.14 Capital costs
The capital cost for the project is estimated to be 188.2 million US$, including a contingency of 24.5 million US$. Competitive bids were obtained for most mechanical equipment, and for the earthworks, civils, structural steel, mechanical erection, piping and electrical, control and instrumentation detailed Bills of Quantities were issued for competitive pricing.
The base date for the capital costs is December 2014 and no provision has been made for escalation. The accuracy of capital costs is considered to be with +/- 10%
Table 7: Construction Capital Costs
|
Category
|
Cost (US$ Million)
|
|
Capital Cost
|
149.9
|
|
Design Development Allowance
|
13.8
|
|
Subtotal
|
163.7
|
|
Contingency
|
24.5
|
|
Total
|
188.2*
|
|
*Excludes taxes, tariffs, duties and interest
|
|
Table 8: Initial Capital Cost Summary
|
Cost Centres
|
Cost (US$ Million)
|
|
Pre-production
|
37.3
|
|
Tailings Storage Facility
|
24.3
|
|
Mechanicals
|
20.8
|
|
Electrical, Control & Instrumentation
|
20.8
|
|
External services
|
17.9
|
|
Earthworks
|
11.8
|
|
Piping
|
7.4
|
|
Structural
|
5.6
|
|
Transport
|
5.5
|
|
Vendor packages
|
3.4
|
|
Civil works
|
2.5
|
|
Consumables and spares
|
2.4
|
|
Buildings, fittings
|
2.1
|
|
Plate work
|
1.9
|
|
Total Capital Costs
|
163.7
|
Future capital expenditure expected to be incurred has been allowed for in the financial model to cover the expansion of the TSF in year 2, the replacement of the mine fleet, the replacement of the power plant, and for rehabilitation at the end of the project. Over the life of mine this accounts for an additional 38.3 million US$ with 7 million US$ spent on the TSF expansion in year 2.
20
1.15 Operating costs
The average cash operating costs from year 3 onwards, after the expatriate staff complement is reduced, are estimated to be 21.7 US$ per mineralized tonne processed and 353 US$ per tonne of concentrate produced. The cash operating costs includes mine operations (owner operated), process plant operations and general and administrative charges. They do not include shipping from Molo to the end user, or any downstream processing costs.
Table 9: Operating Costs per Tonne of Feed
|
Category
|
Year 3 onwards
|
|
Mining
|
US$3.90
|
|
Processing
|
US$11.00
|
|
General and Administrative
|
US$6.80
|
|
Total OPEX per Tonne of Feed
|
US$21.70
|
|
Costs have been rounded.
|
|
Table 10: Operating Costs per Tonne of Concentrate produced at the Mine Site
|
Category
|
Year 3 onwards
|
|
Mining
|
US$64
|
|
Processing
|
US$179
|
|
General and Administrative
|
US$110
|
|
Total OPEX cost per Tonne of Concentrate at Mine Site
|
US$353
|
|
Costs have been rounded
|
|
The operating costs expressed above are considered to be accurate to +/- 10%, and assume a varying US$ inflation rate of 1.6% in 2015 and escalating to 2.0% from 2017 onward. Currency inflation rates were also considered in the financial model and were applied to the South African Rand and Malagasy Ariary portions of the opex costs.
Please note that these operating costs assume that the plant is able to successfully handle the variability in the ore body, as shown by the SGS test work discussed in detail in Section 13. Should the plant not perform as expected this could have a material impact on operating costs as:
• The flake size distribution could be worse than expected
• The product grade could be lower than expected
• The recoveries could be lower than expected or a combination of all of these
21
1.16 Economic analysis
Table 11A below summarizes the economic analysis of the project using discounted cash flow methods based on the projected and escalating graphite basket price.
Table 11A: Economic Analysis of the Project – Projected Escalating Basket Price
|
Category
|
Value
|
|
Average price / tonne of concentrate (at start up, 2017)
|
US$1,689
|
|
Internal Rate of Return (“IRR”) - Project Equity
|
31.2%
|
|
NPV @ 8% Discounted Cash Flow
|
US$521,602,408
|
|
NPV @ 10% Discounted Cash Flow
|
US$389,797,113
|
|
NPV @ 12% Discounted Cash Flow
|
US$293,649,899
|
|
Project Payback Period
|
4.84 years
|
|
* Assumes that the project is financed through 50% equity finance and 50% corporate debt. The debt assumptions used in the model assumes a rate of 5.75% over LIBOR, with LIBOR forecast to escalate to 3.54% by 2022. An arranging fee is also assumed.
|
|
Notes
All values in the above table do not account for inflation and assume that a satisfactory investment agreement is negotiated under Madagascar’s LGIM (Loi Sur les Grands Investissements Miniers) tax laws covering large scale mining investments, for which this project qualifies. Also included in the above table are forecasted prices for 2017, which coincides with the year the Molo mine is expected to be in production.
The exchange rates used in the financial model are as follows:
| · | 11.31 South African Rand (“ZAR”) to US$1, moving in line with purchasing power parity |
| · | 0.833 Euro to US$1, fixed for the modelled period |
| · | 2,746 Malagasy Ariary (“MGA”) to US$1, moving in line with purchasing power parity |
Table 11B below summarizes the economic analysis of the project using discounted cash flow methods based on the historical three-year average graphite price.
Table 11B: Economic Analysis of the Project – Historical Three-Year Average Price
|
Category
|
Value
|
|
Average price / tonne of concentrate
|
US$1,867
|
|
Internal Rate of Return (“IRR”) - Project Equity
|
25.6%
|
|
NPV @ 8% Discounted Cash Flow
|
US$223,903,960
|
|
NPV @ 10% Discounted Cash Flow
|
US$168,138,467
|
|
NPV @ 12% Discounted Cash Flow
|
US$126,029,578
|
|
Project Payback Period
|
5.84 years
|
|
* Assumes that the project is financed through 50% equity finance and 50% corporate debt. The debt assumptions used in the model assumes a rate of 5.75% over LIBOR, with LIBOR forecast to escalate to 3.54% by 2022. An arranging fee is also assumed.
|
|
Notes
All values in the above table do not account for inflation and assume that a satisfactory investment agreement is negotiated under Madagascar’s LGIM (Loi Sur les Grands Investissements Miniers) tax laws covering large scale mining investments, for which this project qualifies. Also included in the above table are forecasted prices for 2017, which coincides with the year the Molo mine is expected to be in production.
The exchange rates used in the financial model are as follows:
| · | 11.31 South African Rand (“ZAR”) to US$1, moving in line with purchasing power parity |
| · | 0.833 Euro to US$1, fixed for the modelled period |
| · | 2,746 Malagasy Ariary (“MGA”) to US$1, moving in line with purchasing power parity |
22
1.17 Environmental & Permitting
A comprehensive Environmental and Social Impact Assessment (“ESIA”) was completed to local Malagasy, Equator Principles, Word Bank and International Finance Corporation (“IFC”) standards. The process was preceded by an Environmental Legal Review and an Environmental and Social Screening Assessment; both providing crucial information to align the project development and design with international best practice on sustainable project development.
The ESIA submission is subject to approval of the investment amount by Madagascar’s Ministry of Mines. The application was submitted on 30th January 2015 and the approval of the investment amount is in progress. Energizer will receive a Global Environmental Permit upon approval of the ESIA, a process which is expected to take six months from date of submission.
A comprehensive permitting register is in place and additional sectorial permit applications will form part of the early execution phase. Approval of the sectorial applications is expected within the same six month period as the ESIA review.
No material issues were identified in relation to Environmental, Social and Permitting processes and through the stakeholder engagement process the local and regional community has expressed a desire for the project to move forward.
1.18 Conclusions
1.18.1 Geology
Energizer’s 2011 exploration program delineated a number of new graphitic trends in southern Madagascar. The resource delineation drilling undertaken during 2012-2014 focused on only one of these, the Molo deposit, and this has allowed for an independent, updated resource statement for the Molo deposit, which is stated in accordance with the CIM Guidelines.
1.18.2 Mining
Maiden mineral reserves of 22 437 000 tonnes have been declared for the Molo Graphite Project at an average grade of 7.02% and based on the information contained in the Molo 2015 FS it is possible to economically mine this deposit.
1.18.3 Metallurgical Test Work
Comprehensive metallurgical test programs culminated in a process flowsheet that is capable of treating the Molo ore using conventional and established mineral processing techniques. Process risks associated with the variability with regards to metallurgical performance have been mostly mitigated through the addition of an upgrading circuit.
1.18.4 Recovery Methods
The laboratory, pilot and vendor test work conducted prior to and during the study defined the required process flow sheet. This was duly translated into a full-scale production plant flow sheet as described within this report. The flow sheet unit processes were populated and individual component equipment selected according to either pilot plant precedents or, where these were not available, proven practice within the industry, in conjunction with suitably experienced vendors. All process designs and selections were based on conventional, proven mineral processing practices.
The processing selections and configurations built into the design are adequately suited to the requirements. Based on the mining and metallurgical test work information presented elsewhere within the Molo 2015 FS, and assuming within specification ROM ore is fed to the plant, the required recovery is expected to be attainable at the throughput stated. Note that this recovery is based on lab and pilot scale test work and may reduce slightly on a full scale plant due to operational inefficiencies. This possible reduction has not been taken into account in the financial analysis.
1.18.5 Infrastructure
All infrastructure required for the project has to be installed from scratch and has been allowed for in the project budget.
1.18.6 Water
The detailed hydrogeological analysis has concluded that the plant can be supplied from a well field.
23
1.18.7 Environmental, Social
A comprehensive Environmental and Social Impact Assessment has been done, and is in the process of being submitted to Madagascan government for approval.
1.18.8 Permitting
Various permits will have to be obtained for the project including an Environmental Permit and a Mining permit. The most urgent permit is for Energizer to renew the exploration permit covering the project.
1.18.9 Tailings
It is possible to construct the required tailings storage facility and a suitable site has been identified. Geochemical and hydrogeological test work has shown that the facility does not need to be lined.
1.18.10 Risks
The qualitative risk assessment identified 56 risks of which 9 were extremely high before controls. After controls were applied the number of extremely high risks was reduced to two. These risks are:
1. The exploration permit covering the Molo pit expired in 2011 and has yet to be officially renewed (Exploration Permit #3432 is the permit in question).
2. Current delays in issuing new mining permits.
After controls were applied the remaining high risks are as follows, (reduced from 39 to 18):
| 1. | Requirement that all voids / excavations be backfilled without exception. |
| 2. | Inaccurate landownership data. |
| 3. | The unit costs of moving product are high. |
| 4. | Project NPV and IRR lower than the PEA |
| 5. | Theft during construction & operation (diesel, cable, etc.) |
| 6. | No off take agreements signed yet or formal product specifications received. |
| 7. | The current execution strategy calls for contracts to be placed before permits are granted. |
| 8. | The project has modelled the diesel price at 0.8 US$ / litre. |
| 9. | ESIA review timeframes could extend past the planned project start date - indications are 6-9 months for ESIA approval from date of submission to the O.N.E (The Madagascan Government department of the Environment) |
| 10. | The process design may not achieve the optimal balance between the competing requirements of: |
| i. | Maximizing coarse flake recovery |
| ii. | Maximizing product carbon grade |
| iii. | Maximizing overall recovery |
| 11. | Future Land Claims (Ancestral Rights). |
| 12. | The process plant may not achieve a consistent on spec product, especially as the feed grade to the plant varies and this may make process control difficult. |
| 13. | Madagascan political situation remains potentially unstable. |
| 14. | Difficult logistics getting material on and off the island plus very bad roads. |
| 15. | Contractors P&G’s high due to locality. |
| 16. | The projects returns are reliant on a real term increase in the price of graphite. |
| 17. | Implementation of the preferential taxation arrangement may be difficult. |
| 18. | The debt funding assumptions may not be achievable. |
24
1.19 Recommendations
1.19.1 Geology
No further recommendations at present.
1.19.2 Mining
The long mine life of the Molo Graphite Project will allow for potential optimization of drilling and blasting designs during execution that could reduce operating costs slightly.
From a pure mining perspective the Molo Graphite Project is very small and provided reasonable levels of short term planning are applied it should have very few challenges in delivering the required tonnages at the required grade to meet the production targets set out in this Molo 2015 FS.
1.19.3 Metallurgical Test Work
The following recommendations are made for additional metallurgical testwork prior to the detailed engineering stage:
| · | Evaluate a range of different attrition mill media to determine if flake degradation can be reduced without affecting the concentrate grade; |
| · | Develop a grinding energy versus concentrate grade relationship for the best grinding media. This will allowa more accurate prediction of the required attrition mill grinding energy as a function of the final concentrate grade; |
| · | Conduct attrition mill vendor tests to aid in the sizing of the equipment; |
| · | Carry out vendor testing on graphite tailings using the optimized reagent regime proposed by the reagent supplier; and |
| · | Complete a series of flotation tests on samples covering the mine life past the initial 5 years. |
1.19.4 Recovery Methods
Optimization and refinement opportunities exist regarding the process design which could reveal benefits over the equipment selections and unit process detail within the current design. The latter are based essentially on test work outcomes pursued and reported on thus far for study purposes.
Appropriate test work is recommended prior to the initiation or during the course of a detailed design phase preceding construction. This would include the following:
| · | Bulk material flow test work; |
| · | Additional test work, in conjunction with vendors and in line with ongoing technical developments, aimed at further refinement of the polishing and attrition milling processes; |
| · | Concentrate attritioning circuit static and dynamic thickening tests, including reagent scoping and optimization trials; |
| · | Further investigation into potentially replacing the final tailings disposal positive displacement pumps withmore common centrifugal pump trains by reducing the slurry solids concentration for overland pumping. Thiswill include examination into whether the overall water balance and supply system can reasonably accommodate such a change. |
1.19.5 Infrastructure
The following are recommended prior to the detailed design stage:
| · | Additional geotechnical investigations at the proposed new construction and permanent camp site, particularly at the location of the new potable water storage tanks |
| · | A detailed geotechnical investigation will need to be undertaken to identify and confirm suitable sources of concrete aggregate and concrete sand materials at the location of the project site. This testing will need to include for concrete material testing and the production of concrete trial mixes with the material identified |
| · | The geotechnical information will also need to confirm the suitability for construction of all the material to beexcavated from the Return Water Dam (“RWD”). It is proposed that all the material excavated from the RWD is utilized in the works as processed fill material |
| · | Confirmation as to whether the material from the proposed borrow pit near Fotadrevo (which will be used to supply all fill material for the TSF starter wall construction) can be utilized as fill material, or if this material can be stabilized in some manner and used in the works |
| · | A detailed topographical survey will need to be undertaken of the proposed construction site, borrow pit areasand the access road between Fotadrevo and the mine site. This information is required prior to the final detailed design of the plant layout and associated earthworks |
25
1.19.6 Water
The following is recommended during the detailed design phase:
| · | Updating the current dynamic water balance including a dynamic TSF water balance. The current water balance only assumed average monthly inflows from the TSF into the RWD. It would be recommended to confirm the water availability on the Molo Graphite Project if drought conditions occur and the TSF model element is included in the dynamic water balance |
| · | Water quality and quantity data is required to provide a baseline for comparison once the Molo Mine is commissioned. To provide the necessary baseline data, regular ground and surface water quality monitoring must be carried out leading up to the date when the Molo Mine will be commissioned. Additionally proposed monitoring and scavenger wells must be installed. This also should include the installation of flow meters on relevant pipelines to verify the dynamic water balance with measured flow rates during operations |
| · | The installation of a weather station on the Molo Graphite Project site should be done as soon as possible. |
| · | The installation and testing of the additional well field boreholes must be undertaken. The groundwater resource model must be updated to include site specific borehole data. |
| · | The environmental geochemical test work of the Molo 2015 FS should be confirmed by selective testing of samples from the latest exploration and metallurgical test programs. The geochemical model should be updated accordingly. |
1.19.7 Environmental, Social
| · | GCS recommends the installation of a suitable weather station at or as near as possible to the proposed project site, even before construction commences. Accurate, local weather data is almost non-existent in Madagascar. This data will prove invaluable for model calibration, improvement in baseline understanding and for future energy supply options which could utilize wind and or solar power generation |
| · | Clean energy supply should be considered as a medium to long term target |
| · | Appointment of a community representative and the establishment of a mandate to sensitize the local communities prior to any project activities |
| · | Monitoring and auditing to commence at project preparation phase |
| · | Compilation of Standard Operating Procedures for Environmental and Social aspects requiring direct management and intervention |
| · | It is recommended that actual activity data, (e.g. kilometers travelled, or litres of diesel consumed) for a financial year is used when a Green House Gas (“GHG”) assessment is being calculated. Given that this project involves an estimation of a future GHG assessment for activities yet to begin, a series of assumptions have been made in order to obtain the activity data required to undertake this calculation |
| · | Community recruitment, skills development and training should begin at project preparation phase |
1.19.8 Permitting
| · | An application for the exploration permit in Energizer’s name is a critical step in the larger permitting and licensing regime and requires early attention and dedicated involvement |
| · | Security of land tenure is a process and is estimated to take 7 months, thus this process should be commissioned as early as possible |
| · | Application for all other necessary permits (water use, construction, mineral processing, transportation, export, labour etc should be undertaken within the ESIA review period (6 months), which is expected to be from March till August 2015 |
| · | Compilation of a comprehensive legal register |
| · | Municipal elections are scheduled for July 2015. It is recommended that all above-mentioned permitting processes should commence prior to and in anticipation of these elections. |
| · | The permitting and licensing of the proposed Molo Graphite Project requires dedicated attention to ensure consistent momentum in application for and delivery of permits and licenses. This is extremely relevant within the Malagasy context. |
26
Tailings
Additional work required during detailed design of the TSF and adjacent RWD is as follows:
| · | The full rheology and beaching characteristics for the tailings are not known which leaves uncertainties regarding the optimum deposition design. This will need to be investigated via large scale tests once suitably sized pilot process plant samples are available. It should be noted that such large scale tests will also provide additional more representative samples which can be used to carry out further testing of other tailings characteristics, such as consolidation, permeability and shear strength, which should be used to validate / revise the assumptions made for the stability assessments, seepage / drainage assessments and water balance |
| · | The geotechnical investigation was carried out for the general TSF area only, and was not focused on the specific design elements as the location of these was not known at the time. Additional focused geotechnical investigations will be required to confirm the geotechnical conditions at specific locations |
| · | The depth to groundwater is not known in the immediate vicinity of the RWD. In the event that ground water is shallow, it may not be possible to excavate the RWD basin to the required depth without employing dewatering measures, or alternatively constructing an additional RWD downstream. The depth to groundwater and any seasonal fluctuations will need to be investigated by installation of a groundwater monitoring borehole, which must be monitored during the wet season |
| · | Water quality data is required over a period of time to provide a baseline for comparison once the TSF is commissioned. To provide the necessary baseline data, regular ground and surface water monitoring must be carried out leading up to the date when the TSF is commissioned |
| · | The overall design will need to be developed to a level required for construction and to optimize the design with regard to technical, environmental and economic considerations, whilst taking due cognizance of additional information made available, including the additional studies detailed” |
Graphite Market and Pricing
Market Overview
Energizer engaged Roskill to compile a report on markets for natural graphite up to 2020 which report was completed in January 2015. This market summary is to a large extent based on the Roskill report.
Graphite consumption comprises three different product lines, namely synthetic graphite, natural amorphous graphite and natural flake graphite. Price is often the major deciding factor in choosing between natural flake and synthetic, although each also has specific characteristics which need to be considered for a particular application. For example in the production of lithium-ion anode materials, natural flake graphite may be chosen due to price although synthetic graphite may be more suitable in some formulations.
In those applications where they compete, synthetic graphite prices are higher than natural graphite prices due essentially to higher production costs. This is somewhat offset by the purification cost to raise most natural graphite to sufficient purity. It is estimated that in 2013, the difference between comparable synthetic and natural grades was US$1,000 per tonne. Amorphous graphite is used in such applications as the refractories industry, as recarburisers, in brake linings, gaskets and clutch materials and in foundries in mould wash.
Natural Graphite is graded into 3 forms: Flake, Amorphous and Lump. A majority of the world’s graphite supply is amorphous (fine or powder) and is used for traditional purposes such as automotive and steel making. Flake graphite is essential for producing batteries, specifically lithium-ion, and for use in consumer electronics. The Molo Graphite Project contains flake graphite. Flake graphite prices are a function of 2 factors - flake size and purity - with large flake (+80 mesh), high Carbon (+94%) varieties commanding premium pricing. Like uranium, there is a posted price for graphite which provides a guideline with respect to longer term trends but transactions are largely based on direct negotiations between the buyer and seller.
World Estimated Consumption of Natural and Synthetic Graphite 2013 (1,000 tonne)
|
Category
|
Natural Graphite
|
(of which Natural Flake Graphite)
|
Synthetic Graphite
|
Total
|
|
Electrodes
|
-
|
-
|
860
|
860
|
|
Refractories
|
511
|
335
|
-
|
511
|
|
Lubricants
|
50
|
12
|
100
|
150
|
|
Foundries
|
133
|
80
|
-
|
133
|
|
Graphite shapes1
|
12
|
1-
|
105
|
117
|
|
Batteries
|
74
|
74
|
27
|
101
|
|
Friction Products
|
53
|
22
|
-
|
53
|
|
Others
|
1352
|
53
|
5203
|
655
|
|
Total
|
968
|
586
|
1,612
|
2,580
|
|
Source: Roskill estimates
|
||||
Notes:
| 1 | Including carbon brushes. |
| 2 | Including 35,000t of amorphous graphite in decarburising. |
| 3 | Mainly consumption in re-carburisers, but also in foundries, friction materials and refractories. |
27
Natural flake graphite is consumed in refractories, foundry applications, batteries, as battery additives, in fuel cells, friction products, lubricants, shapes and expandable graphite.
In 2013, production of natural flake graphite totaled 427,300 tonnes. Output of flake graphite reached a peak of some 500 000 tonnes in 2012, of which 60% originated in China. Other significant producers of flake graphite are Brazil, India, Canada and Norway. The table below illustrates production of flake graphite worldwide and the dominance of Asian, more specifically Chinese, production.
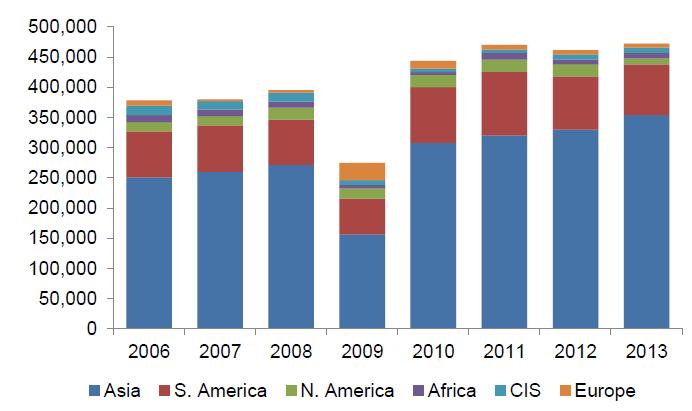
Chinese flake graphite production is currently fragmented and includes a significant number of small operations with 10 000 tonne per annum capacity or less. A process of consolidation is underway, which began in Inner Mongolia during 2010 and started in Shandong and Heilongjiang during 2014. This will create new industry giants in the country situated in these three centers.
Several foreign companies have invested in China, in order to secure supplies. Many existing Chinese mines are coming to the end of their working lives and a number outside China have become exhausted in recent years.
A number of new flake graphite projects that are under development will increase capacity outside China in the coming years. In a recent development a Canadian graphite project announced a significant off take agreement with a Chinese industrial conglomerate of 40,000 tonne, suggesting that security of supply is becoming increasingly important to manufacturers in China, as well as in the rest of the world.
Apart from China, capacity is concentrated in Brazil and India but is also present in a number of other countries. Of these, the leading producer is Nacional de Grafite of Brazil, which has at least 75,000 tonnes per annum of capacity.
Natural graphite production is forecast to grow by 5.4% per annum in the years to 2020 as growing demand for flake graphite drives expansions and new product development. This estimate includes established projects realizing production on their announced timeline. A total of 188,500t of new capacity could come on stream by 2020, however, more realistically this total will be in the region of 100,000t, which would provide a lower CAGR of 3% per annum. This assumes no increase in production in China, due to on-going consolidation. Production of high-purity natural graphite will continue to be concentrated in China.
28
There is currently significant overcapacity in the synthetic graphite market as well as increasing competition from new plants in China, India and Russia. Producers will be able to increase supply to meet likely increases in demand.
A large amount of graphite exploration has been carried out over the last five years as concerns grew over a potential future tightness/shortage of supply. Development of new capacity is focused on high grade, large flake deposits, driven by growing demand from both the traditional markets of refractories and brake linings, and from the emerging, and rapidly growing, markets of lithium-ion batteries and expandable / expanded graphite.
By 2016, many of the prospective new projects had seen little progress and only a handful have reached pre-feasibility.
Broadly speaking graphite prices increase with flake size and carbon content. In practice other factors come into play and the price will depend on the location of the supplier and purchaser and the logistics involved, the agreed contract type and length, graphite specifications as well as underlying production and processing costs.
Published flake graphite prices for fine, medium and large flake sizes are shown in the graph below (average of all carbon grades), illustrating the price premium by size. After the price hike in 2011, and decline in 2012 to 2014, prices have stabilized in 2015.
Average Prices of Flake Graphite by Flake Size, 2003 to 2014
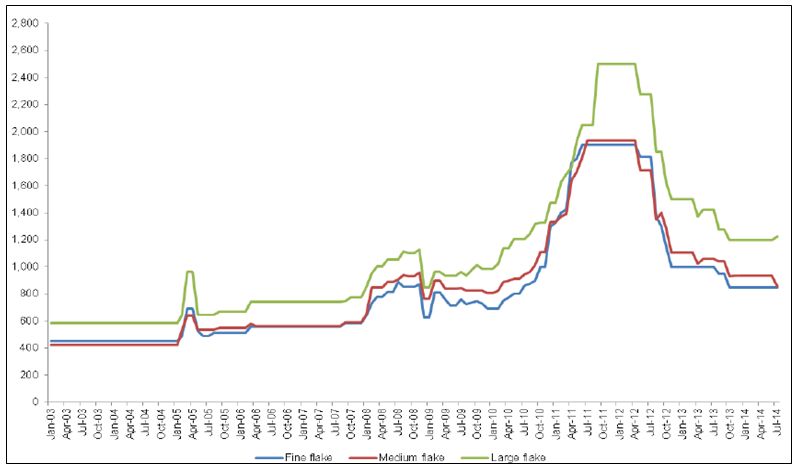
Source: Industrial Minerals, Asian Metal, Industry sources.
Overall natural flake graphite prices are expected to recover in line with, and above, economic activity. The level of price recovery overall will depend on degree of consolidation in the Chinese flake graphite industry and its impact and the recovery and production levels in the steel industry.
Mining projects are commonly evaluated using two or three year trailing averages. However, the significant price spike in 2011 and 2012 distorts the picture such that historic averages are not representative. The subsequent fall of graphite prices means that the historic averages are higher than current prices. Prices have been relatively stable during 2014 and 2015 and have now started to see some upward pressure. It is therefore assumed that this represents the bottom of the market.
29
The conclusion that this is the bottom of the market also takes into account the consolidation of the Chinese natural flake graphite sector over the next two to three years, which may constrict supply, the closure of a North American mine in 2013, and the forecast growth in demand. These combined factors should eliminate any further downside in prices from the present levels, and present opportunities for further growth. Capital and operation costs are also rising, which in the medium to longer term will eliminate more marginal producers, and keep the outlook for graphite prices healthy.
For medium and large flake sized material, new supply is not expected on stream in 2015 to step into any shortfalls from Chinese production restrictions, which could put some upward pressure on pricing levels, especially in Europe. This could cause short term fluctuations of $200-300 per tonne around the average growth rates, or even as much as $400 per tonne for jumbo flakes. In mid-2016, new scheduled production from Mozambique having a significant proportion of larger flake could replace a portion of Chinese material. From 2017 onwards, the effects of the consolidation process are expected to be largely complete and the Chinese industry reorganised into much larger enterprises.
For fine flake material of 90-96%, graphite prices are expected to rise just above economic activity, especially in refractories, foundries and crucibles markets which represent most of the volume. This material is also not expected to see quite the same upward price pressure in 2016.
Chinese FOB flake graphite prices are expected to increase with production costs and supply restrictions within the country, especially for larger flake sizes in 2015 and potentially in 2016. This will maintain or even raise price levels during a period when there is predicted slowdown in growth in the Chinese industry and household purchasing index.
Permitting in Madagascar
Companies in Madagascar first apply for an exploration mining permit with the Bureau de Cadastre Minier de Madagascar (“BCMM”), a government agency falling under the authority of the Minister of Mines. Permits are granted under usual circumstances are generally issued within a month. The 2014 fees per square within a mining permit range from approximately 92,500 Ariary to 500,000 Ariary (between $35 and $194 using a current exchange rate of 2,580 Madagascar Ariary = $1 USD). The number of squares varies widely by claim number. For the 2014 year, the Company paid approximately $400,000 to the BCMM to renew all of its claims in Madagascar. This fee covered both the 100% owned Green Giant Property (6 claims) and the Molo Graphite Property (39 claims). Each year the Company is required to pay a similar amount in order to maintain the claims in good standing.
The next step in the permitting process, which our Company has initiated, is to apply for an exploitation permit. Our company has engaged a third party environmental study company in Madagascar to assist us with this process. In order to get an exploitation permit, an investment plan, exploitation work plan budget and specific ground mapping is submitted to the BCMM. This step is completed in conjunction with a submission of an Environmental and Social Impact Assessment (“ESIA”), which was submitted on January 30, 2015. This environmental impact study includes, among other things, completion of a water study and a social impact study.
QA/QC Protocols
At all times during sample collection, storage, and shipment to the laboratory facility, the samples are in the control of our Company or parties that we have contracted to act as our agents.
When sufficient sample material (grab, trench or core) has been collected, the samples are flown or sent by truck to our storage location in Antananarivo, Madagascar. At all times samples are accompanied by an employee, consultant or agent of our Company. From there, samples are shipped to labs either in South Africa or Canada for ICP-MS analysis.
All analytical results are e-mailed directly by the lab to the Company’s project manager on site in Madagascar and to our company’s geological and executive staff. Results are also posted on a secure website and downloaded by our company’s personnel using a secure username and password. All of the labs that carried out the sampling and analytical work are independent of our company.
In order to carry out QA/QC protocols on the assays, blanks, standards and duplicates were inserted into the sample streams. This was done once in every 30 samples, representing an insertion rate of 3.33% of the total.
30
Since the 2009 Madagascar drill program, our company has rigorously implemented a blank protocol. For the Molo Graphite Deposit a fine-grained quartz sand sourced from a hardware store in Antananarivo was used as the blank material for the sampling campaign. A total of 208 blank samples were used in this program. A detection limit of 0.05% Carbon was used for the purpose of this exercise. To verify the reliability of the blank samples, the detection limit and the blank + 2, and 3 times the detection limit were plotted against the date. The plot shows that there are a lot of blank samples that have concentrations that exceed the blank + 3 times detection limit threshold. This, coupled with the large spread of data points, would lead to the assumption that samples may have been contaminated during their preparation for analysis.
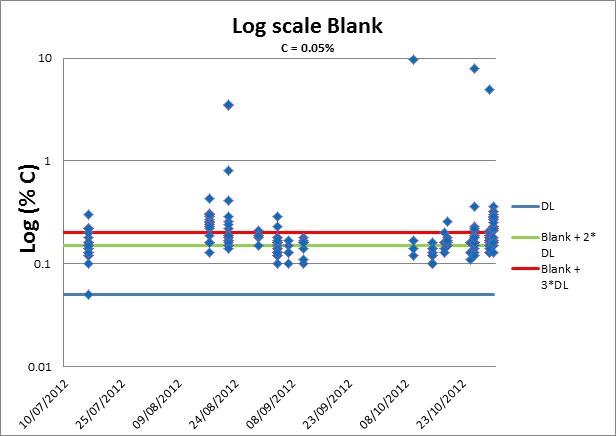
Blanks plot – Log %C versus the date of the analysis.
Since certified reference materials (“CRMs”) are essentially non-existent for graphite, our Company commissioned a third party lab in Canada to create a CRM from the remaining Molo Graphite Deposit drill core pulps from the 2011 program. As certified the third party lab standard (STD 1 C) a recommended value of 9.11 % Carbon.
To check the reliability of the standard, a plot of the recommended CRM value versus date was created. The upper and lower limits of one, two and three times the standard deviations of the recommended value are also included in the plot. All the results except for two fall within the acceptable limit of two times the standard deviation. It is however worth noting that there seems to be a negative bias towards lower concentrations in the first batch of samples that were submitted. As the campaign progressed the bias leant towards the positive side. This issue appears to have been sorted out towards the latter parts of the campaign as the data becomes less spread, and is closer to the recommended value.
31
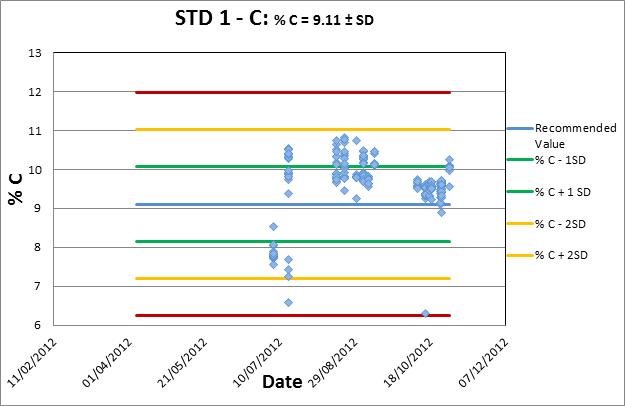
Graph showing carbon concentration as analyzed in STD 1C.
For the Molo Graphite Deposit, 205 field duplicates were prepared. To check how close these were to the original samples, a plot of the original samples with a zero, five, and ten per cent difference of the original samples was created. The majority of the samples were within the 10% difference limit. The plot also shows a good correlation between the original value and the duplicate, as is evident from the regression line with an R2 value of 0.96.
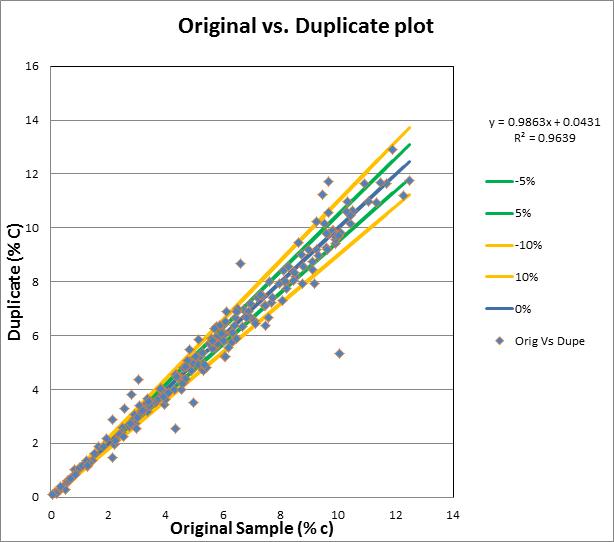
Original (“Orig”) versus Duplicate (“Dupe”) plots.
Milestones
We are pursuing negotiations in respect of potential off-take agreements with graphite end-users and intermediaries with the intention of securing project financing alternatives, which may include debt, equity and derivative instruments. Discussions in respect of these matters have been ongoing for the past 24 months and are expected to continue during the coming months with no assurances as to the conclusion or results of these discussions.
In July 2016, we appointed UK-based HCF International Advisers Limited ("HCF") as advisor in negotiating and structuring strategic partnerships, off take agreements and debt financing for its Molo Graphite project.
32
In August 2016, we initiated a Front End Engineering Design Study (the “FEED Study”) for the Company's Molo graphite project in Madagascar. The FEED Study is being undertaken in order to determine potential development path options that have been presented to the Company by prospective strategic partners.
Our management continues to assess project optimization strategies with the intention of reducing the capital and operating costs relating to the Molo Graphite Property with no assurances as to the conclusion and results of these assessments.
Future Plans
With the completion of the Molo Feasibility Study, potential financiers and strategic partners have been approached, and the Company is seeking funding for the development of the Molo Deposit into a mine. In parallel, the Company has initiated a FEED Study, which is anticipated to continue through to the end of October, 2016.
33
Green Giant Project, Southern Madagascar, Africa
During 2007, we acquired a 75% interest in the property. We paid $765,000, issued 2,500,000 common shares and 1,000,000 now expired common share purchase warrants to enter into a joint venture agreement for the Green Giant Property with Madagascar Minerals and Resources Sarl ("MMR"). On July 9, 2009, we acquired the remaining 25% interest for $100,000. MMR retains a 2% NSR. The NSR can be purchased at our option, for $500,000 in cash or common shares for the first 1% NSR and at a price of $1,000,000 in cash or common shares for the second 1% NSR.
The Green Giant project comprises claims located in south‐central Madagascar located in the UTM zone 38S on the WGS 84 datum at coordinates 510,000 E 7,350,000 N, 145 km southeast of the city of Toliara, in the Tulear region/Fotadrevo, covering an area of 225 km2 situated in two separate blocks. The property is composed of two separate groups of four and two Research Permits respectively.
The discovery of potentially economic vanadium mineralization on the property changed the focus of the 2008 diamond‐drilling program. Through a combination of prospecting, ground based scintillometer surveying, and analysis of a published airborne radiometric survey, five extensive vanadium‐bearing trends were identified during the 2008 exploration program. These vanadiferous trends are theorized to have formed in a black shale or paleo‐roll‐front environment before being subjected to regional granulite facies metamorphism.
Energizer selected the Jaky and Manga vanadium‐bearing trend as the most prospective targets on the property and focus the late 2009‐drill program at delineating mineralized material on these two deposits. Various metallurgical scoping test programs have been completed since Q4 2009, covering physical and chemical pre-concentration processes, acid and alkaline leaching (atmospheric and pressure), alkaline salt roasting and high definition mineralogical characterization. Mineralogical characterization of several silicate samples has revealed a unique deportment of vanadium at Green Giant. Vanadium bearing minerals include clays, micas, oxides, and sulphides.
The mineral deposits on this property have been divided into three separate zones, which are referred to as the Jaky, Manga, and Mainty deposits. The vanadium deposits on the Green Giant property are split into two separate categories: oxide and primary. The mineralization analysis utilized 18,832 m of diamond drill hole data from the 2008, 2009, and 2010 drill programs and was supplemented by approximately 5,928 m of trench data from the 2008 and 2009 exploration programs.
Since early 2012, the Company has focused its efforts on the Molo Project and as such only minimal work has been completed on the property since that time.
Sagar Property, Labrador Trough Region, Quebec, Canada
In 2006, the Company purchased from Virginia Mines Inc. ("Virginia") a 100% interest in 382 claims located in northern Quebec, Canada. Virginia retains a 2% net smelter return royalty ("NSR") on certain claims within the property. Other unrelated parties also retain a 1% NSR and a 0.5% NSR on certain claims within the property, of which half of the 1% NSR can be acquired by the Company by paying $200,000 and half of the 0.5% NSR can be acquired by the Company by paying $100,000.
On February 28, 2014, the Company signed an agreement to sell a 35% interest in the Sagar property to Honey Badger Exploration Inc. (“Honey Badger”), a public company that is a related party through common management. The terms of the agreement were subsequently amended on July 31, 2014 and again on May 8, 2015. To earn the 35% interest, Honey Badger was required to complete a payment of $36,045 (CAD$50,000) by December 31, 2015, incur exploration expenditures of $360,450 (CAD$500,000) by December 31, 2016 and issue 20,000,000 common shares to the Company by December 31, 2015. Honey Badger did not complete the earn-in requirements by December 31, 2015 resulting in the termination of the option agreement.
34
ITEM 1A. – RISK FACTORS
The risk factors required pursuant to Regulation S-K, Item 503(c) are not required for smaller reporting companies. Accordingly, the Company has determined to provide particular risk factors at this time.
Our business is subject to a variety of risks and uncertainties, including, but not limited to, the risks and uncertainties described below. If any of the risks described below, or elsewhere in this report on Form 10-K, or our Company’s other filings with the Securities and Exchange Commission (the "SEC"), were to occur, our financial condition and results of operations could suffer and the trading price of our common stock could decline. Additionally, if other risks not presently known to us, or that we do not currently believe to be significant, occur or become significant, our financial condition and results of operations could suffer and the trading price of our common stock could decline. Our risk factors, including but not limited to the risk factors listed below, are as follows:
SHOULD ONE OR MORE OF THE FOREGOING RISKS OR UNCERTAINTIES MATERIALIZE, OR SHOULD THE UNDERLYING ASSUMPTIONS OF OUR BUSINESS PROVE INCORRECT, ACTUAL RESULTS MAY DIFFER SIGNIFICANTLY FROM THOSE ANTICIPATED, BELIEVED, ESTIMATED, EXPECTED, INTENDED OR PLANNED.
The report of our independent registered public accounting firm contains explanatory language that substantial doubt exists about our ability to continue as a going concern.
The independent auditor’s report on our financial statements contains explanatory language that substantial doubt exists about our ability to continue as a going concern. Due to our lack of operating history and present inability to generate revenues, we have sustained operating losses since our inception.
Since our inception, up to June 30, 2016, we had accumulated net losses of $93,960,748. If we are unable to obtain sufficient financing in the near term as required or achieve profitability, then we would, in all likelihood, experience severe liquidity problems and may have to curtail our operations. If we curtail our operations, we may be placed into bankruptcy or undergo liquidation, the result of which will adversely affect the value of our common shares.
We may not have access to sufficient capital to pursue our business and therefore would be unable to achieve our planned future growth.
We intend to pursue a strategy that includes development of our Company’s business plan. Currently we have limited capital, which is insufficient to pursue our plans for development and growth. Our ability to implement our Company’s plans will depend primarily on our ability to obtain additional private or public equity or debt financing. Such financing may not be available, or we may be unable to locate and secure additional capital on terms and conditions that are acceptable to us. Financing exploration plans through equity financing will have a dilutive effect on our common shares. Our failure to obtain additional capital will have a material adverse effect on our business.
Dependence on One Mineral Project
Our only material mineral property is the Molo Graphite Project. As a result, unless we acquire or develop any additional material properties or projects, any adverse developments affecting this project or our rights to develop this property could materially adversely affect our business, financial condition and results of operations.
Our primary exploration efforts are in the African country of Madagascar, where a new government has been in place since early 2014.
Any adverse developments to the political situation in Madagascar could have a material effect on the Company’s business, results of operations and financial condition. Democratic elections in Madagascar occurred toward the end of 2013 as planned by the elections calendar jointly established between the UN and the Elections Commission. To date, the Company has not experienced any disruptions or been placed under any constraints in our exploration efforts due to the political situation in Madagascar. Depending on future actions taken by the newly elected government, or any future government, the Company’s business operations could be impacted.
The newly elected President was inaugurated on January 25, 2014 and the lower house of Parliament took office in February 2014. A government reshuffle occurred in early 2015, with the naming of a new Prime Minister on January 14, 2015. Ministers composing the new government were named on January 25, 2015. On May 26, 2015, the Parliament voted to impeach the President on the grounds that he had violated the Constitution. The High Constitutional Court invalidated the claim, declaring the accusation unfounded. The President, the Government and the Parliament continue to operate as before.
35
The Company is actively monitoring the political climate in Madagascar and continues to hold meetings with representatives of the government and the Ministry attached to the Presidency in charge of Mining. The transformation or amendment of exploration and research mining permits within the country continues to be suspended, including the transfer and status of the Molo Graphite Project permit. Additionally, this permit expired in 2011 and has not been renewed despite our efforts to do so. The Company has continued to pay taxes and administrative fees in Madagascar with respect to our mining permits including the permit relating to the Molo Graphite Project (although such permit is not in the Company’s name). These payments have been acknowledged and accepted by the Madagascar government. Further, in order to advance the Molo Graphite Project, the current permit will need to be converted into an exploration permit in the name of the Company or one of its subsidiaries. The Company cannot provide any assurance as to the timing of the receipt of the required permits.
Our common shares have been subject to penny stock regulation in the United States of America.
Our common shares have been subject to the provisions of Section 15(g) and Rule 15g-9 of the (US) Securities Exchange Act of 1934, as amended (the “Exchange Act”), commonly referred to as the “penny stock” rule. Section 15(g) sets forth certain requirements for transactions in penny stocks and Rule 15g-9(d)(1) incorporates the definition of penny stock as that used in Rule 3a51-1 of the Exchange Act. The Commission generally defines penny stock to be any equity security that has a market price less than US$5.00 per share, subject to certain exceptions. Rule 3a51-1 provides that any equity security is considered to be penny stock unless that security is: registered and traded on a national securities exchange meeting specified criteria set by the Commission; issued by a registered investment company; excluded from the definition on the basis of price (at least US$5.00 per share) or the registrant’s net tangible assets; or exempted from the definition by the Commission. If our common shares are deemed to be “penny stock”, trading in common shares will be subject to additional sales practice requirements on broker/dealers who sell penny stock to persons other than established customers and accredited investors.
Financial Industry Regulatory Authority, Inc. (“FINRA”) sales practice requirements may limit a shareholder’s ability to buy and sell our common shares.
In addition to the “penny stock” rules described above, FINRA has adopted rules that require that in recommending an investment to a client, a broker-dealer must have reasonable grounds for believing that the investment is suitable for that client. Prior to recommending speculative low priced securities to their non-institutional clients, broker-dealers must make reasonable efforts to obtain information about the client’s financial status, tax status, investment objectives and other information. Under interpretations of these rules, FINRA believes that there is a high probability that speculative low priced securities will not be suitable for at least some clients. FINRA requirements make it more difficult for broker-dealers to recommend that their clients buy our common shares, which may limit your ability to buy and sell our stock and have an adverse effect on the market for our shares.
As a public company we are subject to complex legal and accounting requirements that will require us to incur significant expenses and will expose us to risk of non-compliance.
As a public company, we are subject to numerous legal and accounting requirements in both Canada and the United States of America that do not apply to private companies. The cost of compliance with many of these requirements is material, not only in absolute terms but, more importantly, in relation to the overall scope of the operations of a small company. Our relative inexperience with these requirements may increase the cost of compliance and may also increase the risk that we will fail to comply. Failure to comply with these requirements can have numerous adverse consequences including, but not limited to, our inability to file required periodic reports on a timely basis, loss of market confidence, delisting of our securities and/or governmental or private actions against us. We cannot assure you that we will be able to comply with all of these requirements or that the cost of such compliance will not prove to be a substantial competitive disadvantage compared to privately held and larger public competitors.
Compliance with changing regulation of corporate governance and public disclosure will result in additional expenses and pose challenges for our management.
Changing laws, regulations and standards relating to corporate governance and public disclosure, including the Dodd-Frank Wall Street Reform and Consumer Protection Act and the rules and regulations promulgated thereunder, the Sarbanes-Oxley Act and SEC regulations, have created uncertainty for public companies and significantly increased the costs and risks associated with accessing the U.S. public markets. Our management team needs to devote significant time and financial resources to comply with both existing and evolving standards for public companies, which will lead to increased general and administrative expenses and a diversion of management time and attention from revenue generating activities to compliance activities.
36
Changes in tax laws or tax rulings could materially affect our financial position and results of operations.
Changes in tax laws or tax rulings could materially affect our financial position and results of operations. For example, the current U.S. administration and key members of Congress have made public statements indicating that tax reform is a priority. Certain changes to U.S. tax laws, including limitations on the ability to defer U.S. taxation on earnings outside of the United States until those earnings are repatriated to the United States, could affect the tax treatment of our foreign earnings. In addition, many countries in the European Union, as well as a number of other countries and organizations such as the Organization for Economic Cooperation and Development, are actively considering changes to existing tax laws. Certain proposals could include recommendations that would significantly increase our tax obligations in many countries where we do business. Due to the large and expanding scale of our international business activities, any changes in the taxation of such activities may increase our worldwide effective tax rate and harm our financial position and results of operations.
Because we are quoted on the OTCQB instead of a national securities exchange in the United States, our U.S. investors may have more difficulty selling their stock or experience negative volatility on the market price of our stock in the United States.
In the United States, our common shares are quoted on the OTCQB. The OTCQB is marketed as an electronic exchange for high growth and early stage U.S. companies and a prospective “final step toward a NASDAQ or NYSE listing” (although no assurances can be provided that such change of market shall occur). Trades are settled and cleared in the U.S. similar to any NASDAQ or NYSE stock and trade reports are disseminated through Yahoo, Bloomberg, Reuters, and most other financial data providers. The OTCQB may be significantly illiquid, in part because it does not have a national quotation system by which potential investors can follow the market price of shares except through information received and generated by a limited number of broker-dealers that make markets in particular stocks. There is a greater chance of volatility for securities that trade on the OTCQB as compared to a national securities exchange in the United States, such as the New York Stock Exchange, the NASDAQ Stock Market or the NYSE Amex. This volatility may be caused by a variety of factors, including the lack of readily available price quotations, the absence of consistent administrative supervision of bid and ask quotations, lower trading volume, and market conditions. U.S. investors in our common shares may experience high fluctuations in the market price and volume of the trading market for our securities. These fluctuations, when they occur, have a negative effect on the market price for our common shares. Accordingly, our U.S. shareholders may not be able to realize a fair price from their shares when they determine to sell them or may have to hold them for a substantial period of time until the market for our common shares improves.
In addition to being quoted on the OTCQB, our common shares trade on the Toronto Stock Exchange, Canada’s national stock exchange, under the symbol EGZ and on the Frankfurt Exchange under the symbol A1CXW3.
The market price for our common shares is particularly volatile given our status as a relatively unknown company with a small and thinly traded public float, limited operating history and lack of profits which could lead to wide fluctuations in our share price.
The market for our common shares is characterized by significant price volatility when compared to seasoned issuers, and we expect that our share price will continue to be more volatile than a seasoned issuer. The volatility in our share price is attributable to a number of factors. First our common shares, at times, are thinly traded. As a consequence of this lack of liquidity, the trading of relatively small quantities of shares by our shareholders may disproportionately influence the price of those shares in either direction. The price for our shares could, for example, decline precipitously in the event that a large number of our common shares are sold on the market without commensurate demand, as compared to a seasoned issuer which could better absorb those sales without adverse impact on its share price. Second, we are a speculative or “risky” investment due to our limited operating history, lack of profits to date and uncertainty of future market acceptance for our potential products. As a consequence, more risk-adverse investors may, under the fear of losing all or most of their investment in the event of negative news or lack of progress, be more inclined to sell their shares on the market more quickly and at greater discounts than would be the case with the stock of a seasoned issuer. Many of these factors are beyond our control and may decrease the market price of our common shares, regardless of our performance. We cannot make any predictions as to what the prevailing market price for our common shares will be at any time or as to what effect that the sale of shares or the availability of common shares for sale at any time will have on the prevailing market price.
37
Shareholders should be aware that, according to SEC Release No. 34-29093, the market for penny stocks has suffered in recent years from patterns of fraud and abuse. Such patterns include control of the market for the security by one or a few broker-dealers that are often related to the promoter or issuer; manipulation of prices through prearranged matching of purchases and sales and false and misleading press releases; boiler room practices involving high-pressure sales tactics and unrealistic price projections by inexperienced sales persons; excessive and undisclosed bid-ask differential and markups by selling broker-dealers; and the wholesale dumping of the same securities by promoters and broker-dealers after prices have been manipulated to a desired level, along with the resulting inevitable collapse of those prices and with consequent investor losses. Our management is aware of the abuses that have occurred historically in the penny stock market. Although we do not expect to be in a position to dictate the behavior of the market or of broker-dealers who participate in the market, management will strive within the confines of practical limitations to prevent the described patterns from being established with respect to our securities. The occurrence of these patterns or practices could increase the volatility of our share price.
Volatility in our common share price may subject us to securities litigation, thereby diverting our resources that may have a material effect on our profitability and results of operations.
The market for our common shares is characterized by significant price volatility when compared to seasoned issuers, and we expect that our share price will continue to be more volatile than a seasoned issuer for the indefinite future. In the past, plaintiffs have often initiated securities class action litigation against a company following periods of volatility in the market price of its securities. We may in the future be the target of similar litigation. This type of litigation could result in substantial costs and could divert management’s attention and resources.
Failure to achieve and maintain effective internal controls in accordance with Section 404 of the Sarbanes-Oxley Act of 2002 (the “Sarbanes-Oxley Act”) could have a material adverse effect on our business and our operating results.
If we fail to comply with the requirements of Section 404 of the Sarbanes-Oxley Act regarding internal control over financial reporting or to remedy any material weaknesses in our internal controls that we may identify, such failure could result in material misstatements in our financial statements, cause investors to lose confidence in our reported financial information and have a negative effect on the trading price of our common shares.
Pursuant to Section 404 of the Sarbanes-Oxley Act and current SEC regulations, we are required to prepare assessments regarding internal controls over financial reporting. In connection with our on-going assessment of the effectiveness of our internal control over financial reporting, we may discover “material weaknesses” in our internal controls as defined in standards established by the Public Company Accounting Oversight Board, or the PCAOB. A material weakness is a significant deficiency, or combination of significant deficiencies, that results in more than a remote likelihood that a material misstatement of the annual or interim financial statements will not be prevented or detected. The PCAOB defines “significant deficiency” as a deficiency that results in more than a remote likelihood that a misstatement of the financial statements that is more than inconsequential will not be prevented or detected. In the event that a material weakness is identified, we will employ qualified personnel and adopt and implement policies and procedures to address any material weaknesses that we identify. However, the process of designing and implementing effective internal controls is a continuous effort that requires us to anticipate and react to changes in our business and the economic and regulatory environments and to expend significant resources to maintain a system of internal controls that is adequate to satisfy our reporting obligations as a public company. We cannot assure you that the measures we will take will remediate any material weaknesses that we may identify or that we will implement and maintain adequate controls over our financial process and reporting in the future.
Our CEO and Principal Financial and Accounting Officer, concluded that our disclosure controls and procedures were effective as of June 30, 2016.
A failure remediate any material weaknesses that we may identify or to implement new controls, or difficulties encountered in their implementation, could harm our operating results, cause us to fail to meet our reporting obligations or result in material misstatements in our financial statements. Any such failure could adversely affect the results of the management evaluations of our internal controls. Inadequate internal controls could also cause investors to lose confidence in our reported financial information, which could have a negative effect on the trading price of our common shares.
38
Should we lose the services of our key executives, our financial condition and proposed expansion may be negatively impacted.
We depend on the continued contributions of our executive officers to work effectively as a team, to execute our business strategy and to manage our business. The loss of key personnel, or their failure to work effectively, could have a material adverse effect on our business, financial condition, and results of operations. Specifically, we rely on Craig Scherba, our President and Chief Executive Officer and Marc Johnson, our Chief Financial Officer.
We do not maintain key man life insurance. Should we lose any or all of their services and we are unable to replace their services with equally competent and experienced personnel, our operational goals and strategies may be adversely affected, which will negatively affect our potential revenues.
Minnesota law and our articles of incorporation protect our directors from certain types of lawsuits, which could make it difficult for us to recover damages from them in the event of a lawsuit.
Minnesota law provides that our directors will not be liable to our Company or to our stockholders for monetary damages for all but certain types of conduct as directors. Our articles of incorporation require us to indemnify our directors and officers against all damages incurred in connection with our business to the fullest extent provided or allowed by law. The exculpation provisions may have the effect of preventing stockholders from recovering damages against our directors caused by their negligence, poor judgment or other circumstances. The indemnification provisions may require our Company to use its assets to defend our directors and officers against claims, including claims arising out of their negligence, poor judgment, or other circumstances.
Due to the speculative nature of mineral property exploration, there is substantial risk that our assets will not go into commercial production and our business will fail.
Exploration for minerals is a speculative venture involving substantial risk. We cannot provide investors with any assurance that our claims and properties will ever enter into commercial production. The exploration work that we intend to conduct on our claims or properties may not result in the commercial production of graphite, vanadium, gold, uranium, or other minerals. Problems such as unusual and unexpected rock formations and other conditions are involved in mineral exploration and often result in unsuccessful exploration efforts. In such a case, we would be unable to complete our business plan.
We are a mineral exploration company with a limited operating history and expect to incur operating losses for the foreseeable future.
We are a mineral exploration company. We have not earned any revenues and we have not been profitable. Prior to completing exploration on our claims, we may incur increased operating expenses without realizing any revenues. There are numerous difficulties normally encountered by mineral exploration companies, and these companies experience a high rate of failure. The likelihood of success must be considered in light of the problems, expenses, difficulties, complications and delays encountered in connection with the exploration of the mineral properties that we plan to undertake. These potential problems include, but are not limited to, unanticipated problems relating to exploration and additional costs and expenses that may exceed current estimates. We have no history upon which to base any assumption as to the likelihood that our business will prove successful, and we can provide no assurance to investors that we will generate any operating revenues or ever achieve profitable operations.
Because of the inherent dangers involved in mineral exploration, there is a risk that we may incur liability or damages as we conduct our business.
The search for valuable minerals involves numerous hazards. As a result, we may become subject to liability for such hazards, including pollution, cave-ins and other hazards against which we cannot, or may elect not, to insure against. We currently have no such insurance, but our management intends to periodically review the availability of commercially reasonable insurance coverage. If a hazard were to occur, the costs of rectifying the hazard may exceed our asset value and cause us to liquidate all our assets.
We can provide no assurance that we will be able to successfully bring our claims or interests into commercial production.
We will require significant additional funds in order to place the claims and interests into commercial production. This may occur for a number of reasons, including because of regulatory or permitting difficulties, because we are unable to obtain any adequate funds or because we cannot obtain such funds on terms that we consider economically feasible.
39
Because access to our properties may be restricted by inclement weather or proper infrastructure, our exploration programs are likely to experience delays.
Access to most of the properties underlying our claims and interests is restricted due to their remote locations and because of weather conditions. Some of our properties are only accessible by air. As a result, any attempts to visit, test, or explore the property are generally limited to those periods when weather permits such activities. These limitations can result in significant delays in exploration efforts, as well as mining and production efforts in the event that commercial amounts of minerals are found. This could cause our business to fail.
As we undertake exploration of our claims and interests, we will be subject to the compliance of government regulation that may increase the anticipated time and cost of our exploration program.
There are several governmental regulations that materially restrict the exploration of minerals. We will be subject to the mining laws and regulations in force in the jurisdictions where our claims are located, and these laws and regulations may change over time. In order to comply with these regulations, we may be required to obtain work permits, post bonds, complete environmental assessments and perform remediation work for any physical disturbance to land. While our planned budget for exploration programs includes a contingency for regulatory compliance, there is a risk that new regulations could increase our costs of doing business and prevent us from carrying out our exploration program, or that our budgeted amounts are inadequate.
Our operations are subject to strict environmental regulations, which result in added costs of operations and operational delays.
Our operations are subject to environmental regulations, which could result in additional costs and operational delays. All phases of our operations are subject to environmental regulation. Environmental legislation is evolving in some countries and jurisdictions in a manner that may require stricter standards, and enforcement, increased fines and penalties for non-compliance, more stringent environmental assessments of proposed projects, and a heightened degree of responsibility for companies and their officers, directors, and employees. There is no assurance that any future changes in environmental regulation will not negatively affect our projects.
Our business is subject to U.S. Foreign Corrupt Practices Act and similar worldwide anti-bribery laws, a breach or violation of which could lead to civil and criminal fines and penalties, loss of licenses or permits and reputational harm.
We operate in certain jurisdictions that have experienced governmental and private sector corruption to some degree, and, in certain circumstances, strict compliance with anti-bribery laws may conflict with certain local customs and practices. For example, the U.S. Foreign Corrupt Practices Act and anti-bribery laws in other jurisdictions generally prohibit companies and their intermediaries from making improper payments for the purpose of obtaining or retaining business or other commercial advantage. Our corporate policies mandate compliance with these anti-bribery laws, which often carry substantial penalties. There can be no assurance that our internal control policies and procedures always will protect it from recklessness, fraudulent behavior, dishonesty or other inappropriate acts committed by the Company’s affiliates, employees or agents. As such, our corporate policies and processes may not prevent all potential breaches of law or other governance practices. Violations of these laws, or allegations of such violations, could lead to civil and criminal fines and penalties, litigation, and loss of operating licenses or permits, and may damage the Company’s reputation, which could have a material adverse effect on our business, financial position and results of operations or cause the market value of our common shares to decline.
Mining companies are increasingly required to consider and provide benefits to the communities and countries in which they operate, and are subject to extensive environmental, health and safety laws and regulations.
As a result of public concern about the real or perceived detrimental effects of economic globalization and global climate impacts, businesses generally and large multinational corporations in natural resources industries, face increasing public scrutiny of their activities. These businesses are under pressure to demonstrate that, as they seek to generate satisfactory returns on investment to shareholders, other stakeholders, including employees, governments, communities surrounding operations and the countries in which they operate, benefit and will continue to benefit from their commercial activities. Such pressures tend to be particularly focused on companies whose activities are perceived to have a high impact on their social and physical environment. The potential consequences of these pressures include reputational damage, legal suits, increasing social investment obligations and pressure to increase taxes and royalties payable to governments and communities.
40
In addition, our ability to successfully obtain key permits and approvals to explore for, develop and operate mines and to successfully operate in communities around the world will likely depend on our ability to develop, operate and close mines in a manner that is consistent with the creation of social and economic benefits in the surrounding communities, which may or may not be required by law. Our ability to obtain permits and approvals and to successfully operate in particular communities may be adversely impacted by real or perceived detrimental events associated with our activities or those of other mining companies affecting the environment, human health and safety of communities in which we operate. Delays in obtaining or failure to obtain government permits and approvals may adversely affect our operations, including our ability to explore or develop properties, commence production or continue operations. Key permits and approvals may be revoked or suspended or may be varied in a manner that adversely affects our operations, including our ability to explore or develop properties, commence production or continue operations.
Our exploration, development, mining and processing operations are subject to extensive laws and regulations governing worker health and safety and land use and the protection of the environment, which generally apply to air and water quality, protection of endangered, protected or other specified species, hazardous waste management and reclamation. Some of the countries in which we operate have implemented, and are developing, laws and regulations related to climate change and greenhouse gas emissions. We have made, and expect to make in the future, significant expenditures to comply with such laws and regulations. Compliance with these laws and regulations imposes substantial costs and burdens, and can cause delays in obtaining, or failure to obtain, government permits and approvals which may adversely impact our closure processes and operations.
We have no insurance for environmental problems.
Insurance against environmental risks, including potential liability for pollution or other hazards as a result of the disposal of waste products occurring from exploration and production, has not been available generally in the mining industry. We have no insurance coverage for most environmental risks. In the event of a problem, the payment of environmental liabilities and costs would reduce the funds available to us for future operations. If we are unable to full pay for the cost of remedying an environmental problem, we might be required to enter into an interim compliance measure pending completion of the required remedy.
We do not intend to pay dividends.
We do not anticipate paying cash dividends on our common shares in the foreseeable future. We may not have sufficient funds to legally pay dividends. Even if funds are legally available to pay dividends, we may nevertheless decide, in our sole discretion, not to pay dividends. The declaration, payment and amount of any future dividends will be made at the discretion of our board of directors, and will depend upon, among other things, the results of our operations, cash flows and financial condition, operating and capital requirements, and other factors our board of directors may consider relevant. There is no assurance that we will pay any dividends in the future, and, if dividends are paid, there is no assurance with respect to the amount of any such dividend.
Due to external market factors in the mining business, we may not be able to market any minerals that may be found.
The mining industry, in general, is intensely competitive. Even if commercial quantities of minerals are discovered, we can provide no assurance to investors that a ready market will exist for the sale of these minerals. Numerous factors beyond our control may affect the marketability of any substances discovered. These factors include market fluctuations, the sale price of the minerals, the proximity and capacity of markets and processing equipment, and government regulations, including regulations relating to prices, taxes, royalties, land tenure, land use, mineral importing and exporting and environmental protection. The effect of these factors cannot be accurately predicted, but any combination of these factors may result in our not receiving an adequate return on invested capital.
Our performance may be subject to fluctuations in market prices of any minerals that we find.
The profitability of a mineral exploration project could be significantly affected by changes in the market price of the relevant minerals. A number of factors affect the market prices of minerals. The aggregate effect of the factors affecting the prices of various minerals is impossible to predict with accuracy. Fluctuations in mineral prices may adversely affect the value of any mineral discoveries made on the properties with which we are involved, which may in turn affect the market price and liquidity of our common shares and our ability to pursue and implement our business plan. In addition, the price of both graphite and vanadium can fluctuate significantly on a month-to-month and year-to-year basis.
41
Because from time to time we hold a significant portion of our cash reserves in Canadian dollars, we may experience losses due to foreign exchange translations.
From time to time we hold a significant portion of our cash reserves in Canadian dollars. Due to foreign exchange rate fluctuations, the value of these Canadian dollar reserves can result in translation gains or losses in U.S. dollar terms. If there was a significant decline in the Canadian dollar versus the U.S. dollar, our converted Canadian dollar cash balances presented in U.S. dollars on our balance sheet would significantly decline. If the US dollar significantly declines relative to the Canadian dollar our quoted US dollar cash position would significantly decline as it would be more expensive in US dollar terms to pay Canadian dollar expenses. We have not entered into derivative instruments to offset the impact of foreign exchange fluctuations. In addition, certain of our ongoing expenditures are in South African Rand, Madagascar Ariary and Euros requiring us to occasionally hold reserves of these foreign currencies with a similar risk of foreign exchange currency translation losses.
We are exposed to general economic conditions, which could have a material adverse impact on our business, operating results and financial condition.
Recently there have been adverse conditions and uncertainty in the global economy as the result of unstable global financial and credit markets, inflation, and recession. These unfavorable economic conditions and the weakness of the credit market may continue to have, an impact on our Company’s business and our Company’s financial condition. The current global macroeconomic environment may affect our Company’s ability to access the capital markets may be severely restricted at a time when our Company wishes or needs to access such markets, which could have a materially adverse impact on our Company’s flexibility to react to changing economic and business conditions or carry on our operations.
Climate change and related regulatory responses may impact our business.
Climate change as a result of emissions of greenhouse gases is a current topic of discussion and may generate government regulatory responses in the near future. It is impracticable to predict with any certainty the impact of climate change on our business or the regulatory responses to it, although we recognize that they could be significant. However, it is too soon for us to predict with any certainty the ultimate impact, either directionally or quantitatively, of climate change and related regulatory responses.
To the extent that climate change increases the risk of natural disasters or other disruptive events in the areas in which we operate, we could be harmed. While we maintain rudimentary business recovery plans that are intended to allow us to recover from natural disasters or other events that can be disruptive to our business, our plans may not fully protect us from all such disasters or events.
The current financial environment may impact our business and financial condition that we cannot predict.
The continued instability in the global financial system and related limitation on availability of credit may continue to have an impact on our business and our financial condition, and we may continue to face challenges if conditions in the financial markets do not improve. Our ability to access the capital markets has been restricted as a result of the economic downturn and related financial market conditions and may be restricted in the future when we would like, or need, to raise capital. The difficult financial environment may also limit the number of prospects for potential joint venture, asset monetization or other capital raising transactions that we may pursue in the future or reduce the values we are able to realize in those transactions, making these transactions uneconomic or difficult to consummate.
Public disclosure requirements and compliance with changing regulation of corporate governance pose challenges for our management team and result in additional expenses and costs which may reduce the focus of management and the profitability of our company.
Changing laws, regulations and standards relating to corporate governance and public disclosure, including the Dodd-Frank Wall Street Reform and Consumer Protection Act and the rules and regulations promulgated thereunder, the Sarbanes-Oxley Act and SEC regulations, have created uncertainty for public companies and significantly increased the costs and risks associated with accessing the U.S. public markets. Our management team will need to devote significant time and financial resources to comply with both existing and evolving standards for public companies, which will lead to increased general and administrative expenses and a diversion of management time and attention from revenue generating activities to compliance activities.
42
We will require additional capital in the future and no assurance can be given that such capital will be available on terms acceptable to us or at all.
We will require additional capital in the future and no assurance can be given that such capital will be available on terms acceptable to us or at all. Our currently available funds will not be sufficient to finance the development capital costs of the Molo Graphite Project as disclosed in the Feasibility Study. Accordingly, we will need to raise further equity and/or debt financing to fund development of the Molo Graphite Project. The success and the pricing of any such equity and/or debt financing will be dependent upon the prevailing market conditions at that time, the outcomes of the permitting and development activities or any relevant studies and exploration programs at the Molo Graphite Project. If additional capital is raised by an issue of securities, this may have the effect of diluting stockholders’ interests. Any debt financing, if available, may involve financial covenants which limit our operations. If we cannot obtain such additional capital, we may not be able to complete the development of the Molo Graphite Project which would have a materially adverse effect on our business, operating results and financial condition.
Market Price of Common Shares
Securities of small-cap and mid-cap companies have experienced substantial volatility in the recent past, often based on factors unrelated to the financial performance or prospects of the companies involved. These factors include macroeconomic developments in North America and globally and market perceptions of the attractiveness of particular industries. The price of our common shares is also likely to be significantly affected by short-term changes in graphite prices and demand, the U.S. dollar, the Malagasy ariary, the Canadian dollar, and our financial condition or results of operations as reflected in its financial statements. Other factors unrelated to the performance of our Company that may have an effect on the price of the common shares include the following: the extent of analytical coverage available to investors concerning our business may be limited if investment banks with research capabilities do not follow our Company’s securities; lessening in trading volume and general market interest in our Company’s securities may affect an investor’s ability to trade significant numbers of our common shares; the size of our public float may limit the ability of some institutions to invest in our securities; and a substantial decline in the price of our common shares that persists for a significant period of time could cause our Company’s securities, if listed on an exchange, to be delisted from such exchange, further reducing market liquidity.
As a result of any of these factors, the market price of our common shares at any given point in time may not accurately reflect the long-term value of the Company. Class action litigation often has been brought against companies following periods of volatility in the market price of their securities. We may in the future be the target of similar litigation. Securities litigation could result in substantial costs and damages and divert management’s attention and resources.
Negative Operating Cash Flow
We reported negative cash flow from operations for the year ended June 30, 2016. It is anticipated that we will continue to report negative operating cash flow in future periods, likely until one or more of our mineral properties generate recurring revenues from being placed into production.
Inability to Enforce Legal Rights
Substantially all of our assets are located outside of the United States, in Madagascar. It may not be possible for investors to enforce judgments in the United States against our assets. In addition, many of our directors and officers, and some of the experts named in this document, are residents of Canada or otherwise reside outside the United States, and all or a substantial portion of their assets, are located outside the United States. It may also be difficult for holders of our common shares who reside in the United States to realize in the United States upon judgments of courts of the United States predicated upon our civil liability and the civil liability of our directors, officers and experts under the U.S. federal securities laws.
43
ITEM 1B. – UNRESOLVED STAFF COMMENTS
This Item is not applicable to us as we are not an accelerated filer, a large accelerated filer, or a well-seasoned issuer.
44
ITEM 2. – PROPERTY
The Company’s executive offices are currently located at 520-141 Adelaide Street West, Toronto, Ontario, Canada, M5H 3L5. These offices are leased on a month-to-month basis, and the Company’s current monthly rental payments are approximately CAD $2,000.
See Item 1 – Business, for the description of our material exploration properties.
45
ITEM 3. - LEGAL PROCEEDINGS
The Company was named, jointly and severally with other Corporations that are related parties due to common management, in a Statement of Claim filed in the Province of Ontario on December 15, 2015 by the former Chief Financial Officer for damages for wrongful dismissal. The Company reached a settlement agreement with its former CFO in July 2016, whereby the Company will pay a total severance of USD34,500 (CAD$44,750) through a series of payments.
Except for the above, we are not currently involved in any litigation that we believe could have a material adverse effect on our financial condition or results of operations. There is no action, suit, proceeding, inquiry or investigation before or by any court, public board, government agency, self-regulatory organization or body pending or, to the knowledge of the executive officers of our Company or any of our subsidiaries, threatened against or affecting our company, our common stock, any of our subsidiaries or of our companies or our subsidiaries' officers or directors in their capacities as such, in which an adverse decision could have a material adverse effect.
46
ITEM 4. MINE SAFETY DISCLOSURES
Not applicable.
47
PART II
ITEM 5. MARKET FOR REGISTRANT’S COMMON EQUITY, RELATED STOCKHOLDER MATTERS AND ISSUER PURCHASES OF EQUITY SECURITIES
Market Information
As of September 26, 2016, there were 460,995,711 common shares issued and outstanding and 100,328,860 common shares underlying outstanding options and warrants to purchase, or securities convertible into, our common shares. Our common shares are quoted on the OTCQB under the symbol “ENZR”, the TSX under the symbol “EGZ” and the Frankfurt Stock Exchange under the symbol “A1CXW3”.
On September 26, 2016 the last reported sale price for our common shares on the OTCQB and TSX was US$0.0525 and CAD$0.075 per share, respectively. The table below sets forth the high and low closing sale prices of our common shares for the fiscal quarters indicated as reported on the OTCQB and TSX. Over-the-counter market quotations reflect inter-dealer prices, without retail mark-up, markdown or commission and may not necessarily represent actual transactions.
|
OTCBB / OTCQX / OTCQB (US$)
|
TSX / TSX-V (CDN$)
|
|||
|
Period
|
High
|
Low
|
High
|
Low
|
|
Fiscal year ended June 30, 2016
|
||||
|
First quarter ended September 30, 2015
|
$0.09
|
$0.03
|
$0.11
|
$0.04
|
|
Second quarter ended December 31, 2015
|
$0.09
|
$0.02
|
$0.12
|
$0.03
|
|
Third quarter ended March 31, 2016
|
$0.07
|
$0.05
|
$0.10
|
$0.07
|
|
Fourth quarter ended June 30, 2016
|
$0.10
|
$0.05
|
$0.13
|
$0.07
|
|
Fiscal year ended June 30, 2015
|
||||
|
First quarter ended September 30, 2014
|
$0.25
|
$0.11
|
$0.28
|
$0.12
|
|
Second quarter ended December 31, 2014
|
$0.19
|
$0.09
|
$0.20
|
$0.11
|
|
Third quarter ended March 31, 2015
|
$0.11
|
$0.09
|
$0.14
|
$0.12
|
|
Fourth quarter ended June 30, 2015
|
$0.11
|
$0.09
|
$0.14
|
$0.10
|
|
Fiscal year ended June 30, 2014
|
||||
|
First quarter ended September 30, 2013
|
$0.28
|
$0.10
|
$0.28
|
$0.11
|
|
Second quarter ended December 31, 2013
|
$0.16
|
$0.11
|
$0.18
|
$0.12
|
|
Third quarter ended March 31, 2014
|
$0.17
|
$0.12
|
$0.18
|
$0.13
|
|
Fourth quarter ended June 30, 2014
|
$0.14
|
$.011
|
$0.15
|
$0.12
|
|
Fiscal year ended June 30, 2013
|
||||
|
First quarter ended September 30, 2012
|
$0.41
|
$0.27
|
$0.39
|
$0.27
|
|
Second quarter ended December 31, 2012
|
$0.37
|
$0.29
|
$0.37
|
$0.29
|
|
Third quarter ended March 31, 2013
|
$0.34
|
$0.17
|
$0.34
|
$0.18
|
|
Fourth quarter ended June 30, 2013
|
$0.22
|
$0.12
|
$0.23
|
$0.11
|
Our common shares commenced trading on the TSXV on May 5, 2010. Our common shares ceased trading on the TSXV and commenced trading on the TSX on June 16, 2011. Our common shares traded on the OTCQX from August 28, 2013 to September 4, 2015. Since September 8, 2015 our shares trade on the OTCQB. Prior to August 28, 2014, our common shares traded on the OTCBB.
Holders
As of September 26, 2016, there were approximately 2,500 holders of record of common shares.
Dividends
We have never declared any cash dividends with respect to our common shares. Future payment of dividends is within the discretion of our board of directors, and will depend upon, among other things, the results of our operations, cash flows and financial condition, operating and capital requirements, and other factors our board of directors may consider relevant. Although there are no material restrictions limiting, or that are likely to limit, our ability to pay dividends on our common shares, we presently intend to retain future earnings, if any, for use in our business and have no present intention to pay cash dividends on our common shares.
48
Equity Compensation Plan Information
The following table sets forth information as of June 30, 2016 for (i) all compensation plans previously approved by the Company's security holders and (ii) all compensation plans not previously approved by the Company's security holders. Options reported below were issued under the Company's Amended 2006 Stock Option Plan.
|
Plan Category
|
Number of securities to be issued upon exercise of outstanding options, and warrants
|
Weighted-average exercise price of outstanding options and warrants
|
Number of securities remaining available for future under equity compensation plans (excluding securities reflected in column (a)
|
|
Equity compensation plans approved by security holders
|
41,965,000
|
$0.18
|
1,035,000
|
|
Equity compensation plans not approved by security holders
|
--
|
--
|
--
|
UNREGISTERED SALES OF EQUITY SECURITIES AND USE OF PROCEEDS
| · | On October 7, 2015, the Company closed a non-brokered private placement offering of 14,200,000 units (the “Units”) at a price of $0.04 (CAD$0.05) per Unit, representing gross proceeds of $530,673 (CAD$710,000). Insiders subscribed for a total of $50,000CAD as part of this Offering. Each Unit is comprised of one (1) common share and one-half (0.5) of one (1) common share purchase warrant (a “Warrant”), each Warrant entitling the holder thereof to acquire one (1) additional common share at a price of $0.07 per share until October 6, 2017. The use of proceeds was the advancement of the Molo graphite project in Madagascar and working capital. |
| · | On February 4, 2016, the Company closed a private placement offering of 6,437,900 units (the “Units”) at a price of $0.05 (CAD$0.07) per unit, representing aggregate gross proceeds of $328,977 (CAD$450,653). Each Unit consisted of one common share of the Company and one common share purchase warrant (a “Warrant”). Each Warrant entitles the holder to purchase one common share at a price of $0.11 per common share until February 4, 2018. The use of proceeds was the advancement of the Molo graphite project in Madagascar and working capital. |
| · | On April 11, 2016, the Company closed a private placement offering of 3,207,857 units (the “Units”) at a price of $0.05 (CAD$0.07) per unit, representing aggregate gross proceeds of $172,638 (CAD$224,550). Each Unit consisted of one common share of the Company and one common share purchase warrant (a “Warrant”). Each Warrant entitles the holder to purchase one common share at a price of $0.11 per common share until April 11, 2018. |
| · | On May 17, 2016, the Company closed a private placement offering of 11,150,000 common shares at a price of $0.07 (CAD$0.09) per unit, representing aggregate gross proceeds of $772,500 (CAD$1,003,500). |
| · | On August 18, 2016, the Company closed a private placement offering of 96,064,286 common shares at a price of $0.05 (CAD$0.07) per unit, representing aggregate gross proceeds of $5,177,865 (CAD$6,724,500). |
Each of the issuances above were effected in reliance upon the exemption provided by Regulation S under the Securities Act of 1933, as amended, for a transaction not involving a public offering. We completed the offering of the shares pursuant to Rule 903 of Regulation S of the Securities Act on the basis that the sale of the securities was completed in an “offshore transaction”, as defined in Rule 902(h) of Regulation S. Each investor represented to us that the investor was not a U.S. person, as defined in Regulation S, and was not acquiring the shares for the account or benefit of a U.S. person. The securities contain a legend restricting the sale of such securities in accordance with the Securities Act.
49
ITEM 6. SELECTED FINANCIAL DATA
As a “smaller reporting company”, we are not required to provide the information required by this Item.
Refer to the financial statements included within this report.
50
ITEM 7. MANAGEMENT’S DISCUSSION AND ANALYSIS OF FINANCIAL CONDITION AND RESULTS OF OPERATIONS
As used in this quarterly report, “we”, “us”, “our”, “Energizer Resources”, “Energizer”, “Company” or “our company” refers to Energizer Resources Inc. and all of its subsidiaries. The term NSR stands for Net Smelter Royalty.
Management’s Discussion and Analysis of Results of Financial Condition and Results of Operations (“MD&A”) should be read in conjunction with the financial statements included herein. Further, this MD&A should be read in conjunction with the Company’s Financial Statements and Notes to Financial Statements included in this Annual Report on Form 10-K for the years ended June 30, 2016 and 2015, as well as the “Business” and “Risk Factors” sections within this Annual Report on Form 10-K. The Company's financial statements have been prepared in accordance with United States generally accepted accounting principles.
Management’s Discussion and Analysis may contain various “forward looking statements” within the meaning of Section 21E of the Securities Exchange Act of 1934, as amended, regarding future events or the future financial performance of the Company that involve risks and uncertainties. Certain statements included in this annual report on Form 10-K, including, without limitation, statements related to anticipated cash flow sources and uses, and words including but not limited to “anticipates”, “believes”, “plans”, “expects”, “future” and similar statements or expressions, identify forward looking statements. Any forward-looking statements herein are subject to certain risks and uncertainties in the Company’s business and any changes in current accounting rules, all of which may be beyond the control of the Company. The Company has adopted the most conservative recognition of revenue based on the most astringent guidelines of the SEC. Management will elect additional changes to revenue recognition to comply with the most conservative SEC recognition on a forward going accrual basis as the model is replicated with other similar markets (i.e. SBDC). The Company’s actual results could differ materially from those anticipated in these forward-looking statements as a result of certain factors, including those set forth therein. Undue reliance should not be placed on these forward-looking statements, which speak only as of the date hereof. We undertake no obligation to update these forward-looking statements.
Cautionary Note
Based on the nature of our business, we anticipate incurring operating losses for the foreseeable future. We base this expectation, in part, on the fact that very few mineral properties in the exploration stage are ultimately developed into producing and profitable mines. Our future financial results are uncertain due to a number of factors, some of which are outside the Company’s control. These factors include, but are not limited to: (1) our ability to raise additional funding; (2) the market price for graphite and vanadium; (3) the results of the exploration programs and metallurgical analysis of our mineral properties; (4) the political instability and/or environmental regulations that may adversely impact costs and ability to operate in Madagascar; and (5) our ability to find joint venture and/or off-take partners in order to advance the development of our mineral properties.
Any future equity financing will cause existing shareholders to experience dilution of their ownership interest in the Company. In the event the Company is not successful in raising additional financing, we anticipate the Company will not be able to proceed with its existing business plan. In such a case, the Company may decide to discontinue or modify its business plan and seek other business opportunities in the resource sector.
During this period, the Company will need to maintain periodic filings with the appropriate regulatory authorities and will incur legal, accounting, administrative and exchange listing costs. In the event no other such opportunities are available and the Company cannot raise additional funding to sustain operations, the Company may be forced to discontinue the business. The Company does not have any specific alternative business opportunities under consideration and has not planned for any such contingency.
Due to the lack of operating history and present inability to generate revenues, the Company auditors have stated their opinion in the notes to our audited financial statements in the annual report on Form 10-K and the Company has included in Note 1 of this financial statements that there currently exists doubt as to the Company’s ability to continue as a going concern.
Due to the accumulated losses and present inability to generate revenues, the Company auditors have stated in their opinion in the footnotes to our audited financial statements in this annual report on Form 10-K that there currently exists doubt as to the Company’s ability to continue as a going concern.
51
BACKGROUND – COMPANY OVERVIEW
We are incorporated in the State of Minnesota, USA and have a fiscal year end of June 30. Our principal business is the acquisition, exploration and development of mineral resources. We have not generated operating revenues or paid dividends since inception on March 1, 2004 to the period ended June 30, 2016 and we are unlikely to do so in the immediate or foreseeable future. Our business activities have been entirely financed from the proceeds of securities subscriptions.
During fiscal 2008, we incorporated Energizer Resources (Mauritius) Ltd. (“ERMAU”), a Mauritius subsidiary, and Energizer Resources Madagascar Sarl. (“ERMAD”), a Madagascar subsidiary of ERMAU. During fiscal 2009, the Company incorporated THB Ventures Ltd. (“THB”), a Mauritius subsidiary of ERMAU, and Energizer Resources Minerals Sarl. (“ERMIN”), a Madagascar subsidiary of THB, which holds the 100% ownership interest of the Green Giant Property in Madagascar (see note 7). During fiscal 2012, the Company incorporated Madagascar‑ERG Joint Venture (Mauritius) Ltd. (“ERGJVM”), a Mauritius subsidiary of ERMAU, and ERG (Madagascar) Sarl. (“ERGMAD”), a Madagascar subsidiary of ERGJVM, which holds the Malagasy Joint Venture Ground. During fiscal 2014, the Company incorporated 2391938 Ontario Inc., an Ontario, Canada subsidiary.
On December 16, 2014, our authorized capital was increased from an aggregate of four hundred fifty million (450,000,000) shares to six hundred fifty million (650,000,000) shares, with a par value of $0.001 per share, of which 640,000,000 will be deemed common shares and the remaining 10,000,000 will be deemed eligible to be divisible into classes, series and types with rights and preferences as designated by our Board of Directors.
We have not had any bankruptcy, receivership or similar proceeding since incorporation. Except as described below, there have been no material reclassifications, mergers, consolidations or purchases or sales of any significant amount of assets not in the ordinary course of business since the date of incorporation.
Summary of Our Business
We are an exploration stage company primarily engaged in the advancement of the Molo Graphite Project, consisting of a commercially minable graphite deposit situated in the African country of Madagascar. We have additional exploration stage properties situated in Madagascar and in the Province of Québec, Canada.
Our executive offices are situated at 520–141 Adelaide Street West, Toronto, Ontario, Canada, M5H 3L5 and the primary telephone number is (416) 364-7024. Our website is www.energizerresources.com (which website is expressly not incorporated by reference into this filing).
Further details regarding each of our Madagascar properties, although not incorporated by reference, including the comprehensive geological report prepared in accordance Canada’s National Instrument 43-101 - Standards of Disclosure for Mineral Properties (“NI 43-101”) for the Molo Graphite Property and separately the technical report on the Green Giant Property in Madagascar can be found on the Company’s website at www.energizerresources.com (which website is expressly not incorporated by reference into this filing) or in the Company’s Canadian regulatory filings at www.sedar.com (which website and content is expressly not incorporated by reference into this filing). We report mineral reserve estimates in accordance with the Securities and Exchange Commission’s Industry Guide 7 (“Guide 7”) under the Securities Act of 1933, as amended (the “U.S. Securities Act”). As a reporting issuer in Canada with our primary trading market in Canada, we are also required to prepare reports on our mineral properties in accordance with NI 43-101. The technical reports referenced in this document uses the terms “mineral resource,” “measured mineral resource,” “indicated mineral resource” and “inferred mineral resource”. These terms are defined in and required to be disclosed by NI 43-101; however, these terms are not defined terms under Guide 7 and are normally not permitted to be used in reports filed with the Securities and Exchange Commission. As a result, information in respect of our resources determined in accordance with NI 43-101 are not contained in this document.
52
Summary of Milestones and Future Plans
We are pursuing negotiations in respect of potential off-take agreements with graphite end-users and intermediaries with the intention of securing project financing alternatives, which may include debt, equity and derivative instruments. Discussions in respect of these matters have been ongoing for the past 24 months and are expected to continue during the coming months with no assurances as to the conclusion or results of these discussions.
In July 2016, we appointed UK-based HCF International Advisers Limited ("HCF") as advisor in negotiating and structuring strategic partnerships, off take agreements and debt financing for its Molo Graphite project.
In August 2016, we initiated a Front End Engineering Design Study (the “FEED Study”) for the Company's Molo graphite project in Madagascar. The FEED Study is being undertaken in order to determine potential development path options that have been presented to the Company by prospective strategic partners.
Our management continues to assess project optimization strategies with the intention of reducing the capital and operating costs relating to the Molo Graphite Property with no assurances as to the conclusion and results of these assessments.
From the date of this annual report, and subject to availability of capital, our plan is to incur between $250,000 and $13,250,000 on further engineering, exploration, testing and permitting to advance the Molo Graphite Property and on the potential creation of a pilot plant, subject to the availability of capital and any other unforeseen delays, by June 30, 2017. No assurances can be provided that we will achieve our objective by that date.
The following is a summary of the amounts budgeted to be incurred (presuming all $13,500,000 is required):
|
Front End Engineering Design (FEED) Study
|
$
|
250,000
|
||
|
Detailed engineering study
|
$
|
5,500,000
|
||
|
Bulk sampling program to secure off-take agreement
|
$
|
4,000,000
|
||
|
Value engineering study
|
$
|
2,500,000
|
||
|
Metallurgy
|
$
|
500,000
|
||
|
Permitting fees
|
$
|
750,000
|
||
|
Total
|
$
|
13,500,000
|
The above amounts may be updated based on actual costs and the timing may be delayed based on several factors, including the availability of capital to fund the budget. We anticipate that the source of funds required to complete the budgeted items disclosed above will come from private placements in the capital markets, but there can be no assurance that financing will be available on terms favorable to the Company or at all.
Although no assurances can be provided, the FEED Study is currently ongoing and is anticipated to continue through to the end of December 2016. This will be followed by a decision to pursue a bulk sample and/or the construction of a pilot plant.
53
RESULTS OF OPERATIONS
The following are explanations of the material changes for the year ended June 30, 2016 compared to the year ended June 30, 2015:
|
Year ended June 30,
2016
|
Year ended June 30,
2015
|
|||||||
|
Revenues
|
$
|
-
|
$
|
-
|
||||
|
Expenses
|
||||||||
|
Mineral exploration expense (notes 6, 7 and 15)
|
812,477
|
4,551,286
|
||||||
|
Professional and consulting fees (note 7)
|
811,704
|
629,817
|
||||||
|
General and administrative (note 7)
|
279,097
|
863,124
|
||||||
|
Stock‑based compensation (notes 7)
|
331,491
|
627,264
|
||||||
|
Depreciation (note 5)
|
56,602
|
47,872
|
||||||
|
Interest (note 9)
|
11,371
|
-
|
||||||
|
Foreign currency translation loss (gain)
|
106,036
|
208,194
|
||||||
|
Total expenses
|
2,408,778
|
6,927,557
|
||||||
|
Net Loss From Operations
|
(2,408,778
|
)
|
(6,927,557
|
)
|
||||
|
Other Income (Expenses)
|
||||||||
|
Investment income
|
623
|
10,111
|
||||||
|
Reduction of flow-through premium (note 8)
|
-
|
37,145
|
||||||
|
Reduction (increase) of flow-through provision (note 16)
|
-
|
(190,087
|
)
|
|||||
|
Gain on legal settlement (note 16)
|
59,556
|
-
|
||||||
|
Gain (loss) on sale of marketable securities
|
(18,916
|
)
|
12,278
|
|||||
|
Change in value of warrant liability (note 13)
|
733,802
|
985,300
|
||||||
|
Net Loss
|
$
|
(1,633,713
|
)
|
$
|
(6,072,810
|
)
|
||
|
Unrealized gain (loss) from marketable securities
|
-
|
(816
|
)
|
|||||
|
Realized gain (loss) from marketable securities
in net loss
|
4,323
|
(12,278
|
)
|
|||||
|
Comprehensive Loss
|
$
|
(1,629,390
|
)
|
$
|
(6,085,904
|
)
|
||
| · | Mineral exploration costs decreased significantly as the company shifts from exploration stage to the development of the Molo graphite project situated in Madagascar. |
| · | Stock-based compensation and the general and administrative costs decreased as a result of a reduction of employees, consultants and administrative costs as compared to the previous period. |
54
Liquidity, Capital Resources and Foreign Currencies
The following are explanations of the material changes to the working capital position as of June 30, 2016 when compared to June 30, 2015:
|
June 30, 2016
|
June 30, 2015
|
|||||||
|
Assets
|
||||||||
|
Current Assets:
|
||||||||
|
Cash and cash equivalents
|
$
|
544,813
|
$
|
779,118
|
||||
|
Marketable securities (note 4)
|
-
|
7,615
|
||||||
|
Amounts receivable
|
13,955
|
49,484
|
||||||
|
Prepaid expenses
|
11,545
|
16,032
|
||||||
|
Loan to related party (note 7)
|
-
|
76,450
|
||||||
|
Total current assets
|
570,313
|
928,699
|
||||||
|
Current Liabilities:
|
||||||||
|
Accounts payable (note 7)
|
$
|
215,392
|
$
|
95,580
|
||||
|
Accrued liabilities
|
24,743
|
283,952
|
||||||
|
Contingency provision (note 16)
|
182,742
|
190,087
|
||||||
|
Warrant liability (note 13)
|
111,049
|
844,851
|
||||||
|
Total current liabilities
|
$
|
533,926
|
$
|
1,414,470
|
||||
|
Net Working Capital Position
|
$
|
36,387
|
$
|
(485,771
|
)
|
|||
In managing liquidity, management’s primary objective is to ensure the entity can continue as a going concern while raising additional funding to meet our obligations as they come due. Our operations to date have been funded by issuing equity. Our company expects to improve the working capital position by securing additional financing.
We hold a significant portion of our cash reserves in Canadian dollars to satisfy non-exploration expenditures such as professional and consulting fees and general and administrative costs, which are mainly incurred in Canadian dollars. Due to foreign exchange rate fluctuations, the remeasurement of the value of Canadian dollar reserves into US dollars results in foreign currency translation gains or losses. If there was to be a significant decline in the Canadian dollar against the US dollar, the value of that Canadian dollar cash reserves, as presented on the balance sheet, could significantly decline causing significant foreign currency translation losses. In addition, certain of our ongoing expenditures are in South African Rand, Madagascar Ariary and Euros requiring us to occasionally hold reserves of these foreign currencies with a similar risk of foreign exchange currency translation losses.
55
Capital Financings
We have funded our business to date from sales of our securities. We will require additional funding throughout fiscal 2017 to advance our projects, which will likely be in the form of equity financing from the issuance of additional common shares. However, we cannot provide investors with any assurance that we will be able to raise sufficient funding from the sale of our common shares.
Net proceeds during the past two years:
| · | For the year ended June 30, 2014, we raised net proceeds of $9,559,926 through the issuance of 90,523,283 common shares and 39,312,130 common share purchase warrants. |
| · | For the year ended June 30, 2015, we raised net proceeds of $6,663,148 through the issuance of 40,757,067 common shares and 22,626,569 common share purchase warrants. |
| · | On October 7, 2015, we closed a non-brokered private placement offering of 14,200,000 units (the “Units”) at a price of $0.04 (CAD$0.05) per Unit, representing gross proceeds of $530,673 (CAD$710,000). Insiders subscribed for a total of $50,000CAD as part of this Offering. Each Unit is comprised of one (1) common share and one-half (0.5) of one (1) common share purchase warrant (a “Warrant”), each Warrant entitling the holder thereof to acquire one (1) additional common share at a price of $0.07 per share until October 6, 2017. |
| · | On February 4, 2016, we closed a private placement offering of 6,437,900 units (the “Units”) at a price of $0.05 (CAD$0.07) per unit, representing aggregate gross proceeds of $328,977 (CAD$450,653). Each Unit consisted of one common share and one common share purchase warrant (a “Warrant”). Each Warrant entitles the holder to purchase one common share at a price of $0.11 per common share until February 4, 2018. |
| · | On April 11, 2016, we closed a private placement offering of 3,207,857 units (the “Units”) at a price of $0.05 (CAD$0.07) per unit, representing aggregate gross proceeds of $172,638 (CAD$224,550). Each Unit consisted of one common share and one common share purchase warrant (a “Warrant”). Each Warrant entitles the holder to purchase one common share at a price of $0.11 per common share until April 11, 2018. |
| · | On May 17, 2016, we closed a private placement offering of 11,150,000 common shares at a price of $0.07 (CAD$0.09) per unit, representing aggregate gross proceeds of $772,500 (CAD$1,003,500). |
Net proceeds subsequent to the end of the reporting period:
| · | On August 18, 2016, we closed a private placement offering of 96,064,286 common shares at a price of $0.05 (CAD$0.07) per unit, representing aggregate gross proceeds of $5,177,865 (CAD$6,724,500). |
Each of the issuances above were effected in reliance upon the exemption provided by Regulation S under the Securities Act of 1933, as amended, for a transaction not involving a public offering. We completed the offering of the shares pursuant to Rule 903 of Regulation S of the Securities Act on the basis that the sale of the securities was completed in an “offshore transaction”, as defined in Rule 902(h) of Regulation S. Each investor represented to us that the investor was not a U.S. person, as defined in Regulation S, and was not acquiring the shares for the account or benefit of a U.S. person. The securities contain a legend restricting the sale of such securities in accordance with the Securities Act.
Off-balance sheet arrangements
The Company does not have off-balance sheet arrangements including any arrangements that would affect the liquidity, capital resources, market risk support and credit risk support or other benefits.
56
ITEM 7.A. - QUANTITATIVE AND QUALITATIVE DISCLOSURES ABOUT MARKET RISK
Not applicable.
57
ITEM 8. – FINANCIAL STATEMENTS AND SUPPLEMENTARY DATA
The financial statements required by this Item, the accompanying notes thereto and the reports of independent accountants are included, as part of this Form 10-K immediately following the signature page.
58
ITEM 9. – CHANGES IN AND DISAGREEMENTS WITH ACCOUNTANTS ON ACCOUNTING AND FINANCIAL DISCLOSURE
None noted.
ITEM 9A. - CONTROLS AND PROCEDURES
Evaluation of Disclosure Controls and Procedures
Our management team, under the supervision and with the participation of our chief executive officer and our chief financial officer, evaluated the effectiveness of the design and operation of our disclosure controls and procedures as such term is defined under Rule 13a-15(e) promulgated under the Securities Exchange Act of 1934, as amended (Exchange Act), as of the last day of the fiscal period covered by this report, June 30, 2016.
The term disclosure controls and procedures means our controls and other procedures that are designed to ensure that information required to be disclosed by us in the reports that we file or submit under the Exchange Act is recorded, processed, summarized and reported, within the time periods specified in the SEC’s rules and forms. Disclosure controls and procedures include, without limitation, controls and procedures designed to ensure that information required to be disclosed by us in the reports that we file or submit under the Exchange Act is accumulated and communicated to management, including our chief executive and chief financial officer, or persons performing similar functions, as appropriate to allow timely decisions regarding required disclosure.
Based on this evaluation, our chief executive officer and our chief financial officer concluded that, our disclosure controls and procedures were effective as of June 30, 2016.
Management’s report on internal control over financial reporting
Our principal executive officer and our principal financial officer, are responsible for establishing and maintaining adequate internal control over financial reporting, as such term is defined in Exchange Act Rules 13a-15(f). Management is required to base its assessment of the effectiveness of our internal control over financial reporting on a suitable, recognized control framework, such as the framework developed by the Committee of Sponsoring Organizations (COSO). The COSO framework, published in Internal Control-Integrated Framework, is known as the COSO Report. Our principal executive officer and our principal financial officer, have chosen the COSO framework on which to base its assessment. Based on this evaluation, we have concluded that, as of June 30, 2016, there is not a risk of material deficiencies in our company’s internal controls resulting in material misstatement in our Company’s financial statements. Our internal controls and procedures were effective to prevent a material weakness caused by a significant deficiency in internal controls.
Because of its inherent limitations, internal control over financial reporting may not prevent or detect misstatements. Therefore, even systems like ours which have been determined to be effective can only provide reasonable and not absolute assurance of achieving their control objectives. Furthermore, smaller reporting companies, like ours, face additional limitations. Smaller reporting companies employ fewer individuals and find it difficult to properly segregate duties. Often, only a few individuals control every aspect of the Company's operation and are in a position to override any system of internal control. Additionally, smaller reporting companies tend to utilize general accounting software packages that lack a rigorous set of software controls.
This annual report does not include an attestation report of our independent registered public accounting firm over management’s assessment regarding internal control over financial controls. However, the auditors have reported that they have found no material weaknesses in internal controls during the period of their audit. Management’s report was not subject to attestation by our registered public accounting firm pursuant to an exemption for smaller reporting companies under Section 989G of the Dodd-Frank Wall Street Reform and Consumer Protection Act.
59
It should be noted that any system of controls, however well designed and operated, can provide only reasonable and not absolute assurance that the objectives of the system are met. In addition, the design of any control system is based in part upon certain assumptions about the likelihood of certain events. However, as noted, when the size of our Company and its finance department is materially increased, the deficiencies can be addressed. Once increased, we intend to create a new finance and accounting position that will allow for proper segregation of duties consistent with control objectives, and will increase our personnel resources and technical accounting expertise within the accounting function; and we will prepare and implement appropriate written policies and checklists which set forth procedures for accounting and financial reporting with respect to the requirements and application of US generally accepted accounting principles and SEC disclosure requirements. Because of these and other inherent limitations of control systems, there can be no assurance that any design will succeed in achieving its stated goals under all potential future conditions, regardless of how remote or when the size of our Company and our finance department will materially increase to address these issues.
Changes In Internal Control Over Financial Reporting
On October 23, 2015, the Company appointed Marc Johnson as Chief Financial Officer, replacing the former Chief Financial Officer. Otherwise, there were no changes in the Company's internal controls over financial reporting during the most recently completed fiscal quarter that have materially affected or are reasonably likely to materially affect the Company's internal control over financial reporting.
ITEM 9B. - OTHER INFORMATION
Not applicable.
60
PART III
ITEM 10. - DIRECTORS, EXECUTIVE OFFICERS AND CORPORATE GOVERNANCE
The following table sets forth the name, age, and position of each executive officer and director the Company as at September 28, 2016.
|
Name
|
Age
|
Position
|
|
Craig Scherba
|
44
|
President, Chief Executive Officer and Director
|
|
Marc Johnson
|
40
|
Chief Financial Officer
|
|
Robin Borley
|
48
|
Senior Vice President of Mine Development and Director
|
|
John Sanderson
|
81
|
Chairman and Director
|
|
Quentin Yarie
|
51
|
Director
|
|
Albert A. Thiess, Jr.
|
69
|
Director
|
|
Dean Comand
|
50
|
Director
|
|
Dalton Larson
|
76
|
Director
|
Directors of the Company hold their offices until the next annual meeting of the Company’s shareholders and until their successors have been duly elected and qualified or until their earlier resignation, removal of office or death. Executive officers of the Company are elected by the board of directors to serve until their successors are elected and qualified. There are no family relationships between any director or executive officer of the Company.
John Sanderson, Q.C. (Vancouver, Canada): Mr. Sanderson has been the Company’s Vice Chairman of the Board since October 2009 and a director of our Company since January 2009. Mr. Sanderson was Chairman of the Board of the Company from January 2009 to September 2009. Mr. Sanderson is a chartered mediator, chartered arbitrator, consultant and lawyer called to the bar in the Canadian provinces of Ontario and British Columbia. Mr. Sanderson’s qualifications to serve as a director include his many years of legal and mediation experience in various industries. Mr. Sanderson is a Queen’s Counsel (Q.C.). He has acted as mediator, facilitator and arbitrator across Canada, and internationally, in numerous commercial transactions, including insurance claims, corporate contractual disputes, construction matters and disputes, environmental disputes, inter-governmental disputes, employment matters, and in relation to aboriginal claims. He has authored and co-authored books on the use and value of dispute resolution systems as an alternative to the courts in managing business and legal issues.
Craig Scherba, P.Geol. (Oakville, Canada): Mr. Scherba was appointed as our Chief Executive Officer and President in August 2015 and has served as a director since January 2010. Mr. Scherba served as President and Chief Operating Officer from September 2012 to August 2015 and Vice President, Exploration of the Company from January 2010 to September 2012. Mr. Scherba has been a professional geologist (P. Geol.) since 2000, and his expertise includes supervising large Canadian and international exploration. Mr. Scherba also serves as Vice President, Exploration of MacDonald Mines Exploration Ltd, Red Pine Exploration Inc. and Honey Badger Exploration Inc which are resource exploration company trading on the TSX - Venture Exchange. In addition, Mr. Scherba was professional geologist with Taiga Consultants Ltd. (“Taiga”), a mining exploration consulting company from March 2003 to December 2009. He was a managing partner of Taiga between January 2006 and December 2009. Mr. Scherba was an integral member of the exploration team that developed Nevsun Resources’ high grade gold, copper and zinc Bisha project in Eritrea. While at Taiga, Mr. Scherba served as the Company's Country and Exploration Manager in Madagascar during its initial exploration stage.
Robin Borley (Johannesberg, South Africa): Mr. Borley was appointed our Senior Vice President (“SVP”) of Mine Development during December 2013. Mr. Borley is a Graduate mining engineering professional and a certified mine manager with more than 25 years of international mining experience building and operating mining ventures. He has held senior management positions both internationally and within the South African mining industry. Until October 2014, Mr. Borley served as Mining Director for DRA Mineral Projects. In addition, Mr. Borley was instrumental as the COO of Red Island Minerals in a developing a Madagascar coal venture. His diverse career has spanned resource project management, evaluation, exploration and mine development. Robin has completed several mine evaluations including operational and financial evaluations of new and existing operations across a diverse range of resource sectors. He has experience in the management of underground and surface mining operations from both the contractor and owner miner environments. From 2006 through to 2012, Robin participated in the BEE management buy-out transaction of the Optimum Colliery mining property from BHP, through its independent listing and its ultimate sale to Glencore in December 2012.
Marc Johnson (Toronto, Canada): Mr. Johnson was appointed as our Chief Financial Officer in October 2015. Mr. Johnson is a senior executive with over 20 years of experience, including 10 years at large public companies in corporate development, financial management and cost control positions. He also brings 10 years of capital markets experience, specifically in mining investment banking and as an equity research mining analyst covering precious and base metals. Mr. Johnson is a Chartered Financial Analyst (CFA) and holds a Bachelor of Commerce (Finance) degree from the John Molson School of Business at Concordia University. He will be completing his Chartered Professional Accountant (CPA) designation in 2016. Mr. Johnson also currently serves as the CFO of Red Pine Exploration Inc., as the CFO of Honey Badger Exploration Inc. and is a Principal at Quantum Advisory Partners LLP, a professional services firm that provides CFO services to public and private companies.
61
Quentin Yarie, P.Geo. (Toronto, Canada): Mr. Yarie has served as a director of our Company since 2008. Mr. Yarie is an experienced geophysicist and a successful entrepreneur with over 25 years’ experience in mining and environmental/engineering. Mr. Yarie has project management and business development experience as he has held positions of increasing responsibility with a number of Canadian-based geophysical service providers. He is currently CEO and President of Red Pine Exploration Inc, and Honey Badger Exploration Inc. and President of MacDonald Mines Exploration Inc. From January 2010, Mr. Yarie was Senior Vice President Exploration for MacDonald Mines Exploration Ltd, Red Pine Exploration Inc. and Honey Badger Exploration Inc. all listed on the TSX-Venture Exchange headquartered in Toronto, Canada. From October 2007 to December 2009, Mr. Yarie was a business development officer with Geotech Ltd, a geophysical airborne survey company. From September 2004 to October 2007, Mr. Yarie was a senior representative of sales and business development for Aeroquest Limited. From 1992-2001, he was a partner of a specialized environmental and engineering consulting group where he managed a number of large projects including the ESA of the Sydney Tar Ponds, the closure of the Canadian Forces Bases in Germany and the Maritime and Northeast Pipeline project.
Albert A. Thiess, Jr. (Bluffton, United States of America): Mr. Thiess was appointed a Director during May 2012. Mr. Thiess brings over 35 years of accounting, finance and management experience to the Company. Mr. Thiess served as an audit partner in Coopers & Lybrand, LLP and with PricewaterhouseCoopers LLP following the merger of those firms in 1998. He served clients in the automotive, banking, retail and manufacturing industries, as well as serving as the Managing Partner of the Detroit, Michigan and Los Angeles, California offices. He also was elected to the Governing Council of Coopers & Lybrand. Following the merger with PricewaterhouseCoopers, Mr. Thiess managed various global functions for the newly merged firm.
Dean Comand P. Eng, CET MMP CDir. (Ancaster, Canada): Mr. Comand is a Mechanical Engineer and holds his P. Eng designation in the province of Ontario as well as designation as a Certified Engineering Technologist. He earned his Maintenance Manager Professional Designation (MMP) license in 2006 and his Charter Director designation (CDir) in 2012. Mr Comand is currently the President and Chief Executive Officer of Hamilton Utilities Corporation and continues to provide strategic advice to numerous clients around the world in the mining and energy sectors From 2009 – 2014, Mr. Comand worked for Sherritt International as Vice President of Operations of Ambatovy, a large scale nickel project Madagascar. He successfully led the construction and commissioning of Ambatovy, and led the operations to commercial production. He has extensive business and financial acumen in large-scale energy, power, and mining industries. He has consistently held senior positions in operations, business, project development, environmental management, maintenance, and project construction. He has managed a variety of complex operations, including one of the world’s largest mining facilities, industrial facilities, numerous power plants, renewable energy facilities and privately held municipal water treatment facilities across Canada and the United States.
Dalton Larson (Surrey, Canada): Mr. Larson is a Canadian attorney with more than 35 years as a member of the Law Society of British Columbia. He commenced practice as a member of the Faculty of Law, University of British Columbia, subsequently becoming a partner of a major Vancouver Law firm, now McMillan LLP. Currently, he maintains a private practice along with a vigorous investment business. He is a recognized expert in alternate dispute resolution and has extensive experience as a professional arbitrator and mediator. He has three degrees, including a Master’s Degree in law from the University of London, England. His business activities include more than 25 years as a director of several investment funds managed by the CW Funds group of companies, affiliated with Ventures West Management Inc., which is one of the largest venture capital firms in Canada. The CW Funds raised and invested in a wide variety of businesses totaling more than $130 million, primarily from overseas investors. In that period he served as Chairman of the Board of Directors of a Philippine ethanol company. He was the founding shareholder of the First Coal Corporation, which started operations in 2014, and raised in excess of $65 million in equity to finance its development activities. This company was sold to Xstrata in excess of $150 million.
Director Term Limits and Female Representation in Management and on the Board
The Company has not instituted director term limits. The Company believes that in taking into account the nature and size of the Board and the Company, it is more important to have relevant experience than to impose set time limits on a director’s tenure, which may create vacancies at a time when a suitable candidate cannot be identified and as such would not be in the best interests of the Company. In lieu of imposing term limits, the Company regularly monitors director performance through annual assessments and regularly encourages sharing and new perspectives through regularly scheduled Board meetings, meetings with only independent directors in attendance, as well as through continuing education initiatives. On a regular basis, the Company analyzes the skills and experience necessary for the Board and evaluates the need for director changes to ensure that the Company has highly knowledgeable and motivated Board members, while ensuring that new perspectives are available to the Board.
The Company has not implemented a diversity policy; however the Company believes that it currently promotes the benefits of, and need for, extending opportunities to all candidates, without distinction as to gender, race, colour, religion, sexual orientation, family or marital status, political belief, age, national or ethnic origin, citizenship, disability, or any other basis and will strive for diversity of experience, perspective and education. The Company believes that it currently focuses on hiring the best quality individuals for the position and also encourages representation of women on the Board and in executive officer positions.
The Company has seven Board members and four executive officers, none of whom are female. The Company has not considered the level of representation of women in its executive officer positions or on its Board in previous nominations or appointments (including a targeted number or percentage). The Company’s focus has always been, and will continue to be, working to attract the highest quality executive officers and Board candidates with special focus on the skills, experience, character and behavioural qualities of each candidate. The Company will continue to monitor developments in the area of diversity.
62
Audit Committee and Audit Committee Financial Expert
The audit committee is a key component of the Company’s commitment to maintaining a higher standard of corporate responsibility. This committee consists of Albert A. Thiess Jr., Dean Comand and John Sanderson, all of whom are financially literate (see biographies under “Nominees” section above) and independent as per the independence standards of the NYSE Amex in the United States of America and as per the standards of NI 58-101 in Canada (each are independent directors as they do not have involvement in the day-to-day operations of the Company).
The audit committee assists our Board in its oversight of the Company’s accounting and financial reporting processes and the annual audits of the Company’s financial statements, including (i) the quality and integrity of the Company’s financial statements, (ii) the Company’s compliance with legal and regulatory requirements in both Canada and the United States of America, (iii) the independent auditors’ qualifications and independence, and (iv) the performance of the Company’s internal audit functions and independent auditors, as well as other matters which may come before it as directed by the Board. Further, the audit committee, to the extent it deems necessary or appropriate, among its several other responsibilities, shall: (1) be responsible for the appointment, compensation, retention, termination and oversight of the work of any independent auditor engaged for the purpose of preparing or issuing an audit report or performing other audit, review or attest services for the Company; (2) discuss the annual audited financial statements and the quarterly unaudited financial statements with management and, if necessary the independent auditor prior to their filing with the SEC in the Company’s Annual Report on Form 10-K and Quarterly Reports on Form 10-Q; (3) review with the Company’s financial management on a periodic basis (a) issues regarding accounting principles and financial statement presentations, including any significant changes in the company’s selection or application of accounting principles, and (b) the effect of any regulatory and accounting initiatives, as well as off-balance sheet structures, on the financial statements of the company; (4) monitor the Company’s policies for compliance with federal, state, local and foreign laws and regulations and the Company’s policies on corporate conduct; (5) maintain open, continuing and direct communication between the Board, the committee and both the company’s independent auditors and its internal auditors; and (6) monitor our compliance with legal and regulatory requirements and compliance with federal, state and local laws and regulations, including the Foreign Corrupt Practices Act.
Section 16(a) Beneficial Ownership Reporting Compliance
Section 16(a) of the Securities Exchange Act of 1934, as amended, requires the Company’s directors and executive officers, and persons who beneficially own more than 10% of a registered class of the Company’s equity securities, to file reports of beneficial ownership and changes in beneficial ownership of the Company’s securities with the SEC on Form 3 (Initial Statement of Beneficial Ownership), Form 4 (Statement of Changes of Beneficial Ownership of Securities) and Form 5 (Annual Statement of Beneficial Ownership of Securities). Directors, executive officers and beneficial owners of more than 10% of the Company’s Common Stock are required by SEC regulations to furnish the Company with copies of all Section 16(a) forms that they filed.
Except as otherwise set forth herein, based solely on review of the copies of such forms furnished to the Company, or written representations that no reports were required, the Company believes that for the fiscal year ended June 30, 2015, beneficial owners and executives complied with Section 16(a) filing requirements applicable to them.
Involvement in Certain Legal Proceedings
None of the following events have occurred during the past ten years and are material to an evaluation of the ability or integrity of any director or officer of the Company:
| 1. | A petition under the Federal bankruptcy laws or any state insolvency law was filed by or against, or a receiver, fiscal agent or similar officer was appointed by a court for the business or property of such person, or any partnership in which he was a general partner at or within two years before the time of such filing, or any corporation or business association of which he was an executive officer at or within two years before the time of such filing; |
| 2. | Such person was convicted in a criminal proceeding or is a named subject of a pending criminal proceeding (excluding traffic violations and other minor offenses); |
| 3. | Such person was the subject of any order, judgment, or decree, not subsequently reversed, suspended or vacated, of any court of competent jurisdiction, permanently or temporarily enjoining him from, or otherwise limiting, the following activities: |
| a. | Acting as a futures commission merchant, introducing broker, commodity trading advisor,commodity pool operator, floor broker, leverage transaction merchant, any other person regulatedby theCommodity Futures Trading Commission, or an associated person of any of the foregoing, or as an investment adviser, underwriter, broker or dealer in securities, or as an affiliated person, director or employee of any investment company, bank, savings and loan association or insurance company, or engaging in or continuing any conduct or practice in connection with such activity; |
| b. | Engaging in any type of business practice; or |
| c. | Engaging in any activity in connection with the purchase or sale of any security or commodity orin connection with any violation of Federal or State securities laws or Federal commodities laws; |
| 4. | Such person was the subject of any order, judgment or decree, not subsequently reversed, suspended or vacated, of any Federal or State authority barring, suspending or otherwise limiting for more than 60 days the right of such person to engage in any activity described in paragraph (f)(3)(i) of this section, or to be associated with persons engaged in any such activity; |
63
| 5. | Such person was found by a court of competent jurisdiction in a civil action or by the Commission to have violated any Federal or State securities law, and the judgment in such civil action or finding by the Commission has not been subsequently reversed, suspended, or vacated; |
| 6. | Such person was found by a court of competent jurisdiction in a civil action or by the Commodity Futures Trading Commission to have violated any Federal commodities law, and the judgment in such civil action or finding by the Commodity Futures Trading Commission has not been subsequently reversed, suspended or vacated; |
| 7. | Such person was the subject of, or a party to, any Federal or State judicial or administrative order, judgment, decree, or finding, not subsequently reversed, suspended or vacated, relating to an alleged violation of: |
| a. | Any Federal or State securities or commodities law or regulation; or |
| b. | Any law or regulation respecting financial institutions or insurance companies including, but notlimited to, a temporary or permanent injunction, order of disgorgement or restitution, civil moneypenalty or temporary or permanent cease-and-desist order, or removal or prohibition order; or |
| c. | Any law or regulation prohibiting mail or wire fraud or fraud in connection with any businessentity; or |
| 8. | Such person was the subject of, or a party to, any sanction or order, not subsequently reversed, suspended or vacated, of any self-regulatory organization (as defined in Section 3(a)(26) of the Exchange Act (15 U.S.C. 78c(a)(26))), any registered entity (as defined in Section 1(a)(29) of the Commodity Exchange Act (7 U.S.C. 1(a)(29)), or any equivalent exchange, association, entity or organization that has disciplinary authority over its members or persons associated with a member. |
Code of Ethics
The Company has adopted a code of business conduct and ethics that applies to its directors, officers, and employees, including its principal executive officers, principal financial officer, principal accounting officer, controller or persons performing similar functions. The Financial Code of Business Conduct was filed as Exhibit 14.1 to our Annual Report on Form 10-QSB for June 30, 2004 as filed on May 19, 2004. If we make substantive amendments to the Code of Ethics for Senior Financial Officers or the Code of Business Conduct and Ethics or grant any waiver, including any implicit waiver, we will disclose the nature of such amendment or waiver on our website or in a report on Form 8-K within four days of such amendment or waiver.
64
ITEM 11. – EXECUTIVE COMPENSATION
Compensation of Executives
The table below sets forth certain summary information concerning the compensation paid or accrued during each of our last three completed fiscal years to our principal executive officer and four most highly compensated executive officers who received compensation over $100,000 for the fiscal year ended June 30, 2016 (Named Executive Officers” or “NEO”):
|
Name and Principal Position
|
Fiscal Year
|
Salary
&
Consulting
Fees
($)(1) |
Bonus
($)
|
Option Awards
($)(2) |
Stock
Awards
($)
|
Non-Equity
Incentive
Plans
($)
|
Change in
Pension Value &
Non-Qualified
Deferred
Compensation
($)
|
Other
Compensation
&
Severance
($) |
Total
($)
|
|
Craig Scherba
CEO, President and Director (A) |
2016
|
88,015
|
0
|
37,049
|
0
|
0
|
0
|
0
|
125,064
|
|
2015
|
57,300
|
0
|
45,613
|
0
|
0
|
0
|
0
|
102,913
|
|
|
2014
|
167,305
|
0
|
61,566
|
0
|
0
|
0
|
0
|
228,871
|
|
|
Marc Johnson
CFO (B)
|
2016
|
51,784
|
0
|
29,249
|
0
|
0
|
0
|
0
|
81,033
|
|
2015
|
0
|
0
|
0
|
0
|
0
|
0
|
0
|
0
|
|
|
2014
|
0
|
0
|
0
|
0
|
0
|
0
|
0
|
0
|
|
|
Robin Borley, SVP and Director (C)
|
2016
|
204,800
|
0
|
29,249
|
0
|
0
|
0
|
0
|
234,049
|
|
2015
|
187,200
|
0
|
17,430
|
0
|
0
|
0
|
0
|
204,630
|
|
|
2014
|
116,900
|
0
|
26,820
|
0
|
0
|
0
|
0
|
143,720
|
|
|
Brent Nykoliation, SVP (D)
|
2016
|
129,027
|
0
|
29,249
|
0
|
0
|
0
|
0
|
158,276
|
|
2015
|
115,726
|
0
|
57,941
|
0
|
0
|
0
|
0
|
173,667
|
|
|
2014
|
210,259
|
0
|
61,825
|
0
|
0
|
0
|
0
|
272,084
|
|
|
Richard E. Schler, Former CEO and Director (E)
|
2016
|
36,714
|
0
|
0
|
0
|
0
|
0
|
89,531
|
126,245
|
|
2015
|
149,123
|
0
|
120,866
|
0
|
0
|
0
|
0
|
269,989
|
|
|
2014
|
218,955
|
0
|
84,174
|
0
|
0
|
0
|
0
|
303,129
|
|
|
Peter Liabotis, Former CFO (F)
|
2016
|
26,609
|
0
|
0
|
0
|
0
|
0
|
35,516
|
62,125
|
|
2015
|
103,327
|
0
|
44,617
|
0
|
0
|
0
|
0
|
147,944
|
|
|
2014
|
210,055
|
0
|
58,755
|
0
|
0
|
0
|
0
|
268,810
|
| (A) | On July 30, 2015, Mr. Scherba became the Chief Executive Officer, replacing Mr. Schler. The Company does not have an employment agreement with Mr. Scherba. Mr. Scherba receives a salary of CAD$10,275 per month. |
| (B) | On October 23, 2015, Mr. Johnson became the Chief Financial Officer, replacing Mr. Liabotis. The Company has a management company agreement with Mr. Johnson, who receives consulting fees of CAD$8,000 per month. His contract is for an indefinite term with a 3-month termination notice, which is subject to certain change of control provisions. |
| (C) | The Company does not have an employment agreement with Mr. Borley. Mr. Borley receives consulting fees of USD $16,400 per month. |
| (D) | The Company does not have an employment agreement with Mr. Nykoliation. Mr. Nykoliation receives a salary of CAD$13,700 per month. |
| (E) | Mr. Schler resigned as Chief Executive Officer in July 2015 and received a severance. |
| (F) | Mr. Liabotis was replaced as Chief Financial Officer in October 2015 and awarded a severance. |
| (1) | These amounts include salary and/or consulting fees paid during the year. No bonuses have been paid. |
| (2) | These values represent the calculated Black-Scholes theoretical value of granted options. It is important to note that these granted options may or may not ever be exercised. Whether granted options are exercised or not will be based primarily, but not singularly, on the Company’s future stock price and whether the granted options become “in-the-money”. If these granted options are unexercised and expire, the cash value or benefit to the above noted individuals is $nil. |
65
Outstanding Stock Option Grants
Outstanding stock options granted to Named Executive Officers (“NEO’s”) as at June 30, 2016 are as follows:
|
Name and Principal Position
|
Number of Securities
Underlying Unexercised
Options Exercisable
(#)
|
Number of Securities
Underlying Unexercised
Options Un-Exercisable
(#)
|
Equity Incentive
Plan Awards:
Number of Securities
Underlying Unexercised
Unearned Options
(#)
|
Option Exercise Price
($)
|
Value Realized
if Exercised
($)(1)
|
Option Expiration Date
|
|
Craig Scherba
CEO, President and Director |
350,000
|
0
|
0
|
0.30
|
0
|
July 1, 2016
|
|
200,000
|
0
|
0
|
0.20
|
0
|
October 24, 2016
|
|
|
200,000
|
0
|
0
|
0.21
|
0
|
December 1, 2016
|
|
|
400,000
|
0
|
0
|
0.28
|
0
|
March 4, 2017
|
|
|
750,000
|
0
|
0
|
0.21
|
0
|
February 27, 2018
|
|
|
180,000
|
0
|
0
|
0.11
|
0
|
July 9, 2018
|
|
|
500,000
|
0
|
0
|
0.18
|
0
|
January 10, 2019
|
|
|
250,000
|
0
|
0
|
0.15
|
0
|
July 3, 2019
|
|
|
470,000
|
0
|
0
|
0.20
|
0
|
February 26, 2020
|
|
|
950,000
|
0
|
0
|
0.06
|
0
|
December 22, 2020
|
|
|
Marc Johnson
CFO
|
750,000
|
0
|
0
|
0.06
|
0
|
December 22, 2020
|
|
Robin Borley, SVP and Directo
|
125,000
|
0
|
0
|
0.28
|
0
|
March 4, 2017
|
|
75,000
|
0
|
0
|
0.21
|
0
|
February 27, 2018
|
|
|
300,000
|
0
|
0
|
0.18
|
0
|
January 10, 2019
|
|
|
350,000
|
0
|
0
|
0.20
|
0
|
February 26, 2020
|
|
|
750,000
|
0
|
0
|
0.06
|
0
|
December 22, 2020
|
|
|
Brent Nykoliation, SVP
|
450,000
|
0
|
0
|
0.30
|
0
|
July 1, 2016
|
|
200,000
|
0
|
0
|
0.20
|
0
|
October 24, 2016
|
|
|
200,000
|
0
|
0
|
0.21
|
0
|
December 1, 2016
|
|
|
350,000
|
0
|
0
|
0.28
|
0
|
March 4, 2017
|
|
|
700,000
|
0
|
0
|
0.21
|
0
|
February 27, 2018
|
|
|
175,000
|
0
|
0
|
0.11
|
0
|
July 9, 2018
|
|
|
75,000
|
0
|
0
|
0.15
|
0
|
July 19, 2018
|
|
|
400,000
|
0
|
0
|
0.18
|
0
|
January 10, 2019
|
|
|
400,000
|
0
|
0
|
0.15
|
0
|
July 3, 2019
|
|
|
450,000
|
0
|
0
|
0.20
|
0
|
February 26, 2020
|
|
|
750,000
|
0
|
0
|
0.06
|
0
|
December 22, 2020
|
|
|
Richard E. Schler, Former CEO and Director
|
600,000
|
0
|
0
|
0.30
|
0
|
July 1, 2016
|
|
675,000
|
0
|
0
|
0.29
|
0
|
July 13, 2016
|
|
|
225,000
|
0
|
0
|
0.20
|
0
|
October 24, 2016
|
|
|
200,000
|
0
|
0
|
0.21
|
0
|
December 1, 2016
|
|
|
1,340,000
|
0
|
0
|
0.28
|
0
|
March 4, 2017
|
|
|
650,000
|
0
|
0
|
0.21
|
0
|
February 27, 2018
|
|
|
170,000
|
0
|
0
|
0.11
|
0
|
July 9, 2018
|
|
|
200,000
|
0
|
0
|
0.15
|
0
|
July 19, 2018
|
|
|
475,000
|
0
|
0
|
0.18
|
0
|
January 10, 2019
|
|
|
1,100,000
|
0
|
0
|
0.15
|
0
|
July 3, 2019
|
|
|
465,000
|
0
|
0
|
0.20
|
0
|
February 26, 2020
|
|
|
Peter Liabotis, Former CFO
|
350,000
|
0
|
0
|
0.30
|
0
|
July 1, 2016
|
|
200,000
|
0
|
0
|
0.20
|
0
|
October 24, 2016
|
|
|
200,000
|
0
|
0
|
0.21
|
0
|
December 1, 2016
|
|
|
350,000
|
0
|
0
|
0.28
|
0
|
March 4, 2017
|
|
|
550,000
|
0
|
0
|
0.21
|
0
|
February 27, 2018
|
|
|
150,000
|
0
|
0
|
0.11
|
0
|
July 9, 2018
|
|
|
500,000
|
0
|
0
|
0.18
|
0
|
January 10, 2019
|
|
|
250,000
|
0
|
0
|
0.15
|
0
|
July 3, 2019
|
|
|
450,000
|
0
|
0
|
0.20
|
0
|
February 26, 2020
|
| (1) | Based on a closing price of $0.05 (CAD$0.065) on June 30, 2016 and presuming all options are exercised. |
66
Outstanding Stock Appreciation Rights Grants
The Company had no stock appreciation rights as of June 30, 2016.
Outstanding Stock Awards at Year End
There were no outstanding stock awards as at June 30, 2016.
Options Exercises and Stocks Vested
No options were exercised and no stocks vested during the year ended June 30, 2016.
Grants of Plan-Based Awards
There were no grants of plan-based awards to a named executive officer during the year ended June 30, 2016.
Non-Qualified Deferred Compensation
The Company had no formalized deferred compensation plan as of June 30, 2016.
Other Compensation and Awards
The Company had no arrangements in place relating to the termination of employees or NEOs (i.e. no Golden Parachute Compensation) as of June 30, 2016.
Long-Term Incentive Plan Awards Table
There Company had no Long-Term Incentive Plans in place as of June 30, 2016.
Pension Benefits
The Company had no pension or retirement plans as of June 30, 2016.
Compensation of Directors
The following table summarizes compensation paid to or earned by our directors who are not Named Executive Officers for their service as directors of our company during the fiscal year ended June 30, 2016. Other than stock options granted from time to time, directors currently receive no remuneration for their acting in such capacity.
|
Name and Principal Position
|
Salary
&
Consulting
Fees
($)(1) |
Bonus
($)
|
Option Awards
($)(2) |
Stock
Awards
($)
|
Non-Equity
Incentive Plans
($)
|
Change in
Pension Value
&
Non-Qualified
Deferred Compensation
($)
|
Other Compensation
&
Severance
($) |
Total
($)
|
|
John Sanderson,
Chairman (A)
|
0
|
0
|
33,149
|
0
|
0
|
0
|
0
|
33,149
|
|
V. Peter Harder,
Former Chairman (B)
|
0
|
0
|
33,149
|
0
|
0
|
0
|
0
|
33,149
|
|
Quentin Yarie,
Director
|
20,033
|
0
|
29,249
|
0
|
0
|
0
|
0
|
49,282
|
|
Albert A. Thiess, Jr.,
Director
|
0
|
0
|
29,249
|
0
|
0
|
0
|
0
|
29,249
|
|
Dean Comand,
Director
|
0
|
0
|
29,249
|
0
|
0
|
0
|
0
|
29,249
|
|
Dalton Larson,
Director
|
0
|
0
|
29,249
|
0
|
0
|
0
|
0
|
29,249
|
| (A) | Mr. Sanderson served as vice-chairman until his appointment as Chairman of the Board on March 23, 2016 upon the resignation of Mr. Harder. |
| (B) | Mr. Harder resigned as Chairman and Director on March 23, 2016. |
| (1) | These amounts include salary and/or consulting fees paid during the year. No bonuses have been paid. |
| (2) | These values represent the calculated Black-Scholes theoretical value of granted options. It is important to note that these granted options may or may not ever be exercised. Whether granted options are exercised or not will be based primarily, but not singularly, on the Company’s future stock price and whether the granted options become “in-the-money”. If these granted options are unexercised and expire, the cash value or benefit to the above noted individuals is $nil. |
67
Outstanding stock options granted to directors who are not Named Executive Officers as at June 30, 2016 are as follows:
|
Name and Principal Position
|
Number of Securities
Underlying Unexercised
Options Exercisable
(#)
|
Number of Securities
Underlying Unexercised
Options Un-Exercisable
(#)
|
Equity Incentive
Plan Awards:
Number of Securities
Underlying Unexercised
Unearned Options
(#)
|
Option Exercise Price
($)
|
Value Realized
if
Exercised
($)(1)
|
Option Expiration Date
|
|
John Sanderson,
Chairman
|
125,000
|
0
|
0
|
0.30
|
0
|
July 1, 2016
|
|
50,000
|
0
|
0
|
0.20
|
0
|
October 24, 2016
|
|
|
50,000
|
0
|
0
|
0.21
|
0
|
December 1, 2016
|
|
|
100,000
|
0
|
0
|
0.28
|
0
|
March 4, 2017
|
|
|
100,000
|
0
|
0
|
0.21
|
0
|
February 27, 2018
|
|
|
25,000
|
0
|
0
|
0.11
|
0
|
July 9, 2018
|
|
|
50,000
|
0
|
0
|
0.15
|
0
|
July 19, 2018
|
|
|
400,000
|
0
|
0
|
0.18
|
0
|
January 10, 2019
|
|
|
200,000
|
0
|
0
|
0.15
|
0
|
July 3, 2019
|
|
|
350,000
|
0
|
0
|
0.20
|
0
|
February 26, 2020
|
|
|
850,000
|
0
|
0
|
0.06
|
0
|
December 22, 2020
|
|
|
V. Peter Harder,
Former Chairman
|
225,000
|
0
|
0
|
0.30
|
0
|
July 1, 2016
|
|
25,000
|
0
|
0
|
0.20
|
0
|
October 24, 2016
|
|
|
75,000
|
0
|
0
|
0.21
|
0
|
December 1, 2016
|
|
|
100,000
|
0
|
0
|
0.28
|
0
|
March 4, 2017
|
|
|
275,000
|
0
|
0
|
0.21
|
0
|
February 27, 2018
|
|
|
25,000
|
0
|
0
|
0.11
|
0
|
July 9, 2018
|
|
|
250,000
|
0
|
0
|
0.15
|
0
|
October 9, 2018
|
|
|
250,000
|
0
|
0
|
0.18
|
0
|
January 10, 2019
|
|
|
250,000
|
0
|
0
|
0.15
|
0
|
July 3, 2019
|
|
|
300,000
|
0
|
0
|
0.20
|
0
|
February 26, 2020
|
|
|
850,000
|
0
|
0
|
0.06
|
0
|
December 22, 2020
|
|
|
Quentin Yarie,
Director
|
300,000
|
0
|
0
|
0.30
|
0
|
July 1, 2016
|
|
50,000
|
0
|
0
|
0.20
|
0
|
October 24, 2016
|
|
|
150,000
|
0
|
0
|
0.21
|
0
|
December 1, 2016
|
|
|
300,000
|
0
|
0
|
0.28
|
0
|
March 4, 2017
|
|
|
300,000
|
0
|
0
|
0.21
|
0
|
February 27, 2018
|
|
|
100,000
|
0
|
0
|
0.11
|
0
|
July 9, 2018
|
|
|
50,000
|
0
|
0
|
0.15
|
0
|
July 19, 2018
|
|
|
425,000
|
0
|
0
|
0.18
|
0
|
January 10, 2019
|
|
|
250,000
|
0
|
0
|
0.15
|
0
|
July 3, 2019
|
|
|
350,000
|
0
|
0
|
0.20
|
0
|
February 26, 2020
|
|
|
750,000
|
0
|
0
|
0.06
|
0
|
December 22, 2020
|
|
|
Albert A. Thiess, Jr.,
Director
|
180,000
|
0
|
0
|
0.23
|
0
|
May 23, 2017
|
|
100,000
|
0
|
0
|
0.21
|
0
|
February 27, 2018
|
|
|
25,000
|
0
|
0
|
0.11
|
0
|
July 9, 2018
|
|
|
125,000
|
0
|
0
|
0.18
|
0
|
January 10, 2019
|
|
|
195,000
|
0
|
0
|
0.20
|
0
|
February 26, 2020
|
|
|
750,000
|
0
|
0
|
0.06
|
0
|
December 22, 2020
|
|
|
Dean Comand,
Director
|
400,000
|
0
|
0
|
0.20
|
0
|
February 26, 2020
|
|
750,000
|
0
|
0
|
0.06
|
0
|
December 22, 2020
|
|
|
Dalton Larson,
Director
|
200,000
|
0
|
0
|
0.20
|
0
|
February 26, 2020
|
|
750,000
|
0
|
0
|
0.06
|
0
|
December 22, 2020
|
|
| (1) | Based on a closing price of $0.09 on June 30, 2015 and presuming all options are exercised. |
68
EQUITY COMPENSATION PLAN INFORMATION
The following table sets forth information as of June 30, 2016 for (i) all compensation plans approved by the Company's security holders and (ii) all compensation plans not approved by the Company's security holders.
|
Plan Category
|
Number of securities to be issued upon exercise of outstanding options, and warrants
(#)
|
Weighted-average exercise price of outstanding options and warrants
($)
|
Number of securities remaining available for future under equity compensation plans (excluding securities reflected in column (a)
(#)
|
|
Equity compensation plans approved by security holders
|
41,965,000
|
$0.18
|
1,035,000
|
|
Equity compensation plans not approved by security holders
|
--
|
--
|
--
|
The following table sets forth information as of June 30, 2016 for the equity compensation plans.
|
Group
|
Number of Securities
Underlying Unexercised
Options Exercisable
(#)
|
Option Grant
Date
|
Additional Consideration
to be
Received Upon Exercise
or
Material Conditions
required to
Exercise
|
Option Exercise Price
($)
|
Option Expiration Date
|
|
Current
Named Executive Officers (NEO)
as of
June 30, 2016
|
800,000
|
July 1, 2011
|
None
|
0.30
|
July 1, 2016
|
|
0
|
July 13, 2012
|
None
|
0.29
|
July 13, 2016
|
|
|
400,000
|
October 24, 2011
|
None
|
0.20
|
October 24, 2016
|
|
|
400,000
|
December 1, 2011
|
None
|
0.21
|
December 1, 2016
|
|
|
875,000
|
March 7, 2012
|
None
|
0.28
|
March 4, 2017
|
|
|
0
|
May 23, 2012
|
None
|
0.23
|
May 23, 2017
|
|
|
1,525,000
|
February 27, 2013
|
None
|
0.21
|
February 27, 2018
|
|
|
355,000
|
July 9, 2013
|
None
|
0.11
|
July 9, 2018
|
|
|
75,000
|
July 19, 2013
|
None
|
0.15
|
July 19, 2018
|
|
|
0
|
October 9, 2013
|
None
|
0.13
|
October 9, 2018
|
|
|
1,200,000
|
January 10, 2014
|
None
|
0.18
|
January 10, 2019
|
|
|
650,000
|
July 3, 2014
|
None
|
0.15
|
July 3, 2019
|
|
|
1,270,000
|
February 26, 2015
|
None
|
0.20
|
February 26, 2020
|
|
|
3,200,000
|
December 22, 2015
|
None
|
0.06
|
December 22, 2020
|
|
|
Total
|
10,750,000
|
||||
|
Current
Directors
as of
June 30, 2016
|
775,000
|
July 1, 2011
|
None
|
0.30
|
July 1, 2016
|
|
0
|
July 13, 2012
|
None
|
0.29
|
July 13, 2016
|
|
|
300,000
|
October 24, 2011
|
None
|
0.20
|
October 24, 2016
|
|
|
400,000
|
December 1, 2011
|
None
|
0.21
|
December 1, 2016
|
|
|
925,000
|
March 7, 2012
|
None
|
0.28
|
March 4, 2017
|
|
|
180,000
|
May 23, 2012
|
None
|
0.23
|
May 23, 2017
|
|
|
1,325,000
|
February 27, 2013
|
None
|
0.21
|
February 27, 2018
|
|
|
330,000
|
July 9, 2013
|
None
|
0.11
|
July 9, 2018
|
|
|
100,000
|
July 19, 2013
|
None
|
0.15
|
July 19, 2018
|
|
|
0
|
October 9, 2013
|
None
|
0.13
|
October 9, 2018
|
|
|
1,750,000
|
January 10, 2014
|
None
|
0.18
|
January 10, 2019
|
|
|
700,000
|
July 3, 2014
|
None
|
0.15
|
July 3, 2019
|
|
|
2,315,000
|
February 26, 2015
|
None
|
0.20
|
February 26, 2020
|
|
|
5,550,000
|
December 22, 2015
|
None
|
0.06
|
December 22, 2020
|
|
|
Total
|
14,650,000
|
||||
|
Current
Directors
that are not
Named Executive Officers (NEO)
as of
June 30, 2016
|
425,000
|
July 1, 2011
|
None
|
0.30
|
July 1, 2016
|
|
0
|
July 13, 2012
|
None
|
0.29
|
July 13, 2016
|
|
|
100,000
|
October 24, 2011
|
None
|
0.20
|
October 24, 2016
|
|
|
200,000
|
December 1, 2011
|
None
|
0.21
|
December 1, 2016
|
|
|
400,000
|
March 7, 2012
|
None
|
0.28
|
March 4, 2017
|
|
|
180,000
|
May 23, 2012
|
None
|
0.23
|
May 23, 2017
|
|
|
500,000
|
February 27, 2013
|
None
|
0.21
|
February 27, 2018
|
|
|
150,000
|
July 9, 2013
|
None
|
0.11
|
July 9, 2018
|
|
|
100,000
|
July 19, 2013
|
None
|
0.15
|
July 19, 2018
|
|
|
0
|
October 9, 2013
|
None
|
0.13
|
October 9, 2018
|
|
|
950,000
|
January 10, 2014
|
None
|
0.18
|
January 10, 2019
|
|
|
450,000
|
July 3, 2014
|
None
|
0.15
|
July 3, 2019
|
|
|
1,495,000
|
February 26, 2015
|
None
|
0.20
|
February 26, 2020
|
|
|
3,850,000
|
December 22, 2015
|
None
|
0.06
|
December 22, 2020
|
|
|
Total
|
8,800,000
|
||||
69
|
Group
|
Number of Securities
Underlying Unexercised
Options Exercisable
(#)
|
Option Grant
Date
|
Additional Consideration
to be
Received Upon Exercise
or
Material Conditions
required to
Exercise
|
Option Exercise Price
($)
|
Option Expiration Date
|
|
Current
Employees
that are not
Named Executive Officers (NEO)
as of
June 30, 2016
|
150,000
|
July 1, 2011
|
None
|
0.30
|
July 1, 2016
|
|
0
|
July 13, 2012
|
None
|
0.29
|
July 13, 2016
|
|
|
40,000
|
October 24, 2011
|
None
|
0.20
|
October 24, 2016
|
|
|
15,000
|
December 1, 2011
|
None
|
0.21
|
December 1, 2016
|
|
|
190,000
|
March 7, 2012
|
None
|
0.28
|
March 4, 2017
|
|
|
0
|
May 23, 2012
|
None
|
0.23
|
May 23, 2017
|
|
|
200,000
|
February 27, 2013
|
None
|
0.21
|
February 27, 2018
|
|
|
5,000
|
July 9, 2013
|
None
|
0.11
|
July 9, 2018
|
|
|
75,000
|
July 19, 2013
|
None
|
0.15
|
July 19, 2018
|
|
|
0
|
October 9, 2013
|
None
|
0.13
|
October 9, 2018
|
|
|
350,000
|
January 10, 2014
|
None
|
0.18
|
January 10, 2019
|
|
|
375,000
|
July 3, 2014
|
None
|
0.15
|
July 3, 2019
|
|
|
150,000
|
February 26, 2015
|
None
|
0.20
|
February 26, 2020
|
|
|
0
|
December 22, 2015
|
None
|
0.06
|
December 22, 2020
|
|
|
Total
|
1,550,000
|
||||
|
All Outstanding Options
as of
June 30, 2016
|
3,300,000
|
July 1, 2011
|
None
|
0.30
|
July 1, 2016
|
|
1,650,000
|
July 13, 2012
|
None
|
0.29
|
July 13, 2016
|
|
|
1,640,000
|
October 24, 2011
|
None
|
0.20
|
October 24, 2016
|
|
|
1,785,000
|
December 1, 2011
|
None
|
0.21
|
December 1, 2016
|
|
|
4,900,000
|
March 7, 2012
|
None
|
0.28
|
March 4, 2017
|
|
|
180,000
|
May 23, 2012
|
None
|
0.23
|
May 23, 2017
|
|
|
4,900,000
|
February 27, 2013
|
None
|
0.21
|
February 27, 2018
|
|
|
1,080,000
|
July 9, 2013
|
None
|
0.11
|
July 9, 2018
|
|
|
675,000
|
July 19, 2013
|
None
|
0.15
|
July 19, 2018
|
|
|
250,000
|
October 9, 2013
|
None
|
0.13
|
October 9, 2018
|
|
|
4,400,000
|
January 10, 2014
|
None
|
0.18
|
January 10, 2019
|
|
|
4,275,000
|
July 3, 2014
|
None
|
0.15
|
July 3, 2019
|
|
|
4,430,000
|
February 26, 2015
|
None
|
0.20
|
February 26, 2020
|
|
|
8,500,000
|
December 22, 2015
|
None
|
0.06
|
December 22, 2020
|
|
|
Total
|
41,965,000
|
||||
The Company has an authorized maximum of 43,000,000 stock options.
In addition, please note the following:
| · | There are no associates of any such directors, executive officers, or nominees to that have or are to receive options or any other person who received or is to receive 5 percent of such options, warrants or rights. |
| · | All of the stock options in the above noted table are convertible into common stock. |
| · | The exercise price of all of the stock options noted above were based on the most recent closing price prior to the granting of the stock options. |
| · | There are no cashless or other provisions aside from the right for the holder of the stock option to exercise. |
70
ITEM 12. – SECURITY OWNERSHIP OF CERTAIN BENEFICIAL OWNERS AND MANAGEMENT AND RELATED STOCKHOLDER MATTERS
The following table sets forth certain information regarding beneficial ownership of our common shares as of September 28, 2016, by: (i) each person who is known by the Company to own beneficially more than 5% of our common shares; (ii) each current director of the Company; (iii) each current Named Executive Officers; and (iv) all directors and Named Executive Officers of the Company as a group.
The number and percentage of shares beneficially owned is determined in accordance with Rule 13d-3 under the Exchange Act, and the information is not necessarily indicative of beneficial ownership for any other purpose. These rules generally attribute beneficial ownership of securities to persons who possess sole or shared voting power or investment power with respect to those securities and include ordinary shares issuable upon the exercise of stock options that are immediately exercisable or exercisable within 60 days. Except as otherwise indicated, all persons listed below have sole voting and investment power with respect to the shares beneficially owned by them, subject to applicable community property laws. The Company believes that each individual or entity named has sole investment and voting power with respect to the securities indicated as beneficially owned by them, subject to community property laws, where applicable, except where otherwise noted.
The “Number of Common Shares Beneficially Owned” is the sum of common shares outstanding (460,995,711) plus common share purchase warrants (65,242,431) plus common stock purchase options entitled to exercise (37,015,000). The aggregate is 563,253,142 and is used as the denominator for the percentage calculation below.
|
Name, Principal Position and Address
|
Common Shares
Owned
(#)
|
Common Share
Purchase Warrants
(#)
|
Common Share
Stock Purchase
Options
(#)
|
Number of
Common Shares
Beneficially Owned
(#)
|
Percentage of
Common Shares
Beneficially Owned
(%)
|
|
Goodman & Company, Investment Counsel Inc.,(4)
2100-1 Adelaide Street East, Ontario, Canada
|
89,231,000
|
0
|
0
|
89,231,000
|
15.8%
|
|
VR Capital Group Ltd.,
Dubai International Financial Centre, Gate Village 4, Suite 402, Dubai, UAE
|
40,509,520
|
1,667,000(1)
|
0
|
42,176,520
|
7.5%
|
|
JP Morgan & Co., (5)
270 Park Avenue, New York, NY 10017
|
25,178,410
|
0
|
0
|
25,178,410
|
4.5%
|
|
Craig Scherba,
CEO, President & Director
1480 Willowdown Road, Oakville, ON, Canada
|
0
|
0
|
4,250,000
|
4,250,000
|
0.7%
|
|
Marc Johnson,
CFO
59 East Liberty Street, Toronto, ON, Canada
|
0
|
0
|
750,000
|
750,000
|
0.1%
|
|
Brent Nykoliation,
SVP Corporate Development
161 Fallingbrook Road, Toronto, ON, Canada
|
0
|
0
|
4,150,000
|
4,150,000
|
0.7%
|
|
John Sanderson,
Chairman of the Board & Director
1721-27th Street, West Vancouver, BC, Canada
|
0
|
0
|
2,300,000
|
2,300,000
|
0.4%
|
|
Robin Borley,
SVP Mine Development & Director
Waterfall Country Estate, Gauteng, South Africa
|
0
|
2,787,857(2)
|
1,600,000
|
4,387,857
|
0.8%
|
|
Quentin Yarie,
Director
196 McAllister Road, North York, ON, Canada
|
0
|
0
|
3,025,000
|
3,025,000
|
0.5%
|
|
Albert A. Thiess, Jr.,
Director
8 Lawson’s Pond Court, Bluffton, SC, USA
|
70,000
|
0
|
1,375,000
|
1,445,000
|
0.2%
|
|
Dean Comand,
Director
131 Garden Avenue, Ancaster, ON, Canada
|
0
|
0
|
1,150,000
|
1,150,000
|
0.2%
|
|
Dalton Larson,
Director
3629 Canterbury Drive, Surrey, BC , Canada
|
0
|
100,000(3)
|
950,000
|
1,050,000
|
0.2%
|
|
All Directors and
Named Executive Officers as a group
|
70,000
|
2,887,857
|
19,550,000
|
22,507,857
|
4.0%
|
| (1) | These warrants expire May 4, 2018 and have an exercise price of $0.14. |
| (2) | These warrants expire April 11, 2018 and have an exercise price of $0.11. |
| (3) | These warrants expire January 31, 2017 and have an exercise price of $0.18. |
| (4) | The control person is Brett Whalen, Vice President and Portfolio Manager. |
| (5) | The control person is Neil Gregson, Portfolio Manager, Natural Resources Fund, J.P. Morgan Asset Management. |
71
Changes in Control
We are not aware of any arrangements that may result in a change in control of the Company.
ITEM 13. - CERTAIN RELATIONSHIPS AND RELATED TRANSACTIONS, AND DIRECTOR INDEPENDENCE
Except as noted under the section “Compensation of Executives” and below, none of the following parties has any material interest, direct or indirect, in any transaction with us or in any presently proposed transaction with us that has or will materially affect us: (1) any of our directors or officers; (2) any person proposed as a nominee for election as a director; (3) any person who beneficially owns, directly or indirectly, shares carrying more than 10% of the voting rights attached to our outstanding shares of common stock; (4) any of our promoters; and (5) any relative or spouse of any of the foregoing persons who has the same house as such person.
Parties are related if one party has the ability, directly or indirectly, to control the other party or exercise significant influence over the other party in making operating and financial decisions. Parties are also related if they are subject to common control or common significant influence. Related parties may be individuals or corporate entities. A transaction is considered to be a related party transaction when there is a transfer of resources or obligations between related parties. Related party transactions that are in the normal course of business and have commercial substance are measured at the exchange amount.
The following related party transactions occurred during the year ended June 30, 2016:
| a) | The Company incurred $68,293 in general and administrative costs (June 30, 2015: $98,595) from a public company related by common management, Red Pine Exploration Inc. (TSX.V: "RPX"). During the year the Company forgave the $68,293 in general and administrative costs as a result of a cost settlement agreement between the Companies. The accounts payable balance for general and administrative costs due to RPX was $nil at the end of the year (June 30, 2015: $24,048). |
| b) | The Company incurred $556,982 in mineral exploration, management and consulting fees paid or accrued directly to directors and officers or to companies under their control (June 30, 2015: $629,204). The accounts payable balance for these expenditures was $42,000 at the end of the year (June 30, 2015: $nil). |
| c) | The Company incurred $125,047 in severance costs paid or accrued directly to former officers. The accounts payable balance for these costs was $34,010 at the end of the year (June 30, 2015: $46,292). |
| d) | The Company incurred $nil in mineral exploration from a mining and engineering firm for which one of the Company’s Director services as a senior officer and director (June 30, 2015: $1,927,797), which is included in mineral exploration expenses. |
| e) | The Company granted 7,900,000 common stock purchase options to directors and officers of the Company (June 30, 2015: 6,680,000). These common stock purchase options were valued at $308,092 using the Black-Scholes option pricing model (June 30, 2015: $438,035), which is included in stock-based compensation. |
| f) | The Company received a principal repayment of $76,450 (June 30, 2015: $nil) during the year from MacDonald Mines Exploration Ltd. (TSXV: BMK), a company related by way of common management, for an outstanding loan. |
72
ITEM 14. - PRINCIPAL ACCOUNTING FEES AND SERVICES
The Board considers that the work done in the year ended June 30, 2016 by our company’s external auditors, MNP LLP is compatible with maintaining MNP LLP. All of the work expended by MNP LLP on our June 30, 2016 audit was attributed to work performed by MNP LLP’s full-time, permanent employees.
Audit Fees: The aggregate fees, including expenses, billed by the Company’s auditor in connection with the audit of our financial statements for the most recent fiscal year and for the review of our financial information included in our Annual Report on Form 10-K and our quarterly reports on Form 10-Q during the fiscal year ending June 30, 2016 was CAD$81,855 (June 30, 2015: CAD$40,000).
Audit-Related Fees: The aggregate fees, including expenses, billed by the Company’s auditor for services reasonably related to the audit for the year ended June 30, 2016 were $nil (June 30, 2015: CAD$8,230).
All Other Fees: The aggregate fees, including expenses, billed for all other services rendered to the Company by its auditor during year ended June 30, 2016 was CAD$22,898 (June 30, 2015: $nil).
73
ITEM 15. – EXHIBITS
Exhibit Number & Description
| 3.1 | Articles of Incorporation of Uranium Star Corp. (now known as Energizer Resources Inc.) (Incorporated by reference to Exhibit 3.1 to the registrant’s current report on Form 8-K as filed with the SEC on May 20, 2008) |
| 3.2 | Articles of Amendment to Articles of Incorporation of Uranium Star Corp. changing its name to Energizer Resources Inc. (Incorporated by reference to Exhibit 3.1 to the registrant’s current report on Form 8-K filed with the SEC on July 16, 2010) |
| 3.3 | Amended and Restated By-Laws of Energizer Resources Inc. (Incorporated by reference to Exhibit 3.2 to the registrant’s current report on Form 8-K as filed with the SEC on July 16, 2010) |
| 3.4 | Amendment to the By-Laws of Energizer Resources Inc. (Incorporated by reference to the registrant’s current report on Form 8-K as filed with the SEC on October 16, 2013) |
| 4.1 | Amended and Restated 2006 Stock Option Plan of Energizer Resources, Inc. (as of February 2009) (Incorporated by reference to Exhibit 4.1 to the registrant's Form S-8 registration statement as filed with the SEC on February 19, 2010) |
| 4.2 | Form of broker Subscription Agreement for Units (Canadian and Offshore Subscribers) (Incorporated by reference to Exhibit 4.1 to the registrant’s current report on Form 8-K as filed with the SEC on March 19, 2010) |
| 4.3 | Form of standard Subscription Agreement for Units (Canadian and Offshore Subscribers) (Incorporated by reference to Exhibit 4.2 to the registrant’s current report on Form 8-K as filed with the SEC on March 19, 2010) |
| 4.4 | Form of Warrant to Purchase common shares (Incorporated by reference to Exhibit 4.3 to the registrant’s current report on Form 8-K as filed with the SEC on March 19, 2010) |
| 4.5 | Form of Class A broker warrant to Purchase common shares (Incorporated by reference to Exhibit 4.4 to the registrant’s current report on Form 8-K as filed with the SEC on March 19, 2010) |
| 4.6 | Form of Class B broker warrant to Purchase common shares (Incorporated by reference to Exhibit 4.5 to the registrant’s current report on Form 8-K as filed with the SEC on March 19, 2010) |
| 4.7 | Agency Agreement, dated March 15, 2010, between Energizer Resources, Clarus Securities Inc. and Byron Securities Limited (Incorporated by reference to Exhibit 4.6 to the registrant’s current report on Form 8-K filed with the SEC on March 19, 2010) |
| 4.8 | Form of Warrant relating to private placement completed during November 2012. |
| 4.9 | Agency Agreement relating to private placement completed during November 2012. |
| 4.10. | Amended and Restated Stock Option Plan of Energizer Resources, Inc. (Incorporated by reference to the registrant’s current report on Form 8-K as filed with the SEC on October 16, 2013) |
| 10.1 | Property Agreement effective May 14, 2004 between Thornton J. Donaldson and Thornton J. Donaldson, Trustee for Yukon Resources Corp. (Incorporated by reference to Exhibit 10.1 to the registrant's Form SB-2 registration statement as filed with the SEC on September 14, 2004) |
| 10.2 | Letter of Intent dated March 10, 2006 with Apofas Ltd. (Incorporated by reference to Exhibit 99.1 to the registrant's current report on Form 8-K as filed with the SEC on March 13, 2006) |
| 10.3 | Letter agreement effective May 12, 2006 between Yukon Resources Corp. and Virginia Mines Inc. (Incorporated by reference to Exhibit 99.1 to the registrant's current report on Form 8-K filed as with the SEC on May 9, 2006) |
| 10.4 | Joint Venture Agreement dated August 22, 2007 between Uranium Star Corp. & Madagascar Minerals and Resources Sarl (Incorporated by reference to Exhibit 10.1 to the registrant's Form 8-K as filed with SEC on September 11, 2007) |
| 10.5 | Share Purchase Agreement between Madagascar Minerals and Resources Sarl and THB Venture Limited (a subsidiary of Energizer Resources Inc.) dated July 9, 2009 (Incorporated by reference to Exhibit 10.5 to the registrant’s Form 10-K/A as filed on April 8, 2013) |
| 10.6 | Joint Venture Agreement between Malagasy Minerals Limited and Energizer Resources Inc. dated December 14, 2011 (Incorporated by reference to Exhibit 10.6 to the registrant’s Form 10-K/A as filed on April 8, 2013). |
| 10.7 | Agreement to Purchase Interest In Claims between Honey Badger Exploration Inc. and Energizer Resources Inc. dated February 28, 2014.(Incorporated by reference to Exhibit 10.7 to the registrant’s Form 10-Q as filed on May 14, 2014). |
| 10.8 | Sale and Purchase Agreement between Malagasy Minerals Limited and Energizer Resources Inc. dated April 16, 2014 (Incorporated by reference to Exhibit 10.8 to the registrant’s Form 10-Q as filed on May 14, 2014). |
| 10.9 | ERG Project Minerals Rights Agreement between Malagasy Minerals Limited and Energizer Resources Inc. dated April 16, 2014 (Incorporated by reference to Exhibit 10.9 to the registrant’s Form 10-Q as filed on May 14, 2014). |
| 10.10 | Green Giant Project Joint Venture Agreement between Malagasy Minerals Limited and Energizer Resources Inc. dated April 16, 2014 (Incorporated by reference to Exhibit 10.9 to the registrant’s Form 10-Q as filed on May 14, 2014). |
| 21 | Subsidiaries of the Registrant (Incorporated by reference to Exhibit 21.1 to the registrant’s annual report on Form 10-K filed with the SEC on September 21, 2009) |
| 31.1 | Certification of Chief Executive Officer Pursuant to Section 302 of the Sarbanes-Oxley Act. (filed herein) |
| 31.2 | Certification of Principal Financial & Accounting Officer Pursuant to Section 302 of the Sarbanes-Oxley Act. (filed herein) |
| 32.1 | Certification of Chief Executive Officer Pursuant to Section 906 of the Sarbanes-Oxley Act. (filed herein) |
| 32.2 | Certification of Chief Accounting Officer Pursuant to Section 906 of the Sarbanes-Oxley Act. (filed herein) |
74
WHERE YOU CAN FIND MORE INFORMATION
We file annual, quarterly and current reports, proxy statements and other information with the SEC. Our SEC filings are available to the public over the Internet at the SEC website at http://www.sec.gov. The public may also read and copy any document we file with the SEC at its Public Reference Room at 100 F Street, N.E., Washington, D.C. 20549, on official business days during the hours of 10:00 am to 3:00 pm. The public may obtain information on the operation of the Public Reference Room by calling the Commission at 1-800-SEC-0330. We maintain a website at http://www.energizerresources.com, (which website is expressly not incorporated by reference into this filing). Information contained on our website is not part of this report on Form 10-K.
75
SIGNATURES
Pursuant to the requirements of Section 13 or 15(d) of the Securities Exchange Act of 1934 the registrant has duly caused this report to be signed on its behalf by the undersigned, thereunto duly authorized.
ENERGIZER RESOURCES INC.
Dated: September 28, 2016
By: /s/ Craig Scherba
Name: Craig Scherba
Title: Chief Executive Officer and Director
Dated: September 28, 2016
By: /s/ Marc Johnson
Name: Marc Johnson
Title: Chief Financial Officer (Principal Accounting Officer)
Pursuant to the requirements of the Securities Exchange Act of 1934, this report has been signed below by the following persons in the capacities and on the dates indicated.
Dated: September 28, 2016
By: /s/ Craig Scherba
Name: Craig Scherba
Title: Chief Executive Officer, Director
By: /s/ John Sanderson
Name: John Sanderson
Title: Chairman of the Board, Director
By: /s/ Marc Johnson
Name: Marc Johnson
Title: Chief Financial Officer (Principal Accounting Officer)
By: /s/ Robin Borley
Name: Robin Borley
Title: SVP, Mine Development, Director
By: /s/ Quentin Yarie
Name: Quentin Yarie
Title: Director
By: /s/ Albert A. Thiess, Jr.
Name: Albert A. Thiess, Jr.
Title: Director
By: /s/ Dean Comand
Name: Dean Comand
Title: Director
By: /s/ Dalton Larson
Name: Dalton Larson
Title: Director
76
ENERGIZER RESOURCES INC.
(An Exploration Stage Company)
Consolidated Financial Statements
For the years ended June 30, 2016 and 2015
(Expressed in US Dollars)
77
Report of Independent Registered Public Accounting Firm
To the Board or Directors and Shareholders of Energizer Resources Inc.
We have audited the accompanying consolidated balance sheets of Energizer Resources Inc. as of June 30, 2016 and 2015, and the related consolidated statements of operations and comprehensive loss, stockholders' equity (deficiency), and cash flows for the years then ended. Energizer Resources Inc.’s management is responsible for these consolidated financial statements. Our responsibility is to express an opinion on these consolidated financial statements based on our audits.
We conducted our audits in accordance with the standards of the Public Company Accounting Oversight Board (United States). Those standards require that we plan and perform the audit to obtain reasonable assurance about whether the financial statements are free of material misstatement. Energizer Resources Inc. is not required to have, nor were we engaged to perform, an audit of its internal control over financial reporting. Our audit included consideration of internal control over financial reporting as a basis for designing audit procedures that are appropriate in the circumstances, but not for the purpose of expressing an opinion on the effectiveness of Energizer Resources Inc.’s internal control over financial reporting. Accordingly, we express no such opinion. An audit also includes examining, on a test basis, evidence supporting the amounts and disclosures in the consolidated financial statements, assessing the accounting principles used and significant estimates made by management, as well as evaluating the overall financial statement presentation. We believe that our audits provide a reasonable basis for our opinion.
In our opinion, the consolidated financial statements referred to above present fairly, in all material respects, the financial position of Energizer Resources Inc. as of June 30, 2016 and 2015, and the results of its operations and its cash flows for the years then ended in conformity with accounting principles generally accepted in the United States of America.
The accompanying consolidated financial statements have been prepared assuming the Company will continue as a going concern. As discussed in Note 1, the Company has experienced negative cash flows from operations since inception and has accumulated a significant deficit which raises substantial doubt about its ability to continue as a going concern. Management’s plans regarding these matters are also described in Note 1. The consolidated financial statements do not include any adjustments that might result from the outcome of this uncertainty.
|
|
 Chartered Professional Accountants
Licensed Public Accountants
|
Mississauga, Canada
September 28, 2016

78
Energizer Resources Inc.
Consolidated Balance Sheets
(Expressed in US Dollars)
|
|
June 30, 2016
|
June 30, 2015
|
||||||
|
Assets
|
||||||||
|
Current Assets:
|
||||||||
|
Cash and cash equivalents
|
544,813
|
779,118
|
||||||
|
Marketable securities (note 4)
|
-
|
7,615
|
||||||
|
Amounts receivable
|
13,955
|
49,484
|
||||||
|
Prepaid expenses
|
11,545
|
16,032
|
||||||
|
Loan to related party (note 7)
|
-
|
76,450
|
||||||
|
Total current assets
|
570,313
|
928,699
|
||||||
|
Equipment (note 5)
|
21,911
|
78,513
|
||||||
|
|
||||||||
|
Total Assets
|
592,224
|
1,007,212
|
||||||
|
Liabilities and Stockholders' Deficiency
|
||||||||
|
Liabilities
|
||||||||
|
Current Liabilities:
|
||||||||
|
Accounts payable (note 7)
|
215,391
|
95,580
|
||||||
|
Accrued liabilities
|
24,743
|
283,952
|
||||||
|
Contingency provision (note 16)
|
182,742
|
190,087
|
||||||
|
Warrant liability (note 13)
|
111,049
|
844,851
|
||||||
|
|
||||||||
|
Total Liabilities
|
533,925
|
1,414,470
|
||||||
|
Stockholders' Equity (Deficiency)
|
||||||||
|
Common stock
|
364,932
|
309,385
|
||||||
|
650,000,000 shares authorized, $0.001 par value, 364,931,425 issued and outstanding (June 30, 2015: 309,384,670) (note 10)
|
||||||||
|
Additional paid‑in capital (note 10)
|
93,654,114
|
91,614,714
|
||||||
|
Accumulated comprehensive loss
|
-
|
(4,323
|
)
|
|||||
|
Accumulated deficit
|
(93,960,747
|
)
|
(92,327,034
|
)
|
||||
|
|
||||||||
|
Total Stockholders' Equity (Deficiency)
|
58,299
|
(407,258
|
)
|
|||||
|
|
||||||||
|
Total Liabilities and Stockholders' Equity (Deficiency)
|
592,224
|
1,007,212
|
The accompanying notes are an integral part of these consolidated financial statements.
Nature of Operations and Going Concern (note 1)
Mineral Properties (note 6)
Subsequent Event (note 18)
79
Energizer Resources Inc.
Consolidated Statements of Operations and
Comprehensive Loss
(Expressed in US Dollars)
|
Year ended June 30,
2016
|
Year ended June 30,
2015
|
|||||||
|
Revenues
|
$
|
-
|
$
|
-
|
||||
|
Expenses
|
||||||||
|
Mineral exploration expense (notes 6, 7 and 15)
|
812,477
|
4,551,286
|
||||||
|
Professional and consulting fees (note 7)
|
811,704
|
629,817
|
||||||
|
General and administrative (note 7)
|
279,097
|
863,124
|
||||||
|
Stock‑based compensation (notes 7)
|
331,491
|
627,264
|
||||||
|
Depreciation (note 5)
|
56,602
|
47,872
|
||||||
|
Interest (note 9)
|
11,371
|
-
|
||||||
|
Foreign currency translation loss (gain)
|
106,036
|
208,194
|
||||||
|
Total expenses
|
2,408,778
|
6,927,557
|
||||||
|
Net Loss From Operations
|
(2,408,778
|
)
|
(6,927,557
|
)
|
||||
|
Other Income (Expenses)
|
||||||||
|
Investment income
|
623
|
10,111
|
||||||
|
Reduction of flow-through premium (note 8)
|
-
|
37,145
|
||||||
|
Reduction (increase) of flow-through provision (note 16)
|
-
|
(190,087
|
)
|
|||||
|
Gain on legal settlement (note 16)
|
59,556
|
-
|
||||||
|
Gain (loss) on sale of marketable securities (note 4)
|
(18,916
|
)
|
12,278
|
|||||
|
Change in value of warrant liability (note 13)
|
733,802
|
985,300
|
||||||
|
Net Loss
|
$
|
(1,633,713
|
)
|
$
|
(6,072,810
|
)
|
||
|
Unrealized gain (loss) from marketable securities
|
-
|
(816
|
)
|
|||||
|
Realized gain (loss) from marketable securities
in net loss
|
4,323
|
(12,278
|
)
|
|||||
|
Comprehensive Loss
|
$
|
(1,629,390
|
)
|
$
|
(6,085,904
|
)
|
||
|
Loss per share – basic and diluted
|
$
|
(0.00
|
)
|
$
|
(0.02
|
)
|
||
|
Weighted average shares outstanding (note 14)
|
343,243,652
|
294,044,398
|
||||||
The accompanying notes are an integral part of these consolidated financial statements.
80
Energizer Resources Inc.
Consolidated Statements of Cash Flows
(Expressed in US Dollars)
|
Year ended
June 30, 2016
|
Year ended
June 30, 2015
|
|||||||
|
Operating Activities
|
||||||||
|
Net loss
|
$
|
(1,633,713
|
)
|
$
|
(6,072,810
|
)
|
||
|
Adjustments to reconcile net loss to net cash used in operating activities:
|
||||||||
|
Depreciation
|
56,602
|
47,872
|
||||||
|
Stock‑based compensation
|
331,491
|
627,264
|
||||||
|
Gain (loss) on sale of marketable securities
|
8,068
|
(12,278
|
)
|
|||||
|
Change in value of warrant derivative liability
|
(733,802
|
)
|
(985,300
|
)
|
||||
|
Impairment of related party loan
|
-
|
53,603
|
||||||
|
Non-cash mineral property payments
|
-
|
100,000
|
||||||
|
Reduction of flow-through premium liability
|
-
|
(37,145
|
)
|
|||||
|
Change in operating assets and liabilities:
|
||||||||
|
Accounts receivable and prepaid expenses
|
40,016
|
365,080
|
||||||
|
Accounts payable and accrued liabilities
|
(139,398
|
)
|
(1,247,005
|
)
|
||||
|
Contingency provision
|
(7,345
|
)
|
-
|
|||||
|
Net cash used in operating activities
|
(2,078,081
|
)
|
(7,160,719
|
)
|
||||
|
Investing Activities
|
||||||||
|
Loan to related party
|
76,450
|
(35,541
|
)
|
|||||
|
Proceeds from sale of marketable securities
|
3,870
|
61,847
|
||||||
|
Net cash provided by investing activities
|
80,320
|
26,306
|
||||||
|
Financing Activities
|
||||||||
|
Proceeds from issuance of common stock, net of issue costs
|
1,763,456
|
6,591,097
|
||||||
|
Exercise of warrants
|
-
|
72,051
|
||||||
|
Net cash provided by financing activities
|
1,763,456
|
6,663,148
|
||||||
|
Cash and Cash Equivalents
|
||||||||
|
Net decrease in cash and cash equivalents
|
(234,305
|
)
|
(471,265
|
)
|
||||
|
Cash and cash equivalents ‑ beginning of year
|
779,118
|
1,250,383
|
||||||
|
Cash and cash equivalents ‑ end of year
|
$
|
544,813
|
$
|
779,118
|
||||
|
Supplemental Disclosures:
|
||||||||
|
Issuance of common stock for mineral properties
|
-
|
$
|
100,000
|
|||||
|
Interest Received
|
$
|
11,371
|
$
|
1,000
|
||||
The accompanying notes are an integral part of these consolidated financial statements.
81
Energizer Resources Inc.
Consolidated Statement of Stockholder’s Equity (Deficiency)
(Expressed in US Dollars)
|
Shares
#
|
Common Stock
$
|
Additional Paid-In
Capital
$
|
Accumulated Comprehensive Income (Loss)
$
|
Accumulated Deficit
$
|
Total
$
|
|||||||||||||||||||
|
Balance ‑ June 30, 2014
|
268,627,603
|
268,627
|
84,265,060
|
8,771
|
(86,254,224
|
)
|
(1,711,766
|
)
|
||||||||||||||||
|
Private placement of common shares subscribed
|
39,185,714
|
39,186
|
5,348,814
|
-
|
-
|
5,388,000
|
||||||||||||||||||
|
Cost of issue of private placement of common shares subscribed
|
-
|
-
|
(440,923
|
)
|
-
|
-
|
(440,923
|
)
|
||||||||||||||||
|
Private placement of special warrants subscribed
|
-
|
-
|
2,019,947
|
-
|
-
|
2,019,947
|
||||||||||||||||||
|
Cost of issue of private placement of special warrants subscribed
|
-
|
-
|
(375,927
|
)
|
-
|
-
|
(375,927
|
)
|
||||||||||||||||
|
Issuance of common stock for mineral property
|
1,000,000
|
1,000
|
99,000
|
-
|
-
|
100,000
|
||||||||||||||||||
|
Stock‑based compensation
|
-
|
-
|
627,264
|
-
|
-
|
627,264
|
||||||||||||||||||
|
Issuance of shares to exercise warrants
|
571,353
|
572
|
71,479
|
-
|
-
|
72,051
|
||||||||||||||||||
|
Realized loss on marketable securities
|
-
|
-
|
-
|
(12,278
|
)
|
-
|
(12,278
|
)
|
||||||||||||||||
|
Accumulated comprehensive loss
|
-
|
-
|
-
|
(816
|
)
|
-
|
(816
|
)
|
||||||||||||||||
|
Net loss for the year
|
-
|
-
|
-
|
-
|
(6,072,810
|
)
|
(6,072,810
|
)
|
||||||||||||||||
|
Balance ‑ June 30, 2015
|
309,384,670
|
309,385
|
91,614,714
|
(4,323
|
)
|
(92,327,034
|
)
|
(407,258
|
)
|
|||||||||||||||
|
Private placement of common shares subscribed
|
14,200,000
|
14,200
|
516,473
|
-
|
-
|
530,673
|
||||||||||||||||||
|
Private placement of common shares subscribed
|
6,437,900
|
6,438
|
322,539
|
-
|
-
|
328,977
|
||||||||||||||||||
|
Private placement of common shares subscribed
|
3,207,857
|
3,208
|
169,425
|
-
|
-
|
172,633
|
||||||||||||||||||
|
Private placement of common shares subscribed
|
11,150,000
|
11,150
|
771,580
|
-
|
-
|
782,730
|
||||||||||||||||||
|
Cost of issue of private placement of common shares subscribed
|
-
|
-
|
(51,557
|
)
|
-
|
-
|
(51,557
|
)
|
||||||||||||||||
|
Conversion of Special Warrants into common shares
|
20,550,998
|
20,551
|
(20,551
|
)
|
-
|
-
|
-
|
|||||||||||||||||
|
Stock‑based compensation
|
-
|
-
|
331,491
|
-
|
-
|
331,491
|
||||||||||||||||||
|
Loss on marketable securities
|
-
|
-
|
-
|
(3,745
|
)
|
-
|
(3,745
|
)
|
||||||||||||||||
|
Reclassified loss to profit or loss
|
-
|
-
|
-
|
8,068
|
-
|
8,068
|
||||||||||||||||||
|
Net loss for the year
|
-
|
-
|
-
|
-
|
(1,633,713
|
)
|
(1,633,713
|
)
|
||||||||||||||||
|
Balance ‑ June 30, 2016
|
364,931,425
|
364,932
|
93,654,114
|
-
|
(93,960,747
|
)
|
58,299
|
|||||||||||||||||
The accompanying notes are an integral part of these consolidated financial statements.
82
Energizer Resources Inc.
Notes to Consolidated Financial Statements
For the years ended June 30, 2016 and 2015
(Expressed in US Dollars)
1. Nature of Operations and Going Concern
Energizer Resources Inc. (the "Company") is incorporated in the State of Minnesota, USA and has a fiscal year end of June 30. The Company's principal business is the acquisition, exploration and development of mineral resources. The Company has yet to generate revenue from mining operations or pay dividends and is unlikely to do so in the immediate or foreseeable future.
During fiscal 2008, the Company incorporated Energizer Resources (Mauritius) Ltd. (“ERMAU”), a Mauritius subsidiary, and Energizer Resources Madagascar Sarl. (“ERMAD”), a Madagascar subsidiary of ERMAU. During fiscal 2009, the Company incorporated THB Ventures Ltd. (“THB”), a Mauritius subsidiary of ERMAU, and Energizer Resources Minerals Sarl. (“ERMIN”), a Madagascar subsidiary of THB, which holds the 100% ownership interest of the Green Giant Property in Madagascar (see note 6). During fiscal 2012, the Company incorporated Madagascar‑ERG Joint Venture (Mauritius) Ltd. (“ERGJVM”), a Mauritius subsidiary of ERMAU, and ERG (Madagascar) Sarl. (“ERGMAD”), a Madagascar subsidiary of ERGJVM, which holds the Malagasy Joint Venture Ground (see note 6). During fiscal 2014, the Company incorporated 2391938 Ontario Inc., an Ontario, Canada subsidiary.
As of June 30, 2016, the Company had accumulated losses of $93,960,748 (June 30, 2015: $92,327,034) and as such, there is substantial doubt regarding the Company's ability to continue as a going concern.
These consolidated financial statements have been prepared on a going concern basis, which assumes that the Company will continue to realize its assets and discharge its liabilities in the normal course of business. The continuation of the Company as a going concern is dependent upon the continued financial support from its shareholders, the ability of the Company to obtain necessary equity or debt financing to continue operations, the Company's ability to attract joint venture partners and off‑take contracts and the attainment of profitable operations. These consolidated financial statements do not include any adjustments to the recoverability and classification of recorded asset amounts and classification of liabilities that might be necessary should the Company be unable to continue as a going concern.
83
2. Significant Accounting Policies
Principals of Consolidation and Basis of Presentation
These consolidated financial statements are presented in accordance with accounting principles generally accepted in the United States ("U.S. GAAP"). These consolidated financial statements include the accounts of Energizer Resources Inc. and its wholly‑owned subsidiaries, Energizer Resources (Mauritius) Ltd., THB Ventures Ltd., Energizer Resources Madagascar Sarl, Energizer Resources Minerals Sarl, Madagascar‑ERG Joint Venture (Mauritius) Ltd., ERG (Madagascar) Sarl and 2391938 Ontario Inc. All inter‑company balances and transactions have been eliminated on consolidation.
Use of Estimates
The preparation of these consolidated financial statements requires management to make estimates and assumptions that affect the reported amounts of assets and liabilities and disclosure of contingent assets and liabilities at the date of these consolidated financial statements and the reported amounts of revenues and expenses during the period. On an ongoing basis, management evaluates its judgments and estimates in relation to assets, liabilities, revenue and expenses. Management uses past experience and other factors as the basis for its judgments and estimates. Actual results may differ from those estimates. The impacts of estimates are pervasive throughout these consolidated financial statements and may require accounting adjustments based on future occurrences. Revisions to accounting estimates are recognized in the period in which the estimate is revised and the revision affects current and future periods. Areas where significant estimates and assumptions are used include: the binomial valuation of the warrant liability, the Black‑Scholes valuation of warrants and stock options, the valuation recorded for future income taxes and the assumption that the Company will receive title to the properties after the Madagascar political situation stabilizes.
Cash and Cash Equivalents
Cash and cash equivalents include money market investments that are readily convertible to known amounts of cash and have an original maturity of less than or equal to 90 days.
Marketable Securities
The Company classifies and accounts for debt and equity securities in accordance with ASC Topic 320, "Accounting for Certain Investments in Debt and Equity Securities". The Company has classified all of its marketable securities as available for sale, thus securities are recorded at fair market value and any associated unrealized gain or loss, net of tax, are included as a separate component of stockholders’ equity, titled accumulated comprehensive loss. When an unrealized loss is classified as being other than temporary, it is expensed within the statement of operations and comprehensive loss.
Equipment
Equipment is recorded at cost, less accumulated depreciation, and consists of exploration equipment. Depreciation is computed on a straight line basis over 3 years, which coincides with its estimated useful life.
Mineral Property Costs
Mineral property acquisition and exploration costs are expensed as incurred. The Company has not yet realized any revenues from its mineral operations. When it has been determined that a mineral property can be economically developed as a result of establishing probable and proven reserves, the costs then incurred to develop such property will be capitalized. Such costs will be amortized using the units of production method over the estimated life of the probable reserve. If properties are abandoned or the carrying value is determined to be in excess of possible future recoverable amounts the Company will write off the appropriate amount.
84
2. Significant Accounting Policies (Continued)
Warrant Liability
The Company accounts for its derivative instruments not indexed to its stock as either assets or liabilities and carries them at fair value. Derivatives that are not defined as hedges must be adjusted to fair value through earnings. The Company has issued stock purchase warrants with exercise prices denominated in a currency other than its functional currency of U.S. dollars. As a result, these warrants were no longer considered to be solely indexed to the Company's common stock. Therefore, these warrants are classified as liabilities under the caption "warrant liability" and recorded at estimated fair value at each reporting date, computed using the Binomial valuation method. Changes in the liability from period to period are recorded in the statements of operations under the caption "change in value of warrant liability". The Company records the change in fair value of the warrant liability as a component of other income and expense on the statement of operations as it is believed the amounts recorded relate to financing activities and not as a result of our operations.
Comprehensive Income / (Loss)
ASC Topic 220, "Reporting Comprehensive Income", establishes standards for the reporting and display of comprehensive income, its components and accumulated balances.
Foreign Currency Translation
The Company's functional and reporting currency is United States Dollars. Monetary assets and liabilities denominated in foreign currencies are translated in accordance with ASC Topic 830, "Foreign Currency Translation", using the exchange rate prevailing at the balance sheet date. Gains and losses arising on settlement of foreign currency denominated transactions or balances are included in the consolidated statements of operations and comprehensive loss.
Long Lived Assets
In accordance with ASC Topic 360, "Accounting for Impairment or Disposal of Long Lived Assets", the carrying value of intangible assets and other long lived assets are tested for recoverability whenever events or changes in circumstances indicate that its carrying amount may not be recoverable. The Company recognizes impairment when the sum of the expected undiscounted future cash flows is less than the carrying amount of the asset. Impairment losses, if any, are measured as the excess of the carrying amount of the asset over its estimated fair value.
Basic and Diluted Net Income / (Loss) Per Share
The Company computes net earnings / (loss) per share in accordance with ASC Topic 260, "Earnings per Share". ASC Topic 260 requires presentation of basic and diluted earnings per share ("EPS") on the consolidated statement of operations and comprehensive loss. Basic EPS is computed by dividing net income / (loss) (numerator) by the weighted average number of shares outstanding (denominator) during the year. Diluted EPS gives effect to all dilutive potential common shares outstanding during the year using the treasury stock method and the "if converted" method for convertible instruments. In computing diluted EPS, the average stock price for the year is used in determining the number of shares assumed to be purchased from the exercise of stock options or warrants. Diluted EPS excludes all dilutive potential shares if their effect is anti-dilutive. Diluted EPS and the weighted average number of common shares exclude all dilutive potential shares since their effect is anti-dilutive.
Stock-Based Compensation
The Company has a Stock Option Plan (see Note 11). All stock based awards granted are accounted for using the fair value based method, using the more reliable measure of value of services and Black Scholes pricing model. The fair value of stock options granted is recognized as an expense within the consolidated statements of operations and comprehensive loss and a corresponding increase in additional paid in capital. Any consideration paid by eligible participants on the exercise of stock options is credited to common stock. The additional paid in capital amount associated with stock options is transferred to common stock upon exercise.
85
2. Significant Accounting Policies (Continued)
Income Taxes
The Company has adopted Topic 740 "Accounting for Income Taxes" which is required to compute tax asset benefits for net operating losses carried forward. Deferred income taxes are recorded for temporary differences between financial statement carrying amounts and the tax basis of assets and liabilities. Deferred tax assets and liabilities reflect the tax rates expected to be in effect for the years in which the differences are expected to reverse. A valuation allowance is provided if it is more likely than not that some of all of the deferred tax asset will not be realized. Potential benefits of net operating losses have not been recognized in these consolidated financial statements as the Company cannot be assured it is more likely than not it will utilize the net operating losses carried forward in future years. Management does not believe unrecognized tax benefits will significantly change within one year of the balance sheet date. Interest and penalties related to income tax matters are recognized in income tax expense. As of June 30, 2016, there was no interest or penalties related to uncertain tax positions.
Asset Retirement Obligations
The operations of the Company are subject to regulations governing the environment, including future site restoration for mineral properties. The Company will recognize the fair value of a liability for an asset retirement obligation in the period in which it is incurred and when a reasonable estimate of fair value can be made. If a reasonable estimate of fair value cannot be made in the period the asset retirement is incurred, the liability is recognized when a reasonable estimate of fair value can be made. The Company has determined that there are no asset retirement obligations or any other environmental obligations currently existing with respect to its mineral properties and therefore no liability has been recognized.
Financial Instruments
The fair value of cash and cash equivalents, marketable securities, loan to related parties and accounts payable and accrued liabilities were estimated to approximate their carrying values due to the immediate or short term maturity of these financial instruments. The Company's exploration operations are in Madagascar and Canada, which result in exposure to market risks from changes in foreign currency rates. Financial risk is the risk to the Company's operations that arise from movements in foreign exchange rates and the degree of volatility of these rates.
Fair Value of Financial Instruments Hierarchy
ASC Topic 820 establishes a fair value hierarchy that prioritizes the inputs used to measure fair value. The hierarchy gives the highest priority to unadjusted quoted prices in active markets for identical assets or liabilities (Level 1) and the lowest priority to unobservable inputs (Level 3). Cash and cash equivalents and marketable securities were in Level 1 within the fair value hierarchy. The three levels are as follows:
| · | Level 1 - Quoted prices are available in active markets for identical assets or liabilities as of the reporting date. Active markets are those in which transactions for the asset or liability occur in sufficient frequency and volume to provide pricing information on an ongoing basis. Level 1 includes marketable securities such as listed equities and U.S. government treasury securities. |
| · | Level 2 - Pricing inputs are other than quoted prices in active markets included in Level 1, which are either directly or indirectly observable as of the reporting date. Level 2 includes those financial instruments that are valued using industry standard models or other valuation methodologies. These models consider various assumptions, including quoted forward prices for commodities, time value, volatility factors, current market and contractual prices for the underlying instruments as well as other relevant economic measures. Substantially all of these assumptions are observable in the marketplace throughout the term of the instrument, can be derived from observable data or are supported by observable levels at which transactions are executed in the marketplace. Instruments in this category include the warrant liability. |
| · | Level 3 - Pricing inputs include significant inputs that are generally less observable from objective sources. These inputs may be used with internally developed methodologies that result in management's best estimate of fair value from the perspective of a market participant. Level 3 instruments include those that may be more structured or otherwise tailored to customers' needs. At each balance sheet date, the Company performs an analysis of all instruments subject to ASC Topic 820 and includes in Level 3 all of those whose fair value is based on significant unobservable inputs. |
86
3. Recent Accounting Pronouncements Potentially Affecting The Company
The following are recent FASB accounting pronouncements, which may have an impact on the Company's future consolidated financial statements.
| · | "Presentation of Financial Statements Going Concern (ASC Topic 205‑40): Disclosure of Uncertainties about an Entity’s Ability to Continue as a Going Concern ("ASU 2014‑15") was issued during August 2014. FASB issued guidance on how to account for and disclose going concern risks. This guidance is effective for annual periods beginning after December 15, 2016. |
| · | “Leases” (ASU 2016-02) was issued during February 2016. This update will require organizations that lease assets to recognize on the balance sheet the assets and liabilities for the rights and obligations created by those leases. The new guidance will also require additional disclosure about the amount, timing and uncertainty of cash flows arising from leases. This guidance is effective for annual and interim periods beginning after December 15, 2018. |
| · | “Compensation – Stock Compensation (Topic 718): Improvements to Employee Share-Based Payment Accounting” (ASU 2016-09) was issued in March 2016. This new standard provided guidance for the simplification of several aspects of the accounting for share-based payment transactions, including the income tax consequences, classification of awards as either equity or liabilities, and classification on the statement of cash flows. This standard is effective for annual periods beginning after December 15, 2016. |
The Company continues to evaluate the impact of ASU 2014‑15, ASU 2016-02 and ASU 2016-09 on its consolidated financial statements.
87
4. Marketable Securities
Marketable securities consist of available‑for‑sale securities over which the Company does not have significant influence or control.
During the year ended, the Company disposed of its remaining marketable securities and realized a loss $18,916 included in profit or loss (2015: gain of $12,278).
As at June 30, 2016, there was $nil invested in public companies (June 30, 2015: $7,615).
88
5. Equipment
The Company owns exploration equipment. For the year ended June 30, 2016, the depreciation expense totaled $56,602 (June 30, 2015: $47,872).
|
Equipment
Cost
$
|
Accumulated
Depreciation
$
|
Net Book
Value
$
|
||||||||||
|
Balance June 30, 2014
|
195,561
|
69,176
|
126,385
|
|||||||||
|
Add: Depreciation
|
47,872
|
|||||||||||
|
Balance June 30, 2015
|
195,561
|
117,048
|
78,513
|
|||||||||
|
Add: Depreciation
|
56,602
|
|||||||||||
|
Balance June 30, 2016
|
195,561
|
173,650
|
21,911
|
|||||||||
89
6. Mineral Properties
Molo Graphite Property, Southern Madagascar Region, Madagascar
On December 14, 2011 the Company entered into a Definitive Joint Venture Agreement ("JVA") with Malagasy Minerals Limited ("Malagasy"), a public company listed on the Australian Stock Exchange, to acquire a 75% interest in a property package for the exploration and development of industrial minerals, including graphite, vanadium and 25 other minerals. The land position consists of 2,119 permits covering 827.7 square kilometers and is mostly adjacent towards the south and east with the Company's 100% owned Green Giant Property. Pursuant to the JVA, the Company paid $2,261,690 and issued 7,500,000 common shares that were valued at $1,350,000.
On April 16, 2014, the Company signed a Sale and Purchase Agreement and a Mineral Rights Agreement (together “the Agreements”) with Malagasy to acquire the remaining 25% interest. Pursuant to the Agreements, the Company paid $364,480 (CAD$400,000), issued 2,500,000 common shares subject to a 12 month voluntary vesting period that were valued at $325,000 and issued 3,500,000 common share purchase warrants, which were valued at $320,950 using Black‑Scholes, with an exercise price of $0.14 and an expiry date of April 15, 2019. On May 20, 2015 and upon completion of a bankable feasibility study (“BFS”) for the Molo Graphite Property, the Company paid $546,000 (CAD$700,000) and issued 1,000,000 common shares, which were valued at $100,000.
Malagasy retains a 1.5% net smelter return royalty ("NSR") on the property. A further cash payment of approximately $720,900 (CAD$1,000,000) will be due within five days of the commencement of commercial production.
The Company also acquired a 100% interest in the industrial mineral rights additional claim blocks covering 10,811 hectares adjoining the east side of the Molo Graphite Property.
Green Giant Property, Southern Madagascar Region, Madagascar
In 2007, the Company entered into a joint venture agreement with Madagascar Minerals and Resources Sarl ("MMR") to acquire a 75% interest in the Green Giant Property. Pursuant to the agreement, the Company paid $765,000 in cash, issued 2,500,000 common shares and issued 1,000,000 common share purchase warrants, which have now expired.
On July 9, 2009, the Company acquired the remaining 25% interest by paying $100,000. MMR retains a 2% NSR. The first 1% NSR can be acquired at the Company's option by paying $500,000 in cash or common shares and the second 1% NSR can be acquired at the Company’s option by paying $1,000,000 in cash or common shares.
On April 16, 2014, the Company signed a Joint Venture Agreement with Malagasy, whereby Malagasy acquired a 75% interest in non‑industrial minerals on the Company's 100% owned Green Giant Property. On May 21, 2015, Malagasy terminated the Joint Venture Agreement, which as a result, the Company reverted to its original 100% interest in all minerals on the property.
Sagar Property, Labrador Trough Region, Quebec, Canada
In 2006, the Company purchased from Virginia Mines Inc. ("Virginia") a 100% interest in 382 claims located in northern Quebec, Canada. Virginia retains a 2% net smelter return royalty ("NSR") on certain claims within the property. Other unrelated parties also retain a 1% NSR and a 0.5% NSR on certain claims within the property, of which half of the 1% NSR can be acquired by the Company by paying $200,000 and half of the 0.5% NSR can be acquired by the Company by paying $100,000.
On February 28, 2014, the Company signed an agreement to sell a 35% interest in the Sagar property to Honey Badger Exploration Inc. (“Honey Badger”), a public company that is a related party through common management. The terms of the agreement were subsequently amended on July 31, 2014 and again on May 8, 2015. To earn the 35% interest, Honey Badger was required to complete a payment of $36,045 (CAD$50,000) by December 31, 2015, incur exploration expenditures of $360,450 (CAD$500,000) by December 31, 2016 and issue 20,000,000 common shares to the Company by December 31, 2015. Honey Badger did not complete the earn-in requirements by December 31, 2015 resulting in the termination of the option agreement.
90
7. Related Party Transactions and Balances
The Company had related party transactions during the year. Parties are related if one party has the direct or indirect ability to control or exercise significant influence over the other party in making operating and financial decisions. Parties are also related if they are subject to common control or common significant influence. Related parties include corporate entities, members of the Board of Directors and certain key management as well as companies controlled by these individuals.
A transaction is considered to be a related party transaction when there is a transfer of economic resources or financial obligations between related parties. Related party transactions that are in the normal course of business and have commercial substance are measured at the fair value.
The following related party transactions occurred during the year ended June 30, 2016:
| a) | The Company incurred $68,293 in general and administrative costs (June 30, 2015: $98,595) from a public company related by common management, Red Pine Exploration Inc. (TSX.V: "RPX"). During the year the Company forgave the $68,293 in general and administrative costs as a result of a cost settlement agreement between the Companies. The accounts payable balance for general and administrative costs due to RPX was $nil at the end of the year (June 30, 2015: $24,048). |
| b) | The Company incurred $556,982 in mineral exploration, management and consulting fees paid or accrued directly to directors and officers or to companies under their control (June 30, 2015: $629,204). The accounts payable balance for these expenditures was $42,000 at the end of the year (June 30, 2015: $nil). |
| c) | The Company incurred $125,047 in severance costs paid or accrued directly to former officers. The accounts payable balance for these costs was $34,010 at the end of the year (June 30, 2015: $46,292). |
| d) | The Company incurred $nil in mineral exploration from a mining and engineering firm for which one of the Company’s Director services as a senior officer and director (June 30, 2015: $1,927,797), which is included in mineral exploration expenses. |
| e) | The Company granted 7,900,000 common stock purchase options to directors and officers of the Company (June 30, 2015: 6,680,000). These common stock purchase options were valued at $308,092 using the Black-Scholes option pricing model (June 30, 2015: $438,035), which is included in stock-based compensation. |
| f) | The Company received a principal repayment of $76,450 (June 30, 2015: $nil) during the year from MacDonald Mines Exploration Ltd. (TSXV: BMK), a company related by way of common management, for an outstanding loan. |
91
8. Deferred Premium on Flow-Through Shares
The premium received by the Company for issuing flow-through shares, which are priced in excess of the market value of its common shares, is initially recognized as a financial liability. The flow-through premium liability is subsequently reduced on a pro‑rata basis as eligible Canadian Exploration Expenditures (“CEEs”) are incurred.
|
June 30,
2016
$
|
June 30,
2015
$
|
|||||||
|
Deferred premium, beginning of year
|
-
|
37,145
|
||||||
|
Recognition of deferred premium on issuance of flow-through shares
|
-
|
-
|
||||||
|
Reduction of deferred premium as CEEs are incurred
|
-
|
(37,145
|
)
|
|||||
|
Deferred premium, end of year
|
-
|
-
|
||||||
92
9. Short-Term Loan
On March 30, 2016, the Company received a short-term loan consisting of a $115,500 (CAD$150,000) debenture, which was secured against all assets of the Company and matured on June 29, 2016 plus interest and fees totaling $11,371 (CAD$15,000). The debenture was repaid in full prior to maturity.
93
10. Common Stock and Additional Paid‑in Capital
The authorized share capital of the Company is 650,000,000 shares with a $0.001 par value, of which 640,000,000 will be deemed as common shares. As of June 30, 2016, the Company had 364,931,425 common shares issued and outstanding (June 30, 2015: 309,384,670).
The Company issued the following common shares during the year ended June 30, 2016:
| (a) | On July 31, 2015, a total of 20,550,998 special common share purchase warrants with no exercise price were converted into one common share and one half one common share purchase warrants with an exercise price of $0.14 and an expiry date of May 4, 2018 (see also note 12). As a result, a total of 20,550,998 common shares and 10,275,499 common share purchase warrants were issued. |
| (b) | On October 7, 2015, the Company closed a private placement offering of 14,200,000 units (the “Units”) at a price of $0.04 (CAD$0.05) per unit, representing aggregate gross proceeds of $530,673 (CAD$710,000). Each Unit consisted of one common share of the Company and one half of one common share purchase warrant (each whole common share purchase warrant, a “Warrant”). Each Warrant entitles the holder to purchase one common share at a price of $0.07 per common share until October 6, 2017. |
| (c) | On February 4, 2016, the Company closed a private placement offering of 6,437,900 units (the “Units”) at a price of $0.05 (CAD$0.07) per unit, representing aggregate gross proceeds of $328,977 (CAD$450,653). Each Unit consisted of one common share of the Company and one common share purchase warrant (a “Warrant”). Each Warrant entitles the holder to purchase one common share at a price of $0.11 per common share until February 4, 2018. |
| (d) | On April 11, 2016, the Company closed a private placement offering of 3,207,857 units (the “Units”) at a price of $0.05 (CAD$0.07) per unit, representing aggregate gross proceeds of $172,633 (CAD$224,550). Each Unit consisted of one common share of the Company and one common share purchase warrant (a “Warrant”). Each Warrant entitles the holder to purchase one common share at a price of $0.11 per common share until April 11, 2018. |
| (e) | On May 17, 2016, the Company closed a private placement offering of 11,150,000 common shares at a price of $0.07 (CAD$0.09) for aggregate gross proceeds of $782,730 (CAD$1,003,500). |
The Company issued the following common shares during the year ended June 30, 2015:
(f)On September 18, 2014 a total of 571,353 broker common share purchase warrants were exercised at $0.11 per share for proceeds of $72,051.
| (g) | On September 26, 2014 the Company closed a private placement raising a total of $4,800,000. The Company issued 34,285,714 common shares at a price of $0.14. The Company paid fees, including commissions, legal fees and TSX fees of $413,225 and issued 1,928,571 compensation common share purchase warrants at an exercise price of $0.14 and an expiry date of September 26, 2016. |
| (h) | On December 16, 2014 the authorized capital of the Company was increased from an aggregate of four hundred fifty million (450,000,000) shares to six hundred fifty million (650,000,000) shares, par value of $0.001 per share, of which 640,000,000 will be deemed common shares and the remaining 10,000,000 will be deemed eligible to be divisible into classes, series and types as designated by the board of directors. |
| (i) | On December 30, 2014 the Company closed a private placement raising a total of $588,000. The Company issued 4,900,000 common shares at a price of $0.12. The Company paid fees, including commissions, legal fees and TSX fees of $27,698 and issued 147,000 compensation common share purchase warrants at an exercise price of $0.12 and an expiry date of December 30, 2016. |
94
10. Common Stock and Additional Paid‑in Capital (Continued)
| (j) | On May 4, 2015 the Company closed a private placement offering (the “Offering”) of 20,550,998 special warrants (“Special Warrants”) at a price of CAD$0.12 per Special Warrant, representing aggregate gross proceeds of $2,019,947 (CAD$2,466,120). Each Special Warrant entitles the holder, for no additional consideration, to acquire one unit (“Unit”) of the Company, with each Unit comprised of one common share of the Company and one‑half of one common share purchase warrant ("Warrant"). Each full Warrant entitles the holder to purchase one common share at a price of US$0.14 per common share until May 4, 2018. The Company paid fees, including commissions, legal fees and TSX fees of $375,927. On July 31, 2015, each of these Special Warrants were converted into one common share and one half one common share purchase warrant with an exercise price of $0.14 and an expiry date of May 4, 2018. |
| (k) | On May 20, 2015, the Company issued 1,000,000 shares of common stock at $0.10 per share valued at $100,000 as consideration for the Sale and Purchase Agreement and a Mineral Rights Agreements with Malagasy (note 6). |
95
11. Stock Options
The Company’s Stock Option Plan is restricted to a maximum of 43,000,000 common stock purchase options.
As of June 30, 2016 there were 41,965,000 common stock purchase options outstanding with a weighted average expiration of 2.28 years. All the outstanding common stock purchase options vested on their grant date.
|
Grant
Date
|
Expiration
Date
|
Notes
|
Exercise Price
|
Number of Options
|
||||||
|
July 1, 2011
|
July 1, 2016
|
$
|
0.30
|
3,300,000
|
||||||
|
July 13, 2012
|
July 13, 2016
|
$
|
0.29
|
1,650,000
|
||||||
|
October 24, 2011
|
October 24, 2016
|
$
|
0.20
|
1,640,000
|
||||||
|
December 1, 2011
|
December 1, 2016
|
$
|
0.21
|
1,785,000
|
||||||
|
March 7, 2012
|
March 4, 2017
|
$
|
0.28
|
4,900,000
|
||||||
|
May 23, 2012
|
May 23, 2017
|
$
|
0.23
|
180,000
|
||||||
|
February 27, 2013
|
February 27, 2018
|
$
|
0.21
|
4,900,000
|
||||||
|
July 9, 2013
|
July 9, 2018
|
$
|
0.11
|
1,080,000
|
||||||
|
September 19, 2013
|
July 19, 2018
|
$
|
0.15
|
675,000
|
||||||
|
October 9, 2013
|
October 9, 2018
|
$
|
0.13
|
250,000
|
||||||
|
January 10, 2014
|
January 10, 2019
|
$
|
0.18
|
4,400,000
|
||||||
|
July 3, 2014
|
July 3, 2019
|
$
|
0.15
|
4,275,000
|
||||||
|
February 26, 2015
|
February 26, 2020
|
$
|
0.20
|
4,430,000
|
||||||
|
December 22, 2015
|
December 22, 2020
|
(a)
|
$
|
0.06
|
8,500,000
|
|||||
|
Total Outstanding
|
41,965,000
|
|||||||||
| (a) | On December 22, 2015, the Company issued 8,500,000 stock options at an exercise price of $0.06 and an expiry date of December 22, 2020. The stock options were valued at $331,491 using the Black-Scholes pricing model with the following assumptions: risk free rate – 0.74%; expected volatility – 91%; dividend yield – NIL; and expected life – 5 years. These stock options vested on the grant date. |
The following is a continuity schedule of the Company's outstanding common stock purchase options from prior periods:
|
Weighted-Average
Exercise Price ($)
|
Number of
Stock Options
|
|||||||
|
Outstanding as of June 30, 2014
|
0.23
|
28,470,000
|
||||||
|
Granted
|
0.17
|
9,280,000
|
||||||
|
Exercised
|
-
|
-
|
||||||
|
Expired
|
0.21
|
(2,385,000
|
)
|
|||||
|
Outstanding as of June 30, 2015
|
0.22
|
35,365,000
|
||||||
|
Granted
|
0.06
|
8,500,000
|
||||||
|
Exercised
|
-
|
-
|
||||||
|
Expired
|
0.23
|
(1,900,000
|
)
|
|||||
|
Outstanding as of June 30, 2016
|
0.18
|
41,965,000
|
||||||
96
12. Warrants
As of June 30, 2016, there were 65,242,431 common share purchase warrants outstanding with a weighted average expiration of 1.1 years.
|
Issued
Date
|
Expiration
Date
|
Notes
|
Exercise
Price
|
Number of
Warrants
|
||||||
|
September 26, 2014
|
September 26, 2016
|
$
|
0.14
|
1,928,571
|
||||||
|
November 15, 2012
|
November 15, 2016
|
(a)
|
$
|
0.18
|
2,903,571
|
|||||
|
December 30, 2014
|
December 30, 2016
|
$
|
0.12
|
147,000
|
||||||
|
January 14, 2014
|
January 14, 2017
|
(b)
|
$
|
0.14
|
29,152,033
|
|||||
|
January 31, 2014
|
January 31, 2017
|
(b)
|
$
|
0.14
|
590,000
|
|||||
|
October 7, 2015
|
October 6, 2017
|
(c)
|
$
|
0.07
|
7,100,000
|
|||||
|
July 31, 2015
|
May 4, 2018
|
(d)
|
$
|
0.14
|
10,275,499
|
|||||
|
February 4, 2016
|
February 4, 2018
|
(e)
|
$
|
0.11
|
6,437,900
|
|||||
|
April 11, 2016
|
April 11, 2018
|
(f)
|
$
|
0.11
|
3,207,857
|
|||||
|
June 23, 2014
|
April 15, 2019
|
$
|
0.14
|
3,500,000
|
||||||
|
Total Outstanding
|
65,242,431
|
|||||||||
| (a) | On December 24, 2013, the Company re‑priced and extended the term of the common share purchase warrants from an original expiry date of November 15, 2015 with an exercise price of $0.23 to November 15, 2016 with an exercise price of $0.18. |
| (b) | These warrants were issued at a $0.18 CAD exercise price (see note 13). |
| (c) | These warrants were issued on October 7, 2015 as part of a private placement (see note 10). |
| (d) | These warrants were issued on July 31, 2015 as part of the conversion of special common share purchase warrants (see note 10). |
| (e) | These warrants were issued on February 4, 2016 as part of a private placement (see note 10). |
| (f) | These warrants were issued on April 11, 2016 as part of a private placement (see note 10). |
The following is the continuity schedule of the Company's common share purchase warrants from prior periods:
|
Weighted-Average
Exercise Price ($)
|
Number of
Warrants
|
|||||||
|
Outstanding as of June 30, 2014
|
0.16
|
*
|
42,555,729
|
|||||
|
Issued
|
0.01
|
22,626,569
|
||||||
|
Exercised
|
0.11
|
*
|
(571,353
|
)
|
||||
|
Expired
|
0.19
|
*
|
(992,028
|
)
|
||||
|
Outstanding as of June 30, 2015
|
0.10
|
*
|
63,618,917
|
|||||
|
Issued
|
0.11
|
27,021,256
|
||||||
|
Exercised
|
-
|
(20,550,998
|
)
|
|||||
|
Expired
|
0.12
|
*
|
(4,846,744
|
)
|
||||
|
Outstanding as of June 30, 2016
|
0.13
|
*
|
65,242,431
|
|||||
* Amount represents the converted USD exercise price
97
13. Warrant Derivative
The warrants expiring in January 2017 were issued in a currency other than the Company’s functional currency and therefore, in accordance with ASC 815 Derivatives and Hedging, are considered a derivative instrument and recorded on the balance sheet as a warrant liability. The fair value of the warrant liability was estimated on the date of issue and is re-measured at each reporting period using a binomial model until expiration or exercise of the underlying warrants.
The fair value of the warrant liability was estimated using the following model inputs:
|
Year Ended
June 30, 2016
|
Year Ended
June 30, 2015
|
|||||||
|
Exercise price
|
$
|
0.14
|
$
|
0.14
|
||||
|
Risk free rate
|
0.50
|
%
|
1.53
|
%
|
||||
|
Expected volatility
|
88
|
%
|
93.7
|
%
|
||||
|
Expected dividend yield
|
Nil
|
Nil
|
||||||
|
Expected life (in years)
|
0.55
|
1.48
|
||||||
|
Beginning balance, derivative warrant liability
|
$
|
844,851
|
$
|
1,830,151
|
||||
|
Gain on change in fair value of derivative warrant liability
|
(733,802
|
)
|
(985,300
|
)
|
||||
|
Ending balance, derivative warrant liability
|
$
|
111,049
|
$
|
844,851
|
||||
98
14. Loss Per Share
Basic and diluted loss per share is computed using the weighted average number of common shares outstanding during the reporting period. Diluted loss per share and the weighted average number of shares of common stock excludes all potentially dilutive shares since their effect is anti‑dilutive.
As of June 30, 2016, there was a total of 107,207,431 potentially dilutive warrants and options outstanding (June 30, 2015: 98,983,917).
15. Segmented Reporting
The Company operates one operating segment, which is the acquisition, exploration and development of mineral resources. No revenue has been generated by any mineral resource properties. All of the remaining assets are held in Canada. The Company's President and Chief Executive Officer and Chief Financial Officer are the operating decision‑makers and direct the allocation of resources to its geographic segments.
The following is the segmented information by geographic region:
|
Mineral Exploration Expense
|
Madagascar
$
|
Canada
$
|
Total
$
|
|||||||||
|
Year ended June 30, 2016
|
747,315
|
65,162
|
812,477
|
|||||||||
|
Year ended June 30, 2015
|
2,852,214
|
1,699,072
|
4,551,286
|
|||||||||
|
Cash and Equivalents
|
Madagascar
$
|
Canada
$
|
Total
$
|
|||||||||
|
As of June 30, 2016
|
29,239
|
515,574
|
544,813
|
|||||||||
|
As of June 30, 2015
|
65,299
|
713,819
|
779,118
|
|||||||||
99
16. Contingency Provision and Legal Settlement
| (a) | During fiscal 2014, the Company issued 17,889,215 flow-through shares to eligible Canadian taxpayer subscribers with contractual commitments for the Company to incur $3,812,642 in eligible Canadian Exploration Expenditures (“CEEs”) by December 31, 2014 as per the provision of the Income Tax Act of Canada. The CEEs were renounced as a tax credit to the flow-through share subscribers on December 31, 2013. As at December 31, 2014, the Company had unfulfilled CEE obligations. During the year ended June 30, 2015, the Company recorded a contingent provision for the Part XII.6 taxes and related penalties for the indemnification liability to subscribers for taxes and penalties related to the CEE renunciation shortfall of $190,087. During the year ended June 30, 2016, the Company adjusted the provision due to foreign exchange fluctuations to $182,742. |
| (b) | During fiscal 2016, the Company reached a legal settlement with a shareholder relating to potential “short-swing” profits under Section 16(b) of the Securities Exchange Act of 1934 in connection with purchases and sales of Company securities. As a result of the settlement, the Company recorded a gain of $59,556. |
100
17. Income Taxes
Below is a reconciliation of the United States income tax provision at the statutory rate of 35% to the actual provision:
|
June 30,
2016
|
June 30,
2015
|
|||||||
|
Net Loss
|
(1,633,713
|
)
|
(6,072,810
|
)
|
||||
|
Statutory rate
|
35.00
|
%
|
35.00
|
%
|
||||
|
Expected income tax recovery
|
(571,800
|
)
|
(2,125,480
|
)
|
||||
|
Tax rate changes and other adjustments
|
(703,720
|
)
|
352,480
|
|||||
|
Stock based compensation
|
116,020
|
219,540
|
||||||
|
Change in tax benefits not recognized
|
1,415,360
|
1,208,360
|
||||||
|
Non-deductible expenses
|
(255,860
|
)
|
345,100
|
|||||
|
Income tax recovery
|
-
|
-
|
||||||
Deferred Tax
The Company’s future income tax assets and liabilities as at June 30, 2016 and 2015 are as follows:
|
June 30,
2016
|
June 30,
2015
|
|||||||
|
Property, plant and equipment
|
29,230
|
-
|
||||||
|
Non-capital losses – United States
|
7,562,070
|
8,855,130
|
||||||
|
Exploration expenditures
|
11,259,980
|
8,300,770
|
||||||
|
Other deductible temporary differences
|
6,890
|
141,860
|
||||||
|
18,858,170
|
17,297,760
|
|||||||
|
Less: valuation allowance
|
(18,858,170
|
)
|
(17,297,760
|
)
|
||||
|
Net deferred tax liabilities
|
-
|
-
|
||||||
101
17. Income Taxes (Continued)
The United States net operating loss carry forwards expire as noted in the table below. The remaining deductible temporary differences may be carried forward indefinitely. Deferred tax assets have not been recognized in respect of these items because it is not probable that future taxable profit will be available against which the group can utilize the benefits there from.
The Company's United States net operating losses expire as follows:
|
Expiration Year
|
Tax Loss
$
|
|||
|
2025
|
4,130
|
|||
|
2026
|
29,460
|
|||
|
2027
|
283,870
|
|||
|
2028
|
909,180
|
|||
|
2029
|
341,250
|
|||
|
2030
|
3,435,600
|
|||
|
2031
|
3,998,670
|
|||
|
2032
|
5,264,970
|
|||
|
2033
|
4,660,880
|
|||
|
2034
|
3,642,800
|
|||
|
2035
|
4,944,850
|
|||
|
2036
|
4,655,730
|
|||
|
32,171,390
|
||||
102
18. Subsequent Events
On July 30, 2016, the Company concluded a legal settlement with the Company’s former Chief Financial Officer, whereby a severance of $34,457 (CAD$44,750) was awarded.
On August 18, 2016, the Company closed a private placement offering of 96,064,286 common shares at a price of $0.05 (CAD$0.07) for aggregate gross proceeds of $5,177,865 (CAD$6,724,500).
103