Attached files
| file | filename |
|---|---|
| 8-K - 8-K - RITE AID CORP | v449086_8k.htm |
| EX-99.1 - EXHIBIT 99.1 - RITE AID CORP | v449086_ex99-1.htm |
Exhibit 99.2

September 22, 2016

Safe Harbor Statement
InvestorsareurgedtoreviewRiteAid’sSECfilings.Statements,estimates,targetsandotherinformationincludedhereinmightbeconsideredforward-looking.Thesestatementsandestimatesarebaseduponvariousassumptionsthatmaynotprovetobecorrect.Suchassumptionsareinherentlysubjecttosignificantuncertaintiesandcontingencies,manyofwhicharebeyondthecompany’scontrol.Norepresentationismade,andnoassurancecanbegiven,thatsuchresultscanorwillbeattained.TheriskfactorsassociatedwiththoseuncertaintiesaredescribedinRiteAid’smostrecentForm10-K,itsForm10-Q’sandotherfilingswiththeSEC. RiteAidassumesnoobligationtoupdatetheinformationortheforward-lookingstatementscontainedherein,whetherasaresultofnewinformationorotherwise.Alsoincludedhereinarenon-GAAPfinancialmeasures.ThedefinitionandpurposeforusingthesemeasuresareinRiteAid’sForm8-KfurnishedtotheSEConthedatehereof.
Reconciliation of Non-GAAP Financial Measures ThecompanyseparatelyreportsfinancialresultsonthebasisofAdjustedNetIncome,AdjustedNetIncomeperdilutedshare,andAdjustedEBITDA,whicharenon-GAAPfinancialmeasures.AdjustedNetIncomeandAdjustedNetIncomeperdilutedshareexcludeamortizationofEnvisionRxintangibleassets,mergerandacquisition-relatedcosts,lossondebtretirementsandLIFOadjustments.AdjustedEBITDAisdefinedasnetincomeexcludingtheimpactofincometaxes,interestexpense,depreciationandamortization,LIFOadjustments,chargesorcreditsforfacilityclosingandimpairment,inventorywrite-downsrelatedtostoreclosings,debtretirementsandotheritems(includingstock-basedcompensationexpense,mergerandacquisition-relatedcosts,severanceandcostsrelatedtodistributioncenterclosures,gainorlossonsaleofassetsandrevenuedeferralsrelatedtoourcustomerloyaltyprogram).

Q2 -Fiscal 2017 Summary ($ in millions, except per share amounts) 13 Weeks Ended August 27, 201613 Weeks Ended August 29, 2015 Revenue8,029.8$ 7,664.8$ Net Income14.8$ 21.5$ Net Income per Diluted Share0.01$ 0.02$ Adjusted Net Income35.5$ 58.7$ Adjusted Net Income per Diluted Share0.03$ 0.06$ Adjusted EBITDA312.7$ 3.89%346.8$ 4.52%
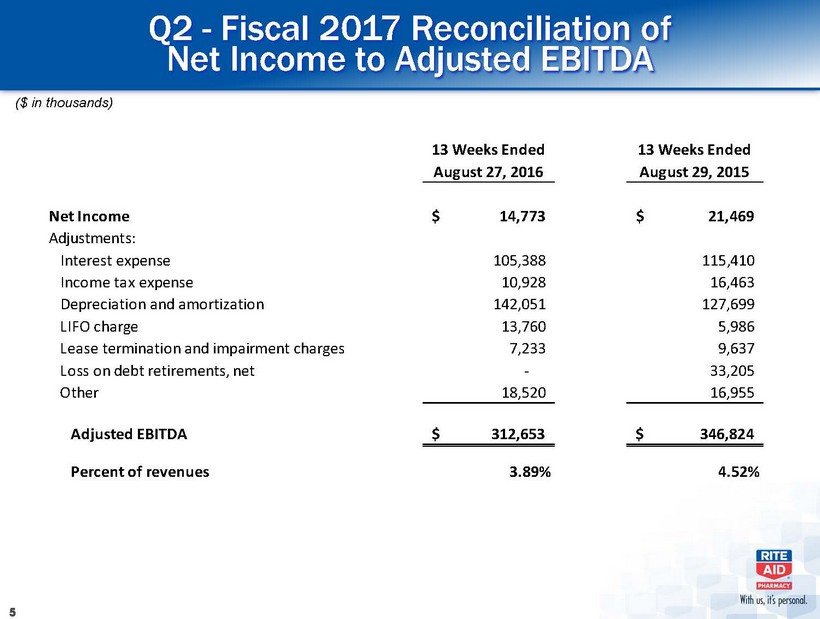
Q2 -Fiscal 2017 Reconciliation of Net Income to Adjusted EBITDA ($ in thousands)
13 Weeks Ended August 27, 201613 Weeks Ended August 29, 2015Net Income14,773$ 21,469$ Adjustments:Interest expense105,388 115,410 Income tax expense10,928 16,463 Depreciation and amortization142,051 127,699 LIFO charge13,760 5,986 Lease termination and impairment charges7,233 9,637 Loss on debt retirements, net- 33,205 Other18,520 16,955 Adjusted EBITDA312,653$ 346,824$ Percent of revenues3.89%4.52%

Q2 -Fiscal 2017 Reconciliation of Net Income to Adjusted Net Income 13 Weeks Ended August 27, 201613 Weeks Ended August 29, 2015Net Income $ 14,773 $ 21,469 Add back - Income tax expense 10,928 16,463 Income before income taxes25,701 37,932 Adjustments:Amortization of EnvisionRx intangible assets20,853 17,040 LIFO charge13,760 5,986 Loss on debt retirements, net- 33,205 Merger and acquisition-related costs1,402 9,617 Adjusted income before income taxes61,716$ 103,780$ Adjusted income tax expense26,229 45,041$ Adjusted net income35,487$ 58,739$ Net income per diluted share0.01$ 0.02$ Adjusted net income per diluted share0.03$ 0.06 ($ in thousands, except per share amounts)

Q2 -Fiscal 2017 SummaryRETAIL PHARMACY SEGMENT Revenue6,485.5$ 6,647.2$ Adjusted EBITDA Gross Profit1,839.1$ 28.36%1,866.8$ 28.08%Adjusted EBITDA SG&A1,576.5$ 24.31%1,553.2$ 23.37%Adjusted EBITDA262.6$ 4.05%313.6$ 4.72%($ in millions)

Q2 -Fiscal 2017 SummaryRETAIL PHARMACY SEGMENT 161.7 million or 2.4%, driven by a 1.8% decrease in comparable script growth and a decrease in reimbursement rates, offset slightly by a 0.1% increase in same store front end sales. EBITDA Gross Profit decreased $27.7 million, with Adjusted EBITDA Gross Margin improving by 28 bps. The decrease was driven by reductions in reimbursement rates and script volume, partially offset by an increase in front-end gross profit and improvements in prescription drug costs. EBITDA SG&A increased $23.3 million and increased 94 bps as a percentage of revenues. The increase in SG&A expenses is due to a shift in the timing of Memorial Day pay and increased benefit costs. The increase in SG&A rate is also due to our decline in revenue.
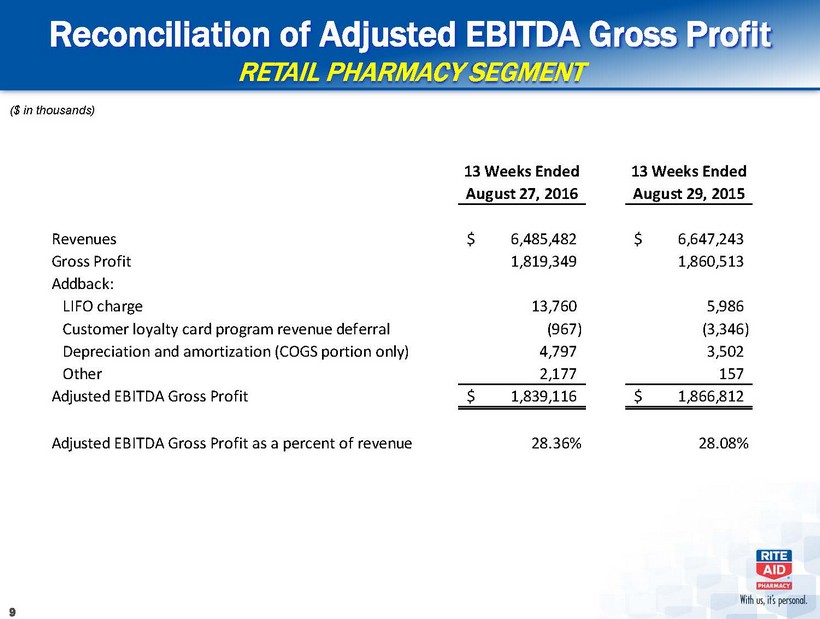
Reconciliation of Adjusted EBITDA Gross ProfitRETAIL PHARMACY SEGMENT 13 Weeks Ended August 27, 201613 Weeks Ended August 29, 2015Revenues6,485,482$ 6,647,243$ Gross Profit1,819,349 1,860,513 Addback:LIFO charge13,760 5,986 Customer loyalty card program revenue deferral(967) (3,346) Depreciation and amortization (COGS portion only)4,797 3,502 Other2,177 157 Adjusted EBITDA Gross Profit1,839,116$ 1,866,812$ Adjusted EBITDA Gross Profit as a percent of revenue28.36%28.08%($ in thousands)
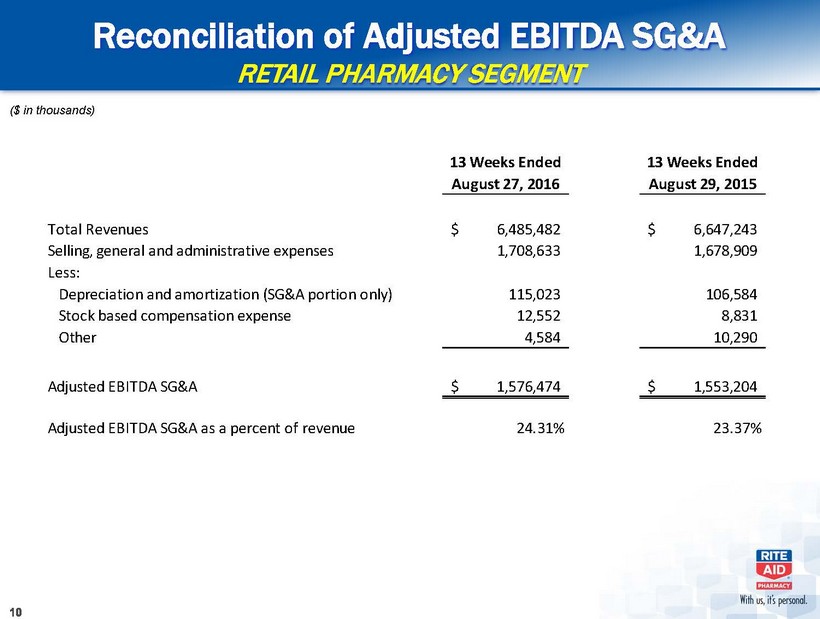
Reconciliation of Adjusted EBITDA SG&ARETAIL PHARMACY SEGMENT 13 Weeks Ended August 27, 201613 Weeks Ended August 29, 2015Total Revenues6,485,482$ 6,647,243$ Selling, general and administrative expenses1,708,633 1,678,909 Less:Depreciation and amortization (SG&A portion only)115,023 106,584 Stock based compensation expense12,552 8,831 Other4,584 10,290 Adjusted EBITDA SG&A1,576,474$ 1,553,204$ Adjusted EBITDA SG&A as a percent of revenue24.31%23.37%($ in thousands)

Pharmacy Services Segment Results 13 Weeks Ended August 27, 2016Period Ended(1) August 29, 2015Revenues1,634.9$ 1,071.9$ Cost of Revenues1,537.5 1,010.1 Gross Profit97.4 61.8 Selling, General and Administrative Expense(69.6) (46.9) Addback:Depreciation and Amortization22.2 17.6 One-time Transaction Expenses- 0.7 Adjusted EBITDA - Pharmacy Services Segment50.0$ 33.2$ (1) Results are from June 24, 2015, the date of acquisition of EnvisionRx, through August 29, 2015.($ in millions)

Q2 -FY 2017 SummaryPHARMACY SERVICES SEGMENT 563.0 million due to fiscal 2017 reflecting results for a full quarter compared to a partial quarter last year. Revenues were strong due to the addition of lives at both Envision and MedTrak. profit increased $35.6 million due to fiscal 2017 reflecting results for a full quarter compared to a partial quarter last year. Gross profits were also positively impacted by the addition of lives at both Envision and MedTrak. , general and administrative expenses increased due to fiscal 2017 reflecting results for a full quarter compared to a partial quarter last year. SG&A expenses were in line with expectations.
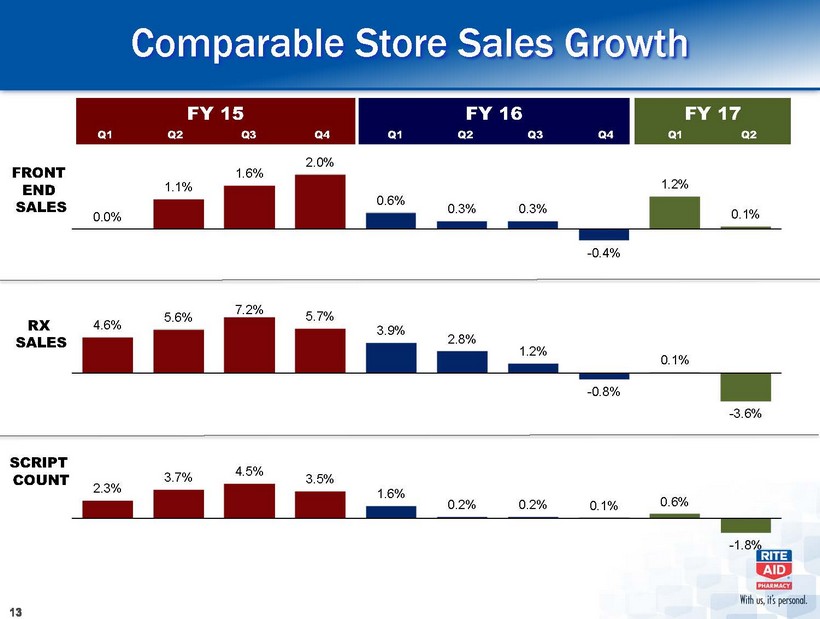
17 FRONT END SALES RX SALES SCRIPT COUNT FY 15 0.0% 1.1% 1.6% 2.0% 0.6% 0.3% 0.3% -0.4% 1.2% 0.1% 4.6% 5.6% 7.2% 5.7% 3.9% 2.8% 1.2% -0.8% 0.1% -3.6% FY 16 Q1 Q2 Q3 Q4 Q1 Q2 Q3 Q4 Q1 Q2 Comparable Store Sales Growth 2.3% 3.7% 4.5% 3.5% 1.6% 0.2% 0.2% 0.1% 0.6% -1.8%

Wellness Store Renovations results for Wellness stores continue to exceed the chain average(1)Front-end sales growth outperformance of 221 bps in Q2 of Fiscal 2017 Script count growth outperformance of 160 bps in Q2 of Fiscal 2017 274 797 1,215 1,634 2,042 2,214 FY 2012 FY 2013 FY 2014 FY 2015 FY 2016 FY 2017Q2 (1)Calculation compares the comp results of Wellness stores remodeled in the last 24 months to the remainder of the chain. Remodeled Stores Since 2012

Capitalization Table & Leverage
Note: Debt in the capitalization table is shown net of unamortized debt issuance costs. August 27, 2016February 27, 2016Secured Debt:Senior secured revolving credit facility due January 2020 2,320,505$ 2,066,097$ Tranche 1 Term Loan (second lien) due August 2020465,198 464,586 Tranche 2 Term Loan (second lien) due June 2021497,275 496,993 Other90 90 3,283,068 3,027,766 Unsecured Guaranteed Debt:9.25% senior notes due March 2020895,529 894,563 6.75% senior notes due June 2021802,870 802,128 6.125% senior secured notes due April 2023 1,771,795 1,769,657 3,470,194 3,466,348 Unsecured Unguaranteed Debt:7.7% notes due February 2027293,289 293,206 6.875% fixed-rate senior notes due December 2028127,195 127,163 420,484 420,369 Lease financing obligations 70,950 79,653 Total Debt:7,244,696 6,994,136 Current maturities of long-term debt and lease financing obligations (24,399) (26,848) Long-term debt and lease financing obligations, less current maturities 7,220,297$ 6,967,288$ Leverage Ratio:Total Debt7,244,696$ 6,994,136$ Add back: Unamortized debt issuance costs83,751 93,349 Less invested cash15,598 14,910 7,312,849$ 7,072,575$ Retail Pharmacy Segment Adjusted EBITDA (Last 12 months)1,195,510$ 1,300,905$ Pharmacy Services Segment Adjusted EBITDA159,320 155,000 1,354,830$ 1,455,905$ Debt: EBITDA Leverage Ratio5.40 4.86 ($ in thousands)

Debt Maturity Profile Maturity table as of August 27, 2016. Note: Maturities reflect calendar year. $2,350 $1,350 $295 $128 $470 $500 $905 $810 $1,800 $0 $500 $1,000 $1,500 $2,000 $2,500 $3,000 $3,500 $4,000 $4,500 $5,000 $5,500 2016 2017 2018 2019 2020 2021 2022 2023 . . . . . . 2027 2028 ($ in millions) Second Lien ABL Funded ABL Unfunded Commitment Senior Unsecured Notes Senior Unsecured (Guaranteed) Notes Callable at 104.625