Attached files
| file | filename |
|---|---|
| 8-K - CHINA FUND INC | fp0021704_8k.htm |

Data as of 8/31/16
Manager's Commentary
Market Review
The Greater China equities market was one of the best performing equity markets during the month of August. The MSCI China Index rallied, gaining 7.37% (in US dollar terms).
China's macroeconomic picture remains mixed. Fixed asset investment weakened sharply in July. In comparison, consumer sentiment remained largely resilient. The strength of discretionary spending was reflected in the quarterly results of China's internet giants, such as Tencent Holdings Ltd. and Alibaba Group Holding Ltd. We expect this divergence to continue. Hong Kong's second quarter 2016 GDP growth was a pleasant surprise, largely due to weak figures during the same period last year. However, soft retail sales and consumption data combined with a fragile global economic recovery still weighs on investors' near term confidence.
Separately, there was positive news on the financial reform agenda in China. The long awaited Shenzhen - Hong Kong Stock Connect Scheme was finally approved by the Chinese State Council in mid-August, and it is expected to be operational before the end of 2016. This is an important step towards expanding China's capital account, following the launch of the Shanghai - Hong Kong Stock Connect almost two years ago. This increases the long term probability that China A-shares will be included in MSCI indices. The new Shenzhen - Hong Kong Stock Connect Scheme will extend access for international investors to more of China's 'new economy' stocks. Almost 60% of the Shenzhen stock market capitalization is in consumer staples, consumer discretionary, health care and IT companies. It is worth noting that many of these names are small and mid-cap companies that trade at a significant premium compared to their Hong Kong listed peers. As a result, Hong Kong listed small and mid-cap companies showed signs of strength against the broader market in the second half of August.
Fund Review
During the month, the Fund's Net Asset Value ("NAV”) price outperformed the MSCI Golden Dragon Index (the "Benchmark Index”). The Fund benefited from our positioning in small and mid-cap names, such as Semiconductor Manufacturing International Corporation, a small-cap semiconductor foundry in China, which was the top contributor in August. In our view, this company is well positioned to provide semiconductors to domestic customers as a substitute for foreign imports. The company's recent better-than-expected second quarter 2016 earnings reflected strong domestic demand in China, as well as the company's capability to maintain good operating margins while continuing to add production capacity, which will contribute to future growth. The share price rallied more than 30% during the month, coming from a very low valuation base. We believe the share price has room to grow in the medium to long term, driven by both improved investor perception and earnings growth.
Key Transactions
In August, the main detractor to relative performance was Sun Hung Kai Properties Ltd., a leading property developer in Hong Kong, whose share price traded sideways in August after a strong rally in July, lagging the Benchmark Index. Fundamentally, we like the company's good public reputation and strong execution track record, which we feel will help drive earnings growth with a strong project launch pipeline. The low gearing ratio, stable recurrent rental income and strong property sales should support the dividend payout and underpin the share price over the medium term.
Outlook
Even after the rally in recent months, Greater China equities are still one of the laggards among emerging markets year-to-date. On a number of valuation methods, Greater China equities are reasonably priced. For example, the dividend yield of China equities listed in Hong Kong is close to 4%. This is one of the highest levels around the world, supported by improving corporate cash flows, which are a result of disciplined capital spending and tighter cost control. This is a positive development, as stable and even increased future dividend payments, in our view, will be supportive for Greater China equities.
The Chinese government will continue to embrace economic restructuring to encourage domestic consumption and services while reducing reliance on traditional heavy industries. In contrast, progress is likely to be gradual, as the government will carefully manage the pace of slowdown in the more challenged parts of the economy via both monetary and fiscal policy. Under these conditions, we are discovering better structural growth prospects in sectors such as telecommunications, high end manufacturing and select internet companies. In the telecommunications space, we prefer companies that can benefit from strong mobile data usage and the upgrade from 3G to 4G. At the same time, we are topping up on select turnaround names within the portfolio where we believe share prices have overcorrected and expect positive catalysts down the road. Some of these include companies that are related to domestic infrastructure spending, semiconductor manufacturing and power generation in China.
|
In Brief
|
|
|
Fund Data
|
|
|
Description
|
Seeks to achieve long-term capital appreciation through investments in China companies.
|
|
Listing Date (NYSE)
|
July 10, 1992
|
|
Total Fund Assets (millions)
|
$290.5
|
|
Median Market Cap (in billions)
|
$11.2
|
|
Distribution Frequency
|
Annual
|
|
Management Firm
|
Allianz Global Investors U.S. LLC
|
|
Portfolio Management
|
Christina Chung, CFA, CMA Lead Portfolio Manager
|
Performance (US$ Returns)
(as of 8/31/16)
|
Fund
|
Benchmark1
|
|
|
One Month
|
5.54%
|
4.64%
|
|
Three Month
|
11.86%
|
12.19%
|
|
One Year
|
8.16%
|
11.31%
|
|
Three Year
|
5.81%
|
6.18%
|
Net Asset Value / Market Price
|
Net Asset Value (NAV) / Market Price at Inception
|
$13.15 / $14.26
|
|
NAV / Market Price (as of 8/31/16)
|
$18.48 / $16.01
|
High / Low Ranges (52-Week)
|
High / Low NAV
|
$20.46 / $14.65
|
|
High / Low Market Price
|
$17.86 / $12.85
|
|
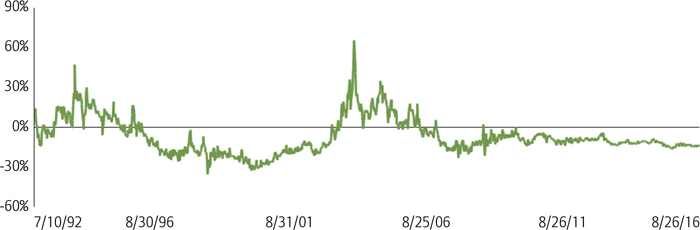
Premium/Discount to NAV (as of 8/31/16)
|
-13.37%
|
Fund Data (Common Shares)
|
Shares Outstanding
|
15,722,674
|
|
Average Daily Volume
|
30,610
|
|
Expense Ratio
|
1.53%
|
Fund Manager

Christina Chung, CFA, CMA
Lead Portfolio Manager
1. MSCI Golden Dragon Index.

The China Fund, Inc.
Investment Objective
The investment objective of the Fund is to achieve long-term capital appreciation. The Fund seeks to achieve its objective through investment in the equity securities of companies and other entities with significant assets, investments, production activities, trading or other business interests in China or which derive a significant part of their revenue from China.
The Fund has an operating policy that the Fund will invest at least 80% of its assets in China companies. For this purpose, 'China companies' are (i) companies for which the principal securities trading market is in China; (ii) companies for which the principal securities trading market is outside of China or in companies organized outside of China, that in both cases derive at least 50% of their revenues from goods or services sold or produced, or have a least 50% of their assets in China; or (iii) companies organized in China. Under the policy, China means the People's Republic of China, including Hong Kong, and Taiwan. The Fund will provide its stockholders with at least 60 days' prior notice of any change to this policy.
Returns For Periods Ending August 31, 2016*
|
1 Month
|
3 Month
|
YTD
|
1 Year
|
3 Year
|
5 Year
|
10 Year
|
Inception
|
|
|
NAV
|
5.54%
|
11.86%
|
4.05%
|
8.16%
|
5.81%
|
4.01%
|
11.02%
|
10.08%
|
|
Market Price
|
5.19%
|
11.96%
|
3.16%
|
11.36%
|
5.64%
|
2.93%
|
9.78%
|
9.06%
|
|
MSCI Golden Dragon Index
|
4.64%
|
12.19%
|
9.69%
|
11.31%
|
6.18%
|
5.31%
|
6.88%
|
—
|
|
Calendar Year Returns
|
|
2008
|
2009
|
2010
|
2011
|
2012
|
2013
|
2014
|
2015
|
|
|
NAV
|
-46.95%
|
72.83%
|
27.26%
|
-24.37%
|
12.12%
|
18.31%
|
7.82%
|
-5.51%
|
|
Market Price
|
-40.65%
|
72.19%
|
23.60%
|
-27.51%
|
20.52%
|
12.70%
|
5.29%
|
-6.38%
|
|
MSCI Golden Dragon Index
|
-49.37%
|
67.12%
|
13.60%
|
-18.35%
|
22.65%
|
7.25%
|
8.06%
|
-7.12%
|
Past performance is not a guide to future returns.
*Annualized for periods greater than one year.
Source: State Street Bank and Trust Company. Source for index data: MSCI as at August 31, 2016. Investment returns are historical and do not guarantee future results. Investment returns reflect changes in net asset value and market price per share during each period and assumes that dividends and capital gains distributions, if any, were reinvested. The net asset value (NAV) percentages are not an indication of the performance of a shareholder's investment in the Fund, which is based on market price. NAV performance includes the deduction of management fees and other expenses. Market price performance does not include the deduction of brokerage commissions and other expenses of trading shares and would be lower had such commissions and expenses been deducted. It is not possible to invest directly in an index.
Premium/Discount
Sector Allocation
|
Fund
|
Benchmark1
|
|
|
Information Technology
|
33.54%
|
32.30%
|
|
Financials
|
20.09%
|
25.11%
|
|
Industrials
|
12.70%
|
6.60%
|
|
Telecom Services
|
10.47%
|
6.14%
|
|
Real Estate
|
8.60%
|
8.34%
|
|
Consumer Discretionary
|
6.73%
|
7.35%
|
|
Energy
|
2.31%
|
3.53%
|
|
Consumer Staples
|
1.55%
|
2.24%
|
|
Utilities
|
1.06%
|
4.31%
|
|
Health Care
|
0.97%
|
1.30%
|
|
Materials
|
0.23%
|
2.80%
|
|
Other assets & liabilities
|
1.75%
|
0.00%
|
Source: IDS GmbH - Analysis and Reporting Services, a subsidiary of Allianz SE.
|
Country Allocation
|
|
Fund
|
Benchmark1
|
|
|
China
|
75.70%
|
75.60%
|
|
Hong Kong Red Chips
|
31.72%
|
10.40%
|
|
Hong Kong 'H' shares
|
16.89%
|
21.12%
|
|
Equity linked securities ('A' shares)
|
1.28%
|
0.00%
|
|
China 'A' & 'B' shares
|
0.00%
|
0.14%
|
|
Other Hong Kong securities
|
25.81%
|
31.20%
|
|
Others
|
0.00%
|
12.73%
|
|
Taiwan
|
22.55%
|
24.40%
|
|
Other assets & liabilities
|
1.75%
|
0.00%
|
|
Top 10 Holdings
|
|
TAIWAN SEMIC CO LTD (Taiwan)
|
8.52%
|
|
TENCENT HOLDINGS LTD (China)
|
6.53%
|
|
SUN HUNG KAI PROPERTIES LTD (H.K.)
|
6.25%
|
|
CHINA MERCHANTS BANK CO LTD (China)
|
4.57%
|
|
HONG KONG EXCHANGES AND CLEARING LTD (H.K.)
|
4.02%
|
|
ALIBABA GROUP HOLDING LTD (China)
|
3.84%
|
|
PING AN INSURANCE (China)
|
3.74%
|
|
CHINA MOBILE LTD (China)
|
3.41%
|
|
CHINA EVERBRIGHT INTL (China)
|
3.19%
|
|
QINGLING MOTORS CO LTD (China)
|
3.11%
|
|
Portfolio Characteristics
|
|
Fund
|
Benchmark1
|
|
|
P/E Ratio
|
14.38
|
13.49
|
|
P/B Ratio
|
1.50
|
1.42
|
|
Issues in Portfolio
|
43
|
283
|
|
Foreign Holdings (%)
|
98.25
|
100.00
|
|
Other assets & liabilities (%)
|
1.75
|
0.00
|
|
Yield (%)
|
2.89
|
2.83
|
Source: IDS GmbH - Analysis and Reporting Services, a subsidiary of Allianz SE.
1. MSCI Golden Dragon Index.
The China Fund, Inc.
Distribution History (10 Year)
|
Declaration Date
|
Ex-dividend Date
|
Record Date
|
Payable Date
|
Distribution/
Share
|
Income
|
Long-term
Capital Gain
|
Short-term
Capital Gain
|
|
12/8/06
|
12/19/06
|
12/21/06
|
12/29/06
|
$4.01170
|
$0.29960
|
$2.73090
|
$0.98120
|
|
12/7/07
|
12/19/07
|
12/21/07
|
1/25/08
|
$12.12000
|
$0.28000
|
$9.00000
|
$2.84000
|
|
12/8/08
|
12/22/08
|
12/24/08
|
1/23/09
|
$5.81740
|
$0.48130
|
$5.33610
|
—
|
|
12/9/09
|
12/22/09
|
12/24/09
|
12/29/09
|
$0.25570
|
$0.25570
|
—
|
—
|
|
12/8/10
|
12/21/10
|
12/24/10
|
12/29/10
|
$2.27420
|
$0.37460
|
$1.89960
|
—
|
|
12/8/11
|
12/21/11
|
12/23/11
|
12/29/11
|
$2.99640
|
$0.17420
|
$2.82220
|
—
|
|
12/10/12
|
12/20/12
|
12/24/12
|
12/28/12
|
$3.25170
|
$0.34730
|
$2.90440
|
—
|
|
12/13/13
|
12/19/13
|
12/23/13
|
12/27/13
|
$3.31400
|
$0.43870
|
$2.87530
|
—
|
|
12/8/14
|
12/18/14
|
12/22/14
|
1/5/15
|
$3.76510
|
$0.29820
|
$3.46690
|
—
|
|
12/16/15
|
12/23/15
|
12/28/15
|
1/6/16
|
$1.49580
|
$0.21330
|
$0.84620
|
$0.43630
|
Distribution/Share includes Income, Long-term Capital gains and Short-term Capital gains.
The China Fund NAV Performance of $10,000 since inception
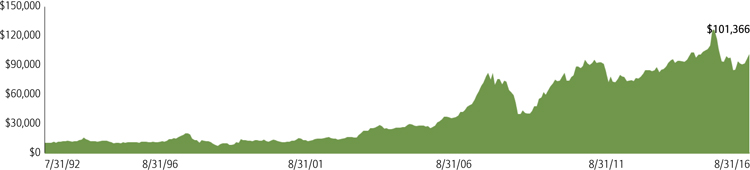
Past performance is not a guide to future returns.
Index Description
MSCI Golden Dragon Index
The MSCI Golden Dragon Index captures the equity market performance of large and mid cap China securities (H shares, B shares, Red-Chips and P-Chips) and non-domestic China securities listed in Hong Kong and Taiwan.
It is not possible to invest directly in an index.
The China Fund, Inc.
Portfolio in Full
|
Sector
|
Company (exchange ticker)
|
Market Price
|
Holding
|
Value US$
|
% of net assets
|
|
Information Technology
|
33.54
|
||||
|
TAIWAN SEMICONDUCTOR MANUFACTURING CO LTD
|
2330
|
176.00
|
4,461,000
|
24,743,890
|
8.52
|
|
TENCENT HOLDINGS LTD
|
700
|
201.80
|
728,800
|
18,960,131
|
6.53
|
|
ALIBABA GROUP HOLDING LTD
|
BABA
|
97.19
|
114,718
|
11,149,442
|
3.84
|
|
DELTA ELECTRONICS INC
|
2308
|
165.00
|
1,548,359
|
8,051,535
|
2.77
|
|
DIGITAL CHINA HOLDINGS LTD
|
861
|
6.99
|
8,362,000
|
7,535,276
|
2.59
|
|
SEMICONDUCTOR MANUFACTURING INTERNATIONAL CORP
|
981
|
0.85
|
64,229,000
|
7,038,205
|
2.42
|
|
ADVANTECH CO LTD
|
2395
|
259.50
|
798,841
|
6,533,122
|
2.25
|
|
LARGAN PRECISION CO LTD
|
3008
|
3,560.00
|
48,000
|
5,385,355
|
1.85
|
|
HON HAI PRECISION INDUSTRY CO LTD
|
2317
|
88.00
|
1,251,000
|
3,469,469
|
1.19
|
|
BAIDU INC
|
BIDU
|
171.07
|
16,749
|
2,865,251
|
0.99
|
|
GOLDPAC GROUP LTD
|
3315
|
2.64
|
5,021,000
|
1,708,858
|
0.59
|
|
Financials
|
20.09
|
||||
|
CHINA MERCHANTS BANK CO LTD
|
3968
|
18.88
|
5,450,500
|
13,266,310
|
4.57
|
|
HONG KONG EXCHANGES AND CLEARING LTD
|
388
|
189.70
|
477,900
|
11,687,353
|
4.02
|
|
PING AN INSURANCE GROUP CO OF CHINA LTD
|
2318
|
40.15
|
2,097,000
|
10,854,149
|
3.74
|
|
CHINA CONSTRUCTION BANK CORP
|
939
|
5.80
|
10,814,000
|
8,085,859
|
2.78
|
|
FUBON FINANCIAL HOLDING CO LTD
|
2881
|
44.90
|
4,270,000
|
6,042,231
|
2.08
|
|
CATHAY FINANCIAL HOLDING CO LTD
|
2882
|
40.10
|
3,462,000
|
4,375,166
|
1.51
|
|
CITIC SECURITIES CO LTD
|
6030
|
17.34
|
1,810,000
|
4,046,127
|
1.39
|
|
Industrials
|
12.69
|
||||
|
CHINA EVERBRIGHT INTERNATIONAL LTD
|
257
|
9.92
|
7,256,000
|
9,279,418
|
3.19
|
|
BEIJING ENTERPRISES HOLDINGS LTD
|
392
|
44.50
|
1,182,500
|
6,783,799
|
2.34
|
|
CK HUTCHISON HOLDINGS LTD
|
1
|
99.70
|
310,000
|
3,984,453
|
1.37
|
|
QINGDAO PORT INTERNATIONAL CO LTD
|
6198
|
4.44
|
6,596,000
|
3,775,508
|
1.30
|
|
CN STATE CONSTRUCTION INTERNATIONAL HOLDINGS LTD
|
3311
|
9.26
|
3,046,000
|
3,636,241
|
1.25
|
|
ZHUZHOU CRRC TIMES ELECTRIC CO LTD
|
3898
|
41.25
|
647,500
|
3,443,305
|
1.19
|
|
JARDINE MATHESON HOLDINGS LTD
|
J36
|
59.85
|
51,100
|
3,058,335
|
1.05
|
|
KING SLIDE WORKS CO LTD
|
2059
|
387.50
|
239,000
|
2,918,722
|
1.00
|
|
Telecom Services
|
10.47
|
||||
|
CHINA MOBILE LTD
|
941
|
95.80
|
801,000
|
9,892,586
|
3.41
|
|
CHINA UNICOM HONG KONG LTD
|
762
|
8.79
|
7,466,000
|
8,460,357
|
2.91
|
|
PCCW LTD
|
8
|
4.92
|
8,623,000
|
5,469,345
|
1.88
|
|
CHUNGHWA TELECOM CO LTD
|
2412
|
114.00
|
1,110,000
|
3,987,961
|
1.37
|
|
HUTCHISON TELECOMMUNICATIONS HK HOLDINGS LTD
|
215
|
2.68
|
7,552,000
|
2,609,207
|
0.90
|
|
Real Estate
|
8.61
|
||||
|
SUN HUNG KAI PROPERTIES LTD
|
16
|
109.20
|
1,289,000
|
18,146,270
|
6.25
|
|
CHINA OVERSEAS LAND & INVESTMENT LTD
|
688
|
25.65
|
2,070,000
|
6,844,938
|
2.36
|
|
Consumer Discretionary
|
6.73
|
||||
|
QINGLING MOTORS CO LTD
|
1122
|
2.42
|
28,960,000
|
9,034,950
|
3.11
|
|
CITIGROUP GLOBAL MARKETS HOLD
(exch. for CHINA CYTS TOURS HOLDIN) |
N/A |
3.17
|
1,173,768
|
3,720,845
|
1.28
|
|
LI & FUNG LTD
|
494
|
3.99
|
7,010,000
|
3,605,809
|
1.24
|
|
SANDS CHINA LTD
|
1928
|
30.50
|
810,800
|
3,188,052
|
1.10
|
|
Energy
|
2.31
|
||||
|
CNOOC LTD
|
883
|
9.53
|
5,467,000
|
6,716,666
|
2.31
|
|
Consumer Staples
|
1.55
|
||||
|
WANT WANT CHINA HOLDINGS LTD
|
151
|
5.11
|
3,993,000
|
2,630,462
|
0.91
|
|
VINDA INTERNATIONAL HOLDINGS LTD
|
3331
|
14.66
|
984,000
|
1,859,691
|
0.64
|
|
Utilities
|
1.06
|
||||
|
CHINA RESOURCES POWER HOLDINGS CO LTD
|
836
|
13.40
|
1,778,000
|
3,071,485
|
1.06
|
|
Health Care
|
0.97
|
||||
|
CSPC PHARMACEUTICAL GROUP LTD
|
1093
|
7.53
|
2,892,000
|
2,807,405
|
0.97
|
The China Fund, Inc.
Portfolio in Full
|
Sector
|
Company (exchange ticker)
|
Market Price
|
Holding
|
Value US$
|
% of net assets
|
|
Materials
|
0.23
|
||||
|
TIANGONG INTERNATIONAL CO LTD
|
826
|
0.738
|
7,246,000
|
681,919
|
0.23
|
Source: State Street Bank and Trust Company, IDS GmbH - Analysis and Reporting Services, a subsidiary of Allianz SE.
Important Information:
Holdings are subject to change daily. The Fund seeks to achieve its objective through investment in the equity securities of companies and other entities with significant assets, investments, production activities, trading or other business interests in China or which derive a significant part of their revenue from China. Investing in non-U.S. securities entails additional risks, including political and economic risk and the risk of currency fluctuations, as well as lower liquidity. These risks, which can result in greater price volatility, will generally be enhanced in less diversified funds that concentrate investments in a particular geographic region.
The information contained herein has been obtained from sources believed to be reliable but Allianz Global Investors U.S. LLC and its affiliates do not warrant the information to be accurate, complete or reliable. The opinions expressed herein are subject to change at any time and without notice. Past performance is not indicative of future results. This material is not intended as an offer or solicitation for the purchase or sale of any financial instrument. Investors should consider the investment objectives, risks, charges and expenses of any mutual fund carefully before investing. This and other information is contained in the Fund's annual and semiannual reports, proxy statement and other Fund information, which may be obtained by contacting your financial advisor or visiting the Fund's website at www.chinafundinc.com. This information is unaudited and is intended for informational purposes only. It is presented only to provide information on the Fund's holdings, performance and strategies. The Fund is a closed-end exchange traded management investment company. This material is presented only to provide information and is not intended for trading purposes. Closed-end funds, unlike open-end funds, are not continuously offered. After the initial public offering by a closed-end fund, its shares can be purchased and sold on the open market through a stock exchange, where shares may trade at a premium or a discount. The market price of holdings is subject to change daily.
P/E is a ratio of security price to earnings per share. Typically, an undervalued security is characterized by a low P/E ratio, while an overvalued security is characterized by a high P/E ratio. P/B is a ratio of the current stock price to the book value. This is used to identify undervalued stocks. Dividend yield is the annual percentage of return earned by an investor on a common or preferred stock. The average dividend yield is the dividend rate divided by current share price.
©2016 Allianz Global Investors Distributors LLC.
|
Investment Products: Not FDIC Insured | May Lose Value | Not Bank Guaranteed
|
FS-CHN-0816
|