Attached files
| file | filename |
|---|---|
| 8-K - FORM 8-K - Jernigan Capital, Inc. | v449105_8k.htm |

1 Investor Presentation Exhibit 99.1
2 Safe Harbor Disclosure Regarding Forward - Looking Statements • This presentation includes "forward - looking statements" within the meaning of Section 27A of the Securities Act of 1933 and Section 21E of the Securities Exchange Act of 1934 and other federal securities laws, including statements regarding our future performance, future book value, rates of return, ability to obtain future financing, including through the sale of A - notes, exit capitalization rates, our use of capital, the timing of our investment cycle, the expected timing of certificates of occupancy, future profits from investments, our future stock price, our dividend, our loan pipeline, our anticipated loan closings and future funding of existing loan commitments. The ultimate occurrence of events and results referenced in these forward - looking statements is subject to known and unknown risks and uncertainties, many of which are beyond our control. Such risks include our ability to obtain additional liquidity to fund our loan pipeline, our ability to make distributions at expected levels, the potential impact of interest rate fluctuations, the uncertainty as to the value of our investments, the lac k of liquidity in our investments and whether we can realize expected gains from our equity participation interests. These forward - looking statements are based upon the Company's present intentions and expectations, but the events and results referenced in these statements are not guaranteed to occur. Investors should not place undue reliance upon forward - looking statements. There can be no assurance that our expectations of the future performance of our investments will be achieved. This information provided herein is as of this date and the Company undertakes no duty to update any forward - looking statements contained herein. For a discussion of these and other risks facing our business, see the information under the heading “Risk Factors” in our Annual Report on Form 10 - K for the year ended December 31, 2015, with the Securities and Exchange Commission (“SEC”) on April 5, 2016, and our other filings with the SEC from time to time, which are accessible on the SEC’s website at www.sec.gov . • This presentation contains statistics and other data that has been obtained from or compiled from information made available by third parties. We have not independently verified such statistics or data . Contact : Jernigan Capital, Inc. John A. Good (901) 567 - 9517
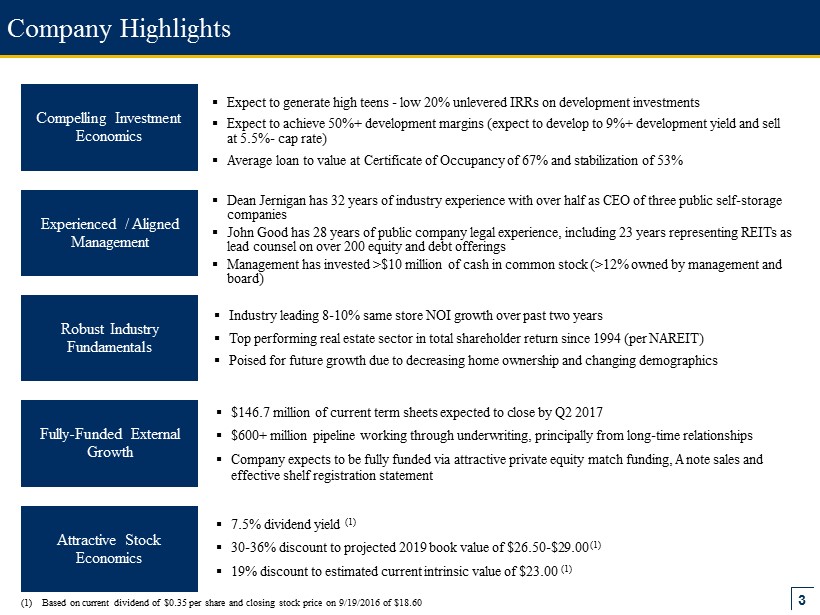
3 ▪ Dean Jernigan has 32 years of industry experience with over half as CEO of three public self - storage companies ▪ John Good has 28 years of public company legal experience, including 23 years representing REITs as lead counsel on over 200 equity and debt offerings ▪ Management has invested >$10 million of cash in common stock (>12% owned by management and board) ▪ Industry leading 8 - 10% same store NOI growth over past two years ▪ Top performing real estate sector in total shareholder return since 1994 (per NAREIT) ▪ Poised for future growth due to decreasing home ownership and changing demographics Experienced / Aligned Management Compelling Investment Economics Robust Industry Fundamentals Fully - Funded External Growth Company Highlights ▪ $146.7 million of current term sheets expected to close by Q2 2017 ▪ $600+ million pipeline working through underwriting, principally from long - time relationships ▪ Company expects to be fully funded via attractive private equity match funding, A note sales and effective shelf registration statement ▪ Expect to generate high teens - low 20% unlevered IRRs on development investments ▪ Expect to achieve 50%+ development margins (expect to develop to 9%+ development yield and sell at 5.5% - cap rate) ▪ Average loan to value at Certificate of Occupancy of 67% and stabilization of 53% Attractive Stock Economics ▪ 7.5% dividend yield (1) ▪ 30 - 36% discount to projected 2019 book value of $26.50 - $29.00 (1) ▪ 19% discount to estimated current intrinsic value of $23.00 (1) (1) Based on current dividend of $0.35 per share and closing stock price on 9/19/2016 of $18.60

4 Typical Development Investment Structure $10 million Development Cost $9 million JCAP Investment (with ROFR) 6 year / 6.9% Interest Rate $1 million Developer Equity $3.15 million Retained B Note 12% - 13% Effective Yield Equity Participation 49.9% Cash flows, Refinancing, and Sale Proceeds $5.85 million A Note A Note Sold at Certificate of Occupancy; Rate of 3.75% to 4.25%
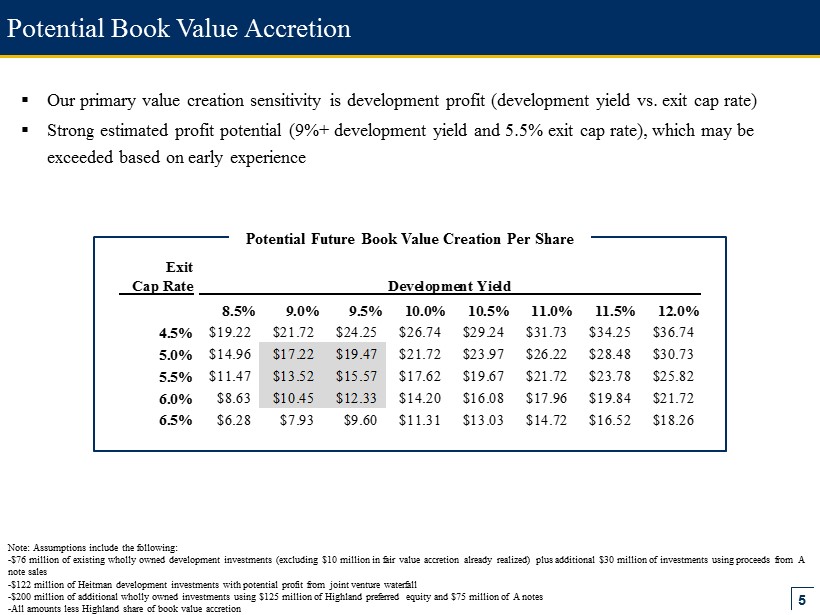
5 Potential Book Value Accretion ▪ Our primary value creation sensitivity is development profit (development yield vs. exit cap rate) ▪ Strong estimated profit potential (9%+ development yield and 5.5% exit cap rate), which may be exceeded based on early experience Note: Assumptions include the following: - $76 million of existing wholly owned development investments (excluding $10 million in fair value accretion already realized) p lus additional $30 million of investments using proceeds from A note sales - $122 million of Heitman development investments with potential profit from joint venture waterfall - $200 million of additional wholly owned investments using $125 million of Highland preferred equity and $75 million of A note s - All amounts less Highland share of book value accretion Exit Cap Rate Development Yield 8.5% 9.0% 9.5% 10.0% 10.5% 11.0% 11.5% 12.0% 4.5% $19.22 $21.72 $24.25 $26.74 $29.24 $31.73 $34.25 $36.74 5.0% $14.96 $17.22 $19.47 $21.72 $23.97 $26.22 $28.48 $30.73 5.5% $11.47 $13.52 $15.57 $17.62 $19.67 $21.72 $23.78 $25.82 6.0% $8.63 $10.45 $12.33 $14.20 $16.08 $17.96 $19.84 $21.72 6.5% $6.28 $7.93 $9.60 $11.31 $13.03 $14.72 $16.52 $18.26 Potential Future Book Value Creation Per Share
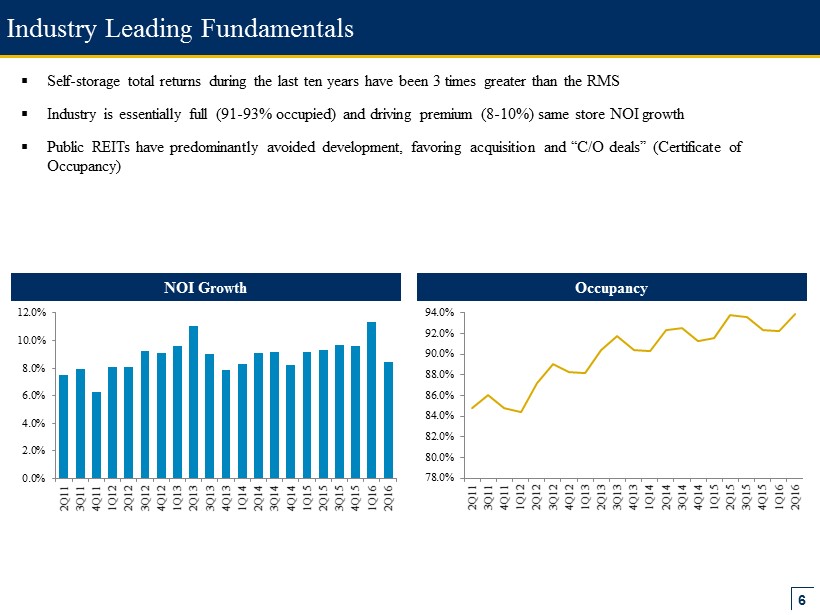
6 Industry Leading Fundamentals NOI Growth Occupancy ▪ Self - storage total returns during the last ten years have been 3 times greater than the RMS ▪ Industry is essentially full ( 91 - 93% occupied) and driving premium (8 - 10%) same store NOI growth ▪ Public REITs have p redominantly avoided development , favoring acquisition and “C/O deals ” (Certificate of Occupancy) 0.0% 2.0% 4.0% 6.0% 8.0% 10.0% 12.0% 2Q11 3Q11 4Q11 1Q12 2Q12 3Q12 4Q12 1Q13 2Q13 3Q13 4Q13 1Q14 2Q14 3Q14 4Q14 1Q15 2Q15 3Q15 4Q15 1Q16 2Q16 78.0% 80.0% 82.0% 84.0% 86.0% 88.0% 90.0% 92.0% 94.0% 2Q11 3Q11 4Q11 1Q12 2Q12 3Q12 4Q12 1Q13 2Q13 3Q13 4Q13 1Q14 2Q14 3Q14 4Q14 1Q15 2Q15 3Q15 4Q15 1Q16 2Q16
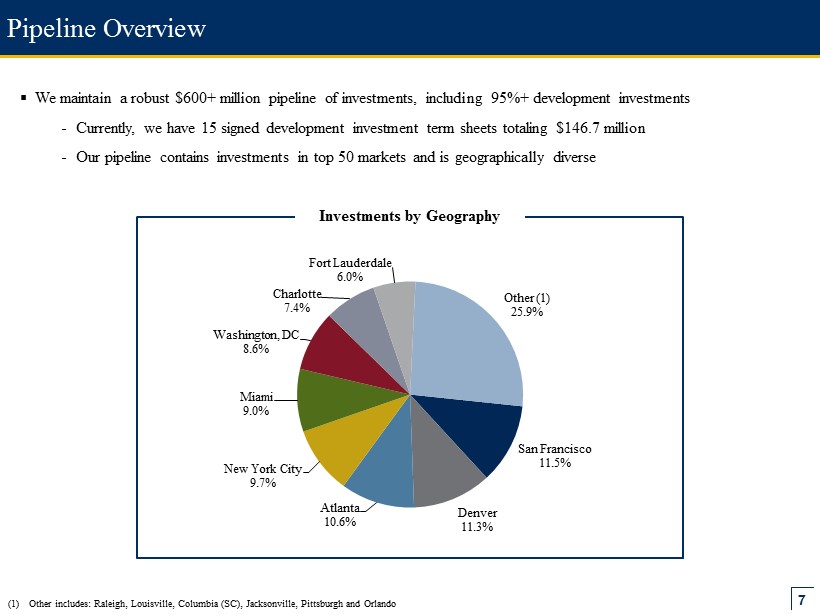
7 Pipeline Overview ▪ We maintain a robust $600+ million pipeline of investments, including 95%+ development investments - Currently, we have 15 signed development investment term sheets totaling $146.7 million - Our pipeline contains investments in top 50 markets and is geographically diverse San Francisco 11.5% Denver 11.3% Atlanta 10.6% New York City 9.7% Miami 9.0% Washington, DC 8.6% Charlotte 7.4% Fort Lauderdale 6.0% Other (1) 25.9% (1) Other includes: Raleigh, Louisville, Columbia (SC), Jacksonville, Pittsburgh and Orlando Investments by Geography

8 Development 77.8% Construction (C/O takeout) 15.8% Operating Property 6.4% C/O Achieved 21.5% C/O Expected 2016 10.9% C/O Expected 2017 67.6% Current Portfolio Overview Investments by Geography Investments by Type % Wholly Owned / % Joint Venture (2) Status of Development Investments (3) (1) Other includes: Austin, Milwaukee, West Palm Beach, Charlotte, New Haven, Nashville, Tampa, Orlando, Pittsburgh, Sarasota, N ew York City, Newark and New Orleans (2) Based on committed total investment amounts; JCAP’s capital commitments to wholly owned and joint venture investments are 92% and 8%, respectively (3) Does not include Construction (C/O takeout) investments Miami 19.9% Atlanta 14.2% Washington, DC 7.4% Jacksonville 6.2% Fort Lauderdale 5.7% Denver 4.7% Chicago 4.0% Raleigh 3.9% Other (1) 34.0% Wholly Owned 54.9% Joint Venture 45.1%

9 (1) Days open and occupancy as of September 18, 2016 Underwriting Track Record Tampa, FL Orlando, FL Atlanta, GA Atlanta, GA ▪ Faster lease - up ▪ Higher occupancy and income Consistent outperformance of underwriting Underwritten Origination Location # Days Occupancy After Date (MSA) Date Opened Open (1) Occupancy (1) 12 Months Open 6/19/2015 Tampa 4/16/2016 154 51.4% 40.0% 4/21/2015 Orlando 5/8/2016 134 55.9% 40.0% 6/26/2015 Atlanta 5/31/2016 111 37.4% 40.0% 6/10/2015 Atlanta 5/30/2016 110 27.8% 40.0% 9/30/2015 Jacksonville 8/19/2016 31 19.0% 40.0% 6/25/2015 Charlotte 8/25/2016 25 5.0% 40.0% Average 94 32.7% 40.0%

10 Orlando, FL Case Study – Ground Up Development Initial Underwriting Current Expectations Approximate Cost to Build $5,925,000 $5,969,198 Development Yield 9.2% 12.0% Length of Construction 14 months 12 months Length of Lease Up 36 months 30 months C/O Value $6,407,848 $10,025,043 Stabilized Cap Rate 7.0% 5.6% Stabilized Value $7,780,959 $12,698,388 JCAP Profit $926,124 $3,357,866 Key Metrics Property Highlights ▪ Multi - story climate controlled facility totaling 55,180 net rentable square feet situated on 3.3 acres ▪ Investment originated in April 2015; C/O achieved May 2016 ▪ Located just one mile off of the Florida Turnpike ▪ 67,000 cars pass in front of the site on W. Colonial Drive daily ▪ 3 mile median household income: $57,291 ▪ 3 mile population: 61,653

11 Atlanta, GA Case Study – Conversion of Industrial Warehouse Initial Underwriting Current Expectations Approximate Cost to Build $6,722,222 $6,722,222 Development Yield 9.5% 12.2% Length of Construction 14 months 11 months Length of Lease Up 36 months 30 months C/O Value $7,510,935 $11,683,825 Stabilized Cap Rate 7.0% 5.5% Stabilized Value $9,120,422 $14,870,323 JCAP Profit $1,196,702 $4,065,902 Key Metrics Property Highlights ▪ Multi - story climate controlled facility totaling 65,625 net rentable square feet ▪ Investment originated in June 2015; C/O achieved May 2016 ▪ Located directly off of Interstate 75 which is a major north - south interstate that runs through six states ▪ 226,580 cars pass the site daily on Interstate 75 ▪ 3 mile median household income: $48,367 ▪ 3 mile population: 77,749

12 JCAP Investment Thesis Excellent Self - Storage Industry Fundamentals Strong Development Profits Fully Funded Accretive Growth Attractive Opportunity for JCAP

13 Appendix

14 Current Portfolio Detail $ in 000s (1) Excludes Sacramento loan repaid in May 2016 Drawn Closing Date Location (MSA) Investment Type Status 6/30/2016 Size REIT Level 4/21/2015 Orlando Development C/O achieved May 2016 $5,137 $5,372 6/10/2015 Atlanta Development C/O achieved May 2016 7,015 8,132 6/19/2015 Tampa Development C/O achieved April 2016 5,152 5,369 6/26/2015 Atlanta Development C/O achieved May 2016 5,027 6,050 6/29/2015 Charlotte Development C/O achieved Aug. 2016 4,328 7,624 7/2/2015 Milwaukee Development C/O expected Sep. 2016 2,908 7,650 7/31/2015 New Haven Development C/O expected Oct. 2016 2,697 6,930 8/10/2015 Pittsburgh Development C/O expected Nov. 2016 2,035 5,266 8/14/2015 Raleigh Development C/O expected Nov. 2017 1,160 8,998 9/30/2015 Jacksonville Development C/O achieved Aug. 2016 4,852 6,445 10/27/2015 Austin Development C/O expected Jan. 2017 881 8,658 Subtotal Development $41,192 $76,494 8/5/2015 West Palm Beach Construction C/O expected Oct. 2016 $3,590 $7,500 8/5/2015 Sarasota Construction C/O expected Dec. 2016 1,547 4,792 11/17/2015 Chicago Construction C/O expected Sep. 2016 3,694 6,808 12/23/2015 Miami Construction C/O expected July 2017 6,257 17,733 Subtotal Construction $15,088 $36,833 6/19/2015 New Orleans Operating Property $2,800 $2,800 7/7/2015 Newark Operating Property 3,480 3,480 10/30/2015 Nashville Operating Property 1,210 1,210 11/24/2015 Nashville Operating Property 4,863 4,968 12/22/2015 Chicago Operating Property 2,376 2,502 Subtotal Operating Property $14,729 $14,960 Total REIT Committed Investments (1) $71,009 $128,287 Heitman Joint Venture 5/14/2015 Miami Development C/O expected Jan. 2017 $3,033 $13,867 5/14/2015 Miami Development C/O expected June 2017 3,308 14,849 9/25/2015 Fort Lauderdale Development C/O expected June 2017 2,606 13,230 4/15/2016 Washington, DC Development C/O expected May 2017 5,311 17,269 4/29/2016 Atlanta Development C/O expected June 2017 127 10,223 7/19/2016 Jacksonville Development C/O expected Oct. 2017 NA 8,127 7/21/2016 New York City Development C/O expected Oct. 2017 NA 7,828 8/16/2016 Atlanta Development C/O expected Nov. 2017 NA 8,772 8/25/2016 Denver Development C/O expected Nov. 2017 NA 11,031 Total Heitman JV Investments $14,385 $105,197 Total REIT + Heitman JV Committed Investments $85,394 $233,484 Investment Balance

15 Value Creation from Recent Capital Initiatives Estimated Book Value per Share at Year - End 2019: $ 26.50 - $29.00 Note: $ in 000s except per share values (1) Assuming 9.00% - 9.50% development yield and 5.25% - 5.75% exit cap (2) After participating dividend to Highland Capital (3) Including amortization of origination fees (4) Dividends on Series A Preferred Stock and A notes/senior participations (5) Assumes no dilution due to match funding provision in Highland Capital commitment Capital Gains Income Aggregate Exit Value (1) Total Cost JCAP Profit Allocation (2) Annual Interest Income (3) Cash Funding Cost (4) Annual Cash Net Investment Income (5) $350,000 - $ 375,000 $222,000 $50,000 - $55,000 $14,300 $11,800 $2,500 Projected Incremental Book Value / Share - - ▪ Below is a breakdown of shareholder value expected to be created from $200 million of new on - balance sheet investments ▪ We believe these economics will significantly reduce our cost of capital and allow for future common equity issuance to support additional growth $8.00 - $10.00 $1.50 - $2.00 $9.50 - $12.00 + $200 Million of New Investments Heitman JV Projected Book Value per Share Increase (2) Total

16 Selective Underwriting $4.9 billion Investments reviewed $417 million Term sheets issued $385 million Signed Term Sheets $233.5 million (~5% of evaluated) Closed Investments Jernigan Capital uses a stringent underwriting process based on management’s extensive experience and successful track record underwriting self - storage properties and markets

17 0.00% 0.20% 0.40% 0.60% 0.80% 1.00% 1.20% - 2,000 4,000 6,000 8,000 10,000 12,000 14,000 16,000 18,000 2004 2005 2006 2007 2008 2009 2010 2011 2012 2013 2014 2015 As % of Existing Supply New Square Footage (000s) New Square Footage Completions As a % of existing supply Development Investment Opportunity New Square Footage Constructed - Nationwide ▪ Supply growth has historically been modest (<1%) due to “spec” build / long lease - up times ▪ Exacerbated over the last 6 years due to financial crisis and resulting regulatory changes / pressures ▪ Management estimates top 50 markets are undersupplied by 1,600 facilities ▪ Drives strong industry fundamentals and creates development investment opportunities Source: FW Dodge, Self - Storage Almanac, Management Estimates 6 years of dramatic undersupply
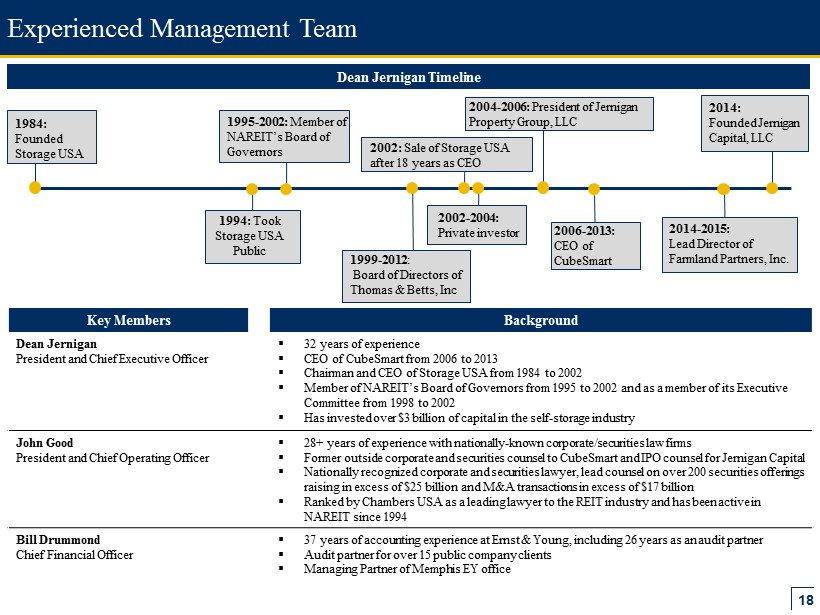
18 2006 - 2013: CEO of CubeSmart 1995 - 2002: Member of NAREIT’s Board of Governors Experienced Management Team Key Members Background Dean Jernigan President and Chief Executive Officer ▪ 32 years of experience ▪ CEO of CubeSmart from 2006 to 2013 ▪ Chairman and CEO of Storage USA from 1984 to 2002 ▪ Member of NAREIT’s Board of Governors from 1995 to 2002 and as a member of its Executive Committee from 1998 to 2002 ▪ Has invested over $3 billion of capital in the self - storage industry John Good President and Chief Operating Officer ▪ 28+ years of experience with nationally - known corporate/securities law firms ▪ Former outside corporate and securities counsel to CubeSmart and IPO counsel for Jernigan Capital ▪ Nationally recognized corporate and securities lawyer, lead counsel on over 200 securities offerings raising in excess of $25 billion and M&A transactions in excess of $17 billion ▪ Ranked by Chambers USA as a leading lawyer to the REIT industry and has been active in NAREIT since 1994 Bill Drummond Chief Financial Officer ▪ 37 years of accounting experience at Ernst & Young, including 26 years as an audit partner ▪ Audit partner for over 15 public company clients ▪ Managing Partner of Memphis EY office 1994: Took Storage USA Public 1984: Founded Storage USA 2004 - 2006: President of Jernigan Property Group, LLC 2002: Sale of Storage USA after 18 years as CEO 2002 - 2004: Private investor 1999 - 2012 : Board of Directors of Thomas & Betts, Inc 2014 - 2015: Lead Director of Farmland Partners, Inc. Dean Jernigan Timeline 2014: Founded Jernigan Capital, LLC

19 Underwriting Timeline Prospect to Closed Investment 4 months Facility Construction ($10 million total cost) 14 months Lease - up period 2.5 years Certificate of Occupancy (~$14.5 million estimated value) Investment Origination Stabilization (~$17 million estimated value) Construction Start Stabilization ~3.5 years ▪ Below is an example of a typical timeline for a development project - Key assumptions include a 9.25% yield on cost and a 5.5% cap rate at stabilization - Rental rates = rates at time of underwriting – no trending of rents Fair Value Accounting recognition of 1/3 estimated profit between 40% completion and Certificate of Occupancy Fair Value Accounting recognition of balance of estimated profit over remaining term of investment using DCF method and appraisals

20 We Are Not A Typical Mortgage REIT Typical Mortgage REIT ▪ Higher corporate leverage, including leverage of junior debt ▪ No equity participation ▪ Structured finance arbitrage rather than property focus Jernigan Capital ▪ Low corporate leverage ▪ Equity participations that allow investors to participate in property appreciation ▪ Specific niche property focus led by team with decades of experience in self - storage ▪ Rights of first refusal for purchase of all new development (1) ▪ JCAP has characteristics that distinguish it from a typical mortgage REIT - Emphasis on outsized value accretion versus current cash flow - Underwriting to own versus underwriting to avoid owning - Structural pathway to asset ownership versus return and redeployment of principal (1) Excluding C/O take - out deals and initial deals on which ROFRs were transferred

21 ▪ Underwriting performed by management team with many years of experience ▪ Significant operating and interest reserves built into each project ▪ Developer equity funded up front ▪ Significant input from third party managers on unit mix and projected operating results ▪ Conservative lease - up projection relative to current experience by equity REITs ▪ Rents not trended in underwriting ▪ Deal structure designed for quick takeover, together with strong covenants, completion guarantees and ROFR Conservative Underwriting and Expert Processing/Servicing Conservative Underwriting ▪ JCAP servicing team – collective experience of more than 40 years across all property types ▪ General Counsel – over 30 years of real estate experience representing primarily developers and serial acquirers ▪ Construction monitoring and draw authorization by Newbanks (national firm with 55 years in business, focused exclusively on construction consulting services and client list including all major financial institutions) ▪ Weekly monitoring of lease - up; continuous dialogue with developer at all stages of investment Expert Monitoring and Servicing

22 Impressive Results Since IPO Key Metrics Considered at IPO Current Market Conditions Actual Results Better Than IPO Expectations Investment Opportunity Pipeline of attractive development investments s ignificantly greater than anticipated at IPO x Development Yields Higher than underwritten, with some properties more than 200 bps better x Market Cap Rates Lower than underwritten for every property x A Note Sales Multiple options available at certificate of occupancy (C/O); pricing better than expected; currently $ 33.6 million of A note sales at 58% LTV at 3.87% x Corporate Capital Alternatives and Costs A - notes, joint venture and preferred equity provide sufficient capital to fund business through end of 2017 at attractive costs relative to investment opportunities x Institutional Validation Sophisticated institutional owners of common stock; large investments from Heitman (joint venture) and Highland Capital (preferred equity commitment) x Book Value Accretion Better than expected asset level fundamentals and attractive capital sources combine to provide path for $10+ of book value accretion over next 2 - 3 years x ▪ Jernigan’s business plan and investments are even more attractive today than at the time of its IPO