Attached files
| file | filename |
|---|---|
| 8-K - 8-K - Mahwah Bergen Retail Group, Inc. | v448980_8k.htm |
| EX-99.1 - EXHIBIT 99.1 - Mahwah Bergen Retail Group, Inc. | v448980_ex99-1.htm |
Exhibit 99.2

Q4 FY16 Earnings Release Supplemental Material September 19, 2016
Safe Harbor Statement 2

Q4 FY16 Earnings Highlights 3 (a) Non - GAAP Q4 FY16 comp sales includes unaudited, internally generated ANN data Non-GAAP Q4 FY16 Q4 FY15 Q4 FY16 (a) Comparable Sales N / A N / A (5%) Gross Margin 57.5% 54.5% 57.4% BD&O 18.1% 18.1% 18.7% SG&A 29.8% 34.2% 30.1% EBITDA Margin N / A N / A 8.6% EPS $0.07 ($1.98) $0.08 GAAP

Q4 FY16 Sales Performance by Brand 4 Q4 FY16 Sales Mix (b) (a) ANN was acquired in the first quarter of Fiscal 2016; fourth quarter comp sales for ANN and Total Company (as shown) are presented using unaudited, internally generated ANN data from the pre - acquisition period (b) Q4 FY16 sales mix is based on fourth quarter revenue excluding the 53 rd week of sales at the legacy ascena brands Q4 FY16 Q4 FY15 30-Jul-16 25-Jul-15 ANN (a) (6%) N / A Justice (4%) (17%) Lane Bryant 1% 3% maurices (9%) 8% dressbarn (7%) (3%) Catherines (5%) 3% Legacy ascena (4%) (2%) Total Company (5%) N / A Comp Sales Performance (a) ANN 35.7% Justice 12.7% Lane Bryant 17.3% maurices 13.8% dressbarn 15.4% Catherines 5.1%
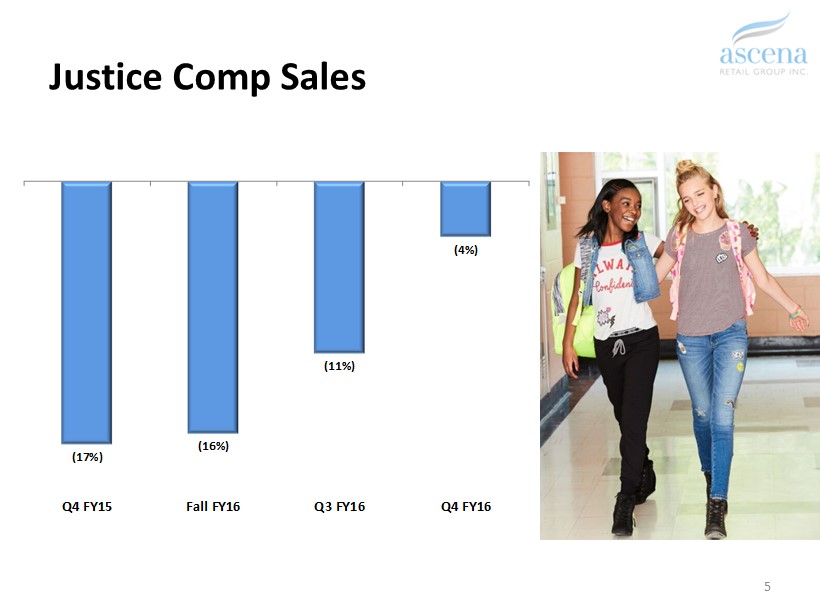
Justice Comp Sales 5 (17%) (16%) (11%) (4%) Q4 FY15 Fall FY16 Q3 FY16 Q4 FY16
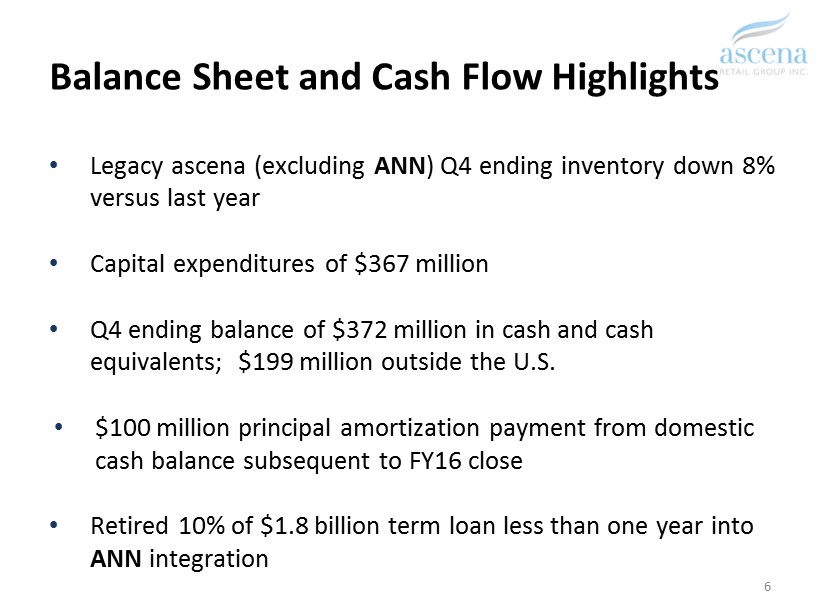
Balance Sheet and Cash Flow Highlights • Legacy ascena (excluding ANN ) Q4 ending inventory down 8% versus last year • Capital expenditures of $367 million • Q4 ending balance of $372 million in cash and cash equivalents; $199 million outside the U.S. • $100 million principal amortization payment from domestic cash balance subsequent to FY16 close • Retired 10% of $1.8 billion term loan less than one year into ANN integration 6

Disciplined Inventory Management 7 Figures shown exclude ANN (5%) (6%) (7%) (8%) (2%) (7%) (5%) (5%) (2%) (10%) (10%) (9%) Q1 FY16 Q2 FY16 Q3 FY16 Q4 FY16 Inventory Net Sales Store Traffic All figures above represent legacy ascena brands (excludes ANN )
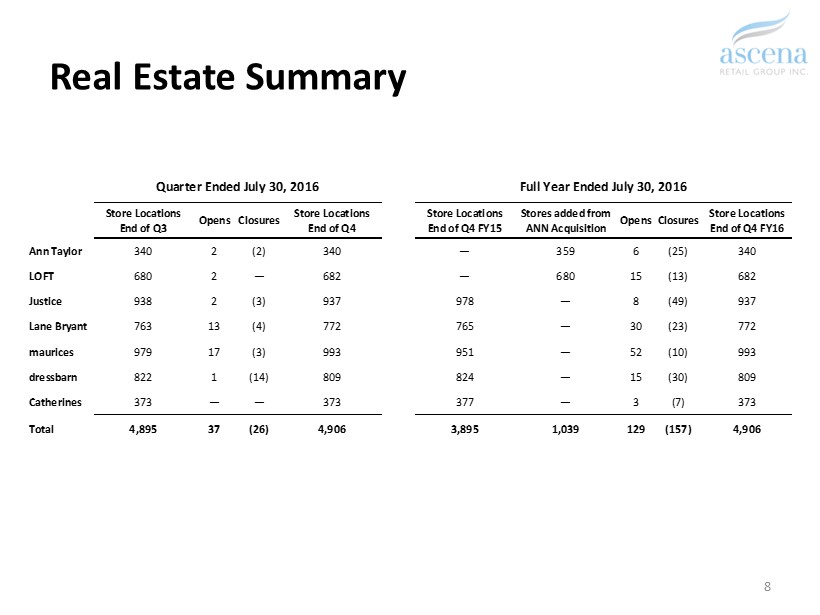
Store Locations End of Q3 Opens Closures Store Locations End of Q4 Store Locations End of Q4 FY15 Stores added from ANN Acquisition OpensClosures Store Locations End of Q4 FY16 Ann Taylor 340 2 (2) 340 — 359 6 (25) 340 LOFT 680 2 — 682 — 680 15 (13) 682 Justice 938 2 (3) 937 978 — 8 (49) 937 Lane Bryant 763 13 (4) 772 765 — 30 (23) 772 maurices 979 17 (3) 993 951 — 52 (10) 993 dressbarn 822 1 (14) 809 824 — 15 (30) 809 Catherines 373 — — 373 377 — 3 (7) 373 Total 4,895 37 (26) 4,906 3,895 1,039 129 (157) 4,906 Quarter Ended July 30, 2016 Full Year Ended July 30, 2016 Real Estate Summary 8
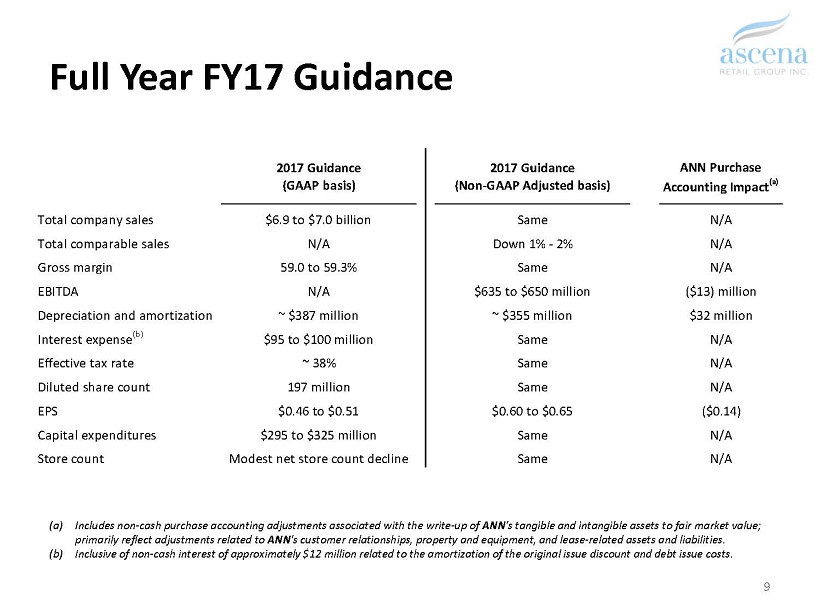
2017 Guidance (GAAP basis) 2017 Guidance (Non-GAAP Adjusted basis) ANN Purchase Accounting Impact (a) Total company sales $6.9 to $7.0 billion Same N/A Total comparable sales N/A Down 1% - 2% N/A Gross margin 59.0 to 59.3% Same N/A EBITDA N/A $635 to $650 million ($13) million Depreciation and amortization ~ $387 million ~ $355 million ($32) million Interest expense (b) $95 to $100 million Same N/A Effective tax rate ~ 38% Same N/A Diluted share count 197 million Same N/A EPS $0.46 to $0.51 $0.60 to $0.65 ($0.14) Capital expenditures $295 to $325 million Same N/A Store count Modest net store count decline Same N/A Full Year FY17 Guidance 9 (a) Includes non - cash purchase accounting adjustments associated with the write - up of ANN 's tangible and intangible assets to fair market value; primarily reflect adjustments related to ANN 's customer relationships, property and equipment, and lease - related assets and liabilities. (b) Inclusive of non - cash interest of approximately $12 million related to the amortization of the original issue discount and debt issue costs.
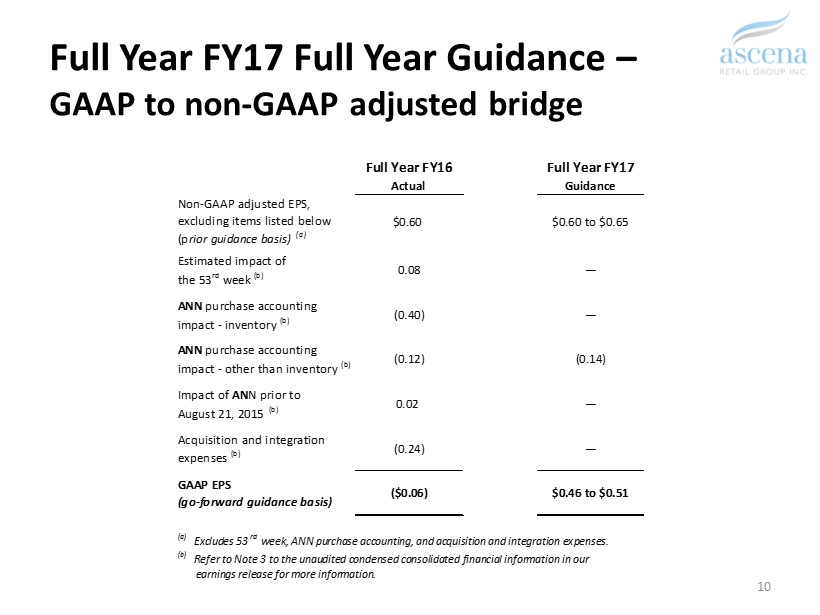
Full Year FY16 Full Year FY17 Actual Guidance Non-GAAP adjusted EPS, excluding items listed below (prior guidance basis) (a) $0.60 $0.60 to $0.65 Estimated impact of the 53 rd week (b) 0.08 — ANN purchase accounting impact - inventory (b) (0.40) — ANN purchase accounting impact - other than inventory (b) (0.12) (0.14) Impact of ANN prior to August 21, 2015 (b) 0.02 — Acquisition and integration expenses (b) (0.24) — GAAP EPS (go-forward guidance basis) ($0.06) $0.46 to $0.51 (a) Excludes 53 rd week, ANN purchase accounting, and acquisition and integration expenses. (b) Refer to Note 3 to the unaudited condensed consolidated financial information in our earnings release for more information. Full Year FY17 Full Year Guidance – GAAP to non - GAAP adjusted bridge 10
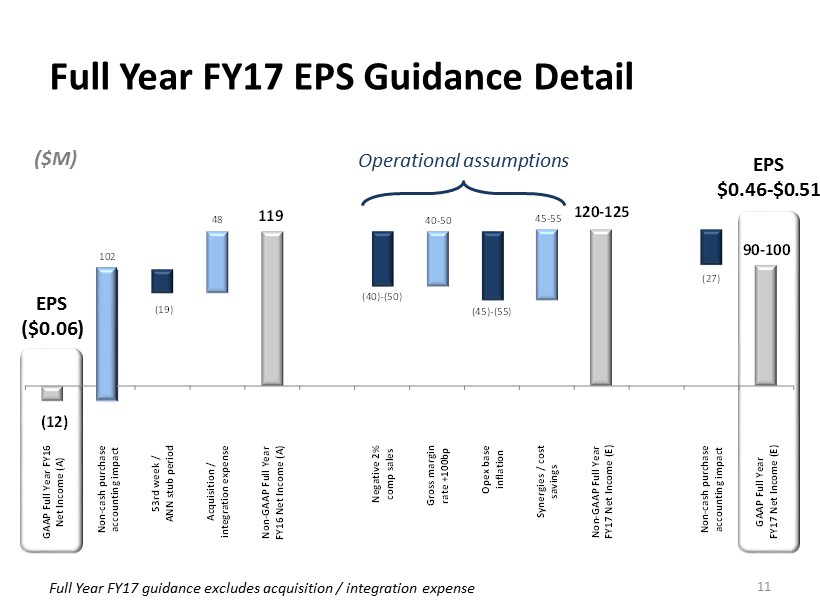
(12) 102 (19) 48 119 (40) - (50) 40 - 50 (45) - (55) 45 - 55 120 - 125 (27) 90 - 100 GAAP Full Year FY16 Net Income (A) Non-cash purchase accounting impact 53rd week / ANN stub period Acquisition / integration expense Non-GAAP Full Year FY16 Net Income (A) Negative 2% comp sales Gross margin rate +100bp Opex base inflation Synergies / cost savings Non-GAAP Full Year FY17 Net Income (E) Non-cash purchase accounting impact GAAP Full Year FY17 Net Income (E) Full Year FY17 EPS Guidance Detail 11 Operational assumptions ($M) EPS ($0.06) EPS $0.46 - $0.51 Full Year FY17 guidance excludes acquisition / integration expense
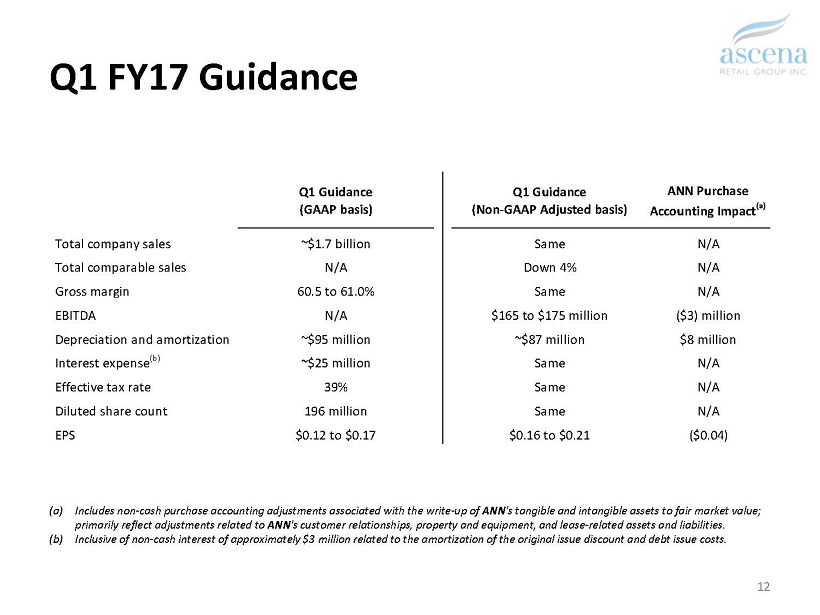
Q1 FY17 Guidance 12 (a) Includes non - cash purchase accounting adjustments associated with the write - up of ANN 's tangible and intangible assets to fair market value; primarily reflect adjustments related to ANN 's customer relationships, property and equipment, and lease - related assets and liabilities. (b) Inclusive of non - cash interest of approximately $ 3 million related to the amortization of the original issue discount and debt issue costs. Q1 Guidance (GAAP basis) Q1 Guidance (Non-GAAP Adjusted basis) ANN Purchase Accounting Impact (a) Total company sales ~$1.7 billion Same N/A Total comparable sales N/A Down 4% N/A Gross margin 60.5 to 61.0% Same N/A EBITDA N/A $165 to $175 million ($3) million Depreciation and amortization ~$95 million ~$87 million ($8) million Interest expense (b) ~$25 million Same N/A Effective tax rate 39% Same N/A Diluted share count 196 million Same N/A EPS $0.12 to $0.17 $0.16 to $0.21 ($0.04)
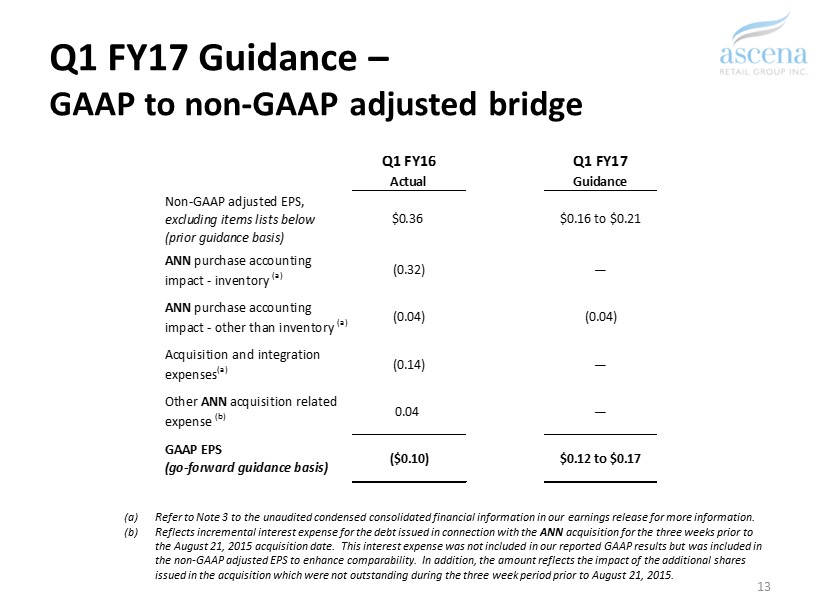
Q1 FY17 Guidance – GAAP to non - GAAP adjusted bridge 13 (a) Refer to Note 3 to the unaudited condensed consolidated financial information in our earnings release for more information. (b) Reflects incremental interest expense for the debt issued in connection with the ANN acquisition for the three weeks prior to the August 21, 2015 acquisition date. This interest expense was not included in our reported GAAP results but was included i n the non - GAAP adjusted EPS to enhance comparability. In addition, the amount reflects the impact of the additional shares issued in the acquisition which were not outstanding during the three week period prior to August 21, 2015. Q1 FY16 Q1 FY17 Actual Guidance Non-GAAP adjusted EPS, excluding items lists below (prior guidance basis) $0.36 $0.16 to $0.21 ANN purchase accounting impact - inventory (a) (0.32) — ANN purchase accounting impact - other than inventory (a) (0.04) (0.04) Acquisition and integration expenses (a) (0.14) — Other ANN acquisition related expense (b) 0.04 — GAAP EPS (go-forward guidance basis) ($0.10) $0.12 to $0.17
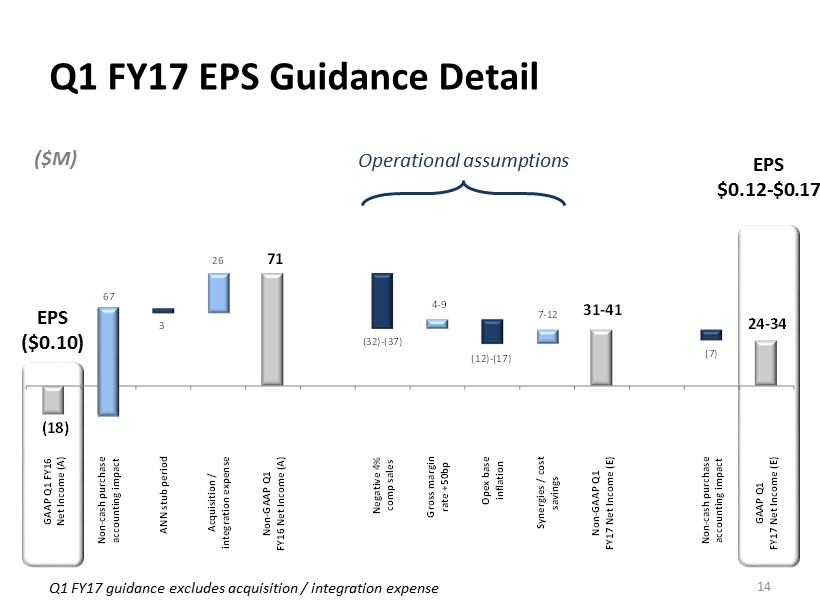
(18) 67 3 26 71 (32) - (37) 4 - 9 (12) - (17) 7 - 12 31 - 41 (7) 24 - 34 GAAP Q1 FY16 Net Income (A) Non-cash purchase accounting impact ANN stub period Acquisition / integration expense Non-GAAP Q1 FY16 Net Income (A) Negative 4% comp sales Gross margin rate +50bp Opex base inflation Synergies / cost savings Non-GAAP Q1 FY17 Net Income (E) Non-cash purchase accounting impact GAAP Q1 FY17 Net Income (E) Q1 FY17 EPS Guidance Detail 14 Operational assumptions ($M) EPS ($0.10) EPS $0.12 - $0.17 Q1 FY17 guidance excludes acquisition / integration expense