Attached files
| file | filename |
|---|---|
| 8-K - 8-K - M&T BANK CORP | d244697d8k.htm |

Barclays Global Financial Services Conference September 14, 2016 Exhibit 99.1
Disclaimer This presentation contains forward- looking statements within the meaning of the Private Securities Litigation Reform Act of 1995 giving M&T Bank Corporation’s (“M&T”) expectations or predictions of future financial or business performance or conditions. Forward-looking statements are typically identified by words such as “believe,” “expect,” “anticipate,” “intend,” “target,” “estimate,” “continue,” “positions,” “prospects” or “potential,” by future conditional verbs such as “will,” “would,” “should,” “could” or “may”, or by variations of such words or by similar expressions. These forward-looking statements are subject to numerous assumptions, risks and uncertainties which change over time. Forward-looking statements speak only as of the date they are made and we assume no duty to update forward-looking statements. Actual results may differ materially from current projections. Forward-looking statements involve known and unknown risks and uncertainties. A number of factors, many of which are beyond M&T’s control, could cause our actual results, events or developments, or industry results to be materially different from any future results, events or developments expressed, implied or anticipated by such forward-looking statements and so our business and financial condition and results of operations could be materially and adversely affected. In addition to factors previously disclosed in M&T’s reports filed with the U.S. Securities and Exchange Commission (the “SEC”) and those identified elsewhere in this document, the following factors, among others, could cause actual results to differ materially from forward-looking statements or historical performance: changes in asset quality and credit risk; the inability to sustain revenue and earnings growth; changes in interest rates and capital markets; inflation; customer acceptance of M&T products and services; customer borrowing, repayment, investment and deposit practices; customer disintermediation; the introduction, withdrawal, success and timing of business initiatives; competitive pressures; the inability to realize cost savings, revenues or other benefits, or to implement integration plans and other consequences associated with mergers, acquisitions and divestitures; general economic conditions and weakening in the economy; deteriorating credit quality; political developments, wars or other hostilities may disrupt or increase volatility in securities markets or other economic conditions; changes in accounting policies or procedures; significant litigation; and the impact, extent and timing of technological changes, capital management activities, and other actions of the Federal Reserve Board and other legislative and regulatory actions and reforms. Annualized, pro forma, projected and estimated numbers are used for illustrative purpose only, are not forecasts and may not reflect actual results.

Introduction
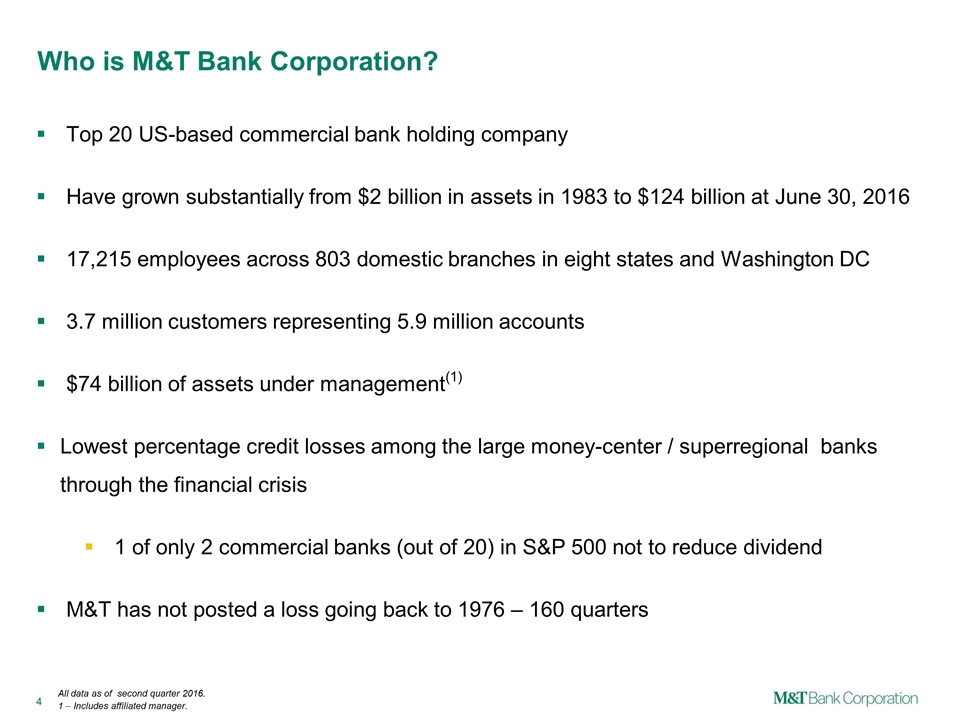
Who is M&T Bank Corporation? Top 20 US-based commercial bank holding company Have grown substantially from $2 billion in assets in 1983 to $124 billion at June 30, 2016 17,215 employees across 803 domestic branches in eight states and Washington DC 3.7 million customers representing 5.9 million accounts $74 billion of assets under management(1) Lowest percentage credit losses among the large money-center / superregional banks through the financial crisis 1 of only 2 commercial banks (out of 20) in S&P 500 not to reduce dividend M&T has not posted a loss going back to 1976 – 160 quarters All data as of second quarter 2016. 1 – Includes affiliated manager.
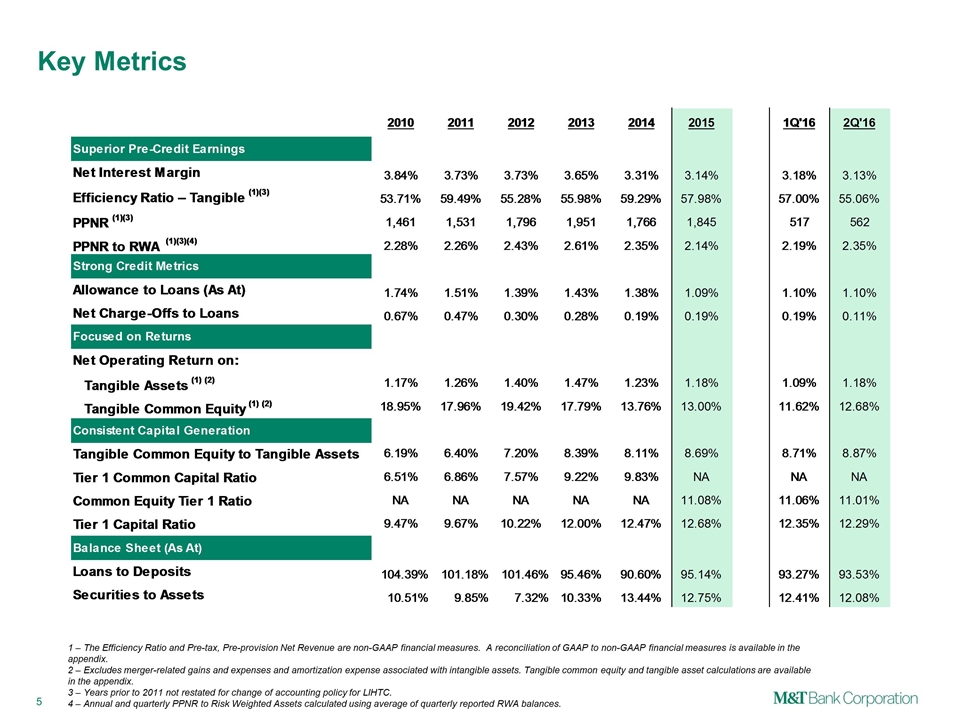
Key Metrics 1 – The Efficiency Ratio and Pre-tax, Pre-provision Net Revenue are non-GAAP financial measures. A reconciliation of GAAP to non-GAAP financial measures is available in the appendix. 2 – Excludes merger-related gains and expenses and amortization expense associated with intangible assets. Tangible common equity and tangible asset calculations are available in the appendix. 3 – Years prior to 2011 not restated for change of accounting policy for LIHTC. 4 – Annual and quarterly PPNR to Risk Weighted Assets calculated using average of quarterly reported RWA balances.
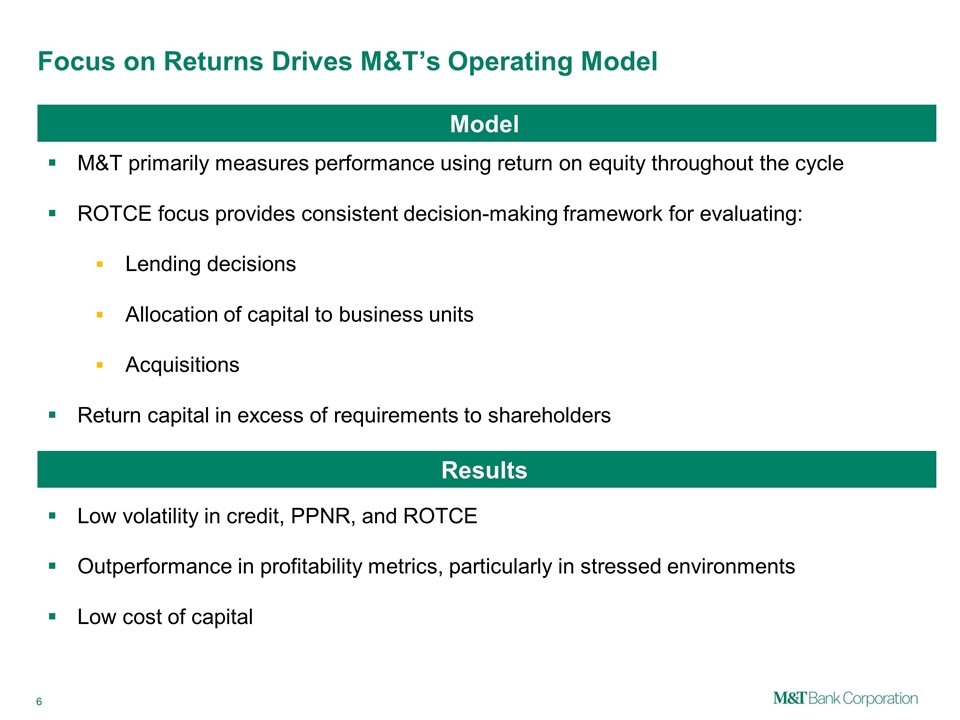
Focus on Returns Drives M&T’s Operating Model M&T primarily measures performance using return on equity throughout the cycle ROTCE focus provides consistent decision-making framework for evaluating: Lending decisions Allocation of capital to business units Acquisitions Return capital in excess of requirements to shareholders Low volatility in credit, PPNR, and ROTCE Outperformance in profitability metrics, particularly in stressed environments Low cost of capital Results Model
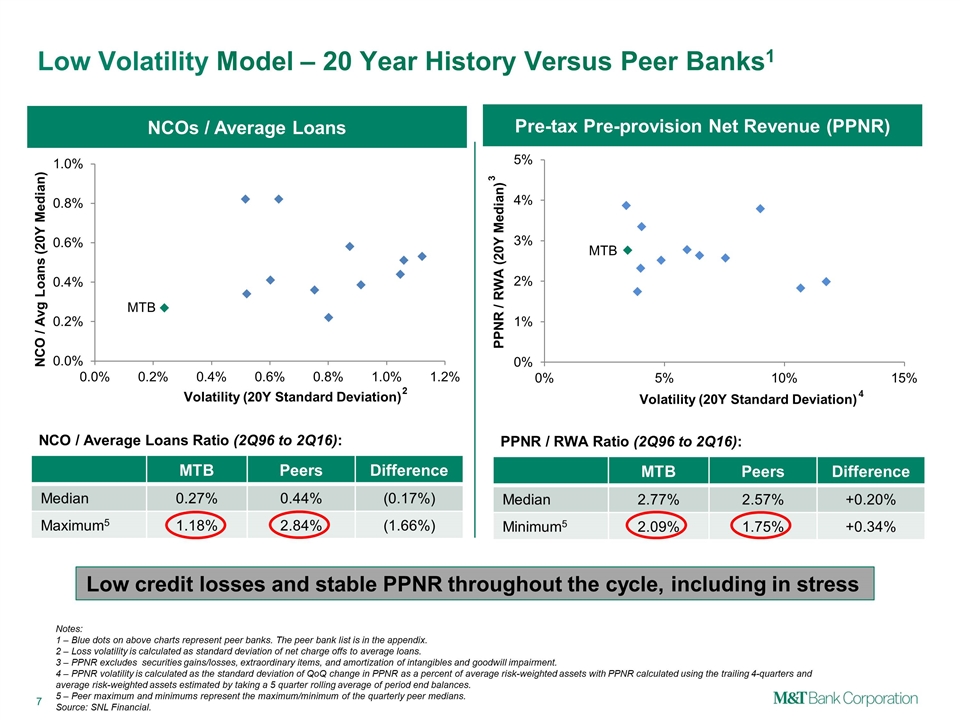
NCOs / Average Loans Low Volatility Model – 20 Year History Versus Peer Banks1 Pre-tax Pre-provision Net Revenue (PPNR) MTB Peers Difference Median 0.27% 0.44% (0.17%) Maximum5 1.18% 2.84% (1.66%) NCO / Average Loans Ratio (2Q96 to 2Q16): MTB Peers Difference Median 2.77% 2.57% +0.20% Minimum5 2.09% 1.75% +0.34% PPNR / RWA Ratio (2Q96 to 2Q16): Notes: 1 – Blue dots on above charts represent peer banks. The peer bank list is in the appendix. 2 – Loss volatility is calculated as standard deviation of net charge offs to average loans. 3 – PPNR excludes securities gains/losses, extraordinary items, and amortization of intangibles and goodwill impairment. 4 – PPNR volatility is calculated as the standard deviation of QoQ change in PPNR as a percent of average risk-weighted assets with PPNR calculated using the trailing 4-quarters and average risk-weighted assets estimated by taking a 5 quarter rolling average of period end balances. 5 – Peer maximum and minimums represent the maximum/minimum of the quarterly peer medians. Source: SNL Financial. Low credit losses and stable PPNR throughout the cycle, including in stress 2 4 3
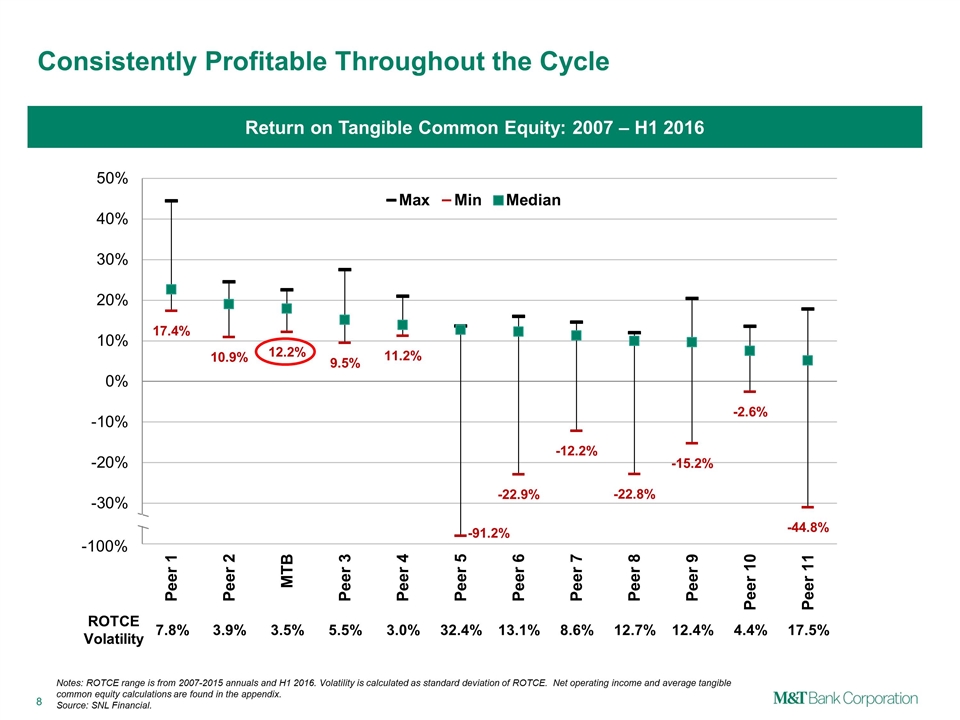
Consistently Profitable Throughout the Cycle Notes: ROTCE range is from 2007-2015 annuals and H1 2016. Volatility is calculated as standard deviation of ROTCE. Net operating income and average tangible common equity calculations are found in the appendix. Source: SNL Financial. Return on Tangible Common Equity: 2007 – H1 2016 ROTCE Volatility 7.8% 3.9% 3.5% 5.5% 3.0% 32.4% 13.1% 8.6% 12.7% 12.4% 4.4% 17.5% / / -100%
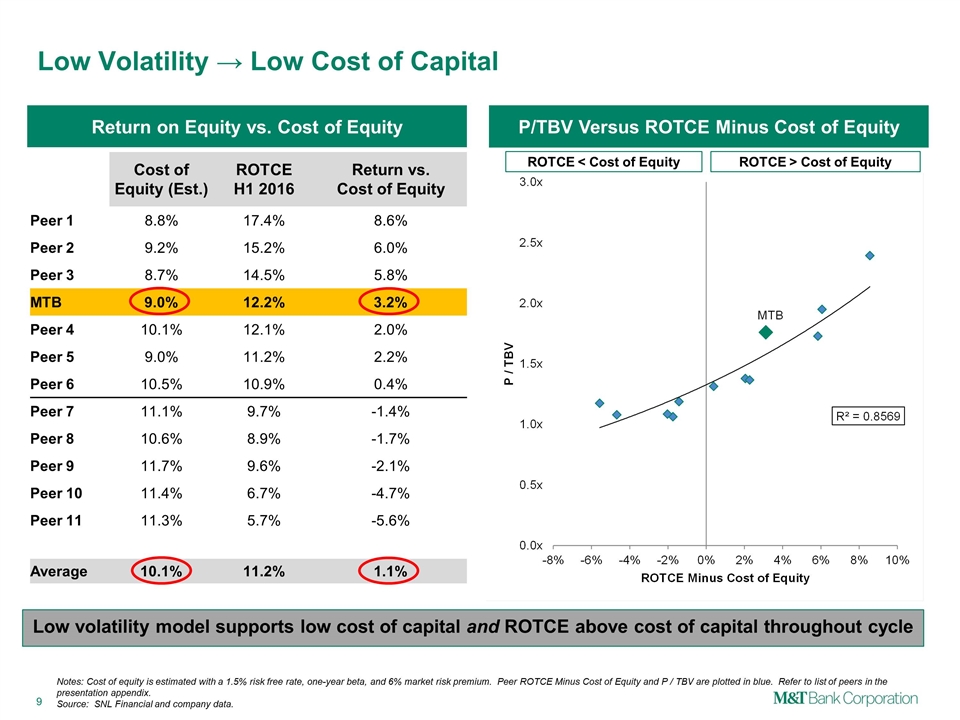
Cost of Equity (Est.) ROTCE H1 2016 Return vs. Cost of Equity Peer 1 8.8% 17.4% 8.6% Peer 2 9.2% 15.2% 6.0% Peer 3 8.7% 14.5% 5.8% MTB 9.0% 12.2% 3.2% Peer 4 10.1% 12.1% 2.0% Peer 5 9.0% 11.2% 2.2% Peer 6 10.5% 10.9% 0.4% Peer 7 11.1% 9.7% -1.4% Peer 8 10.6% 8.9% -1.7% Peer 9 11.7% 9.6% -2.1% Peer 10 11.4% 6.7% -4.7% Peer 11 11.3% 5.7% -5.6% Average 10.1% 11.2% 1.1% P/TBV Versus ROTCE Minus Cost of Equity Low Volatility → Low Cost of Capital Notes: Cost of equity is estimated with a 1.5% risk free rate, one-year beta, and 6% market risk premium. Peer ROTCE Minus Cost of Equity and P / TBV are plotted in blue. Refer to list of peers in the presentation appendix. Source: SNL Financial and company data. ROTCE < Cost of Equity ROTCE > Cost of Equity Return on Equity vs. Cost of Equity Low volatility model supports low cost of capital and ROTCE above cost of capital throughout cycle
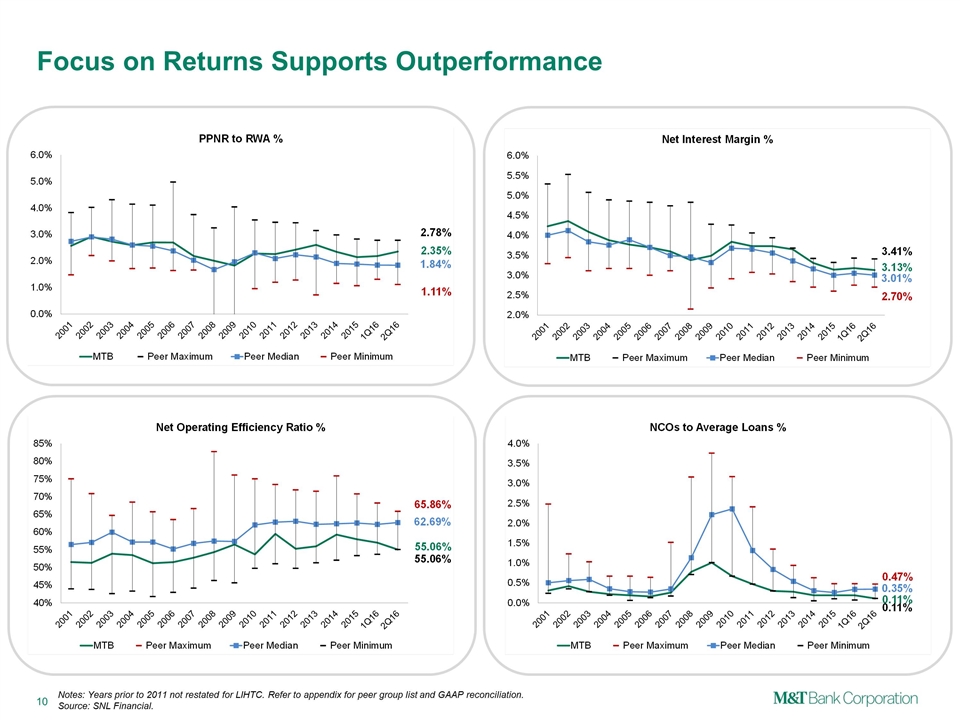
Focus on Returns Supports Outperformance Notes: Years prior to 2011 not restated for LIHTC. Refer to appendix for peer group list and GAAP reconciliation. Source: SNL Financial.
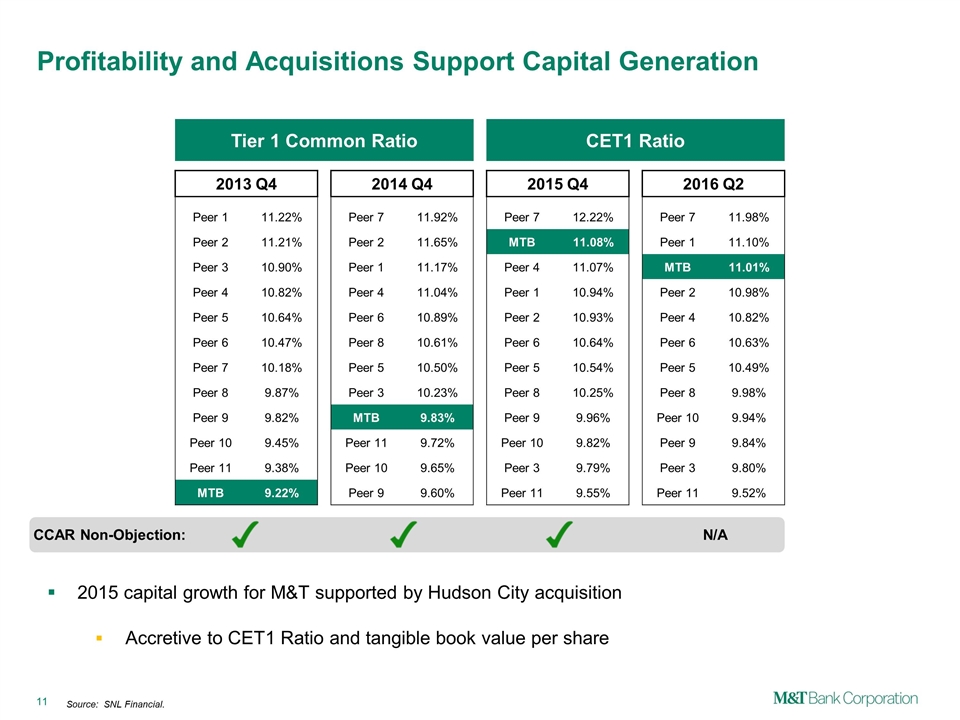
Profitability and Acquisitions Support Capital Generation Tier 1 Common Ratio CET1 Ratio Source: SNL Financial. CCAR Non-Objection: 2015 capital growth for M&T supported by Hudson City acquisition Accretive to CET1 Ratio and tangible book value per share N/A 2013 Q4 2014 Q4 2015 Q4 2016 Q2 Peer 1 11.22% Peer 7 11.92% Peer 7 12.22% Peer 7 11.98% Peer 2 11.21% Peer 2 11.65% MTB 11.08% Peer 1 11.10% Peer 3 10.90% Peer 1 11.17% Peer 4 11.07% MTB 11.01% Peer 4 10.82% Peer 4 11.04% Peer 1 10.94% Peer 2 10.98% Peer 5 10.64% Peer 6 10.89% Peer 2 10.93% Peer 4 10.82% Peer 6 10.47% Peer 8 10.61% Peer 6 10.64% Peer 6 10.63% Peer 7 10.18% Peer 5 10.50% Peer 5 10.54% Peer 5 10.49% Peer 8 9.87% Peer 3 10.23% Peer 8 10.25% Peer 8 9.98% Peer 9 9.82% MTB 9.83% Peer 9 9.96% Peer 10 9.94% Peer 10 9.45% Peer 11 9.72% Peer 10 9.82% Peer 9 9.84% Peer 11 9.38% Peer 10 9.65% Peer 3 9.79% Peer 3 9.80% MTB 9.22% Peer 9 9.60% Peer 11 9.55% Peer 11 9.52%
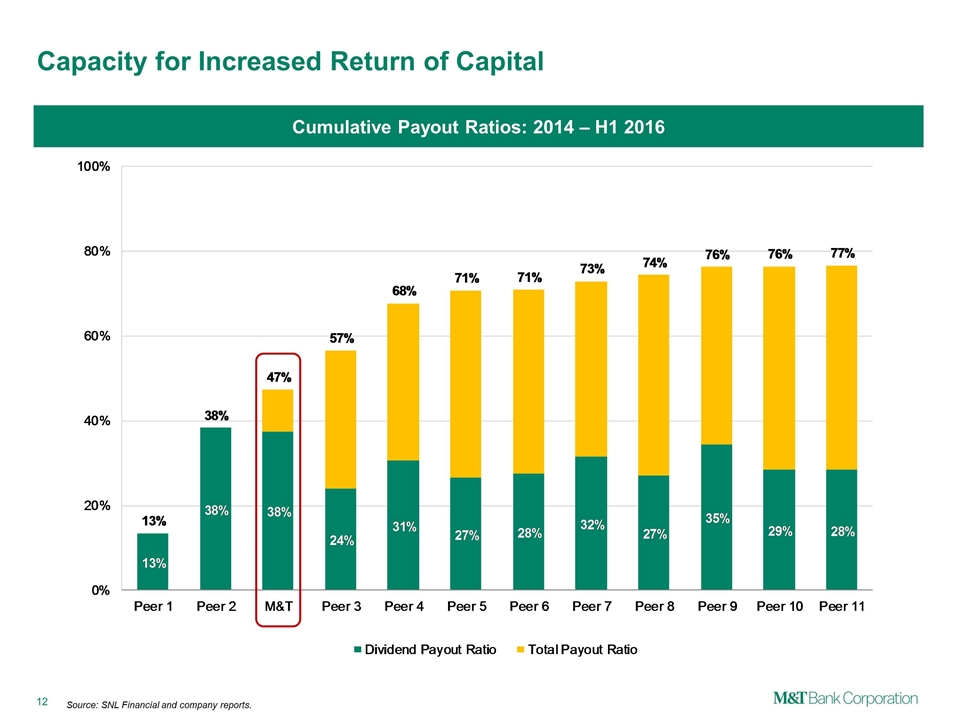
Capacity for Increased Return of Capital Cumulative Payout Ratios: 2014 – H1 2016 Source: SNL Financial and company reports.

Outlook and Opportunities
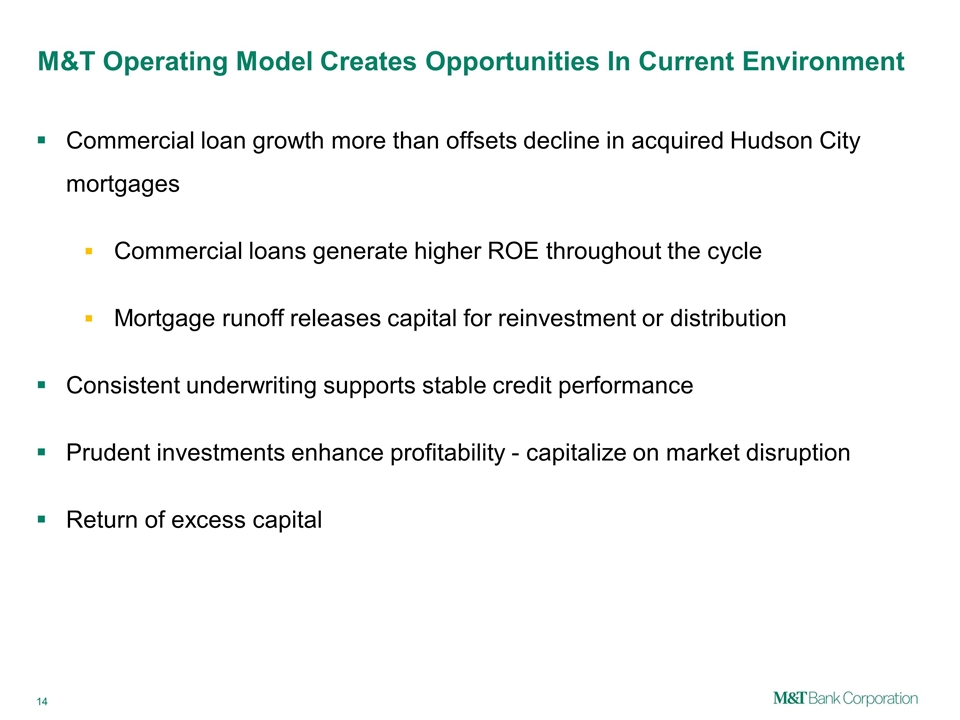
M&T Operating Model Creates Opportunities In Current Environment Commercial loan growth more than offsets decline in acquired Hudson City mortgages Commercial loans generate higher ROE throughout the cycle Mortgage runoff releases capital for reinvestment or distribution Consistent underwriting supports stable credit performance Prudent investments enhance profitability - capitalize on market disruption Return of excess capital
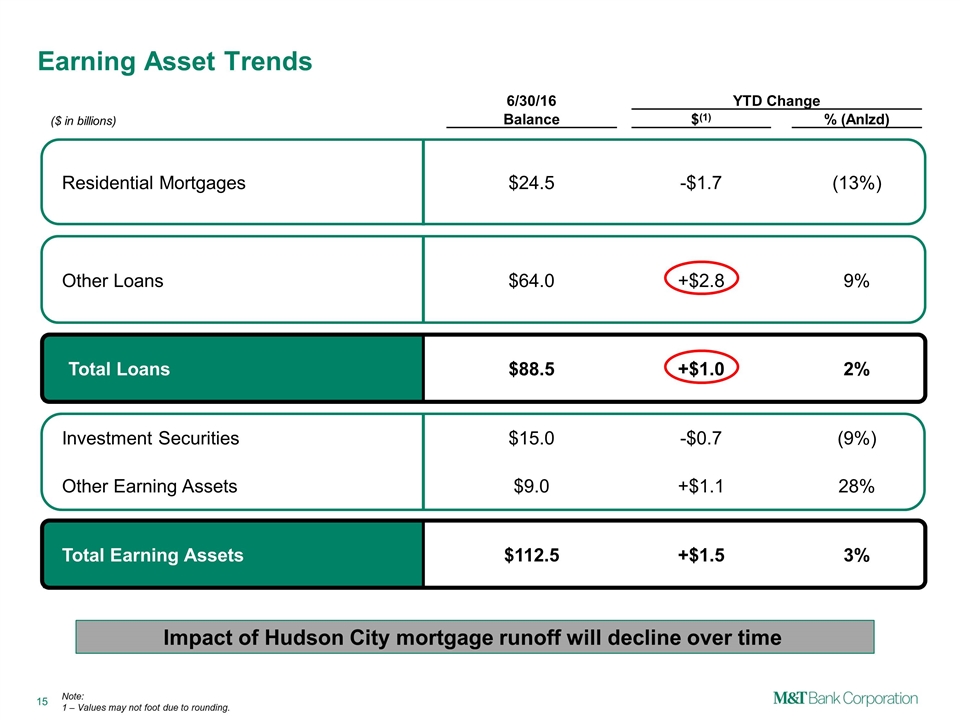
Earning Asset Trends 6/30/16 YTD Change ($ in billions) Balance $(1) % (Anlzd) Residential Mortgages $24.5 -$1.7 (13%) Other Loans $64.0 +$2.8 9% Total Loans $88.5 +$1.0 2% Investment Securities $15.0 -$0.7 (9%) Other Earning Assets $9.0 +$1.1 28% Total Earning Assets $112.5 +$1.5 3% Impact of Hudson City mortgage runoff will decline over time Note: 1 – Values may not foot due to rounding.
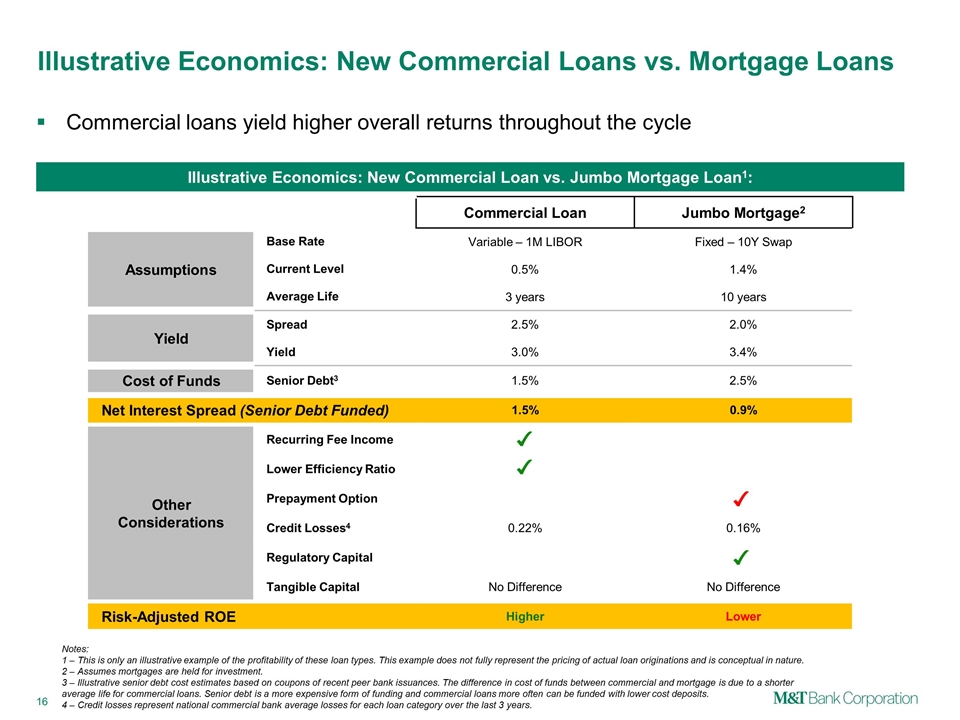
Commercial loans yield higher overall returns throughout the cycle Illustrative Economics: New Commercial Loans vs. Mortgage Loans Commercial Loan Jumbo Mortgage2 Assumptions Base Rate Variable – 1M LIBOR Fixed – 10Y Swap Current Level 0.5% 1.4% Average Life 3 years 10 years Yield Spread 2.5% 2.0% Yield 3.0% 3.4% Cost of Funds Senior Debt3 1.5% 2.5% Net Interest Spread (Senior Debt Funded) 1.5% 0.9% Other Considerations Recurring Fee Income Lower Efficiency Ratio Prepayment Option Credit Losses4 0.22% 0.16% Regulatory Capital Tangible Capital No Difference No Difference Risk-Adjusted ROE Higher Lower Illustrative Economics: New Commercial Loan vs. Jumbo Mortgage Loan1: Notes: 1 – This is only an illustrative example of the profitability of these loan types. This example does not fully represent the pricing of actual loan originations and is conceptual in nature. 2 – Assumes mortgages are held for investment. 3 – Illustrative senior debt cost estimates based on coupons of recent peer bank issuances. The difference in cost of funds between commercial and mortgage is due to a shorter average life for commercial loans. Senior debt is a more expensive form of funding and commercial loans more often can be funded with lower cost deposits. 4 – Credit losses represent national commercial bank average losses for each loan category over the last 3 years.
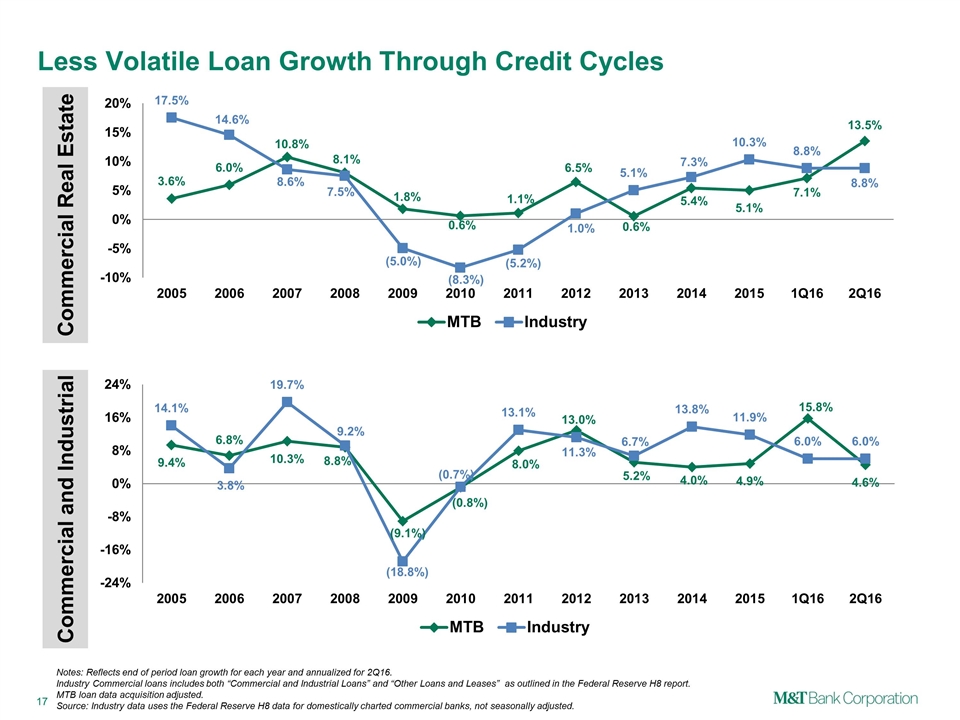
Less Volatile Loan Growth Through Credit Cycles Commercial Real Estate Commercial and Industrial Notes: Reflects end of period loan growth for each year and annualized for 2Q16. Industry Commercial loans includes both “Commercial and Industrial Loans” and “Other Loans and Leases” as outlined in the Federal Reserve H8 report. MTB loan data acquisition adjusted. Source: Industry data uses the Federal Reserve H8 data for domestically charted commercial banks, not seasonally adjusted.
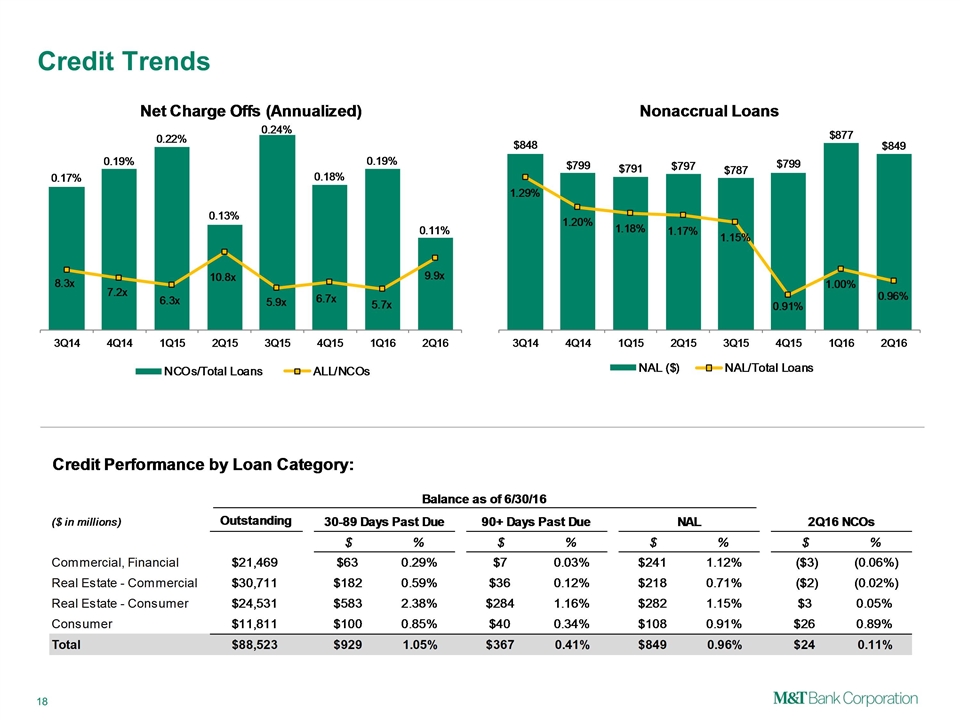
Credit Trends
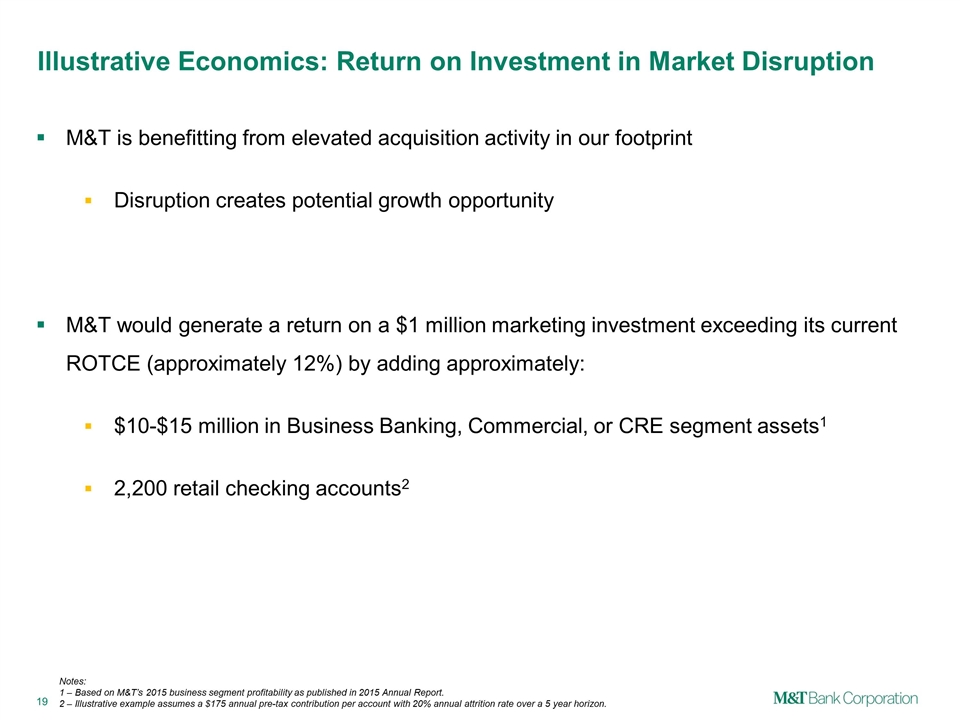
Illustrative Economics: Return on Investment in Market Disruption M&T is benefitting from elevated acquisition activity in our footprint Disruption creates potential growth opportunity M&T would generate a return on a $1 million marketing investment exceeding its current ROTCE (approximately 12%) by adding approximately: $10-$15 million in Business Banking, Commercial, or CRE segment assets1 2,200 retail checking accounts2 Notes: 1 – Based on M&T’s 2015 business segment profitability as published in 2015 Annual Report. 2 – Illustrative example assumes a $175 annual pre-tax contribution per account with 20% annual attrition rate over a 5 year horizon.
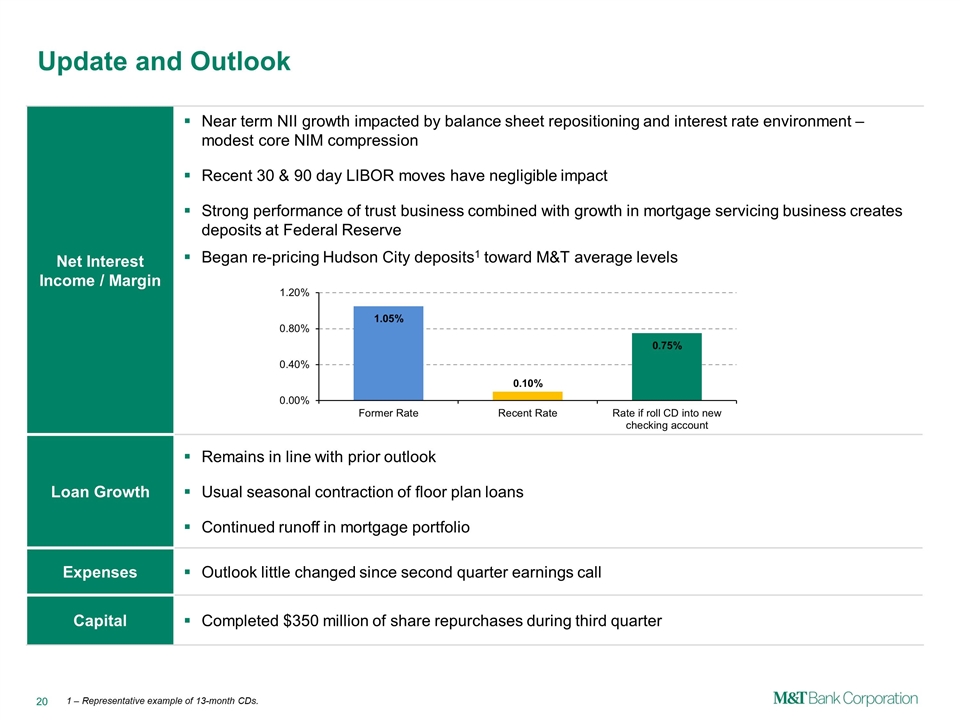
Net Interest Income / Margin Near term NII growth impacted by balance sheet repositioning and interest rate environment – modest core NIM compression Recent 30 & 90 day LIBOR moves have negligible impact Strong performance of trust business combined with growth in mortgage servicing business creates deposits at Federal Reserve Began re-pricing Hudson City deposits1 toward M&T average levels Loan Growth Remains in line with prior outlook Usual seasonal contraction of floor plan loans Continued runoff in mortgage portfolio Expenses Outlook little changed since second quarter earnings call Capital Completed $350 million of share repurchases during third quarter Update and Outlook 1 – Representative example of 13-month CDs.
Long-term Shareholder Outperformance
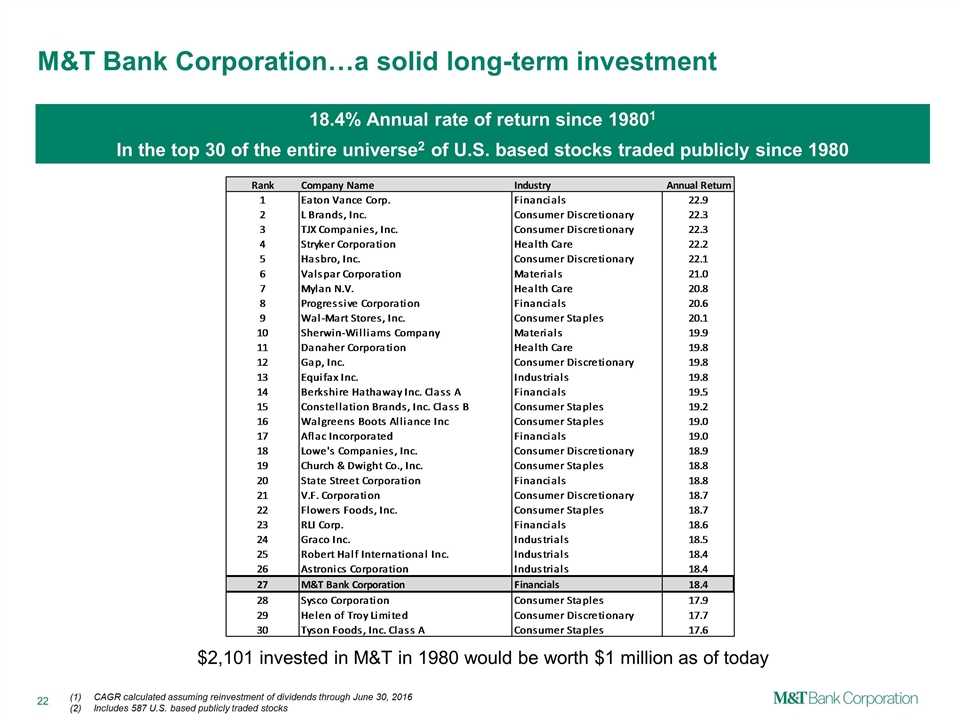
18.4% Annual rate of return since 19801 In the top 30 of the entire universe2 of U.S. based stocks traded publicly since 1980 M&T Bank Corporation…a solid long-term investment CAGR calculated assuming reinvestment of dividends through June 30, 2016 Includes 587 U.S. based publicly traded stocks $2,101 invested in M&T in 1980 would be worth $1 million as of today
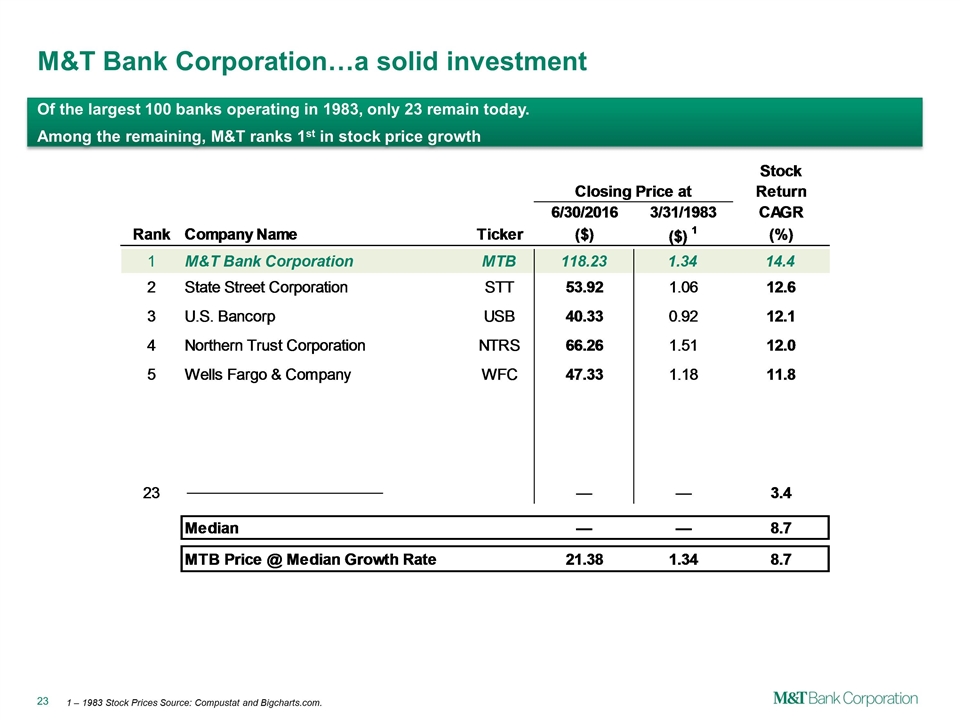
Of the largest 100 banks operating in 1983, only 23 remain today. Among the remaining, M&T ranks 1st in stock price growth M&T Bank Corporation…a solid investment 1 – 1983 Stock Prices Source: Compustat and Bigcharts.com.

Appendix and GAAP Reconciliations
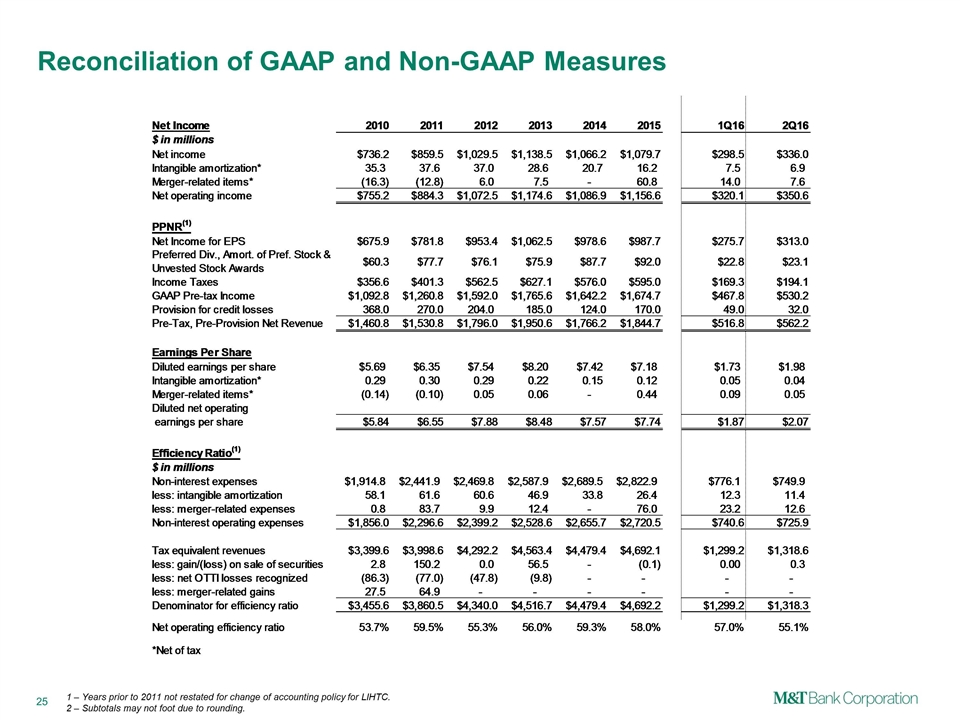
Reconciliation of GAAP and Non-GAAP Measures 1 – Years prior to 2011 not restated for change of accounting policy for LIHTC. 2 – Subtotals may not foot due to rounding.
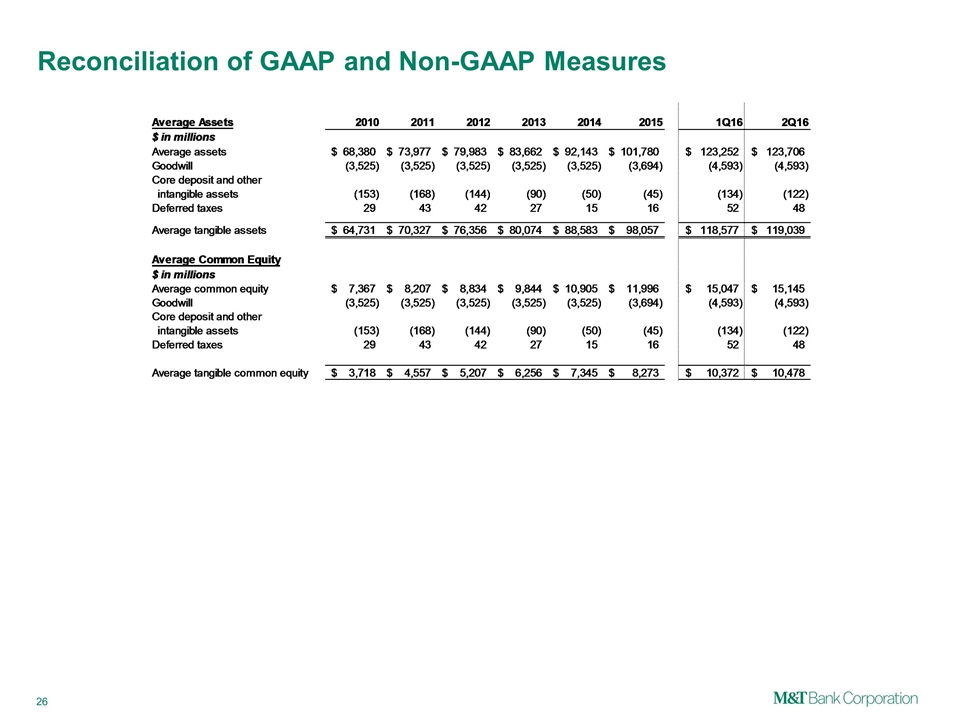
Reconciliation of GAAP and Non-GAAP Measures
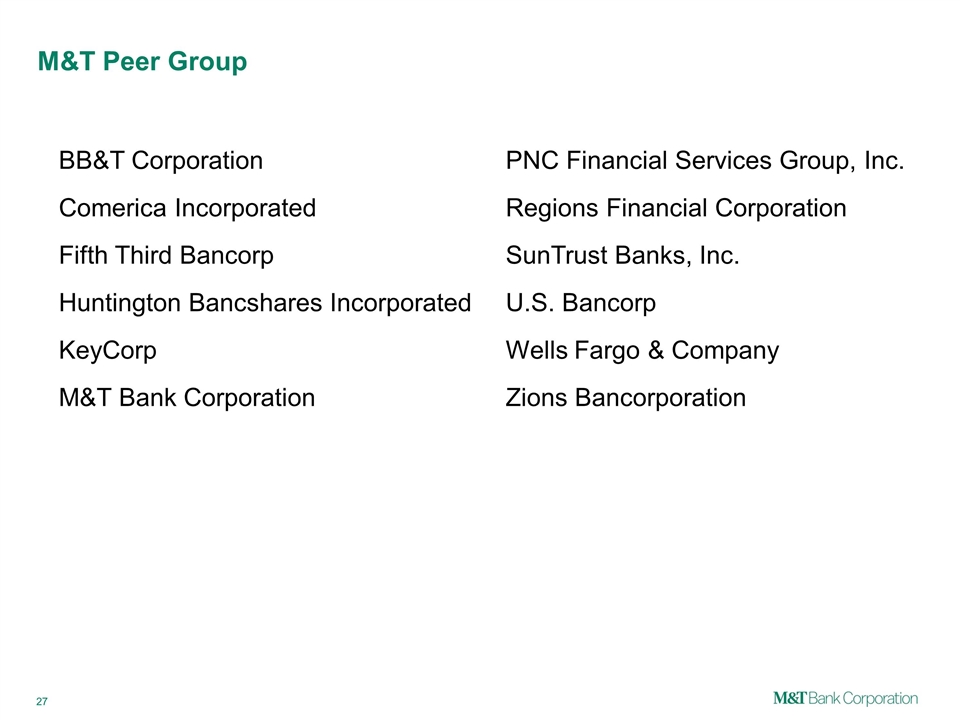
BB&T Corporation M&T Bank Corporation PNC Financial Services Group, Inc. Comerica Incorporated Regions Financial Corporation Fifth Third Bancorp Wells Fargo & Company SunTrust Banks, Inc. Huntington Bancshares Incorporated Zions Bancorporation KeyCorp M&T Peer Group U.S. Bancorp
