Attached files
| file | filename |
|---|---|
| 8-K - 8-K - NAVIENT CORP | d254866d8k.htm |
Exhibit 99.1

NAVIENT R
Barclays Global
Financial Services Conference
September 12, 2016
Forward-Looking Statements; Non-GAAP Financial Measures
The following information is current as of June 30, 2016 (unless otherwise noted) and should be read in connection with Navient Corporation’s (Navient) Annual Report on Form
10-K for the year ended December 31, 2015 (the “2015 Form 10-K”), filed by Navient with the Securities and Exchange Commission (the “SEC”) on February 25, 2016 and subsequent reports filed by Navient with the SEC. Definitions for
capitalized terms in this presentation not defined herein can be found in our 2015 Form 10-K. This presentation contains “forward-looking” statements and other information that is based on management’s current expectations as of the
date of this presentation. Statements that are not historical facts, including statements about our beliefs, opinions, or expectations and statements that assume or are dependent upon future events, are forward-looking statements and often contain
words such as “expect,” “anticipate,” “intend,” “plan,” “believe,” “seek,” “see,” “will,” “would,” or “target.” Forward-looking statements are
subject to risks, uncertainties, assumptions and other factors that may cause actual results to be materially different from those reflected in such forward-looking statements.
For us, these factors include, among others, the risks and uncertainties associated with:
increases in financing costs;
the availability of financing;
limits on liquidity resulting from disruptions in the capital markets or other factors;
unanticipated increases in costs associated with compliance with laws and regulations;
changes in the marketplaces in which we compete (including changes in demand or changes resulting from new laws and regulations);
changes in accounting standards pertaining to loan loss reserves and estimates or other accounting standards that may impact our operations;
adverse outcomes in any significant litigation to which we are a party;
credit risk associated
with our exposure to third parties, including counterparties to hedging or other derivative transactions; and
changes in the terms of education loans and the
educational credit marketplace (including changes resulting from new laws and the implementation of existing laws).
We could also be affected by, among other
things:
unanticipated deferrals in our FFELP securitization trusts that would delay repayment of the bonds beyond their legal final maturity date;
reductions to our credit ratings, the credit ratings of asset-backed securitizations we sponsor or the credit ratings of the United States of America;
failures of our operating systems or infrastructure, or those of third-party vendors;
risks
related to cybersecurity including the potential disruption of our systems or potential disclosure of confidential customer information;
damage to our reputation
resulting from the politicization of student loan servicing;
failures to successfully implement cost-cutting initiatives and adverse effects of such initiatives on
our business;
delays or errors in converting portfolio acquisitions to our servicing platform
risks associated with restructuring initiatives;
changes in law and regulations with respect
to the student lending business and financial institutions generally;
increased competition from banks and other consumer lenders who are not subject to the same
level of regulation;
the creditworthiness of our customers;
changes in the
general interest rate environment, including the relationship between the relevant money-market index rate and the rate at which our assets are priced;
our ability
to successfully effectuate any acquisitions and other strategic initiatives;
changes in the demand for debt management services;
changes in general economic conditions; and
the other factors that are described in the
“Risk Factors” section of the 2015 Form 10-K and in our future reports filed with the SEC.
The preparation of our consolidated financial statements also
requires management to make certain estimates and assumptions including estimates and assumptions about future events. These estimates or assumptions may prove to be incorrect and actual results could differ materially. All forward-looking
statements contained in this presentation are qualified by these cautionary statements and are made only as of the date of this presentation. We do not undertake any obligation to update or revise these forward-looking statements except as required
by law.
Navient reports financial results on a GAAP basis and also provides certain non-GAAP core earnings performance measures. When compared to GAAP results,
core earnings exclude the impact of: (1) the financial results of the consumer banking business for historical periods prior to the April 30, 2014 spin-off of Navient from SLM Corporation as well as related restructuring and reorganization expenses
incurred in connection with the spin-off, including the restructuring initiated in the second quarter of 2015; (2) unrealized, mark-to-market gains/losses on derivatives; and (3) goodwill and acquired intangible asset amortization and impairment.
Navient provides core earnings measures because this is what management uses when making management decisions regarding Navient’s performance and the allocation of corporate resources. Navient core earnings are not defined terms within GAAP and
may not be comparable to similarly titled measures reported by other companies. For additional information, see “Differences Between ‘Core Earnings’ and GAAP” on slide 20 of this presentation for a further discussion and a
complete reconciliation between GAAP net income and core earnings.
Confidential and proprietary information © 2016 Navient Solutions, Inc. All rights
reserved.
2
NAVIENTSM
We are the
leading loan management, servicing and asset recovery company
$117 billion education loan portfolio, of which 79% is insured or guaranteed
Servicing more than $300 billion in student loans, the company supports the educational and economic achievements of more than 12 million Americans
Asset recovery and business processing platform provide services for over 1,000 public and private sector clients
Helping our customers navigate the path to financial success is everything we stand for
As of
June 30, 2016
Confidential and proprietary information © 2016 Navient Solutions, Inc. All rights reserved.
3
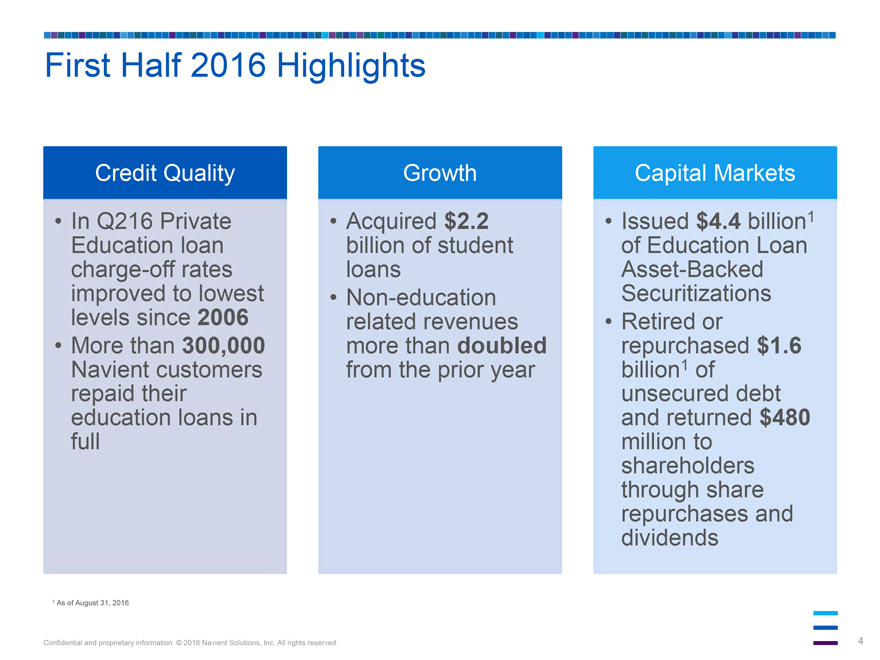
First Half 2016 Highlights
Credit Quality
In Q216 Private Education loan charge-off rates improved to
lowest levels since 2006
More than 300,000 Navient customers repaid their education loans in full
Growth
Acquired $2.2 billion of student loans
Non-education related revenues more than doubled from the prior year
Capital Markets
Issued $4.4 billion1 of Education Loan Asset-Backed Securitizations
Retired
or repurchased $1.6 billion1 of unsecured debt and returned $480 million to shareholders through share repurchases and dividends
1 As of August 31, 2016
Confidential and proprietary information © 2016 Navient Solutions, Inc. All rights reserved.
4
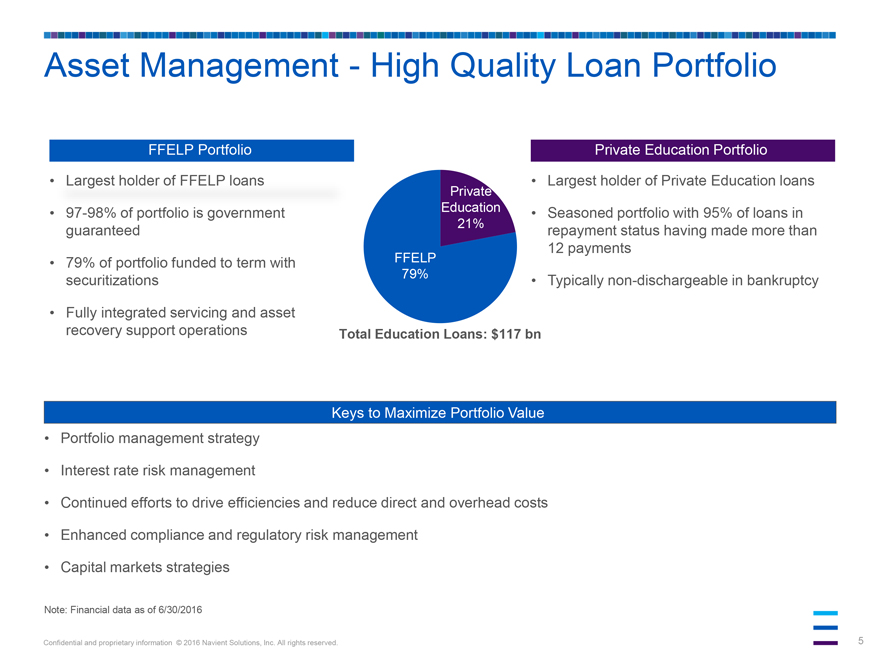
Asset Management - High Quality Loan Portfolio
FFELP Portfolio
Largest holder of FFELP loans
97-98% of portfolio is government guaranteed
79% of portfolio funded to term with
securitizations
Fully integrated servicing and asset recovery support operations
FFELP 79%
Private Education 21%
Total Education Loans: $117 bn
Private Education Portfolio
Largest holder of Private Education loans
Seasoned portfolio with 95% of loans in repayment
status having made more than 12 payments
Typically non-dischargeable in bankruptcy
Keys to Maximize Portfolio Value
Portfolio management strategy
Interest rate risk management
Continued efforts to drive efficiencies and reduce direct and
overhead costs
Enhanced compliance and regulatory risk management
Capital
markets strategies
Note: Financial data as of 6/30/2016
Confidential and
proprietary information © 2016 Navient Solutions, Inc. All rights reserved.
5
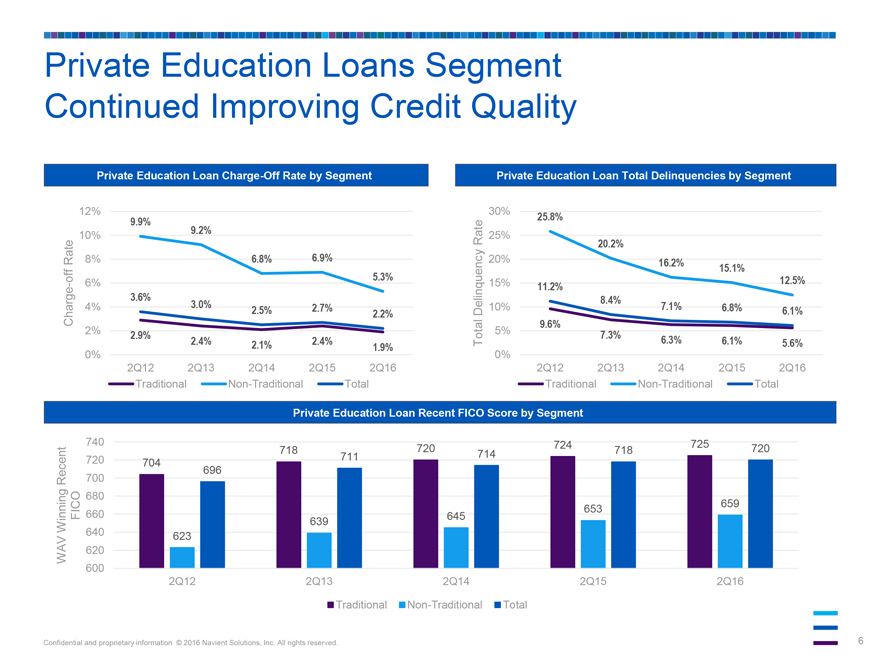
Private Education Loans Segment
Continued Improving Credit Quality
Private Education Loan Charge-Off Rate by Segment
Charge-off Rate
12% 10% 8% 6% 4% 2% 0%
9.9% 9.2% 6.8% 6.9% 5.3%
3.6% 3.0% 2.5% 2.7% 2.2%
2.9% 2.4% 2.1% 2.4% 1.9%
2Q12 2Q13 2Q14 2Q15 2Q16
Traditional Non-Traditional Total
Private Education Loan Total Delinquencies by Segment
Total Delinquency Rate
30% 25% 20% 15% 10% 5% 0%
25.8% 20.2% 16.2% 15.1% 12.5%
11.2% 8.4% 7.1% 6.8% 6.1%
9.6% 7.3% 6.3% 6.1% 5.6%
2Q12 2Q13 2Q14 2Q15 2Q16
Traditional Non-Traditional Total
Private Education Loan Recent FICO Score by Segment
WAV Winning Recent
FICO
740 720 700 680 660 640 620 600
704 623 696 718 639 711 720 645 714 724 653 718 725 659 720
2Q12 2Q13 2Q14 2Q15 2Q16
Traditional Non-Traditional Total
Confidential and proprietary information © 2016 Navient Solutions, Inc. All rights reserved.
6
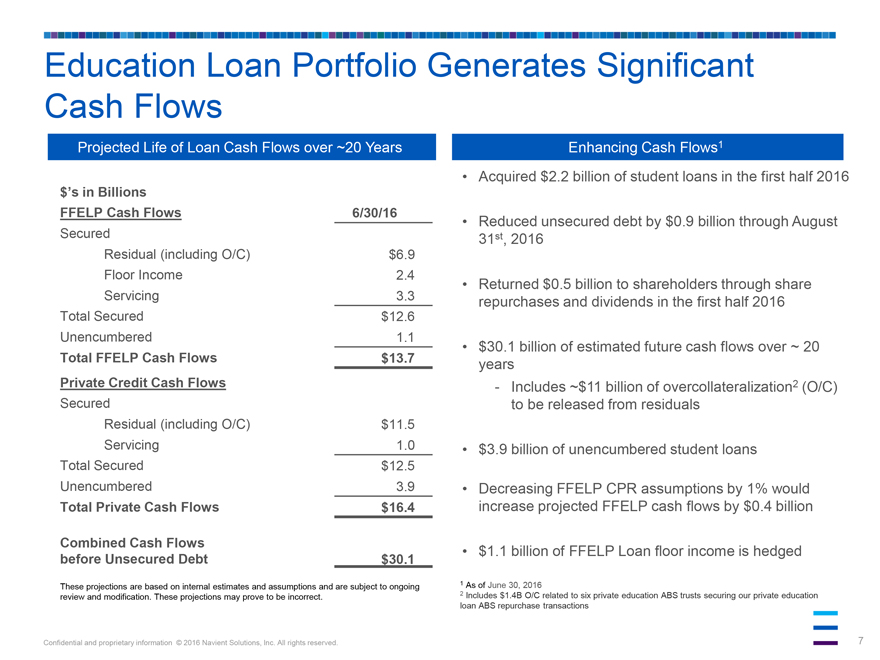
Education Loan Portfolio Generates Significant Cash Flows
Projected Life of Loan Cash Flows over ~20 Years
$’s in Billions
FFELP Cash Flows 6/30/16
Secured
Residual (including O/C) $6.9
Floor Income 2.4
Servicing 3.3
Total Secured $12.6
Unencumbered 1.1
Total FFELP Cash Flows $13.7
Private Credit Cash Flows
Secured
Residual (including O/C) $11.5
Servicing 1.0
Total Secured $12.5
Unencumbered 3.9
Total Private Cash Flows $16.4
Combined Cash Flows
before Unsecured Debt $30.1
These projections are based on internal estimates and assumptions
and are subject to ongoing review and modification. These projections may prove to be incorrect.
Enhancing Cash Flows1
Acquired $2.2 billion of student loans in the first half 2016
Reduced unsecured debt by $0.9
billion through August 31st, 2016
Returned $0.5 billion to shareholders through share repurchases and dividends in the first half 2016
$30.1 billion of estimated future cash flows over ~ 20 years
- Includes ~$11 billion of
overcollateralization2 (O/C) to be released from residuals
$3.9 billion of unencumbered student loans
Decreasing FFELP CPR assumptions by 1% would increase projected FFELP cash flows by $0.4 billion
$1.1 billion of FFELP Loan floor income is hedged
1 As of June 30, 2016
2 Includes $1.4B O/C related to six private education ABS trusts securing our private education loan ABS repurchase transactions
Confidential and proprietary information © 2016 Navient Solutions, Inc. All rights reserved.
7
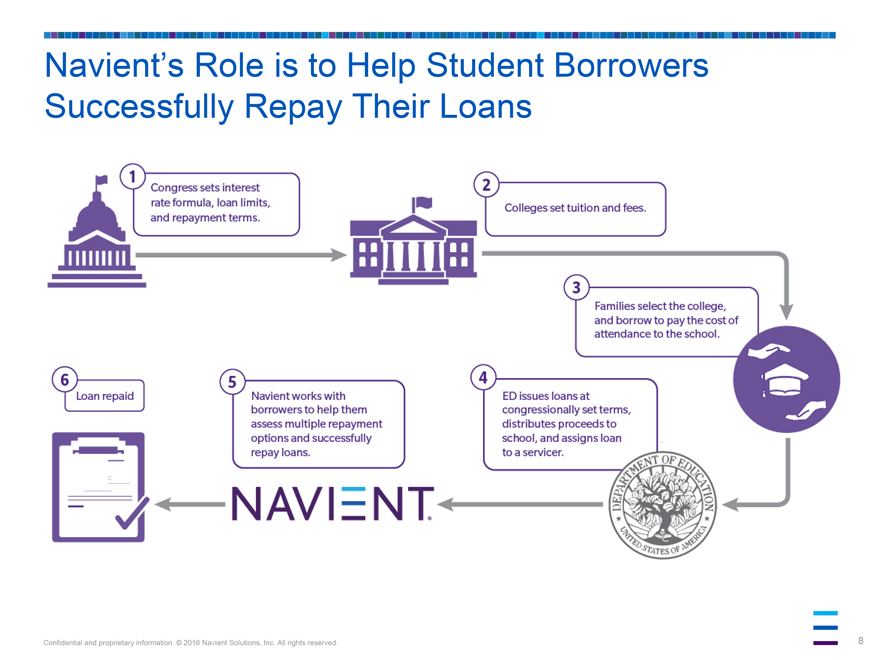
Navient’s Role is to Help Student Borrowers Successfully Repay Their Loans
1 Congress sets interest rate formula, loan limits, and repayment terms.
2 Colleges set
tuition and fees.
3 Families select the college, and borrow to pay the cost of attendance to the school.
4 ED issues loans at congressionally set terms, distributes proceeds to school, and assigns loan to a servicer.
5 Navient works with borrowers to help them assess multiple repayment options and successfully repay loans.
6 Loan repaid
DEPARTMENT OF EDUCATION
UNITED STATES OF AMERICA
NAVIENT
Confidential and proprietary information © 2016 Navient Solutions, Inc. All rights reserved.
8
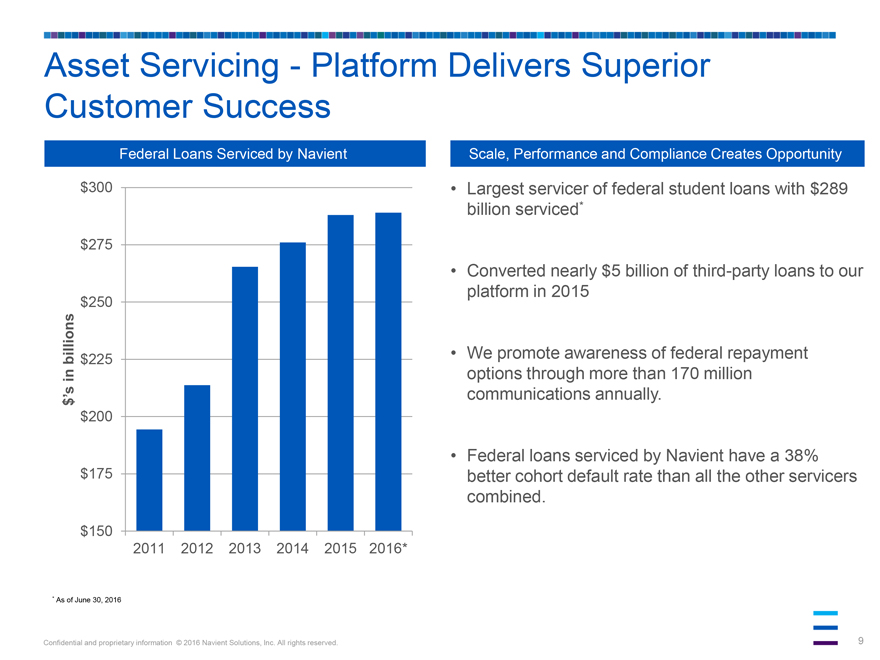
Asset Servicing - Platform Delivers Superior Customer Success
Federal Loans Serviced by Navient
$’s in billions
$300 $275 $250 $225 $200 $175 $150
2011 2012 2013 2014 2015 2016*
Scale, Performance and Compliance Creates Opportunity
Largest servicer of federal student
loans with $289 billion serviced*
Converted nearly $5 billion of third-party loans to our platform in 2015
We promote awareness of federal repayment options through more than 170 million communications annually.
Federal loans serviced by Navient have a 38% better cohort default rate than all the other servicers combined.
* As of June 30, 2016
Confidential and proprietary information © 2016 Navient Solutions,
Inc. All rights reserved.
9
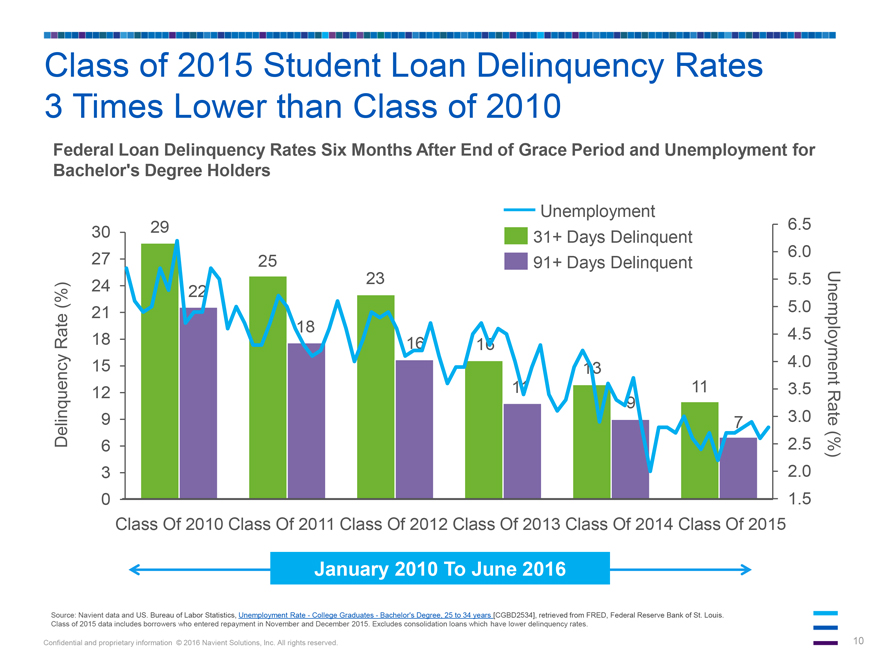
Class of 2015 Student Loan Delinquency Rates
3 Times Lower than Class of 2010
Federal Loan Delinquency Rates Six Months After End of Grace
Period and Unemployment for Bachelor’s Degree Holders
Delinquency Rate (%)
30
27
24
21
18
15
12
9
6
3
0
29
22
25
18
23
16
16
11
13
9
11
7
Unemployment
31+ Days Delinquent
91+ Days Delinquent
6.5
6.0
5.5
5.0
4.5
4.0
3.5
3.0
2.5
2.0
1.5
Unemployment Rate (%)
Class Of 2010 Class Of 2011 Class Of 2012 Class Of 2013 Class Of 2014 Class Of 2015
January
2010 To June 2016
Source: Navient data and US. Bureau of Labor Statistics, Unemployment Rate - College Graduates - Bachelor’s Degree, 25 to 34 years
[CGBD2534], retrieved from FRED, Federal Reserve Bank of St. Louis. Class of 2015 data includes borrowers who entered repayment in November and December 2015. Excludes consolidation loans which have lower delinquency rates.
Confidential and proprietary information © 2016 Navient Solutions, Inc. All rights reserved.
10
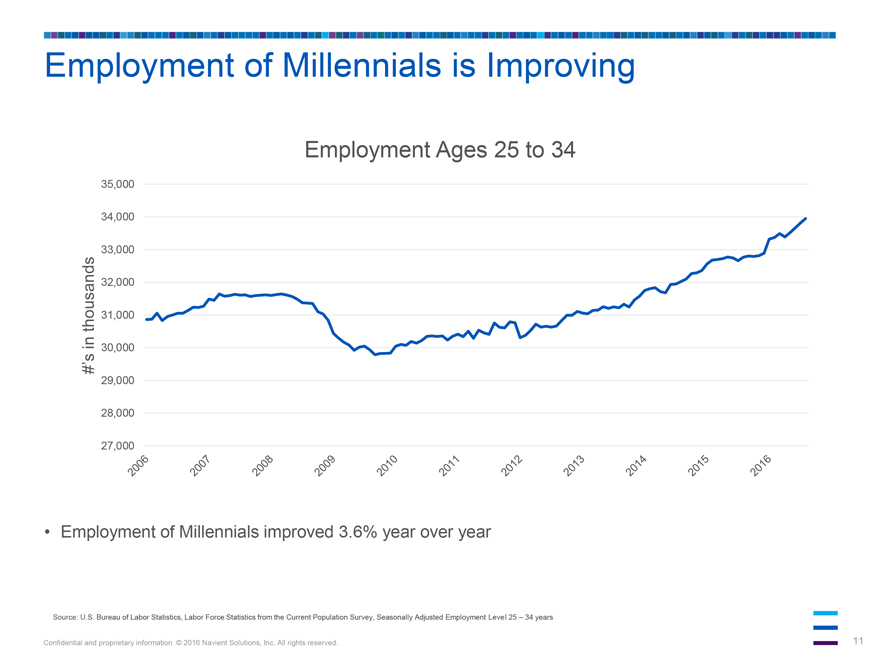
Employment of Millennials is Improving
Employment Ages 25 to 34
#’s in thousands
35,000 34,000 33,000 32,000 31,000 30,000 29,000 28,000 27,000
2006 2007 2008 2009 2010 2011
2012 2013 2014 2015 2016
• Employment of Millennials improved 3.6% year over year
Source: U.S. Bureau of Labor Statistics, Labor Force Statistics from the Current Population Survey, Seasonally Adjusted Employment Level 25 – 34 years
Confidential and proprietary information © 2016 Navient Solutions, Inc. All rights reserved.
11
Improving the Federal Education Loan Repayment Process
4 recommendations to improve student loan program success:
1. Provide more front-end resources
to improve decision making.
Students and their families need tools to understand how much they’ll need to borrow to earn the degree—not simply the
current semester—and to assess the likely economic benefits of a chosen field. This kind of information will help students and parents make a more informed assessment about what they can afford.
2. Simplify repayment.
Currently, the government offers 16 repayment plans, eight forgiveness
programs, and 32 deferment and forbearance options—each with its own nuances, payment schedules, qualifications, and complex enrollment criteria. They should be and can be simplified. For example, collapsing the multiple income-driven repayment
options into one plan with the most appropriate borrower-friendly terms would be a good start.
3. Help borrowers pay off early.
In the rush to help student borrowers, too many have trumpeted lower payments over longer periods as the universal solution despite the higher interest costs many borrowers will
pay. We need programs that help struggling borrowers through short-term and long-term challenges, but anyone enrolling should understand the trade-offs to be able to make the right choice for their financial circumstances.
4. Encourage borrowers to engage with their loan servicers.
Default is avoidable, but borrower
contact is key. As a servicer, we’ve found that nine times out of 10, when we reach struggling federal loan borrowers we are able to help them avoid default by getting them into a repayment plan that works for them. Contact works; let’s
encourage it.
navient.com/views
#studentloansuccess
NAVIENT
Confidential and proprietary information © 2016 Navient Solutions, Inc. All
rights reserved.
12
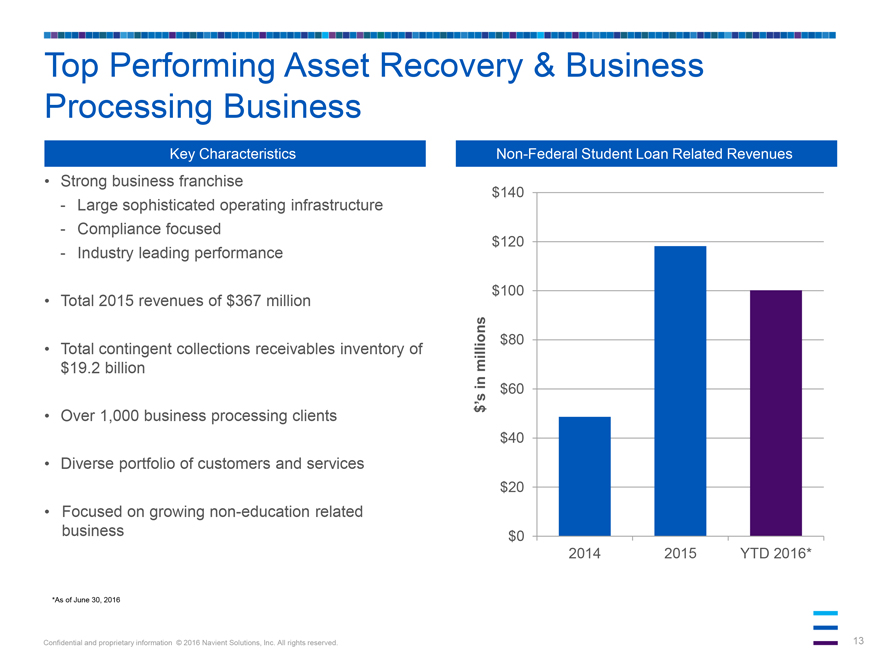
Top Performing Asset Recovery & Business Processing Business
Key Characteristics
Strong business franchise
Large sophisticated operating infrastructure
Compliance focused
Industry leading performance
Total 2015 revenues of $367 million
Total contingent collections receivables inventory of $19.2 billion
Over 1,000 business
processing clients
Diverse portfolio of customers and services
Focused on
growing non-education related business
Non-Federal Student Loan Related Revenues
$’s in millions
$140 $120 $100 $80 $60 $40 $20 $0
2014 2015 YTD 2016*
*As of June 30, 2016
Confidential and proprietary information © 2016 Navient Solutions, Inc. All rights reserved.
13
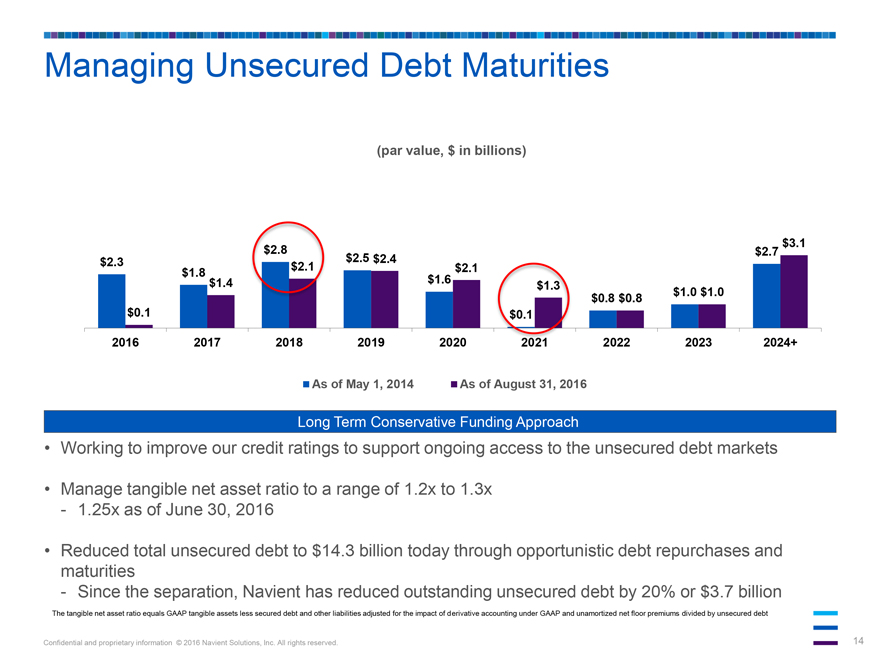
Managing Unsecured Debt Maturities
(par value, $ in billions)
$2.3
$0.1
$1.8
$1.4
$2.8
$2.1
$2.5 $2.4
$1.6
$2.1
$0.1
$1.3
$0.8 $0.8
$1.0 $1.0
$2.7
$3.1
2016 2017 2018 2019 2020 2021 2022 2023 2024+
As of May 1, 2014 As of August
31, 2016
Long Term Conservative Funding Approach
Working to improve our
credit ratings to support ongoing access to the unsecured debt markets
Manage tangible net asset ratio to a range of 1.2x to 1.3x
1.25x as of June 30, 2016
Reduced total unsecured debt to $14.3 billion today through
opportunistic debt repurchases and maturities
Since the separation, Navient has reduced outstanding unsecured debt by 20% or $3.7 billion
The tangible net asset ratio equals GAAP tangible assets less secured debt and other liabilities adjusted for the impact of derivative accounting under GAAP and unamortized net
floor premiums divided by unsecured debt
Confidential and proprietary information © 2016 Navient Solutions, Inc. All rights reserved.
14
Access to Multiples Sources of Funding –2016 Financing Activity
Completed five FFELP ABS transactions totaling $3.9 billion
Issued first FFELP ABS transaction
consisting entirely of rehabilitated loans
Completed one Private Education Loan ABS transaction totaling $488 million
Extended FFELP ABCP facility to March 2018
Current maximum financing capacity of $7.5 billion
in this facility
Extended Private Education Loan ABCP facility to June 2017
Current maximum financing capacity of $750 million in this facility
Increased
our existing Private Education Loan repurchase facility by an additional $478 million
Issued $750 million of long-term unsecured debt
Year to date as of August 31, 2016
Confidential and proprietary information © 2016
Navient Solutions, Inc. All rights reserved.
15
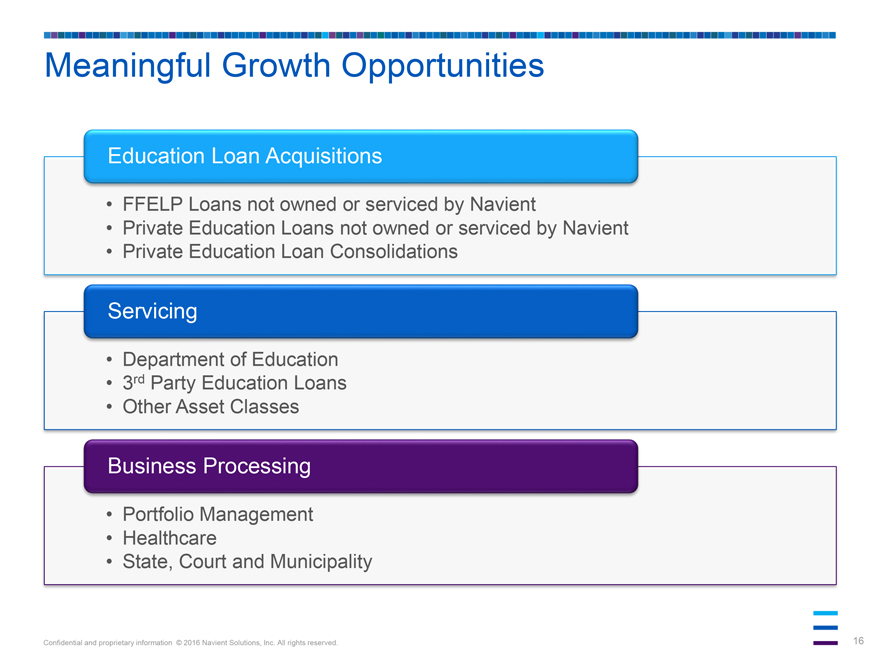
Meaningful Growth Opportunities
Education Loan Acquisitions
FFELP Loans not owned or serviced by Navient
Private Education Loans not owned or serviced by Navient
Private Education Loan Consolidations
Servicing
Department of Education
3rd Party Education Loans
Other Asset Classes
Business Processing
Portfolio Management
Healthcare
State, Court and Municipality
Confidential and proprietary information © 2016 Navient Solutions, Inc. All rights reserved.
16
Investment Highlights
High quality loan portfolio
Significant and predictable cash flow generation
Efficient and large-scale, customer-focused operating platforms
Growing
non-student loan related fee businesses
Ability to service unsecured debt through long-term conservative funding approach
Improving credit quality driven by a seasoned portfolio
Meaningful growth opportunities
Confidential and proprietary information © 2016 Navient Solutions, Inc. All rights reserved.
17
NAVIENT®
Appendix
Confidential and
proprietary information © 2016 Navient Solutions, Inc. All rights reserved.
19
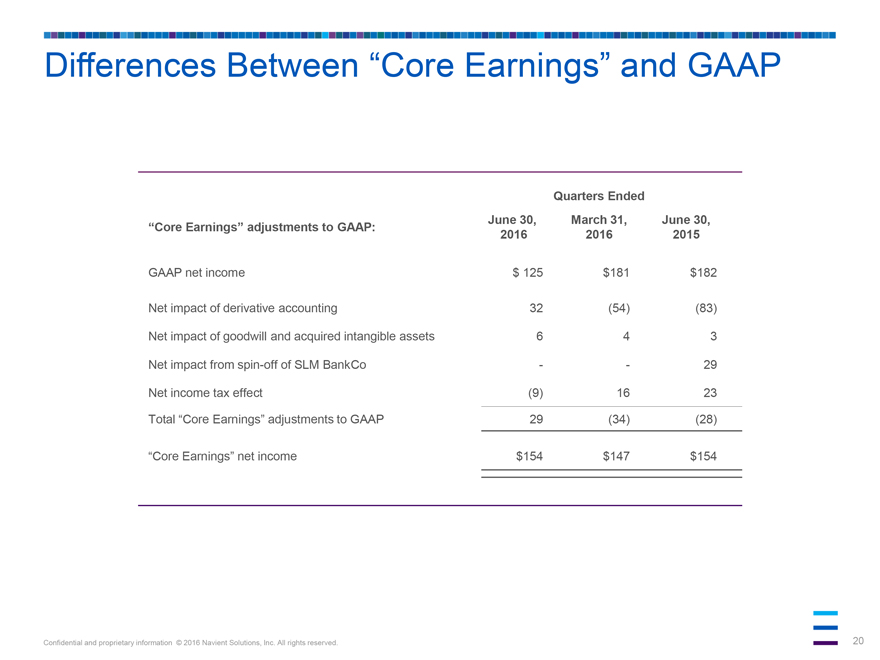
Differences Between “Core Earnings” and GAAP
Quarters Ended
“Core Earnings” adjustments to GAAP: June 30, 2016 March 31, 2016
June 30, 2015
GAAP net income $125 $181 $182
Net impact of derivative
accounting 32 (54) (83)
Net impact of goodwill and acquired intangible assets 6 4 3
Net impact from spin-off of SLM BankCo - - 29
Net income tax effect (9) 16 23
Total “Core Earnings” adjustments to GAAP 29 (34) (28)
“Core Earnings” net
income $154 $147 $154
Confidential and proprietary information © 2016 Navient Solutions, Inc. All rights reserved.
20
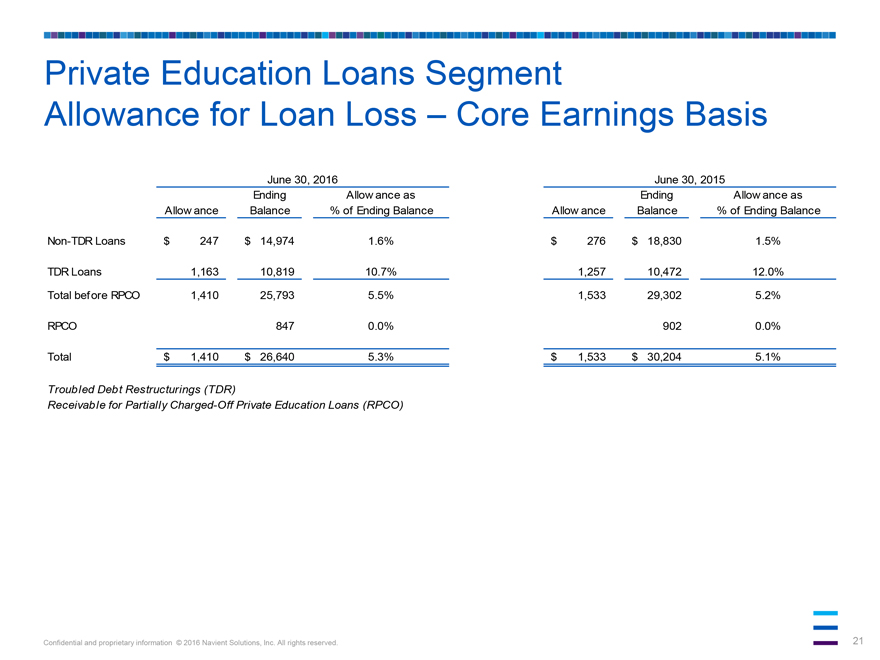
Private Education Loans Segment
Allowance for Loan Loss - Core Earnings Basis
June 30, 2016
June 30, 2015
Allowance
Ending Balance
Allowance as % of Ending Balance
Allowance
Ending Balance
Allowance as % of Ending Balance
Non-TDR Loans $247 $14,974 1.6% $276 $18,830 1.5%
TDR Loans 1,163 10,819 10.7% 1,257 10,472 12.0%
Total before RPCO 1,410 25,793 5.5% 1,533
29,302 5.2%
RPCO 847 0.0% 902 0.0%
Total $1,410 $26,640 5.3% $1,533 $30,204
5.1%
Troubled Debt Restructurings (TDR)
Receivable for Partially Charged-Off
Private Education Loans (RPCO)
Confidential and proprietary information © 2016 Navient Solutions, Inc. All rights reserved.
21
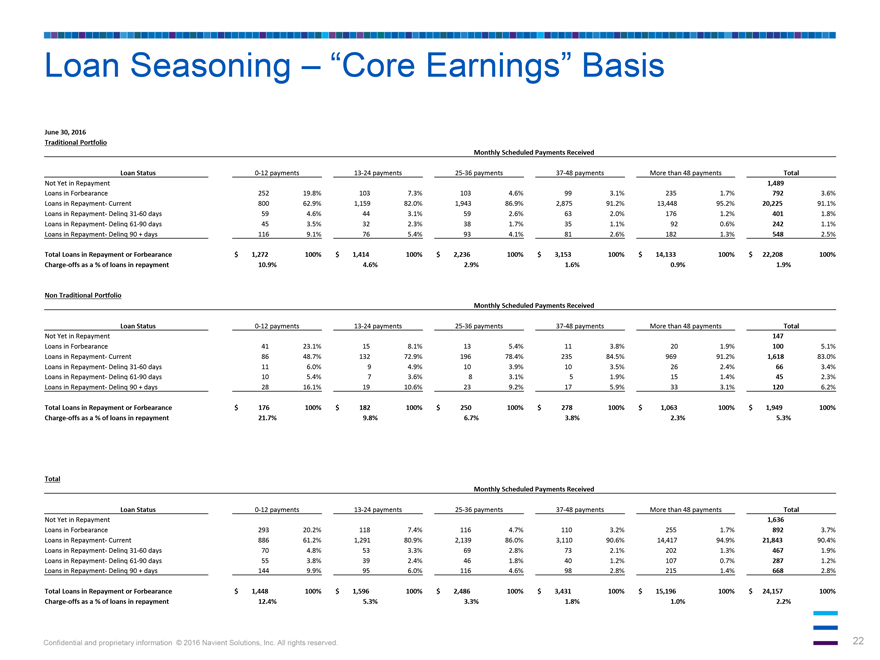
Loan Seasoning - “Core Earnings” Basis
June 30, 2016
Traditional Portfolio
Monthly Scheduled Payments Received
Loan Status
0-12 payments
13-24 payments
25-36 payments
37-48 payments
More than 48 payments
Total
Not Yet in Repayment
1,489
Loans in Forbearance 252 19.8% 103 7.3% 103 4.6% 99 3.1% 235 1.7% 792 3.6%
Loans in Repayment-
Current 800 62.9% 1,159 82.0% 1,943 86.9% 2,875 91.2% 13,448 95.2% 20,225 91.1%
Loans in Repayment- Delinq 31-60 days 59 4.6% 44 3.1% 59 2.6% 63 2.0% 176 1.2% 401
1.8%
Loans in Repayment- Delinq 61-90 days 45 3.5% 32 2.3% 38 1.7% 35 1.1% 92 0.6% 242 1.1%
Loans in Repayment- Delinq 90 + days 116 9.1% 76 5.4% 93 4.1% 81 2.6% 182 1.3% 548 2.5%
Total
Loans in Repayment or Forbearance $1,272 100% $1,414 100% $2,236 100% $3,153 100% $14,133 100% $22,208 100%
Charge-offs as a % of loans in repayment 10.9% 4.6%
2.9% 1.6% 0.9% 1.9%
Non Traditional Portfolio
Monthly Scheduled Payments
Received
Loan Status
0-12 payments
13-24 payments
25-36 payments
37-48 payments
More than 48 payments
Total
Not Yet in Repayment 147
Loans in Forbearance 41 23.1% 15 8.1% 13 5.4% 11 3.8% 20 1.9% 100 5.1%
Loans in Repayment-
Current 86 48.7% 132 72.9% 196 78.4% 235 84.5% 969 91.2% 1,618 83.0%
Loans in Repayment- Delinq 31-60 days 11 6.0% 9 4.9% 10 3.9% 10 3.5% 26 2.4% 66 3.4%
Loans in Repayment- Delinq 61-90 days 10 5.4% 7 3.6% 8 3.1% 5 1.9% 15 1.4% 45 2.3%
Loans in Repayment- Delinq 90 + days 28 16.1% 19 10.6% 23 9.2% 17 5.9% 33 3.1% 120 6.2%
Total
Loans in Repayment or Forbearance $176 100% $182 100% $250 100% $278 100% $1,063 100% $1,949 100%
Charge-offs as a % of loans in repayment 21.7% 9.8% 6.7% 3.8%
2.3% 5.3%
Total
Monthly Scheduled Payments Received
Loan Status
0-12 payments
13-24 payments
25-36 payments
37-48 payments
More than 48 payments
Total
Not Yet in Repayment 1,636
Loans in Forbearance 293 20.2% 118 7.4% 116 4.7% 110 3.2% 255 1.7% 892 3.7%
Loans in
Repayment- Current 886 61.2% 1,291 80.9% 2,139 86.0% 3,110 90.6% 14,417 94.9% 21,843 90.4%
Loans in Repayment- Delinq 31-60 days 70 4.8% 53 3.3% 69 2.8% 73 2.1%
202 1.3% 467 1.9%
Loans in Repayment- Delinq 61-90 days 55 3.8% 39 2.4% 46 1.8% 40 1.2% 107 0.7% 287 1.2%
Loans in Repayment- Delinq 90 + days 144 9.9% 95 6.0% 116 4.6% 98 2.8% 215 1.4% 668 2.8%
Total
Loans in Repayment or Forbearance $1,448 100% $1,596 100% $2,486 100% $3,431 100% $15,196 100% $24,157 100%
Charge-offs as a % of loans in repayment 12.4% 5.3%
3.3% 1.8% 1.0% 2.2%
Confidential and proprietary information © 2016 Navient Solutions, Inc. All rights reserved.
22
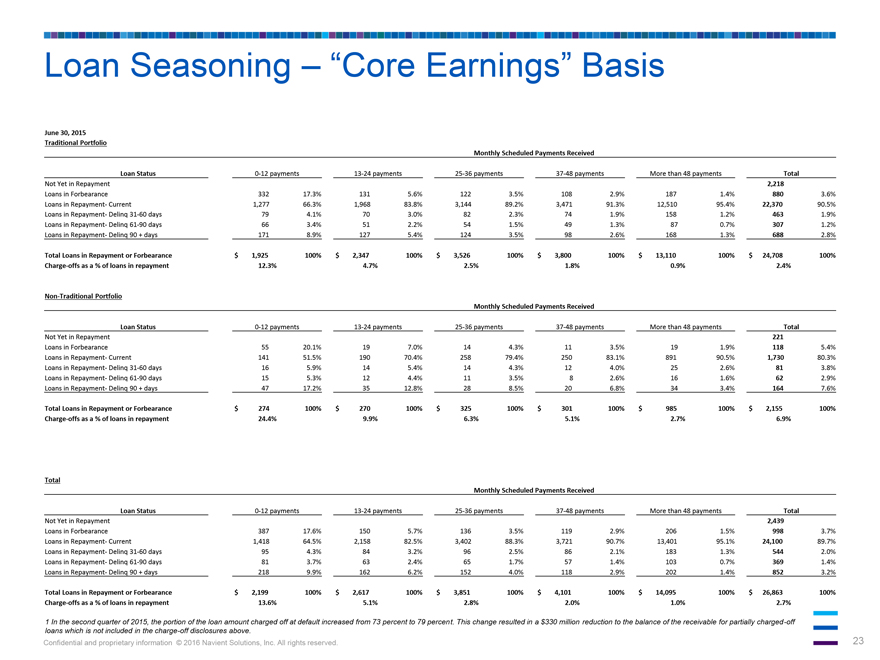
Loan Seasoning - “Core Earnings” Basis
June 30, 2015
Traditional Portfolio
Monthly Scheduled Payments Received
Loan Status 0-12 payments 13-24 payments 25-36 payments
37-48 payments More than 48 payments Total
Not Yet in Repayment 2,218
Loans
in Forbearance 332 17.3% 131 5.6% 122 3.5% 108 2.9% 187 1.4% 880 3.6%
Loans in Repayment- Current 1,277 66.3% 1,968 83.8% 3,144 89.2% 3,471 91.3% 12,510 95.4%
22,370 90.5%
Loans in Repayment- Delinq 31-60 days 79 4.1% 70 3.0% 82 2.3% 74 1.9% 158 1.2% 463 1.9%
Loans in Repayment- Delinq 61-90 days 66 3.4% 51 2.2% 54 1.5% 49 1.3% 87 0.7% 307 1.2%
Loans
in Repayment- Delinq 90 + days 171 8.9% 127 5.4% 124 3.5% 98 2.6% 168 1.3% 688 2.8%
Total Loans in Repayment or Forbearance $1,925 100% $2,347 100% $3,526 100%
$3,800 100% $13,110 100% $24,708 100%
Charge-offs as a % of loans in repayment 12.3% 4.7% 2.5% 1.8% 0.9% 2.4%
Non-Traditional Portfolio
Monthly Scheduled Payments Received
Loan Status 0-12 payments 13-24 payments 25-36 payments 37-48 payments More than 48 payments Total
Not Yet in Repayment 221
Loans in Forbearance 55 20.1% 19 7.0% 14 4.3% 11 3.5% 19 1.9% 118
5.4%
Loans in Repayment- Current 141 51.5% 190 70.4% 258 79.4% 250 83.1% 891 90.5% 1,730 80.3%
Loans in Repayment- Delinq 31-60 days 16 5.9% 14 5.4% 14 4.3% 12 4.0% 25 2.6% 81 3.8%
Loans in
Repayment- Delinq 61-90 days 15 5.3% 12 4.4% 11 3.5% 8 2.6% 16 1.6% 62 2.9%
Loans in Repayment- Delinq 90 + days 47 17.2% 35 12.8% 28 8.5% 20 6.8% 34 3.4% 164 7.6%
Total Loans in Repayment or Forbearance $274 100% $270 100% $325 100% $301 100% $985 100% $2,155 100%
Charge-offs as a % of loans in repayment 24.4% 9.9% 6.3% 5.1% 2.7% 6.9%
Total
Monthly Scheduled Payments Received
Loan Status 0-12 payments 13-24 payments 25-36 payments
37-48 payments More than 48 payments Total
Not Yet in Repayment 2,439
Loans
in Forbearance 387 17.6% 150 5.7% 136 3.5% 119 2.9% 206 1.5% 998 3.7%
Loans in Repayment- Current 1,418 64.5% 2,158 82.5% 3,402 88.3% 3,721 90.7% 13,401 95.1%
24,100 89.7%
Loans in Repayment- Delinq 31-60 days 95 4.3% 84 3.2% 96 2.5% 86 2.1% 183 1.3% 544 2.0%
Loans in Repayment- Delinq 61-90 days 81 3.7% 63 2.4% 65 1.7% 57 1.4% 103 0.7% 369 1.4%
Loans
in Repayment- Delinq 90 + days 218 9.9% 162 6.2% 152 4.0% 118 2.9% 202 1.4% 852 3.2%
Total Loans in Repayment or Forbearance $2,199 100% $2,617 100% $3,851 100%
$4,101 100% $14,095 100% $26,863 100%
Charge-offs as a % of loans in repayment 13.6% 5.1% 2.8% 2.0% 1.0% 2.7%
1 In the second quarter of 2015, the portion of the loan amount charged off at default increased from 73 percent to 79 percent. This change resulted in a $330 million reduction to
the balance of the receivable for partially charged-off loans which is not included in the charge-off disclosures above.
Confidential and proprietary information
© 2016 Navient Solutions, Inc. All rights reserved.
23