Attached files
| file | filename |
|---|---|
| 8-K - 8-K - Paramount Gold Nevada Corp. | pzg-8k_20160912.htm |
Industry-leading US-Based Gold Ownership Per Share NYSE MKT: PZG September 2016 Exhibit 99.1
This Presentation contains “forward-looking statements” within the meaning of applicable securities laws relating to Paramount Gold Nevada Corp. (“Paramount”, “we”, “us”, “our”, or the “Company”) which represent our current expectations or beliefs including, but not limited to, statements concerning our operations, performance, and financial condition. These statements by their nature involve substantial risks and uncertainties, credit losses, dependence on management and key personnel, variability of quarterly results, and our ability to continue growth. Statements in this presentation regarding planned drilling activities and any other statements about Paramount’s future expectations, beliefs, goals, plans or prospects constitute forward-looking statements. For this purpose, any statements contained in this presentation that are not statements of historical fact are forward-looking statements. Without limiting the generality of the foregoing, words such as “may”, “anticipate”, “intend”, “could”, “estimate”, or “continue” or the negative or other comparable terminology are intended to identify forward-looking statements. Other matters such as our growth strategy and competition are beyond our control. Should one or more of these risks or uncertainties materialize or should the underlying assumptions prove incorrect, actual outcomes and results could differ materially from those indicated in the forward-looking statements. Any forward-looking statement speaks only as of the date on which such statement is made, and we undertake no obligation to update any forward-looking statement or statements to reflect events or circumstances after the date on which such statement is made or to reflect the occurrence of unanticipated events. New factors emerge from time to time and it is not possible for us to predict all of such factors, nor can we assess the impact of each such factor on the business or the extent to which any factor, or combination of factors, may cause actual results to differ materially from those contained in any forward-looking statements. Cautionary Note to U.S. Investors - All mineral resources have been estimated in accordance with the definition standards on mineral resources and mineral reserves of the Canadian Institute of Mining, Metallurgy and Petroleum referred to in National Instrument 43-101. U.S. reporting requirements for disclosure of mineral properties are governed by the Securities and Exchange Commission (“SEC”) Industry Guide 7. Canadian and Guide 7 standards are substantially different. The SEC permits mining companies, in their filings, to disclose only those mineral deposits that a company can economically and legally extract or produce. We use certain terms in this document, such as "reserves," "resources," "geologic resources," "proven," "probable," "measured," "indicated," and "inferred," which are not recognized under Industry Guide 7. U.S. Investors should be aware that the issuer has no "reserves" as defined by Industry Guide 7 and are cautioned not to assume that any part or all of mineral resources will be confirmed or converted into Industry Guide 7 compliant "reserves". Disclosure of "contained ounces" in a resource is permitted disclosure under Canadian regulations; however, the SEC normally only permits issuers to report mineralization that does not constitute Industry Guide 7 "reserves" by SEC standards as in-place tonnage and grade without reference to unit measures. Mineral resources that are not mineral reserves do not have demonstrated economic viability. FORWARD LOOKING STATEMENTS paramountnevada.com | @ParamountNV
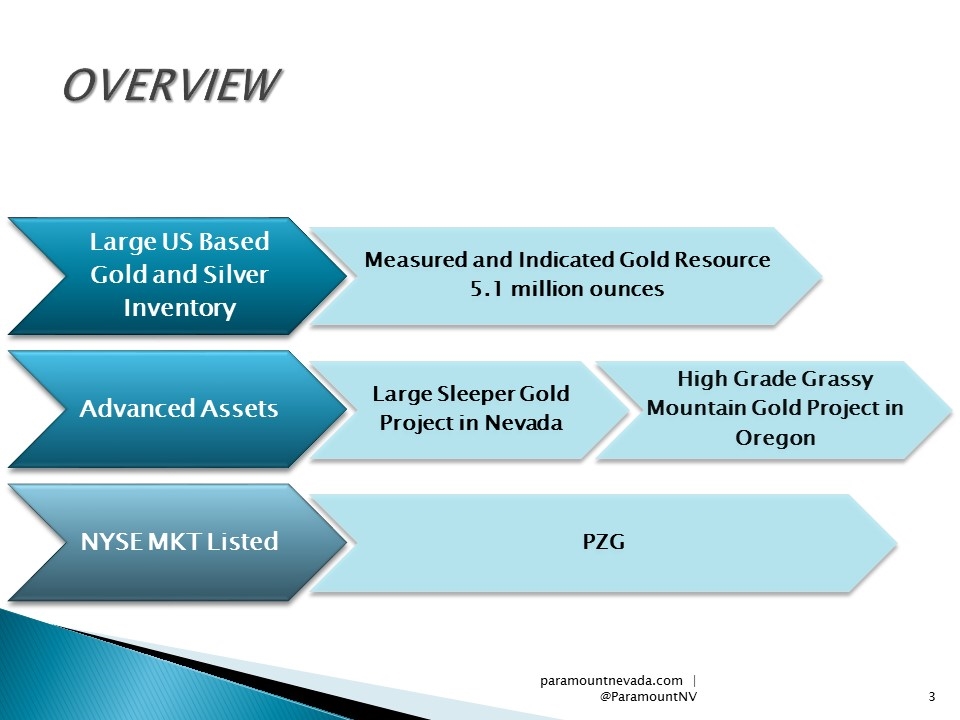
OVERVIEW paramountnevada.com | @ParamountNV Large US Based Gold and Silver Inventory Measured and Indicated Gold Resource 5.1 million ounces Advanced Assets Large Sleeper Gold Project in Nevada High Grade Grassy Mountain Gold Project in Oregon NYSE MKT Listed PZG
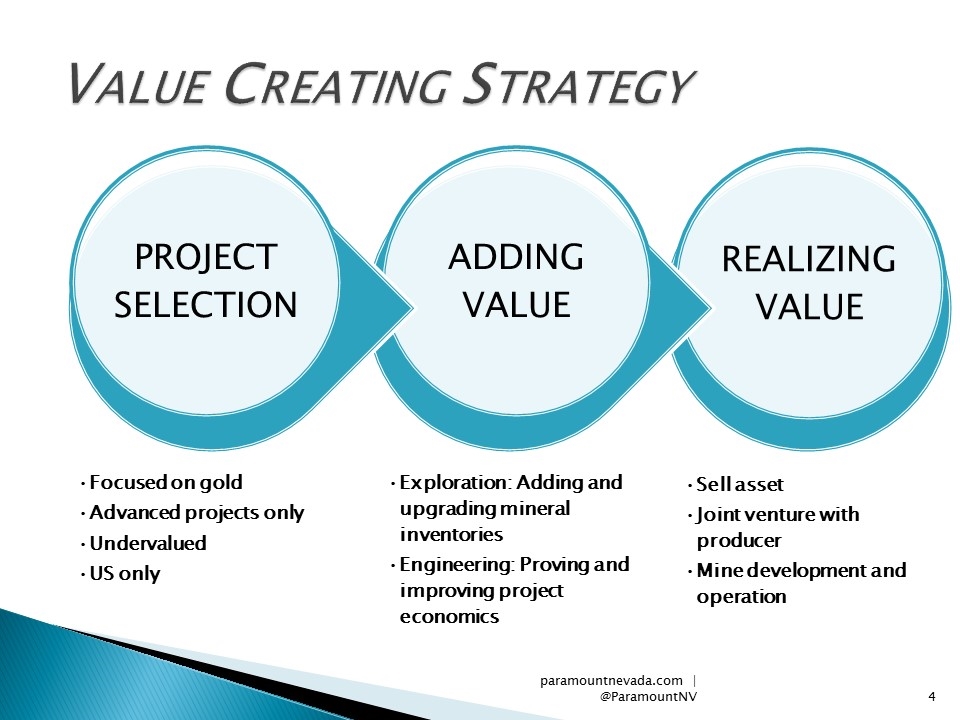
Value Creating Strategy paramountnevada.com | @ParamountNV PROJECT SELECTION Focused on gold Exploration: Adding and upgrading mineral inventories Engineering: Proving and improving project economics REALIZING VALUE Sell asset Advanced projects only US only ADDING VALUE Joint venture with producer Mine development and operation Undervalued
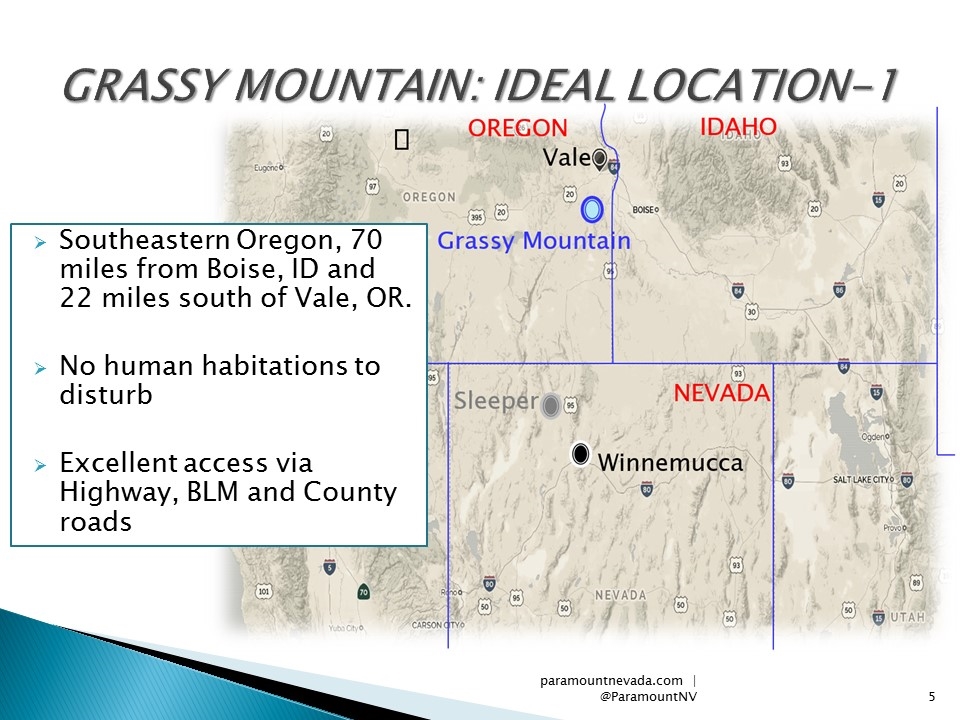
GRASSY MOUNTAIN: IDEAL LOCATION-1 Southeastern Oregon, 70 miles from Boise, ID and 22 miles south of Vale, OR. No human habitations to disturb Excellent access via Highway, BLM and County roads paramountnevada.com | @ParamountNV
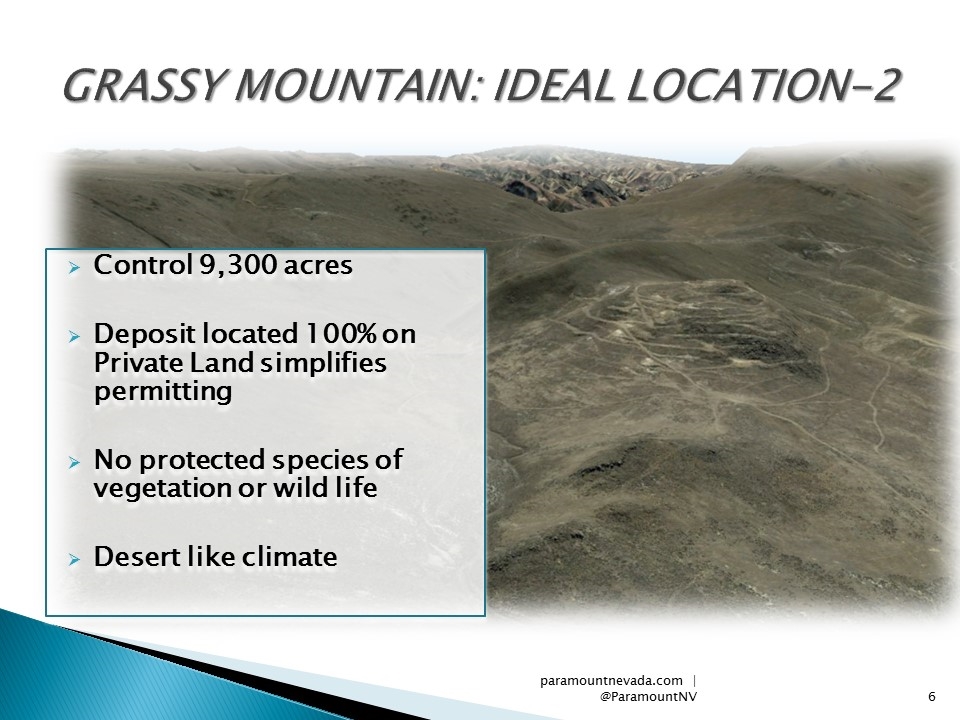
GRASSY MOUNTAIN: IDEAL LOCATION-2 Control 9,300 acres Deposit located 100% on Private Land simplifies permitting No protected species of vegetation or wild life Desert like climate paramountnevada.com | @ParamountNV
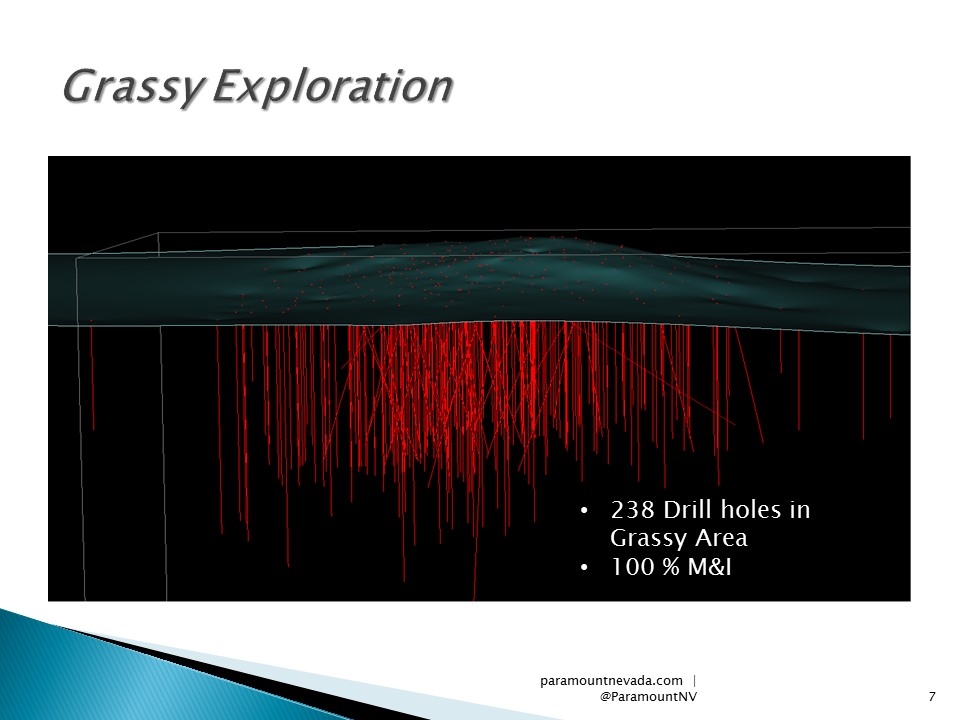
paramountnevada.com | @ParamountNV Grassy Exploration 238 Drill holes in Grassy Area 100 % M&I
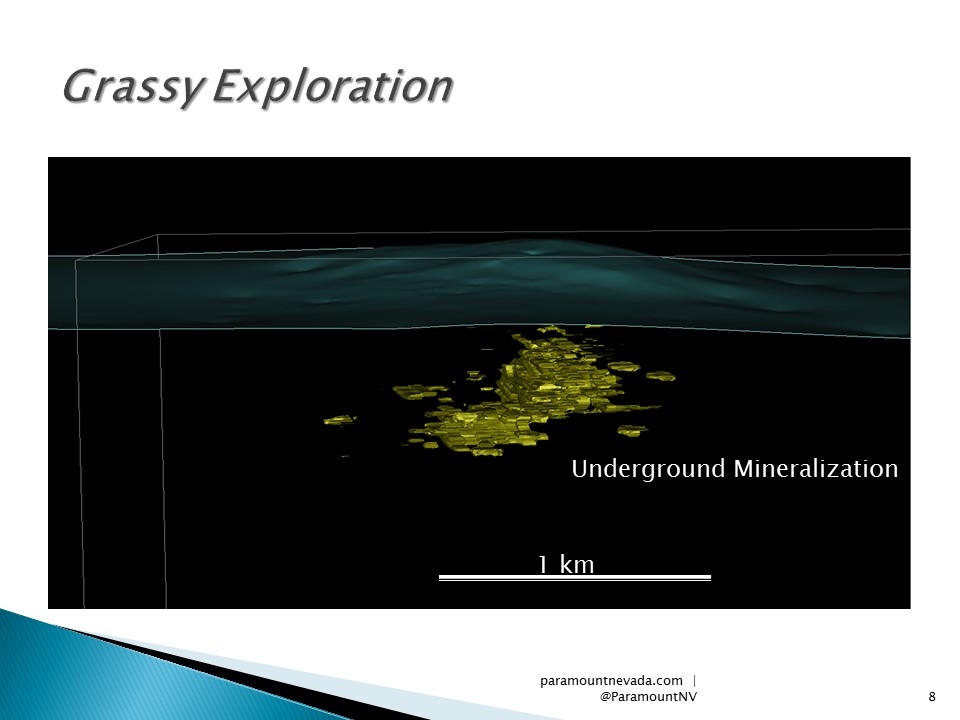
paramountnevada.com | @ParamountNV Grassy Exploration Underground Mineralization 1 km
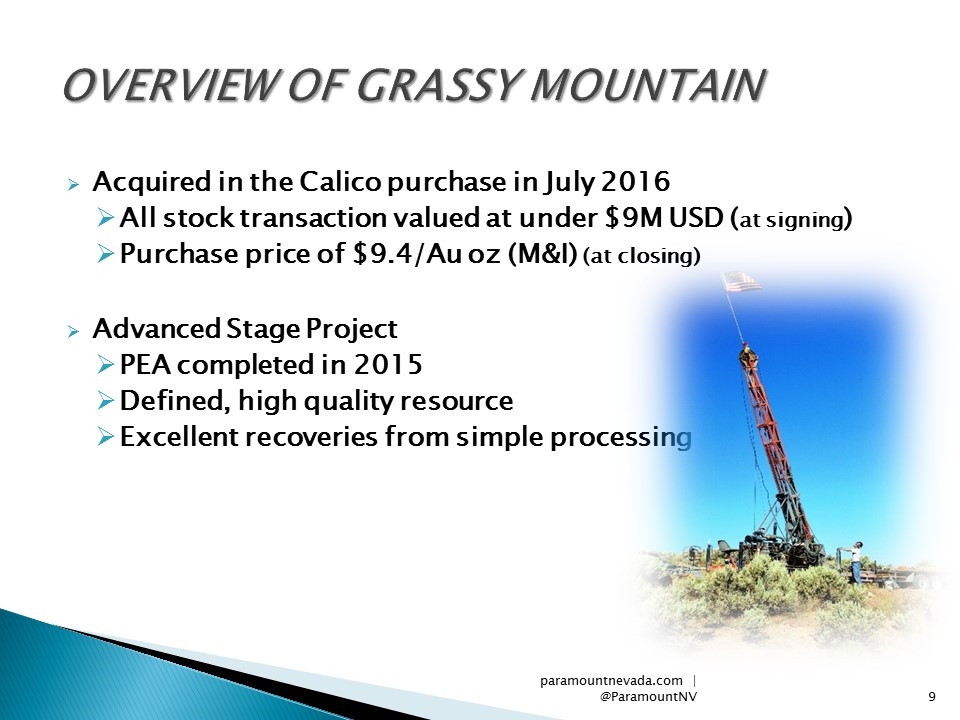
Acquired in the Calico purchase in July 2016 All stock transaction valued at under $9M USD (at signing) Purchase price of $9.4/Au oz (M&I) (at closing) Advanced Stage Project PEA completed in 2015 Defined, high quality resource Excellent recoveries from simple processing paramountnevada.com | @ParamountNV OVERVIEW OF GRASSY MOUNTAIN
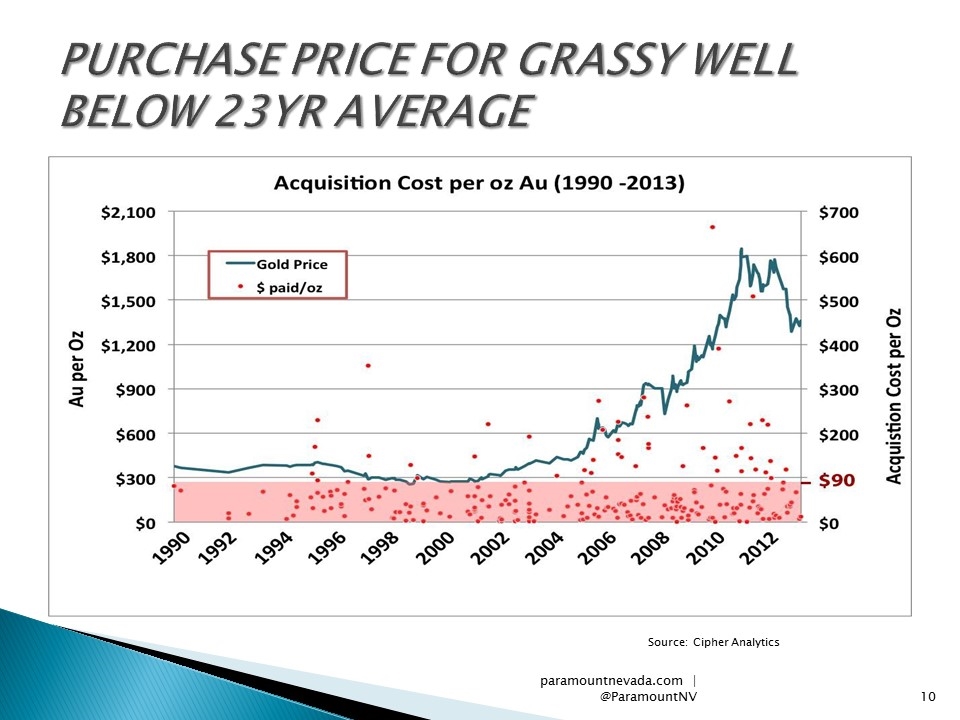
paramountnevada.com | @ParamountNV PURCHASE PRICE FOR GRASSY WELL BELOW 23YR AVERAGE Source: Cipher Analytics
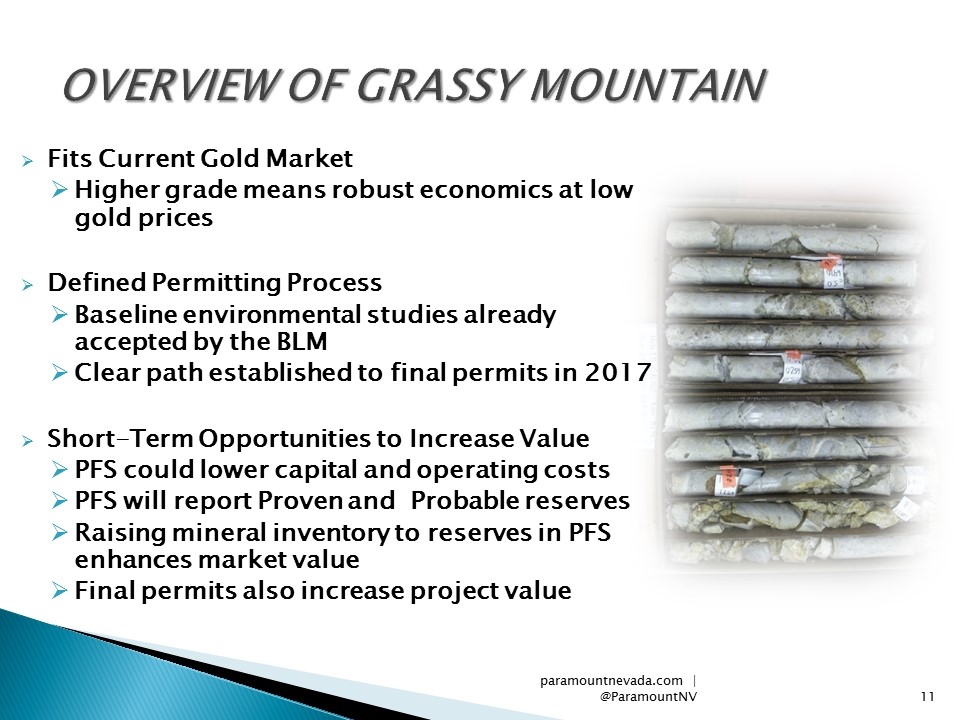
Fits Current Gold Market Higher grade means robust economics at low gold prices Defined Permitting Process Baseline environmental studies already accepted by the BLM Clear path established to final permits in 2017 Short-Term Opportunities to Increase Value PFS could lower capital and operating costs PFS will report Proven and Probable reserves Raising mineral inventory to reserves in PFS enhances market value Final permits also increase project value paramountnevada.com | @ParamountNV OVERVIEW OF GRASSY MOUNTAIN
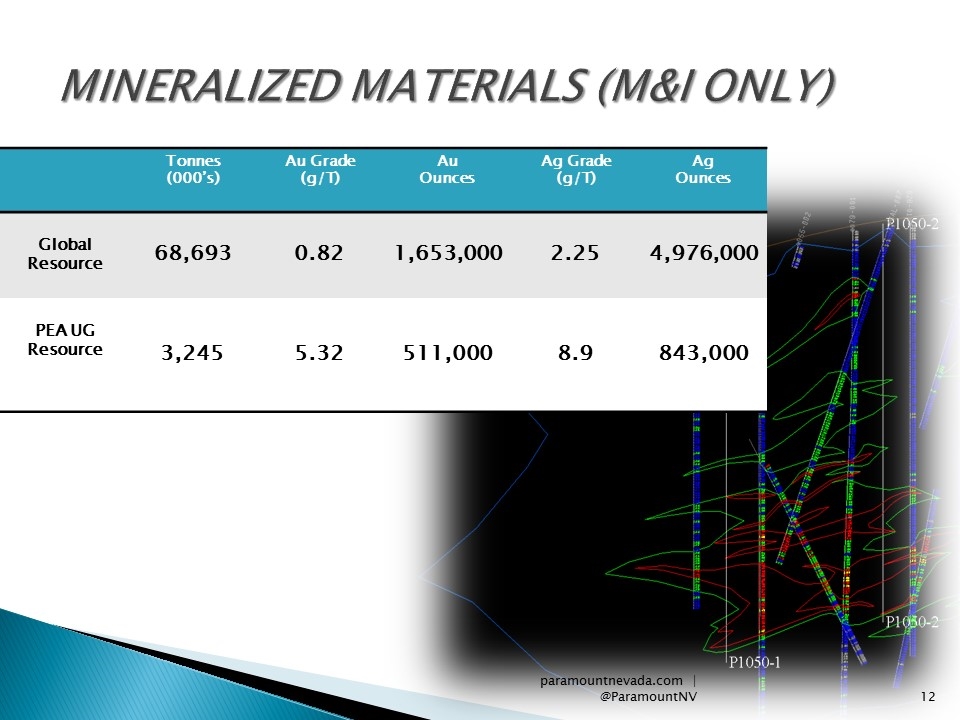
MINERALIZED MATERIALS (M&I ONLY) Tonnes (000’s) Au Grade (g/T) Au Ounces Ag Grade (g/T) Ag Ounces Global Resource 68,693 0.82 1,653,000 2.25 4,976,000 PEA UG Resource 3,245 5.32 511,000 8.9 843,000 paramountnevada.com | @ParamountNV
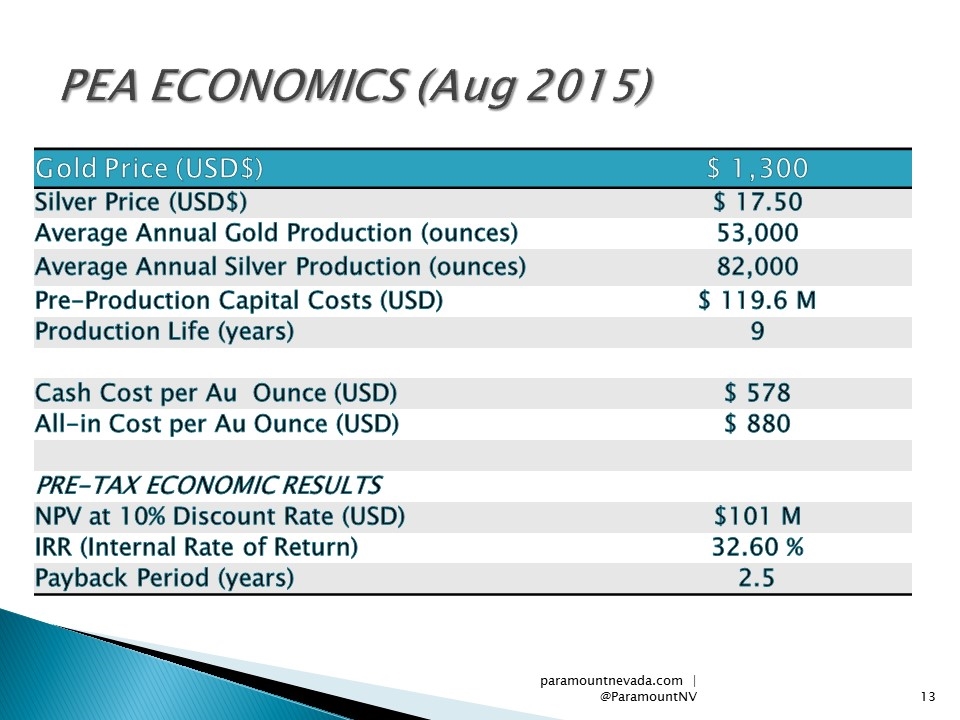
Gold Price (USD$) $ 1,300 Silver Price (USD$) $ 17.50 Average Annual Gold Production (ounces) 53,000 Average Annual Silver Production (ounces) 82,000 Pre-Production Capital Costs (USD) $ 119.6 M Production Life (years) 9 Cash Cost per Au Ounce (USD) $ 578 All-in Cost per Au Ounce (USD) $ 880 PRE-TAX ECONOMIC RESULTS NPV at 10% Discount Rate (USD) $101 M IRR (Internal Rate of Return) 32.60 % Payback Period (years) 2.5 PEA ECONOMICS (Aug 2015) paramountnevada.com | @ParamountNV
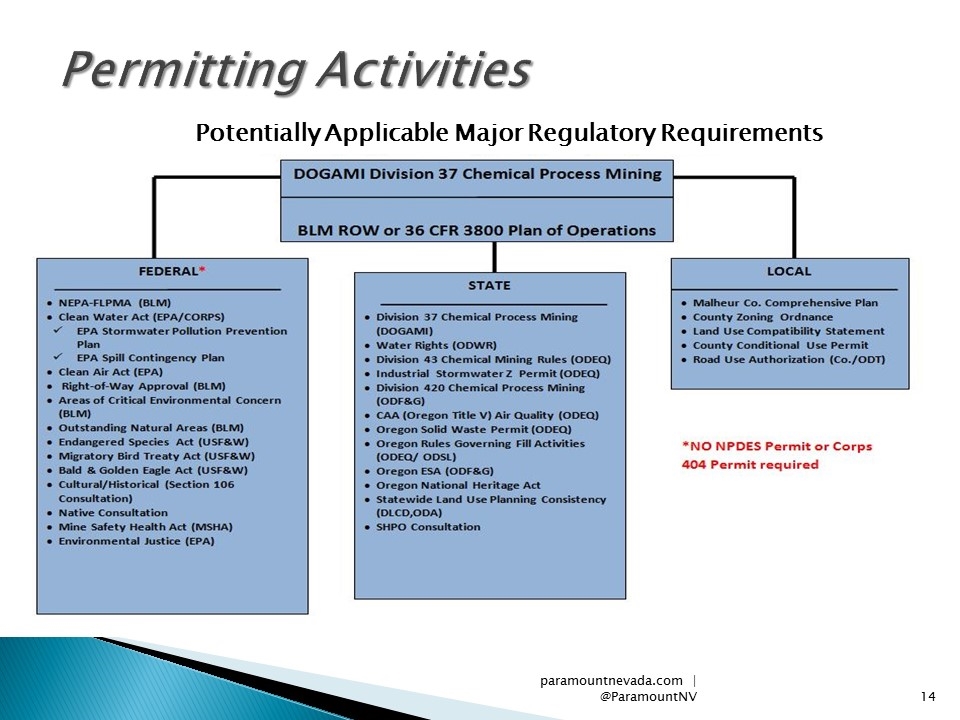
paramountnevada.com | @ParamountNV Permitting Activities Potentially Applicable Major Regulatory Requirements
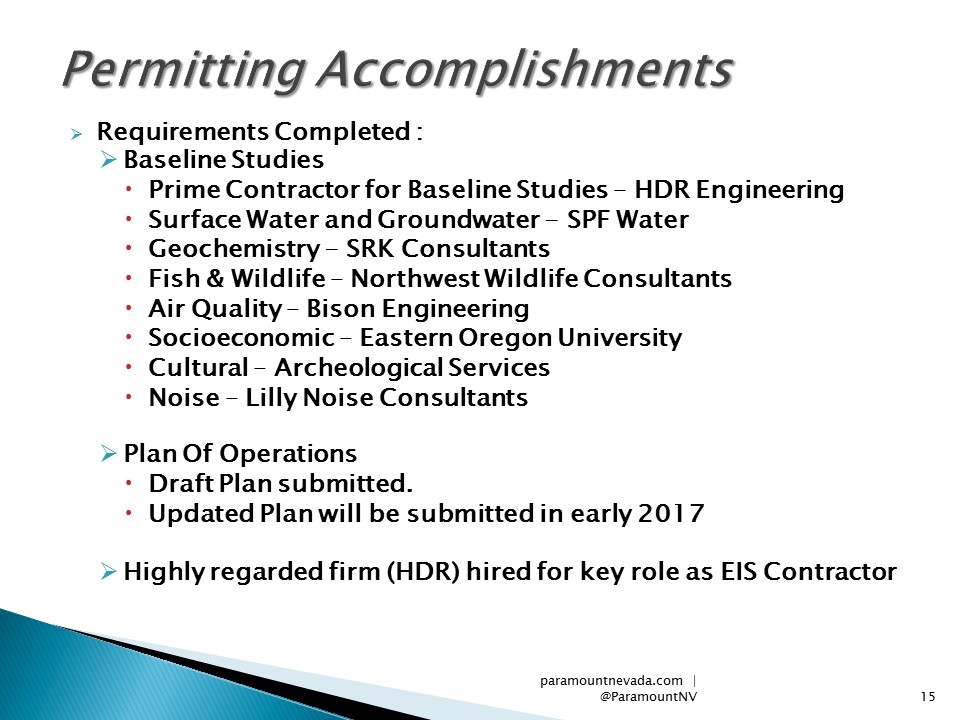
paramountnevada.com | @ParamountNV Permitting Accomplishments Requirements Completed : Baseline Studies Prime Contractor for Baseline Studies – HDR Engineering Surface Water and Groundwater - SPF Water Geochemistry - SRK Consultants Fish & Wildlife – Northwest Wildlife Consultants Air Quality – Bison Engineering Socioeconomic – Eastern Oregon University Cultural – Archeological Services Noise – Lilly Noise Consultants Plan Of Operations Draft Plan submitted. Updated Plan will be submitted in early 2017 Highly regarded firm (HDR) hired for key role as EIS Contractor
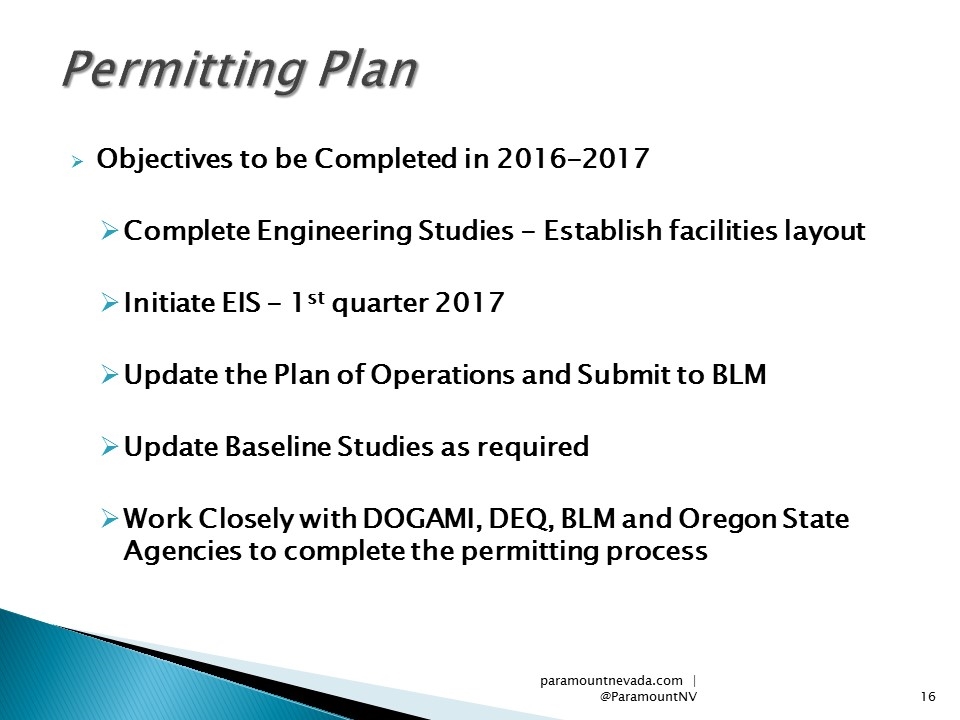
paramountnevada.com | @ParamountNV Permitting Plan Objectives to be Completed in 2016-2017 Complete Engineering Studies - Establish facilities layout Initiate EIS - 1st quarter 2017 Update the Plan of Operations and Submit to BLM Update Baseline Studies as required Work Closely with DOGAMI, DEQ, BLM and Oregon State Agencies to complete the permitting process
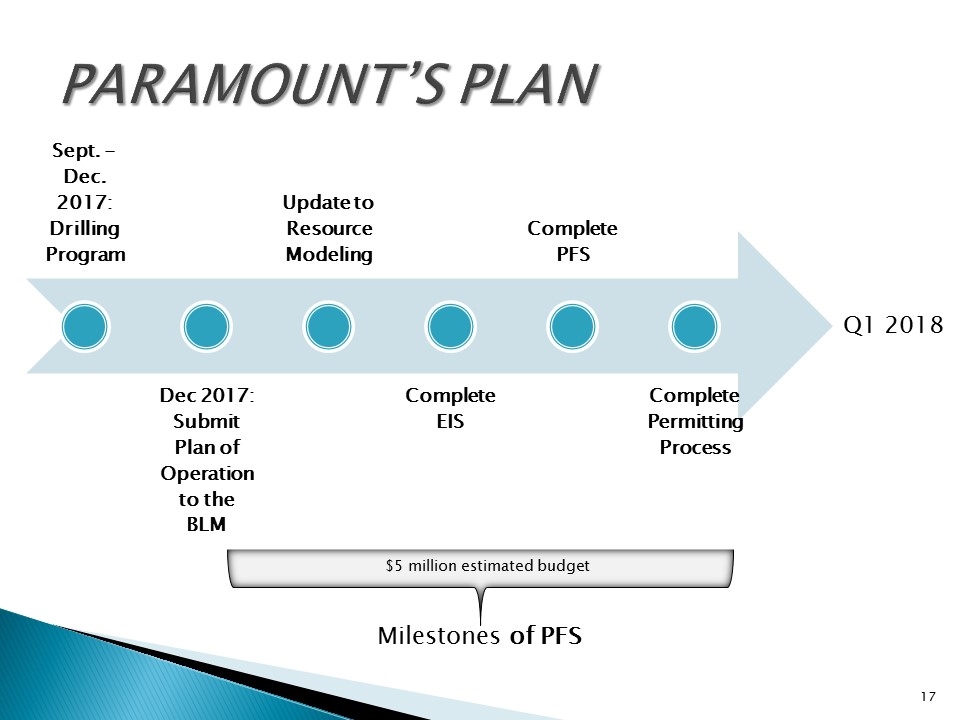
PARAMOUNT’S PLAN Q1 2018 Milestones of PFS $5 million estimated budget Sept. - Dec. 2017: Drilling Program Update to Resource Modeling Complete EIS Complete Permitting Process Dec 2017: Submit Plan of Operation to the BLM Complete PFS
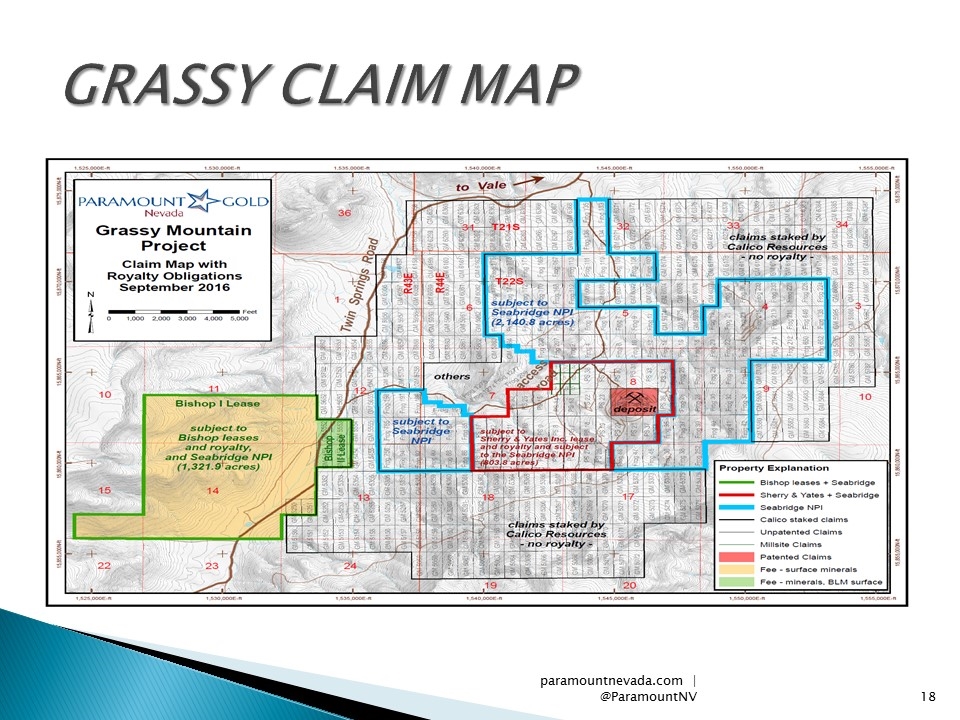
paramountnevada.com | @ParamountNV GRASSY CLAIM MAP
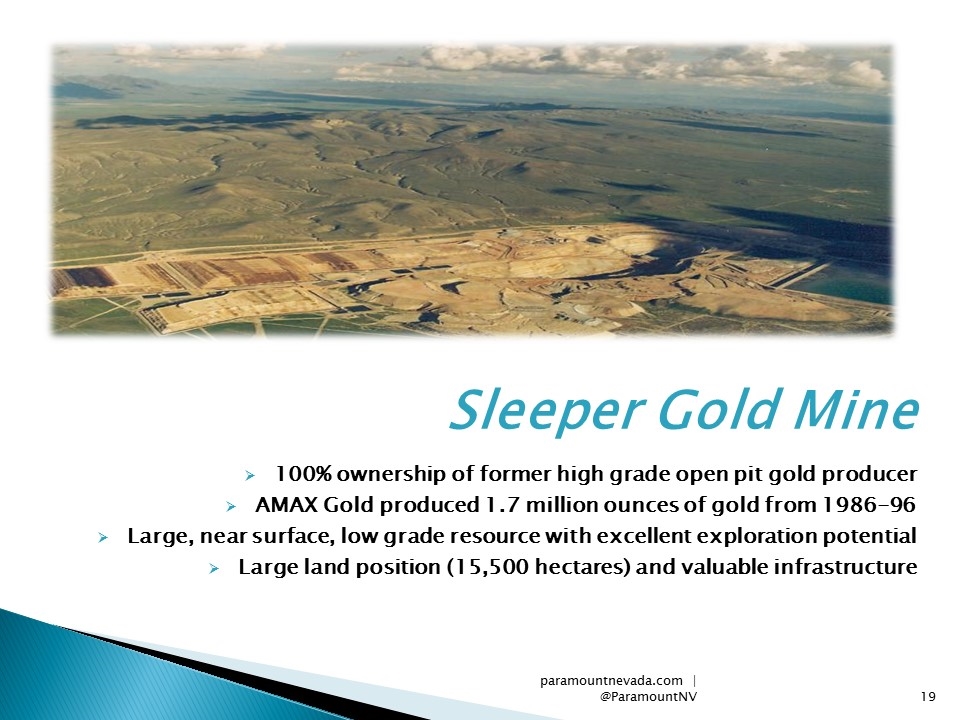
Sleeper Gold Mine 100% ownership of former high grade open pit gold producer AMAX Gold produced 1.7 million ounces of gold from 1986-96 Large, near surface, low grade resource with excellent exploration potential Large land position (15,500 hectares) and valuable infrastructure paramountnevada.com | @ParamountNV
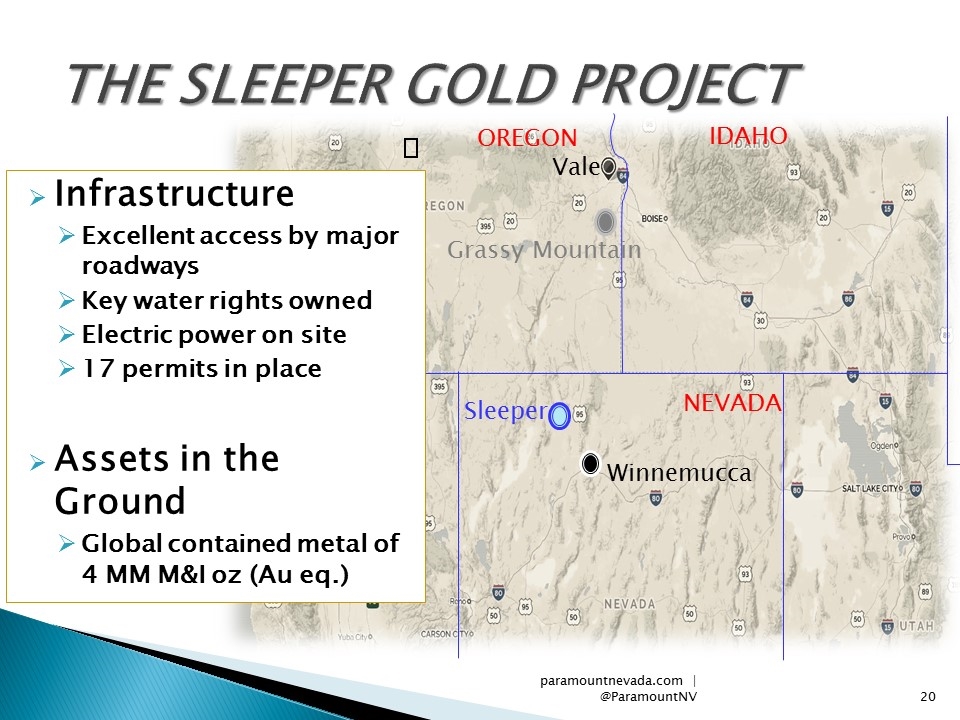
THE SLEEPER GOLD PROJECT Grassy Mountain IDAHO OREGON Vale Winnemucca NEVADA Sleeper Infrastructure Excellent access by major roadways Key water rights owned Electric power on site 17 permits in place Assets in the Ground Global contained metal of 4 MM M&I oz (Au eq.) paramountnevada.com | @ParamountNV
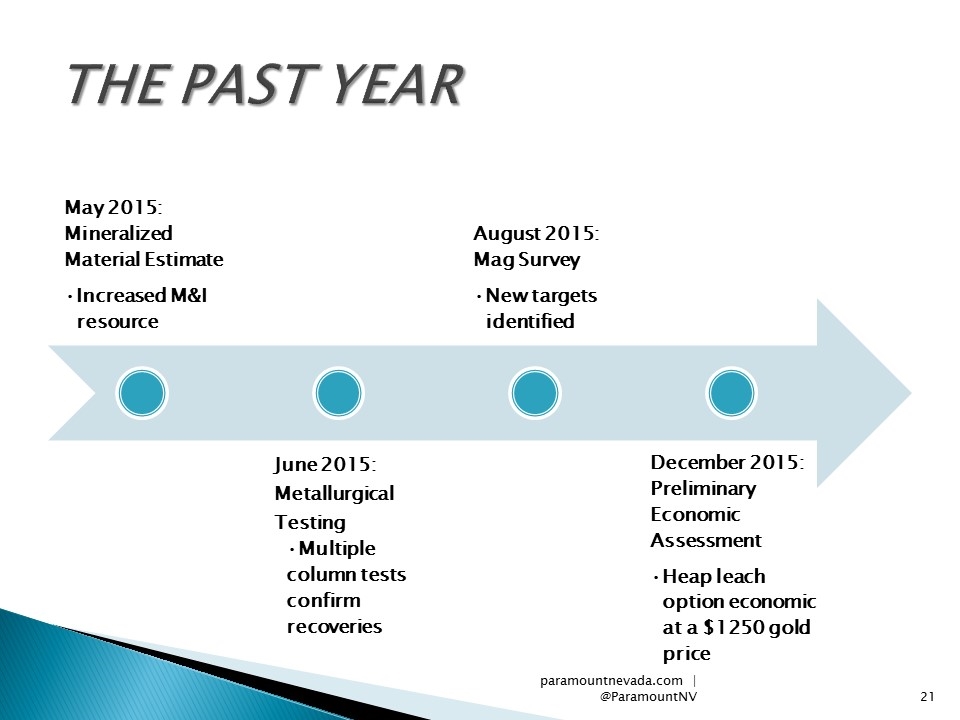
paramountnevada.com | @ParamountNV THE PAST YEAR May 2015: Mineralized Material Estimate August 2015: Mag Survey December 2015: Preliminary Economic Assessment June 2015: Metallurgical Testing New targets identified Multiple column tests confirm recoveries Increased M&I resource Heap leach option economic at a $1250 gold price
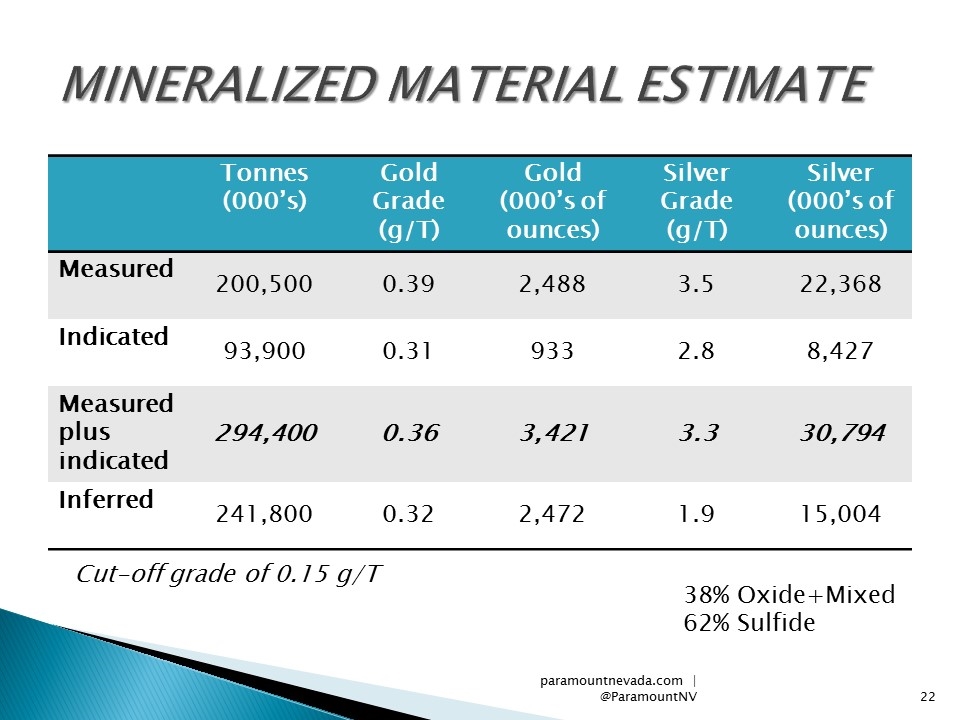
Tonnes (000’s) Gold Grade (g/T) Gold (000’s of ounces) Silver Grade (g/T) Silver (000’s of ounces) Measured 200,500 0.39 2,488 3.5 22,368 Indicated 93,900 0.31 933 2.8 8,427 Measured plus indicated 294,400 0.36 3,421 3.3 30,794 Inferred 241,800 0.32 2,472 1.9 15,004 paramountnevada.com | @ParamountNV Mineralized Material Estimate Cut-off grade of 0.15 g/T 38% Oxide+Mixed 62% Sulfide
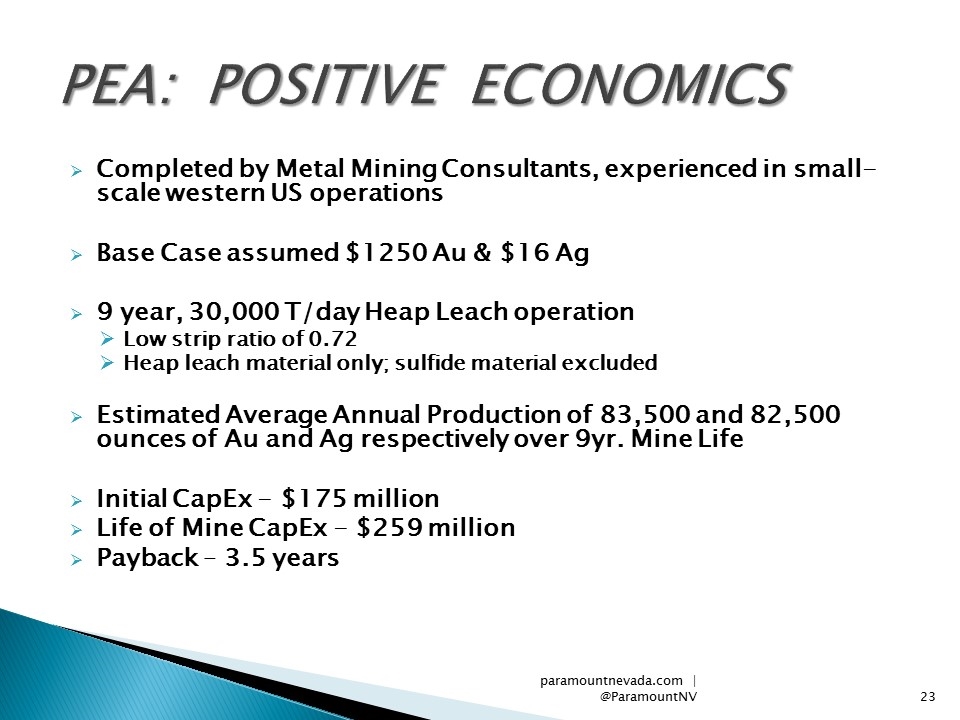
Completed by Metal Mining Consultants, experienced in small-scale western US operations Base Case assumed $1250 Au & $16 Ag 9 year, 30,000 T/day Heap Leach operation Low strip ratio of 0.72 Heap leach material only; sulfide material excluded Estimated Average Annual Production of 83,500 and 82,500 ounces of Au and Ag respectively over 9yr. Mine Life Initial CapEx - $175 million Life of Mine CapEx - $259 million Payback – 3.5 years PEA: POSITIVE ECONOMICS paramountnevada.com | @ParamountNV
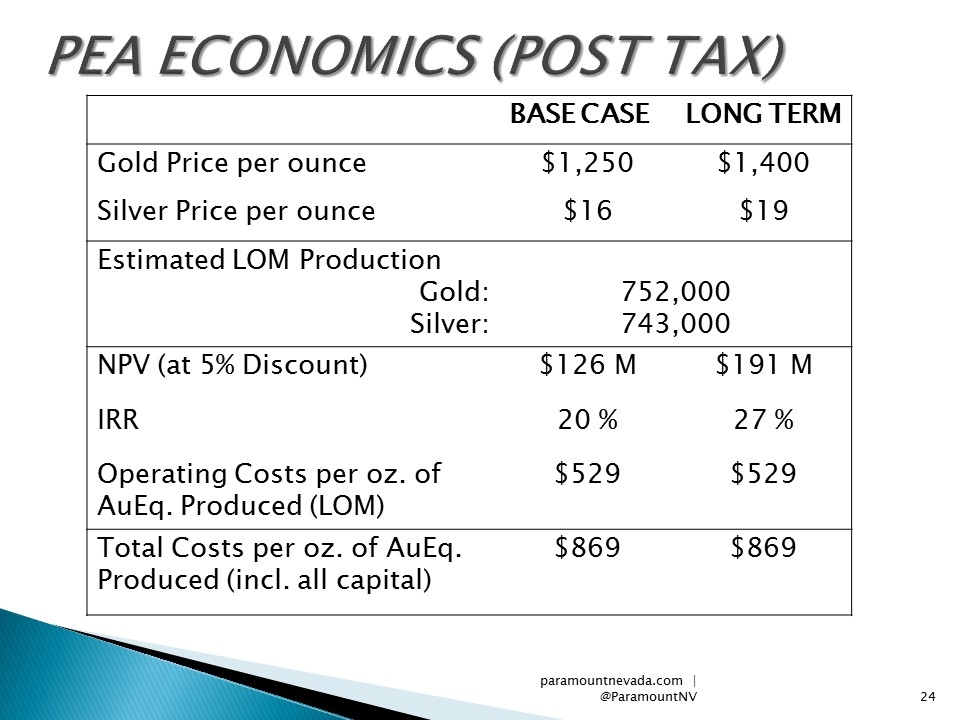
BASE CASE LONG TERM Gold Price per ounce $1,250 $1,400 Silver Price per ounce $16 $19 Estimated LOM Production Gold: Silver: 752,000 743,000 NPV (at 5% Discount) $126 M $191 M IRR 20 % 27 % Operating Costs per oz. of AuEq. Produced (LOM) $529 $529 Total Costs per oz. of AuEq. Produced (incl. all capital) $869 $869 paramountnevada.com | @ParamountNV PEA Economics (Post Tax)
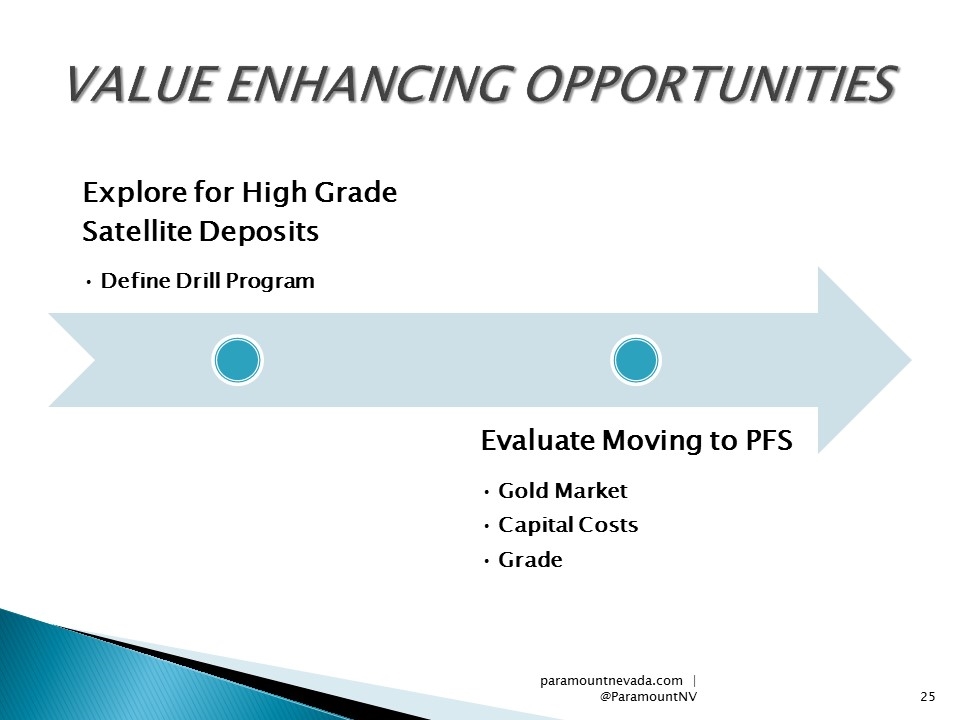
paramountnevada.com | @ParamountNV VALUE ENHANCING OPPORTUNITIES Explore for High Grade Satellite Deposits Evaluate Moving to PFS Define Drill Program Gold Market Capital Costs Grade
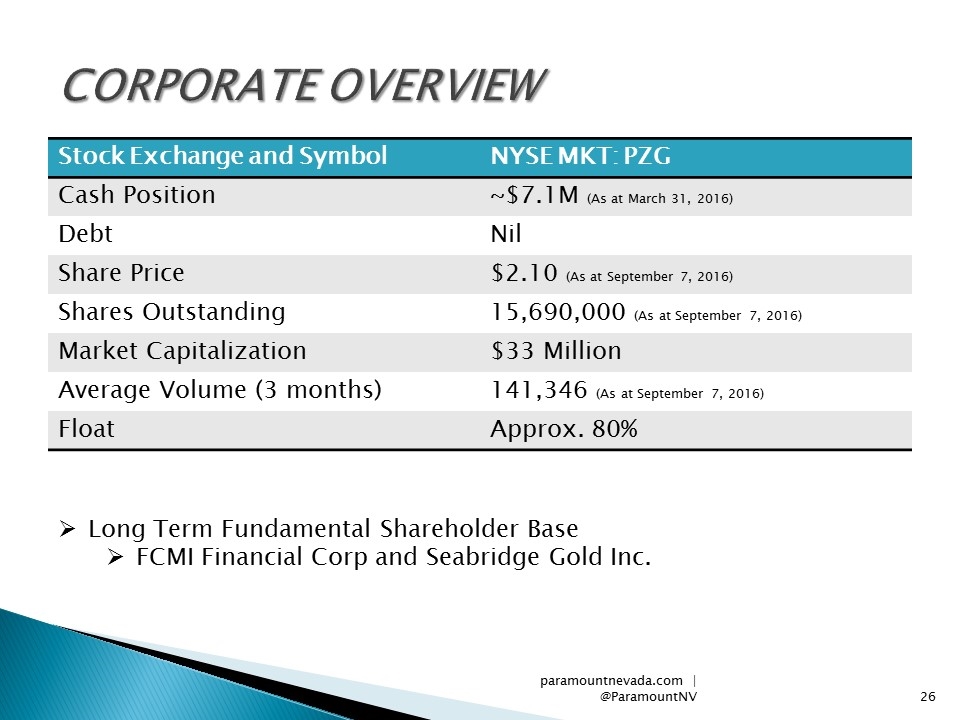
Stock Exchange and Symbol NYSE MKT: PZG Cash Position ~$7.1M (As at March 31, 2016) Debt Nil Share Price $2.10 (As at September 7, 2016) Shares Outstanding 15,690,000 (As at September 7, 2016) Market Capitalization $33 Million Average Volume (3 months) 141,346 (As at September 7, 2016) Float Approx. 80% paramountnevada.com | @ParamountNV CORPORATE OVERVIEW Long Term Fundamental Shareholder Base FCMI Financial Corp and Seabridge Gold Inc.
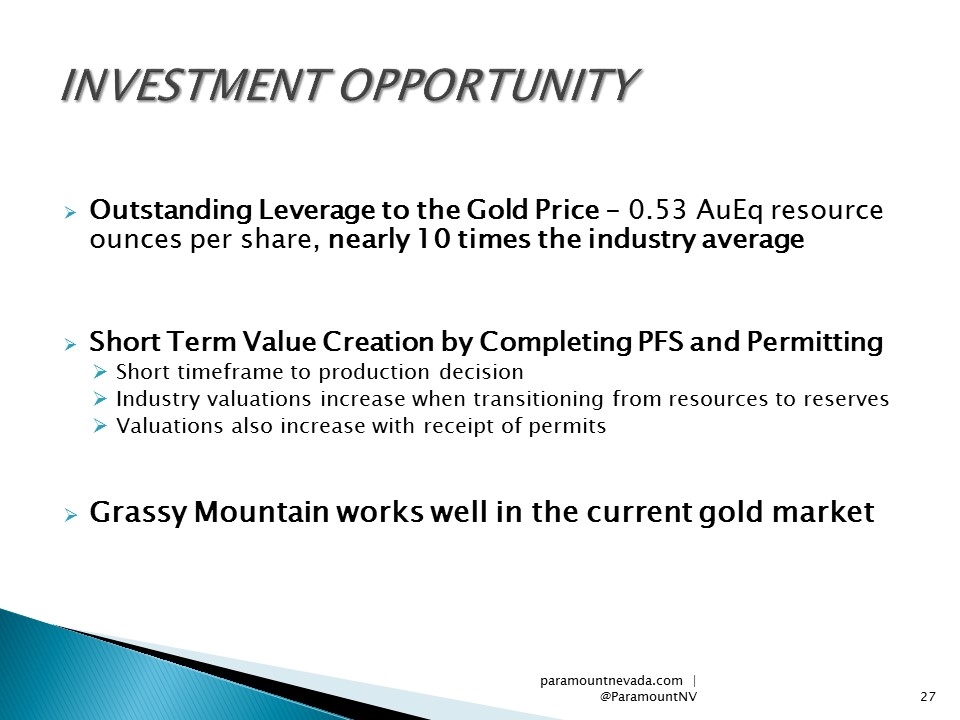
paramountnevada.com | @ParamountNV INVESTMENT OPPORTUNITY Outstanding Leverage to the Gold Price - 0.53 AuEq resource ounces per share, nearly 10 times the industry average Short Term Value Creation by Completing PFS and Permitting Short timeframe to production decision Industry valuations increase when transitioning from resources to reserves Valuations also increase with receipt of permits Grassy Mountain works well in the current gold market
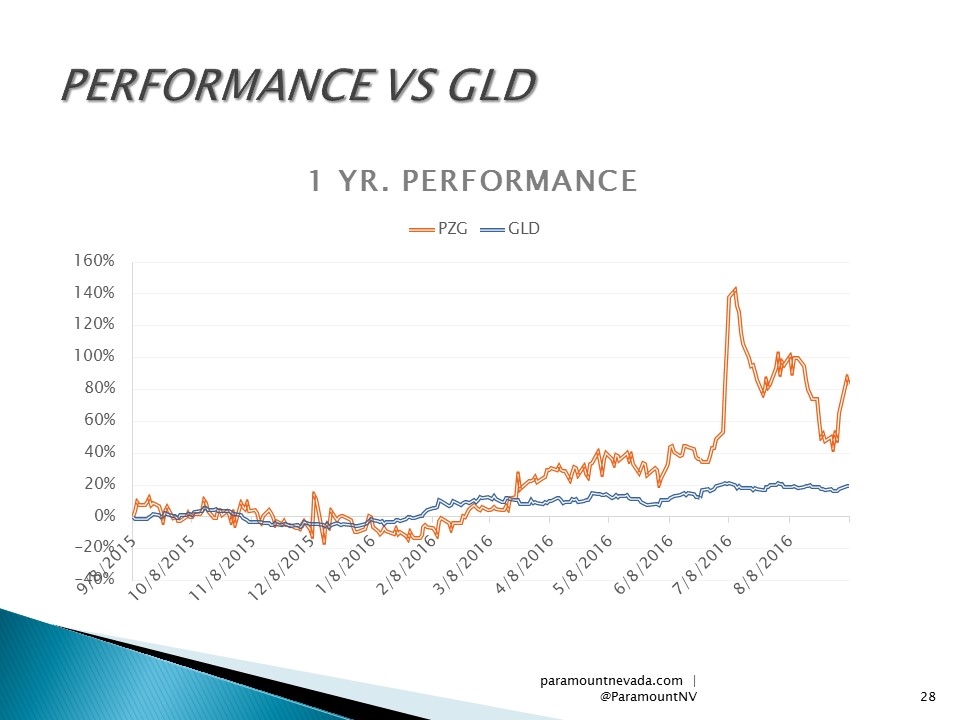
paramountnevada.com | @ParamountNV PERFORMANCE VS GLD
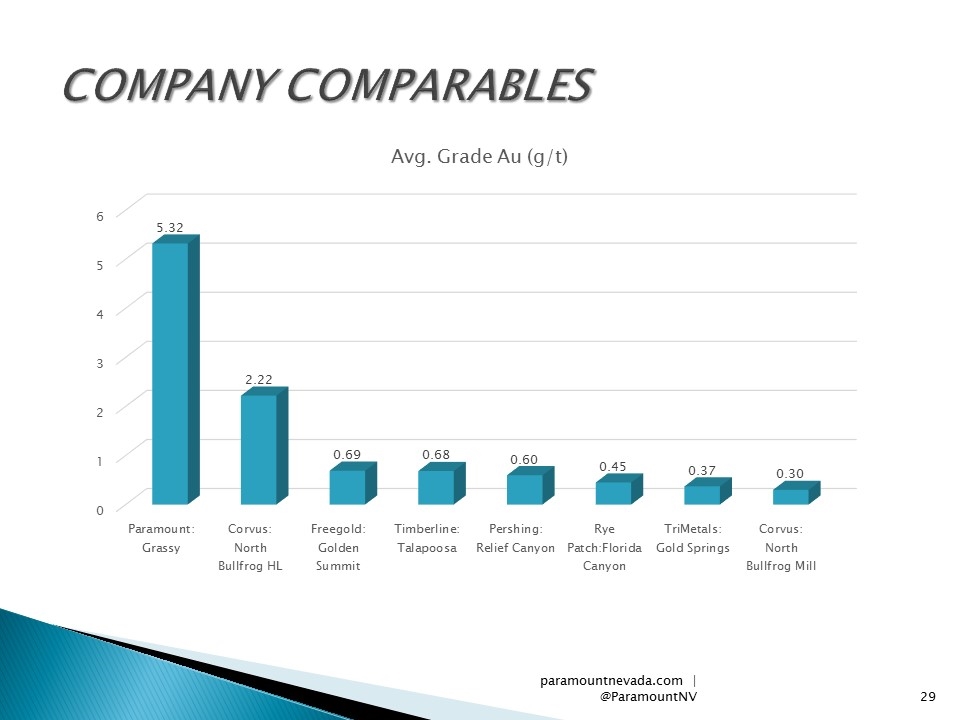
paramountnevada.com | @ParamountNV COMPANY COMPARABLES
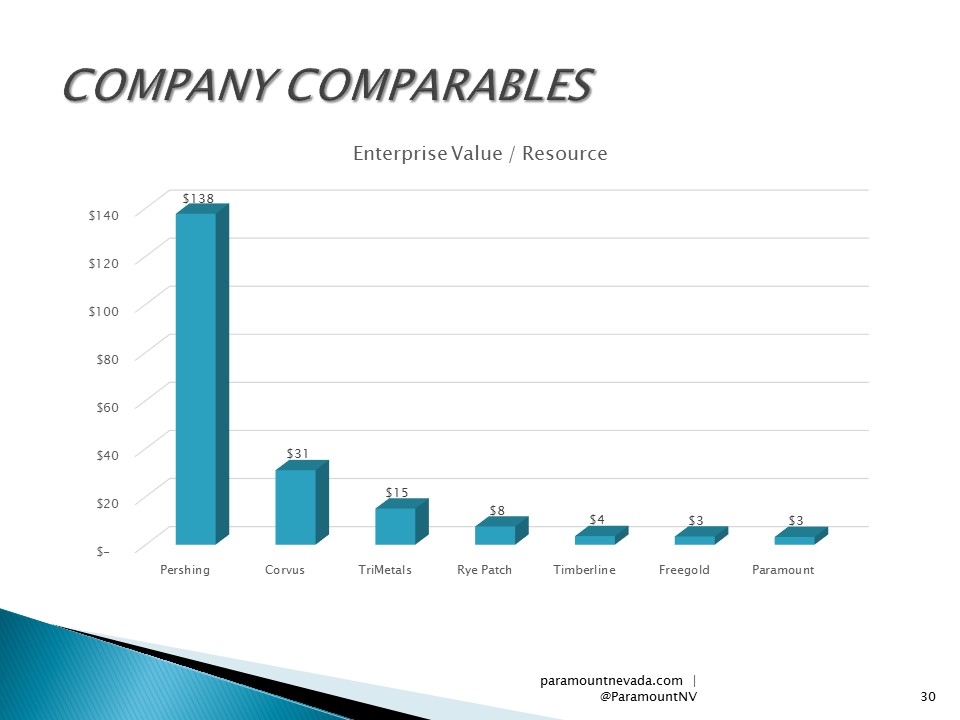
paramountnevada.com | @ParamountNV COMPANY COMPARABLES
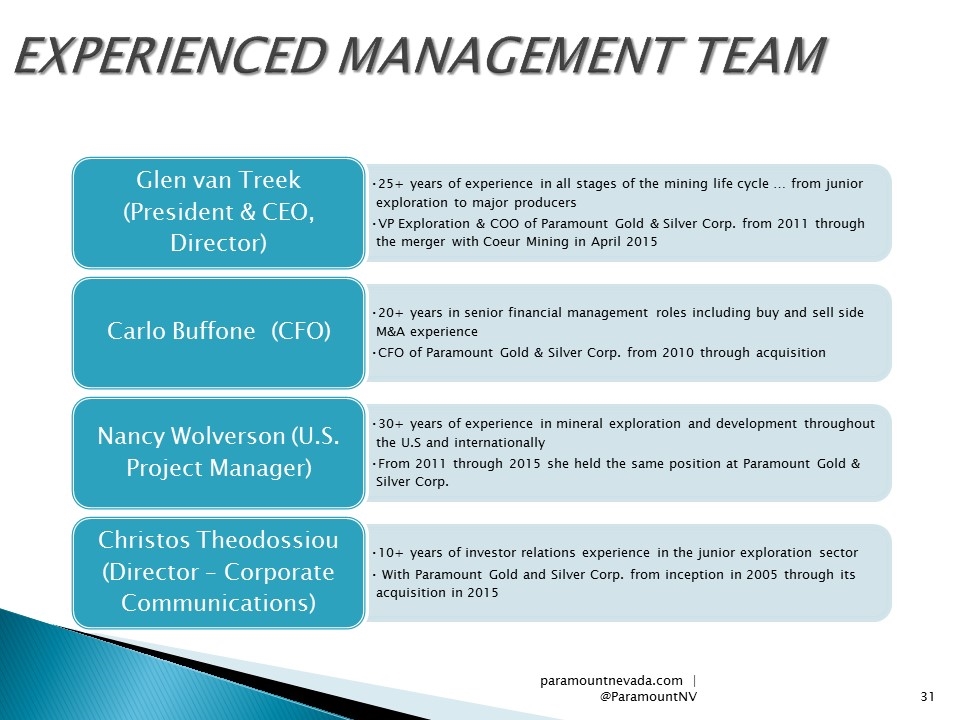
EXPERIENCED MANAGEMENT TEAM paramountnevada.com | @ParamountNV Glen van Treek (President & CEO, Director) 25+ years of experience in all stages of the mining life cycle … from junior exploration to major producers Carlo Buffone (CFO) 20+ years in senior financial management roles including buy and sell side M&A experience Nancy Wolverson (U.S. Project Manager) VP Exploration & COO of Paramount Gold & Silver Corp. from 2011 through the merger with Coeur Mining in April 2015 30+ years of experience in mineral exploration and development throughout the U.S and internationally From 2011 through 2015 she held the same position at Paramount Gold & Silver Corp. Christos Theodossiou (Director – Corporate Communications) 10+ years of investor relations experience in the junior exploration sector With Paramount Gold and Silver Corp. from inception in 2005 through its acquisition in 2015 CFO of Paramount Gold & Silver Corp. from 2010 through acquisition
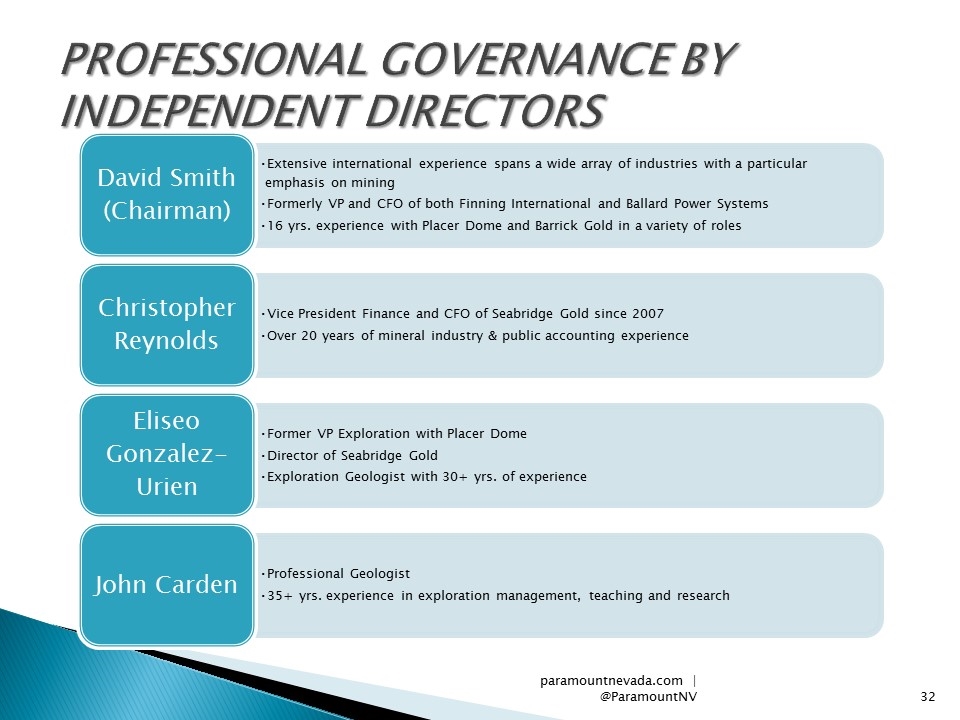
PROFESSIONAL GOVERNANCE BY INDEPENDENT DIRECTORS paramountnevada.com | @ParamountNV David Smith (Chairman) Christopher Reynolds Eliseo Gonzalez-Urien John Carden Vice President Finance and CFO of Seabridge Gold since 2007 Professional Geologist Former VP Exploration with Placer Dome Extensive international experience spans a wide array of industries with a particular emphasis on mining 35+ yrs. experience in exploration management, teaching and research Over 20 years of mineral industry & public accounting experience Director of Seabridge Gold Exploration Geologist with 30+ yrs. of experience Formerly VP and CFO of both Finning International and Ballard Power Systems 16 yrs. experience with Placer Dome and Barrick Gold in a variety of roles
