Attached files
| file | filename |
|---|---|
| 8-K - FORM 8-K - JPMORGAN CHASE & CO | jpmc2016ccbform8k.htm |

September 12, 2016
Gordon Smith, Chief Executive Officer – Consumer & Community Banking
Barclays Global Financial Services Conference

Agenda
Page
B
A
R
C
L
A
Y
S
G
L
O
B
A
L
F
I
N
A
N
C
I
A
L
S
E
R
V
I
C
E
S
C
O
N
F
E
R
E
N
C
E
1
State of the U.S. Consumer
1
Chase Consumer & Community Banking business fundamentals 7
Payments update 19
Summary 28
Appendix 30

S
T
A
T
E
O
F
T
H
E
U
.
S
.
C
O
N
S
U
M
E
R
We have relationships with more U.S. households than any other financial
services provider
Estimated penetration of U.S. households (mm)
~4
~18
~40
~49
~53mm
Charles Schwab
US Bank
Wells Fargo
Bank of America
Chase
~41
~47
~59
Wells Fargo
Bank of America
Chase
Chase account and transactions statistics
# of checking
accounts4
~32mm
# of credit, debit, and
pre-paid card
accounts5
~94mm
# of credit and debit
transactions6
~14B
1 As of June 2016. Includes consumer and business households
2 Source: Bank of America 2Q16 Earnings. Includes consumer and business households
3 Source: Wells Fargo Investor Day (May 2016). Includes consumer households only
4 As of 2Q16. Includes checking accounts and Liquid ® cards
5 As of 2Q16. Excludes Commercial Card
6 Last 12 months ending June 2016. Includes credit, debit, and pre-paid transactions on Chase cards
1
2
3
2
S
T
A
T
E
O
F
T
H
E
U
.
S
.
C
O
N
S
U
M
E
R
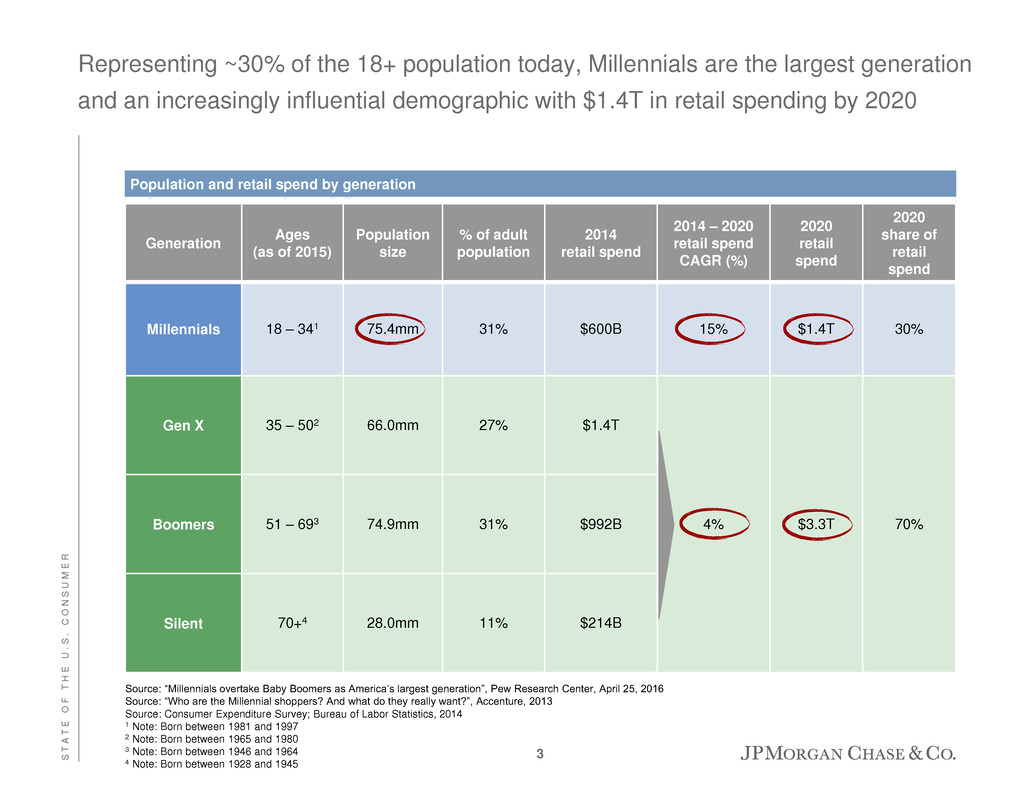
Representing ~30% of the 18+ population today, Millennials are the largest generation
and an increasingly influential demographic with $1.4T in retail spending by 2020
Source: “Millennials overtake Baby Boomers as America’s largest generation”, Pew Research Center, April 25, 2016
Source: “Who are the Millennial shoppers? And what do they really want?”, Accenture, 2013
Source: Consumer Expenditure Survey; Bureau of Labor Statistics, 2014
1 Note: Born between 1981 and 1997
2 Note: Born between 1965 and 1980
3 Note: Born between 1946 and 1964
4 Note: Born between 1928 and 1945
Generation
Ages
(as of 2015)
Population
size
% of adult
population
2014
retail spend
2014 – 2020
retail spend
CAGR (%)
2020
retail
spend
2020
share of
retail
spend
Millennials 18 – 341 75.4mm 31% $600B 15% $1.4T 30%
Gen X 35 – 502 66.0mm 27% $1.4T
4% $3.3T 70% Boomers 51 – 693 74.9mm 31% $992B
Silent 70+4 28.0mm 11% $214B
Population and retail spend by generation
3

S
T
A
T
E
O
F
T
H
E
U
.
S
.
C
O
N
S
U
M
E
R
Millennials make up the majority of our new deposit customers, and we lead
competitors in primary relationships with Millennials
Millennials primary financial institution by product type2
22%
19%
14%
3%
2%
2%
Chase
Bank of America
Wells Fargo
Citibank
Capital One
US Bank
19%
16%
9%
2%
3%
2%
Checking or savings Credit card
1 Includes new to bank and existing customer checking account openings from 3Q15 – 2Q16. Excludes accounts of customers under 18 years of age
2 Source: TNS Retail Banking Monitor. TNS defines Millennials as ages 18 – 34
Note: Respondents were asked to list all of the providers with whom they currently have a checking or savings account and/or a credit card account. If a customer had
multiple relationships, the customer was asked to identify primary bank by product type. Survey data includes interviews from 2Q15 – 1Q16. Survey sample was weighted to
be representative of the U.S. population as reflected by the Census Bureau. N=1,437
Chase checking account acquisitions by age1
18-24 25-30 31-35 36-40 41-45 46-50 51-55 56-60 61-65 66-70 71+
% of total acquired accounts57%
4

S
T
A
T
E
O
F
T
H
E
U
.
S
.
C
O
N
S
U
M
E
R
Millennials spend more of their “wallet” on experiences than other generations
Note: Millennials defined as born 1981 – 1997. Non-Millennials defined as born prior to 1981
Note: Includes Chase branded credit and debit card customers who used their card at least once a month from 01/2013 to 03/2016 and have at least one transaction in the
following categories during the entire time period: Grocery, Restaurant, Fuel/Transit, Clothing, Misc. Retail, Pharmacy, Home Supply, and Entertainment
Note: Numbers may not sum due to rounding
Spend category distribution by generation (credit + debit cards, 2015)
17% 19%
19%
20%
15%
18%
12%
11%
3%
6%
16%
11%
12% 10%
6% 7%
Millennials Non-Millennials
Travel
Dining
Grocery
Transportation/fuel
Retail
Other
Entertainment
Average annual spend per customer $20.0K $24.8K
Home improvement
Exp
e
rien
c
e
s
34% 28%
5

S
T
A
T
E
O
F
T
H
E
U
.
S
.
C
O
N
S
U
M
E
R
Chase customers as a percentage of total Millennial
population
Top 10 metro areas by Millennial population (mm)
In Chase footprint
Source: Population by metro area/age determined based on data from the 2010 – 2014 American Community Survey
Note: Millennials defined as born 1981 – 1997
Note: Chase Millennial share includes all Millennial customers with at least one Chase product, including deposit products, card, mortgage, auto lending, etc.
Note: Numbers may not sum due to rounding
We perform strongly with Millennials, particularly within our branch footprint
45%
38%
49%
35%
36%
13%
15%
34%
18%
16%
55%
62%
51%
65%
64%
87%
85%
66%
82%
84%
New York
Los Angeles
Chicago
Dallas
Houston
Philadelphia
Washington
D.C.
Miami
Atlanta
Boston
Chase customers All other Millennials
4.7
3.3
2.3
1.6
1.5
1.4
1.4
1.3
1.3
1.1
15.2
9.7
7.3
5.1
4.7
4.6
4.4
4.5
4.2
3.5
19.9
13.1
9.5
6.7
6.2
6.0
5.9
5.8
5.5
4.7
New York
Los Angeles
Chicago
Dallas
Houston
Philadelphia
Washington
D.C.
Miami
Atlanta
Boston
Millennials All other population
6

Agenda
Page
B
A
R
C
L
A
Y
S
G
L
O
B
A
L
F
I
N
A
N
C
I
A
L
S
E
R
V
I
C
E
S
C
O
N
F
E
R
E
N
C
E
7
Chase Consumer & Community Banking business fundamentals
7
State of the U.S. Consumer 1
Payments update 19
Summary 28
Appendix 30

C
H
A
S
E
C
O
N
S
U
M
E
R
&
C
O
M
M
U
N
I
T
Y
B
A
N
K
I
N
G
B
U
S
I
N
E
S
S
F
U
N
D
A
M
E
N
T
A
L
S
We have continued strong momentum across key business drivers, driven by
consistent investment strategy
$ in billions, except ratios and where otherwise noted 1H 2016 YoY ∆
Consumer &
Community Banking
Households (mm) 59.2 2%
Active mobile users (mm) 24.8 18%
Credit Card
New accounts opened1 (mm) 5.0 19%
Sales volume1 $258 8%
Average loans $128 2%
Net charge-off rate 2.66% 5bps
Commerce Solutions Merchant processing volume $511 12%
Auto Finance
Loan and lease originations $18 20%
Average loan and lease portfolio $72 16%
Mortgage Banking
Total mortgage originations $47 (12%)
Third-party mortgage loans serviced (end of period) $630 (13%)
Average loans $229 19%
Net charge-off rate2 0.10% (15)bps
Business Banking
Average deposits $106 10%
Average loans $21 6%
Loan originations $4 12%
Consumer Banking
Average deposits $452 11%
Client investment assets (end of period) $225 1%
1 Excludes Commercial Card
2 Excludes write-offs of purchased credit-impaired (PCI) loans
Key business drivers
8

C
H
A
S
E
C
O
N
S
U
M
E
R
&
C
O
M
M
U
N
I
T
Y
B
A
N
K
I
N
G
B
U
S
I
N
E
S
S
F
U
N
D
A
M
E
N
T
A
L
S
Our growth metrics are driven by deep relationships with high-performing customers
Checking balances per new account2
1H15 1H16
Business Banking average loan size
1H15 1H16
+25%
1 An engaged household is one that has two or more product relationships with Chase and meets certain thresholds for engagement on at least one of their relationships
2 Data represents average checking balance per new checking account on the last day of the month the account was opened
3 Represents sales on new accounts originated in that period. Excludes Commercial Card and certain terminated partner portfolios
4 Data per Experian Automotive and represents penetration for new car loans and leases
5 Source: Inside Mortgage Finance (IMF) and Chase internal data. Mortgage Banking only market share. Excludes Private Bank and Home Equity
+4%
Chase engaged households1
1H15 1H16
+1mm
Auto manufacturing partner
penetration4
1H15 1H16
+390 bps
Jumbo mortgage originations market
share5
1H15 1H16
+210 bps
Card in-year sales by vintage3
1H15 1H16
+27%
9
C
H
A
S
E
C
O
N
S
U
M
E
R
&
C
O
M
M
U
N
I
T
Y
B
A
N
K
I
N
G
B
U
S
I
N
E
S
S
F
U
N
D
A
M
E
N
T
A
L
S
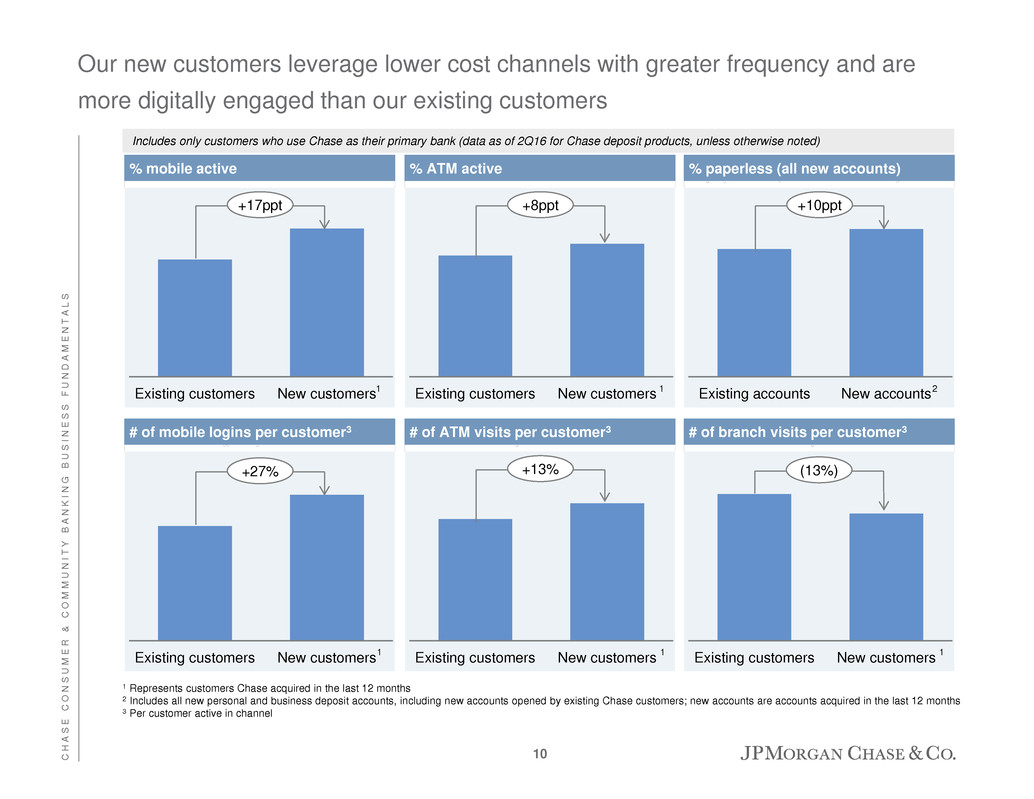
Our new customers leverage lower cost channels with greater frequency and are
more digitally engaged than our existing customers
% mobile active
07/20/11
% ATM active % paperless (all new accounts)
# of mobile logins per customer3 # of ATM visits per customer3 # of branch visits per customer3
1 Represents customers Chase acquired in the last 12 months
2 Includes all new personal and business deposit accounts, including new accounts opened by existing Chase customers; new accounts are accounts acquired in the last 12 months
3 Per customer active in channel
Existing customers New customers
+17ppt
Existing customers New customers
+8ppt
Existing accounts New accounts
+10ppt
Existing customers New customers
+27%
Existing customers New customers
+13%
Existing customers New customers
(13%)
Includes only customers who use Chase as their primary bank (data as of 2Q16 for Chase deposit products, unless otherwise noted)
2 1 1
1 1 1
10

C
H
A
S
E
C
O
N
S
U
M
E
R
&
C
O
M
M
U
N
I
T
Y
B
A
N
K
I
N
G
B
U
S
I
N
E
S
S
F
U
N
D
A
M
E
N
T
A
L
S
Consumer & Community Banking avg. loans1 ($B)
We continue to see strong growth in deposits and core loans
Consumer & Community Banking avg. deposits ($B)
$414
$453
$487
$531
$573
2012 2013 2014 2015 1H16
Note: Numbers may not sum due to rounding
1 Includes held-for-sale loans
2 Non-core loans include runoff portfolios, discontinued portfolios and portfolios the Firm has an intent to exit
3 Other includes securities-based lending of $0.2B in 2013, $0.8B in 2014, $1.4B in 2015, and $1.5B as of 1H16
$109 $110 $114 $118 $122
$53 $57
$69
$108
$145 $48 $51
$53
$56
$62
$15 $16
$18
$20
$21
$184 $159 $137
$115
$100
2012 2013 2014 2015 1H16
Card Mortgage Banking
Auto Business Banking/Other
Non-core loans (all LOBs)
$409
$393 $391
2012 – 1H 2016
CAGR
Non-core
loans:
(16%)
Core
loans:
+13%
Total:
+3%
2
Total: +8%
Core: +16%
3
$417
$450
CAGR
+10%
11

C
H
A
S
E
C
O
N
S
U
M
E
R
&
C
O
M
M
U
N
I
T
Y
B
A
N
K
I
N
G
B
U
S
I
N
E
S
S
F
U
N
D
A
M
E
N
T
A
L
S
4.40%
2.70% 2.56%
1.40%
1Q12 2Q12 3Q12 4Q12 1Q13 2Q13 3Q13 4Q13 1Q14 2Q14 3Q14 4Q14 1Q15 2Q15 3Q15 4Q15 1Q16 2Q16
0.00%
1.00%
2.00%
3.00%
4.00%
5.00%
6.00%
Net Charge-off % 30+ Day Delinquency %
Credit Card net charge-off and 30+ delinquency rates
0.28%
0.29%
0.79%
1.16%
1Q12 2Q12 3Q12 4Q12 1Q13 2Q13 3Q13 4Q13 1Q14 2Q14 3Q14 4Q14 1Q15 2Q15 3Q15 4Q15 1Q16 2Q16
0.00%
0.40%
0.80%
1.20%
1.60%
2.00%
Net Charge-off % 30+ Day Delinquency %
2.20%
0.08%
5.05%
1.33%
0.00%
1.00%
2.00%
3.00%
4.00%
5.00%
6.00%
1Q12 2Q12 3Q12 4Q12 1Q13 2Q13 3Q13 4Q13 1Q14 2Q14 3Q14 4Q14 1Q15 2Q15 3Q15 4Q15 1Q16 2Q16
Net Charge-off % 30+ Day Delinquency %
Mortgage Banking non-credit impaired net charge-off and 30+ delinquency rates
Auto net charge-off and 30+ delinquency rates
2 3
7
6
Note: For footnoted information, refer to appendix
4
5
12
Credit trends across the businesses continue to be favorable1
C
H
A
S
E
C
O
N
S
U
M
E
R
&
C
O
M
M
U
N
I
T
Y
B
A
N
K
I
N
G
B
U
S
I
N
E
S
S
F
U
N
D
A
M
E
N
T
A
L
S
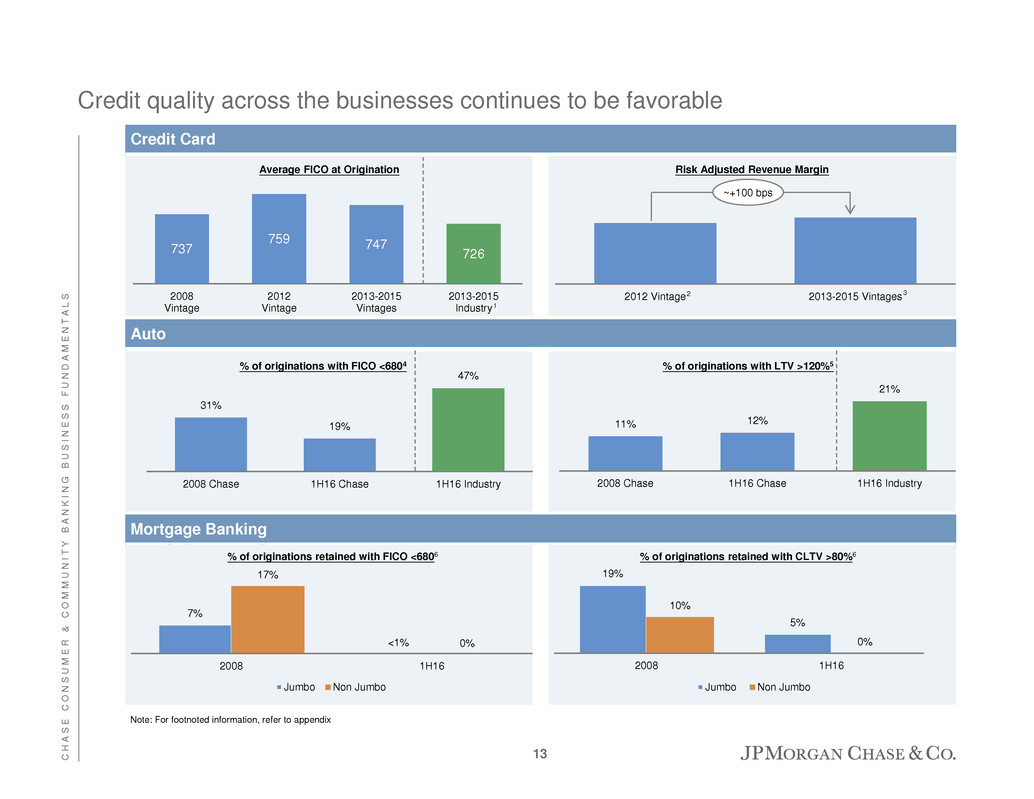
Credit Card
Mortgage Banking
Auto
Credit quality across the businesses continues to be favorable
737
759 747
726
2008
Vintage
2012
Vintage
2013-2015
Vintages
2013-2015
Industry
Average FICO at Origination
7%
17%
0%
2008 1H16
Jumbo Non Jumbo
% of originations retained with FICO <6806
19%
5%
10%
0%
2008 1H16
Jumbo Non Jumbo
% of originations retained with CLTV >80%6
Note: For footnoted information, refer to appendix
2012 Vintage 2013-2015 Vintages
Risk Adjusted Revenue Margin
<1%
1
13
31%
19%
47%
2008 Chase 1H16 Chase 1H16 Industry
% of originations with FICO <6804
11% 12%
21%
2008 Chase 1H16 Chase 1H16 Industry
% of originations with LTV >120%5
~+100 bps
2 3

C
H
A
S
E
C
O
N
S
U
M
E
R
&
C
O
M
M
U
N
I
T
Y
B
A
N
K
I
N
G
B
U
S
I
N
E
S
S
F
U
N
D
A
M
E
N
T
A
L
S
14%
15%
31%
35%
24%
25%
17%
17%
16% 15%
12% 11%
2Q14 3Q14 4Q14 1Q15 2Q15 3Q15 4Q15 1Q16 2Q16
10%
15%
20%
25%
30%
35%
40%
Chase Cap One Wells Discover Citi BofA
26%
28% 28%
31%
34%
39%
Chase Amex Citi Discover Cap One BofA
Chase vs. Competitors – FICO <660 portfolio mix1
Chase Card has modest exposure to FICO <660, and is lowest in the 640-720 range
1 Based on Autonomous Research, U.S. Cards Subprime Plateau, 8/15/2016. Credit card loans without a FICO score included in FICO <660 category
2 Based on Lightspeed Behavioral Tracking Panel data for sample of existing portfolios’ customers polled between November 2014 and October 2015
Chase vs. Competitors FICO (640–720) portfolio mix2
14

C
H
A
S
E
C
O
N
S
U
M
E
R
&
C
O
M
M
U
N
I
T
Y
B
A
N
K
I
N
G
B
U
S
I
N
E
S
S
F
U
N
D
A
M
E
N
T
A
L
S
Chase Auto has managed layered risk
3%
4%
Chase Industry
<620 FICO Score1 – Chase Auto2 loan mix vs. Industry3
1%
5%
Chase Industry
3%
8%
Chase Industry
LTV > 120
Note: All percentages are of total auto loans for Chase and for the industry
1 FICO® is a registered trademark of Fair Isaac Corporation in the United States and other countries
2 Data is based on EOP loans as of 2Q 2016. Chase data excludes independent dealers to provide a better comparable to J.D. Power PIN data
3 Source: Power Information Network – PIN, a business division of J.D. Power. EOP industry portfolio mix is unavailable so the last 26 months of originations is used as a proxy
LTV < 100
LTV
101 – 120
15

C
H
A
S
E
C
O
N
S
U
M
E
R
&
C
O
M
M
U
N
I
T
Y
B
A
N
K
I
N
G
B
U
S
I
N
E
S
S
F
U
N
D
A
M
E
N
T
A
L
S
Card credit trends remain strong, but with modest deterioration in late stage
delinquencies
1 Includes loans held-for-sale
2 June 2012 adjusted for the effect of a change in charge-off policy for troubled debt restructurings and December 2014 adjusted to exclude losses from portfolio exits. These
are non-GAAP financial measures used by management to facilitate comparisons with prior periods. The reported delinquency roll-rates for June 2012 and December 2014
were 58.13% and 57.23%, respectively
Credit Card delinquency $ roll-rate from current to 60 days past due1
Credit Card delinquency $ roll-rate from 60 days past due to charge-off (60-180 days past due)1,2
0.0%
0.5%
1.0%
1.5%
2.0%
0.0%
10.0%
20.0%
30.0%
40.0%
50.0%
60.0%
16

C
H
A
S
E
C
O
N
S
U
M
E
R
&
C
O
M
M
U
N
I
T
Y
B
A
N
K
I
N
G
B
U
S
I
N
E
S
S
F
U
N
D
A
M
E
N
T
A
L
S
We expect to exit 2016 with CCB structural expense $2.35B lower than 2014
17
$2,700
$350
2016
Investor Day
target
Mortgage
Banking
Lower
foreclosure¹
Branch
transformation
Internal
technology
efficiencies
Paperless
adoption
Various
initiatives²
Other³ 4Q16 Exit
work in
progress
CCB structural expense ($mm)
¹ Includes mortgage operating losses, in large part foreclosure-related
² Includes various initiatives, such as vendor rationalization, real estate / location strategy, marketing efficiencies and training consolidation
³ Includes non-recurring items from 2014
Expect 2016 Firmwide adjusted expense to be ~$56B

C
H
A
S
E
C
O
N
S
U
M
E
R
&
C
O
M
M
U
N
I
T
Y
B
A
N
K
I
N
G
B
U
S
I
N
E
S
S
F
U
N
D
A
M
E
N
T
A
L
S
2014 to 1H 2016
We are investing in marketing to take advantage of attractive market opportunities
Credit Card
new account
marketing
Consumer
Banking new
account
marketing
ROE > 20%
Incremental Marketing Investments
On average ~$375mm annual investment yielded per year1:
~1.45mm new accounts
~$6.0B annual spend (~$11.3B steady state)
~$1.0B average outstandings (~$2.2B steady state)
On average ~$90mm annual investment yielded per year:
~290K new households
~$2.5B in average deposits
1 Before reduction for FAS91 loan origination costs which are amortized against revenue
Select examples
18
Agenda
Page
B
A
R
C
L
A
Y
S
G
L
O
B
A
L
F
I
N
A
N
C
I
A
L
S
E
R
V
I
C
E
S
C
O
N
F
E
R
E
N
C
E
19
Payments update
19
State of the U.S. Consumer 1
Chase Consumer & Community Banking business fundamentals 7
Summary 28
Appendix 30

P
A
Y
M
E
N
T
S
U
P
D
A
T
E
We deliver scale to each component of the payments ecosystem
16% 16%
18%
Credit and debit
payments
GPCC
outstandings
Merchant
processing
volume
Chase holds strong market share positions
07/20/11
3
~94mm credit, debit and pre-paid card accounts4
18mm digital and mobile logins each day
Consumer reach
Over $780B in total Chase credit and debit sales4, 5
38mm credit and debit card payments each day4
Payments scale
$1.0T processed5
Over 515K active global merchant outlets
Merchant scale
Chase’s scale across merchants and consumers is
unmatched
Position:
#1 #1 #2
2
1 Source: Nilson, February 2016, May 2016
2 Source: Nilson, February 2016. GPCC defined as General Purpose Credit Cards
3 Source: Nilson, March 2016. Chase is the #1 wholly-owned merchant acquirer in the U.S. When volume from JVs and revenue share arrangements are included in First Data’s
volume, First Data holds #1 share position in the U.S.
4 Excludes Commercial Card
5 From July 2015 – June 2016
1
20
P
A
Y
M
E
N
T
S
U
P
D
A
T
E
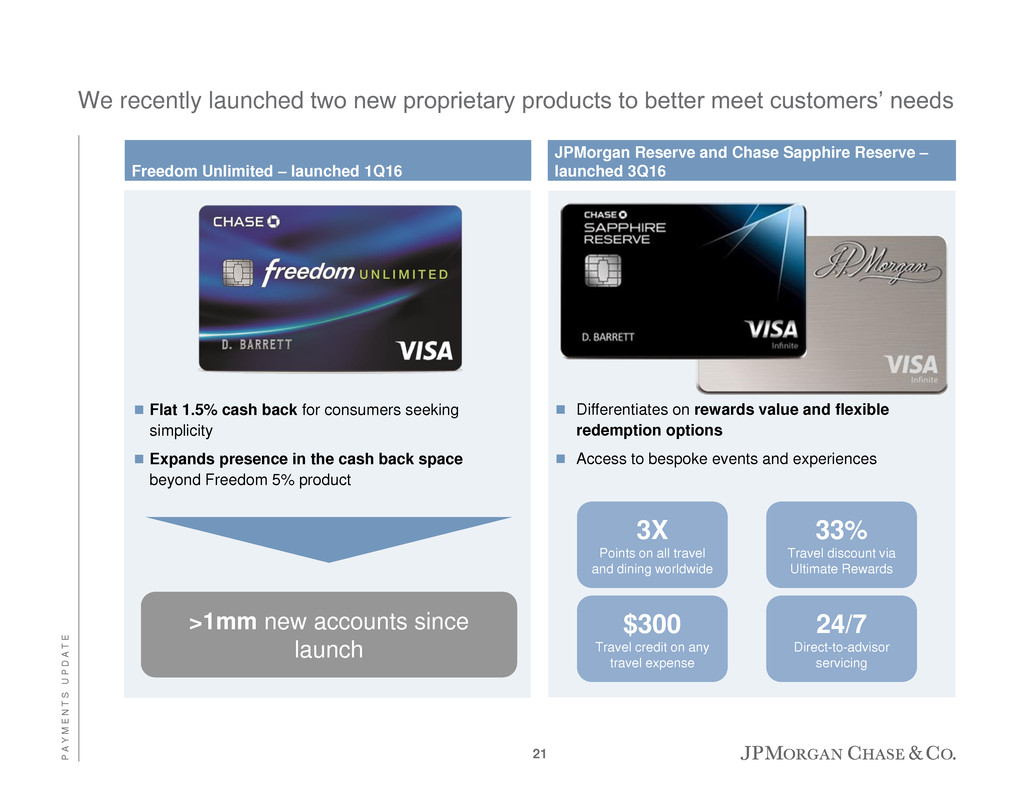
We recently launched two new proprietary products to better meet customers’ needs
Freedom Unlimited – launched 1Q16
JPMorgan Reserve and Chase Sapphire Reserve –
launched 3Q16
Flat 1.5% cash back for consumers seeking
simplicity
Expands presence in the cash back space
beyond Freedom 5% product
>1mm new accounts since
launch
Differentiates on rewards value and flexible
redemption options
Access to bespoke events and experiences
33%
Travel discount via
Ultimate Rewards
3X
Points on all travel
and dining worldwide
24/7
Direct-to-advisor
servicing
$300
Travel credit on any
travel expense
21

P
A
Y
M
E
N
T
S
U
P
D
A
T
E
1H12 1H16
1H12 1H16
Co-brand new accounts
Co-brand sales volumes1
We continue to grow our co-brand portfolio
Key co-brand partnerships overview
1 Excludes certain runoff and terminated partner portfolios
>50%
>50%
Partner for over 25 years
Partner for nearly 15 years
Partner for 20 years
22

P
A
Y
M
E
N
T
S
U
P
D
A
T
E
The mobile payments space is in its formative period; our intention is to be
wherever our customers want to spend
Apple Pay, Android Pay, and Samsung Pay
share of retail POS payments ($)2
All other retail POS
payments
Apple Pay, Android Pay,
and Samsung Pay
1 Source: comScore 1Q16. Population consisted of iPhone and Android smartphone owners. iPhone owners N = 696; Android phone owners N = 1,364
2 Source: “Merchant, Bank Mobile Wallets Prove Value Where Apple, Google, and Samsung Have Not”, Javelin Strategy & Research, August 2016
Awareness and usage among device owners1
52%
35%
31%
8%
3% 2%
Apple Pay Android Pay Samsung Pay
Awareness Usage
<1%
99%
23

P
A
Y
M
E
N
T
S
U
P
D
A
T
E
Chase maintains leading share in credit and debit purchase volumes
15% 15%
16% 16% 16% 16%
2010 2011 2012 2013 2014 2015
Chase share of purchase volume (credit + debit, % of total U.S. market)
Source: Nilson, 2011 – 2016
07/20/11
Position: #1 #1 #1 #1 #1 #1
24
P
A
Y
M
E
N
T
S
U
P
D
A
T
E
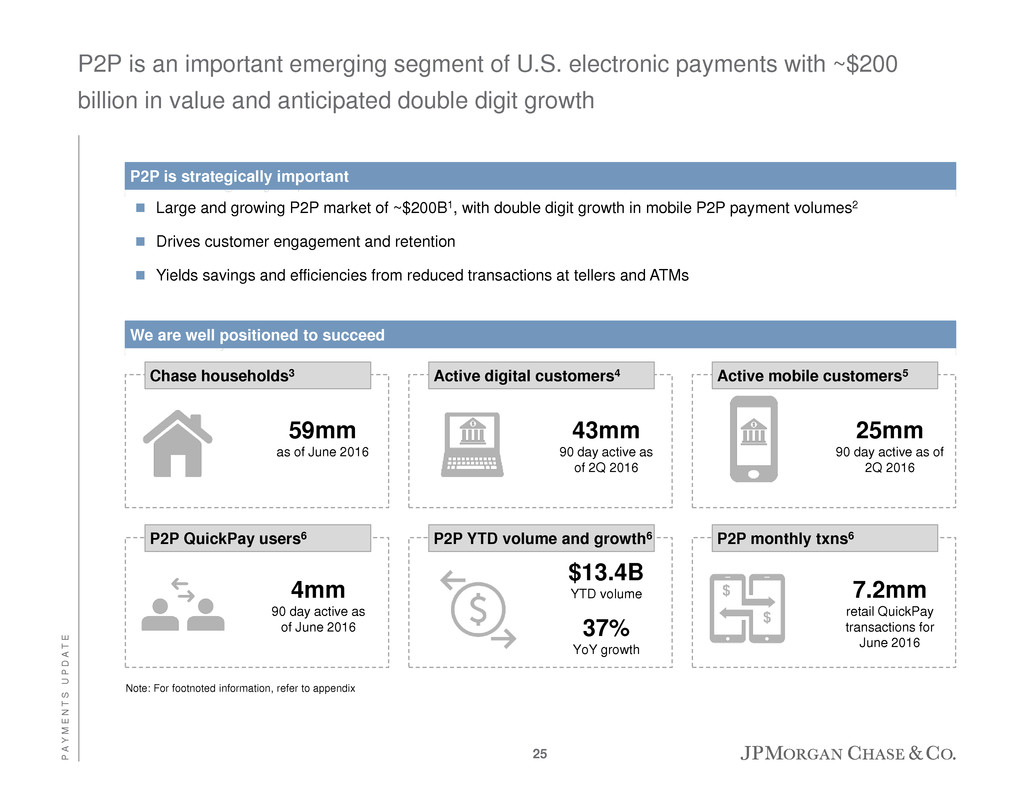
P2P is an important emerging segment of U.S. electronic payments with ~$200
billion in value and anticipated double digit growth
Large and growing P2P market of ~$200B1, with double digit growth in mobile P2P payment volumes2
Drives customer engagement and retention
Yields savings and efficiencies from reduced transactions at tellers and ATMs
P2P is strategically important
We are well positioned to succeed
Chase households3 Active digital customers4 Active mobile customers5
P2P QuickPay users6 P2P YTD volume and growth6 P2P monthly txns6
$13.4B
YTD volume 7.2mm
retail QuickPay
transactions for
June 2016
59mm
as of June 2016
43mm
90 day active as
of 2Q 2016
25mm
90 day active as of
2Q 2016
4mm
90 day active as
of June 2016 37%
YoY growth
Note: For footnoted information, refer to appendix
25
P
A
Y
M
E
N
T
S
U
P
D
A
T
E
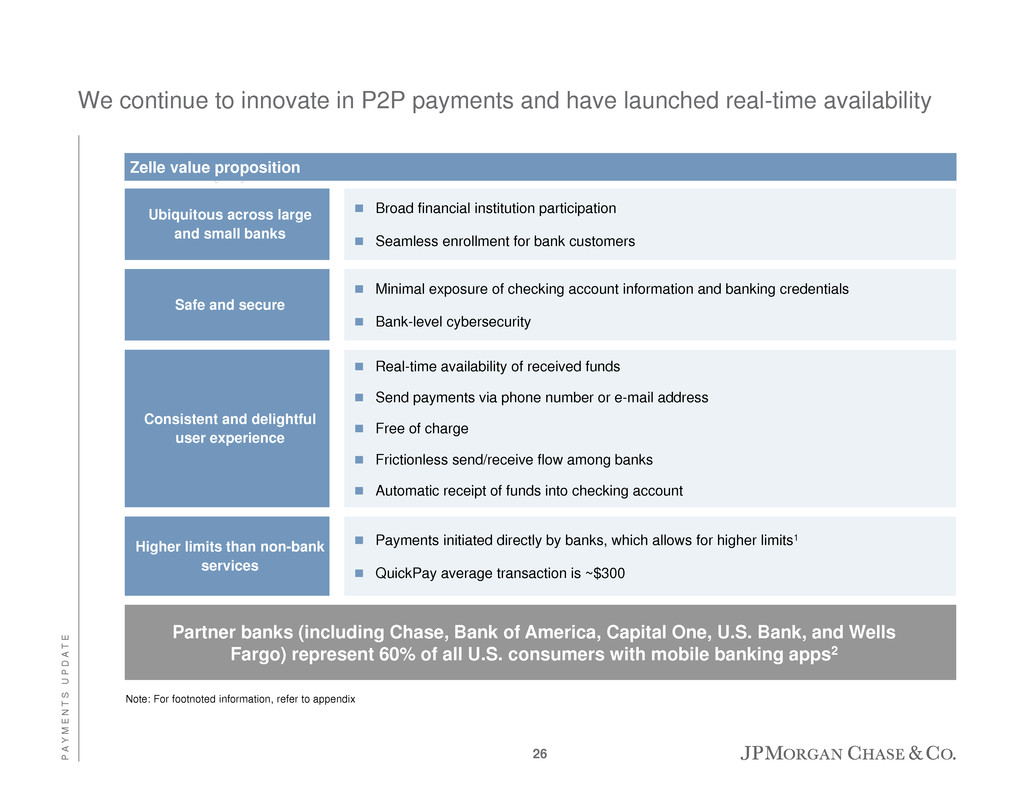
We continue to innovate in P2P payments and have launched real-time availability
Partner banks (including Chase, Bank of America, Capital One, U.S. Bank, and Wells
Fargo) represent 60% of all U.S. consumers with mobile banking apps2
Note: For footnoted information, refer to appendix
Zelle value proposition
Broad financial institution participation
Seamless enrollment for bank customers
Minimal exposure of checking account information and banking credentials
Bank-level cybersecurity
Real-time availability of received funds
Send payments via phone number or e-mail address
Free of charge
Frictionless send/receive flow among banks
Automatic receipt of funds into checking account
Payments initiated directly by banks, which allows for higher limits1
QuickPay average transaction is ~$300
Ubiquitous across large
and small banks
Safe and secure
Consistent and delightful
user experience
Higher limits than non-bank
services
26

P
A
Y
M
E
N
T
S
U
P
D
A
T
E
Chase’s enhanced, real-time QuickPay experience launched in July
Enhanced real-time QuickPay experience launched in July 2016
Select contact in Chase app Enter dollar amount and
include notes
Confirm transaction
27
Agenda
Page
B
A
R
C
L
A
Y
S
G
L
O
B
A
L
F
I
N
A
N
C
I
A
L
S
E
R
V
I
C
E
S
C
O
N
F
E
R
E
N
C
E
28
Summary
28
State of the U.S. Consumer 1
Chase Consumer & Community Banking business fundamentals 7
Payments update 19
Appendix 30
S
U
M
M
A
R
Y
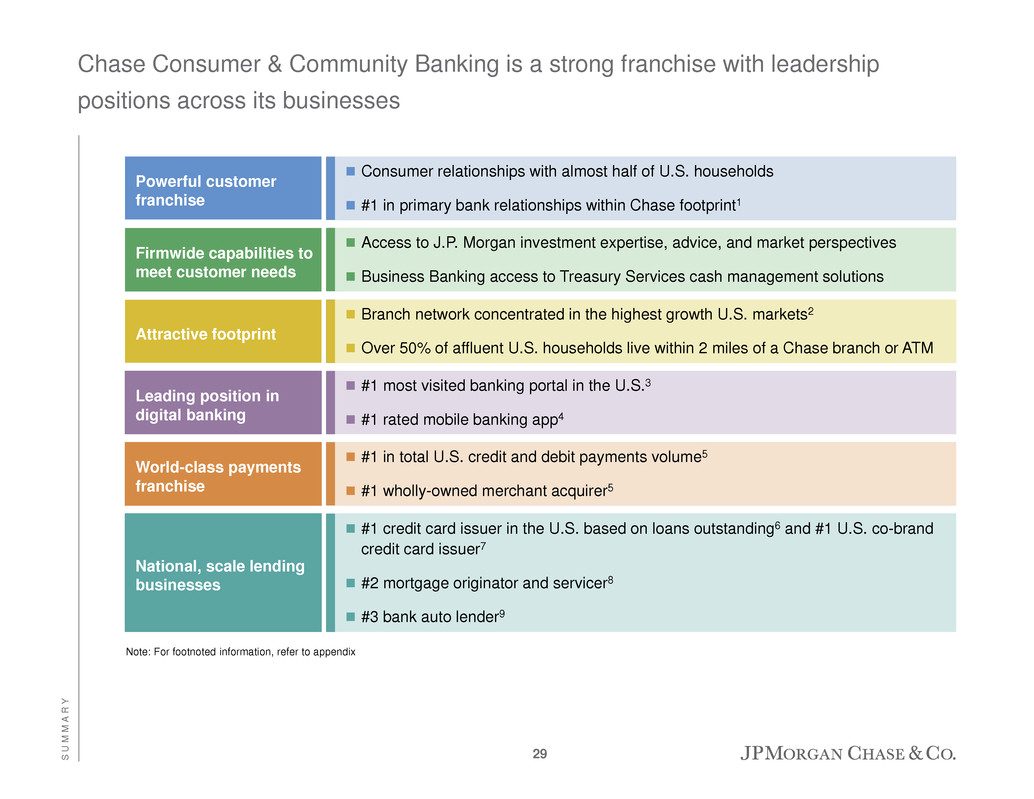
Chase Consumer & Community Banking is a strong franchise with leadership
positions across its businesses
Note: For footnoted information, refer to appendix
Consumer relationships with almost half of U.S. households
#1 in primary bank relationships within Chase footprint1
Powerful customer
franchise
Access to J.P. Morgan investment expertise, advice, and market perspectives
Business Banking access to Treasury Services cash management solutions
Firmwide capabilities to
meet customer needs
Branch network concentrated in the highest growth U.S. markets2
Over 50% of affluent U.S. households live within 2 miles of a Chase branch or ATM
Attractive footprint
#1 most visited banking portal in the U.S.3
#1 rated mobile banking app4
Leading position in
digital banking
#1 in total U.S. credit and debit payments volume5
#1 wholly-owned merchant acquirer5
World-class payments
franchise
#1 credit card issuer in the U.S. based on loans outstanding6 and #1 U.S. co-brand
credit card issuer7
#2 mortgage originator and servicer8
#3 bank auto lender9
National, scale lending
businesses
29

Agenda
Page
B
A
R
C
L
A
Y
S
G
L
O
B
A
L
F
I
N
A
N
C
I
A
L
S
E
R
V
I
C
E
S
C
O
N
F
E
R
E
N
C
E
30
Appendix
30
State of the U.S. Consumer 1
Chase Consumer & Community Banking business fundamentals 7
Payments update 19
Summary 28
A
P
P
E
N
D
I
X
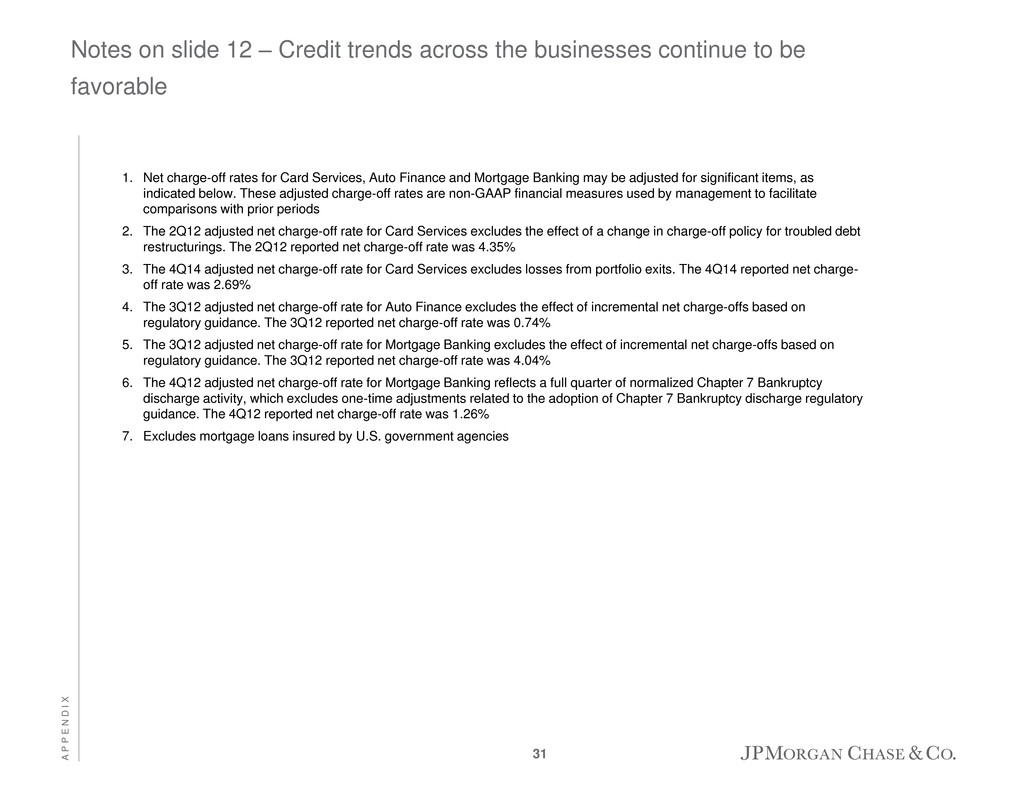
Notes on slide 12 – Credit trends across the businesses continue to be
favorable
1. Net charge-off rates for Card Services, Auto Finance and Mortgage Banking may be adjusted for significant items, as
indicated below. These adjusted charge-off rates are non-GAAP financial measures used by management to facilitate
comparisons with prior periods
2. The 2Q12 adjusted net charge-off rate for Card Services excludes the effect of a change in charge-off policy for troubled debt
restructurings. The 2Q12 reported net charge-off rate was 4.35%
3. The 4Q14 adjusted net charge-off rate for Card Services excludes losses from portfolio exits. The 4Q14 reported net charge-
off rate was 2.69%
4. The 3Q12 adjusted net charge-off rate for Auto Finance excludes the effect of incremental net charge-offs based on
regulatory guidance. The 3Q12 reported net charge-off rate was 0.74%
5. The 3Q12 adjusted net charge-off rate for Mortgage Banking excludes the effect of incremental net charge-offs based on
regulatory guidance. The 3Q12 reported net charge-off rate was 4.04%
6. The 4Q12 adjusted net charge-off rate for Mortgage Banking reflects a full quarter of normalized Chapter 7 Bankruptcy
discharge activity, which excludes one-time adjustments related to the adoption of Chapter 7 Bankruptcy discharge regulatory
guidance. The 4Q12 reported net charge-off rate was 1.26%
7. Excludes mortgage loans insured by U.S. government agencies
31

A
P
P
E
N
D
I
X
Notes on slide 13 – Credit quality across the businesses continues to be
favorable
The information supplied by Power Information Network, a business division of J.D. Power and Associates (“PIN”) is based on
data believed to be reliable but is neither all-inclusive nor guaranteed by PIN. Without limiting the generality of the foregoing,
specific data points may vary considerably from other information sources. Any opinions expressed herein reflect the judgment of
Chase Auto Finance at this date and are subject to change.
FICO® is a registered trademark of Fair Isaac Corporation in the United States and other countries.
1. Industry data is an average of Lightspeed’s Behavioral Tracking Panel average risk scores for a sample of new accounts
2. Actual 1H16 performance of Chase branded accounts booked in 2012
3. Expected year 3 performance of Chase branded accounts booked 2013 – 2015
4. Excludes operating leases. Industry FICO data per Experian Automotive. Chase originations include franchise and
independent dealers to provide a better comparable to Experian data
5. Excludes operating leases. Industry LTV data per PIN. Chase originations exclude independent dealers to provide a better
comparable to PIN data
6. Reflects first-lien originations retained on on-balance sheet. Excludes Home Equity and Private Bank loans, and excludes
loans where the FICO score or estimated property value is unavailable
32

A
P
P
E
N
D
I
X
Notes on slide 25 – P2P is an important emerging segment of U.S. electronic
payments with ~$200 billion in value and anticipated double digit growth
1. “P2P Payments in 2015: Market Sizing and Evaluation of P2P”, Javelin Strategy & Research, 2015. Market size includes
online and mobile person-to-person transfers via bank and non-bank providers and excludes wire transfers through banks
and money services businesses
2. Source: “Chase adds real-time P2P payments”, Business Insider, June 2016
3. As of June 2016; Includes consumer and business households
4. Users of all web and/or mobile platforms who have logged in within the past 90 days
5. Users of all mobile platforms who have logged in within the past 90 days
6. Represents figures for customers who have agreed to the QuickPay legal agreements and sent a payment via QuickPay
during the selected time frame (as of June 2016)
33

A
P
P
E
N
D
I
X
1. Limits for QuickPay users: Payments from Chase and verified non-Chase accounts: maximum of $2,000 per transaction, with
a maximum of $2,000 total per day, maximum of $8,000 in any seven-day period, maximum of $16,000 in any 30-day period;
Payments from Private Banking clients: maximum of $5,000 per transaction, with a maximum of $5,000 total per day,
maximum of $8,000 in any seven-day period, maximum of $16,000 in any 30-day period; Payments from Chase business
accounts: maximum of $5,000 per transaction, with a maximum of $5,000 total per day; maximum of $20,000 in any seven-
day period, maximum of $40,000 in any 30-day period; Invoice payments made using Chase QuickPay: maximum of $10,000
per transaction, with a maximum of $10,000 total per day, maximum of $20,000 in any seven-day period, maximum of
$40,000 in any 30-day period
2. Nilson, December 2015
34
Notes on slide 26 – We continue to innovate in P2P payments and have launched
real-time availability

A
P
P
E
N
D
I
X
Notes on slide 29 – Chase Consumer & Community Banking is a strong
franchise with leadership positions across all its businesses
1. TNS 1Q16 Retail Banking Monitor. Based on total U.S. (~5K surveys per quarter) and Chase footprint (~2.8K surveys per
quarter). TNS survey questions used to determine primary bank: “With which banks do you currently do business? Which do
you consider to be your main or primary bank?”
2. Highest growth U.S. markets refers to top 30 core based statistical areas by deposit balance growth from 2011 to 2015, per
SNL Financial
3. Per compete.com as of June 2016
4. Based on Javelin Research mobile banking app ratings as of May 2016; ranking is among large banks
5. Nilson data for full year 2015
6. Based on disclosures by peers through 2Q16 (Citi, Bank of America, Capital One, American Express, Discover)
7. Based on Phoenix Credit Card Monitor for 12-month period ending June 2016; based on card accounts, revolving balance
dollars and spending dollars
8. Based on Inside Mortgage Finance as of 2Q16 for Servicer and Originator rankings
9. Per Experian AutoCount data for June 2016 YTD; bank auto lenders are non-captive auto lenders
35
Forward-looking statements
This presentation contains forward-looking statements within the meaning of the Private Securities Litigation Reform Act of 1995.
These statements are based on the current beliefs and expectations of JPMorgan Chase’s management and are subject to
significant risks and uncertainties. Actual results may differ from those set forth in the forward-looking statements. Factors that
could cause JPMorgan Chase’s actual results to differ materially from those described in the forward-looking statements can be
found in JPMorgan Chase’s Annual Report on Form 10-K for the year ended December 31, 2015, and Quarterly Reports on
Form 10-Q for the quarters ended March 31, 2016, and June 30, 2016, which have been filed with the Securities and Exchange
Commission and are available on JPMorgan Chase’s website (http://investor.shareholder.com/jpmorganchase/sec.cfm) and on
the Securities and Exchange Commission's website (www.sec.gov). JPMorgan Chase does not undertake to update the forward-
looking statements to reflect the impact of circumstances or events that may arise after the date of the forward-looking
statements.
