Attached files
Table of Contents
As filed with the U.S. Securities and Exchange Commission on September 12, 2016
Registration No. 333-213334
UNITED STATES
SECURITIES AND EXCHANGE COMMISSION
Washington, D.C. 20549
AMENDMENT NO. 1 TO
FORM S-1
REGISTRATION STATEMENT
UNDER
THE SECURITIES ACT OF 1933
Apptio, Inc.
(Exact Name of Registrant as Specified in Its Charter)
| Delaware | 7372 | 26-1175252 | ||
| (State or other Jurisdiction of Incorporation or Organization) |
(Primary Standard Industrial Classification Code Number) |
(I.R.S. Employer Identification Number) |
11100 NE 8th Street, Suite 600
Bellevue, WA 98004
(866) 470-0320
(Address, Including Zip Code, and Telephone Number, Including Area Code, of Registrant’s Principal Executive Offices)
Sunny Gupta
President and Chief Executive Officer
11100 NE 8th Street, Suite 600
Bellevue, WA 98004
(866) 470-0320
(Name, Address, Including Zip Code, and Telephone Number, Including Area Code, of Agent for Service)
Copies to:
| Patrick J. Schultheis Michael Nordtvedt John Brust Wilson Sonsini Goodrich & Rosati, Professional Corporation 701 Fifth Avenue, Suite 5100 Seattle, WA 98104 (206) 883-2500 |
John Morrow Executive Vice President Apptio, Inc. 11100 NE 8th Street, Suite 600 Bellevue, WA 98004 (866) 470-0320 |
Andrew Williamson David Peinsipp Eric Jensen Cooley LLP 1700 Seventh Avenue, Suite 1900 Seattle, WA 98101 (206) 452-8700 |
Approximate date of commencement of proposed sale to the public: As soon as practicable after the effective date of this registration statement.
If any of the securities being registered on this Form are to be offered on a delayed or continuous basis pursuant to Rule 415 under the Securities Act of 1933 check the following box. ¨
If this Form is filed to register additional securities for an offering pursuant to Rule 462(b) under the Securities Act, check the following box and list the Securities Act registration statement number of the earlier effective registration statement for the same offering. ¨
If this Form is a post-effective amendment filed pursuant to Rule 462(c) under the Securities Act, check the following box and list the Securities Act registration statement number of the earlier effective registration statement for the same offering. ¨
If this Form is a post-effective amendment filed pursuant to Rule 462(d) under the Securities Act, check the following box and list the Securities Act registration statement number of the earlier effective registration statement for the same offering. ¨
Indicate by check mark whether the registrant is a large accelerated filer, an accelerated filer, a non-accelerated filer, or a smaller reporting company. See the definitions of “large accelerated filer,” “accelerated filer” and “smaller reporting company” in Rule 12b-2 of the Exchange Act.
| Large accelerated filer | ¨ | Accelerated filer | ¨ | |||
| Non-accelerated filer | þ (Do not check if a smaller reporting company) | Smaller reporting company | ¨ |
CALCULATION OF REGISTRATION FEE
|
| ||||||||
| Title of Each Class of Securities to be Registered |
Amount to be Registered(1) |
Proposed Maximum Offering Price per Share(2) |
Proposed Maximum Aggregate Offering Price(1)(2) |
Amount of Registration Fee(3) | ||||
| Class A Common Stock, $0.0001 par value per share |
6,900,000 | $15.00 | $103,500,000 | $10,423 | ||||
|
| ||||||||
|
| ||||||||
| (1) | Includes the additional shares that the underwriters have the option to purchase from the registrant, if any. |
| (2) | Estimated solely for the purpose of calculating the amount of the registration fee in accordance with Rule 457(a) under the Securities Act. |
| (3) | The registrant previously paid $7,552.50 of the registration fee in connection with the initial filing of this registration statement on August 26, 2016. |
The Registrant hereby amends this registration statement on such date or dates as may be necessary to delay its effective date until the Registrant shall file a further amendment that specifically states that this registration statement shall thereafter become effective in accordance with Section 8(a) of the Securities Act of 1933 or until the registration statement shall become effective on such date as the Securities and Exchange Commission, acting pursuant to said Section 8(a), may determine.
Table of Contents
The information in this preliminary prospectus is not complete and may be changed. These securities may not be sold until the registration statement filed with the Securities and Exchange Commission is effective. This preliminary prospectus is not an offer to sell these securities nor does it seek an offer to buy these securities in any jurisdiction where the offer or sale is not permitted.
Subject to Completion. Dated September 12, 2016
6,000,000 Shares

Class A Common Stock
This is an initial public offering of shares of Class A common stock of Apptio, Inc.
Following this offering, we will have two classes of authorized common stock, Class A common stock and Class B common stock. All shares of our capital stock outstanding prior to this offering will convert into shares of our Class B common stock. The rights of the holders of Class A common stock and Class B common stock will be identical, except with respect to voting and conversion rights. Each share of Class A common stock will be entitled to one vote per share. Each share of Class B common stock will be entitled to ten votes per share and is convertible into one share of Class A common stock. Outstanding shares of Class B common stock will represent approximately 98% of the voting power of our outstanding capital stock immediately following the closing of this offering.
Prior to this offering, there has been no public market for the Class A common stock. It is currently estimated that the initial public offering price per share will be between $13.00 and $15.00. Our Class A common stock has been approved for listing on The NASDAQ Global Market under the symbol “APTI.”
We are an “emerging growth company” as defined under the federal securities laws and, as such, may elect to comply with certain reduced public company reporting requirements for this and future filings.
Investing in our Class A common stock involves risks. See the section of this prospectus captioned “Risk Factors” beginning on page 14 to read about factors you should consider before buying shares of the Class A common stock.
Neither the Securities and Exchange Commission nor any regulatory body has approved or disapproved of these securities or passed upon the accuracy or adequacy of this prospectus. Any representation to the contrary is a criminal offense.
| Per Share | Total | |||||||
| Initial public offering price |
$ | $ | ||||||
| Underwriting discount |
$ | $ | ||||||
| Proceeds, before expenses, to us |
$ | $ | ||||||
To the extent that the underwriters sell more than 6,000,000 shares of Class A common stock, the underwriters have the option to purchase up to an additional 900,000 shares from us at the initial public offering price less the underwriting discount.
The underwriters expect to deliver the shares against payment in New York, New York on , 2016.
| Goldman, Sachs & Co. | J.P. Morgan | BofA Merrill Lynch |
| Barclays | Jefferies | RBC Capital Markets | Pacific Crest Securities a division of KeyBanc Capital Markets |
Prospectus dated , 2016
Table of Contents
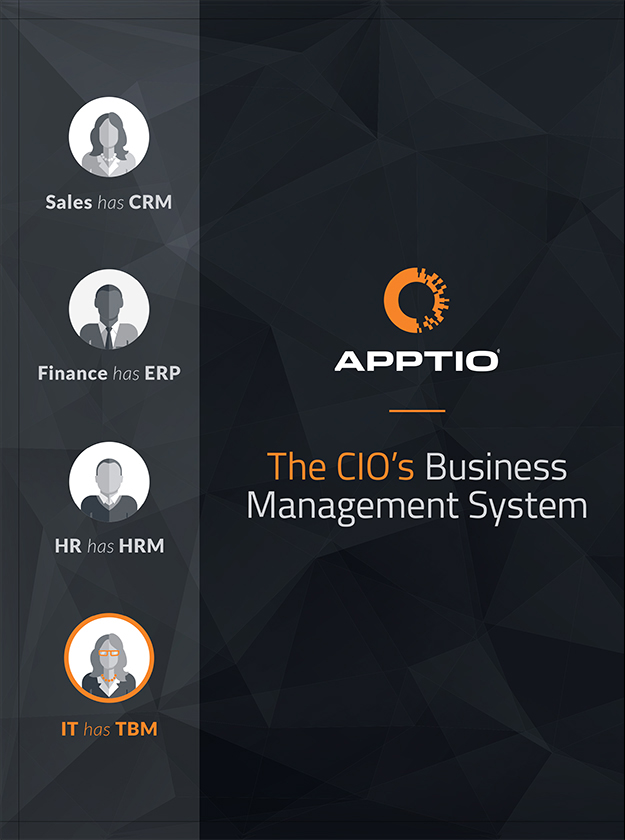
Table of Contents
| Page |
| 1 |
| 14 |
| 44 |
| 46 |
| 47 |
| 48 |
| 51 |
| 53 |
| MANAGEMENT’S DISCUSSION AND ANALYSIS OF FINANCIAL CONDITION AND RESULTS OF OPERATIONS |
56 |
| 88 |
| 107 |
| 116 |
| 131 |
| 135 |
| 138 |
| 145 |
| MATERIAL U.S. FEDERAL INCOME AND ESTATE TAX CONSEQUENCES TO NON-U.S. HOLDERS OF CLASS A COMMON STOCK |
148 |
| 152 |
| 157 |
| 157 |
| 157 |
| F-1 |
Through and including , 2016 (the 25th day after the date of this prospectus), all dealers effecting transactions in these securities, whether or not participating in this offering, may be required to deliver a prospectus. This is in addition to a dealer’s obligation to deliver a prospectus when acting as an underwriter and with respect to an unsold allotment or subscription.
We have not authorized anyone to provide any information or to make any representations other than those contained in this prospectus or in any free writing prospectuses we have prepared. We take no responsibility for, and can provide no assurance as to the reliability of, any other information that others may give you. This prospectus is an offer to sell only the shares offered hereby, but only under circumstances and in jurisdictions where it is lawful to do so. The information contained in this prospectus is current only as of its date.
-i-
Table of Contents
This summary highlights selected information contained elsewhere in this prospectus and is qualified in its entirety by the more detailed information and financial statements included elsewhere in this prospectus. It does not contain all of the information that may be important to you and your investment decision. You should carefully read this entire prospectus, including the matters set forth under “Risk Factors,” “Management’s Discussion and Analysis of Financial Condition and Results of Operations” and our financial statements and related notes.
Overview
We are the leading provider of Technology Business Management, or TBM, solutions. We pioneered the TBM software category to provide the strategic business management system for the CIO because IT needed a data-driven system comparable to those leveraged by other enterprise functions such as sales, human resources and finance. Our cloud-based platform and SaaS applications enable IT leaders to analyze, optimize and plan technology investments, and to benchmark their financial and operational performance against peers. We empower IT leaders to transform IT into a service provider, to navigate the cloud transition, and to shift technology resources to drive more business innovation.
Our TBM solutions consist of a powerful, cloud-based platform and a suite of SaaS applications: Cost Transparency, IT Benchmarking, Business Insights, Bill of IT and IT Planning. Our data and analytics platform leverages proprietary modeling capabilities, powerful self-service analytics and planning workflows to enable customers to make actionable, data-driven strategic and operational decisions. Our platform automatically aggregates, cleanses and establishes relationships across large amounts of customer data from disparate sources and maps the data into our standard IT operating model. Our solutions are the business system of record for our customers’ IT organizations.
Our growing customer base, which includes over 40% of the FORTUNE 100, spans a broad spectrum of industries, including financial services, professional services, technology, energy, consumer goods, manufacturing, healthcare, media, retail and transportation, as well as federal and state government agencies. We offer our solutions on a subscription basis, with subscription fees based on spend managed by our applications and the number of applications or capabilities for which the customer has subscribed. Our customers’ annual IT spend ranges from less than $10 million to billions of dollars.
We formed the Technology Business Management Council, or TBM Council, as a separate non-profit entity in 2012 to foster the growth of the TBM category. The TBM Council has become the leading community for CIOs, IT professionals and IT finance professionals dedicated to advancing the discipline of managing the business of IT, with over 2,900 members. This community establishes industry-endorsed best practices for TBM and helps create a powerful network effect for TBM solutions.
We had total revenue of $73.8 million, $106.6 million and $129.3 million in 2013, 2014 and 2015, respectively, reflecting a year-over-year increase of 45% and 21% in 2014 and 2015, respectively. For 2013, 2014 and 2015, our net losses were $23.7 million, $32.9 million and $41.0 million, respectively, as we focused on growing our business.
-1-
Table of Contents
Industry Background
Digitalization of business processes has increasingly made technology a strategic priority for enterprises of all sizes and across industries. Rapid innovation in technology, particularly the emergence of cloud computing, is simultaneously increasing the complexity of technology decision making and fundamentally transforming the way IT services are delivered. To gain and maintain a competitive advantage, IT leaders must focus more time and resources on transforming their IT business, and less time managing legacy infrastructure and applications.
In today’s world, IT professionals must not only measure and manage traditional infrastructure, but also a wide array of modern IT options, such as cloud computing and IT purchased directly by business units. IT leaders are faced with the need to evaluate hybrid approaches to IT, using a mixture of public cloud, private cloud and owned infrastructure solutions in order to best suit their application, workload and business needs.
The challenge with traditional approaches to managing IT is that technology and business leaders do not always have the data and analytics to understand how technology spending and services align to business priorities. The IT function has historically lacked the insight into costs, capacity, and utilization necessary to make data-driven decisions. However, business and IT leaders desire the ability to make fast decisions, drive innovation and adopt new technology to drive better business results, while also demanding better control, cost management and asset utilization. In order to be aligned on objectives, business and IT leaders need data and analytical solutions to drive optimal business results. The benefits the cloud provides in agility and cost are driving greater urgency by IT leaders to adopt solutions enabling them to understand their existing infrastructure and make decisions on how their infrastructure needs evolve as part of an ongoing transition.
Given these factors, we believe that there is significant pent up demand for a single system of record to manage the business of IT.
Our Opportunity
We believe the total addressable market for TBM solutions is large and largely unpenetrated. The total addressable market for our solutions is driven by global IT spend, which Gartner, an independent technology industry and market research firm, expects to be $2.7 trillion in 2016, which is the sum of all enterprise IT spending by vertical industry market worldwide.1 Subscription fees for our applications are based primarily on the customer’s annual costs being managed by our applications and the number of applications or capabilities for which the customer has subscribed. We typically sell a subset of the five applications we offer so that customers can realize a rapid time to value from a targeted implementation, and seek to sell additional applications over time. Assuming full deployment of all of our current applications, subscription fees typically range from 0.1% to 0.5% of a customer’s annual IT spend. With a reasonable expectation of our ability to penetrate the market, we believe that the current total addressable market for our existing TBM solutions is approximately $6 billion.
We also believe that, with the development of additional capabilities and applications, our platform can be extended to other areas of customers’ businesses. In fact, our solutions are currently deployed by several customers to address a variety of non-IT, enterprise business management use cases in shared services such as legal, human resources and facilities and for analyzing operational
| 1 | See Gartner note (1) in the section of this prospectus captioned “Special Note Regarding Forward Looking Statements.” |
-2-
Table of Contents
metrics, and we believe that enterprise business management use cases such as these represent future market opportunities. If we are successful in our strategy of developing and selling additional applications beyond our current offerings, we believe that our market opportunity will expand.
Our Technology Business Management Solutions
We provide the business system of record used by our customers’ IT organizations to analyze, optimize and plan investments, and benchmark their financial and operational performance against peers. Our TBM solutions consist of a powerful, cloud-based platform and a suite of SaaS applications that empower IT leaders to understand, communicate and transform IT to drive greater value from technology investments.
Key elements of our solutions include:
| • | Adaptive Data Management. Our purpose-built, cloud-based data and analytics platform aggregates, cleanses and correlates large amounts of customer data from a wide variety of disparate sources. Our typical customer starts with a handful of data sources and has the option to integrate data from hundreds of sources ranging from general ledger data, human resources data, billing data, and service management and other operational data. |
| • | Standard IT Operating Model and Taxonomy. Our platform is underpinned by a flexible framework that provides a standard model for how IT costs are captured, categorized and allocated to IT services and business services. |
| • | Visual Modeling and Powerful Calculation Engine. Our visual modeling capabilities allow users to intuitively build and manage the financial and operational model of their IT organization. |
| • | Intuitive, Self-Service Analytics. Our analytics interface is powerful, yet easy to use by a broad range of IT and business users. |
| • | Modular Applications. Our platform currently includes five SaaS applications that can be deployed in a modular fashion: Cost Transparency, IT Benchmarking, Business Insights, Bill of IT and IT Planning. |
Our platform provides the following benefits:
| • | Increase the Value of IT. Our solutions deliver transparency and actionable insights to IT leaders, enabling them to manage IT in the context of the business. As a result, our solutions enable IT leaders to change their IT organizations from a reactive cost center to a proactive service provider and increase the return on business investments through initiatives such as application rationalization and infrastructure optimization. |
| • | Understand and Communicate IT Costs. Our solutions provide IT and business leaders with a business system of record that gives a comprehensive, transparent and up-to-date view of the costs of IT services associated with specific business functions and services. With this insight, IT leaders can work with business leaders to evaluate different IT options, such as cloud versus owned infrastructure and custom-built or purchased versus SaaS applications, and make better, data-driven decisions. |
-3-
Table of Contents
| • | Optimize IT Investments to Drive Better Business Results. Our solutions enable IT professionals to more efficiently manage existing IT investments and focus incremental effort and spend on innovating and expanding technology investments where they can drive the most value for the business. In addition, our solutions, with their dynamic analytics, key performance indicators, and benchmarking capabilities, allow professionals to optimize investments on an ongoing basis, unlike initiatives based on the advice of consultants or internally developed legacy business processes held together by spreadsheets. |
| • | Plan IT Investments. IT professionals can collaborate with the business to understand their demand for IT services, and then plan efficiently and predictably to meet these demands. |
| • | Transform IT into a Service Provider. Our solutions enable IT to be delivered as a service regardless of whether it is provided by internal resources, cloud providers or other external service providers. Using our solutions, IT leaders can provide transparency into total and unit costs of alternatives and are able to correlate costs to expected value. This empowers business leaders with real, data-driven choices to better align IT and business objectives. |
Our Competitive Strengths
The following strengths are key to our success:
| • | TBM Category Creation and Thought Leadership. We pioneered the TBM category and are its market and thought leader. We believe our efforts and position at the center of the TBM ecosystem allow us to benefit from a network effect, accelerating market adoption of TBM solutions and customer acquisition. |
| • | High Profile Reference Accounts and CIO Engagement. We currently have over 325 customers across various industries, with over 40% of the FORTUNE 100 using our solutions. Our high profile customers and CIO engagement leads to enhanced credibility and better lead generation and conversion. |
| • | Deep IT Business Process Expertise. We have a deep and unique understanding of the role of IT, IT business processes and how IT can maximize business value. We embed this expertise into our purpose-built solutions and these efforts allow us to deliver a compelling value proposition to customers. |
| • | Unique Data Set. We have built a large and unique aggregated data set of customer IT spend across a spectrum of industries, geography and amount of spend. We believe that this data set is the most extensive, granular and up-to-date data set of its kind. This allows us to deliver solutions that provide unique benchmarking capabilities. As our customer base continues to grow, our data set will become deeper and richer, increasing its value. |
| • | Unbiased Approach. Our focus on TBM allows us to provide customers an unbiased assessment of IT solutions offered by providers of infrastructure, applications and services. We believe this has led to deep customer trust. Customers need not be concerned that we have a competing agenda and seek to drive technology decisions that will benefit us economically. |
-4-
Table of Contents
| • | Proven, Enterprise Class Cloud-Based Platform. Our solutions are cloud-based, allowing us to provide enterprise-class software solutions that are regularly updated and highly scalable to customers around the globe. |
Our Growth Strategy
We are pursuing the following strategies to grow our business:
| • | Expand Our Customer Base. We believe the market for TBM solutions is large, growing and under-penetrated. We intend to leverage our strong brand, leadership position, high-profile customer base from a wide range of industries and experienced sales team to target customers with a wide range of IT spend and across industries. |
| • | Further Maximize Our Existing Customer Base. Many customers initially subscribe for a subset of the applications we offer so they can realize rapid time to value by reducing costs or shifting technology investments to where they will be most productive. We seek to generate additional revenue from customers by selling subscriptions to other existing or newly developed applications and modules, and expanding the use of our solutions to additional business units. |
| • | Continue to Foster the IT Leader Community. We will continue to support the TBM Council and leverage our leadership position in a large and growing IT leader community to increase awareness and adoption of TBM solutions. Our relationship with the TBM Council helps us introduce a growing body of CIOs and other leaders to the advantages of TBM and to our solutions, and continues to create a network effect as members exchange information, ideas and experiences with TBM. |
| • | Continue to Deliver Innovative Products. We have made, and will continue to make, significant investments in product development to enhance the capabilities of our existing applications and expand the number of applications on our extensible platform to address customers’ evolving needs. |
| • | Leverage Our Unique Position to Deliver Valuable Benchmarking Data. Over time, we believe there will be substantial opportunities to leverage our large, unique and growing aggregated data set by embedding data insights in our solutions or by selling data to customers or third parties on a standalone basis. |
| • | Expand Internationally. We have a growing presence in Europe and Australia. We believe that there is significant opportunity for our TBM solutions outside of the United States, and we intend to expand our direct sales force and third-party relationships to further penetrate these and other regions. |
| • | Expand into Enterprise Business Management. Many shared services groups, such as legal, facilities and human resources, face similar challenges to IT in making data-driven decisions and lack a software solution to help them do so. We believe a substantial market exists for enterprise business management outside of the IT organization. |
-5-
Table of Contents
Risks Associated with Our Business
Our business is subject to numerous risks and uncertainties, including those highlighted in the section of this prospectus captioned “Risk Factors” immediately following this prospectus summary. Some of these risks are:
| • | We have a history of losses, our revenue growth rate may decline and we expect our costs to increase. As our costs increase, we may not be able to generate sufficient revenue to achieve or maintain profitability in the future. |
| • | The TBM market is relatively new and increasingly competitive and if the market fails to further develop or we are unable to compete effectively, our business, results of operations, financial condition and growth prospects will be harmed. |
| • | If we fail to acquire new customers, convince our existing customers to adopt our solutions, renew their subscriptions and purchase additional subscriptions, or to adapt our solutions to changing market dynamics and customer preferences, or to achieve increased market acceptance of our TBM solutions, our business, results of operations, financial condition and growth prospects will be harmed. |
| • | We have a limited operating history, which makes it difficult to predict our future operating results. Our quarterly operating results may fluctuate and be unpredictable, and because we recognize revenue from subscriptions ratably over the term of the agreement, near-term changes in sales may not be reflected immediately in our operating results. |
| • | We may not achieve anticipated revenue growth from expanding our sales force or from our development efforts, if at all. |
| • | The market in which we participate is increasingly competitive, and if we do not compete effectively, our operating results could be harmed. |
Corporate Information
We were incorporated in Delaware in October 2007. Our principal executive offices are located at 11100 NE 8th Street, Suite 600, Bellevue, Washington 98004. Our telephone number is (866) 470-0320. Our website address is www.apptio.com. Information contained on, or that can be accessed through, our website does not constitute part of this prospectus and inclusions of our website address in this prospectus are inactive textual references only.
Unless the context indicates otherwise, as used in this prospectus, the terms “Apptio,” “the Company,” “we,” “us” and “our” refer to Apptio, Inc. and its subsidiaries, Apptio Europe Limited, Apptio GmbH, Apptio Nordic ApS, Apptio NL B.V., Apptio Pty Ltd and Apptio Technology Canada Ltd. We use “APPTIO®”, “APPTIO TBM UNIFIED MODEL®”, “ATUM®”, the Dissolving Circle Logo Design and other marks as trademarks in the United States and other countries. This prospectus contains references to our trademarks and to those belonging to other entities. Solely for convenience, trademarks and trade names referred to in this prospectus, including logos, artwork and other visual displays, may appear without the ® or ™ symbols, but such references are not intended to indicate in any way that we will not assert, to the fullest extent under applicable law, our rights or the rights of the applicable licensor to these trademarks and trade names. We do not intend our use or display of other entities’ trade names or trademarks to imply a relationship with, or endorsement or sponsorship of us by, any other entity.
-6-
Table of Contents
Additionally, we are an “emerging growth company” as defined in the Jumpstart Our Business Startups Act, or the JOBS Act, and therefore we may take advantage of certain exemptions from various public company reporting requirements, including not being required to have our internal control over financial reporting audited by our independent registered public accounting firm pursuant to Section 404 of the Sarbanes-Oxley Act of 2002, or the Sarbanes-Oxley Act, reduced disclosure obligations regarding executive compensation in our periodic reports and proxy statements and exemptions from the requirements of holding a nonbinding advisory vote on executive compensation and any golden parachute payments. In addition, the JOBS Act provides that an “emerging growth company” can delay adopting new or revised accounting standards until such time as those standards apply to private companies. We have elected to avail ourselves of this exemption and, therefore, we will not be subject to the same implementation timing of new or revised accounting standards as other public companies that are not “emerging growth companies” until these standards apply to private companies unless we elect to early adopt as permitted by the relevant guidance for private companies.
-7-
Table of Contents
| Class A common stock offered by us |
6,000,000 shares. |
| Class A common stock to be outstanding after this offering |
6,000,000 shares (or 6,900,000 shares if the underwriters exercise their option to purchase additional shares in full). |
| Class B common stock to be outstanding after this offering |
31,285,839 shares. |
| Total Class A common stock and Class B common stock to be outstanding after this offering |
37,285,839 shares. |
| Option to purchase additional shares of Class A common stock from us |
900,000 shares. |
| Use of proceeds |
We estimate that the net proceeds from the sale of shares of Class A common stock in this offering will be approximately $74.8 million (or approximately $86.5 million if the underwriters exercise their option to purchase additional shares in full), based upon the assumed initial price to public of $14.00 per share, the midpoint of the estimated offering price range set forth on the cover page of this prospectus, and after deducting underwriting discounts and commissions and estimated offering expenses payable by us. |
Each $1.00 increase (decrease) in the assumed initial price to public of $14.00 per share, would increase (decrease) the net proceeds to us from this offering by approximately $5.6 million, assuming that the number of shares offered by us, as set forth on the cover page of this prospectus, remains the same, and after deducting underwriting discounts and commissions and estimated offering expenses payable by us. Each increase (decrease) of 500,000 in the number of shares offered by us would increase (decrease) the net proceeds to us from this offering by approximately $6.5 million, assuming that the assumed initial price to public remains the same, and after deducting underwriting discounts and commissions and estimated offering expenses payable by us. We do not expect that a change in the initial price to public or the number of shares by these amounts would have a material effect on our uses of the proceeds from this offering, although it may accelerate the time at which we will need to seek additional capital.
| We intend to use the net proceeds from this offering to repay $20.2 million principal and pre-payment fees for amounts borrowed under our credit facilities, and the remainder for working capital and other general corporate purposes, including making investments in our sales, marketing, professional services and product development organizations. |
-8-
Table of Contents
| Additionally, we may choose to expand our current business through acquisitions of or investments in other complementary businesses, technologies, or other assets. However, we currently have no agreements or commitments with respect to any such acquisitions or investments. See the section of this prospectus captioned “Use of Proceeds” for additional information. |
| Voting rights |
Shares of Class A common stock are entitled to one vote per share. |
| Shares of Class B common stock are entitled to 10 votes per share. |
| Holders of Class A common stock and Class B common stock will generally vote together as a single class, unless otherwise required by law or our certificate of incorporation. The holders of our outstanding Class B common stock will hold approximately 98% of the voting power of our outstanding capital stock following this offering and will have the ability to control the outcome of matters submitted to our stockholders for approval, including the election of our directors and the approval of any change in control transaction. See the sections of this prospectus captioned “Principal Stockholders” and “Description of Capital Stock” for additional information. |
| Trading symbol |
“APTI”. |
Prior to the closing of this offering, we had one class of common stock. Upon the closing of this offering, we will have authorized a new class of Class A common stock and a new class of Class B common stock. All currently outstanding shares of common stock and convertible preferred stock (including shares issuable upon the exercise of the warrants described below) will convert into shares of new Class B common stock. In addition, all currently outstanding options to purchase shares of capital stock will become exercisable for shares of new Class B common stock.
The number of shares of common stock to be outstanding following this offering is based on 31,285,839 shares of common stock outstanding as of June 30, 2016, and excludes:
| • | 11,394,824 shares of Class B common stock issuable upon exercise of options outstanding as of June 30, 2016, at a weighted-average exercise price of $9.28 per share; |
| • | 551,548 shares of Class B common stock reserved for future issuance under our 2007 Stock Plan as of June 30, 2016; provided, however, that upon the effectiveness of the registration statement of which this prospectus forms a part, our 2007 Stock Plan will terminate so that no further awards may be granted under our 2007 Stock Plan; |
| • | 222,920 shares of Class B common stock reserved for future issuance under our 2011 Executive Equity Incentive Plan as of June 30, 2016; provided, however, that upon the effectiveness of the registration statement of which this prospectus forms a part, our 2011 Executive Equity Incentive Plan will terminate so that no further awards may be granted under our 2011 Executive Equity Incentive Plan; |
| • | an aggregate of 4,550,000 shares of Class A common stock reserved for future issuance under our 2016 Equity Incentive Plan and 2016 Employee Stock Purchase Plan, each of |
-9-
Table of Contents
| which will become effective on the business day immediately prior to the date of effectiveness of the registration statement of which this prospectus forms a part; and |
| • | 75,214 shares of Class B common stock issuable upon the exercise of warrants outstanding as of June 30, 2016 at a weighted-average exercise price of $9.52 per share, after conversion of the convertible preferred stock. |
Unless otherwise indicated, other than in our consolidated financial statements, this prospectus reflects and assumes the following:
| • | the reclassification of outstanding common stock into an equivalent number of shares of newly authorized Class B common stock, which will occur immediately prior to the closing of this offering, and the authorization of Class A common stock; |
| • | the conversion of all outstanding shares of convertible preferred stock into an aggregate of 18,239,475 shares of Class B common stock immediately prior to the closing of this offering; |
| • | the filing of the certificate of incorporation immediately prior to the closing of this offering; and |
| • | no exercise by the underwriters of their option to purchase up to an additional 900,000 shares of Class A common stock. |
-10-
Table of Contents
Summary Consolidated Financial Data
We derived the following summary consolidated statements of operations data for the years ended December 31, 2014 and 2015 from audited consolidated financial statements appearing elsewhere in this prospectus. We derived the following summary consolidated statement of operations data for the year ended December 31, 2013 from audited consolidated financial statements not included in this prospectus. We derived the following summary consolidated statements of operations data for the six months ended June 30, 2015 and 2016 and the summary consolidated balance sheet data as of June 30, 2016 from unaudited consolidated financial statements appearing elsewhere in this prospectus. In the opinion of management, the unaudited consolidated financial statements reflect all adjustments, which include normal recurring adjustments, necessary for a fair presentation of the financial statements. Historical results are not necessarily indicative of the results that may be expected in the future and the results for the six months ended June 30, 2016 are not necessarily indicative of the results that may be expected for the full year or any other period. The summary financial data set forth below should be read together with the financial statements and the related notes to those statements, as well as the sections of this prospectus captioned “Selected Consolidated Financial Data” and “Management’s Discussion and Analysis of Financial Condition and Results of Operations.”
| Year Ended December 31, | Six Months Ended June 30, |
|||||||||||||||||||
| 2013 | 2014 | 2015 | 2015 | 2016 | ||||||||||||||||
| (in thousands, except per share amounts) |
||||||||||||||||||||
| Consolidated Statements of Operations Data |
||||||||||||||||||||
| Revenue: |
||||||||||||||||||||
| Subscription |
$ | 54,206 | $ | 78,719 | $ | 99,924 | $ | 47,242 | $ | 61,681 | ||||||||||
| Professional services |
19,562 | 27,896 | 29,327 | 14,913 | 13,941 | |||||||||||||||
|
|
|
|
|
|
|
|
|
|
|
|||||||||||
| Total revenue |
73,768 | 106,615 | 129,251 | 62,155 | 75,622 | |||||||||||||||
| Cost of revenue: |
||||||||||||||||||||
| Subscription(1) |
8,325 | 14,686 | 23,457 | 11,142 | 13,039 | |||||||||||||||
| Professional services(1) |
19,034 | 25,731 | 25,720 | 13,036 | 12,712 | |||||||||||||||
|
|
|
|
|
|
|
|
|
|
|
|||||||||||
| Total cost of revenue(1) |
27,359 | 40,417 | 49,177 | 24,178 | 25,751 | |||||||||||||||
|
|
|
|
|
|
|
|
|
|
|
|||||||||||
| Gross profit |
46,409 | 66,198 | 80,074 | 37,977 | 49,871 | |||||||||||||||
|
|
|
|
|
|
|
|
|
|
|
|||||||||||
| Operating expenses: |
||||||||||||||||||||
| Research and development(1) |
17,804 | 23,099 | 30,553 | 14,674 | 17,057 | |||||||||||||||
| Sales and marketing(1) |
43,415 | 60,775 | 71,337 | 33,274 | 35,956 | |||||||||||||||
| General and administrative(1) |
8,597 | 14,245 | 17,763 | 7,698 | 10,684 | |||||||||||||||
|
|
|
|
|
|
|
|
|
|
|
|||||||||||
| Total operating expenses |
69,816 | 98,119 | 119,653 | 55,646 | 63,697 | |||||||||||||||
|
|
|
|
|
|
|
|
|
|
|
|||||||||||
| Loss from operations |
(23,407 | ) | (31,921 | ) | (39,579 | ) | (17,669 | ) | (13,826 | ) | ||||||||||
| Other income (expense): |
||||||||||||||||||||
| Interest (expense) income and other, net |
(51 | ) | 2 | (18 | ) | 19 | (434 | ) | ||||||||||||
| Foreign exchange loss |
(163 | ) | (697 | ) | (1,301 | ) | (607 | ) | (407 | ) | ||||||||||
|
|
|
|
|
|
|
|
|
|
|
|||||||||||
| Loss before provision for income taxes |
(23,621 | ) | (32,616 | ) | (40,898 | ) | (18,257 | ) | (14,667 | ) | ||||||||||
| Provision for income taxes |
(114 | ) | (256 | ) | (109 | ) | (149 | ) | (214 | ) | ||||||||||
|
|
|
|
|
|
|
|
|
|
|
|||||||||||
| Net loss |
$ | (23,735 | ) | $ | (32,872 | ) | $ | (41,007 | ) | $ | (18,406 | ) | $ | (14,881 | ) | |||||
|
|
|
|
|
|
|
|
|
|
|
|||||||||||
| Net loss per share attributable to common stockholders, basic and diluted |
$ | (2.11 | ) | $ | (2.72 | ) | $ | (3.24 | ) | $ | (1.47 | ) | $ | (1.14 | ) | |||||
|
|
|
|
|
|
|
|
|
|
|
|||||||||||
| Weighted-average shares used to compute net loss per share attributable to common stockholders, basic and diluted |
11,256 | 12,080 | 12,653 | 12,485 | 13,016 | |||||||||||||||
|
|
|
|
|
|
|
|
|
|
|
|||||||||||
| Pro forma net loss per share attributable to common stockholders, basic and diluted(2) |
$ | (1.33 | ) | $ | (0.48 | ) | ||||||||||||||
|
|
|
|
|
|||||||||||||||||
| Weighted-average shares used to compute pro forma net loss per share attributable to common stockholders, basic and diluted(2) |
30,893 | 31,256 | ||||||||||||||||||
|
|
|
|
|
|||||||||||||||||
-11-
Table of Contents
| (1) | Includes stock-based compensation expense as follows: |
| Year Ended December 31, | Six Months Ended June 30, |
|||||||||||||||||||
| 2013 | 2014 | 2015 | 2015 | 2016 | ||||||||||||||||
| (in thousands) | ||||||||||||||||||||
| Cost of revenue: |
||||||||||||||||||||
| Subscription |
$ | 75 | $ | 220 | $ | 482 | $ | 196 | $ | 332 | ||||||||||
| Professional services |
314 | 609 | 738 | 395 | 367 | |||||||||||||||
| Research and development |
836 | 1,465 | 2,283 | 1,160 | 1,267 | |||||||||||||||
| Sales and marketing |
1,047 | 2,006 | 2,477 | 1,210 | 1,441 | |||||||||||||||
| General and administrative |
789 | 1,466 | 1,835 | 894 | 1,008 | |||||||||||||||
|
|
|
|
|
|
|
|
|
|
|
|||||||||||
| Total stock-based compensation |
$ | 3,061 | $ | 5,766 | $ | 7,815 | $ | 3,855 | $ | 4,415 | ||||||||||
|
|
|
|
|
|
|
|
|
|
|
|||||||||||
| (2) | See Note 8 of the notes to our consolidated financial statements included in this prospectus for an explanation of the method used to calculate basic and diluted net loss per share and pro forma net loss per share attributable to common stockholders and the weighted-average number of shares used in the computation of the per share amounts. |
| As of June 30, 2016 | ||||||||||||
| Actual | Pro Forma(1) | Pro Forma As Adjusted(2) |
||||||||||
| (in thousands) | ||||||||||||
| Consolidated Balance Sheet Data |
||||||||||||
| Cash and cash equivalents |
$ | 42,052 | $ | 42,052 | $ | 96,672 | ||||||
| Working capital, excluding deferred revenue |
71,965 | 71,965 | 127,132 | |||||||||
| Total assets |
107,485 | 107,485 | 162,105 | |||||||||
| Deferred revenue, current and non-current |
82,184 | 82,184 | 82,184 | |||||||||
| Long-term debt, current and non-current, net of debt issuance costs |
19,432 | 19,432 | — | |||||||||
| Preferred stock warrant liability |
406 | — | — | |||||||||
| Convertible preferred stock |
133,809 | — | — | |||||||||
| Accumulated deficit |
(183,652 | ) | (183,652 | ) | (184,420 | ) | ||||||
| Total stockholders’ (deficit) equity |
(151,931 | ) | (17,716 | ) | 56,336 | |||||||
| (1) | Reflects (a) the automatic conversion of all outstanding shares of our convertible preferred stock as of June 30, 2016 into an aggregate of 18,239,475 shares of Class B common stock which conversion will occur immediately prior to the closing of this offering, as if such conversion had occurred on June 30, 2016; and (b) the conversion of warrants to purchase 27,321 shares of convertible preferred stock into warrants to purchase 27,321 shares of Class B common stock. |
| (2) | Gives effect to (a) the pro forma adjustments set forth above, (b) the sale and issuance by us of 6,000,000 shares of Class A common stock in this offering at an assumed initial price to public of $14.00 per share, the midpoint of the estimated offering price range set forth on the cover page of this prospectus, after deducting underwriting discounts and commissions and estimated offering expenses payable by us and (c) the application of such proceeds as described in the section of this prospectus captioned “Use of Proceeds.” Each $1.00 increase (decrease) in the assumed initial price to public of $14.00 per share, would increase (decrease) each of cash and cash equivalents, working capital, excluding deferred revenue, total assets and total stockholders’ (deficit) equity by approximately $5.6 million, assuming that the number of shares offered by us, as set forth on the cover page of this prospectus, remains the same, and after deducting underwriting discounts and commissions and estimated offering expenses payable by us. We may also increase or decrease the number of shares we are offering. Each increase (decrease) of 500,000 in the number of shares offered by us would increase (decrease) each of cash and cash equivalents, working capital, excluding deferred revenue, total assets and total stockholders’ (deficit) equity by approximately $6.5 million, assuming that the assumed initial price to public remains the same, and after deducting underwriting discounts and commissions and estimated offering expenses payable by us. The pro forma as adjusted information discussed above is illustrative only and will be adjusted based on the actual initial price to public and other terms of this offering determined at pricing. |
-12-
Table of Contents
Non-GAAP Financial Measures
In addition to our results determined in accordance with U.S. generally accepted accounting principles, or GAAP, we believe the following non-GAAP measure is useful in evaluating our business performance. We regularly review the liquidity measure set forth below.
| Year Ended December 31, | Six Months Ended June 30, |
|||||||||||||||||||
| 2013 | 2014 | 2015 | 2015 | 2016 | ||||||||||||||||
| (in thousands) | ||||||||||||||||||||
| Other Non-GAAP Financial Data: |
||||||||||||||||||||
| Free cash flow(1) |
$ | (15,480 | ) | $ | (24,276 | ) | $ | (18,234 | ) | $ | (8,071 | ) | $ | (3,729 | ) | |||||
| (1) | We define free cash flow as net cash used in operating activities, plus purchases of property and equipment. |
We believe free cash flow facilitates period-to-period comparisons of liquidity. We consider free cash flow to be an important measure because it measures the amount of cash we generate from our operations after our capital expenditures and reflects changes in working capital. We use free cash flow in conjunction with traditional GAAP measures as part of our overall assessment of our liquidity, including the preparation of our annual operating budget and quarterly forecasts, to evaluate the effectiveness of our business strategies and to communicate with our board of directors concerning our liquidity.
Our definitions may differ from the definitions used by other companies and therefore comparability may be limited. In addition, other companies may not publish these or similar metrics. Thus, our free cash flow should be considered in addition to, not as a substitute for, or in isolation from, measures prepared in accordance with GAAP.
We compensate for these limitations by providing investors and other users of our financial information reconciliations of free cash flow to the related GAAP financial measure, net cash used in operating activities. We encourage investors and others to review our financial information in its entirety, not to rely on any single financial measure and to view free cash flow in conjunction with the related GAAP financial measure.
The following table provides a reconciliation of net cash used in operating activities to free cash flow.
| Year Ended December 31, | Six Months Ended June 30, |
|||||||||||||||||||
| 2013 | 2014 | 2015 | 2015 | 2016 | ||||||||||||||||
| (in thousands) | ||||||||||||||||||||
| Net cash used in operating activities |
$ | (11,264 | ) | $ | (17,957 | ) | $ | (10,591 | ) | $ | (3,312 | ) | $ | (1,409 | ) | |||||
| Plus: purchases of property and equipment |
(4,216 | ) | (6,319 | ) | (7,643 | ) | (4,759 | ) | (2,320 | ) | ||||||||||
|
|
|
|
|
|
|
|
|
|
|
|||||||||||
| Free cash flow |
$ | (15,480 | ) | $ | (24,276 | ) | $ | (18,234 | ) | $ | (8,071 | ) | $ | (3,729 | ) | |||||
|
|
|
|
|
|
|
|
|
|
|
|||||||||||
-13-
Table of Contents
Investing in our Class A common stock involves a high degree of risk. Before making an investment decision, you should carefully consider the risks and uncertainties described below, which we believe are the material risks associated with our business and this offering. Our business, financial condition, operating results or growth prospects could be harmed by any of these risks. In that event, the trading price of our Class A common stock could decline due to any of these risks, and you may lose all or part of your investment. In assessing these risks, you should also refer to all of the other information contained in this prospectus, including our financial statements and related notes.
Risks Related to Our Business and Industry
We have a history of losses and we expect our revenue growth rate to decline. As our costs increase, we may not be able to generate sufficient revenue to achieve or maintain profitability in the future.
We incurred net losses of $23.7 million, $32.9 million and $41.0 million in 2013, 2014 and 2015, respectively, and $18.4 million and $14.9 million in the six months ended June 30, 2015 and 2016, respectively. We had an accumulated deficit of $183.7 million at June 30, 2016. We expect that our revenue growth rate will decline over time. We may not be able to generate sufficient revenue to achieve or sustain profitability. We expect to continue to incur losses for the foreseeable future and we expect our costs to increase in future periods as we expend substantial financial and other resources on, among other things:
| • | sales and marketing, including a continued expansion of our direct sales organization which will require time before these investments generate sales results; |
| • | hiring of additional employees for our research and development team to support growth, our technology and datacenter infrastructure, enhancements to our cloud architecture, improved disaster recovery protection, increasing security, compliance and operations expenses, and expenses related to required certifications and third-party attestations; |
| • | other software development, including enhancements and modifications related to our business applications, including investments in our software development team; |
| • | international expansion in an effort to increase our customer base and sales; |
| • | continued growth of the customer success team; and |
| • | general and administration, including significantly increasing expenses in accounting and legal related to the increase in the sophistication and resources required for public company compliance and other work arising from the growth and maturity of the company. |
These expenditures may not result in additional revenue or the growth of our business. If we fail to continue to grow revenue or to achieve or sustain profitability, the market price of our Class A common stock could decline.
We have a limited operating history, which makes it difficult to evaluate our prospects and future operating results.
We were incorporated in 2007 and introduced our first solution in 2008. Our limited operating history makes our ability to forecast future operating results difficult and subjects us to a number of uncertainties, including our ability to plan and model future growth. Our revenue grew 46%, 45% and
-14-
Table of Contents
21% in 2013, 2014 and 2015, respectively, compared to the prior year, and by 22% in the six months ended June 30, 2016 compared to the same period in the prior year; however, our historical revenue growth is not necessarily indicative of our future performance. Our revenue growth is expected to decline in future periods due to a number of reasons, which may include the maturation of our business, increase in overall revenue over time, slowing demand for our applications, increasing competition, a decrease in the growth of the markets in which we compete, or if we fail, for any reason, to continue to capitalize on growth opportunities, a decrease in our renewal rates, or a decline in available opportunities as a result of our increased market penetration in one or more of our markets.
We have encountered and will continue to encounter risks and uncertainties frequently experienced by growing companies in rapidly changing industries, such as determining appropriate investments of our limited resources, market adoption of our current and future applications, competition from other companies, acquiring and retaining customers, hiring, integrating, training and retaining skilled personnel, developing new applications, determining prices and contract terms for our applications, and unforeseen expenses and challenges in forecasting accuracy. If our assumptions regarding these risks and uncertainties, which we use to plan our business, are incorrect or change, or if we do not address these risks successfully, our prospects, operating results and business could be harmed.
If the TBM market fails to develop, or we are unable to maintain our leadership within that market category, our business, results of operations, financial condition and growth prospects could be harmed.
Our business model depends upon the development and adoption of the market for TBM solutions and our leadership within that market category. We derive and expect to continue to derive for some period of time the majority of revenue and cash flows from our core TBM solutions. The TBM market is relatively new and is evolving rapidly, and overall market acceptance of the importance of TBM and our solutions is critical to our continued success. If the market for TBM solutions does not continue to grow, or grows more slowly than we expect, or if the market for TBM solutions does not develop as we anticipate, our operating results would be harmed. In addition, successful market adoption will depend in part on our ability to correctly anticipate, identify and build the key features, functions, reports, metric selection, and packaging that is most useful and attractive to the market, all while maintaining sufficient flexibility with the platform as needed to accommodate customer-specific needs.
We derive, and expect to continue to derive, substantially all of our revenue and operating cash flows from TBM solutions and related professional services. If we fail to adapt our solutions to changing market dynamics and customer preferences or to achieve increased market acceptance of our TBM solutions, our business, results of operations, financial condition, and growth prospects would be harmed.
We derive, and expect to continue to derive, substantially all of our revenue and cash flows from TBM solutions and related professional services. As such, the market acceptance of TBM solutions is critical to our success. Demand for our TBM solutions is affected by a number of factors, many of which are beyond our control, such as continued market acceptance of our solutions by customers for existing and new use cases, the timing of development and release of new applications, features, and functionality introduced by our competitors, technological change, and growth or contraction in our addressable market. Although we may expand our efforts in the marketplace beyond the TBM category, there can be no certainty that any such expansion will generate returns capable of offsetting the costs associated with any such expansion. You should consider our business and prospects based on our current solutions within the TBM category and, and in light of the various challenges we and TBM as a category face, including those discussed in this “Risk Factors” section.
-15-
Table of Contents
Our business model heavily depends on the acquisition of new customers, adoption by current customers of our solutions, renewals of their subscriptions and the purchase of additional subscriptions from us.
In order to maintain or improve our operating results, we depend on the acquisition of new customers, the adoption of additional applications by existing customers and the decision by existing and new customers to renew their subscriptions upon the expiration of their current contract term. Our contracts typically vary in length between one and three years and our customers have no obligation to renew their subscriptions after the expiration of their initial subscription periods. Our customers may elect not to renew, may seek to renew for lower subscription amounts or for shorter contract lengths and may choose to renew for the same or fewer applications and modules over time. Our renewal rates may decline or fluctuate as a result of a number of factors, including leadership changes within our customers resulting in loss of sponsorship, limited customer resources, pricing changes by us or our competitors, adoption and utilization of our solutions by our customers, customer satisfaction with our applications, the acquisition of our customers by other companies, procurement or budgetary decisions from legislative or other regulatory bodies, and deteriorating general economic conditions. To the extent our customer base continues to grow, renewals and the subscriptions to additional applications and modules by renewing customers will become an increasingly important part of our results. If our customers do not renew their subscriptions for our applications, or decrease the amount they spend with us, revenue will decline and our business will be harmed.
Because our recent growth has resulted in the rapid expansion of our business, we do not have a long history upon which to base forecasts of customer renewal rates, customer upgrade rates or future revenue. As a result, our future operating results may be significantly below the expectations of investors, which could harm the market price of our Class A common stock.
If we fail to effectively develop and expand our sales and marketing capabilities, our ability to increase our customer base and increase acceptance of our TBM solutions could be harmed.
To increase the number of customers and increase the market acceptance of our solutions, we will need to expand our sales and marketing operations, including our domestic and international sales force. We will continue to dedicate significant resources to sales and marketing programs. We believe that there is significant competition for direct sales personnel with the sales skills and technical knowledge that we require. Our ability to achieve significant revenue growth in the future will depend, in large part, on our success in recruiting, training and retaining a sufficient number of direct sales personnel. New hires require significant training and time before they achieve full productivity, particularly in new sales territories. Our recent hires and planned hires may not become as productive as quickly as we would like, and we may be unable to hire or retain sufficient numbers of qualified individuals in the future in the markets where we do business. The effectiveness of our sales and marketing has also varied over time and, together with the effectiveness of any partners or resellers we may engage, may vary in the future. Our business will be harmed if our efforts do not generate a correspondingly significant increase in revenue. We may not achieve anticipated revenue growth from expanding our sales force if we are unable to hire, develop and retain talented sales personnel, if our new sales personnel are unable to achieve desired productivity levels in a reasonable period of time, or if our sales and marketing programs are not effective.
-16-
Table of Contents
We may experience quarterly fluctuations in our operating results due to a number of factors, which makes our future results difficult to predict and could cause our operating results to fall below expectations.
Our quarterly operating results have fluctuated in the past and we expect them to fluctuate in the future due to a variety of factors, many of which are outside of our control. As a result, our past results may not be indicative of our future performance, and comparing our operating results on a period-to-period basis may not be meaningful. In addition to the other risks described in this prospectus, factors that may affect our quarterly operating results include:
| • | changes in spending on TBM solutions by our current or prospective customers; |
| • | pricing our applications effectively so that we are able to attract and retain customers without compromising our operating results; |
| • | attracting new customers and increasing existing customers’ use of our solutions; |
| • | unexpected sales and transaction execution delays; |
| • | customer renewal rates and the amounts for which agreements are renewed; |
| • | awareness of our brand; |
| • | changes in the competitive dynamics of our market, including consolidation among competitors or customers and the introduction of new applications or capabilities; |
| • | changes to the commission plans, quotas and other compensation-related metrics for our sales representatives; |
| • | the amount and timing of payment for operating expenses, particularly research and development, sales and marketing expenses and employee benefit expenses; |
| • | our ability to manage our existing business and future growth, including increases in the number of customers for our solutions and the introduction and adoption of our solutions in the United States and globally; |
| • | unforeseen costs and expenses related to the expansion of our business, operations and infrastructure, including disruptions in our hosting network infrastructure and privacy and data security; |
| • | the level of international sales and the pricing of sales; |
| • | foreign currency exchange rate fluctuations; and |
| • | general economic and political conditions in our domestic and international markets. |
We may not be able to accurately forecast the amount and mix of future subscriptions, size or duration of contracts, revenue and expenses and, as a result, our operating results may fall below our estimates or the expectations of public market analysts and investors. If our revenue or operating results fall below the expectations of investors, or below any estimates we may provide, the market price of our Class A common stock could decline.
-17-
Table of Contents
We target sales efforts at enterprise customers and the length, cost and uncertainty associated with sales cycles may result in fluctuations in our operating results and our failure to achieve the expectations of investors.
We target sales efforts at enterprises and face long sales cycles, complex customer requirements, substantial upfront sales costs, and a relatively low and difficult to predict volume of sales on a quarter-by-quarter basis. This makes it difficult to predict with certainty our sales and related operating performance in any given period. Our typical sales cycle is approximately six months, but is variable and difficult to predict and can be longer. Customers often undertake a prolonged evaluation of our solutions, including assessing their own readiness, scoping the professional services involved, and comparing our solutions to products offered by our competitors and their ability to solve the problem internally. Moreover, our customers often begin to deploy our solutions on a limited basis, but nevertheless demand extensive configuration, integration services and pricing concessions, which increase our upfront investment in the sales effort with no guarantee that these customers will deploy our solutions widely enough across their organization to justify our substantial upfront investment. Adherence to our financial plan in part depends on a predictable growth rate in the acquisition of new customers that represent high annual contract value, while additional growth and enhanced predictability in part depends on an increased volume of new customers with a relatively lower annual contract value. Our financial performance and the predictability of our quarterly financial results may be harmed by intermittent failures to secure the higher value enterprise agreements, or increase the volume of transactions overall, according to our forecasts, and depends in large part on the successful execution of our direct sales team. In addition, because of the relatively small and tightly knit nature of the community of IT leaders within the enterprises that we sell into, our business is vulnerable to negative feedback or opinions even if held by a few influential leaders within this community.
Additionally, our quarterly sales cycles are generally more heavily weighted toward the end of the quarter with an increased volume of sales in the last few weeks of the quarter. This could negatively impact the timing of recognized revenue and billings, cash collections and delivery of professional services in subsequent periods. Furthermore, the concentration of contract negotiations in the last few weeks of the quarter could require us to expend more in the form of compensation for additional sales, legal and finance employees and contractors. Compression of sales activity to the end of the quarter also greatly increases the likelihood that sales cycles will extend beyond the quarter in which they are forecasted to close for some sizeable transactions, which will harm forecasting accuracy and adversely impact billings and new customer acquisition metrics for the quarter in which they are forecasted to close.
Because we recognize revenue from subscriptions ratably over the term of the agreement, near-term changes in sales may not be reflected immediately in our operating results.
We offer our applications primarily through multi-year subscription agreements, which typically vary in length between one and three years. All subscription fees that are billed in advance of service are recorded in deferred revenue. Subscription revenue is recognized ratably over the subscription term. As a result, most of the revenue that we report in each period is derived from the recognition of deferred revenue relating to subscriptions entered into during previous periods. A decline in new or renewed subscriptions in any one quarter is not likely to have a material impact on results for that quarter. However, declines would negatively affect revenue and deferred revenue balances in future periods, and the effect of significant downturns in sales and market acceptance of our applications, and potential changes in our rate of renewals, may not be fully reflected in our results of operations until future periods. Our subscription model also makes it difficult for us to rapidly increase our total revenue through additional sales in any period, as revenue from new customers is recognized over the applicable subscription term.
-18-
Table of Contents
Because we expense commissions associated with subscriptions to our applications immediately upon the execution of a subscription agreement with a customer, our operating income in any period may not be indicative of our financial health and future performance.
We expense commissions paid to sales personnel in the period in which we enter into an agreement for the subscription to our applications. In contrast, we recognize the revenue associated with a subscription to our applications ratably over the related subscription period. Although we believe higher sales is a positive indicator of the long-term health of our business, higher sales increases our operating expenses and could decrease earnings in any particular period. Thus, we may report poor operating results due to higher sales commissions in a period in which we experience strong sales of our applications. Alternatively, we may report better operating results due to the reduction of sales commissions in a period in which we experience a slowdown in sales. Therefore, you should not necessarily rely on our operating income during any one quarter as an indication of our financial health and potential future performance.
If we fail to attract and retain additional qualified personnel we may be unable to execute our business strategy.
To execute our business strategy, we must attract and retain highly qualified personnel. In particular, we compete with many other companies for software developers with high levels of experience in designing, developing and managing cloud-based software, as well as for skilled product development, marketing, sales and operations professionals, and we may not be successful in attracting and retaining the professionals we need, in particular in the Seattle, Washington area where we are headquartered. We have experienced, and we expect to continue to experience, difficulty in hiring and retaining highly skilled employees with appropriate qualifications which may, among other things, impede our ability to execute our software development and sales strategies. Many of the companies with which we compete for experienced personnel are more well known and have greater resources than we do. In addition, in making employment decisions, particularly in the software industry, job candidates often consider the value of the stock options or other equity incentives they are to receive in connection with their employment. If the price of our stock declines, or experiences significant volatility, our ability to attract or retain qualified employees will be adversely affected. If we fail to attract new personnel or fail to retain and motivate our current personnel, our growth prospects could be harmed.
The market in which we participate is increasingly competitive, and if we do not compete effectively, our operating results could be harmed.
The market for TBM solutions is relatively new and rapidly evolving. In many cases, our primary competition is the use of legacy spreadsheet-based business processes, or occasionally we encounter either custom software developed, or general purpose business intelligence solutions repurposed, by in-house IT and finance departments of our potential customers to meet specific business needs. As we look to sell our solutions to potential customers with existing internal solutions, we must convince internal stakeholders that our TBM solutions are superior to the legacy solutions that the organization has previously adopted. If we are unable to effectively convince internal stakeholders at our prospective customers to abandon their legacy solutions, our business, results of operations, financial condition and cash flows could be materially and adversely affected.
Larger companies, such as VMware and ServiceNow, provide a suite of products and services that includes TBM capabilities. These competitors have greater name recognition, much longer operating histories, more and better-established customer relationships, larger sales forces, larger marketing and software development budgets and significantly greater resources than we do. These large vendors commonly have an enterprise-wide license agreement in place with the Fortune 2000 enterprise company customer base and are able to leverage that license to easily transact for their
-19-
Table of Contents
services. In some cases, these large vendors may be willing to provide their competing software for free as part of enterprise-wide agreements that include other products or services, which has resulted in pricing pressures and lost sales. Further, such large vendors frequently benefit from existing system integrator and other go-to-market relationships that facilitate their sales and marketing efforts, and that can be easily redirected to competition with us in the TBM market. In addition, certain of our competitors may be able to respond more quickly and effectively than we can to new or changing opportunities, technologies, standards, or customer requirements, or simply accelerate product development and improvements at greater velocity.
Several specialized companies target the TBM market through solutions that are tailored to a specific TBM use case or industry. Some of our principal competitors in these situations offer their products or services at a lower price, which has resulted in pricing pressures and lost sales. Potential customers with discrete and immediate needs that may be addressed by these niche solutions may choose to deploy these solutions instead of an offering from our integrated suite of TBM solutions. If we fail to compete effectively against these more specific, niche providers of TBM solutions, our business will be harmed.
We expect competition to intensify in the future. We expect that the large software vendors who currently do not have an offering in the TBM category, some of which operate in adjacent product categories today, may in the future bring such a solution to market through product development, acquisitions or other means. Such vendors would potentially benefit from the same advantages described above regarding our existing larger competitors, but perhaps on an even greater scale. Also, a simpler solution could gain traction in the market and acceptance by medium sized businesses, which may result in downward pressure on our pricing and potentially a decrease in market share and market opportunity for us.
If we fail to adapt and respond effectively to rapidly changing technology, evolving industry standards and changing customer needs or requirements, our solutions may become less competitive.
Our success depends on our ability to adapt and enhance our solutions. To attract new customers and increase revenue from existing customers, we need to continue to enhance and improve our solutions, capabilities and enhancements to meet customer needs at prices that our customers are willing to pay. Such efforts will require adding new functionality and responding to technological advancements, which will increase our research and development costs. If we are unable to develop solutions that address customers’ needs, or enhance and improve our offerings in a timely manner, we may not be able to maintain or increase market acceptance of our solutions. Further, many of our existing and potential future competitors expend a considerably greater amount of funds on their research and development programs, and those that do not may be acquired by larger companies that would allocate greater resources to competitors’ research and development programs. If we fail to maintain adequate research and development resources or compete effectively with the research and development programs of our competitors our business could be harmed. Our ability to grow is also subject to the risk of future disruptive technologies. If new technologies emerge that are able to deliver TBM solutions at lower prices, more efficiently, more conveniently or more securely, such technologies could adversely affect our ability to compete.
We may not receive significant revenue from our current development efforts for several years, if at all.
Developing software applications is expensive and the investment in product development often involves a long return on investment cycle. We have made and expect to continue to make significant investments in development and related product opportunities. Accelerated product
-20-
Table of Contents
introductions and short product life cycles require high levels of expenditures that could adversely affect our operating results if not offset by revenue increases. We believe that we must continue to dedicate a significant amount of resources to our development efforts to maintain our competitive position. However, we may not receive significant revenue from these investments for several years, if at all.
Our planned further expansion of our business outside the United States exposes us to risks associated with international operations.
Our growth strategy involves the further expansion of our operations and customers located outside of the United States. In 2015 and for the six months ended June 30, 2016, 22% and 24%, respectively, of our revenue was derived from customers located outside North America, primarily from customers in Europe. A key element of our growth strategy is to expand our international operations and develop a worldwide customer base. While we have initiated efforts to expand our business into Asia-Pacific through a limited presence in Australia and Singapore, our investment may never be recouped. Our current international operations and future initiatives will involve a variety of risks, including:
| • | the need to make significant investments in people, solutions and infrastructure, typically well in advance of revenue generation; |
| • | the need to localize and adapt our application for specific countries, including translation into foreign languages and associated expenses; |
| • | potential changes in public or customer sentiment regarding cloud-based services or the ability of non-local enterprises to provide adequate data protection, particularly in the European Union; |
| • | technical or latency issues in delivering our applications; |
| • | dependence on certain third parties, including resellers with whom we do not have extensive experience; |
| • | the lack of reference customers and other marketing assets in regional markets that are new or developing for us, as well as other adaptations in our market generation efforts that we may be slow to identify and implement; |
| • | unexpected changes in regulatory requirements, taxes or trade laws; |
| • | differing labor regulations, especially in the European Union, where labor laws are generally more advantageous to employees as compared to the United States, including deemed hourly wage and overtime regulations in these locations; |
| • | challenges inherent in efficiently managing an increased number of employees over large geographic distances, including the need to implement appropriate systems, policies, benefits and compliance programs; |
| • | difficulties in maintaining our company culture with a dispersed and distant workforce; |
| • | difficulties in managing a business in new markets with diverse cultures, languages, customs, legal systems, alternative dispute systems and regulatory systems; |
-21-
Table of Contents
| • | currency exchange rate fluctuations and the resulting effect on our revenue and expenses, and the cost and risk of entering into hedging transactions if we choose to do so in the future; |
| • | limitations on our ability to reinvest earnings from operations in one country to fund the capital needs of our operations in other countries; |
| • | limited or insufficient intellectual property protection; |
| • | political instability or terrorist activities; |
| • | requirements to comply with foreign privacy and information security laws and regulations and the risks and costs of non-compliance; |
| • | likelihood of potential or actual violations of domestic and international anticorruption laws, such as the U.S. Foreign Corrupt Practices Act and the U.K. Bribery Act, or of U.S. and international export control and sanctions regulations, which likelihood may increase with an increase of sales or operations in foreign jurisdictions and operations in certain industries; |
| • | requirements to comply with U.S. export control and economic sanctions laws and regulations and other restrictions on international trade; |
| • | likelihood that the United States and other governments and their agencies impose sanctions and embargoes on certain countries, their governments and designated parties, which may prohibit the export of certain technology, products, and services to such persons; and |
| • | adverse tax burdens and foreign exchange controls that could make it difficult to repatriate earnings and cash should we desire to do so. |
Our limited experience in operating our business internationally increases the risk that any potential future expansion efforts that we may undertake will not be successful. If we invest substantial time and resources to expand our international operations and are unable to do so successfully and in a timely manner, our business and operating results will be harmed.
Increased sales to customers outside the United States and/or paid for in currency other than the U.S. dollar exposes us to potential currency exchange losses.
As our international sales and operations increase, so too will the number and significance of transactions, including intercompany transactions, occurring in currencies other than the U.S. dollar. In addition, our international subsidiaries may begin to maintain or accumulate assets that are denominated in currencies other than the functional operating currencies of these entities. Accordingly, changes in the value of foreign currencies relative to the U.S. dollar can affect our revenue and operating results due to transactional and translational remeasurement that is reflected in our earnings. We do not currently maintain a program to hedge transactional exposures in foreign currencies. However, in the future, we may use derivative instruments, such as foreign currency forward and option contracts, to hedge certain exposures to fluctuations in foreign currency exchange rates. The use of such hedging activities may not offset any or more than a portion of the adverse financial effects of unfavorable movements in foreign exchange rates over the limited time the hedges are in place. Moreover, the use of hedging instruments may introduce additional risks if we are unable to structure effective hedges with such instruments. Additionally, our license fees are largely based on our customers’ anticipated spend managed by our solutions expressed in U.S. dollars, which fee construct may increase the exposure of our revenue to currency fluctuations.
-22-
Table of Contents
If we fail to manage our rapid growth effectively or our business does not grow as we expect, our operating results may suffer.
Our employee base and operations have grown substantially in a relatively short period of time. Our full-time employee base grew from 628 employees as of June 30, 2015 to 694 employees as of June 30, 2016. Our growth has placed, and will continue to place, a significant strain on our operational, financial and management infrastructure. We anticipate further increases in headcount will be required to support increases in our application offerings and continued expansion. To manage this growth effectively, we must continue to improve operational, financial and management systems and controls by, among other things:
| • | effectively attracting, training and integrating a large number of new employees, particularly technical personnel and members of our management and sales teams; |
| • | further improving key business systems, processes and IT infrastructure to support our business needs; |
| • | enhancing information and communication systems to ensure that employees are well-coordinated and can effectively communicate with each other and customers; and |
| • | improving internal control over financial reporting and disclosure controls and procedures to ensure timely and accurate reporting of operational and financial results. |
If we fail to effectively manage expansion or implement new systems, or if we fail to implement improvements or maintain effective internal controls and procedures, costs and expenses may increase more than expected and we may not expand our customer base, increase renewal rates, enhance existing applications, develop new applications, satisfy customers, respond to competitive pressures, or otherwise execute our business plan. If we are unable to effectively manage our growth, our operating results will be harmed.
Our growth strategy depends in part on the success of our strategic relationships with third parties and their continued performance and alignment.
To continue our growth we will need to continue to develop various third-party relationships. In particular, our growth strategy depends on continuing to develop successful go-to-market partnerships with key technology, system integrator and consultant partners both domestically and internationally to help validate our solutions and provide introductions to certain potential customers, and in some cases to resell our solutions, or provide professional services related to them. Failure to successfully develop and implement strategic third-party relationships with resellers, technology providers and service providers could significantly harm our operating results. For example, results may suffer if efforts towards developing our go-to-market relationships consume resources and incur costs, but do not result in a commensurate increase in revenue for us. We also may enter into relationships with other businesses to expand our solutions or our ability to provide our solutions in international locations, which could involve preferred or exclusive licenses, additional channels of distribution, discount pricing or investments in other companies. The cost of developing and maintaining such relationships may go unrecovered or unrewarded.
If we fail to offer high-quality professional services and support, our business and reputation may suffer. If we fail to reduce the cost of those services, our operating results may be harmed.
High-quality professional services and support, including training, implementation and consulting services, are important for the successful marketing, sale and use of our solutions and for
-23-
Table of Contents
the renewal of subscriptions by existing customers. The importance of high-quality professional services and support will increase as we expand our business and pursue new customers. If we do not provide effective ongoing support, our ability to retain and sell additional functionality and applications or modules to existing customers may suffer, and our reputation with existing or potential customers may be harmed.
At the same time, these services are provided at relatively high cost to us with resulting fees to the customer. These factors may negatively impact the future revenue growth for our solutions or lengthen the sales cycle, either of which would be detrimental to our business. We continue to pursue strategies to reduce the amount of professional services required for a customer to begin to use and gain value from our solutions, lower the overall costs of professional service fees to our customers, and improve the gross margin of our professional services business. If we are unable to successfully accomplish these objectives, our operating results, including our profit margins, may be harmed.
We rely on our management team and other key employees, and the loss of one or more key employees could harm our business.
Our success and future growth depend upon the continued services of our management team, including Sunny Gupta, one of our founders and our chief executive officer, and other key employees in the areas of engineering, marketing, sales, services and general and administrative functions. From time to time, there may be changes in our management team resulting from the hiring or departure of executives, which could disrupt our business. We also are dependent on the continued service of our existing software engineers and information technology personnel because of the complexity of our software, technologies and infrastructure. We may terminate any employee’s employment at any time, with or without cause, and any employee may resign at any time, with or without cause. We do not maintain any “key man” insurance for any employee. The loss of one or more of our management team members or key employees could harm our business.
If our network or computer systems are breached or unauthorized access to customer data is otherwise obtained, our applications may be perceived as insecure and we may lose existing customers or fail to attract new customers, our reputation may be damaged and we may incur significant liabilities.
Our operations involve the storage and transmission of our customers’ sensitive and proprietary information. Cyber-attacks and other malicious internet-based activity continue to increase generally, and cloud-based platform providers of software and services have been targeted. If any unauthorized access to or security breaches of our platform, or those of our service providers, occurs, or is believed to have occurred, such an event or perceived event could result in the loss of data, loss of intellectual property, loss of business, severe reputational or brand damage adversely affecting customer or investor confidence, regulatory investigations and orders, litigation, indemnity obligations, damages for contract breach, penalties for violation of applicable laws, regulations, or contractual obligations, and significant costs for remediation that may include liability for stolen assets or information and repair of system damage that may have been caused, incentives offered to customers or other business partners in an effort to maintain business relationships after a breach, and other liabilities. Additionally, any such event or perceived event could impact our reputation, harm customer confidence, hurt our sales and expansion into existing and new markets, or cause us to lose existing customers. We could be required to expend significant capital and other resources to alleviate problems caused by such actual or perceived breaches and to remediate our systems, we could be exposed to a risk of loss, litigation or regulatory action and possible liability, and our ability to operate our business may be impaired. Additionally, actual, potential or anticipated attacks may cause us to incur increasing costs, including costs to deploy additional personnel and protection technologies, train employees and engage third-party experts and consultants.
-24-
Table of Contents
In addition, if the security measures of our customers are compromised, even without any actual compromise of our own systems, we may face negative publicity or reputational harm if customers or anyone else incorrectly attributes the blame for such security breaches to us or our systems. If customers believe that our applications do not provide adequate security for the storage of personal or other sensitive information or its transmission over the internet, our business will be harmed. Customers’ concerns about security or privacy may deter them from using our platform for activities that involve personal or other sensitive information.
Our errors and omissions insurance covering certain security and privacy damages and claim expenses may not be sufficient to compensate for all liability. Although we maintain insurance for liabilities incurred as a result of some security and privacy damages, we cannot be certain that our coverage will be adequate for liabilities actually incurred or that insurance will continue to be available to us on economically reasonable terms, or at all. Because the techniques used and vulnerabilities exploited to obtain unauthorized access or to sabotage systems change frequently and generally are not identified until they are launched against a target, we may be unable to anticipate these techniques or vulnerabilities or implement adequate preventative measures. We may also experience security breaches that may remain undetected for an extended period.
Because data security is a critical competitive factor in our industry, we make public statements in our privacy policies, on our website, and elsewhere describing the security of our platform. Should any of these statements be untrue, become untrue, or be perceived to be untrue, even if through circumstances beyond our reasonable control, we may face claims, including claims of unfair or deceptive trade practices, brought by the U.S. Federal Trade Commission, state, local, or foreign regulators, and private litigants.
Interruptions or performance problems associated with our technology and infrastructure may adversely affect our business and operating results.
Our continued growth depends in part on the ability of our existing and potential customers to access our applications at any time. We have experienced, and may in the future experience, disruptions, outages, and other performance problems due to a variety of factors, including infrastructure changes, introductions of new capabilities, human or technology errors, distributed denial of service attacks, or other security related incidents. In some instances, we may not be able to identify the cause or causes of these performance problems within an acceptable period of time. It may become increasingly difficult to maintain and improve our performance, especially during peak usage times and as our platform becomes more complex and our user traffic increases. If our applications are unavailable or if our users are unable to access our applications within a reasonable amount of time or at all, our business will be harmed.
Moreover, our customer agreements often include performance guarantees and service level standards that may obligate us to provide credits or termination rights in the event of a significant disruption in our platform. To the extent that our third-party service providers experience outages, or to the extent we do not effectively address capacity constraints, upgrade our systems as needed, and continually develop our technology and network architecture to accommodate actual and anticipated changes in technology, our business and operating results may be adversely affected.
Our use of “open source” software could negatively affect our ability to offer our applications and subject us to possible litigation.
Our applications use “open source” software that we, in some cases, have obtained from third parties. Open source software is generally freely accessible, usable and modifiable, and is made available to the general public on an “as-is” basis under the terms of a non-negotiable license. Use and distribution of open source software may entail greater risks than use of third-party commercial
-25-
Table of Contents
software. Open source licensors generally do not provide warranties or other contractual protections regarding infringement claims or the quality of the software. In addition, certain open source licenses, like the GNU Affero General Public License, or AGPL, may require us to offer for no cost the components of our software that incorporate the open source software, to make available source code for modifications or derivative works we create by incorporating or using the open source software, or to license our modifications or derivative works under the terms of the particular open source license. If we are required, under the terms of an open source license, to release the source code of our proprietary software to the public, our competitors could create similar applications with lower development effort and time, which ultimately could result in a loss of sales for us.
We may also face claims alleging noncompliance with open source license terms or infringement or misappropriation of proprietary software. These claims could result in litigation, require us to purchase a costly license or require us to devote additional research and development resources to re-engineer our applications, any of which would have a negative effect on our business and operating results, including being enjoined from the offering of the components of our software that contained the open source software. We could also be subject to suits by parties claiming ownership of what we believe to be open source software. Litigation could be costly for us to defend, have a negative effect on our operating results and financial condition and require us to devote additional research and development resources to re-engineer our applications.
Although we monitor our use of open source software to avoid subjecting our applications to unintended conditions, few courts have interpreted open source licenses, and there is a risk that these licenses could be construed in a way that could impose unanticipated conditions or restrictions on our ability to commercialize our applications. We cannot guarantee that we have incorporated open source software in our software in a manner that will not subject us to liability, or in a manner that is consistent with our current policies and procedures.
Our business is dependent upon our brand recognition and reputation, and if we fail to maintain or enhance our brand recognition or reputation, our business could be harmed.
We believe that maintaining and enhancing our brand and our reputation are critical to our relationships with our customers and to our ability to attract new customers. We also believe that our brand and reputation will be increasingly important as competition in our market continues to develop. Our success in this area will depend on a wide range of factors, some of which are beyond our control, including the following:
| • | the efficacy of our marketing efforts; |
| • | our ability to continue to offer high-quality, innovative and error- and bug-free applications; |
| • | our ability to maintain the security and privacy of our customer’s sensitive and proprietary information; |
| • | our ability to retain existing customers and obtain new customers; |
| • | our ability to maintain high customer satisfaction; |
| • | the quality and perceived value of our applications; |
| • | our ability to successfully differentiate our applications from those of our competitors; |
| • | actions of competitors and other third parties; |
-26-
Table of Contents
| • | our ability to provide high quality customer support and professional services; |
| • | any data breach or data loss or misuse or perceived misuse of our applications; |
| • | positive or negative publicity; |
| • | interruptions, delays or attacks on our platform or applications; and |
| • | litigation, legislative or regulatory-related developments. |
If our brand promotion activities are not successful, our operating results and growth may be harmed.
Furthermore, negative publicity, whether or not justified, relating to events or activities attributed to us, employees, partners or others associated with any of these parties, may tarnish our reputation and reduce the value of our brand. Damage to our reputation and loss of brand equity may reduce demand for our applications and have an adverse effect on our business, operating results and financial condition. Moreover, any attempts to rebuild our reputation and restore the value of our brands may be costly and time consuming, and such efforts may not ultimately be successful.
We are materially invested in the formation and growth of the TBM Council, and our efforts in that area may fail to have a positive effect on our overall growth.
We have invested a significant amount of our money and time into the formation and growth of the TBM Council. Our ability to help build that organization, maintain strong relationships with the individuals involved, and build a positive public profile of the TBM Council and our association with the council, may have an effect on our overall success. It is possible that our efforts in this area will not yield the results that we are anticipating or the benefits of such efforts will not offset the costs.
We rely upon data centers and other systems and technologies provided by third parties, and technology systems and electronic networks supplied and managed by third parties, to operate our business and interruptions or performance problems with these systems, technologies and networks may adversely affect our business and operating results.
We rely on data centers and other technologies and services provided by third parties in order to operate our business. If any of these services becomes unavailable or otherwise is unable to serve our requirements due to extended outages, interruptions, facility closure, or because it is no longer available on commercially reasonable terms, expenses could increase, our ability to manage finances could be interrupted and our operations otherwise could be disrupted or otherwise impacted until appropriate substitute services, if available, are identified, obtained, and implemented.
We do not control, or in some cases have limited control over, the operation of the data center facilities we use, and they are vulnerable to damage or interruption from earthquakes, floods, fires, power loss, telecommunications failures and similar events. They may also be subject to break-ins, sabotage, intentional acts of vandalism and similar misconduct, and to adverse events caused by operator error. We may not be able to rapidly switch to new data centers or move customers from one data center to another in the event of any adverse event. Despite precautions taken at these facilities, the occurrence of a natural disaster, an act of terrorism or other act of malfeasance, a decision to close the facilities without adequate notice or other unanticipated problems at these facilities could result in lengthy interruptions in our service and the loss of customer data.
Our ability to provide services and solutions to our subscribers also depends on our ability to communicate with our subscribers through the public internet and electronic networks that are owned and operated by third parties. In addition, in order to provide services on-demand and promptly, our
-27-
Table of Contents
computer equipment and network servers must be functional 24 hours per day, which requires access to telecommunications facilities managed by third parties and the availability of electricity, which we do not control. A severe disruption of one or more of these networks or facilities, including as a result of utility or third-party system interruptions, could impair our ability to process information and provide services to our customers.
Any unavailability of, or failure to meet our requirements by, third-party data centers or other third-party technologies or services, or any disruption of the internet or the third-party networks or facilities that we rely upon, could impede our ability to provide services to our subscribers, harm our reputation, result in a loss of subscribers, cause us to issue refunds or service credits to customers, subject us to potential liabilities, result in contract terminations, and adversely affect our renewal rates. Any of these circumstances could adversely affect our business and operating results.
Catastrophic events may disrupt our business and impair our ability to provide our solutions to our customers, resulting in costs for remediation, customer dissatisfaction, and other business or financial losses.
Our operations depend, in part, on our ability to protect our facilities against damage or interruption from natural disasters, power or telecommunications failures, criminal acts and similar events. Despite precautions taken at our facilities, the occurrence of a natural disaster, an act of terrorism, vandalism or sabotage, spikes in usage volume or other unanticipated problems at a facility could result in lengthy interruptions in the availability of our applications. Our headquarters are located in Bellevue, Washington, which is situated near active earthquake fault lines. Even with current and planned disaster recovery arrangements, our business could be harmed. Also, in the event of damage or interruption, our insurance policies may not adequately compensate us for any losses that we may incur. These factors in turn could further reduce revenue, subject us to liability and cause us to issue credits or cause customers to fail to renew their subscriptions, any of which could harm our business.
We may not timely and effectively scale our existing technology, including our computing architecture, to meet the performance and other requirements placed on our systems, which could increase expenditures unexpectedly and create risk of outages and other performance and quality of service issues for our customers.
Our future growth and renewal rates depend on our ability to meet our customers’ expectations with respect to the speed and other performance attributes of our solutions, and to meet the expanding needs of our customers as their use of our solutions grows. The number of users, the amount and complexity of data ingested, created, transferred, processed and stored by us, the number of locations where our applications are being accessed, and the number of processes and systems managed by us on behalf of these customers, among other factors, separately and combined, can have an effect on the performance of our applications. In order to ensure that we meet the performance and other requirements of our customers, we continue to make significant investments to develop and implement new technologies in our software and infrastructure operations. These technologies, which include database, application and server advancements, revised network and hosting strategies, and automation, are often advanced, complex, and sometimes broad in scope and untested via industry-wide usage. We may not be successful in developing or implementing these technologies. To the extent that we do not develop offerings and scale our operations in a manner that maintains performance as our customers expand their use, our business and operating results may be harmed.
We may not accurately assess the capital and operational expenditures required to successfully fulfill our objectives and our financial performance may be harmed as a result. Further, we may make mistakes in the technical execution of these efforts to improve our solutions, which may affect our customers. Issues that may arise include performance (speed), data loss, and outages as well as other issues that could give rise to customer satisfaction issues, loss of business, and harm to
-28-
Table of Contents
our reputation. If any of these were to occur there would be a negative and potentially significant impact to our financial performance. Lastly, our ability to generate new applications, and improve our current solutions may be limited if and to the extent resources are necessarily allocated to address issues related to the performance of existing solutions.
Real or perceived errors, failures, or bugs in our applications could adversely affect our operating results and growth prospects.
We update our applications on a frequent basis. Despite efforts to test our updates, errors, failures or bugs may not be found in our applications until after they are deployed to our customers. We have discovered and expect we will continue to discover errors, failures and bugs in our applications and anticipate that certain of these errors, failures and bugs will only be discovered and remediated after deployment to customers. Real or perceived errors, failures or bugs in our applications could result in negative publicity, government inquiries, loss of or delay in market acceptance of our applications, loss of competitive position, or claims by customers for losses sustained by them. In such an event, we may be required, or may choose, for customer relations or other reasons, to expend additional resources in order to help correct the problem.
We implement bug fixes and upgrades as part of our regular system maintenance, which may lead to system downtime. Even if we are able to implement the bug fixes and upgrades in a timely manner, any history of inaccuracies in the data we collect for our customers, or the loss, damage or inadvertent release or exposure of confidential or other sensitive data could cause our reputation to be harmed and result in claims against us, and customers may elect not to purchase or renew their agreements with us or we may incur increased insurance costs. The costs associated with any material defects or errors in our applications or other performance problems may be substantial and could harm our operating results.
Because many of our customers use our applications to store and retrieve critical information, we may be subject to liability claims if our applications do not work properly. We cannot be certain that the limitations of liability set forth in our licenses and agreements would be enforceable or would otherwise protect us from liability for damages. A material liability claim against us, regardless of its merit or its outcome, could result in substantial costs, significantly harm our business reputation and divert management’s attention from our operations.
We are subject to governmental laws, regulation and other legal obligations, particularly related to privacy, data protection and information security, and any actual or perceived failure to comply with such obligations could harm our business.
Personal privacy and information security are significant issues in the United States and the other jurisdictions where we offer our applications. The legislative and regulatory framework for privacy and security issues worldwide is rapidly evolving and is likely to remain uncertain for the foreseeable future. We collect personally identifiable information, or PII, and other data from our customers and users. Our handling of data is subject to a variety of laws and regulations, including regulation by various government agencies, including the U.S. Federal Trade Commission, or FTC, and various state, local and foreign agencies.
In the United States, the FTC and many state attorneys general are applying federal and state consumer protection laws to impose standards for the online collection, use and dissemination of data. Many foreign countries and governmental bodies, including the European Union, or EU, Canada, and other relevant jurisdictions where we conduct business, have laws and regulations concerning the collection and use of PII obtained from their residents or by businesses operating within their jurisdiction. These laws and regulations often are more restrictive than those in the United States. Laws and regulations in these jurisdictions apply broadly to the collection, use, storage, disclosure and
-29-
Table of Contents
security of data that identifies or may be used to identify or locate an individual, such as names, email addresses and, in some jurisdictions, Internet Protocol addresses. In the EU, where companies must meet specified privacy and security standards, Directive 95/46/EC of the European Parliament and of the Council of 24 October 1995 on the protection of individuals with regard to the processing of personal data and on the free movement of such data, commonly referenced as the Data Protection Directive, and EU member state implementations of the Data Protection Directive, require comprehensive information privacy and security protections for consumers with respect to PII collected about them. The EU has adopted a General Data Protection Regulation, to supersede the Data Protection Directive. This regulation, which will become effective in 2018, would cause EU data protection requirements to be more stringent and to provide for greater penalties for noncompliance.
An October 2015 ruling of the Court of Justice of the EU, the EU’s highest court, invalidated the U.S.-EU Safe Harbor Framework as a method of compliance with restrictions set forth in the Data Protection Directive (and member states’ implementations thereof) regarding the transfer of data outside of the European Economic Area, or EEA. As a result of this ruling, we have entered into contractual provisions with certain European customers that impose additional obligations on us with respect to our handling of PII from the EEA. Additionally, U.S. and EU authorities reached a political agreement in February 2016 regarding a new potential means for legitimizing personal data transfers from the EEA to the U.S., the EU-U.S. Privacy Shield. We plan to file for the EU-U.S. Privacy Shield, and we may make additional changes to our PII handling practices in the future. We publicly post our privacy policies and practices concerning our processing, use and disclosure of PII. Our publication of our Privacy Shield filing, our privacy policy, and other statements we publish that provide promises and assurances about privacy and security can subject us to potential state and federal action if they are found to be deceptive or misrepresentative of our practices. Additionally, we may find it necessary or desirable to join industry or other self-regulatory bodies or other privacy-or data protection-related organizations that require compliance with their rules pertaining to privacy and data protection. We also may be bound by additional, more stringent contractual obligations relating to our collection, use and disclosure of PII and other data.
On June 23, 2016, the United Kingdom held a referendum and voted in favor of leaving the European Union, which has created uncertainty with regard to the regulation of data protection in the United Kingdom. In particular, it is unclear whether the United Kingdom will enact the pending European General Data Protection Regulation, or other data protection laws or regulations, and how data transfers to and from the United Kingdom will be regulated.
Although we are working to comply with those federal, state, and foreign laws and regulations, industry standards, contractual obligations and other legal obligations that apply to us, those laws, regulations, standards and obligations are evolving and may be modified, interpreted and applied in an inconsistent manner from one jurisdiction to another, and may conflict with one another, other requirements or legal obligations, our practices or the features of our applications or platform. Any failure or perceived failure by us to comply with federal, state or foreign laws or regulations, industry standards, contractual obligations or other legal obligations, or any actual or suspected security incident, whether or not resulting in unauthorized access to, or acquisition, release or transfer of PII or other data, may result in governmental enforcement actions and prosecutions, private litigation, fines and penalties or adverse publicity and could cause our customers to lose trust in us, which could have an adverse effect on our reputation and business. Any inability to adequately address privacy and security concerns, even if unfounded, or comply with applicable laws, regulations, policies, industry standards, contractual obligations, or other legal obligations could result in additional cost and liability to us, damage our reputation, inhibit sales, and adversely affect our business.
We also expect that there will continue to be new proposed laws, regulations and industry standards concerning privacy, data protection and information security in the United States, the
-30-
Table of Contents
European Union and other jurisdictions, and we cannot yet determine the impact such future laws, regulations and standards may have on our business. Future laws, regulations, standards and other obligations, and changes in the interpretation of existing laws, regulations, standards and other obligations could impair our or our customers’ ability to collect, use or disclose information relating to consumers, which could decrease demand for our applications, increase our costs and impair our ability to maintain and grow our customer base and increase revenue. New laws, amendments to or re-interpretations of existing laws and regulations, industry standards, contractual obligations and other obligations may require us to incur additional costs and restrict our business operations. Such laws and regulations may require companies to implement privacy and security policies, permit users to access, correct and delete personal information stored or maintained by such companies, inform individuals of security breaches that affect their personal information, and, in some cases, obtain individuals’ consent to use PII for certain purposes. In addition, a foreign government could require that any PII collected in a country not be disseminated outside of that country, and we may face difficulty in complying with any such requirement for certain geographic regions. If we fail to comply with federal, state and international data privacy laws and regulations our ability to successfully operate our business and pursue our business goals could be harmed.
Third-party claims that we are infringing the intellectual property rights of others, whether successful or not, could subject us to costly and time-consuming litigation or require us to obtain expensive licenses, and our business could be harmed.
The technology industry is characterized by the existence of a large number of patents, copyrights, trademarks, trade secrets and other intellectual property rights. Companies in the technology industry must often defend against litigation claims based on allegations of infringement or other violations of intellectual property rights. Third parties, including our competitors, may own patents or other intellectual property rights that cover aspects of our technology or business methods and may assert patent or other intellectual property rights against us and others in the industry. Moreover, in recent years, individuals and groups that are non-practicing entities, commonly referred to as “patent trolls,” have purchased patents and other intellectual property assets for the purpose of making claims of infringement in order to extract settlements. From time to time, we may receive threatening letters, notices or “invitations to license,” or may be the subject of claims that our applications and business operations infringe or violate the intellectual property rights of others. Responding to such claims, regardless of their merit, can be time consuming, costly to defend in litigation, divert management’s attention and resources, damage our reputation and brand and cause us to incur significant expenses. Claims of intellectual property infringement might require us to stop using technology found to infringe a third party’s rights, redesign our application, which could require significant effort and expense and cause delays of releases, enter into costly settlement or license agreements or pay costly damage awards, or face a temporary or permanent injunction prohibiting us from marketing or selling our applications. If we cannot or do not license the infringed technology on reasonable terms or at all, or substitute similar technology from another source, we could be forced to limit or stop selling our applications, we may not be able to meet our obligations to customers under our customer contracts, revenue and operating results could be adversely impacted, and we may be unable to compete effectively. Additionally, our customers may not purchase our applications if they are concerned that they may infringe third-party intellectual property rights. The occurrence of any of these events may harm our business.
In our subscription agreements with our customers, we generally agree to indemnify our customers against any losses or costs incurred in connection with claims by a third party alleging that the customer’s use of our applications infringes the intellectual property rights of the third party. Our customers who are accused of intellectual property infringement may seek indemnification from us. If any claim is successful, or if we are required to indemnify or defend our customers from any of these or other claims, these matters could be disruptive to our business and management and result in additional legal expenses.
-31-
Table of Contents
The success of our business depends in part on our ability to protect and enforce our intellectual property rights.
Our success is dependent, in part, upon protecting our proprietary technology. As of June 30, 2016, we had six issued U.S. patents. We also had 15 patent applications pending for examination in the United States. Our issued patents, and any patents issued in the future, may not provide us with any competitive advantages or may be challenged by third parties, and our patent applications may never be granted. Additionally, the process of obtaining patent protection is expensive and time-consuming, and we may not be able to prosecute all necessary or desirable patent applications at a reasonable cost or in a timely manner. Even if issued, there can be no assurance that these patents will adequately protect our intellectual property, as the legal standards relating to the validity, enforceability and scope of protection of patent and other intellectual property rights are uncertain.
Any patents that are issued may subsequently be invalidated or otherwise limited, allowing other companies to develop offerings that compete with ours, which could adversely affect our competitive business position, business prospects and financial condition. In addition, issuance of a patent does not guarantee that we have a right to practice the patented invention. Patent applications in the United States are typically not published until 18 months after filing or, in some cases, not at all, and publications of discoveries in industry-related literature lag behind actual discoveries. We cannot be certain that we were the first to use the inventions claimed in our issued patents or pending patent applications or otherwise used in our software, that we were the first to file for protection in our patent applications, or that third parties do not have blocking patents that could be used to prevent us from marketing or practicing our patented software or technology. Effective patent, trademark, copyright and trade secret protection may not be available to us in every country in which our software is available. The laws of some foreign countries may not be as protective of intellectual property rights as those in the United States (in particular, some foreign jurisdictions do not permit patent protection for software), and mechanisms for enforcement of intellectual property rights may be inadequate. Additional uncertainty may result from changes to intellectual property legislation enacted in the United States (including the recent “America Invents Act”) and other national governments and from interpretations of the intellectual property laws of the United States and other countries by applicable courts and agencies. Accordingly, despite our efforts, we may be unable to prevent third parties from infringing upon or misappropriating our intellectual property.
Although we enter into confidentiality and invention assignment agreements with our employees and consultants and enter into confidentiality agreements with our customers and the parties with whom we have strategic relationships and business alliances, no assurance can be given that these agreements will be effective in controlling access to and distribution of our applications and propriety information or prevent reverse engineering. Further, these agreements may not prevent our competitors from independently developing technologies that are substantially equivalent or superior to our applications, and we may be unable to prevent this competition.
We may be required to spend significant resources to monitor and protect our intellectual property rights. Litigation may be necessary in the future to enforce our intellectual property rights. Such litigation could be costly, time consuming and distracting to management and could result in the impairment or loss of portions of our intellectual property. Furthermore, our efforts to enforce our intellectual property rights may be met with defenses, counterclaims and countersuits attacking the validity and enforceability of our intellectual property rights. We may not prevail in any lawsuits that we initiate. Any litigation, whether or not resolved in our favor, could subject us to substantial costs, divert resources and the attention of management and technical personnel from our business and adversely affect our business. Our inability to protect our proprietary technology against unauthorized copying or use, as well as any costly litigation, could delay further sales or the implementation of our software and
-32-
Table of Contents
offerings, impair the functionality of our software and offerings, delay introductions of new features or enhancements, result in our substituting inferior or more costly technologies into our software and offerings, or injure our reputation.
We may initiate claims or litigation against third parties for infringement of our proprietary rights or to establish the validity of our proprietary rights. Litigation also puts our patents at risk of being invalidated or interpreted narrowly and our patent applications at risk of not issuing. Additionally, we may provoke third parties to assert counterclaims against us. We may not prevail in any lawsuits that we initiate, and the damages or other remedies awarded, if any, may not be commercially viable. Any litigation, whether or not it is resolved in our favor, could result in significant expense to us and divert the efforts of our technical and management personnel, which may adversely affect our business, results of operations, financial condition and cash flows.
Future acquisitions could disrupt our business and may divert management’s attention and if unsuccessful, harm our business.
We may choose to expand by making acquisitions that could be material to our business. To date, we have completed one minor acquisition, in 2012, and our ability as an organization to successfully acquire and integrate technologies or businesses is unproven and limited. Acquisitions involve many risks, including the following:
| • | an acquisition may negatively affect our results of operations and financial condition because it may require us to incur charges or assume substantial debt or other liabilities, may cause adverse tax consequences or unfavorable accounting treatment, may expose us to claims and disputes by third parties, including intellectual property claims and disputes, or may not generate sufficient financial return to offset additional costs and expenses related to the acquisition; |
| • | we may encounter difficulties or unforeseen expenditures in integrating the business, technologies, products, personnel or operations of any company that we acquire, particularly if key personnel of the acquired company decide not to work for us; |
| • | an acquisition may disrupt our ongoing business, divert resources, increase expenses and distract management; |
| • | an acquisition may result in a delay or reduction of customer purchases for both us and the company we acquired due to customer uncertainty about continuity and effectiveness of service from either company; |
| • | we may encounter difficulties in, or may be unable to, successfully sell any acquired products; |
| • | an acquisition may involve the entry into geographic or business markets in which we have little or no prior experience or where competitors have stronger market positions; |
| • | challenges inherent in effectively managing an increased number of employees in diverse locations; |
| • | the potential strain on our financial and managerial controls and reporting systems and procedures; |
| • | potential known and unknown liabilities associated with an acquired company; |
-33-
Table of Contents
| • | our use of cash to pay for acquisitions would limit other potential uses for our cash; |
| • | if we incur debt to fund such acquisitions, such debt may subject us to material restrictions on our ability to conduct our business as well as financial maintenance covenants; |
| • | the risk of impairment charges related to potential write-downs of acquired assets or goodwill in future acquisitions; |
| • | to the extent that we issue a significant amount of equity or equity-linked securities in connection with future acquisitions, existing stockholders may be diluted and earnings per share may decrease; and |
| • | managing the varying intellectual property protection strategies and other activities of an acquired company. |
We may not succeed in addressing these or other risks or any other problems encountered in connection with the integration of any acquired business. The inability to integrate successfully the business, technologies, products, personnel or operations of any acquired business, or any significant delay in achieving integration, could harm our business and operating results.
Provisions of our debt instruments may restrict our ability to pursue our business strategies.
Our credit facilities require us, and any debt instruments we may enter into in the future may require us, to comply with various covenants that limit our ability to, among other things:
| • | dispose of assets; |
| • | complete mergers or acquisitions; |
| • | incur indebtedness; |
| • | encumber assets; |
| • | pay dividends or make other distributions to holders of our capital stock; |
| • | make specified investments; |
| • | change certain key management personnel; and |
| • | engage in transactions with our affiliates. |
These restrictions could inhibit our ability to pursue our business strategies. In addition, we are subject to a financial covenant based on subscription and professional services performance. If we default under our credit facilities, and such event of default was not cured or waived, the lenders could terminate commitments to lend and cause all amounts then outstanding with respect to the debt to be due and payable immediately, which in turn could result in cross defaults under any other debt instruments then outstanding. Our assets and cash flow may not be sufficient to fully repay borrowings under all of our outstanding debt instruments if some or all of these instruments are accelerated upon a default.
-34-
Table of Contents
We may incur additional indebtedness in the future. The debt instruments governing such indebtedness could contain provisions that are as, or more, restrictive than our existing debt instruments. If we are unable to repay, refinance or restructure our indebtedness when payment is due, the lenders could proceed against the collateral granted to them to secure such indebtedness or force us into bankruptcy or liquidation.
Our ability to raise capital in the future may be limited, and if we fail to raise capital when needed, we could be prevented from growing.
Our business and operations may consume resources faster than we anticipate. While we believe our cash and cash equivalents, cash flows from operations and available borrowings under our credit facilities will be sufficient to support our planned operations for at least the next 12 months, in the future, we may need to raise additional funds to invest in future growth opportunities. Additional financing may not be available on favorable terms, if at all. If adequate funds are not available on acceptable terms, we may be unable to invest in future growth opportunities, which could harm our business and operating results. As of June 30, 2016, we had incurred $20 million in debt under our credit facilities, and the debt holders have rights senior to common stockholders to make claims on our assets. In addition, our credit facilities impose and future debt instruments may impose, restrictions on our ability to dispose property, make changes in our business, engage in mergers or acquisitions, incur additional indebtedness, and make investments and distributions. Furthermore, if we issue additional equity securities, stockholders will experience dilution, and the new equity securities could have rights senior to those of our common stock. Because our decision to issue securities in any future offering will depend on market conditions and other factors beyond our control, we cannot predict or estimate the amount, timing or nature of our future offerings. As a result, stockholders bear the risk that future securities offerings reduce the market price of our Class A common stock and dilute their interest.
We may be subject to additional obligations to collect and remit sales tax and other taxes, and we may be subject to tax liability for past sales, which could harm our business.
We do not collect sales and use, value added and similar taxes in all jurisdictions in which we have sales, based on our belief that such taxes are not applicable in certain jurisdictions. State, local and foreign jurisdictions have differing rules and regulations governing sales, use, value added and other taxes, and these rules and regulations are subject to varying interpretations that may change over time. In particular, the applicability of such taxes to our software in various jurisdictions is unclear. Further, these jurisdictions’ rules regarding tax nexus are complex and vary significantly. As a result, we could face the possibility of tax assessments and audits. Our liability for these taxes and associated penalties and interest could exceed our original estimates, and we could be required to collect additional taxes in the future. A successful assertion that we should be collecting additional sales, use, value added or other taxes in those jurisdictions where we have not historically done so and do not accrue for such taxes could result in substantial tax liabilities and related penalties for past sales, discourage customers from purchasing our application or otherwise harm our business and operating results.
Changes in tax laws or regulations that are applied adversely to us or our customers could increase the costs of our applications and adversely impact our business.
New income, sales, use or other tax laws, statutes, rules, regulations or ordinances could be enacted at any time, which could affect the tax treatment of our (and our subsidiaries’) domestic and foreign earnings. Any new taxes could adversely affect our domestic and international business operations, and our business and financial performance. Further, existing tax laws, statutes, rules, regulations or ordinances could be interpreted, changed, modified or applied adversely to us. Specifically, taxation of cloud-based applications is constantly evolving as many state and local
-35-
Table of Contents
jurisdictions consider the taxability of software services provided remotely. These events could require us or our customers to pay additional tax amounts on a prospective or retroactive basis, as well as require us or our customers to pay fines or penalties and interest for past amounts deemed to be due. If we raise our prices to offset the costs of these changes, existing and potential future customers may elect not to continue or purchase our platform or applications in the future. Additionally, new, changed, modified or newly interpreted or applied tax laws could increase our customers’ and our compliance, operating and other costs, as well as the costs of our software. Any or all of these events could harm our business and operating results.
We are a multinational organization faced with increasingly complex tax issues in many jurisdictions, and we could be obligated to pay additional taxes in various jurisdictions.
As a multinational organization, we may be subject to taxation in several jurisdictions around the world with increasingly complex tax laws, the application of which can be uncertain, and significant judgment and estimates are required in determining our provision for taxes. Our tax expense may be impacted if our intercompany transactions, which are required to be computed on an arm’s-length basis, are challenged and successfully disputed by tax authorities. Our policies governing transfer pricing may be determined to be inadequate and could result in additional tax assessments. The amount of taxes we pay in these jurisdictions could increase substantially as a result of changes in the applicable tax principles, including increased tax rates, new tax laws or revised interpretations of existing tax laws and precedents, which could harm our liquidity and operating results. In addition, the authorities in these jurisdictions could review our tax returns and impose additional tax, interest and penalties, and the authorities could claim that various withholding requirements or other taxes apply to us or our subsidiaries (including withholding and indirect taxes on software licenses and related intercompany transactions) or assert that benefits of tax treaties are not available to us or our subsidiaries, any of which could adversely affect our operating results.
Our ability to use our net operating loss carryforwards and certain other tax attributes may be limited.
As of December 31, 2015, we had federal net operating loss carryforwards of approximately $145.8 million, which will expire between 2027 and 2034. Under Sections 382 and 383 of the Internal Revenue Code of 1986, as amended, if a corporation undergoes an “ownership change” (generally defined as a greater than 50-percentage-point cumulative change (by value) in the equity ownership of certain stockholders over a rolling three-year period), the corporation’s ability to use its pre-change net operating loss carryforwards and other pre-change tax attributes (such as research tax credits) to offset its post-change taxable income or taxes may be limited. We may experience such an ownership change in connection with this offering or in the future as a result of subsequent shifts in our stock ownership, some of which are outside our control. Furthermore, our ability to utilize the net operating losses or other tax attributes of companies that we may acquire in the future may be subject to limitations. There is also a risk that due to regulatory changes, such as suspensions on the use of net operating losses, or other unforeseen reasons, our existing net operating losses could expire or otherwise be unavailable to offset future income tax liabilities. For these reasons, our ability to use our pre-change net operating loss carryforwards and other pre-change tax attributes to offset post-change taxable income or taxes may be subject to limitation, which could potentially result in increased future tax liability to us.
Future changes in the regulations and laws of the United States, or those of the international markets in which we do business, could harm our business.
We are subject to general business regulations and laws, as well as regulations and laws specifically governing the internet and software, in the United States as well as the international
-36-
Table of Contents
markets in which we do business. These regulations and laws may cover employment, taxation, privacy, data protection, pricing, content, copyrights, mobile communications, electronic contracts and other communications, consumer protection, unencumbered internet access to our services, the design and operation of websites, and the characteristics and quality of software and services. It is possible changes to these regulations and laws, as well as compliance challenges related to the complexity of multiple, conflicting and changing sets of applicable regulations and laws, may impact our sales, operations, and future growth.
Significant U.K. or European developments stemming from the U.K.’s referendum on membership in the European Union could have a material adverse effect on us.
On June 23, 2016, the United Kingdom held a referendum and voted in favor of leaving the European Union. This has created political and economic uncertainty, particularly in the United Kingdom and the European Union, and this uncertainty may last for years. Our business in the United Kingdom, the European Union, and worldwide could be affected during this period of uncertainty, and perhaps longer, by the impact of the United Kingdom’s referendum. There are many ways in which our business could be affected, only some of which we can identify as of the date of this prospectus.
The referendum, and the likely withdrawal of the United Kingdom from the European Union it triggers, has caused and, along with events that could occur in the future as a consequence of the United Kingdom’s withdrawal, including the possible breakup of the United Kingdom, may continue to cause significant volatility in global financial markets, including in global currency and debt markets. This volatility could cause a slowdown in economic activity in the United Kingdom, Europe or globally, which could adversely affect our operating results and growth prospects. In addition, our business could be negatively affected by new trade agreements or data transfer agreements between the United Kingdom and other countries, including the United States, and by the possible imposition of trade or other regulatory barriers in the United Kingdom. Furthermore, we currently operate in Europe through an Apptio subsidiary based in the United Kingdom, which currently provides us with certain operational, tax and other benefits, as well as through other subsidiaries in Europe. The United Kingdom’s withdrawal from the European Union could adversely affect our ability to realize those benefits and we may incur costs and suffer disruptions in our European operations as a result. These possible negative impacts, and others resulting from the United Kingdom’s actual or threatened withdrawal from the European Union, may adversely affect our operating results and growth prospects.
Increased sales to U.S. federal, state, local and foreign governments expose us to risks inherent in government sales and procurement.
Contracts with U.S. federal, state, local and foreign government entities are subject to various procurement regulations and other requirements relating to their formation, administration and performance. We may be subject to audits and investigations relating to our government contracts and any violations could result in various civil and criminal penalties and administrative sanctions, including termination of contract, refunding or suspending of payments, forfeiture of profits, payment of fines and suspension or debarment from future government business. Further, in order to obtain, and in some cases expedite, sales to certain government customers, we may enter into subcontractor agreements with existing approved government contractors subjecting us to further risks associated with those subcontractor agreements as well as the potential default or breach of the underlying agreements between the approved government contractors and government entity to which we are not a party.
Risks Related to Our Class A Common Stock and this Offering
The dual class structure of our common stock has the effect of concentrating voting control with those stockholders who held our capital stock prior to the closing of this offering,
-37-
Table of Contents
including our executive officers, employees and directors and their affiliates, which will limit your ability to influence the outcome of important transactions, including a change in control.
Our Class B common stock has 10 votes per share, and our Class A common stock, which is the stock we are offering by means of this prospectus, has one vote per share. Upon the closing of this offering, stockholders who hold shares of Class B common stock, including our executive officers, employees and directors and their affiliates, will collectively hold approximately 98% of the voting power of our outstanding capital stock. Because of the ten-to-one voting ratio between Class B common stock and Class A common stock, after the closing of this offering, the holders of Class B common stock will collectively continue to control a majority of the combined voting power of our capital stock and therefore be able to control all matters submitted to our stockholders for approval until the earlier of (1) the seventh anniversary of the closing of this offering and (2) the date on which the Class B common stock ceases to represent at least 20% of our outstanding common stock, on which date all of the shares of Class B common stock will automatically convert to Class A common stock. These holders of Class B common stock may also have interests that differ from yours and may vote in a way with which you disagree and which may be adverse to your interests. This concentrated control may have the effect of delaying, preventing or deterring a change in control of our company, could deprive our stockholders of an opportunity to receive a premium for their capital stock as part of a sale of our company and might ultimately affect the market price of our Class A common stock.
Future transfers by holders of Class B common stock will generally result in those shares converting into shares of Class A common stock, subject to limited exceptions, such as certain transfers effected for estate planning or charitable purposes. The conversion of shares of Class B common stock into shares of Class A common stock will have the effect, over time, of increasing the relative voting power of those holders of Class B common stock who retain their shares in the long term, which may include our executive officers and directors and their affiliates. For a description of the dual class structure, see the section of the prospectus captioned “Description of Capital Stock.”
Our stock price may fluctuate significantly and investors may not be able to resell their shares at or above the initial public offering price.
The trading price of Class A common stock following this offering may be highly volatile and could be subject to wide fluctuations in response to various factors, some of which are beyond our control. In addition to the factors discussed in this “Risk Factors” section and elsewhere in this prospectus, these factors include:
| • | actual or anticipated fluctuations in revenue and other operating results, including as a result of the addition or loss of any number of customers; |
| • | announcements by us or our competitors of significant technical innovations, acquisitions, strategic partnerships, joint ventures or capital commitments; |
| • | the financial projections we may provide to the public, any changes in these projections or our failure to meet these projections; |
| • | failure of securities analysts to initiate or maintain coverage of us, changes in ratings and financial estimates and the publication of other news by any securities analysts who follow our company, or our failure to meet these estimates or the expectations of investors; |
| • | changes in operating performance and stock market valuations of cloud-based software or other technology companies, or those in our industry in particular; |
| • | the size of our public float; |
-38-
Table of Contents
| • | price and volume fluctuations in the trading of our Class A common stock and in the overall stock market, including as a result of trends in the economy as a whole or in the technology industry; |
| • | new laws or regulations or new interpretations of existing laws or regulations applicable to our business or industry, including data privacy and data security; |
| • | lawsuits threatened or filed against us for claims relating to intellectual property, employment issues or otherwise; |
| • | changes in our board of directors or management; |
| • | short sales, hedging and other derivative transactions involving our Class A common stock; |
| • | sales of large blocks of our common stock including sales by our executive officers, directors and significant stockholders; and |
| • | other events or factors, including changes in general economic, industry and market conditions and trends, as well as any natural disasters that may affect our operations. |
The stock market in general, and market prices for the securities of technology companies like ours in particular, have from time to time experienced volatility that often has been unrelated to the operating performance of the underlying companies. These broad market and industry fluctuations may adversely affect the market price of our Class A common stock, regardless of our operating performance. In several recent situations when the market price of a stock has been volatile, holders of that stock have instituted securities class action litigation against the company that issued the stock. If any of our stockholders were to bring a lawsuit against us, the defense and disposition of the lawsuit could be costly and divert the time and attention of our management and harm our operating results.
There has been no prior market for our Class A common stock and an active trading market for our Class A common stock may not develop.
Prior to this offering, there has been no public market for our Class A common stock and an active trading market for our shares may never develop or be sustained following this offering. The initial price to the public for our Class A common stock will be determined through negotiations with the underwriters, and the negotiated price may not be indicative of the market price of the Class A common stock after the offering. The lack of an active market may impair investors’ ability to sell their shares at the time they wish to sell them or at a price that they consider reasonable, may reduce the market value of their shares and may impair our ability to raise capital.
If securities or industry analysts do not publish research reports about our business, or if they issue an adverse opinion about our business, our stock price and trading volume could decline.
The trading market for our Class A common stock will be influenced by the research and reports that industry or securities analysts publish about us or our business. We do not currently have and may never obtain research coverage by securities and industry analysts. We do not have any control over these analysts. If no or few analysts commence research coverage of us, or one or more of the analysts who cover us issues an adverse opinion about our company, our stock price would likely decline. If one or more of these analysts ceases research coverage of us or fails to regularly publish reports on us, we could lose visibility in the financial markets, which in turn could cause our stock price or trading volume to decline.
-39-
Table of Contents
Future sales of our common stock could cause our stock price to fall.
Our stock price could decline as a result of sales of a large number of shares of our common stock after this offering or the perception that these sales could occur. These sales, or the possibility that these sales may occur, also might make it more difficult for us to sell equity securities in the future at a time and at a price that we deem appropriate.
Upon the closing of this offering, 6,000,000 shares of our Class A common stock will be outstanding (6,900,000 shares of Class A common stock will be outstanding assuming exercise in full of the underwriters’ option to purchase additional shares) and 31,285,839 shares of our Class B common stock will be outstanding, based on our shares outstanding as of June 30, 2016. All shares of Class A common stock expected to be sold in this offering will be freely tradable without restriction or further registration under the Securities Act unless held by our “affiliates,” as that term is defined in Rule 144 under the Securities Act. The resale of the 31,285,839 shares of Class B common stock, or approximately 84% of our outstanding shares after this offering, is currently prohibited or otherwise restricted as a result of securities law provisions, market standoff agreements entered into by our stockholders with us or lock-up agreements entered into by our stockholders with the underwriters; however, subject to applicable securities law restrictions, these shares will be able to be sold in the public market beginning 180 days after the date of this prospectus. In addition, the shares subject to outstanding options and warrants, of which options and warrants to purchase 11,394,824 shares and 75,214 shares, respectively, were outstanding as of June 30, 2016, and the shares reserved for future issuance under our stock option and equity incentive plans will become available for sale immediately upon the exercise of such options and the expiration of any applicable market stand-off or lock-up agreements, and Rule 144 and Rule 701 under the Securities Act. For more information see the section of this prospectus captioned “Shares Eligible for Future Sale.”
Upon the closing of this offering, the holders of 27,976,982 shares (including the shares underlying warrants described in the section of this prospectus captioned “Shares Eligible for Future Sale – Warrants”), or approximately 75% of our common stock, will have rights, subject to some conditions, to require us to file registration statements covering the sale of their shares or to include their shares in registration statements that we may file for ourselves or other stockholders. We also intend to register the offer and sale of all shares of common stock that we may issue under our equity compensation plans. Once we register the offer and sale of shares for the holders of registration rights and shares to be issued under our equity incentive plans, they can be freely sold in the public market upon issuance, subject to the lock-up agreements and the restrictions of Rule 144 under the Securities Act in the case of our affiliates, described in the section of this prospectus captioned “Shares Eligible For Future Sale.”
In addition, in the future, we may issue additional shares of Class A common stock or other equity or debt securities convertible into Class A common stock in connection with a financing, acquisition, commercial relationship, litigation settlement, employee arrangements or otherwise. Any such issuance could result in substantial dilution to our existing stockholders and could cause our stock price to decline.
Our management team has broad discretion to use the net proceeds from this offering and its investment of these proceeds may not yield a favorable return. They may invest the proceeds of this offering in ways with which investors disagree.
We expect to use the net proceeds from this offering for working capital and other general corporate purposes. We may also use a portion of the net proceeds to expand our current business through acquisitions of or investments in other complementary businesses, technologies, or other assets. However, we currently have no agreements or commitments with respect to any such acquisitions or investments at this time.
-40-
Table of Contents
In addition, within the scope of our plan, and in light of the various risks to our business that are set forth in this “Risk Factors” section, our management will have broad discretion over the use of proceeds from this offering, and we could spend the proceeds from this offering in ways our stockholders may not agree with or that do not yield a favorable return, if at all. If we do not invest or apply the proceeds of this offering in ways that improve our operating results, we may fail to achieve expected financial results, which could cause our stock price to decline.
Anti-takeover provisions in our charter documents and under Delaware or Washington law could make an acquisition of us difficult, limit attempts by our stockholders to replace or remove our current management and adversely affect our stock price.
Provisions of our certificate of incorporation and bylaws may delay or discourage transactions involving an actual or potential change in our control or change in our management, including transactions in which stockholders might otherwise receive a premium for their shares, or transactions that our stockholders might otherwise deem to be in their best interests. Therefore, these provisions could adversely affect the price of our stock. Among other things, the certificate of incorporation and bylaws will:
| • | permit the board of directors to issue up to 5,000,000 shares of preferred stock, with any rights, preferences and privileges as they may designate; |
| • | provide that the authorized number of directors may be changed only by resolution of the board of directors; |
| • | provide that all vacancies, including newly-created directorships, may, except as otherwise required by law, be filled by the affirmative vote of a majority of directors then in office, even if less than a quorum; |
| • | divide the board of directors into three classes; |
| • | provide that a director may only be removed from the board of directors by the stockholders for cause; |
| • | require that any action to be taken by our stockholders must be effected at a duly called annual or special meeting of stockholders and may not be taken by written consent; |
| • | provide that stockholders seeking to present proposals before a meeting of stockholders or to nominate candidates for election as directors at a meeting of stockholders must provide notice in writing in a timely manner, and meet specific requirements as to the form and content of a stockholder’s notice; |
| • | prevent cumulative voting rights (therefore allowing the holders of a plurality of the shares of common stock entitled to vote in any election of directors to elect all of the directors standing for election, if they should so choose); |
| • | require that, to the fullest extent permitted by law, a stockholder reimburse us for all fees, costs and expenses incurred by us in connection with a proceeding initiated by such stockholder in which such stockholder does not obtain a judgment on the merits that substantially achieves the full remedy sought; |
| • | provide that special meetings of our stockholders may be called only by the chairman of the board, our chief executive officer (or president, in the absence of a chief executive officer) or by the board of directors; |
-41-
Table of Contents
| • | provide that stockholders will be permitted to amend the bylaws only upon receiving at least two-thirds of the total votes entitled to be cast by holders of all outstanding shares then entitled to vote generally in the election of directors, voting together as a single class; and |
| • | authorize two classes of common stock, as discussed above. |
In addition, because we are incorporated in Delaware, we are governed by the provisions of Section 203 of the Delaware General Corporation Law, which generally prohibits a Delaware corporation from engaging in any of a broad range of business combinations with any “interested” stockholder for a period of three years following the date on which the stockholder became an “interested” stockholder. Likewise, because our principal executive offices are located in Washington, the anti-takeover provisions of the Washington Business Corporation Act may apply to us under certain circumstances now or in the future. These provisions prohibit a “target corporation” from engaging in any of a broad range of business combinations with any stockholder constituting an “acquiring person” for a period of five years following the date on which the stockholder became an “acquiring person.” See the section of this prospectus captioned “Description of Capital Stock—Anti-Takeover Effects of Delaware and Washington Law and Our Certificate of Incorporation and Bylaws” for additional information.
Our certificate of incorporation provides that the Court of Chancery of the State of Delaware will be the exclusive forum for substantially all disputes between us and our stockholders, which could limit our stockholders’ ability to obtain a favorable judicial forum for disputes with us or our directors, officers or employees.
Our certificate of incorporation provides that, unless we otherwise consent in writing, the Court of Chancery of the State of Delaware is the exclusive forum for any derivative action or proceeding brought on our behalf, any action asserting a breach of fiduciary duty, any action asserting a claim against us arising pursuant to the Delaware General Corporation Law, our certificate of incorporation or our bylaws, any action to interpret, apply, enforce, or determine the validity of our certificate of incorporation or bylaws, or any action asserting a claim against us that is governed by the internal affairs doctrine. The choice of forum provision may limit a stockholder’s ability to bring a claim in a judicial forum that it finds favorable for disputes with us or our directors, officers or other employees, which may discourage such lawsuits against us and our directors, officers and other employees. Alternatively, if a court were to find the choice of forum provision contained in our certificate of incorporation to be inapplicable or unenforceable in an action, we may incur additional costs associated with resolving such action in other jurisdictions, which could adversely affect our business and financial condition.
We are an “emerging growth company,” and any decision on our part to comply only with certain reduced reporting and disclosure requirements applicable to emerging growth companies could make our Class A common stock less attractive to investors.
We are an “emerging growth company,” as defined in the Jumpstart Our Business Startups, or JOBS, Act enacted in April 2012, and, for as long as we continue to be an “emerging growth company,” we may choose to take advantage of exemptions from various reporting requirements applicable to other public companies but not to “emerging growth companies,” including, but not limited to, not being required to have our independent registered public accounting firm audit our internal control over financial reporting under Section 404, reduced disclosure obligations regarding executive compensation in our periodic reports and proxy statements, and exemptions from the requirements of holding a nonbinding advisory vote on executive compensation and stockholder approval of any golden parachute payments not previously approved. We could be an “emerging growth company” for up to
-42-
Table of Contents
five years following the closing of this offering, although, if we have more than $1.0 billion in annual revenue, if the market value of our common stock that is held by non-affiliates exceeds $700 million as of June 30 of any year, or we issue more than $1.0 billion of non-convertible debt over a three-year period before the end of that five-year period, we would cease to be an “emerging growth company” as of the following December 31. We cannot predict if investors will find our Class A common stock less attractive if we choose to rely on these exemptions. If some investors find our Class A common stock less attractive as a result of any choices to reduce future disclosure, there may be a less active trading market for our Class A common stock and our stock price may be more volatile.
As an “emerging growth company” the JOBS Act, allows us to delay adoption of new or revised accounting pronouncements applicable to public companies until such pronouncements are made applicable to private companies. We have elected to use this extended transition period under the JOBS Act. As a result, our financial statements may not be comparable to the financial statements of issuers who are required to comply with the effective dates for new or revised accounting standards that are applicable to public companies, which may make our common stock less attractive to investors.
We will incur increased costs by being a public company.
As a public company, and particularly after we cease to be an “emerging growth company,” we will incur greater legal, accounting and other expenses that we did not incur as a private company, including costs associated with public company reporting requirements. We also anticipate that we will incur costs associated with relatively recently adopted corporate governance requirements, including requirements of the SEC and The NASDAQ Global Market. We expect these rules and regulations to increase our legal and financial compliance costs and to make some activities more time-consuming and costly. We also expect that these rules and regulations may make it more difficult and more expensive for us to obtain director and officer liability insurance and we may be required to accept reduced policy limits and coverage or incur substantially higher costs to obtain the same or similar coverage. As a result, it may be more difficult for us to attract and retain qualified individuals to serve on our board of directors or as executive officers. We are currently evaluating and monitoring developments with respect to these rules, and we cannot predict or estimate the amount of additional costs we may incur or the timing of such costs.
When our independent registered public accounting firm is required to undertake an assessment of our internal control over financial reporting, the cost of our compliance with Section 404 will correspondingly increase. Moreover, if we are not able to comply with the requirements of Section 404 applicable to us in a timely manner, or if we or our independent registered public accounting firm identifies deficiencies in our internal control over financial reporting that are deemed to be material weaknesses, the market price of our stock could decline and we could be subject to sanctions or investigations by the SEC or other regulatory authorities, which would require additional financial and management resources.
-43-
Table of Contents
SPECIAL NOTE REGARDING FORWARD-LOOKING STATEMENTS
This prospectus contains forward-looking statements that are based on management’s beliefs and assumptions and on information currently available to management. Some of the statements in the sections of this prospectus captioned “Prospectus Summary,” “Risk Factors,” “Management’s Discussion and Analysis of Financial Condition and Results of Operations” and “Business” and elsewhere in this prospectus contain forward-looking statements. In some cases, you can identify forward-looking statements by the following words: “may,” “will,” “could,” “would,” “should,” “expect,” “intend,” “plan,” “anticipate,” “believe,” “estimate,” “predict,” “project,” “potential,” “continue,” “ongoing” or the negative of these terms or other comparable terminology, although not all forward-looking statements contain these words.
These statements involve risks, uncertainties, assumptions and other factors that may cause actual results, levels of activity, performance or achievements to be materially different from the information expressed or implied by these forward-looking statements. Although we believe that we have a reasonable basis for each forward-looking statement contained in this prospectus, we caution you that these statements are based on a combination of facts and factors currently known by us and our projections of the future, about which we cannot be certain. Forward-looking statements in this prospectus include, but are not limited to, statements about:
| • | our future financial performance, including our expectations regarding our revenue, cost of revenue, gross profit or gross margin, operating expenses, ability to generate cash flow and ability to achieve and maintain future profitability; |
| • | the impact of competition in our industry and innovation by our competitors; |
| • | the anticipated trends, growth rates and challenges in our business and in the TBM market; |
| • | maintaining and expanding our customer base and our relationships with go-to-market partners; |
| • | our liquidity and working capital requirements; |
| • | our anticipated growth and growth strategies and our ability to effectively manage that growth and effect these strategies; |
| • | our ability to sell our solutions and expand internationally; |
| • | our involvement with, and the activities of, the TBM Council; |
| • | the reliability of the third-party infrastructure on which our solutions depend; |
| • | our ability to hire and retain necessary qualified employees to expand our operations; |
| • | our ability to adequately protect our intellectual property; |
| • | the effect on our business of litigation to which we are or may become a party; |
| • | our ability to stay abreast of new or modified laws and regulations that currently apply or become applicable to our business both in the United States and internationally; |
-44-
Table of Contents
| • | the increased expenses and administrative workload associated with being a public company; |
| • | our ability to maintain an effective system of internal controls necessary to accurately report our financial results and prevent fraud; |
| • | our use of the net proceeds from this offering; and |
| • | the estimates and estimate methodologies used in preparing our consolidated financial statements and determining option exercise prices. |
In addition, you should refer to the section of this prospectus captioned “Risk Factors” for a discussion of important factors that may cause actual results to differ materially from those expressed or implied by the forward-looking statements. As a result of these factors, we cannot assure you that the forward-looking statements in this prospectus will prove to be accurate. Furthermore, if the forward-looking statements prove to be inaccurate, the inaccuracy may be material. In light of the significant uncertainties in these forward-looking statements, you should not regard these statements as a representation or warranty by us or any other person that we will achieve our objectives and plans in any specified time frame, or at all. We undertake no obligation to publicly update any forward-looking statements, whether as a result of new information, future events or otherwise, except as required by law.
Unless otherwise indicated, information contained in this prospectus concerning our industry and the market in which we operate, including our general expectations, market position, market opportunity and market size, is based on information from various sources, including independent industry publications like those generated by Gartner, Inc. In presenting this information, we have also made assumptions based on such data and other similar sources and on our knowledge of, and our experience to date in, the markets for our service and related solutions. These data involve a number of assumptions and limitations, and you are cautioned not to give undue weight to such estimates. While we believe the market position, opportunity and market size information included in this prospectus is generally reliable, such information is inherently imprecise. In addition, projections, assumptions and estimates of our future performance and the future performance of the industry in which we operate are necessarily subject to a high degree of uncertainty and risk due to a variety of factors, including those described in “Risk Factors” and elsewhere in this prospectus. These and other factors could cause results to differ materially from those expressed in the estimates made by the independent parties and by us.
The Gartner reports described herein, or the Gartner Reports, represent research opinion or viewpoints published, as part of a syndicated subscription service, by Gartner, Inc., or Gartner. Each Gartner Report speaks as of its original publication date (and not as of the date of this prospectus) and the opinions expressed in the Gartner Reports are subject to change without notice.
In certain instances where the Gartner Reports are identified as the sources of market and industry data contained in this prospectus, the applicable report is identified by superscript notations. The sources of these data are provided below:
| (1) | Gartner, Forecast: Enterprise IT Spending by Vertical Industry Market, Worldwide, 2014-2020, 2Q16 Update, July 25, 2016. |
| (2) | Gartner, IT Key Metrics Data 2016; Key Industry Measures: Professional Services Analysis: Current Year, December 14, 2015. |
-45-
Table of Contents
We estimate that the net proceeds to us from the sale of the shares of Class A common stock in this offering will be approximately $74.8 million, or approximately $86.5 million if the underwriters exercise their option to purchase additional shares in full, based upon an assumed initial price to public of $14.00 per share, the midpoint of the estimated offering price range set forth on the cover page of this prospectus, and after deducting underwriting discounts and commissions and estimated offering expenses payable by us.
Each $1.00 increase (decrease) in the assumed initial price to public of $14.00 per share, would increase (decrease) the net proceeds to us from this offering by approximately $5.6 million, assuming that the number of shares offered by us, as set forth on the cover page of this prospectus, remains the same, and after deducting underwriting discounts and commissions and estimated offering expenses payable by us. We may also increase or decrease the number of shares we are offering. Each increase (decrease) of 500,000 in the number of shares offered by us would increase (decrease) the net proceeds to us from this offering by approximately $6.5 million, assuming that the assumed initial price to public remains the same, and after deducting underwriting discounts and commissions and estimated offering expenses payable by us. We do not expect that a change in the initial price to public or the number of shares by these amounts would have a material effect on our uses of the proceeds from this offering, although it may accelerate the time at which we will need to seek additional capital.
The principal purposes of this offering are to create a public market for our Class A common stock, facilitate our future access to the public capital markets and improve brand awareness, as well as to obtain additional capital. We intend to use the net proceeds to us from this offering to repay $20.2 million principal and prepayment fees for amounts borrowed under our credit facilities, and the remainder for working capital and general corporate purposes. Other than the repayment of indebtedness we have not quantified or allocated any specific portion of the net proceeds or range of net proceeds to any particular purpose. Additionally, we may choose to expand our current business through acquisitions of, or investments in, other complementary businesses, technologies, or other assets. However, we currently have no agreements or commitments with respect to any such acquisitions or investments.
We cannot specify with certainty all of the particular uses for the net proceeds to be received upon the closing of this offering. In addition, the amount, allocation and timing of our actual expenditures will depend upon numerous factors. Pending other uses, we intend to invest the proceeds in interest-bearing, investment-grade instruments, certificates of deposit or direct or guaranteed obligations of the U.S. government, or hold as cash. We cannot predict whether the proceeds invested will yield a favorable return. Our management will have broad discretion in the application of the net proceeds we receive from our initial public offering, and investors will be relying on the judgment of our management regarding the application of the net proceeds.
The $10.0 million principal amount of term borrowings under our senior credit facility to be repaid from the net proceeds of this offering accrues interest at a floating rate equal to the prime rate plus 1.25% and is scheduled to mature on April 20, 2020. The $10.0 million principal amount of term borrowings under our subordinated loan and security agreement to be repaid from the net proceeds of this offering accrues interest at 9.5% and is scheduled to mature on April 20, 2019. We used the proceeds of such borrowings for working capital. In addition, we intend to pay a prepayment penalty and a final payment fee in the aggregate amount of $200,000 from the net proceeds of this offering incurred in connection with the foregoing repayment under our subordinated loan and security agreement.
-46-
Table of Contents
We have never declared or paid any cash dividends on our common stock or any other securities. We anticipate that we will retain all available funds and any future earnings, if any, for use in the operation of our business and do not anticipate paying cash dividends in the foreseeable future. In addition, our credit facilities materially restrict, and future debt instruments we issue may materially restrict, our ability to pay dividends on our Class A common stock or Class B common stock. Payment of future cash dividends, if any, will be at the discretion of the board of directors after taking into account various factors, including our financial condition, operating results, current and anticipated cash needs, the requirements of current or then-existing debt instruments and other factors the board of directors deems relevant.
-47-
Table of Contents
The following table sets forth our cash and cash equivalents and capitalization as of June 30, 2016:
| • | on an actual basis; |
| • | on a pro forma basis, to reflect: (1) the automatic conversion of all outstanding shares of our convertible preferred stock as of June 30, 2016 into an aggregate of 18,239,475 shares of Class B common stock, which conversion will occur immediately prior to the closing of this offering, as if such conversion had occurred on June 30, 2016; (2) the conversion of warrants to purchase 27,321 shares of convertible preferred stock into warrants to purchase 27,321 shares of Class B common stock; and (3) the filing of our amended and restated certificate of incorporation immediately prior to the closing of this offering; and |
| • | on a pro forma as adjusted basis, giving effect to (a) the pro forma adjustments set forth above, (b) the sale and issuance by us of 6,000,000 shares of Class A common stock in this offering at an assumed initial price to public of $14.00 per share, the midpoint of the estimated offering price range set forth on the cover page of this prospectus, after deducting underwriting discounts and commissions and estimated offering expenses payable by us and (c) the application of such proceeds as described in the section of this prospectus captioned “Use of Proceeds.” |
-48-
Table of Contents
Investors should read the information in this table together with the financial statements and related notes to those statements, as well as the sections of this prospectus captioned “Selected Consolidated Financial Data” and “Management’s Discussion and Analysis of Financial Condition and Results of Operations.”
| As of June 30, 2016 | ||||||||||||
| Actual | Pro Forma | Pro Forma As Adjusted(1) |
||||||||||
| (in thousands, except share and per share amounts) | ||||||||||||
| Cash and cash equivalents |
$ | 42,052 | $ | 42,052 | $ | 96,672 | ||||||
|
|
|
|
|
|
|
|||||||
| Long-term debt, current and non-current, net of debt issuance costs |
$ | 19,432 | $ | 19,432 | $ | — | ||||||
| Preferred stock warrant liability |
406 | — | — | |||||||||
| Convertible preferred stock, $0.0001 par value per share; issuable in series, 18,430,604 shares authorized, 18,239,475 shares issued and outstanding, actual; no shares authorized, issued or outstanding, pro forma and pro forma as adjusted |
133,809 | — | — | |||||||||
| Stockholders’ (deficit) equity: |
||||||||||||
| Preferred stock, $0.0001 par value per share, no shares authorized, issued or outstanding, actual; 5,000,000 shares authorized, no shares issued and outstanding, pro forma and pro forma as adjusted |
— | — | — | |||||||||
| Common stock, $0.0001 par value per share, 44,100,000 shares authorized, 13,046,364 shares issued and outstanding, actual; no shares authorized, issued or outstanding pro forma and pro forma as adjusted |
1 | — | — | |||||||||
| Class A common stock, $0.0001 par value per share, no shares authorized, issued or outstanding, actual; 451,000,000 shares authorized, no shares issued or outstanding, pro forma; 451,000,000 shares authorized, 6,000,000 shares issued and outstanding, pro forma as adjusted |
— | — | 1 | |||||||||
| Class B common stock, $0.0001 par value per share, no shares authorized, issued or outstanding, actual; 44,000,000 shares authorized, 31,285,839 shares issued and outstanding, pro forma and pro forma as adjusted |
— | 3 | 3 | |||||||||
| Additional paid-in capital |
31,720 | 165,933 | 240,752 | |||||||||
| Accumulated other comprehensive loss |
— | — | — | |||||||||
| Accumulated deficit |
(183,652 | ) | (183,652 | ) | (184,420 | ) | ||||||
|
|
|
|
|
|
|
|||||||
| Total stockholders’ (deficit) equity |
(151,931 | ) | (17,716 | ) | 56,336 | |||||||
|
|
|
|
|
|
|
|||||||
| Total capitalization |
$ | 1,716 | $ | 1,716 | $ | 56,336 | ||||||
|
|
|
|
|
|
|
|||||||
| (1) | Each $1.00 increase (decrease) in the assumed initial price to public of $14.00 per share, would increase (decrease) each of the pro forma as adjusted cash and equivalents, additional paid-in capital, total stockholders’ (deficit) equity and total capitalization by approximately $5.6 million, assuming that the number of shares offered by us, as set forth on the cover page of this prospectus, remains the same, and after deducting underwriting discounts and commissions and estimated offering expenses payable by us. We may also increase or decrease the number of shares we are offering. Each increase (decrease) of 500,000 in the number of shares offered by us would increase (decrease) each of the pro forma as adjusted cash and cash equivalents, additional paid-in capital, total stockholders’ (deficit) equity and total capitalization by approximately $6.5 million, assuming that the assumed initial price to public remains the same, and after deducting underwriting discounts and commissions and estimated offering expenses payable by us. The pro forma as adjusted information discussed above is illustrative only and will be adjusted based on the actual initial price to public and other terms of this offering determined at pricing. |
-49-
Table of Contents
The number of shares of common stock to be outstanding following this offering is based on 31,285,839 shares of common stock outstanding as of June 30, 2016, giving effect to the conversion of all outstanding shares of convertible preferred stock into an aggregate of 18,239,475 shares of Class B common stock immediately prior to the closing of this offering. The outstanding share information in the table above excludes as of June 30, 2016:
| • | 11,394,824 shares of Class B common stock issuable upon exercise of options outstanding as of June 30, 2016, at a weighted-average exercise price of $9.28 per share; |
| • | 551,548 shares of Class B common stock reserved for future issuance under our 2007 Stock Plan as of June 30, 2016; provided, however, that upon the effectiveness of the registration statement of which this prospectus forms a part, our 2007 Stock Plan will terminate so that no further awards may be granted under our 2007 Stock Plan; |
| • | 222,920 shares of Class B common stock reserved for future issuance under our 2011 Executive Equity Incentive Plan as of June 30, 2016; provided, however, that upon the effectiveness of the registration statement of which this prospectus forms a part, our 2011 Executive Equity Incentive Plan will terminate so that no further awards may be granted under our 2011 Executive Equity Incentive Plan; |
| • | an aggregate of 4,550,000 shares of Class A common stock reserved for future issuance under our 2016 Equity Incentive Plan and 2016 Employee Stock Purchase Plan, each of which will become effective on the business day immediately prior to the date of effectiveness of the registration statement of which this prospectus forms a part; and |
| • | 75,214 shares of Class B common stock issuable upon the exercise of warrants outstanding as of June 30, 2016, at a weighted-average exercise price of $9.52 per share. |
-50-
Table of Contents
Investors purchasing Class A common stock in this offering will experience immediate and substantial dilution in the pro forma net tangible book value of their shares of Class A common stock. Dilution in pro forma net tangible book value represents the difference between the price to public per share of our Class A common stock and the pro forma as adjusted net tangible book value per share of our common stock immediately after the offering. Pro forma net tangible book value per share represents our total tangible assets less total liabilities, divided by the number of outstanding shares of Class A common stock and Class B common stock.
After giving effect to (1) the automatic conversion of our outstanding convertible preferred stock into an aggregate of 18,239,475 shares of Class B common stock immediately prior to the closing of this offering, (2) the issuance of 6,000,000 shares of Class A common stock in this offering and (3) receipt of the net proceeds from our sale of 6,000,000 shares of Class A common stock in this offering at an assumed initial price to public of $14.00 per share, the midpoint of the estimated offering price range set forth on the cover page of this prospectus, after deducting underwriting discounts and commissions and estimated offering expenses payable by us, our pro forma as adjusted net tangible book value as of June 30, 2016 would have been approximately $54.6 million, or $1.47 per share. This represents an immediate increase in pro forma as adjusted net tangible book value of $2.12 per share to existing stockholders and an immediate dilution of $12.53 per share to new investors purchasing Class A common stock in this offering.
The following table illustrates this dilution on a per share basis to new investors:
| Assumed initial price to public per share |
$ | 14.00 | ||||||
| Pro forma net tangible book value per share before this offering |
$ | (0.65 | ) | |||||
| Increase in net tangible book value per share attributable to investors participating in this offering |
2.12 | |||||||
|
|
|
|||||||
| Pro forma as adjusted net tangible book value per share, as adjusted to give effect to this offering |
1.47 | |||||||
|
|
|
|||||||
| Pro forma as adjusted dilution per share to investors participating in this offering |
$ | 12.53 |
Each $1.00 increase (decrease) in the assumed initial price to public of $14.00 per share, would increase (decrease) our pro forma as adjusted net tangible book value by approximately $5.6 million, or approximately $0.15 per share, and increase (decrease) the dilution per share to investors in this offering by approximately $0.85 per share, assuming that the number of shares offered by us, as set forth on the cover page of this prospectus, remains the same, and after deducting underwriting discounts and commissions and estimated offering expenses payable by us. We may also increase or decrease the number of shares we are offering. Each increase of 500,000 in the number of shares offered by us would increase our pro forma as adjusted net tangible book value by approximately $6.5 million, or $0.15 per share, and the dilution per share to investors participating in this offering would be $12.38 per share, assuming that the assumed initial price to public remains the same, and after deducting underwriting discounts and commissions and estimated offering expenses payable by us. Similarly, each decrease of 500,000 in the number of shares offered by us would decrease our pro forma as adjusted net tangible book value by approximately $6.5 million, or $0.16 per share, and the dilution per share to investors participating in this offering would be $12.69 per share, assuming that the assumed initial price to public remains the same, and after deducting underwriting discounts and commissions and estimated offering expenses payable by us. The pro forma as adjusted information discussed above is illustrative only and will be adjusted based on the actual initial price to public and other terms of this offering determined at pricing.
If the underwriters exercise their option in full to purchase 900,000 additional shares of Class A common stock in this offering, the pro forma as adjusted net tangible book value per share after the offering would be $1.74 per share, the increase in the pro forma net tangible book value per share
-51-
Table of Contents
to existing stockholders would be $0.27 per share and the pro forma dilution to new investors purchasing Class A common stock in this offering would be $12.26 per share.
The following table summarizes, on a pro forma basis as of June 30, 2016, the differences between the number of shares of common stock purchased from us, the total consideration and the weighted-average price per share paid by existing stockholders and by investors participating in this offering at an assumed initial price to public of $14.00 per share, before deducting underwriting discounts and commissions and estimated offering expenses payable by us:
|
Shares Purchased |
Total Consideration |
Weighted- Average Price Per Share |
||||||||||||||||||
| Number | Percent | Amount (In thousands) |
Percent | |||||||||||||||||
| Existing stockholders before this offering |
31,285,839 | 84 | % | $ | 143,347 | 63 | % | $ | 4.58 | |||||||||||
| Investors participating in this offering |
6,000,000 | 16 | 84,000 | 37 | 14.00 | |||||||||||||||
|
|
|
|
|
|
|
|
|
|||||||||||||
| Total |
37,285,839 | 100 | % | $ | 227,347 | 100 | % | 6.10 | ||||||||||||
|
|
|
|
|
|
|
|
|
|||||||||||||
Each $1.00 increase (decrease) in the assumed initial price to public of $14.00 per share, would increase (decrease) total consideration paid by new investors by $6.0 million, assuming that the number of shares offered by us, as set forth on the cover page of this prospectus, remains the same. We may also increase or decrease the number of shares we are offering. Each increase (decrease) of 500,000 in the number of shares offered by us would increase (decrease) total consideration paid by new investors by $7.0 million, assuming that the assumed initial price to public remains the same.
The outstanding share information in the table above excludes as of June 30, 2016:
| • | 11,394,824 shares of Class B common stock issuable upon exercise of options outstanding as of June 30, 2016, at a weighted-average exercise price of $9.28 per share; |
| • | 551,548 shares of Class B common stock reserved for future issuance under our 2007 Stock Plan as of June 30, 2016; provided, however, that upon the effectiveness of the registration statement of which this prospectus forms a part, our 2007 Stock Plan will terminate so that no further awards may be granted under our 2007 Stock Plan; |
| • | 222,920 shares of Class B common stock reserved for future issuance under our 2011 Executive Equity Incentive Plan as of June 30, 2016; provided, however, that upon the effectiveness of the registration statement of which this prospectus forms a part, our 2011 Executive Equity Incentive Plan will terminate so that no further awards may be granted under our 2011 Executive Equity Incentive Plan; |
| • | an aggregate of 4,550,000 shares of Class A common stock reserved for future issuance under our 2016 Equity Incentive Plan and 2016 Employee Stock Purchase Plan, each of which will become effective on the business day immediately prior to the date of effectiveness of the registration statement of which this prospectus forms a part; and |
| • | 75,214 shares of Class B common stock issuable upon the exercise of warrants outstanding as of June 30, 2016, at a weighted-average exercise price of $9.52 per share, after conversion of the convertible preferred stock. |
Share reserves for the equity incentive plans will also be subject to automatic annual increases in accordance with the terms of the plans. To the extent that new options are issued under the equity benefit plans or we issue additional shares of common stock in the future, there will be further dilution to investors participating in this offering.
-52-
Table of Contents
SELECTED CONSOLIDATED FINANCIAL DATA
We derived the following selected consolidated statements of operations data for the years ended December 31, 2014 and 2015 and the selected consolidated balance sheet data as of December 31, 2014 and 2015 from audited consolidated financial statements appearing elsewhere in this prospectus. We derived the following selected consolidated statement of operations data for the year ended December 31, 2013, and the selected consolidated balance sheet data as of December 31, 2013, from audited consolidated financial statements not included in this prospectus. We derived the following selected consolidated statements of operations data for the six months ended June 30, 2015 and 2016 and the summary consolidated balance sheet data as of June 30, 2016 from unaudited consolidated financial statements appearing elsewhere in this prospectus. In the opinion of management, the unaudited consolidated financial statements reflect all adjustments, which include normal recurring adjustments, necessary for a fair presentation of the financial statements. Historical results are not necessarily indicative of the results that may be expected in the future and the results for the six months ended June 30, 2016 are not necessarily indicative of the results that may be expected for the full year or any other period. The selected financial data set forth below should be read together with the financial statements and the related notes to those statements, as well as the sections of this prospectus captioned “Management’s Discussion and Analysis of Financial Condition and Results of Operations.”
| Year Ended December 31, | Six Months Ended June 30, |
|||||||||||||||||||
| 2013 | 2014 | 2015 | 2015 | 2016 | ||||||||||||||||
| (in thousands, except per share amounts) | ||||||||||||||||||||
| Consolidated Statements of Operations Data |
||||||||||||||||||||
| Revenue: |
||||||||||||||||||||
| Subscription |
$ | 54,206 | $ | 78,719 | $ | 99,924 | $ | 47,242 | $ | 61,681 | ||||||||||
| Professional services |
19,562 | 27,896 | 29,327 | 14,913 | 13,941 | |||||||||||||||
|
|
|
|
|
|
|
|
|
|
|
|||||||||||
| Total revenue |
73,768 | 106,615 | 129,251 | 62,155 | 75,622 | |||||||||||||||
| Cost of revenue: |
||||||||||||||||||||
| Subscription(1) |
8,325 | 14,686 | 23,457 | 11,142 | 13,039 | |||||||||||||||
| Professional services(1) |
19,034 | 25,731 | 25,720 | 13,036 | 12,712 | |||||||||||||||
|
|
|
|
|
|
|
|
|
|
|
|||||||||||
| Total cost of revenue(1) |
27,359 | 40,417 | 49,177 | 24,178 | 25,751 | |||||||||||||||
|
|
|
|
|
|
|
|
|
|
|
|||||||||||
| Gross profit |
46,409 | 66,198 | 80,074 | 37,977 | 49,871 | |||||||||||||||
|
|
|
|
|
|
|
|
|
|
|
|||||||||||
| Operating expenses: |
||||||||||||||||||||
| Research and development(1) |
17,804 | 23,099 | 30,553 | 14,674 | 17,057 | |||||||||||||||
| Sales and marketing(1) |
43,415 | 60,775 | 71,337 | 33,274 | 35,956 | |||||||||||||||
| General and administrative(1) |
8,597 | 14,245 | 17,763 | 7,698 | 10,684 | |||||||||||||||
|
|
|
|
|
|
|
|
|
|
|
|||||||||||
| Total operating expenses |
69,816 | 98,119 | 119,653 | 55,646 | 63,697 | |||||||||||||||
|
|
|
|
|
|
|
|
|
|
|
|||||||||||
| Loss from operations |
(23,407 | ) | (31,921 | ) | (39,579 | ) | (17,669 | ) | (13,826 | ) | ||||||||||
| Other income (expense): |
||||||||||||||||||||
| Interest (expense) income and other, net |
(51 | ) | 2 | (18 | ) | 19 | (434 | ) | ||||||||||||
| Foreign exchange loss |
(163 | ) | (697 | ) | (1,301 | ) | (607 | ) | (407 | ) | ||||||||||
|
|
|
|
|
|
|
|
|
|
|
|||||||||||
| Loss before provision for income taxes |
(23,621 | ) | (32,616 | ) | (40,898 | ) | (18,257 | ) | (14,667 | ) | ||||||||||
| Provision for income taxes |
(114 | ) | (256 | ) | (109 | ) | (149 | ) | (214 | ) | ||||||||||
|
|
|
|
|
|
|
|
|
|
|
|||||||||||
| Net loss |
$ | (23,735 | ) | $ | (32,872 | ) | $ | (41,007 | ) | $ | (18,406 | ) | $ | (14,881 | ) | |||||
|
|
|
|
|
|
|
|
|
|
|
|||||||||||
| Net loss per share attributable to common stockholders, basic and diluted |
$ | (2.11 | ) | $ | (2.72 | ) | $ | (3.24 | ) | $ | (1.47 | ) | $ | (1.14 | ) | |||||
|
|
|
|
|
|
|
|
|
|
|
|||||||||||
| Weighted-average shares used to compute net loss per share attributable to common stockholders, basic and diluted |
11,256 | 12,080 | 12,653 | 12,485 | 13,016 | |||||||||||||||
|
|
|
|
|
|
|
|
|
|
|
|||||||||||
| Pro forma net loss per share attributable to common stockholders, basic and diluted(2) |
$ | (1.33 | ) | $ | (0.48 | ) | ||||||||||||||
|
|
|
|
|
|||||||||||||||||
| Weighted-average shares used to compute pro forma net loss per share attributable to common stockholders, basic and diluted(2) |
30,893 | 31,256 | ||||||||||||||||||
|
|
|
|
|
|||||||||||||||||
-53-
Table of Contents
| (1) | Includes stock-based compensation expense as follows: |
| Year Ended December 31, | Six Months Ended June 30, |
|||||||||||||||||||
| 2013 | 2014 | 2015 | 2015 | 2016 | ||||||||||||||||
| (in thousands) | ||||||||||||||||||||
| Cost of revenue: |
||||||||||||||||||||
| Subscription |
$ | 75 | $ | 220 | $ | 482 | $ | 196 | $ | 332 | ||||||||||
| Professional services |
314 | 609 | 738 | 395 | 367 | |||||||||||||||
| Research and development |
836 | 1,465 | 2,283 | 1,160 | 1,267 | |||||||||||||||
| Sales and marketing |
1,047 | 2,006 | 2,477 | 1,210 | 1,441 | |||||||||||||||
| General and administrative |
789 | 1,466 | 1,835 | 894 | 1,008 | |||||||||||||||
|
|
|
|
|
|
|
|
|
|
|
|||||||||||
| Total stock-based compensation |
$ | 3,061 | $ | 5,766 | $ | 7,815 | $ | 3,855 | $ | 4,415 | ||||||||||
|
|
|
|
|
|
|
|
|
|
|
|||||||||||
| (2) | See Note 8 of the notes to our consolidated financial statements included in this prospectus for an explanation of the method used to calculate basic and diluted net loss per share and pro forma net loss per share attributable to common stockholders and the weighted-average number of shares used in the computation of the per share amounts. |
| As of December 31, | As of June 30, 2016 |
|||||||||||||||
| 2013 | 2014 | 2015 | ||||||||||||||
| (in thousands) | ||||||||||||||||
| Consolidated Balance Sheet Data |
||||||||||||||||
| Cash and cash equivalents |
$ | 35,816 | $ | 19,686 | $ | 17,256 | $ | 42,052 | ||||||||
| Working capital, excluding deferred revenue |
77,198 | 66,574 | 61,544 | 71,965 | ||||||||||||
| Total assets |
110,509 | 108,462 | 99,151 | 107,485 | ||||||||||||
| Deferred revenue, current and non-current |
46,259 | 63,289 | 83,225 | 82,184 | ||||||||||||
| Long-term debt, current and non-current, net of debt issuance costs |
— | — | — | 19,432 | ||||||||||||
| Preferred stock warrant liability |
241 | 357 | 414 | 406 | ||||||||||||
| Convertible preferred stock |
133,809 | 133,809 | 133,809 | 133,809 | ||||||||||||
| Accumulated deficit |
(94,892 | ) | (127,764 | ) | (168,771 | ) | (183,652 | ) | ||||||||
| Total stockholders’ deficit |
(86,147 | ) | (111,827 | ) | (142,261 | ) | (151,931 | ) | ||||||||
Non-GAAP Financial Measures
In addition to our results determined in accordance with U.S. generally accepted accounting principles, or GAAP, we believe the following non-GAAP measure is useful in evaluating our business performance. We regularly review the liquidity measure set forth below.
| Year Ended December 31, | Six Months Ended June 30, |
|||||||||||||||||||
| 2013 | 2014 | 2015 | 2015 | 2016 | ||||||||||||||||
| (in thousands) | ||||||||||||||||||||
| Other Non-GAAP Financial Data: |
||||||||||||||||||||
| Free cash flow(1) |
$ | (15,480 | ) | $ | (24,276 | ) | $ | (18,234 | ) | $ | (8,071 | ) | $ | (3,729 | ) | |||||
| (1) | We define free cash flow as net cash used in operating activities, plus purchases of property and equipment. |
We believe free cash flow facilitates period-to-period comparisons of liquidity. We consider free cash flow to be an important measure because it measures the amount of cash we generate from our operations after our capital expenditures and reflects changes in working capital. We use free cash flow in conjunction with traditional GAAP measures as part of our overall assessment of our liquidity, including the preparation of our annual operating budget and quarterly forecasts, to evaluate the effectiveness of our business strategies and to communicate with our board of directors concerning our liquidity.
-54-
Table of Contents
Our definitions may differ from the definitions used by other companies and therefore comparability may be limited. In addition, other companies may not publish these or similar metrics. Thus, our free cash flow should be considered in addition to, not as a substitute for, or in isolation from, measures prepared in accordance with GAAP.
We compensate for these limitations by providing investors and other users of our financial information reconciliations of free cash flow to the related GAAP financial measure, net cash used in operating activities. We encourage investors and others to review our financial information in its entirety, not to rely on any single financial measure and to view free cash flow in conjunction with the related GAAP financial measure.
The following table provides a reconciliation of net cash used in operating activities to free cash flow.
| Year Ended December 31, | Six Months Ended June 30, |
|||||||||||||||||||
| 2013 | 2014 | 2015 | 2015 | 2016 | ||||||||||||||||
| (in thousands) | ||||||||||||||||||||
| Net cash used in operating activities |
$ | (11,264 | ) | $ | (17,957 | ) | $ | (10,591 | ) | $ | (3,312 | ) | $ | (1,409 | ) | |||||
| Plus: purchases of property and equipment |
(4,216 | ) | (6,319 | ) | (7,643 | ) | (4,759 | ) | (2,320 | ) | ||||||||||
|
|
|
|
|
|
|
|
|
|
|
|||||||||||
| Free cash flow |
$ | (15,480 | ) | $ | (24,276 | ) | $ | (18,234 | ) | $ | (8,071 | ) | $ | (3,729 | ) | |||||
|
|
|
|
|
|
|
|
|
|
|
|||||||||||
-55-
Table of Contents
MANAGEMENT’S DISCUSSION AND ANALYSIS OF FINANCIAL CONDITION AND RESULTS OF OPERATIONS
The following discussion and analysis of our financial condition and results of operations should be read in conjunction with our consolidated financial statements and related notes that appear elsewhere in this prospectus. In addition to historical consolidated financial information, the following discussion contains forward-looking statements that reflect our plans, estimates and beliefs. Our actual results could differ materially from those discussed in the forward-looking statements. Factors that could cause or contribute to these differences include those discussed below and elsewhere, particularly in the section of this prospectus captioned “Risk Factors.”
Overview
We are the leading provider of Technology Business Management, or TBM, solutions. Our cloud-based platform and SaaS applications enable IT leaders to analyze, optimize and plan technology investments, and benchmark their financial and operational performance against peers. We empower IT leaders to transform IT into a service provider, navigate the cloud transition, and shift technology resources to drive more business innovation.
We were founded in 2007 to deliver cloud-based TBM solutions to global enterprises. Our cycle of frequent updates has facilitated rapid innovation and the introduction of new applications throughout our history. We began offering our first TBM application via our extensible platform in 2008. Since then, we have continued to invest in product innovation and have consistently introduced new applications and capabilities to the market. Our customer base has grown from over 250 as of June 30, 2015 to over 325 as of June 30, 2016.
Because we offer our applications on a subscription basis, typically on contracts with one- to three-year terms, we have visibility into a substantial portion of future revenue. Subscription fees are based on two primary factors: (1) the customer’s annual costs being managed by the applications; and (2) the applications or capabilities for which the customer has subscribed. For some applications, pricing is also impacted by the number of users. We recognize revenue from subscription fees ratably over the term of the contract. We currently derive a significant portion of subscription revenue from subscriptions to our Cost Transparency application. We sell our offerings primarily through a direct sales force and we engage in a variety of marketing activities, including traditional and online activities as well as participation in, and support of, the TBM Council, which are designed to provide sales lead generation, sales support and market awareness. Customers may subscribe for one or more of our applications, and within those applications they may choose to subscribe for all or a portion of the respective application’s capabilities, which are segmented into modules. For those customers that do not initially implement all of our applications, we seek to sell additional applications and modules over time. We believe that there is a significant opportunity to continue to expand the number of applications deployed by existing customers. We also derive revenue from professional services. Professional services revenue includes revenue from application configuration, integration, change management, education and training services, and conference registration and sponsorship fees. This revenue is largely driven by the number and mix of implementations that we perform in a quarter.
We generate the majority of our revenue in North America; however, we are focused on growing our international business. Revenue generated from customers outside of North America accounted for 19%, 22% and 24% of total revenue in 2014, 2015 and the six months ended June 30, 2016, respectively. For additional information regarding revenue generated from each geographic segment, please see Note 10 of the notes to our consolidated financial statements included in this prospectus.
-56-
Table of Contents
We have grown significantly in a relatively short period of time. Our diverse customer base includes companies across industries and sizes, and our direct sales force has historically targeted organizations with annual IT spend of $100 million or more. Beginning in 2014, we expanded the focus of our sales force to include a broader set of target customers, often referred to as the Global 10,000, which includes many companies with annual IT spend of less than $100 million. We expect these customers will account for an increasing amount of our revenue over time. A substantial majority of our revenue growth in 2014, 2015 and the first six months of 2016 has come from new customers. Our current financial focus is on growing our revenue and expanding our customer base. While we are incurring losses today, we strive to invest in a disciplined manner across all of our functional areas to sustain continued near-term revenue growth and support our long-term initiatives. Our operating expenses have increased significantly in absolute dollars in recent periods, primarily due to employee growth. We had 628 and 694 employees as of June 30, 2015 and 2016, respectively.
We intend to continue investing for long-term growth. We plan to continue to expand our sales and marketing organizations to sell our offerings globally. In addition, we have invested, and expect to continue to invest, in our product development efforts to deliver additional compelling applications and to address customers’ evolving needs. We are also investing in personnel to service our growing customer base. These investments will increase operating expenses on an absolute dollar basis for the foreseeable future. Many of these investments will occur in advance of our experiencing any direct benefit from them and will make it difficult to determine if we are allocating our resources efficiently. However, we expect research and development, sales and marketing, and general and administrative expenses to decrease as a percentage of total revenue over the long term as revenue grows, and we anticipate that we will gain economies of scale as our customer base grows.
Since our inception, we have invested in professional services to help ensure that customers successfully deploy and adopt our applications. Additionally, we continue to expand our professional services partner ecosystem to further support our customers. We believe that our investment in professional services, as well as partners building consulting practices around Apptio, will drive additional customer subscriptions and continued growth in revenue. In addition, over the long term, we expect professional services revenue to decrease as a percentage of total revenue as our customer base continues to grow and as the effort required to deploy our solutions decreases, through product enhancements and our efforts to drive increased customer adoption of our standardized IT operating model, the Apptio TBM Unified Model, or ATUM.
As of June 30, 2016, the average annual subscription contract value from all active customers was approximately $400,000. Average annual subscription contract value has been affected by the fact that, prior to 2014, our sales force focused on selling our entire technology platform to customers, generally with very large IT spend, which resulted in fewer, but larger, deals as compared to today. Add-on sales to existing customers were not a primary focus. Beginning in 2014, our sales force began to focus on selling discrete applications rather than our entire platform to a broader range of customers in the Global 10,000. Under this approach, we often sell one or two applications initially and subsequently target sales opportunities for additional applications. As a result, although some period-to-period variability may be introduced with one or more large contracts, we expect average annual contract value of newly acquired customers to decrease for the foreseeable future.
We had total revenue of $106.6 million and $129.3 million in 2014 and 2015, respectively, reflecting a year-over-year increase of 21%. Subscription revenue was $78.7 million and $99.9 million in 2014 and 2015, respectively, reflecting a year-over-year increase of 27%. For the six months ended June 30, 2015 and 2016, total revenue was $62.2 million and $75.6 million, respectively, reflecting a period-over-period increase of 22%. Subscription revenue was $47.2 million and $61.7 million for the six months ended June 30, 2015 and 2016, respectively, reflecting a period-over-period increase of 31%. We have incurred significant net losses since our inception, including net losses of $32.9 million and $41.0 million in 2014 and 2015, respectively. For the six months ended June 30, 2015 and 2016,
-57-
Table of Contents
net losses were $18.4 million and $14.9 million, respectively. We had an accumulated deficit of $183.7 million as of June 30, 2016. We expect to incur losses for the foreseeable future and may not be able to achieve or sustain profitability.
Our Business Model
Our business model focuses on maximizing the lifetime value of customer relationships. We make significant investments in acquiring new customers and believe that we will be able to achieve a substantial positive return on these investments by retaining customers, increasing the number of applications and modules deployed by customers over time, and increasing the spend managed by our applications. In connection with the acquisition of new customers, we incur significant upfront costs, including sales and marketing costs associated with acquiring new customers, such as sales commission expenses, which are expensed upfront, and marketing costs, which are expensed as incurred. We recognize subscription revenue ratably over the term of the subscription period, which commences when all of the revenue recognition criteria have been met.
Our objective is for each customer relationship to be profitable over its lifetime, however, the costs we incur with respect to any customer relationship may exceed revenue in earlier periods because we recognize those costs faster than we recognize the associated revenue. Over time, we expect a large portion of our customers to renew their subscriptions, purchase additional applications and expand their IT spend managed by our applications. We also expect the proportion of annual revenue from existing customers to grow relative to annual revenue from new customers. Our sales and marketing expense for renewals and additional sales to existing customers are significantly less than those for sales to new customers while the cost of revenue remains relatively constant. As a result, we believe the mix shift over time between new and existing customers will have a positive impact on our operating margins. Specifically, as the percentage of our annual revenue from existing customers grows relative to the annual revenue from new customers, we would expect the percentage of revenue spent on sales and marketing to decline.
To provide a better understanding of the economics of customer relationships under our current sales strategy, we are providing an analysis of the customers we acquired in 2014, which we refer to as the 2014 Cohort. The 2014 Cohort includes every customer we acquired in 2014 with an initial annual subscription contract value of not more than $500,000. The 2014 Cohort consists of 67 of the 78 new customers we acquired in 2014. While we expect to have customers with initial annual subscription contract value above $500,000 in the future, and we expect such customers will continue to contribute meaningfully to our revenue, we excluded customers with annual subscription contract value above $500,000 because they are well above our historical average, and because sales of not more than $500,000 are representative of the typical annual subscription contract value we expect under our current sales strategy.
We measure the success of our current sales strategy in part by our ability to retain and upsell our customers over time. As seen in the chart below, as of December 31, 2015, the aggregate annual subscription contract value for the 2014 Cohort grew by approximately 20% on a net basis. We calculate the aggregate net annual subscription contract value by dividing the annual subscription contract value for the 2014 Cohort measured as of December 31, 2015 by the annual subscription contract value for the 2014 Cohort measured as of January 1, 2015. We retained substantially all customers in the 2014 Cohort and grew the aggregate annual subscription contract value by selling additional applications, selling premium support offerings, and expanding customers’ aggregate IT spend managed by our applications. The aggregate annual subscription contract value for the 11 customers we excluded from the 2014 Cohort because their initial annual contract value was more than $500,000 grew more than 5% on a net basis through December 31, 2015. The aggregate annual subscription contract value for all customers we acquired in 2014, regardless of their initial annual contract value, grew more than 10% on a net basis through December 31, 2015.
-58-
Table of Contents
2014 Cohort Aggregate Net Annual Subscription Contract Value
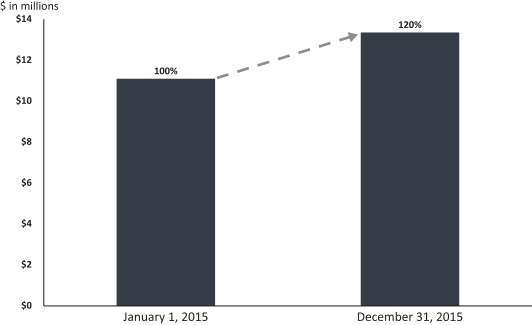
We believe that the economics exhibited to date by the 2014 Cohort are illustrative of the value of our customer base. However, as we increase our customer base we may: spend more in sales and marketing costs to acquire customers, see a shift in our anticipated mix of annual subscription contract values, see a change in renewal rates, or experience lesser or slower sales of additional applications or expansions of customer’s IT spend managed through our applications, any of which could have a significant negative impact on our net revenues and operating results.
Key Factors Affecting Our Performance
Number of Customers
Since we launched our first application, we have made the expansion of our customer base a priority. We believe that our ability to expand our customer base is an indicator of our market penetration, the growth of our business and our potential future business opportunities. We define the number of customers at the end of any particular period as the number of customers with signed agreements for subscriptions with service periods that run through the current or future periods. Multiple companies or divisions within a single consolidated enterprise that each have a separate paid subscription for our applications are each treated as a separate customer. In cases where our customers have subscriptions to our platform obtained through resellers or other distributors, each end customer is counted separately. As of June 30, 2016, we had over 325 customers.
Net Subscription Dollar Retention Rate
We believe that our net subscription dollar retention rate provides insight into our ability to retain and increase revenue from our customers, as well as their potential long-term value to us. Accordingly, we compare the aggregate annual contract value of our customer base at the end of the prior year, which we refer to as the base annual contract value, to the aggregate annual contract value from the same group of customers at the end of the current year, which we refer to as the retained
-59-
Table of Contents
annual contract value. We calculate our net subscription dollar retention rate on an annual basis by dividing the retained annual contract value by the base annual contract value. In the event a customer renews a subscription for a period that begins and ends in the same year, the value of that partial-year subscription is included in our calculation of retained annual contract value. Our net subscription dollar retention rate was approximately 100% for each of 2014 and 2015.
Investment in Growth
We have invested, and intend to continue to invest, in our sales and marketing organization to drive additional revenue and support the growth of our customer base. Any investments we make in our sales and marketing organization will occur in advance of experiencing any benefits from such investments, so it may be difficult for us to determine if we are efficiently allocating our resources in these areas. We have invested, and intend to continue to invest, in expanding our operations, increasing our headcount and developing technology to support our growth. As a result, we expect total operating expenses to increase for the foreseeable future.
Investment in Infrastructure
We have made, and intend to continue to make, substantial investments in infrastructure that will impact cost of revenue, operating expenses and capital expenditures. We intend to invest to support growth at our leased data centers and with public cloud infrastructure providers to deliver enhanced levels of service to our customers. We intend to continue to invest in enhancements to our cloud architecture, which are designed to provide our customers with enhanced security, scalability and availability. We intend to continue to evaluate the expansion of our data center locations to address additional geographic markets. In addition, we intend to expand existing and establish new facilities in the future to accommodate our projected headcount growth at various locations around the world. We expect to incur substantial costs in connection with such expansion efforts, including leasehold improvements, equipment costs, and, if headcount increases faster than we expect, potentially lease termination payments to enter into new leases for larger space.
Focus on Free Cash Flow
We define free cash flow as cash used in operating activities plus purchases of property and equipment. We consider free cash flow to be an important measure that we are focused on to run our business. For more information about free cash flow, see the section of this prospectus captioned “Selected Consolidated Financial Data—Non-GAAP Financial Measures.”
Components of Our Results of Operations
Revenue
We derive revenue from two sources: (1) subscription revenue, which is comprised of subscription fees from customers accessing our platform, fees for additional support beyond the standard support that is included in the basic subscription fees, and fees for subscription-based online training; and (2) professional services, which consist of fees associated with the implementation and configuration of our applications, as well as fees for in-person training and conference registration and sponsorship fees for the TBM Council, the operations of which we consolidate in our financial statements given the nature of our relationship.
Subscription revenue is driven primarily by the acquisition of new customers and renewals by existing customers, the amount of annual spend our customers are licensed to manage with our applications and the number of applications or capabilities for which the customer has subscribed.
-60-
Table of Contents
Support revenue is derived from customers purchasing additional support beyond the standard support that is included in the basic subscription fees. Our contracts typically vary in length between one and three years. All subscription and support fees that are billed in advance of service are recorded in deferred revenue. Subscription and support-based revenue is recognized ratably over the subscription term. As a result, most of the revenue that we report in each period is derived from the recognition of deferred revenue relating to subscriptions entered into during previous periods. Pricing includes multiple environments, hosting and support services, data backup and disaster recovery services, as well as future upgrades, when and if available, offered during the subscription period. We typically invoice our customers for subscription fees in annual increments upon execution of the initial contract or subsequent renewal but contract lengths and billing frequencies may vary. Therefore, the annualized value of the arrangements that we enter into with our customers may not be fully reflected in deferred revenue at any single point in time. Accordingly, we do not believe that the change in deferred revenue for any period is an accurate indicator of future revenue for a given period of time. Our contracts are generally non-cancelable during the subscription term, though a customer can terminate for breach if we materially fail to perform.
A typical new customer implementation takes three to six months depending on the customer’s complexity and timeliness. All professional services fees that are billed in advance of service are recorded in deferred revenue. Most of our professional services engagements are priced on a time-and-materials basis, with the balance priced on a fixed-fee basis. In addition, sometimes partners will perform implementation services directly to our customers for which we do not receive professional services revenue. For time-and-materials arrangements, we recognize revenue as hours are worked at the stated hourly rate. For fixed-fee arrangements, we recognize professional services revenue using the percentage of completion method measured on an hours incurred basis. Professional services yield lower gross margins than subscriptions due to the labor-intensive nature of professional services.
On occasion, we sell our applications through third-party resellers. These arrangements typically call for the reseller to retain a portion of the subscription fee paid by the customer as compensation. Since we are typically responsible for the acceptability of the services purchased by the customer, we are the primary obligor in the transaction and, therefore, record revenue on a gross basis based on the amount billed to the customer. Reseller fees are recognized as sales and marketing expense as incurred.
Cost of Revenue and Gross Margin
Cost of subscription revenue consists primarily of employee-related costs, including payroll, benefits and stock-based compensation expense for our technology operations and customer support teams, fees paid to our managed hosting providers and other third-party service providers, amortization of capitalized software development costs and acquired technology, and allocated overhead costs, which include rent, facilities and costs related to internal IT. We expect cost of subscription revenue to continue to increase in absolute dollars for the foreseeable future as our customer base grows.
Subscription gross margin, or subscription revenue less cost of subscription revenue expressed as a percentage of subscription revenue, can and does fluctuate based on a number of factors, including the timing and extent of the fees that we pay to our hosting providers and other third-party service providers and the timing and extent of the investments that we make in additional data center infrastructure and capabilities. Due to investments we made in additional data centers and public cloud hosting capabilities prior to December 31, 2015, we expect subscription gross margin to increase modestly over the long term, although it may fluctuate from period to period depending on the interplay of the factors discussed above. Because we have data centers in each of our three primary geographies, we expect to be able to more efficiently add capacity within these data centers to support our anticipated customer growth.
-61-
Table of Contents
Cost of professional services revenue consists primarily of personnel costs of our professional services organization, including salaries, employee benefits, travel expenses, bonuses and stock-based compensation expense, as well as allocated overhead costs. In addition, cost of professional services excludes costs associated with TBM Council conferences, which we record as sales and marketing expenses. We expect cost of professional services revenue to continue to increase in absolute dollars for the foreseeable future as we further expand our professional services organization to serve our growing customer base.
Professional services gross margin, or professional services revenue less cost of professional services revenue expressed as a percentage of professional services revenue, can and does fluctuate based on a number of factors, including the timing and extent of our investments in our professional services organization. The primary focus of our professional services business will continue to be providing high-quality customer deployments that allow customers to realize rapid value from our solutions and become long-term, loyal customers. In the future, we may choose to invest in our professional services organization at a pace faster than professional services revenue growth, in which case we may experience a decline in professional services gross margin. We also expect professional services gross margin to be positively affected in periods, particularly the fourth quarter, in which we recognize revenue related to TBM Council events. We expect professional services gross margin to remain relatively consistent over the long term, although it may fluctuate from period to period depending on the interplay of the factors discussed above.
We expect total gross margin to increase modestly over the long term as our subscription revenue increases as a percentage of total revenue, as we realize operational efficiencies in our data centers and public cloud hosting environments, and as we continue to leverage our partners to help us provide professional services, although total gross margin may fluctuate from period to period depending on the interplay of the factors discussed above.
Operating Expenses
Research and Development. Research and development expenses consist primarily of personnel costs, employee benefits, stock-based compensation expense and other headcount-related costs associated with product development, depreciation of equipment used in research and development, and allocated overhead costs. For development costs related to our software and internal use software, qualifying internally developed software costs incurred during the application development stage are capitalized. Costs related to preliminary project activities and post-implementation activities are expensed as incurred. We expect research and development expenses to continue to increase in absolute dollars for the foreseeable future as we continue to increase the functionality and otherwise enhance our platform and develop new applications. However, we expect research and development expenses to decrease modestly as a percentage of total revenue over the long term as our customer base and revenue grows, although research and development expenses may fluctuate as a percentage of total revenue from period to period due to the seasonality of revenue and the timing and extent of these expenses.
Sales and Marketing. Sales and marketing expenses consist primarily of personnel costs for our sales and marketing employees, including sales commissions and incentives, employee benefits and stock-based compensation expense, marketing programs for lead generation, the costs associated with TBM Council events and allocated overhead costs. We immediately expense sales commissions related to acquiring new customers and subsequent renewals from existing customers. We expect sales and marketing expenses to continue to increase and continue to be our largest component of operating expenses for the foreseeable future as we continue to expand our direct sales teams, increase our marketing activities, grow our international operations, build brand awareness and sponsor additional marketing events. However, we expect sales and marketing expenses to decrease
-62-
Table of Contents
as a percentage of total revenue over the long term, although sales and marketing expenses may fluctuate as a percentage of total revenue from period to period due to the seasonality of revenue and the timing and extent of these expenses.
General and Administrative. General and administrative expenses consist primarily of personnel costs and related expenses, including payroll, employee benefits and stock-based compensation expense for executive, finance, legal, human resources, and administrative personnel, professional fees for external legal, accounting and other consulting services and allocated overhead costs. We expect general and administrative expenses will continue to increase in absolute dollars for the foreseeable future as we continue to grow and incur the costs of compliance associated with being a publicly traded company, including increased legal, audit and consulting fees. Although general and administrative expenses may fluctuate as a percentage of total revenue from period to period due to the seasonality of revenue and the timing and extent of these expenses, in the near term, we expect general and administrative expenses to increase as a percentage of total revenue; however, we expect general and administrative expenses to decrease modestly as a percentage of total revenue over the long term as we focus on processes, systems and controls to enable our internal support functions to scale with the growth of our business.
Other Income (Expense)
Interest Income (Expense) and Other, net. Interest income (expense) and other, net consists primarily of interest on our capital leases and debt and fair value adjustments for our preferred stock warrant liability. Interest income is derived from our available-for-sale investments.
Foreign Exchange Loss. Foreign exchange loss consists primarily of foreign currency transaction gains and losses related to the impact of transactions denominated in a foreign currency other than the functional currency (U.S. dollars). As we have expanded our international operations, our exposure to fluctuations in foreign currencies has increased, and we expect this trend to continue.
Provision for Income Taxes. Provision for income taxes consists primarily of income taxes in certain foreign jurisdictions in which we conduct business. As we have expanded our international operations, we have incurred increased foreign tax expense, and we expect this trend to continue. We have a full valuation allowance for net deferred tax assets, including net operating loss carryforwards, and tax credits related primarily to research and development. We expect to maintain this full valuation allowance for the foreseeable future.
-63-
Table of Contents
Results of Operations
The following tables set forth certain consolidated financial data in dollar amounts and as a percentage of total revenue.
| Year Ended December 31, | Six Months Ended June 30, |
|||||||||||||||||||||||||||||||
| 2014 | 2015 | 2015 | 2016 | |||||||||||||||||||||||||||||
| (in thousands) | ||||||||||||||||||||||||||||||||
| Revenue: |
||||||||||||||||||||||||||||||||
| Subscription |
$ | 78,719 | $ | 99,924 | $ | 47,242 | $ | 61,681 | ||||||||||||||||||||||||
| Professional services |
27,896 | 29,327 | 14,913 | 13,941 | ||||||||||||||||||||||||||||
|
|
|
|
|
|
|
|
|
|||||||||||||||||||||||||
| Total revenue |
106,615 | 129,251 | 62,155 | 75,622 | ||||||||||||||||||||||||||||
| Cost of revenue: |
||||||||||||||||||||||||||||||||
| Subscription |
14,686 | 23,457 | 11,142 | 13,039 | ||||||||||||||||||||||||||||
| Professional services |
25,731 | 25,720 | 13,036 | 12,712 | ||||||||||||||||||||||||||||
|
|
|
|
|
|
|
|
|
|||||||||||||||||||||||||
| Total cost of revenue |
40,417 | 49,177 | 24,178 | 25,751 | ||||||||||||||||||||||||||||
|
|
|
|
|
|
|
|
|
|||||||||||||||||||||||||
| Gross profit |
66,198 | 80,074 | 37,977 | 49,871 | ||||||||||||||||||||||||||||
|
|
|
|
|
|
|
|
|
|||||||||||||||||||||||||
| Operating expenses: |
||||||||||||||||||||||||||||||||
| Research and development |
23,099 | 30,553 | 14,674 | 17,057 | ||||||||||||||||||||||||||||
| Sales and marketing |
60,775 | 71,337 | 33,274 | 35,956 | ||||||||||||||||||||||||||||
| General and administrative |
14,245 | 17,763 | 7,698 | 10,684 | ||||||||||||||||||||||||||||
|
|
|
|
|
|
|
|
|
|||||||||||||||||||||||||
| Total operating expenses |
98,119 | 119,653 | 55,646 | 63,697 | ||||||||||||||||||||||||||||
|
|
|
|
|
|
|
|
|
|||||||||||||||||||||||||
| Loss from operations |
(31,921 | ) | (39,579 | ) | (17,669 | ) | (13,826 | ) | ||||||||||||||||||||||||
| Other income (expense): |
||||||||||||||||||||||||||||||||
| Interest income (expense) and other, net |
2 | (18 | ) | 19 | (434 | ) | ||||||||||||||||||||||||||
| Foreign exchange loss |
(697 | ) | (1,301 | ) | (607 | ) | (407 | ) | ||||||||||||||||||||||||
|
|
|
|
|
|
|
|
|
|||||||||||||||||||||||||
| Loss before provision for income taxes |
(32,616 | ) | (40,898 | ) | (18,257 | ) | (14,667 | ) | ||||||||||||||||||||||||
| Provision for income taxes |
(256 | ) | (109 | ) | (149 | ) | (214 | ) | ||||||||||||||||||||||||
|
|
|
|
|
|
|
|
|
|||||||||||||||||||||||||
| Net loss |
$ | (32,872 | ) | $ | (41,007 | ) | $ | (18,406 | ) | $ | (14,881 | ) | ||||||||||||||||||||
|
|
|
|
|
|
|
|
|
|||||||||||||||||||||||||
| Year Ended December 31, | Six Months Ended June 30, |
|||||||||||||||||||||||||||||||
| 2014 | 2015 | 2015 | 2016 | |||||||||||||||||||||||||||||
| (as a percentage of total revenue) | ||||||||||||||||||||||||||||||||
| Revenue: |
||||||||||||||||||||||||||||||||
| Subscription |
74 | % | 77 | % | 76 | % | 82 | % | ||||||||||||||||||||||||
| Professional services |
26 | 23 | 24 | 18 | ||||||||||||||||||||||||||||
|
|
|
|
|
|
|
|
|
|||||||||||||||||||||||||
| Total revenue |
100 | 100 | 100 | 100 | ||||||||||||||||||||||||||||
| Cost of revenue: |
||||||||||||||||||||||||||||||||
| Subscription |
14 | 18 | 18 | 17 | ||||||||||||||||||||||||||||
| Professional services |
24 | 20 | 21 | 17 | ||||||||||||||||||||||||||||
|
|
|
|
|
|
|
|
|
|||||||||||||||||||||||||
| Total cost of revenue |
38 | 38 | 39 | 34 | ||||||||||||||||||||||||||||
|
|
|
|
|
|
|
|
|
|||||||||||||||||||||||||
| Gross profit |
62 | 62 | 61 | 66 | ||||||||||||||||||||||||||||
-64-
Table of Contents
| Year Ended December 31, | Six Months Ended June 30, |
|||||||||||||||||||||||||||||||
| 2014 | 2015 | 2015 | 2016 | |||||||||||||||||||||||||||||
| (as a percentage of total revenue) | ||||||||||||||||||||||||||||||||
| Operating expenses: |
||||||||||||||||||||||||||||||||
| Research and development |
22 | 24 | 24 | 22 | ||||||||||||||||||||||||||||
| Sales and marketing |
57 | 55 | 54 | 48 | ||||||||||||||||||||||||||||
| General and administrative |
13 | 14 | 12 | 14 | ||||||||||||||||||||||||||||
|
|
|
|
|
|
|
|
|
|||||||||||||||||||||||||
| Total operating expenses |
92 | 93 | 90 | 84 | ||||||||||||||||||||||||||||
|
|
|
|
|
|
|
|
|
|||||||||||||||||||||||||
| Loss from operations |
(30 | ) | (31 | ) | (29 | ) | (18 | ) | ||||||||||||||||||||||||
| Other income (expense): |
||||||||||||||||||||||||||||||||
| Interest income (expense) and other, net |
— | — | — | (1 | ) | |||||||||||||||||||||||||||
| Foreign exchange loss |
(1 | ) | (1 | ) | (1 | ) | (1 | ) | ||||||||||||||||||||||||
|
|
|
|
|
|
|
|
|
|||||||||||||||||||||||||
| Loss before provision for income taxes |
(31 | ) | (32 | ) | (30 | ) | (20 | ) | ||||||||||||||||||||||||
|
|
|
|
|
|
|
|
|
|||||||||||||||||||||||||
| Provision for income taxes |
— | — | — | — | ||||||||||||||||||||||||||||
| Net loss |
(31 | )% | (32 | )% | (30 | )% | (20 | )% | ||||||||||||||||||||||||
|
|
|
|
|
|
|
|
|
|||||||||||||||||||||||||
| Year Ended December 31, | Six Months Ended June 30, |
|||||||||||||||||||||||||||||||
| 2014 | 2015 | 2015 | 2016 | |||||||||||||||||||||||||||||
| (dollars in thousands) | ||||||||||||||||||||||||||||||||
| Revenue by geography: |
||||||||||||||||||||||||||||||||
| North America |
$ | 86,565 | $ | 101,192 | $ | 48,778 | $ | 57,400 | ||||||||||||||||||||||||
| Europe |
16,077 | 22,296 | 10,377 | 15,193 | ||||||||||||||||||||||||||||
| APAC |
3,973 | 5,763 | 3,000 | 3,029 | ||||||||||||||||||||||||||||
|
|
|
|
|
|
|
|
|
|||||||||||||||||||||||||
| $ | 106,615 | $ | 129,251 | $ | 62,155 | $ | 75,622 | |||||||||||||||||||||||||
|
|
|
|
|
|
|
|
|
|||||||||||||||||||||||||
| Year Ended December 31, | Six Months Ended June 30, |
|||||||||||||||||||||||||||||||
| 2014 | 2015 | 2015 | 2016 | |||||||||||||||||||||||||||||
| (as a percentage of total revenue) | ||||||||||||||||||||||||||||||||
| Revenue by geography: |
||||||||||||||||||||||||||||||||
| North America |
81 | % | 78 | % | 78 | % | 76 | % | ||||||||||||||||||||||||
| Europe |
15 | 17 | 17 | 20 | ||||||||||||||||||||||||||||
| APAC |
4 | 5 | 5 | 4 | ||||||||||||||||||||||||||||
|
|
|
|
|
|
|
|
|
|||||||||||||||||||||||||
| 100 | % | 100 | % | 100 | % | 100 | % | |||||||||||||||||||||||||
|
|
|
|
|
|
|
|
|
|||||||||||||||||||||||||
Six Months Ended June 30, 2015 Compared to the Six Months Ended June 30, 2016
Revenue
| Six Months Ended June 30, |
Change | |||||||||||||||||||||||||||||||
| 2015 | 2016 | Amount | % | |||||||||||||||||||||||||||||
| (dollars in thousands) | ||||||||||||||||||||||||||||||||
| Subscription |
$ | 47,242 | $ | 61,681 | $ | 14,439 | 31 | % | ||||||||||||||||||||||||
| Professional services |
14,913 | 13,941 | (972 | ) | (7 | ) | ||||||||||||||||||||||||||
|
|
|
|
|
|
|
|||||||||||||||||||||||||||
| Total revenue |
$ | 62,155 | $ | 75,622 | $ | 13,467 | 22 | |||||||||||||||||||||||||
|
|
|
|
|
|
|
|||||||||||||||||||||||||||
-65-
Table of Contents
Subscription revenue increased for the six months ended June 30, 2016 primarily due to the impact of new customer acquisition. Our customer count increased 24% from June 30, 2015 to June 30, 2016. Professional services revenue decreased for the six months ended June 30, 2016 primarily due to a decrease in implementation times and a lessening need for our customers to purchase follow-on services after the initial deployment. This decrease is attributable to product enhancements and an increase in the number of packaged service offerings as a percentage of total.
Cost of Revenue and Gross Margin
| Six Months Ended June 30, |
Change | |||||||||||||||||||||||||||||||
| 2015 | 2016 | Amount | % | |||||||||||||||||||||||||||||
| (dollars in thousands) | ||||||||||||||||||||||||||||||||
| Cost of revenue: |
||||||||||||||||||||||||||||||||
| Subscription |
$ | 11,142 | $ | 13,039 | $ | 1,897 | 17 | % | ||||||||||||||||||||||||
| Professional services |
13,036 | 12,712 | (324 | ) | (2 | ) | ||||||||||||||||||||||||||
|
|
|
|
|
|
|
|||||||||||||||||||||||||||
| Total cost of revenue |
$ | 24,178 | $ | 25,751 | $ | 1,573 | 7 | |||||||||||||||||||||||||
|
|
|
|
|
|
|
|||||||||||||||||||||||||||
| Gross margin: |
||||||||||||||||||||||||||||||||
| Subscription |
76 | % | 79 | % | ||||||||||||||||||||||||||||
| Professional services |
13 | 9 | ||||||||||||||||||||||||||||||
| Total gross margin |
61 | 66 | ||||||||||||||||||||||||||||||
The overall increase in cost of subscription revenue was primarily attributable to increased personnel-related costs of $2.4 million driven by headcount growth, which resulted in increased employee compensation, benefits and travel costs of $2.3 million, and additional stock-based compensation of $0.1 million. In addition, data center fees increased by $0.1 million as we increased data center capacity to support our growth, and allocated overhead expenses increased by $0.3 million. These increases were offset by decreased consulting fees of $0.4 million. Additionally, professional services personnel are, on occasion, utilized for services associated with general subscription support. As a result, we reallocate the related personnel costs from cost of professional services to cost of subscription. This cost allocation decreased by $0.2 million as a result of planned improvements in our implementation service cycle, which reduced the need to augment our subscription support personnel. In 2016, we began allocating the cost of hosting internal-use instances of our SaaS applications to the departments using them. This resulted in a reduction of $0.5 million in subscription cost of revenue for the six months ended June 30, 2016. We have evaluated the cost of hosting internal-use instances for the years ended December 31, 2014 and 2015, and for the six months ended June 30, 2015, and determined that the impact was immaterial for reclassification of those financial statements. At June 30, 2016 and 2015, we delivered our service from six data centers located in the United States, Europe and Australia.
The overall decrease in cost of professional services revenue was primarily attributable to a decrease in personnel-related costs consisting of employee compensation, benefits and travel costs of $0.5 million driven by a reduction in headcount due to planned improvements in our implementation service cycle. Outside services decreased $0.1 million, due to a reduction in the use of third parties to supplement internal staff in providing implementation services in 2016.
Subscription gross margin increased as a result of an increase in revenue from growth in our customer base, and expanded utilization of existing hosting infrastructure.
Professional services gross margin declined because planned improvements in our implementation services cycle resulted in a decrease in the number of billable hours. The
-66-
Table of Contents
corresponding decrease in revenue was greater than the corresponding decrease in professional services costs.
Operating Expenses
Research and Development
| Six Months Ended June 30, |
Change | |||||||||||||||
| 2015 | 2016 | Amount | % | |||||||||||||
| (dollars in thousands) | ||||||||||||||||
| Research and development |
$ | 14,674 | $ | 17,057 | $ | 2,383 | 16 | % | ||||||||
| Percentage of total revenue |
24 | % | 22 | % | ||||||||||||
Research and development expenses increased primarily due to increased personnel-related costs of $1.8 million, consisting of increased employee compensation and benefits costs driven by headcount growth. Total headcount in research and development increased 10% from June 30, 2015 to June 30, 2016 as we continued to upgrade and enhance our platform and applications and develop new technologies. Additionally, allocated overhead and internal hosting costs increased by $0.4 million.
Sales and Marketing
| Six Months Ended June 30, |
Change | |||||||||||||||
| 2015 | 2016 | Amount | % | |||||||||||||
| (dollars in thousands) | ||||||||||||||||
| Sales and marketing |
$ | 33,274 | $ | 35,956 | $ | 2,682 | 8 | % | ||||||||
| Percentage of total revenue |
54 | % | 48 | % | ||||||||||||
Sales and marketing expenses increased due to the expansion of our sales force and increased allocated overhead costs. Total headcount in sales and marketing increased 6% from June 30, 2015 to June 30, 2016, contributing to a $2.1 million increase in personnel-related costs, consisting of increased employee compensation, benefits, commissions and increased travel costs associated with our direct sales force of $1.9 million, and additional stock-based compensation of $0.2 million. Allocated overhead costs increased by $0.6 million as a result of additional IT resources and internal hosting costs. These increases were offset by a decrease of $0.1 million for partner commissions.
General and Administrative
| Six Months Ended June 30, |
Change | |||||||||||||||
| 2015 | 2016 | Amount | % | |||||||||||||
| (dollars in thousands) | ||||||||||||||||
| General and administrative |
$ | 7,698 | $ | 10,684 | $ | 2,986 | 39 | % | ||||||||
| Percentage of total revenue |
12 | % | 14 | % | ||||||||||||
General and administrative expenses increased primarily due to a 38% increase in headcount from June 30, 2015 to June 30, 2016 to support our overall growth. Personnel-related expenses increased by $2.7 million, net of allocations, consisting of increased employee compensation, benefits and travel costs.
-67-
Table of Contents
Other Income (Expense)
| Six Months Ended June 30, |
Change | |||||||||||||||
| 2015 | 2016 | Amount | % | |||||||||||||
| (dollars in thousands) | ||||||||||||||||
| Interest income (expense) and other, net |
$ | 19 | $ | (434 | ) | $ | (453 | ) | (2,384 | )% | ||||||
| Foreign exchange loss |
(607 | ) | (407 | ) | 200 | (33 | ) | |||||||||
The increase in interest expense and other, net was primarily attributable to an increase in interest expense associated with the term loan borrowings in the six months ended June 30, 2016. This increase was offset by a decrease in interest expense associated with fair value adjustments related to our mandatorily redeemable preferred stock warrants. The decrease in foreign exchange loss was primarily due to the impact of foreign currency transaction gains and losses.
Provision for income taxes
| Six Months Ended June 30, |
Change | |||||||||||||||
| 2015 | 2016 | Amount | % | |||||||||||||
| (dollars in thousands) | ||||||||||||||||
| Provision for income taxes |
$ | (149 | ) | $ | (214 | ) | $ | (65 | ) | 44 | % | |||||
The increase in provision for income taxes was due to an increase in foreign taxes related to our growing foreign operations.
Year Ended December 31, 2014 Compared to the Year Ended December 31, 2015
Revenue
| Year Ended December 31, | Change | |||||||||||||||||||||||||||||||
| 2014 | 2015 | Amount | % | |||||||||||||||||||||||||||||
| (dollars in thousands) | ||||||||||||||||||||||||||||||||
| Subscription |
$ | 78,719 | $ | 99,924 | $ | 21,205 | 27 | % | ||||||||||||||||||||||||
| Professional services |
27,896 | 29,327 | 1,431 | 5 | ||||||||||||||||||||||||||||
|
|
|
|
|
|
|
|||||||||||||||||||||||||||
| Total revenue |
$ | 106,615 | $ | 129,251 | $ | 22,636 | 21 | |||||||||||||||||||||||||
|
|
|
|
|
|
|
|||||||||||||||||||||||||||
Subscription revenue increased in 2015 primarily due to the impact of new customer acquisition. Our customer base increased 29% from December 31, 2014 to December 31, 2015. Professional services revenue increased in 2015 primarily due to an increase in implementation fees associated with the growth in our customer base.
Cost of Revenue and Gross Margin
| Year Ended December 31, | Change | |||||||||||||||||||||||||||||||
| 2014 | 2015 | Amount | % | |||||||||||||||||||||||||||||
| (dollars in thousands) | ||||||||||||||||||||||||||||||||
| Cost of revenue: |
||||||||||||||||||||||||||||||||
| Subscription |
$ | 14,686 | $ | 23,457 | $ | 8,771 | 60 | % | ||||||||||||||||||||||||
| Professional services |
25,731 | 25,720 | (11 | ) | 0 | |||||||||||||||||||||||||||
|
|
|
|
|
|
|
|||||||||||||||||||||||||||
| Total cost of revenue |
$ | 40,417 | $ | 49,177 | $ | 8,760 | 22 | |||||||||||||||||||||||||
|
|
|
|
|
|
|
|||||||||||||||||||||||||||
| Gross margin: |
||||||||||||||||||||||||||||||||
| Subscription |
81 | % | 77 | % | ||||||||||||||||||||||||||||
| Professional services |
8 | 12 | ||||||||||||||||||||||||||||||
| Total gross margin |
62 | 62 | ||||||||||||||||||||||||||||||
-68-
Table of Contents
The overall increase in cost of subscription revenue was primarily attributable to increased personnel-related costs of $4.9 million driven by headcount growth, which was comprised of increased employee compensation, benefits and travel costs of $4.6 million, and additional stock-based compensation of $0.3 million. In addition, data center fees increased by $0.8 million as we increased data center capacity to support our growth, consulting fees increased by $0.7 million as we enhanced our disaster recovery functionality in each of our data centers, and allocated overhead expenses increased by $0.7 million. Additionally, professional services personnel are, on occasion, utilized for services associated with general subscription support. As a result, we reallocate the related personnel costs from cost of professional services to cost of subscription. This cost allocation increased by $0.3 million due to growth in our customer base and an increase in the number of customers migrating to new versions of our applications. At December 31, 2015, we delivered our service from two data centers in the United States and four data centers internationally, compared to two data centers in the United States and one data center internationally at December 31, 2014. Depreciation and amortization expense also increased by $0.4 million as we expanded our hosting infrastructure to support our customer growth.
Cost of professional services revenue decreased slightly year-over-year due to a decrease in outside services of $1.7 million, as a result of a reduction in our use of third parties to supplement internal staff in providing implementation services in 2015, offset by an increase in personnel-related costs of $1.7 million, driven by headcount growth, consisting of increased employee compensation, benefits and travel costs of $1.5 million and additional stock-based compensation of $0.2 million.
Subscription gross margin decreased as a result of an increase in the number of data centers employed in anticipation of increased capacity requirements from customer base growth. These capacity increases are occurring in advance of generating significant revenue from new customers. Additionally, we increased the use of consulting services in 2015 to assist with the enhancement of disaster recovery functionality in each of our data centers.
Professional services gross margin improved as a result of changes in the way we deploy our applications to our customers, product enhancements that allow deployments to be more efficient, and increased customer adoption of our standardized cost model, ATUM.
Total headcount associated with cost of revenue increased 12% from December 31, 2014 to December 31, 2015 as we invested in additional resources to continue to support our solutions and further develop our professional services group.
Operating Expenses
Research and Development
| Year Ended December 31, | Change | |||||||||||||||
| 2014 | 2015 | Amount | % | |||||||||||||
| (dollars in thousands) | ||||||||||||||||
| Research and development |
$ | 23,099 | $ | 30,553 | $ | 7,454 | 32 | % | ||||||||
| Percentage of total revenue |
22 | % | 24 | % | ||||||||||||
Research and development expenses increased primarily due to increased personnel-related costs of $5.7 million, consisting of increased employee compensation and benefits costs of $4.9 million and an increase in stock-based compensation of $0.8 million. Additionally, allocated overhead costs increased by $1.0 million. Total headcount in research and development increased 14% from December 31, 2014 to December 31, 2015 as we continued to upgrade and enhance our platform and applications and develop new technologies.
-69-
Table of Contents
Sales and Marketing
| Year Ended December 31, | Change | |||||||||||||||
| 2014 | 2015 | Amount | % | |||||||||||||
| (dollars in thousands) | ||||||||||||||||
| Sales and marketing |
$ | 60,775 | $ | 71,337 | $ | 10,562 | 17 | % | ||||||||
| Percentage of total revenue |
57 | % | 55 | % | ||||||||||||
Sales and marketing expenses increased due to the expansion of our sales force, increases in marketing programs to address additional opportunities in new and existing markets, and increased allocated overhead costs. Total headcount in sales and marketing increased 13% from December 31, 2014 to December 31, 2015, contributing to an $8.1 million increase in personnel-related costs. This increase consists of increased employee compensation, benefits and increased travel costs of $7.6 million attributable to the increase in headcount and commission expense from increased sales, and additional stock-based compensation of $0.5 million. Marketing and event costs increased by $1.2 million due to our continued efforts to generate sales leads and build brand awareness, and allocated overhead costs increased by $1.2 million as a result of higher building rent and additional IT resources.
General and Administrative
| Year Ended December 31, | Change | |||||||||||||||
| 2014 | 2015 | Amount | % | |||||||||||||
| (dollars in thousands) | ||||||||||||||||
| General and administrative |
$ | 14,245 | $ | 17,763 | $ | 3,518 | 25 | % | ||||||||
| Percentage of total revenue |
13 | % | 14 | % | ||||||||||||
General and administrative expenses increased primarily due to a 27% increase in headcount from December 31, 2014 to December 31, 2015. Personnel-related expenses increased by $3.7 million, consisting of increased employee compensation, benefits and travel costs of $3.3 million, and additional stock-based compensation of $0.4 million as we added employees to support the growth of our business. These increases were offset by a $0.2 million decrease in professional services fees.
Other Income (Expense)
| Year Ended December 31, | Change | |||||||||||||||
| 2014 | 2015 | Amount | % | |||||||||||||
| (dollars in thousands) | ||||||||||||||||
| Interest income (expense) and other, net |
$ | 2 | $ | (18 | ) | $ | (20 | ) | (1,000 | )% | ||||||
| Foreign exchange loss |
(697 | ) | (1,301 | ) | (604 | ) | 87 | % | ||||||||
The change in interest income (expense) and other, net was primarily attributable to a decrease in interest and other income due primarily to lower investment balances, combined with a decrease in interest expense from fair value adjustments related to our preferred stock warrants. The increase in foreign exchange loss was primarily due to strengthening of the U.S. dollar combined with an increase in foreign currency denominated sales.
Provision for income taxes
| Year Ended December 31, | Change | |||||||||||||||
| 2014 | 2015 | Amount | % | |||||||||||||
| (dollars in thousands) | ||||||||||||||||
| Provision for income taxes |
$ | (256) | $ | (109) | $ | 147 | 57% | |||||||||
The decrease in provision for income taxes was due to a decrease in foreign taxes related to our foreign operations.
-70-
Table of Contents
Quarterly Results of Operations
The following tables set forth selected unaudited quarterly consolidated statements of operations data for each of the quarters indicated, as well as the percentage of total revenue that each line item represented for each quarter. We prepared the quarterly consolidated statements of operations on a basis consistent with the audited consolidated financial statements included elsewhere in this prospectus. In the opinion of management, the financial information reflects all adjustments, consisting only of normal recurring adjustments, which we consider necessary for a fair presentation of this data. This information should be read in conjunction with the audited consolidated financial statements and related notes included elsewhere in this prospectus. The results of historical periods are not necessarily indicative of the results for any future period.
| Three Months Ended | ||||||||||||||||||||||||||||||||
| September 30, 2014 |
December 31, 2014 |
March 31, 2015 |
June 30, 2015 |
September 30, 2015 |
December 31, 2015 |
March 31, 2016 |
June 30, 2016 |
|||||||||||||||||||||||||
| (in thousands) | ||||||||||||||||||||||||||||||||
| Revenue: |
||||||||||||||||||||||||||||||||
| Subscription |
$ | 20,549 | $ | 20,953 | $ | 23,087 | $ | 24,155 | $ | 25,594 | $ | 27,088 | $ | 30,277 | $ | 31,404 | ||||||||||||||||
| Professional services |
6,967 | 7,802 | 7,384 | 7,529 | 6,660 | 7,754 | 6,566 | 7,375 | ||||||||||||||||||||||||
|
|
|
|
|
|
|
|
|
|
|
|
|
|
|
|
|
|||||||||||||||||
| Total revenue |
27,516 | 28,755 | 30,471 | 31,684 | 32,254 | 34,842 | 36,843 | 38,779 | ||||||||||||||||||||||||
| Cost of revenue: |
||||||||||||||||||||||||||||||||
| Subscription(1) |
4,021 | 5,154 | 5,547 | 5,595 | 6,173 | 6,142 | 6,480 | 6,559 | ||||||||||||||||||||||||
| Professional services(1) |
6,593 | 6,573 | 6,602 | 6,434 | 6,684 | 6,000 | 6,116 | 6,596 | ||||||||||||||||||||||||
|
|
|
|
|
|
|
|
|
|
|
|
|
|
|
|
|
|||||||||||||||||
| Total cost of revenue |
10,614 | 11,727 | 12,149 | 12,029 | 12,857 | 12,142 | 12,596 | 13,155 | ||||||||||||||||||||||||
|
|
|
|
|
|
|
|
|
|
|
|
|
|
|
|
|
|||||||||||||||||
| Gross profit |
16,902 | 17,028 | 18,322 | 19,655 | 19,397 | 22,700 | 24,247 | 25,624 | ||||||||||||||||||||||||
|
|
|
|
|
|
|
|
|
|
|
|
|
|
|
|
|
|||||||||||||||||
| Operating expenses: |
||||||||||||||||||||||||||||||||
| Research and development(1) |
5,949 | 6,300 | 7,258 | 7,416 | 7,928 | 7,951 | 8,431 | 8,626 | ||||||||||||||||||||||||
| Sales and marketing(1) |
12,997 | 18,398 | 15,727 | 17,547 | 15,855 | 22,208 | 16,287 | 19,669 | ||||||||||||||||||||||||
| General and administrative(1) |
3,743 | 3,860 | 3,837 | 3,861 | 5,023 | 5,042 | 5,180 | 5,504 | ||||||||||||||||||||||||
|
|
|
|
|
|
|
|
|
|
|
|
|
|
|
|
|
|||||||||||||||||
| Total operating expenses |
22,689 | 28,558 | 26,822 | 28,824 | 28,806 | 35,201 | 29,898 | 33,799 | ||||||||||||||||||||||||
|
|
|
|
|
|
|
|
|
|
|
|
|
|
|
|
|
|||||||||||||||||
| Loss from operations |
(5,787 | ) | (11,530 | ) | (8,500 | ) | (9,169 | ) | (9,409 | ) | (12,501 | ) | (5,651 | ) | (8,175 | ) | ||||||||||||||||
| Other income (expense): |
||||||||||||||||||||||||||||||||
| Interest (expense) income and other, net |
(17 | ) | 45 | 16 | 3 | (18 | ) | (19 | ) | (57 | ) | (377 | ) | |||||||||||||||||||
| Foreign exchange (loss) gain |
(106 | ) | (493 | ) | (643 | ) | 36 | (351 | ) | (343 | ) | (112 | ) | (295 | ) | |||||||||||||||||
|
|
|
|
|
|
|
|
|
|
|
|
|
|
|
|
|
|||||||||||||||||
| Loss before provision for income taxes |
(5,910 | ) | (11,978 | ) | (9,127 | ) | (9,130 | ) | (9,778 | ) | (12,863 | ) | (5,820 | ) | (8,847 | ) | ||||||||||||||||
| Provision for income taxes |
(72 | ) | (65 | ) | (68 | ) | (81 | ) | (87 | ) | 127 | (76 | ) | (138 | ) | |||||||||||||||||
|
|
|
|
|
|
|
|
|
|
|
|
|
|
|
|
|
|||||||||||||||||
| Net loss |
$ | (5,982 | ) | $ | (12,043 | ) | $ | (9,195 | ) | $ | (9,211 | ) | $ | (9,865 | ) | $ | (12,736 | ) | $ | (5,896 | ) | $ | (8,985 | ) | ||||||||
|
|
|
|
|
|
|
|
|
|
|
|
|
|
|
|
|
|||||||||||||||||
| (1) | Stock-based compensation included in the consolidated statement of operations data was as follows: |
| Three Months Ended | ||||||||||||||||||||||||||||||||
| September 30, 2014 |
December 31, 2014 |
March 31, 2015 |
June 30, 2015 |
September 30, 2015 |
December 31, 2015 |
March 31, 2016 |
June 30, 2016 |
|||||||||||||||||||||||||
| (in thousands) |
||||||||||||||||||||||||||||||||
| Cost of revenue: |
||||||||||||||||||||||||||||||||
| Subscription |
$ | 77 | $ | 82 | $ | 87 | $ | 109 | $ | 145 | $ | 141 | $ | 141 | $ | 191 | ||||||||||||||||
| Professional services |
160 | 187 | 190 | 205 | 179 | 164 | 154 | 213 | ||||||||||||||||||||||||
| Research and development |
416 | 459 | 569 | 591 | 577 | 546 | 553 | 714 | ||||||||||||||||||||||||
| Sales and marketing |
606 | 489 | 567 | 643 | 623 | 644 | 635 | 806 | ||||||||||||||||||||||||
| General and administrative |
387 | 503 | 463 | 431 | 498 | 443 | 422 | 586 | ||||||||||||||||||||||||
|
|
|
|
|
|
|
|
|
|
|
|
|
|
|
|
|
|||||||||||||||||
| Total stock-based compensation |
$ | 1,646 | $ | 1,720 | $ | 1,876 | $ | 1,979 | $ | 2,022 | $ | 1,938 | $ | 1,905 | $ | 2,510 | ||||||||||||||||
|
|
|
|
|
|
|
|
|
|
|
|
|
|
|
|
|
|||||||||||||||||
-71-
Table of Contents
| Three Months Ended | ||||||||||||||||||||||||||||||||
| September 30, 2014 |
December 31, 2014 |
March 31, 2015 |
June 30, 2015 |
September 30, 2015 |
December 31, 2015 |
March 31, 2016 |
June 30, 2016 |
|||||||||||||||||||||||||
| (as a percentage of total revenue) |
||||||||||||||||||||||||||||||||
| Revenue: |
||||||||||||||||||||||||||||||||
| Subscription |
75 | % | 73 | % | 76 | % | 76 | % | 79 | % | 78 | % | 82 | % | 81 | % | ||||||||||||||||
| Professional services |
25 | 27 | 24 | 24 | 21 | 22 | 18 | 19 | ||||||||||||||||||||||||
|
|
|
|
|
|
|
|
|
|
|
|
|
|
|
|
|
|||||||||||||||||
| Total revenue |
100 | 100 | 100 | 100 | 100 | 100 | 100 | 100 | ||||||||||||||||||||||||
| Cost of revenue: |
||||||||||||||||||||||||||||||||
| Subscription |
15 | 18 | 18 | 18 | 19 | 18 | 18 | 17 | ||||||||||||||||||||||||
| Professional services |
24 | 23 | 22 | 20 | 21 | 17 | 17 | 17 | ||||||||||||||||||||||||
|
|
|
|
|
|
|
|
|
|
|
|
|
|
|
|
|
|||||||||||||||||
| Total cost of revenue |
39 | 41 | 40 | 38 | 40 | 35 | 35 | 34 | ||||||||||||||||||||||||
|
|
|
|
|
|
|
|
|
|
|
|
|
|
|
|
|
|||||||||||||||||
| Gross profit |
61 | 59 | 60 | 62 | 60 | 65 | 65 | 66 | ||||||||||||||||||||||||
| Operating expenses: |
||||||||||||||||||||||||||||||||
| Research and development |
22 | 22 | 24 | 23 | 25 | 23 | 23 | 22 | ||||||||||||||||||||||||
| Sales and marketing |
47 | 64 | 52 | 55 | 49 | 64 | 44 | 51 | ||||||||||||||||||||||||
| General and administrative |
14 | 13 | 13 | 12 | 15 | 14 | 14 | 14 | ||||||||||||||||||||||||
|
|
|
|
|
|
|
|
|
|
|
|
|
|
|
|
|
|||||||||||||||||
| Total operating expenses |
83 | 99 | 89 | 90 | 89 | 101 | 81 | 87 | ||||||||||||||||||||||||
|
|
|
|
|
|
|
|
|
|
|
|
|
|
|
|
|
|||||||||||||||||
| Loss from operations |
(22 | ) | (40 | ) | (29 | ) | (28 | ) | (29 | ) | (36 | ) | (16 | ) | (21 | ) | ||||||||||||||||
| Other income (expense): |
||||||||||||||||||||||||||||||||
| Interest income (expense) and other, net |
— | — | — | — | — | — | — | (1 | ) | |||||||||||||||||||||||
| Foreign exchange loss |
— | (2 | ) | (2 | ) | — | (1 | ) | (1 | ) | — | (1 | ) | |||||||||||||||||||
|
|
|
|
|
|
|
|
|
|
|
|
|
|
|
|
|
|||||||||||||||||
| Loss before provision for income taxes |
(22 | ) | (42 | ) | (31 | ) | (28 | ) | (30 | ) | (37 | ) | (16 | ) | (23 | ) | ||||||||||||||||
| Provision for income taxes |
— | — | — | — | — | — | — | — | ||||||||||||||||||||||||
|
|
|
|
|
|
|
|
|
|
|
|
|
|
|
|
|
|||||||||||||||||
| Net loss |
(22 | )% | (42 | )% | (31 | )% | (28 | )% | (30 | )% | (37 | )% | (16 | )% | (23 | )% | ||||||||||||||||
|
|
|
|
|
|
|
|
|
|
|
|
|
|
|
|
|
|||||||||||||||||
Revenue has increased in each of the periods presented above primarily due to the increase in customer count. Operating expenses generally have increased sequentially in every quarter primarily due to increases in headcount and other related expenses to support growth. We anticipate operating expenses will continue to increase in absolute dollars in future periods as we invest in the long-term growth of our business.
We may experience variances in total customers over a particular quarter for a variety of business reasons, and the extent to which we gain or lose customers over a particular quarter will not necessarily correlate to the changes in revenue in that quarter or in future periods. As a result of the foregoing factors, a slowdown in our ability to enter into customer agreements or to renew customer agreements may not be apparent in revenue for the quarter, as the revenue recognized in any quarter is primarily from customer agreements entered into in prior quarters.
Seasonality
We have historically experienced seasonality in terms of when we enter into agreements with customers. We typically enter into a significantly higher percentage of agreements with new customers, as well as renewal agreements with existing customers, in the fourth quarter and, to a lesser extent, the second quarter. The increase in customer agreements for the fourth quarter is attributable to large enterprise account buying patterns typical in the software industry. Fourth quarter professional services revenue is also typically positively impacted by recognition of TBM Council conference registration and sponsorship fees.
Furthermore, we usually enter into a significant portion of agreements with customers during the last month, and often the last two weeks, of each quarter. This seasonality is reflected to a much lesser extent, and sometimes is not immediately apparent, in revenue, due to the fact that we recognize subscription revenue over the term of the subscription agreement, which is generally one to three years. Although these seasonal factors are common in the technology industry, historical patterns should not be considered a reliable indicator of future sales activity or performance.
-72-
Table of Contents
Backlog
Backlog represents future amounts to be invoiced under subscription agreements. As of December 31, 2014 and 2015 and June 30, 2016 we had backlog of approximately $48.8 million, $79.8 million and $78.1 million, respectively.
We often sign multiple-year subscription agreements for our applications. The timing of invoices to customers is a negotiated term and thus varies among our subscription agreements. For multiple-year agreements, it is common to invoice an initial annual amount at contract signing followed by subsequent annual invoices. At any point in the contract term, there can be amounts that we have not yet been contractually able to invoice. Until such time as we have the contractual right to invoice, they are not recorded in deferred revenue or elsewhere in our consolidated financial statements, and are considered by us to be backlog.
We expect that the amount of backlog relative to the total value of our contracts will change from year-to-year for several reasons, including the amount invoiced early in the contract term, the specific timing and duration of large customer subscription agreements, varying invoicing cycles of subscription agreements, the specific timing of customer renewals, changes in customer financial circumstances, and foreign currency fluctuations.
Backlog may also vary based on changes in the average non-cancellable term of subscription agreements. The change in backlog that results from changes in the average non-cancellable term of subscription agreements may not be an indicator of the likelihood of renewal or expected future revenue. Accordingly, we believe that fluctuations in backlog are not a reliable indicator of future revenue, and we do not utilize backlog as a key management metric internally.
Liquidity and Capital Resources
As of June 30, 2016, we had $42.1 million of cash and investments, and $25.0 million in available borrowings under our credit facilities. We believe that existing cash and investments, any positive cash flows from operations and available borrowings under our credit facilities will be sufficient to support working capital and capital expenditure requirements for at least the next 12 months. Since inception, we have financed operations primarily through the sale of equity securities and sales of subscriptions and professional services. Our principal uses of cash are funding operations and capital expenditures.
Sources of Funds
In June 2015, we entered into an amended and restated loan and security agreement, the senior credit facility, to allow for the incurrence of up to $10 million in term loan borrowings and up to $15 million in a revolving accounts receivable line of credit. In January 2016, we incurred $10 million principal amount of term borrowings under the senior credit facility. In April 2016, the senior credit facility was amended and we entered into a new subordinated loan and security agreement which provides for an additional $20 million of term loan borrowings. Upon closing, we incurred $10 million in term loan borrowings under the subordinated loan and security agreement.
From time to time, we may explore additional financing sources and means to lower our cost of capital, which could include equity, equity-linked and debt financing. We cannot assure you that any additional financing will be available to us on acceptable terms, or at all.
Credit Facilities
The senior credit facility, which was amended in April 2016, provides $10 million aggregate principal amount of term loan borrowings and up to $15 million aggregate principal amount of revolver
-73-
Table of Contents
borrowings. Interest on the term loan borrowings accrues at a floating rate equal to the prime rate plus 1.25%. In January 2016 we borrowed the full $10 million term loan. The April 2016 amendment extended the maturity dates of the term loan and the revolver, as well as the interest only period on the term loan, by 12 months. The term loan now matures on April 20, 2020. Through April 30, 2017, we are required to pay only interest on outstanding term loan borrowings on a monthly basis. Following the expiration of the interest only payment period, we are required to pay principal and interest in 36 equal monthly payments. We can also incur revolver borrowings based on a borrowing base tied to the amount of eligible accounts receivable, not to exceed $15 million. Interest on the revolver borrowings accrues at a floating rate equal to the prime rate and is payable monthly. The revolver matures on June 16, 2017.
In April 2016, in addition to amending the senior credit facility, we entered into a new subordinated loan and security agreement pursuant to which we incurred $10 million in term loan borrowings and we may, at our option, through April 20, 2017 incur an additional $10 million of term loan borrowings. Interest on the subordinated term loans is fixed at 9.5% per year and matures on April 20, 2019. Through the maturity of the subordinated term loans, we are required to pay only interest on outstanding subordinated term loans on a monthly basis. The full principal amount is due at maturity.
The senior credit facility and subordinated loan agreement contain customary conditions to borrowing, events of default and covenants, including covenants that restrict our ability to dispose of assets, merge with or acquire other entities, incur indebtedness, incur encumbrances, make distributions to holders of our capital stock, make investments or engage in transactions with affiliates. If cash, cash equivalents and investments held with the lender are below $25 million as of the last day of the applicable monthly measuring period, we will be required to comply with a financial covenant based on subscription and professional services performance. This financial covenant is measured both monthly and quarterly, generally on a trailing six month basis. We were in compliance with all covenants as of June 30, 2016. Our obligations under the senior credit facility and subordinated loan agreement are secured by substantially all of our assets other than intellectual property. We intend to use a portion of the net proceeds from this offering to repay $20.2 million principal and pre-payment fees for amounts borrowed under our credit facilities.
In 2008, we issued a warrant to purchase 27,321 shares of Series A convertible preferred stock in connection with entering into a prior credit facility with our lender. The warrant has a ten-year term and an exercise price of $1.37255 per share. In connection with entering into the senior credit facility in June 2015, we issued a warrant to purchase 10,722 shares of common stock. The warrant has a ten-year term and an exercise price of $13.99 per share. In addition, as a result of the borrowings under the term loan under the senior credit facility in January 2016, the number of shares issuable upon exercise of the warrant that we issued to the lenders was automatically adjusted such that the holder of the warrant shall have the right to purchase an additional 10,722 shares of common stock at the same $13.99 exercise price. As a result, the warrants held by the lenders under the senior credit facility provide for the right to purchase up to an aggregate of 21,444 shares of stock. Such warrants will become exercisable for shares of our Class B common stock in connection with this offering.
In April 2016, in connection with amending the senior credit facility, we issued to the lender a warrant to purchase 5,241 shares of Class B common stock. The warrant has a ten-year term and an exercise price of $14.31 per share. In addition, in connection with entering into the subordinated loan agreement, we issued warrants to purchase an aggregate of 21,208 shares of Class B common stock. The warrants have an exercise price of $14.31 per share and a ten-year term. Pursuant to the terms of the warrants, if we incur any additional borrowings under the subordinated term loan, the number of shares issuable upon exercise of the warrants will automatically be adjusted such that the holders shall have the right to purchase up to an aggregate of 42,215 shares at the same $14.31 exercise price.
-74-
Table of Contents
Use of Funds
Our principal uses of cash are funding operations and other working capital requirements. Cash used in operations for 2015 was $10.6 million and cash used in operations for the six months ended June 30, 2016 was $1.4 million. Over the past several years, revenue has increased significantly from year to year and, as a result, cash flows from customer collections have increased. However, operating expenses have also increased as we have invested in growing our business. Our operating cash requirements may increase in the future as we continue to invest in the strategic growth of our company.
To the extent existing cash and investments and cash from operations are not sufficient to fund future activities, we may need to raise additional funds. We may seek to raise additional funds through equity, equity-linked or debt financings. If we raise additional funds through the incurrence of indebtedness, such indebtedness may have rights that are senior to holders of our equity securities and could contain covenants that restrict operations. Any additional equity financing may be dilutive to stockholders. Although we are not currently a party to any agreement or letter of intent with respect to potential investments in, or acquisitions of, complementary businesses, services or technologies, we may enter into these types of arrangements in the future, which could also require us to seek additional equity financing, incur indebtedness, or use cash resources. We have no present understandings, commitments or agreements to enter into any such acquisitions.
Historical Cash Flow Trends
The following table shows cash flows for 2014 and 2015 and the six months ended June 30, 2015 and 2016:
| Years Ended December 31, | Six Months Ended June 30, |
|||||||||||||||
| 2014 | 2015 | 2015 | 2016 | |||||||||||||
| (in thousands) | ||||||||||||||||
| Net cash used in operating activities |
$ | (17,957 | ) | $ | (10,591 | ) | $ | (3,312 | ) | $ | (1,409 | ) | ||||
| Net cash provided by investing activities |
521 | 6,743 | 4,568 | 6,373 | ||||||||||||
| Net cash provided by financing activities |
1,396 | 1,455 | 1,626 | 20,034 | ||||||||||||
Operating Activities
Net cash used in operating activities consists primarily of net loss adjusted for certain non-cash items, including stock-based compensation, change in fair value of preferred stock warrant liability, depreciation and amortization and other non-cash charges, net.
Net cash used in operating activities during the six months ended June 30, 2016 reflected our net loss of $14.9 million, offset by non-cash expenses that included $4.4 million of stock-based compensation and $3.0 million of depreciation and amortization. Working capital sources of cash included a decrease of $8.5 million in accounts receivable, primarily due to collections on transactions originating in the fourth quarter of 2015. These sources of cash were offset by a $0.8 million, net decrease in accounts payable, accrued expenses and deferred rent, a $1.0 million decrease in deferred revenue and a $0.8 million increase in prepaid expenses and other current assets.
Net cash used in operating activities during the six months ended June 30, 2015 reflected our net loss of $18.4 million, offset by non-cash expenses that included $3.9 million of stock-based compensation and $3.2 million of depreciation and amortization. Working capital sources of cash included a decrease of $15.8 million in accounts receivable, primarily due to collections on transactions
-75-
Table of Contents
originating in the fourth quarter of 2014. These sources of cash were offset by a $5.1 million decrease in deferred revenue, a $1.2 million, net decrease in accounts payable, accrued expenses and deferred rent, and a $1.5 million increase in prepaid expenses and other current assets.
Net cash used in operating activities during 2015 primarily reflected our net loss of $41.0 million, offset by non-cash expenses that included $7.8 million of stock-based compensation and $6.5 million of depreciation and amortization. Working capital sources of cash included a $19.9 million increase in deferred revenue, primarily resulting from the growth in the number of customers invoiced during the period, and a $3.1 million increase in accounts payable, accrued expenses and deferred rent. These sources of cash were offset by a $6.2 million increase in accounts receivable as a result of increased billings to customers consistent with the overall growth of the business and a $1.0 million increase in prepaid expenses.
Net cash used in operating activities during 2014 primarily reflected our net loss of $32.9 million, offset by non-cash expenses that included $5.8 million in stock-based compensation and $5.2 million of depreciation and amortization. Working capital sources of cash included a $17.0 million increase in deferred revenue primarily resulting from the growth in the number of customers invoiced during the period and a $3.7 million increase in accounts payable, accrued expenses and deferred rent. These sources of cash were offset by a $15.2 million increase in accounts receivable as a result of increased billings to customers consistent with the overall growth of the business and a $2.0 million increase in prepaid expenses and other current assets. The change in net cash used in operating activities from 2013 to 2014 is primarily due to increases in payments for employee payroll as we continued to invest in and grow our business.
Investing Activities
Our investing activities have consisted primarily of purchases, sales and maturities of available-for-sale securities, property and equipment purchases for computer-related equipment, leasehold improvements to leased office facilities and capitalization of software development costs. Capitalized software development costs are related to new applications or improvements to existing software platform that expands the functionality for customers.
Net cash provided by investing activities during the six months ended June 30, 2016 consisted primarily of $6.2 million of cash maturities from available-for-sale securities and $2.5 million from the release of restricted cash, offset by $2.3 million of purchased property and equipment and capitalized software development costs.
Net cash provided by investing activities during the six months ended June 30, 2015 consisted primarily of $11.1 million of cash maturities from available-for-sale securities, offset by $4.8 million of purchased property and equipment and capitalized software development costs and $2.0 million in purchases of available-for-sale securities.
Net cash provided by investing activities during 2015 was $6.7 million, consisting primarily of $16.8 million of cash maturities from available-for-sale securities, offset by $7.6 million of purchased property and equipment and capitalized software development costs, and $2.7 million in purchases of available-for-sale securities.
Net cash provided by investing activities during 2014 was $0.5 million, consisting primarily of $28.4 million of cash maturities from available-for-sale securities. These sources of cash were partially offset by a $20.7 million in purchases of available-for-sale securities and $6.3 million of purchased property and equipment.
-76-
Table of Contents
Financing Activities
Our financing activities have consisted primarily of issuances of convertible preferred stock and debt borrowings to fund operations and, to a lesser extent, proceeds from the exercise of options. Cash flows used in financing activities consist primarily of payment of initial public offering costs, loan fees and repayment of capital leases.
Net cash provided by financing activities for the six months ended June 30, 2016 consisted primarily of $20.0 million in principal proceeds from term loan borrowings and $0.5 million from proceeds received from option exercises, offset by the payment of deferred initial public offering costs and loan fees of $0.5 million.
Net cash provided by financing activities for the six months ended June 30, 2015 consisted primarily of $1.7 million from proceeds received from option exercises.
Net cash provided by financing activities for 2015 consisted primarily of $2.7 million of proceeds received from option exercises, offset by the payment of deferred initial public offering costs of $1.1 million.
Net cash provided by financing activities for 2014 was $1.4 million, consisting primarily of proceeds received from option exercises.
Contractual Obligations and Commitments
Contractual obligations are cash that we are obligated to pay as part of certain contracts that we have entered into during the normal course of business. Below is a table that shows the projected outlays as of December 31, 2015:
| Payments Due by Period: | ||||||||||||||||||||
| Total | Less than 1 Year |
1-3 Years | 3-5 Years | More Than 5 Years |
||||||||||||||||
| (in thousands) | ||||||||||||||||||||
| Capital leases(1) |
$ | 148 | $ | 47 | $ | 73 | $ | 28 | $ | — | ||||||||||
| Operating leases(2) |
25,614 | 4,171 | 7,712 | 7,005 | 6,726 | |||||||||||||||
| Purchase obligations(3) |
1,221 | 985 | 236 | — | — | |||||||||||||||
|
|
|
|
|
|
|
|
|
|
|
|||||||||||
| Total |
$ | 26,983 | $ | 5,203 | $ | 8,021 | $ | 7,033 | $ | 6,726 | ||||||||||
|
|
|
|
|
|
|
|
|
|
|
|||||||||||
| (1) | Includes interest totaling $11,000. |
| (2) | Includes non-cancellable obligations for our amended headquarters lease signed in 2014 and other leases for office and facility space. As of December 31, 2015, we had leases that expire at various dates through 2023. |
| (3) | Purchase obligations relate primarily to non-cancellable agreements for software and marketing services. |
Below is a table that shows the projected outlays as of June 30, 2016:
| Payments Due by Period: | ||||||||||||||||||||
| Total | Less than 1 Year |
1-3 Years | 3-5 Years | More Than 5 Years |
||||||||||||||||
| (in thousands) | ||||||||||||||||||||
| Credit facilities(1) |
$ | 20,000 | $ | 556 | $ | 16,667 | $ | 2,777 | $ | — | ||||||||||
| Capital leases(2) |
121 | 46 | 58 | 17 | — | |||||||||||||||
| Operating leases(3) |
26,020 | 4,423 | 8,496 | 7,357 | 5,744 | |||||||||||||||
| Purchase obligations(4) |
548 | 440 | 108 | — | — | |||||||||||||||
|
|
|
|
|
|
|
|
|
|
|
|||||||||||
| Total |
$ | 46,689 | $ | 5,465 | $ | 25,329 | $ | 10,151 | $ | 5,744 | ||||||||||
|
|
|
|
|
|
|
|
|
|
|
|||||||||||
| (1) | In January 2016, we borrowed $10 million in term loan borrowings under our senior credit facility. We are required to pay only interest on outstanding borrowings through April 2017. Following the interest only period, |
-77-
Table of Contents
| we are required to make monthly payments of $278,000 through the maturity date of April 20, 2020. In April 2016, we borrowed an additional $10 million in term loan borrowings under the subordinated loan and security agreement, which is interest only until the maturity date of April 20, 2019. We intend to use a portion of the net proceeds from this offering to repay $10.2 million principal and pre-payment fees for amounts borrowed under our subordinated loan and security agreement. |
| (2) | Includes interest totaling $7,000. |
| (3) | Includes non-cancellable obligations for our amended headquarters lease signed in 2014 and other leases for office and facility space. As of June 30, 2016, we had leases that expire at various dates through 2023. |
| (4) | Purchase obligations relate primarily to non-cancellable agreements for software and marketing services. |
Off-Balance Sheet Arrangements
During 2014 and 2015 and the six months ended June 30, 2016 we did not have any relationships with unconsolidated organizations or financial partnerships, such as structured finance or special purpose entities, that would have been established for the purpose of facilitating off-balance sheet arrangements.
Qualitative and Quantitative Disclosures about Market Risk
Foreign Currency Exchange Risk
Due to our international operations, we have foreign currency risks related to revenue and operating expenses denominated in currencies other than the U.S. dollar, primarily the British Pound Sterling, Euro and Australian dollar. Our sales contracts are primarily denominated in the local currency of the customer making the purchase. In addition, a portion of operating expenses are incurred outside the United States and are denominated in foreign currencies. Additionally, subscription fees are largely based on customers’ anticipated spend as expressed in U.S. dollars as managed by our system, which fee construct may increase the exposure of revenue to currency fluctuations. Decreases in the relative value of the U.S. dollar to other currencies may negatively affect revenue and other operating results as expressed in U.S. dollars. We do not believe that an immediate 10% increase or decrease in the relative value of the U.S. dollar to other currencies would have a material effect on operating results.
We have experienced and will continue to experience fluctuations in net loss as a result of transaction gains or losses related to remeasuring certain current asset and current liability balances that are denominated in currencies other than the functional currency of the entities in which they are recorded. We have not engaged in the hedging of foreign currency transactions to date. We are evaluating the costs and benefits of initiating such a program and may in the future hedge selected significant transactions denominated in currencies other than the U.S. dollar as we expand international operations.
Interest Rate Sensitivity
We hold cash and cash equivalents for working capital purposes. We do not have material exposure to market risk with respect to investments, as any investments we enter into are primarily highly liquid investments. We have a senior credit facility, consisting of $25 million of term borrowings and an accounts receivable line of credit, which was undrawn as of December 31, 2015. In January, 2016, we incurred $10 million principal amount of term borrowings under the senior credit facility. Interest accrues on term loan borrowings at a floating rate equal to the prime rate plus 1.25%. Interest accrues on the accounts receivable line of credit at a floating rate equal to the prime rate. In addition, in April 2016, we incurred an additional $10 million principal amount of term borrowings under our new subordinated loan and security agreement. Interest is fixed at 9.5% per year. We intend to use a portion of the net proceeds from this offering to repay $10.2 million principal and pre-payment fees for amounts borrowed under our subordinated loan and security agreement. A 10% increase or decrease in interest rates would not result in a material change in either our obligations under the credit facility, even at the borrowing limit, or in the returns on our cash.
-78-
Table of Contents
Emerging Growth Company Status
As an “emerging growth company,” or EGC, the Jump-start Our Business Start-ups, or JOBS Act, allows us to delay adoption of new or revised accounting pronouncements applicable to public companies until such pronouncements are made applicable to private companies. As an “emerging growth company,” the JOBS Act allows us to delay adoption of new or revised accounting pronouncements applicable to public companies until such pronouncements are made applicable to private companies. We have elected to use this extended transition period under the JOBS Act. As a result, our financial statements may not be comparable to the financial statements of issuers who are required to comply with the effective dates for new or revised accounting standards that are applicable to public companies, which may make our common stock less attractive to investors.
Critical Accounting Policies and Estimates
Our discussion and analysis of our financial condition and results of operations are based upon our financial statements which have been prepared in accordance with U.S. generally accepted accounting principles, or GAAP. The preparation of these financial statements requires us to make estimates and judgments that affect the reported amounts of assets and liabilities and related disclosure of contingent assets and liabilities, revenue and expenses at the date of the financial statements. Generally, we base our estimates on historical experience and on various other assumptions in accordance with GAAP that we believe to be reasonable under the circumstances. Actual results may differ from these estimates.
Critical accounting policies and estimates are those that we consider the most important to the portrayal of our financial condition and results of operations because they require our most difficult, subjective or complex judgments, often as a result of the need to make estimates about the effect of matters that are inherently uncertain. Our critical accounting policies and estimates include those related to:
| • | revenue recognition; |
| • | stock-based compensation; |
| • | common stock valuations; |
| • | income taxes; and |
| • | capitalized internal use software. |
Revenue Recognition
We commence revenue recognition when all of the following conditions are met:
| • | there is persuasive evidence of an arrangement; |
| • | the service has been provided to the customer; |
| • | the collection of related fees is reasonably assured; and |
| • | the amount of fees to be paid by the customer is fixed or determinable. |
Signed agreements are used as evidence of an arrangement. If a signed contract by the customer does not exist, we have historically used either a purchase order or a signed order form as evidence of an
-79-
Table of Contents
arrangement. In cases where both a signed contract and either a purchase order or signed order form exist, we consider the signed contract to be the final persuasive evidence of an arrangement.
Subscription revenue is recognized ratably over the contract term beginning on the commencement date of each subscription term, which is generally the date we make the subscribed applications available to customers. Once the subscribed application is available to customers, amounts that we have the contractual right to invoice are recorded in accounts receivable and in deferred revenue. Professional services are priced either on a fixed-fee or a time-and-materials basis. Professional services revenue is recognized as the services are delivered. In instances where final acceptance of non-standard service deliverables are required before revenue is recognized, revenue and the associated costs are deferred until all acceptance criteria have been met.
We assess collectability based on a number of factors such as past collection history with the customer and creditworthiness of the customer. If we determine collectability is not reasonably assured, we defer the revenue recognition until collectability becomes reasonably assured. We assess whether the fee is fixed or determinable based on the payment terms associated with the transaction and whether the sales price is subject to refund or adjustment. Our arrangements do not include general rights of return.
We derive revenue from two sources: (1) subscription revenue, which is comprised of subscription fees from customers utilizing our applications, fees for additional support beyond the standard support that is included in the basic subscription fees, which we refer to as premium support offerings, and fees for subscription based online training offerings; and (2) professional services, which consist of fees associated with the implementation and configuration of our applications, as well as fees for in-person training and TBM Council conference registration and sponsorship fees. Implementation and configuration services primarily consist of consultative services, such as data mapping and establishing best practices. Implementation and configuration services do not result in any significant customization or modification of the software platform or user interface. We present revenue from each of these sources separately in our consolidated financial statements.
We enter into arrangements with multiple deliverables that primarily include subscription and professional services, but may also include premium support, online training and in-person training. The professional services are not considered essential to the functionality of the software. To qualify as a separate unit of accounting, the delivered item must have value to the customer on a stand-alone basis. We believe subscription offerings and professional service offerings have stand-alone value. Subscriptions have stand-alone value because such services are often sold separately from other professional services. Professional services have stand-alone value because those services may be sold separately by other vendors and there are trained third-party consultants capable of performing the professional services. Deliverables that are accounted for separately consist of software subscription, professional services, training, premium support and online training.
When arrangements involve multiple elements that qualify as separate units of accounting, we allocate revenue to each deliverable in a multiple-deliverable arrangement based upon its relative selling price. The estimated selling price for each element is based upon the following hierarchy in order of priority: vender-specific objective evidence, or VSOE, of selling price, if available, third-party evidence, or TPE, of selling price, if VSOE of selling price is not available, or best estimate of selling price, or BESP, if neither VSOE of selling price, nor TPE of selling price is available.
We determine VSOE of selling price based on historical stand-alone sales to customers. In determining VSOE, we require that a substantial majority of the selling prices for our subscription or professional services fall within a reasonably narrow pricing range of the applicable median selling price. We have not yet been able to establish VSOE for our subscription and professional services
-80-
Table of Contents
because we have not historically priced our service offerings within a sufficiently narrow range. When VSOE cannot be established, we apply judgment with respect to whether we can establish a selling price based on TPE. TPE is determined based on third-party prices for similar deliverables when sold separately. Generally, our pricing strategy differs from that of our peers and our services and solutions contain a significant level of differentiation such that the comparable pricing of other offerings with similar functionality cannot be obtained. Furthermore, we are unable to reliably determine what similar competitor services’ selling prices are on a stand-alone basis. As a result, we use BESP as the selling price for our services.
We estimate BESP for subscriptions, premium support and online training based on the historical amounts for such deliverables on a stand-alone basis. The BESP for professional services is based on the historical average rate per hour charged, and BESP for in-person training is based on historical amounts on a per-seat basis.
We recognize revenue for subscription fees from customers utilizing our applications ratably over the subscription term, which are typically one to three years. Our subscription arrangements generally do not allow the customer the contractual right to take possession of the software; as such, the arrangements are considered to be service contracts. In those limited situations where the customer takes possession of the software, we follow the guidance in Accounting Standards Codification, or ASC, 985, Software Revenue Recognition. Fees for premium support offerings and subscription-based online training are generally one-year agreements billed upfront, and are recognized ratably over the term of the support or training agreement. Our premium support offerings include all of our standard incident support services, with enhanced response times, dedicated support resources, access to architecture and configuration experts and other services not included with standard support. Our subscription-based online training provides self-directed training for customers via access to recorded training sessions.
Professional services revenue consists of fees associated with application configuration, integration, change management, education and training services, and conference registration and sponsorship fees. Professional services engagements are priced either on a time-and-materials basis or on a fixed-fee basis. The duration of our professional services engagements varies based on the scope of services requested, but typically ranges between three and six months. For time-and-materials arrangements, we recognize revenue as hours are worked. For fixed-fee arrangements, we recognize professional services revenue as delivered using the percentage of completion, or POC method, measured on an hours incurred basis. Under the POC method of accounting, revenue and expenses are recognized as work is performed based on the relationship between actual hours incurred and total estimated hours at the completion of the project. Changes to the original estimates may be required during the life of the project. Estimates of both hours and costs to complete a project are reviewed periodically and the effect of any change in the estimated hours to complete a project is reflected as an adjustment to revenue in the period the change becomes known.
In the event current estimated costs to complete a project exceed the revenue allocated to the project, a loss equal to the amount of estimated excess costs will be recognized in the period the change becomes known. The use of the POC method of accounting involves considerable use of estimates in determining revenue, costs and profits and in assigning the amounts to accounting periods. Associated out-of-pocket travel expenses related to the delivery of professional services are typically reimbursed by the customer. Out-of-pocket expense reimbursements are recognized as revenue and cost of service expense as incurred.
Fees for in-person training are billed in advance of the training and are recognized in the period the training occurs. Conference registration and sponsorship fees are for TBM Council conferences and related TBM Council activities. Registration fees for TBM Council conferences are
-81-
Table of Contents
billed in advance of the conference and are recognized in the period the conference occurs. TBM Council sponsorship fees are paid in advance and are recognized in the period the sponsorship activities occur, or ratably over the contractual period if the sponsorship entails ongoing activities beyond a single event.
On occasion, we sell subscriptions through third-party resellers. These arrangements typically call for the reseller to retain a portion of the price to the customer as compensation. Since we are typically responsible for the acceptability of the services purchased by the customer, we are the primary obligor in the transaction and, therefore, record revenue on a gross-basis based on the amount billed to the customer. Reseller fees are recognized as sales and marketing expense as incurred.
Deferred revenue represents the unearned revenue on cash receipts or accounts receivable for the sale of subscriptions and for professional services for which services have not yet been provided. The substantial majority of deferred revenue relates to subscription revenue.
Stock-based Compensation
We measure and recognize compensation expense for all stock-based awards granted to our employees and other service providers, based on the estimated fair value of the award on the date of grant, and expense is recognized on a straight-line basis over the vesting period of the award based on the estimated portion of the award that is expected to vest.
We use the Black-Scholes option pricing model to measure the fair value of stock-based awards when they are granted. We make several estimates in determining stock-based compensation and these estimates generally require significant analysis and judgment to develop. These assumptions and estimates are as follows:
| • | Fair Value of Common Stock. As our stock is not publicly traded, we must estimate the fair value of common stock, as discussed in “Valuation of Common Stock” below. |
| • | Expected Term. The expected term of options represents the period that stock-based awards are expected to be outstanding. We estimate the expected term using the simplified method due to the lack of historical exercise activity for our company. |
| • | Risk-Free Interest Rate. The risk-free interest rate is based on the implied yield available at the time of the option grant in U.S. Treasury securities at maturity with a term equivalent to the expected term of the option. |
| • | Expected Volatility. Expected volatility is based on an average volatility of stock prices for a group of publicly traded peer companies. In considering peer companies, we assess characteristics such as industry, state of development, size and financial leverage. |
| • | Dividend Yield. We have never declared or paid any cash dividends and do not plan to pay cash dividends in the foreseeable future, and, therefore, use an expected dividend yield of zero. |
If any assumptions used in the Black-Scholes option pricing model change significantly, stock-based compensation for future awards may differ materially compared with the awards granted previously.
In addition to the assumptions used in the Black-Scholes option pricing model, we must also estimate a forfeiture rate to calculate the stock-based compensation expense for awards. Our forfeiture
-82-
Table of Contents
rate is derived from historical employee termination behavior. If the actual number of forfeitures differs from these estimates, additional adjustments to compensation expense will be required.
Valuation of Common Stock
Given the absence of an active market for our common stock, our board of directors was required to estimate the fair value of our common stock at the time of each option grant based upon several factors, including its consideration of input from management and contemporaneous third-party valuations.
The exercise price for all stock options granted was at the estimated fair value of the underlying common stock, as estimated on the date of grant by our board of directors in accordance with the guidelines outlined in the American Institute of Certified Public Accountants, Valuation of Privately-Held-Company Equity Securities Issued as Compensation. Each fair value estimate was based on a variety of factors, which included the following:
| • | contemporaneous valuations performed by unrelated third-party valuation firms; |
| • | the prices, rights, preferences and privileges of our preferred stock relative to those of our common stock; |
| • | the lack of marketability of our common stock; |
| • | our actual operating and financial performance; |
| • | current business conditions and projections; |
| • | hiring of key personnel and the experience of our management; |
| • | our history and the timing of the introduction of new applications and capabilities; |
| • | our stage of development; |
| • | the likelihood of achieving a liquidity event, such as an initial public offering or a merger or acquisition of our business given prevailing market conditions; |
| • | the market performance of comparable publicly traded companies; and |
| • | U.S. and global capital market conditions. |
In valuing our common stock, our board of directors determined the equity value of our business generally using various valuation methods, including combinations of methods, as deemed appropriate under the circumstances applicable at the valuation date.
The market approach estimates value based on a comparison of the subject company to comparable public companies in a similar line of business. To determine our peer group of companies, we considered public enterprise cloud-based application providers and selected those that are similar to us in size, stage of life cycle, and financial leverage. From the comparable companies, a representative market value multiple is determined which is applied to the subject company’s operating results to estimate the value of the subject company. The market value multiple was determined based on consideration of revenue multiples and earnings before interest, taxes, depreciation, and amortization, or EBITDA, to each of the comparable companies’ last 12-month revenue and the
-83-
Table of Contents
forecasted future 12-month revenue. In addition, the market approach considers merger and acquisition transactions involving companies similar to the subject company’s business being valued. Multiples of revenue or EBITDA are calculated for these transactions and then applied to the business being valued, after reduction by an appropriate discount. Based on the above, the estimated value is then discounted by a non-marketability factor (discount for lack of marketability, or DLOM) due to the fact that stockholders of private companies do not have access to trading markets similar to those enjoyed by stockholders of public companies, which impacts liquidity.
The income approach estimates value based on the expectation of future cash flows that a company will generate—such as cash earnings, cost savings, tax deductions, and the proceeds from disposition. These future cash flows are discounted to their present values using a discount rate derived from an analysis of the cost of capital of comparable publicly traded companies in our industry or similar lines of business as of each valuation date and is adjusted to reflect the risks inherent in our cash flows. In addition, we also considered an appropriate discount adjustment to recognize the lack of marketability due to being a private company.
The prior sale of company stock approach estimates value by considering any prior arm’s length sales of the company’s equity. When considering prior sales of the company’s equity, the valuation considers the size of the equity sale, the relationship of the parties involved in the transaction, the timing of the equity sale, and the financial condition of the company at the time of the sale.
Once an equity value is determined, our board of directors utilized one of the following methods to allocate the equity value to each of our classes of stock: (1) the option pricing method, or OPM; (2) a probability weighted expected return method, or PWERM; (3) the current value method, or CVM; or (4) the Hybrid Method, which is a hybrid between the OPM, PWERM and/or CVM methods.
The OPM treats common stock and preferred stock as call options on a business, with exercise prices based on the liquidation preference of the preferred stock. Therefore, the common stock only has value if the funds available for distribution to the holders of common stock exceeds the value of the liquidation preference of the preferred stock at the time of a liquidity event, such as a merger, sale, or initial public offering, assuming the business has funds available to make a liquidation preference meaningful and collectible by stockholders. The common stock is modeled as a call option with a claim on the business at an exercise price equal to the remaining value immediately after the preferred stock is liquidated. The OPM uses the Black-Scholes option pricing model to price the call option.
The PWERM approach employs various market approach calculations depending upon the likelihood of various liquidation scenarios. For each of the various scenarios, an equity value is estimated and the rights and preferences for each shareholder class are considered to allocate the equity value to common shares. The common share value is then multiplied by a discount factor reflecting the calculated discount rate and the timing of the event. Lastly, the common share value is multiplied by an estimated probability for each scenario. The probability and timing of each scenario are based upon discussions between our board of directors and our management team. Under the PWERM, the value of our common stock is based upon possible future events for our company.
The CVM approach allocates the enterprise value derived from one or more of the approaches described above to the various series of a company’s preferred stock based on their respective liquidation preferences or conversion values, in accordance with the terms of the prevailing Articles/Certificate of Incorporation, assuming that each class of stock takes the course of action that maximizes its return. The fundamental assumption of this method is that the manner in which each class of preferred stockholders will exercise its rights and achieve its return is determined based on the
-84-
Table of Contents
enterprise value as of the valuation date and not at some future date. Accordingly, depending upon the equity value and the nature and amount of the various liquidation preferences, preferred stockholders will participate in equity value allocation either as holders of preferred stock or, if conversion would provide them with better economic results, as holders of common stock. We utilized CVM to account for certain secondary transactions involving our common stock. Specifically, we considered pricing, investor participation, visibility of information between the parties and the purpose and size of the transaction.
Following this offering, we will rely on the closing price of our common stock as reported by The NASDAQ Global Market on the date of grant to determine the fair value of our common stock.
Income Taxes
Our provision for income taxes, deferred tax assets and liabilities, and reserves for unrecognized tax benefits reflect our best assessment of estimated future taxes to be paid. Significant judgments and estimates based on interpretations of existing tax laws or regulations in the U.S. and the numerous foreign jurisdictions where we are subject to income tax are required in determining our provision for income taxes. Changes in tax laws, statutory tax rates, and estimates of our future taxable income could impact the deferred tax assets and liabilities provided for in the consolidated financial statements and would require an adjustment to the provision for income taxes.
Deferred tax assets are regularly assessed to determine the likelihood they will be realized from future taxable income. A valuation allowance is established when we believe it is not more likely than not all or some of a deferred tax asset will be realized. In evaluating our ability to recover deferred tax assets within the jurisdiction in which they arise we consider all available positive and negative evidence. Factors reviewed include the cumulative pre-tax book income for the past three years, scheduled reversals of deferred tax liabilities, our history of earnings and reliable forecasting, projections of pre-tax book income over the foreseeable future, and the impact of any feasible and prudent tax planning strategies.
We recognize the impact of a tax position in our consolidated financial statements only if that position is more likely than not of being sustained upon examination by taxing authorities, based on the technical merits of the position. Tax authorities may examine our returns in the jurisdictions in which we do business and we regularly assess the tax risk of our return filing positions. Due to the complexity of some of the uncertainties, the ultimate resolution may result in payments that are materially different from our current estimate of the tax liability. These differences, as well as any interest and penalties, will be reflected in the provision for income taxes in the period in which they are determined.
Capitalized Internal Use Software
We capitalize certain costs incurred for the development of computer software for internal use. These costs generally relate to the development of our technology platform and applications. We capitalize these costs during the development of the project, when it is determined that it is probable that the project will be completed, and the software will be used as intended. Costs related to preliminary project activities, post-implementation activities, training and maintenance are expensed as incurred. Internal-use software is amortized on a straight-line basis over our estimated useful life, generally three years, and the amortization expense is recorded as a component of cost of subscriptions for projects associated with delivery of our technology platform and applications, or through operating expenses for projects associated with internal operations. Management evaluates the useful lives of these assets on an annual basis and tests for impairment whenever events or changes in circumstances occur that could impact the recoverability of these assets.
-85-
Table of Contents
Recently Adopted Accounting Pronouncements
In April 2015, the Financial Accounting Standards Board, or FASB, issued Accounting Standards Update, or ASU, 2015-03, Interest – Imputation of Interest, requiring entities to present debt issuance costs related to a debt liability as a reduction of the carrying amount of the liability. In August 2015, the FASB issued ASU 2015-15, Interest – Imputation of Interest: Presentation and Subsequent Measurement of Debt Issuance Costs Associated with Line-of-Credit Arrangements, to provide additional guidance pertaining to debt issuance costs related to line-of-credit arrangements. The guidance is effective for public entities for fiscal years and interim periods beginning after December 15, 2015. For all other entities, the guidance is effective for fiscal years beginning after December 15, 2015, and interim periods within fiscal years beginning after December 15, 2016. Early adoption is permitted. We early adopted this standard in the first quarter of 2016. The adoption of this guidance did not have a material impact on our financial statements.
In April 2015, the FASB issued ASU 2015-05, Customer’s Accounting for Fees Paid in a Cloud Computing Arrangement. The new standard provides guidance to customers about whether a cloud computing arrangement includes a software license. If a cloud computing arrangement includes a software license, the customer should account for the software license element of the arrangement consistent with the acquisition of other software licenses. If a cloud computing arrangement does not include a software license, the customer should account for the arrangement as a service contract. The new standard does not change the accounting for a customer’s accounting for service contracts. The new standard is effective for public entities for interim and annual reporting periods beginning after December 15, 2015. For all other entities, the new standard is effective for annual periods beginning after December 15, 2015, and interim periods within annual periods beginning after December 15, 2016. Early adoption is permitted. We early adopted this standard in the first quarter of 2016. The adoption of this new standard did not have a material impact on our financial statements.
In November 2015, the FASB issued ASU 2015-17, Balance Sheet Classification of Deferred Taxes, which requires deferred tax assets and liabilities, along with related valuation allowances, to be classified as non-current on the balance sheet. For public entities, the new standard is effective for fiscal years beginning after December 15, 2016, with early adoption permitted. For all other entities, the new standard is effective for fiscal years beginning after December 15, 2017, and interim periods within annual periods beginning after December 15, 2018. We early adopted this new standard retrospectively in the fourth quarter of 2015. The adoption of this new standard did not have a material impact on our financial statements.
New Accounting Pronouncements Not Yet Adopted
In March 2016, the FASB issued ASU 2016-09, Stock Compensation (Topic 718): Improvements to Employee Share-Based Payment Accounting, which simplifies several aspects of the accounting for employee share-based payment transactions, including the accounting for income taxes, forfeitures, and statutory tax withholding requirements, as well as classification in the statement of cash flows. For public entities, ASU 2016-09 is effective for fiscal years beginning after December 15, 2016, including interim periods within those fiscal years. For all other entities, the guidance is effective for fiscal years beginning after December 15, 2017, and interim periods within those annual periods beginning after December 15, 2018. We are currently evaluating the impact this guidance will have on our financial statements.
In February 2016, the FASB issued ASU 2016-02, Leases (Topic 842). The objective of the update is to improve financial reporting by increasing transparency and comparability among organizations by recognizing lease assets and lease liabilities on the balance sheet and disclosing key information about leasing arrangements. For public entities, the new standard is effective for interim
-86-
Table of Contents
and annual reporting periods beginning after December 15, 2018. For all other entities, the new standard is effective for annual reporting periods beginning after December 15, 2019, and for interim periods within those annual periods beginning after December 15, 2020. Early application of the amendments is permitted for all entities. We are currently evaluating the impact this guidance will have on our financial statements.
In May 2014, the FASB issued ASU 2014-09, Revenue from Contracts with Customers (Topic 606), outlining a single comprehensive model for entities to use in accounting for revenue arising from contracts with customers that supersedes most current revenue recognition guidance. This guidance requires an entity to recognize revenue when it transfers promised goods or services to customers in an amount that reflects the consideration to which the entity expects to be entitled in exchange for those goods or services. Additionally, this guidance expands related disclosure requirements. In August 2015, the FASB issued ASU 2015-14, Revenue from Contracts with Customers (Topic 606): Deferral of the Effective date, which delayed the effective date of ASU No. 2014-09 by one year and is allowing earlier adoption; however, entities reporting under GAAP are not permitted to adopt the standard earlier than the original effective date for public entities. For public entities, the new standard is effective for annual periods and interim periods within those annual periods, beginning after December 15, 2017. For all other entities, the new standard is effective for annual periods beginning after December 15, 2018, and interim periods within those annual periods beginning after December 15, 2019. The new standard will require full or modified retrospective application. In March 2016, the FASB issued ASU 2016-08, Revenue from Contracts with Customers (Topic 606): Principal versus Agent Considerations (Reporting Revenue Gross versus Net), which is intended to improve the operability and understandability of the implementation guidance on principal versus agent considerations. The effective date for ASU 2016-08 is the same as the effective date for ASU 2014-09. In April 2016, the FASB issued ASU 2016-10, Revenue from Contracts with Customers (Topic 606): Identifying Performance Obligations and Licensing, which clarifies the implementation guidance on identifying performance obligations and licensing. The effective date for ASU 2016-10 is the same as the effective date for ASU 2014-09. In May 2016, the FASB issued ASU 2016-12, Revenue from Contracts with Customers (Topic 606): Narrow-Scope Improvements and Practical Expedients, which clarifies the implementation guidance on collectability, noncash consideration, presentation of sales tax and transition. We are currently evaluating the impact this guidance will have on our financial statements as well as the expected adoption method and timing.
In August 2014, the FASB issued ASU No. 2014-15, Presentation of Financial Statements – Going Concern (Subtopic 205-40), related to the disclosures around going concern. The new standard provides guidance around management’s responsibility to evaluate whether there is substantial doubt about an entity’s ability to continue as a going concern and to provide related footnote disclosures. The new standard is effective for all entities for fiscal years beginning after December 15, 2016, with early adoption permitted. The adoption of this standard is not expected to have a material impact on our financial statements.
-87-
Table of Contents
Overview
We are the leading provider of Technology Business Management, or TBM, solutions. We pioneered the TBM software category to provide the strategic business management system for the CIO because IT needed a data-driven system comparable to those leveraged by other enterprise functions such as sales, human resources and finance. Our cloud-based platform and SaaS applications enable IT leaders to analyze, optimize and plan technology investments, and to benchmark their financial and operational performance against peers. We empower IT leaders to transform IT into a service provider, to navigate the cloud transition, and to shift technology resources to drive more business innovation.
Our TBM solutions consist of a powerful, cloud-based platform and a suite of SaaS applications: Cost Transparency, IT Benchmarking, Business Insights, Bill of IT and IT Planning. Our data and analytics platform leverages proprietary modeling capabilities, powerful self-service analytics and planning workflows to enable customers to make actionable, data-driven strategic and operational decisions. Our platform automatically aggregates, cleanses and establishes relationships across large amounts of customer data from disparate sources and maps the data into our standard IT operating model. Our solutions are the business system of record for our customers’ IT organizations.
Technology has become a strategic imperative for enterprises regardless of size and industry, driven by the digitalization of business processes. To gain and maintain a competitive advantage, IT leaders must focus more time and resources on transforming their IT business while optimizing their existing infrastructure and applications. IT organizations manage large budgets and are faced with a rapidly changing, vastly more complicated and increasingly diverse technology and vendor ecosystem. In the absence of a TBM solution, some IT leaders attempt to manage their investments manually using spreadsheets or general purpose business intelligence tools, while others do not even try. These approaches are expensive, error-prone, inefficient, slow and often fail to deliver actionable information. As a result, IT leaders are often unable to make agile, data-driven decisions.
Enterprise IT is undergoing a fundamental transition as cloud computing and technology-as-a-service delivery models offer compelling benefits and economics. IT organizations must transition from traditional internally delivered IT infrastructure and applications to a more hybrid and service-oriented approach. This hybrid delivery and service model allows modern IT organizations to optimize service options and deliver IT as a service to meet business needs, but evaluating, deciding and managing between alternatives is complex. IT organizations are in the early stages of a long-term transformation to delivering IT as a service through the use of public and private clouds as well as third party service providers. Our SaaS applications enable IT leaders to make data-driven decisions, such as which workloads to move into the cloud or leave on-premise.
Our growing customer base, which includes over 40% of the FORTUNE 100, spans a broad spectrum of industries, including financial services, professional services, technology, energy, consumer goods, manufacturing, healthcare, media, retail and transportation, as well as federal and state government agencies. Our customers include leading businesses from a broad spectrum of industries, such as Allianz Life Insurance of North America, AOL, Cox Automotive, eBay, First American Title Insurance Company, Freddie Mac, KeyBank, Microsoft and Molina Healthcare. We currently have several customers utilizing our solutions in legal, facilities and other shared services functions and foresee great potential of further adoption in these segments. We offer our solutions on a subscription basis, with subscription fees based on spend managed by our applications and the number of applications or capabilities for which the customer has subscribed. Our customers’ annual IT spend ranges from less than $10 million to billions of dollars.
-88-
Table of Contents
We formed the Technology Business Management Council, or TBM Council, as a separate non-profit entity in 2012 to foster the growth of the TBM category. The TBM Council has become the leading community for CIOs, IT professionals and IT finance professionals dedicated to advancing the discipline of managing the business of IT, with over 2,900 members. The TBM Council promotes interaction, learning, and the development and improvement of standards and best practices to members, many of which dovetail with our solutions. Our relationship with the TBM Council helps us introduce a growing body of CIOs and other leaders to the advantages of TBM and to our solutions, creating a network effect as members exchange information, ideas and experiences with TBM. Our relationship with the TBM Council also enabled development of Apptio TBM Unified Model, or ATUM, our standardized cost and operational model for the business of IT, which is the first of its kind in our industry. We consider this relationship an important growth catalyst for the TBM category and our business.
We had total revenue of $106.6 million and $129.3 million in 2014 and 2015, respectively, reflecting a year-over-year increase of 21%. For the six months ended June 30, 2015 and 2016, we had total revenue of $62.2 million and $75.6 million, respectively, reflecting a period-over-period increase of 22%. For 2014, 2015, and the six months ended June 30, 2015 and 2016, our net losses were $32.9 million, $41.0 million, $18.4 million and $14.9 million, respectively, as we focused on growing our business.
Industry Background
Technology continues to transform business, impacting both internal and customer facing functions. With technology a strategic priority, organizations of all sizes must understand, communicate and optimize their technology investments to more closely align with key business objectives. This transformation is defined and impacted by a number of factors.
IT Performance is Critical to Business Success. Almost every business depends on IT. Digitalization of business processes has spread across industries, such as online banking and electronic trading in the financial industry, omnichannel commerce in the retail industry, and digital marketing and customer service across many industries. To gain and maintain a competitive advantage, IT leaders must focus more time and resources on transforming their IT business, and less time managing legacy infrastructure and applications. According to a December 2015 Gartner report, organizations on average in 2015 spent approximately 70% of IT budgets on running the business, 19% on growing the business and 11% on transforming the business.1 This means over two-thirds of IT resources are spent on simply maintaining what already exists, and less than one-third are spent on initiatives that drive better business outcomes. Unlike other business functions, from marketing to sales to manufacturing, IT has historically lacked a business management solution to manage the critical technology function. As a result, IT leaders are often unable to make agile, data-driven decisions and lack the solutions necessary to help them shift their focus to creating business value.
IT Complexity is Increasing Significantly. Rapid innovation in technology, particularly the emergence of cloud computing, is simultaneously increasing the complexity of technology decision making and fundamentally transforming the way IT services are delivered. IT professionals must not only measure and manage traditional infrastructure such as servers, storage and software applications, but also a wide array of modern options such as cloud, virtualized environments, and IT purchased directly by business units without the involvement of IT professionals. IT leaders are faced with the need to evaluate hybrid approaches to IT, using a mixture of public cloud, private cloud and owned infrastructure solutions in order to best suit their application, workload and business needs.
| 1 | See Gartner note (2) in the section of this prospectus captioned “Special Note Regarding Forward Looking Statements.” |
-89-
Table of Contents
Simultaneously, enterprises must manage significantly more IT providers, sometimes numbering in the hundreds. To succeed in this complex and rapidly changing environment, enterprises must have better visibility into IT infrastructure and labor utilization, IT spend and resulting business performance, and a way to analyze their alternatives.
Demand for IT as a Service. When making decisions regarding investments in and consumption of technology, businesspeople want choice, on-demand availability, a clear view of total and unit costs of the alternatives and the means to correlate costs to expected value. The ease of use, transparent pricing reliability and availability of both enterprise and consumer cloud-based software is accelerating demand for technology that is being delivered as a service with those factors in mind.
IT Complexity Requires an Effective Management System. The IT function has historically lacked the insight into costs, capacity and utilization necessary to make data-driven decisions provided by a business management system. The emergence of the cloud and public cloud providers with a variety of capabilities and different pricing models adds to this complexity. While it is possible to gain limited insight through consulting engagements or laborious, inefficient internally developed processes, the time, costs and resources associated with such efforts mean that such initiatives often cannot be undertaken more than once a year and, by the time IT and business leaders are asked to make a decision, the information that formed the basis of the decision is often dated. Alternatively, some attempt to employ general purpose business intelligence tools that have not been built to provide the necessary insights. IT operations software focuses on automating business processes, not on managing IT as a business function. Without a business management system to map IT costs and performance to business results, IT organizations struggle to analyze and correlate disparate financial and operational data in the context of the business operations. Business and IT leaders desire the ability to make fast decisions, drive innovation and adopt new technology to drive better business results, while also demanding better control, cost management, and asset utilization. In order to be aligned on objectives, business and IT leaders need data and analytical solutions to drive optimal business results. The benefits the cloud provides in agility and cost are driving greater urgency by IT leaders to adopt solutions enabling them to understand their existing infrastructure and make decisions on how their infrastructure needs evolve as part of an ongoing transition.
Given these factors, we believe that there is significant pent up demand for a single system of record to manage the business of IT in a similar manner to the system of record used by leaders of other business functions, such as finance, sales or human resources.
Our Opportunity
We believe the total addressable market for TBM solutions is large and largely unpenetrated. The total addressable market for our solutions is driven by global IT spend, which Gartner, an independent technology industry and market research firm, expects to be $2.7 trillion in 2016, which is the sum of all enterprise IT spending by vertical industry market worldwide.2 Subscription fees for our applications are based primarily on the customer’s annual costs being managed by our applications and the number of applications or capabilities for which the customer has subscribed. We typically sell a subset of the five applications we offer so that customers can realize a rapid time to value from a targeted implementation, and seek to sell additional applications over time. Assuming full deployment of all of our current applications, subscription fees typically range from 0.1% to 0.5% of a customer’s annual IT spend. With a reasonable expectation of our ability to penetrate the market, we believe that the current total addressable market for our existing TBM solutions is approximately $6 billion.
| (2) | See Gartner note (1) in the section of this prospectus captioned “Special Note Regarding Forward Looking Statements.” |
-90-
Table of Contents
We also believe that, with the development of additional capabilities and applications, our platform can be extended to other areas of customers’ businesses. In fact, our solutions are currently deployed by several customers to address a variety of non-IT, enterprise business management use cases in shared services such as legal, human resources and facilities and for analyzing operational metrics such as unit costs of various offerings or transactions, and we believe that enterprise business management use cases such as these represent future market opportunities. If we are successful in our strategy of developing and selling additional applications beyond our current offerings, we believe that our market opportunity will expand.
Our Technology Business Management Solutions
We provide the business system of record for our customers’ IT organizations, which enables them to analyze, optimize and plan investments, and benchmark their financial and operational performance against peers. Our TBM solutions consist of a powerful, cloud-based platform and a suite of SaaS applications that empower IT leaders to understand, communicate and transform IT to drive greater value from technology investments as illustrated by the following figure.
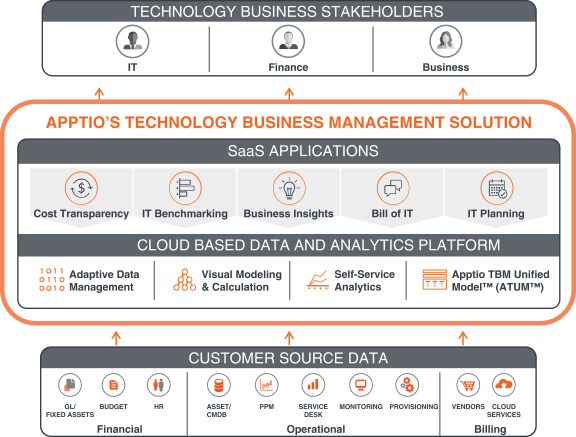
Key elements of our solutions include:
Adaptive Data Management. Our purpose-built, cloud-based data and analytics platform aggregates, cleanses and correlates large amounts of customer data from a wide variety of disparate sources. Our platform automatically establishes relationships between data from various sources and transforms the data into intuitive, dynamic and easily usable reports through our applications. Our typical customer starts with a handful of data sources and has the option to integrate data from
-91-
Table of Contents
hundreds of sources. For example, a customer may choose to aggregate and analyze general ledger data from Oracle, human resources data from Workday, billing data from Microsoft, and service management and other operational data from HP, VMware and ServiceNow, although they have the capability to capture data from significantly more sources. Our database preserves historical context of the data, and easily tracks and adapts to changing technology and policy requirements and IT complexity.
Standard IT Operating Model and Taxonomy. Our platform is underpinned by a flexible framework that provides a standard model for how IT costs are captured, categorized and allocated to IT services and business services. While we allow our customers to modify this framework, we encourage customers to adopt the Apptio TBM Unified Model, or ATUM, our standardized cost and operational model. ATUM is the first of its kind in our industry. This model was developed in conjunction with the TBM Council’s efforts to establish standards for TBM, including common taxonomies, frameworks and benchmarks that organize and translate IT costs, operational data and other metrics into IT and business perspectives. We believe that ATUM is a strategic advantage and will be an important element to broaden the market for TBM solutions and accelerate market adoption.
Visual Modeling and Powerful Calculation Engine. Our visual modeling capabilities allow users to intuitively build and manage the financial and operational model of their IT organization. The powerful calculation engine in our platform then allows the models to be applied across very large data sets accessible to users through the analytics capabilities included in our applications. Our platform, modeling capabilities and calculation engine can be applied to IT business services and to non-IT enterprise business services, such as legal, human resources and facilities.
Intuitive, Self-Service Analytics. Our analytics interface is powerful, yet easy to use by a broad range of IT and business users. Our solutions enable analysis, scenario modeling and planning with intuitive data visualization. Our analytics can be applied to infrastructure modernization, vendor consolidation, application rationalization, cloud decisions, personnel costs and business services. Our solutions enable users to start with a high level view such as costs and utilization allocated across major categories, such as compute, application, storage, network and cloud. The user may then drill through various levels of detail — such as fully burdened costs by application — all the way to a single line item cost in a monthly bill for a given application.
Modular Applications. Our platform currently includes five SaaS applications that can be deployed in a modular fashion. This approach allows customers to realize a rapid time to value and also provides us with a significant opportunity to sell additional applications. Customers gain rapid return on investment from our solutions by making data-driven decisions allowing them to shift expenses from running the business to transforming the business, or by automating processes that the IT organization is currently performing manually. Our applications are:
| • | Cost Transparency. The Cost Transparency application allows customers to understand their enterprise’s IT costs to drive better and faster resource investment decisions. |
| • | IT Benchmarking. The IT Benchmarking application enables customers to see how they compare with their peers and share this information within their organization. |
| • | Business Insights. The Business Insights application enables customers to optimize their IT investments by better understanding the value to the enterprise of such investments and what drives that value. |
| • | Bill of IT. The Bill of IT application allows IT leaders to communicate the IT costs attributable to each business partner and to empower each business partner to be a better consumer of IT by giving the partner choices that help reduce and recover costs. |
-92-
Table of Contents
| • | IT Planning. The IT Planning application allows IT finance and budget owners to plan more effectively and confidently, align faster with financial plans and business priorities, and hold budget owners accountable with variance analysis. |
Data Aggregation and Benchmarking. As a cloud-based solution serving many customers and industry verticals, we are uniquely positioned to capture data across our customer base, forming a new source of IT-specific business data. We also license additional data from third parties to enable our benchmarking offerings. Over time, our customers will benefit from aggregated anonymized benchmarking data providing additional performance insights based on peer groups by industry, business size and geography. We expect to offer our benchmarking data to platform customers and others to drive additional growth and advance our position as a TBM thought leader.
Benefits of Our Solutions
Our Technology Business Management solutions deliver the following benefits:
Increase the Value of IT. Our solutions deliver transparency and actionable insights to IT leaders, enabling them to manage IT in the context of the business. This allows IT professionals to strategically align with C-level executives and other business leaders to deliver positive business contributions. As a result, our solutions enable IT leaders to change their IT organizations from a reactive cost center to a proactive service provider and increase the return on business investments through initiatives such as application rationalization and infrastructure optimization.
Understand and Communicate IT Costs. Our solutions provide IT and business leaders with a business system of record that gives a comprehensive, transparent and up-to-date view of the costs of IT services associated with specific business functions and services. With this insight, IT leaders can work with business leaders to evaluate different IT options, such as cloud versus owned infrastructure and custom-built or purchased versus SaaS applications, and make better, data-driven decisions.
Optimize IT Investments to Drive Better Business Results. Our solutions enable IT professionals to more efficiently manage existing IT investments and focus incremental effort and spend on innovating and expanding technology investments where they can drive the most value for the business. IT professionals can also leverage value-added insight from benchmarking in order to better understand and optimize asset and service utilization and cost. In addition, unlike initiatives based on the advice of consultants or laborious, internally developed legacy business processes held together by spreadsheets, that are too expensive or time consuming to undertake regularly, our solutions, with their dynamic analytics, key performance indicators, and benchmarking capabilities, allow professionals to optimize investments on an ongoing basis.
Plan IT Investments. IT professionals can collaborate with the business to understand their demand for IT services, and then plan efficiently and predictably to meet these demands. For example, customers can model various scenarios with various complexity, such as how costs associated with a single application priced on a per-user basis with multiple pricing bands would change if a business unit added more users, or what would the effect be if the business took multiple applications from one or more vendors and aggregated various levels of usage across the enterprise.
Transform IT into a Service Provider. Our solutions enable IT to be delivered as a service regardless of whether it is provided by internal resources, cloud providers or other external service providers. Using our solutions, IT leaders can provide transparency into total and unit costs of alternatives and are able to correlate costs to expected value. This empowers business leaders with real, data-driven choices to better align IT and business objectives.
-93-
Table of Contents
Our Competitive Strengths
The following strengths are key to our success:
TBM Category Creation and Thought Leadership. We pioneered the TBM category and are its market and thought leader. Since inception, we have dedicated ourselves to establishing deep relationships with, and fostering a community of, CIOs and other IT leaders, particularly through our efforts with the TBM Council. We believe our efforts and position at the center of the TBM ecosystem allow us to benefit from a network effect, accelerating market adoption of TBM solutions and customer acquisition.
High Profile Reference Accounts and CIO Engagement. As of June 30, we had over 325 customers across various industries, with over 40% of the FORTUNE 100 using our solutions. We have engaged, and will continue to engage, with the CIO community, who are the key decision-makers in transforming their enterprises’ IT businesses. Our high profile customers and CIO engagement lead to enhanced credibility and better lead generation and conversion, existing and potential customers view us as the market leader in TBM, further reinforcing the network effect resulting from our leadership in the TBM category.
Deep IT Business Process Expertise. As the TBM category creator and leader, we have a deep and unique understanding of the role of IT, IT business processes and how IT can maximize business value. We embed this TBM expertise into our purpose-built solutions which, in conjunction with our standard setting efforts through the TBM Council and ATUM, the industry’s first standardized IT operating model, allow us to deliver a compelling value proposition to customers. In addition, through our support and leadership of the TBM Council and other initiatives to foster a robust IT leader community, we apply our expertise to improve market awareness of TBM solutions and generate sales leads.
Unique Data Set. We have built a large and unique aggregated data set of customer IT spend across a spectrum of industries, geography and amount of spend. We believe that this data set is the most extensive, granular and up-to-date data set of its kind. This allows us to deliver solutions that provide unique benchmarking capabilities. As our customer base continues to grow, our data set will become deeper and richer, increasing its value.
Unbiased Approach. Our focus on TBM allows us to provide customers an unbiased assessment of IT solutions offered by providers of infrastructure, applications and services. We believe this has led to deep customer trust. Customers need not be concerned that we have a competing agenda and seek to drive technology decisions that will benefit us economically.
Proven, Enterprise-Class Cloud-Based Platform. Our powerful platform leverages in-memory processing for performance and is proven to scale to serve customers ranging from annual IT spend of less than $10 million to annual IT spend in the billions at some of the world’s largest enterprises. Our solutions are cloud-based, allowing us to provide enterprise-class software solutions that are regularly updated and highly scalable to customers around the globe.
Our Growth Strategy
We are pursuing the following strategies to grow our business:
Expand Our Customer Base. We believe the market for TBM solutions is large, growing and under-penetrated. We intend to leverage our strong brand, leadership position, high-profile customer base from a wide range of industries and experienced sales team to target customers with a wide
-94-
Table of Contents
range of IT spend and across industries. As of June 30, 2016, we had over 325 customers and we believe there are tens of thousands of potential customers worldwide with annual IT spend in excess of $10 million that would benefit from our solutions. We also intend to sell our solutions to government agencies in the United States and elsewhere. To achieve this planned expansion of our customer base and to further accelerate our sales cycle and customer onboarding processes, we intend to continue to make investments in our sales, marketing, professional services and product development organizations.
Further Maximize Our Existing Customer Base. Many customers initially subscribe for a subset of the applications we offer so they can realize rapid time to value by reducing costs or shifting technology investments to where they will be most productive. We seek to generate additional revenue from customers by selling subscriptions to other existing or newly developed applications and modules, and expanding the use of our solutions to additional business units. We believe there is a significant opportunity to continue to expand the number of applications and modules deployed by existing customers.
Continue to Foster the IT Leader Community. Through the TBM Council and other efforts, we have fostered an enthusiastic and engaged IT leader community that contributes to our success through their willingness to share their experiences with TBM and our solutions with other potential customers. To support the IT leader community and encourage collaboration, we support various TBM Council events in the United States and elsewhere. We will continue to support the TBM Council and leverage our leadership position in a large and growing IT leader community to increase awareness and adoption of TBM solutions. Our relationship with the TBM Council helps us introduce a growing body of CIOs and other leaders to the advantages of TBM and to our solutions, and continues to create a network effect as members exchange information, ideas and experiences with TBM.
Continue to Deliver Innovative Products. We have made, and will continue to make, significant investments in product development to enhance the capabilities of our existing applications and expand the number of applications on our extensible platform to address customers’ evolving needs. For example, we launched our IT Planning Foundation application in late 2014 to further enhance the value of our suite of TBM applications.
Leverage Our Unique Position to Deliver Valuable Benchmarking Data. The large, unique and growing aggregated data set we have continues to grow as our customer base grows. Over time, we believe there will be substantial opportunities to leverage this aggregated data set by embedding data insights in our solutions making them more valuable to our customers, or by selling data to customers or third parties on a standalone basis. We believe that our ability to continue to collect, analyze and leverage this data will further our thought leadership position in the TBM market as we provide surveys, IT indexes and other information to IT leaders.
Expand Internationally. We have a growing presence in Europe and Australia. We believe that there is significant opportunity for our TBM solutions outside of the United States and we intend to expand our direct sales force and third-party relationships to further penetrate these and other regions.
Expand into Enterprise Business Management. Many shared services groups, such as legal, facilities and human resources, face similar challenges to IT in making data-driven decisions and lack a software solution to help them do so. We believe a substantial market exists for enterprise business management outside of the IT organization. We currently have several customers utilizing our solutions in legal, facilities and other shared services functions, and to analyze unit costs of various offerings or transactions outside of shared services.
-95-
Table of Contents
Applications and Technology
Applications
We have built a suite of cloud-based TBM applications that run on our platform. We currently offer five applications that can be deployed in a modular fashion, with the following core capabilities and features:
Cost Transparency. The Cost Transparency application allows customers to understand their enterprises’ IT costs to drive better and faster resource investment decisions. This understanding is accomplished by putting actionable, current, and trusted information about IT costs at the fingertips of the decision-makers. The Cost Transparency application translates raw financial and IT data into an automated sub-ledger model for IT finance, coupled with real-time and intuitive analytics. IT organizations can then use this information to leverage the best practices in the ATUM standard, or a customized model to ensure that the IT leaders’ cost and key performance indicator, or KPI, categories are directly relevant to the IT business owners. By understanding IT costs, IT organizations can replace assumption and emotion with defensible facts.
By revealing the true cost of applications, infrastructure, and IT services, the Cost Transparency application allows IT organizations to discover and investigate anomalies, spot trends, and monitor changes over time. With this understanding, customers can then accelerate initiatives, bolster business cases for investment, and demonstrate and drive greater efficiency of the IT business. Operationally, IT organizations can streamline financial reporting cycles from weeks to hours, focus more on analysis and insights, and respond quickly to questions from other departments about IT costs.
The Cost Transparency application consists of three modules: Cost Transparency Foundation, Cost Transparency Applications and Services and Cost Transparency Business Unit. The Cost Transparency Foundation module exposes the true cost structure, drivers, and trends by projects, internal and contract labor, vendors, internal functions (such as application support and service management), and the total costs of IT infrastructure, whether on-premise or in the cloud. The Cost Transparency Applications and Services module builds on the Cost Transparency Foundation module by enabling IT leaders to see how these foundational costs drive the total cost of the applications and services that they deliver to their organization. Lastly, the Cost Transparency Business Unit module allows IT leaders to see relative consumption of IT services by the various business units and understand the relative total costs to provide IT across the business units.
IT Benchmarking. The IT Benchmarking application enables customers to see how they compare with their peers and share this information within their organization. IT Benchmarking extends the Cost Transparency application by surfacing side-by-side peer benchmarks beside the customer’s actual KPIs. With IT Benchmarking, customers can evolve their costing monthly via the Cost Transparency application and iteratively improve their data quality and completeness.
IT Benchmarking allows IT organizations to more readily identify targets for IT cost optimization, pinpoint and initiate IT performance improvements, demonstrate efficiency and use the application to help justify IT spend on an ongoing basis. The data that informs our benchmarking application is global and spans 23 industries. The data is based on real engagements, and peer costs are calculated via consistent cost structures. Today, we utilize a combination of third-party data and our own aggregated data to enable our benchmarking offerings. ATUM normalizes data and enables IT leaders to make actionable apples-to-apples comparisons of their monthly actual costs against a database of current benchmarks from relevant peer organizations.
-96-
Table of Contents
Business Insights. The Business Insights application enables customers to optimize their IT investments by better understanding the value to the enterprise of such investments and what drives that value. Business Insights does this by correlating operational IT data, such as capacity, performance and utilization, with financial data provided by the Cost Transparency application. The Business Insights application provides additional insights that enable IT organizations to automate the ongoing measurement and tracking of key metrics on the utilization, performance and quality of IT products and services delivered. It also allows IT organizations to measure the financial impact of changes in performance and utilization so IT leaders can improve and demonstrate efficiency, justify new investments and accelerate decisions. It enables customers to accelerate initiatives and business cases for investment, drive greater efficiency, facilitate better conversations between IT and the business, and improve IT consumption behavior by the business.
The Business Insights application is available in two modules: Infrastructure Insights and Application Insights. The Infrastructure Insights module allows IT organizations to optimize their infrastructure investments and to justify infrastructure spend and budgets by demonstrating and improving efficiency. For example, Infrastructure Insights allows IT leaders to correlate “bring your own device” initiatives to cost trends, optimize sourcing of public, private, and hybrid clouds, and re-tier, reclaim, and retire their storage. The Application Insights module enables organizations to optimize application value to the business while maximizing delivery efficiency. For example, Application Insights supports application rationalization efforts, allows IT leaders to make informed build-versus-buy decisions, and helps manage costs throughout the application lifecycle.
Bill of IT. The Bill of IT application allows IT organizations to communicate the IT costs attributable to business partners in the enterprise, and to empower business partners to be better consumers of IT by giving the partner choices that help reduce and recover costs. The Bill of IT application does this by leveraging the information rendered from the Cost Transparency application or other data sources to create and deliver an internal invoice for the IT services consumed by the recipient.
Many business partners are dissatisfied with fixed allocations of IT costs, and instead want to see exactly how much their business unit consumed and to what extent that drove costs. The Bill of IT application enables IT cost reporting through a simple but interactive “bill” template that allows IT leaders to provide budget, cost, price-based or hybrid bills to their business partners. This then enables cost recovery and unit rate analysis. It shows IT consumption by business units, departments, and users, and provides business-controlled demand levers, such as usage, headcount, and actual or planned consumption. The application also provides “what-if” modeling to collaborate on cost reduction. The application allows IT leaders to create a defensible and consumer-friendly IT showback or chargeback process that makes sense to the rest of the organization and builds trust through transparency, cadence and defensible facts.
IT Planning. The IT Planning application automates planning of IT within a single source via a collaborative workflow resource for IT finance and budget owners so these teams can plan more effectively and confidently. The IT Planning application does this by automating, centralizing, and simplifying any budget, forecast and variance tracking processes in a manner that is purpose-built for the IT finance function and budget owner. The application enables automated baseline budget creation, roll-up of budget requests, and flexible approval hierarchies.
IT Planning incorporates IT specific planning capabilities, and shifts the process from that of managing spreadsheet logistics to consulting and guiding the business. Customers can also derive unique benefits by combining the IT Planning Application with inputs from our Cost Transparency application. Actuals can be leveraged from Cost Transparency to derive fact-based and defensible budgets and forecasts, and provide in-depth actuals-to-plan variance analysis by IT cost pool and IT resource tower, and data-driven budget justifications using historical and unit costs.
-97-
Table of Contents
Technology
ATUM. We developed the Apptio TBM Unified Model, or ATUM, in conjunction with the TBM Council to provide a standardized TBM model utilizing industry-endorsed best practices. Without a standard methodology, organizations face the overwhelming task of how to combine finance and IT data and develop a framework that accurately represents the cost and operations of IT. The result is often a haphazard cost model which provides data and analytics that are viewed skeptically by stakeholders.
Organizations that adopt ATUM can realize better alignment between IT, finance and the rest of the business by having a common language about the IT operating structure and work with the confidence that they have embraced industry best practices. This approach offers easier, more frequent comparisons of performance with peers via ATUM-aligned benchmarking, reducing the challenge of peer comparability that is a significant impediment to historical benchmarking approaches. Importantly, our applications are built to the latest ATUM standards to enable rapid adoption within our customers and have the adaptability to evolve the model over time as IT practices change. Continuing increased adoption of ATUM will enable us to continue to build on what we believe to be the most extensive, granular and up-to-date IT data set by facilitating normalization and comparison of the data.
There are three core elements of ATUM:
| • | Data: Enables organizations to source the data elements, formats, and relationships needed by the model. |
| • | Taxonomy: Provides a way to organize components of key IT operational functions into standard management categories for consistency and comparability. |
| • | Model: Prescribes standard costing and allocation rules to apportion costs to IT categories to ensure alignment with industry best practices. |
The following figure provides an overview of ATUM:
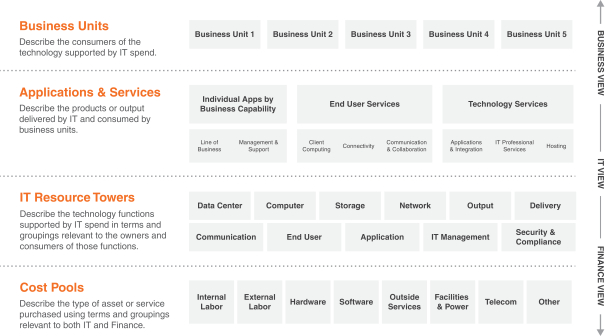
-98-
Table of Contents
Proven, Scalable Technology Foundation
Our solutions are built on an innovative and highly adaptive foundation of modern technologies.
Purpose-Built Platform. Our powerful platform is built to enable TBM applications. It provides integrated data ingestion and management, cost analytics and visualization capabilities. Each element was designed and built specifically for TBM applications with end-to-end optimization providing the highest levels of scalability, while maintaining high levels of performance and reliability. Our platform includes an integrated visual design experience which makes its modeling capabilities accessible to non-technical users. Our platform is also highly configurable and extensible, making it customizable for a variety of uses, evaluations and models, able to integrate other third-party solution providers, and enables our customers to manage the rapid pace of change in the technology market.
Data Ingestion. Our solutions can easily ingest data from wide variety of disparate sources, including financial, budget, HR, asset management, project management, service desk, monitoring and provisioning systems, as well as from vendor and cloud provider billing systems. We can ingest data through a direct connection between our solutions and the vendor’s solution, through a customer’s extract, transform and load infrastructure or by ingesting a file, which may be as simple as a flat file exported from the relevant system and imported into our solution. While we have relationships with many key vendors in the technology ecosystem to facilitate data ingestion, our solutions are not dependent on those relationships.
Automated Data Management. Our platform integrates innovative technologies that greatly ease the cleansing, transformation and mapping process for source data. Our platform persists all source data, intrinsically versions all data and models, and can index to any point of time. This allows our customers to effectively rewind to points in time with full fidelity. Our journal-based architecture provides both auditability and granular rollback of individual transactions and actions in the system.
Calculation Engine. Our in-memory calculation engine optimizes calculations allowing for high levels of scalability, performance and interactivity. This enables our customers to benefit from high performance for the most complex models with large data sets updated on a regular basis. This calculation engine is designed to scale-up, by increasing resources on a given machine, and scale-out, by deploying work across multiple machines, to increase performance without impacting the customer’s user experience.
Proven Scalability. Our platform has proven its capacity to scale to enterprises representing some of the largest IT budgets in the world, while being leveraged for much smaller customers. Our platform can scale calculations or components of work across multiple servers. Through this infrastructure we are able to provide a consistent and highly interactive application experience up through customer solutions at multi-terabyte scale.
Security. We employ a number of technologies, policies and procedures to protect customer data and utilize data centers and services that that have SSAE 16 or ISO 27001 attestations or equivalent attestations.
Shared and Dedicated Services. Our platform and applications combine shared and dedicated services, to provide the best performance for our applications while also optimizing our cost to deliver.
Portable. Our platform and applications are portable across hosting environments. Our solutions can run in co-located data centers and public cloud environments, which provides us with flexibility in deployment of our solutions.
-99-
Table of Contents
Other Technology Components. We utilize industry standard development environments and programming languages. We broadly utilize Java-based environments and JavaScript. We utilize standard database technologies where applicable, including MySQL. Our software is deployed on virtual server instances running on industry standard servers, networking and storage.
TBM Council
The Technology Business Management Council, or TBM Council, is a non-profit entity that promotes interaction, learning, and the development and improvement of standards and best practices to members, many of which dovetail with our solutions. Our relationship with the TBM Council helps us introduce a growing body of CIOs and other leaders to the advantages of TBM and our solutions, creating a network effect as members exchange information, ideas and experiences with TBM. Our relationship with the TBM Council also enabled development of ATUM, our standardized cost and operational model for the business of IT, which is the first of its kind in our industry. We consider this relationship an important growth catalyst for the TBM category and our business
In the earliest days of our company, we interviewed CIOs and other IT leaders at major companies to understand their unmet business needs. We then designed our solutions to allow them to efficiently manage IT services and make effective, data-driven decisions with respect to the cost, quality and value of the IT solutions that they provide for their organization. In an effort to further our and the industry’s understanding of TBM, we formed the TBM Council as a nonprofit professional organization dedicated to advancing TBM in April 2012. We are deeply invested in the TBM Council and committed to its future success. We are the founding member of the TBM Council, we serve as its technical advisor, our chief executive officer is a member of its board of directors and our chief marketing officer serves as its current president. Since its inception, we have invested significant financial and operational resources in the TBM Council’s growth. As a result of our relationship with the TBM Council’s finances and corporate governance, we consolidate the operations of the TBM Council into our financial statements.
Today, the TBM Council has become the leading community for CIOs, IT leaders and IT finance professionals dedicated to advancing the discipline of managing the business of IT, with over 2,900 members and a board of directors comprised of IT thought leaders from some of the world’s most respected companies. The TBM Council hosts an annual TBM Conference in the U.S. plus two international conferences to explore best practices that produce greater value, align IT with business goals, and deliver TBM breakthroughs. The 2015 U.S. conference had over 800 attendees.
We believe that the future success of our business depends upon the development and adoption of the market for TBM. The TBM Council provides an opportunity for IT leaders to be introduced to standards and best practices of TBM and accelerates adoption of our TBM solutions in the market. In addition, we believe that the wide-spread adoption of TBM standards promulgated by the TBM Council will help to broaden the market for TBM solutions to companies with a wider range of annual IT spend, and drive customer adoption of ATUM.
We believe that our ability to help the TBM Council achieve its mission has had and will continue to have an effect on our overall success.
Customers
As of June 30, 2016, we had over 325 customers, including more than 40% of the FORTUNE 100. We have customers in a wide variety of industries, including financial services, professional services, technology, energy, consumer goods, manufacturing, healthcare, media, retail and transportation. Multiple companies or divisions within a single consolidated enterprise that each have a
-100-
Table of Contents
separate paid subscription for our applications are each treated as a separate customer. Typically, our customer subscription contracts have a one- to three-year term and provide for the purchase of certain applications or capabilities being subscribed for by our customers. For 2013, 2014 and 2015, and for the six months ended June 30, 2015 and 2016, no single customer represented more than 10% of our revenue.
Since inception, we have invested heavily in our professional services organization to help ensure that customers successfully deploy and adopt our applications. We believe that the success of our customers is critical to the success of our overall business and therefore we have continued to expand our professional services and partner ecosystem. We actively engage with our existing customer base to assess whether our customers are satisfied and realizing the benefits from our solutions. While these efforts often require a substantial commitment and upfront costs, we believe our investment in professional services will create opportunities to expand our customer relationships over time. In addition, we have made substantial investments to drive increased customer adoption of our solutions and of ATUM. We believe that our efforts to develop more standardized applications will enable us to provide our TBM solutions to a broader set of organizations while reducing the per customer investment required to promote success. For 2014 and 2015 and the six months ended June 30, 2015 and 2016, we derived 26%, 23%, 24% and 18%, respectively, of total revenue from professional services.
Customer Case Studies
Microsoft
Microsoft is a leading platform and productivity company for the mobile-first, cloud-first world. Given its history as an innovative, technology-driven company, Microsoft’s internal service engineering IT team needed a way to automate the consolidation of more than 15 cost center budgets into a single plan with ongoing forecasting capabilities. Utilizing Apptio’s TBM solution, Microsoft anticipates it will be able to complete its yearly planning and quarterly forecasting processes in a 50% shorter timeframe with 90% accuracy.
eBay
eBay is one of the world’s largest online marketplaces with a portfolio of commerce brands. Two of its largest businesses, eBay and PayPal, operated autonomously, each with its own platforms and staff. Following a mandate from the eBay CEO in 2011, the organizations were tasked with creating one unified digital business infrastructure by rationalizing the two company’s separate technologies and services into a small set of standardized digital business components. With Apptio’s TBM solution, the eBay IT team was able to consolidate 23 cloud platforms down to one, increase operational agility and more intelligently negotiate with the company’s suppliers. Then, in 2014, eBay made the decision to spin-off PayPal into a separate entity in 2015. By leveraging the understanding and transparency built with TBM over the past four years, the team was able to quickly separate their infrastructure and establish two digital commerce companies without disrupting IT operations within either organization.
KeyBank
KeyBank is one of the nation’s largest bank-based financial services companies. In 2012, KeyBank’s IT team made the decision to improve transparency into its total IT spend and better manage budget variances. The efforts were initiated without the help of a tool and progress was limited due to the sheer complexity of their data. Numerous manual processes impacted the ability to gain traction and realize measurable results. In late 2014, KeyBank’s IT team engaged Apptio because of
-101-
Table of Contents
the company’s domain expertise, standard methodology, professional network and proven results in improving transparency. In less than 100 days, the KeyBank team gained the transparency they needed to better understand and communicate their IT costs. Utilizing Apptio’s Cost Transparency and Benchmarking applications, KeyBank has benefited from collaborative, fact-based decision making, a process for timely, transparent reporting and partner access to financial data.
Molina Healthcare
Molina Healthcare, Inc., provides managed health care services under the Medicaid and Medicare programs and through the state insurance marketplaces. In 2013, the company’s IT team was looking for a way to understand and report its spending on technology to its counterparts in corporate finance. With Apptio’s TBM solution, Molina was able to centralize disparate sets of financial and technical data in order to identify areas for savings, increased efficiencies and gaps in technical data. As a result, Molina’s IT leaders were able to credibly report on their investments and make reliable recommendations to the business on future areas of technology investment. In addition to strengthening the communication between IT and corporate finance at Molina, the implementation of Apptio has led to better conversations with the business regarding the financial impact of requested IT services.
AOL
AOL, the media technology company, was looking for a way to take its annual IT planning process off of spreadsheets so it could track actual spending against the budget plan. By leveraging Apptio’s TBM solution for its annual budgeting, monthly variance analysis and scenario planning processes, AOL’s IT team is now able to see its exact budget allocation from corporate finance and compare that number to its monthly spend. As a result, AOL’s IT budgeting process is now simpler, more transparent and more accurate.
Cox Automotive
Cox Automotive is an innovative online marketplace for buying and selling new, certified, pre-owned and used cars, which includes Autotrader.com. Cox has over 40,000 dealer partners and employees in over 150 locations and relies heavily on technology to manage and expand its business. Cox management needed to understand its disparate IT data sources in order to enable operational managers to understand consumption of IT resources by each business unit. Cox used Apptio to create a dedicated TBM Office that delivers reporting in a format meaningful to its operational managers. This shift in reporting elevated IT financial management visibility across the organization and established a working cadence with business segments, the IT function and executive management.
Sales and Marketing
We sell substantially all of our applications through our direct sales organization. Our direct sales team is comprised of inside sales and field sales personnel who are organized by geography, account size, and role. We generate customer leads, accelerate sales opportunities and build brand awareness through our marketing programs, through our strategic relationships and by our participation in the TBM Council. Our marketing programs target technology professionals and senior business leaders. Our principal marketing programs include:
| • | recommendations from key customers; |
| • | field marketing events for customers and prospects; |
-102-
Table of Contents
| • | sales development representatives who respond to incoming leads to convert them into new sales opportunities; |
| • | participation in, and sponsorship of, TBM Council conferences; |
| • | integrated marketing campaigns, including direct e-mail, online web advertising, blogs and webinars; |
| • | public relations, analyst relations and social media initiatives; |
| • | cooperative marketing efforts with partners, including joint press announcements, joint trade show activities, channel marketing campaigns and joint seminars; and |
| • | use of our website to provide application and company information, as well as learning opportunities for potential customers. |
We have also developed go-to-market partnerships with a number of key technology, system integrator and consultant partners both domestically and internationally to help customers and potential customers validate our solutions and provide introductions to potential customers, and in some cases to resell our software services, or provide professional services related to our solutions. We anticipate that we will continue to develop a select number of third-party relationships to help grow our business.
Competition
The market for TBM solutions is relatively new and rapidly evolving. In many cases, our primary competition is legacy business processes held together by spreadsheets by our prospective customers. Occasionally we encounter either custom software developed in-house or by consultants, or legacy solutions such as ERP or business intelligence solutions repurposed by in-house IT and finance departments of our potential customers to meet specific business needs. Our competitors also include larger companies, such as VMware and ServiceNow, that provide a suite of products and services, a few niche vendors that provide subsets of TBM capabilities, and several specialized companies that currently target the TBM market through solutions that are tailored to a specific TBM use case or industry. Service management software vendors and others in adjacent segments also have solutions that offer a subset of TBM capabilities, generally targeted around their core offerings. We have ongoing partnerships with many of these vendors and many customers ingest IT finance and operational data from products these vendors provide.
We believe that success in the TBM market requires a dedicated focus and a product architected to manage and analyze large data volumes. We believe that we will increasingly be able to convince internal stakeholders at potential new customers that our TBM solutions are superior to using legacy business processes held together by spreadsheets or legacy solutions that the organization may have previously used to manage IT. We believe this to be especially true as the discipline of TBM, with the help of the TBM Council, develops and establishes standards that are widely accepted best practices for managing and delivering IT within an organization.
In addition, we believe the principal factors affecting a company’s competitive advantage as a provider of TBM solutions include the following:
| • | platform reliability and availability; |
| • | ease of use; |
| • | the use of customer data to drive the information provided in TBM solutions, including benchmarking; |
-103-
Table of Contents
| • | breadth of applications, product features and capabilities; |
| • | focus on, and expertise in, the TBM market; |
| • | price of products and services; |
| • | breadth of expertise of sales organization; |
| • | strength of professional services organization; |
| • | independence of the TBM vendor and trustworthiness of information being delivered; |
| • | IT business management expertise and thought leadership; |
| • | ability to attract customers through demonstrated customer successes; and |
| • | company size and financial stability of operations. |
We believe that we compete effectively on each of the factors listed above; however, we expect competition to intensify in the future. It is possible that the large software vendors who currently do not have an offering in the TBM category, some of which operate in adjacent product categories today, may in the future bring such a solution to market through product development, acquisitions or other means. In addition, several of our competitors have greater name recognition, much longer operating histories, more and better-established customer relationships, larger sales forces, larger marketing and software development budgets and significantly greater resources than we do. Therefore, it is possible that we may not compete favorably with competitors with respect to certain of the forgoing factors.
Data Center Operations
We rely heavily on data centers and other technologies and services provided by third parties in order to operate critical functions of our business. We host our applications and serve our customers from multiple redundant data centers in the following geographies: North America, Western Europe, and Australia. Our data centers are designed to host mission-critical computer systems with fully redundant subsystems and compartmentalized security zones. While we procure and operate all infrastructure equipment delivering our applications, the data centers that we use are operated by third parties. In addition, some of our platform and applications are delivered using a Virtual Private Cloud infrastructure built on by Amazon Web Services, or AWS. As of June 30, 2016, we used AWS data center facilities located in Western Europe, North America (including the AWS GovCloud in the United States) and Australia. We and AWS maintain a formal and comprehensive security program designed to ensure the security and integrity of customer data, protect against security threats or data breaches, and prevent unauthorized access to the data of our customers. We and AWS strictly regulate and limit all access to on-demand servers and networks at our production and remote backup facilities.
We apply a wide variety of strategies to achieve better than 99.5% subscription services availability, excluding scheduled maintenance. Our systems are continually monitored for any signs of problems, and we strive to take preemptive action when necessary. Backup files are transmitted over secure connections to a redundant server storage device in a secondary data center. Our data center facilities and the AWS data centers employ advanced measures designed to ensure physical integrity, including redundant power and cooling systems, and advanced fire and flood prevention.
-104-
Table of Contents
Research and Development
Our ability to compete depends in large part on our continuous commitment to research and development and our ability to introduce new applications, technologies, features and capabilities in a timely manner. Our research and development organization is responsible for design, development, testing and release. Our efforts are focused on developing new products and core technologies and further enhancing the functionality, reliability, performance and flexibility of existing solutions. We focus our efforts on anticipating customer demand in bringing new products and new versions of existing products to market in order to remain competitive in the marketplace.
Research and development expenses were $23.1 million and $30.6 million for 2014 and 2015, respectively, and $14.7 million and $17.1 million for the six months ended June 30, 2015 and 2016, respectively.
Intellectual Property
We rely on a combination of trade secret, copyright, trademark, patent and other intellectual property laws, contractual arrangements, such as assignment, confidentiality and non-disclosure agreements, and confidentiality procedures and technical measures to gain rights to and protect the technology and intellectual property used in our business. We actively pursue registration of our trademarks and service marks in the United States, Australia, Singapore, and the European Community.
As June 30, 2016, we owned six issued U.S. patents and 15 pending U.S. patent applications. We also owned nine pending and granted counterpart applications worldwide, including four European Patent Office applications, one Australian patent application, and four Patent Cooperation Treaty applications. The issued U.S. patents that we own are expected to expire between July 2030 and May 2035. We have sole ownership of all of our U.S. patents and pending U.S. patent applications.
Our applications use “open source” software. Open source software is made available to the general public in source code form for use, modification and redistribution on an “as-is” basis under the terms of a non-negotiable license. We also rely on other technology that we license from third parties. Though such third-party technology may not continue to be available to us on commercially reasonable terms, we believe that alternative technology would be available to us.
Our policy is to require employees and independent contractors to sign agreements assigning to us any inventions, trade secrets, works of authorship, and other technology and intellectual property created by them on our behalf and agreeing to protect our confidential information, and all of our key employees and contractors have done so. In addition, we generally enter into confidentiality agreements with our vendors and customers. We also control and monitor access to our software, source code and other proprietary information.
Regulatory Matters
The legal environment of internet-based businesses is evolving rapidly in the United States and elsewhere. The manner in which existing laws and regulations are applied in this environment, and how they will relate to our business in particular, both in the United States and internationally, is often unclear. For example, we sometimes cannot be certain which laws will be deemed applicable to us given the global nature of our business, including with respect to such topics as data privacy and security, pricing, advertising, taxation, content regulation, and intellectual property ownership and infringement.
-105-
Table of Contents
Data Privacy and Security Laws
Data privacy and security with respect to the collection of personally identifiable information, or PII, continues to be the focus of worldwide legislation and regulation. We are subject to data privacy and security regulation by data protection authorities in the United States (including the states in which we conduct our business) and in other countries where we conduct our business. These regulations include laws requiring holders of personal information to maintain safeguards and to take certain actions in response to a data breach, and, in the European Union, the Data Protection Directive and EU member state implementations thereof, which require comprehensive information privacy and security protections for consumers with respect to PII collected about them. We post on our website our privacy policies and practices concerning the processing, use and disclosure of PII, and certify adherence to and compliance with the U.S. Department of Commerce’s Safe Harbor Privacy Principles and the U.S.-EU and U.S.-Swiss Safe Harbor Frameworks. Our publication of our Safe Harbor certifications, our privacy policy, and other statements we publish regarding privacy and security may subject us to potential state and federal action if they are found to be deceptive or misrepresentative of our practices. We also may be bound from time to time by contractual obligations, including model contract provisions approved by the European Commission, that impose additional restrictions on our handling of PII. The various privacy and data security legal obligations that apply to us may evolve in a manner that relates to our practices or the features of our applications or platform, and we may need to take additional measures to comply with such changes in legal obligations and to maintain and improve our information security posture in an effort to avoid information security incidents or breaches affecting PII or other sensitive or proprietary data.
Legal Proceedings
We may, from time to time, be party to litigation and subject to claims incident to the ordinary course of business. As our growth continues, we may become party to an increasing number of litigation matters and claims. The outcome of litigation and claims cannot be predicted with certainty, and the resolution of these matters could materially affect our future results of operations, cash flows or financial position. We are not presently party to any legal proceedings that, if determined adversely to us, would individually or taken together have a material adverse effect on our business, operating results, financial condition or cash flows.
Employees
As of June 30, 2016, we had 694 full-time employees, of which 591 work in the U.S. or Canada, 83 in Europe, and 20 in Australia. Of our full-time employees, 204 work in sales and marketing, 165 in research and development, 102 in general and administrative and business development, and 223 in customer success and technology operations. None of our U.S. employees is represented by a labor union or is the subject of a collective bargaining agreement.
Facilities
We lease approximately 89,000 square feet of office space for our corporate headquarters in Bellevue, Washington pursuant to a lease that expires in January 2023. We also lease space in various locations in the United States and internationally. We believe our facilities are adequate for our current needs.
-106-
Table of Contents
Executive Officers and Directors
Our executive officers and directors, and their ages and positions as of August 31, 2016, are as set forth below:
| Name |
Age | Position | ||||
| Sachin (Sunny) Gupta |
46 | President, Chief Executive Officer and Director | ||||
| Lawrence Blasko |
47 | Chief Revenue Officer | ||||
| Barbara Gordon |
57 | Chief Customer Officer | ||||
| Ted Kummert |
52 | Executive Vice President, Engineering and Cloud Operations | ||||
| John Morrow |
46 | Executive Vice President, Corporate Development, General Counsel and Secretary | ||||
| Christopher Pick |
46 | Chief Marketing Officer | ||||
| Kurt Shintaffer |
42 | Chief Financial Officer | ||||
| Thomas Bogan(1)(2) |
64 | Chairman of the Board | ||||
| Peter Klein(1) |
53 | Director | ||||
| John McAdam(2)(3) |
65 | Director | ||||
| Matthew McIlwain(3) |
51 | Director | ||||
| Ravi Mohan |
49 | Director | ||||
| Rajeev Singh(1) |
48 | Director | ||||
| (1) | Member of the Audit Committee. |
| (2) | Member of the Compensation Committee. |
| (3) | Member of the Nominating and Corporate Governance Committee. |
Executive Officers
Sunny Gupta, our co-founder, has served as chief executive officer, president and a member of our board of directors since October 2007. Mr. Gupta previously served as chief executive officer of iConclude Co. until its acquisition by Opsware, Inc. in April 2007, following which he served as executive vice president of products of Opsware, Inc. until its acquisition by Hewlett-Packard Company in September 2007. Previously, Mr. Gupta held positions at IBM Corporation and Rational Software. Mr. Gupta holds a B.S. in computer science from the University of South Carolina – Coastal Carolina.
Lawrence Blasko has served as our chief revenue officer since July 2016. He previously served as our senior vice president of worldwide sales from May 2013 to June 2016, and as vice president of worldwide sales from September 2009 to April 2013. Previously, he held positions at Hewlett-Packard, serving as the vice president of enterprise sales for the eastern U.S. from July 2008 to September 2009, Opsware, Inc. (acquired by Hewlett-Packard), where he served as the senior vice president of sales for americas east and public sector from January 2005 to July 2008, in addition to previous sales and sales leadership roles at Veritas Software (acquired by Symantec) and Computer Associates. Mr. Blasko also served as a commissioned officer in the United States Army from September 1991 through September 1995. Mr. Blasko holds a B.S. in criminal justice from the University of Scranton and an M.B.A. from The George Washington University.
Barbara Gordon has served as our chief customer officer since July 2016. From December 2014 to March 2016, Ms. Gordon served as senior vice president of the Emerging Technology Division, a division of publicly traded EMC Corporation. From September 2013 to December 2014, Ms. Gordon served as senior vice president and chief operating officer of EMC Isilon, a division of EMC Corporation. From September 2009 to August 2013, Ms. Gordon served as corporate vice president of Microsoft Corporation Customer Service and Support organization. From September 2010 through August 2013, she served as vice president for enterprise partner group sales in EMEA and served
-107-
Table of Contents
November 2003 through November 2010 as worldwide sales strategy vice president. Previously, she held additional positions at Microsoft, Sun Microsystems, Inc. and iPlanet, Inc. (acquired by Sun Microsystems, Inc.), Digital Equipment Corporation and AT&T. Ms. Gordon holds a B.S. in business administration and a minor in history from Bowling Green State University.
Ted Kummert has served as executive vice president, engineering and cloud operations since November 2013. From February 2013 to November 2013, Mr. Kummert served as a venture partner at Madrona Venture Group, a venture capital firm. From January 2007 to January 2013, Mr. Kummert served as corporate vice president of the business platform division at Microsoft Corporation, where he led the development of several key Microsoft enterprise products. Previously, Mr. Kummert held positions at Apple and Hewlett-Packard. Mr. Kummert holds a B.S. in electrical engineering from the University of Washington.
John Morrow has served as executive vice president, corporate development, general counsel and secretary since March 2015. From January 2015 to February 2015, Mr. Morrow served as senior vice president, corporate development, general counsel and secretary. From September 2014 until January 2015, Mr. Morrow served as senior vice president, general counsel and secretary. From June 2006 to March 2014, Mr. Morrow served as a senior executive at Vertafore, Inc., a provider of cloud-based solutions to the insurance industry, most recently as senior vice president, corporate development and legal affairs, general counsel and secretary. Previously, Mr. Morrow was a shareholder at Heller Ehrman LLP, and held positions at Venture Law Group and Baker & Hostetler LLP. Mr. Morrow holds a B.A. in political science from DePauw University and a J.D. from the University of Notre Dame Law School.
Christopher Pick has served as chief marketing officer since September 2010. From May 2009 to August 2010, Mr. Pick served as entrepreneur in residence at Austin Ventures, a venture capital firm, where he evaluated potential investments in the software section. Previously, he was the chief marketing officer and vice president of products at NetIQ, Inc. and a senior manager at Ernst & Young LLP. Mr. Pick attended the University of Calgary.
Kurt Shintaffer, our co-founder, has served as chief financial officer since March 2015. He previously served as chief financial officer from December 2007 to October 2013 as senior vice president of worldwide accounting and finance from November 2013 to March 2015 and as a member of our board of directors from October 2007 to January 2013. Previously, he held positions at iConclude Co. (acquired by Opsware, Inc.), Pacific Edge Software, Inc. and Ernst & Young LLP. Mr. Shintaffer holds a B.A. in business administration from the University of Washington.
Board of Directors
Thomas Bogan has served as a member of the board of directors since November 2007, as a member of the audit committee and compensation committee since December 2007, and as the chairman of the board of directors since February 2012. Since January 2015, Mr. Bogan has served as chief executive officer of Adaptive Insights, Inc., a SaaS company. From January 2010 to December 2014, Mr. Bogan was an independent director and investor and also served as a venture partner at Greylock Partners, a venture capital firm. From May 2004 to December 2009, he served as a partner at Greylock Partners. Previously, Mr. Bogan served as president of Rational Software, an S&P 500 enterprise software company, and as president and chief executive officer of two early stage technology companies. Mr. Bogan previously served as a member of the board of directors of Citrix Systems, Inc., a publicly-traded software company, PTC Inc., a publicly-traded product development software company, and Rally Software Development Corp., a publicly-traded provider of cloud-based solutions for managing agile software development. Mr. Bogan holds a B.S. in accounting from Stonehill College. We believe Mr. Bogan’s senior management experience in the software industry, both as a chief executive officer and director, qualify him to serve on our board.
-108-
Table of Contents
Peter Klein has served as a member of the board of directors and as chairman of the audit committee since November 2013. From January 2014 to June 2014, Mr. Klein served as chief financial officer of William Morris Endeavor Entertainment, LLC, or WME, a marketing firm. Prior to joining WME, Mr. Klein spent over 11 years at Microsoft Corporation, including serving as chief financial officer from November 2009 until May 2013. Previously, he held senior finance positions with McCaw Cellular Communications, Orca Bay Capital Corporation, Asta Networks Inc. and Homegrocer.com, Inc. Mr. Klein currently serves on the board of directors of F5 Networks Inc., a publicly-traded provider of application delivery networking technology. Mr. Klein holds a B.A. in history from Yale University and an M.B.A. from the University of Washington. We believe Mr. Klein’s extensive experience as a senior finance executive, including as the chief financial officer of one of the world’s largest software companies, qualifies him to serve on our board.
John McAdam has served as a member of our board of directors since February 2013, as chairman of the compensation committee since December 2014 and as a member of the nominating and corporate governance committee since November 2015. Since December 2015, Mr. McAdam has served as president and chief executive officer of F5 Networks Inc., a position he also held from 2000 through July 2015. Previously, he served as general manager of the web server sales business at IBM Corporation and as president and chief operating officer of Sequent Computer Systems, Inc., a manufacturer of high-end open systems (acquired by IBM Corporation). Mr. McAdam currently serves as a member of the board of directors of F5 Networks and Tableau Software, Inc., a publicly-traded business analytics software company and previously served as chairman of F5 Networks. Mr. McAdam holds a B.S. in computer science from the University of Glasgow, Scotland. We believe Mr. McAdam’s fifteen year tenure as the president and chief executive officer of a publicly-traded technology company qualifies him to serve on our board.
Matthew McIlwain has served as a member of our board of directors since November 2007, as a member of the audit committee from December 2007 to July 2015 and as a member of the compensation committee from December 2007 to December 2014. He has served as chair of the nominating and governance committee since July 2015. Since 2002, Mr. McIlwain has served as a managing director of Madrona Venture Group, a venture capital firm. Previously, Mr. McIlwain held positions at Genuine Parts Company, McKinsey & Company and Credit Suisse First Boston. Mr. McIlwain currently serves on the boards of multiple private companies, and previously served on the board of directors of Isilon Systems, a computer hardware and software company (acquired by EMC Corporation). Mr. McIlwain received a B.A. in government and economics from Dartmouth College, M.A. in public policy from Harvard University’s Kennedy School of Government and an M.B.A. from Harvard Business School. We believe Mr. McIlwain’s experience advising growth-oriented technology companies as an investment banker, management consultant, venture capital investor and director qualifies him to serve on our board.
Ravi Mohan has served as a member of our board of directors since August 2010. Since April 2004, Mr. Mohan has served as a managing director of Shasta Ventures, a venture capital firm, which he co-founded. Previously, Mr. Mohan held positions at Battery Ventures, McKinsey & Company, Hyperion Software Corporation, and MIC, a software development firm based in India. He currently serves on the boards of directors of multiple private companies. Mr. Mohan holds a B.S. in operations research and industrial engineering from Cornell University and an M.B.A. from the University of Michigan Business School. We believe Mr. Mohan’s experience advising growth-oriented technology companies as a venture capital investor, coupled with his experience as a director of various companies, qualifies him to serve on our board.
Rajeev Singh has served as a member of our board of directors since October 2010 and as a member of the audit committee since July 2015. Since November 2015, Mr. Singh has served as the chief executive officer of Accolade, a consumer healthcare engagement services company. From
-109-
Table of Contents
September 2005 to January 2015, Mr. Singh served as president of Concur Technologies, or Concur, a SaaS travel and expense management company, which he co-founded in 1993 (acquired by SAP). Previously, Mr. Singh held positions at Ford Motor Company and General Motors. From April 2008 until January 2015, Mr. Singh served on Concur’s board. Mr. Singh holds a B.S.E. from Western Michigan University. We believe Mr. Singh’s senior leadership experience at one of the world’s largest enterprise SaaS companies, which created the SaaS travel and expense market, qualifies him to serve on our board.
Board Composition and Risk Oversight
The board of directors is currently composed of seven members. All of our directors are elected to the board of directors pursuant to a voting agreement that will terminate by its terms upon the closing of this offering. The certificate of incorporation and bylaws to be in effect upon the closing of this offering provide that the number of directors shall be at least one and will be fixed from time to time by resolution of the board of directors. There are no family relationships among any of the directors or executive officers.
During 2015, the board of directors met eight times.
Immediately prior to the closing of this offering, the board of directors will be divided into three classes of directors. At each annual meeting of stockholders, a class of directors will be elected for a three-year term to succeed the class whose terms are then expiring. The terms of the directors will expire upon the election and qualification of successor directors at the annual meeting of stockholders to be held during the years 2017 for the Class I directors, 2018 for the Class II directors and 2019 for the Class III directors.
The Class I directors will be Sachin Gupta and Ravi Mohan.
The Class II directors will be Matt McIlwain, Peter Klein and Thomas Bogan.
The Class III directors will be John McAdam and Rajeev Singh.
The division of the board of directors into three classes with staggered three-year terms may delay or prevent a change of our management or a change in control. See the section of this prospectus captioned “Description of Capital Stock—Anti-Takeover Effects of Delaware and Washington Law and Our Certificate of Incorporation and Bylaws” for a discussion of these and other anti-takeover provisions found in the certificate of incorporation and bylaws.
The board of directors has an active role, as a whole and also at the committee level, in overseeing the management of our risks. The board of directors is responsible for general oversight of risks and regular review of information regarding our risks, including credit risks, liquidity risks and operational risks. The compensation committee is responsible for overseeing the management of risks relating to our executive compensation plans and arrangements. The audit committee is responsible for overseeing the management of risks relating to accounting matters and financial reporting. The nominating and corporate governance committee is responsible for overseeing the management of risks associated with the independence of the board of directors and potential conflicts of interest. While each committee is responsible for evaluating certain risks and overseeing the management of such risks, the entire board of directors is regularly informed through discussions from committee members about such risks. The board of directors believes its administration of its risk oversight function has not affected the board of directors’ leadership structure.
-110-
Table of Contents
Director Independence
Upon the closing of this offering, our Class A common stock will be listed on The NASDAQ Global Market. Under the rules of The NASDAQ Global Market, independent directors must comprise a majority of a listed company’s board of directors within a specified period of the closing of this offering. In addition, the rules of The NASDAQ Global Market require that, subject to specified exceptions, each member of a listed company’s audit, compensation and nominating and corporate governance committees be independent. Audit committee members must also satisfy the independence criteria set forth in Rule 10A-3 under the Securities Exchange Act of 1934, as amended. Under the rules of The NASDAQ Global Market, a director will only qualify as an “independent director” if, in the opinion of that company’s board of directors, that person does not have a relationship that would interfere with the exercise of independent judgment in carrying out the responsibilities of a director.
To be considered independent for purposes of Rule 10A-3, a member of an audit committee of a listed company may not, other than in his or her capacity as a member of the audit committee, the board of directors, or any other board committee: (1) accept, directly or indirectly, any consulting, advisory, or other compensatory fee from the listed company or any of its subsidiaries; or (2) be an affiliated person of the listed company or any of its subsidiaries.
In August 2015, the board of directors undertook a review of its composition, the composition of its committees and the independence of directors and considered whether any director has a material relationship with us that could compromise his or her ability to exercise independent judgment in carrying out his or her responsibilities. Based upon information requested from and provided by each director concerning his or her background, employment and affiliations, including family relationships, the board of directors has determined that none of Messrs. Bogan, Klein, McAdam, McIlwain, Mohan or Singh, representing six of our seven directors, has a relationship that would interfere with the exercise of independent judgment in carrying out the responsibilities of a director and that each of these directors is “independent” as that term is defined under the rules of The NASDAQ Global Market. The board of directors also determined that Messrs. Bogan, Klein and Singh, who comprise our audit committee, Messrs. Bogan and McAdam, who comprise our compensation committee, and Messrs. McIlwain and McAdam, who comprise our nominating and corporate governance committee, satisfy the independence standards for those committees established by applicable SEC rules and the rules of The NASDAQ Global Market.
In making this determination, the board of directors considered the relationships that each non-employee director has with us and all other facts and circumstances the board of directors deemed relevant in determining their independence, including the beneficial ownership of our capital stock by each non-employee director.
Board Committees
The board of directors has an audit committee, a compensation committee and a nominating and corporate governance committee, each of which has the composition and the responsibilities described below.
Audit Committee
The members of our audit committee are Messrs. Klein, Bogan and Singh. Our audit committee chairman, Mr. Klein, is our audit committee financial expert, as that term is defined under the SEC rules implementing Section 407 of the Sarbanes-Oxley Act of 2002, and possesses financial
-111-
Table of Contents
sophistication, as defined under the rules of The NASDAQ Global Market. Our audit committee oversees our corporate accounting and financial reporting process and assists the board of directors in monitoring our financial systems. Our audit committee will also:
| • | approve the hiring, discharging and compensation of our independent auditors; |
| • | oversee the work of our independent auditors; |
| • | approve engagements of the independent auditors to render any audit or permissible non-audit services; |
| • | review the qualifications, independence and performance of the independent auditors; |
| • | review financial statements, critical accounting policies and estimates; |
| • | review the adequacy and effectiveness of our internal controls; |
| • | oversee the management of risks relating to accounting, financial reporting and other matters; and |
| • | review and discuss with management and the independent auditors the results of our annual audit, our quarterly financial statements and our publicly filed reports. |
During 2015, our audit committee met four times.
Compensation Committee
The members of our compensation committee are Messrs. Bogan and McAdam. Mr. McAdam is the chairman of our compensation committee. Our compensation committee oversees our compensation policies, plans and benefits programs. The compensation committee will also:
| • | review and recommend policies relating to compensation and benefits of our officers and employees; |
| • | review and approve corporate goals and objectives relevant to compensation of our chief executive officer and other senior officers; |
| • | evaluate the performance of our officers in light of established goals and objectives; |
| • | recommend compensation of our officers based on its evaluations; and |
| • | administer the issuance of stock options and other awards under our stock plans. |
During 2015, our compensation committee met three times.
Nominating and Corporate Governance Committee
The members of our nominating and corporate governance committee are Messrs. McIlwain and McAdam. Mr. McIlwain is the chairman of our nominating and corporate governance committee. Our nominating and corporate governance committee oversees and assists the board of directors in reviewing and recommending nominees for election as directors. The nominating and corporate governance committee will also:
| • | evaluate and make recommendations regarding the organization and governance of the board of directors and its committees; |
-112-
Table of Contents
| • | assess the performance of members of the board of directors and make recommendations regarding committee and chair assignments; |
| • | recommend desired qualifications for board of directors membership and conduct searches for potential members of the board of directors; and |
| • | review and make recommendations with regard to our corporate governance guidelines. |
During 2015, our nominating and corporate governance committee did not meet.
The board of directors may from time to time establish other committees.
Code of Conduct and Ethics
We have adopted a written code of conduct and ethics that applies to our directors, officers and employees, including our principal executive officer, principal financial officer, principal accounting officer or controller, or persons performing similar functions prior to the closing of this offering. Following this offering, a current copy of the code will be posted on the investor section of our website, www.apptio.com. Information contained on or accessible through our website is not a part of this prospectus, and the inclusion of our website address in this prospectus is an inactive textual reference only. We intend to disclose any amendments to the code of conduct and ethics, or any waivers of its requirements, on our website to the extent required by the applicable rules and exchange requirements. The inclusion of our website address in this prospectus does not incorporate by reference the information on or accessible through our website into this prospectus.
Compensation Committee Interlocks and Insider Participation
The members of our compensation committee are Messrs. Bogan and McAdam. Neither is an officer or employee of us. None of our executive officers currently serves, or in the past year has served, as a member of the board of directors or compensation committee (or other board committee performing equivalent functions or, in the absence of any such committee, the entire board of directors) of any entity that has one or more executive officers serving on the board of directors or compensation committee. Please refer to the section of this prospectus captioned “Certain Relationships and Related Party Transactions” for information regarding certain transactions with Mr. Bogan.
Limitation of Liability and Indemnification
Our certificate of incorporation and bylaws provide the indemnification of our directors and officers to the fullest extent permitted under the Delaware General Corporation Law. In addition, the certificate of incorporation provides that our directors shall not be personally liable to us or our stockholders for monetary damages for breach of fiduciary duty as a director and that if the Delaware General Corporation Law is amended to authorize corporate action further eliminating or limiting the personal liability of directors, then the liability of our directors shall be eliminated or limited to the fullest extent permitted by the Delaware General Corporation Law, as so amended.
As permitted by the Delaware General Corporation Law, we have entered into separate indemnification agreements with each of our directors and certain of our officers that require us, among other things, to indemnify them against certain liabilities which may arise by reason of their status as directors, officers or certain other employees. We expect to obtain and maintain insurance policies under which our directors and officers are insured, within the limits and subject to the limitations of those policies, against certain expenses in connection with the defense of, and certain liabilities that might be imposed as a result of, actions, suits or proceedings to which they are parties by reason of being or having been directors or officers. The coverage provided by these policies may apply whether or not we would have the power to indemnify such person against such liability under the provisions of the Delaware General Corporation Law.
-113-
Table of Contents
We believe that these provisions and agreements are necessary to attract and retain qualified persons as our officers and directors. At present, there is no pending litigation or proceeding involving our directors or officers for whom indemnification is required or permitted, and we are not aware of any threatened litigation or proceeding that may result in a claim for indemnification.
Non-Employee Director Compensation
The following table sets forth information concerning the compensation paid or accrued for services rendered to us by non-employee members of the board of directors for 2015. Compensation paid or accrued for services rendered to us by Mr. Gupta in his role as chief executive officer is included in our disclosures related to executive compensation in the section of this prospectus captioned “Executive Compensation.”
Director Compensation Table
| Name |
Fees Earned or Paid in Cash ($) |
Option Awards ($)(1) |
All Other Compensation ($) |
Total ($) |
||||||||||||
| Thomas Bogan(2) |
— | 171,717 | — | 171,717 | ||||||||||||
| Peter Klein(3) |
— | 171,717 | — | 171,717 | ||||||||||||
| John McAdam(4) |
— | 171,717 | — | 171,717 | ||||||||||||
| Matt McIlwain(5) |
— | 171,717 | — | 171,717 | ||||||||||||
| Ravi Mohan(6) |
— | 171,717 | — | 171,717 | ||||||||||||
| Rajeev Singh(7) |
— | 171,717 | — | 171,717 | ||||||||||||
| (1) | The dollar amounts in this column represent aggregate grant date fair value of options granted to non-employee members of the board of directors in 2015. These amounts have been computed in accordance with FASB Topic 718, using the Black-Scholes option pricing model. Pursuant to SEC rules, the amounts shown exclude the impact of estimated forfeitures related to service-based vesting conditions. For a discussion of valuation assumptions, see the notes to our financial statements included elsewhere in this prospectus. |
| (2) | As of December 31, 2015, Mr. Bogan held options for the purchase of 30,000 shares of our Class B common stock, none of which were vested as of such date. |
| (3) | As of December 31, 2015, Mr. Klein held options for the purchase of 118,127 shares of our Class B common stock, of which 45,899 shares were vested as of such date. |
| (4) | As of December 31, 2015, Mr. McAdam held options for the purchase of 118,127 shares of our Class B common stock, of which 64,259 shares were vested as of such date. |
| (5) | As of December 31, 2015, Mr. McIlwain held options for the purchase of 30,000 shares of our Class B common stock, none of which were vested as of such date. |
| (6) | As of December 31, 2015, Mr. Mohan held options for the purchase of 30,000 shares of our Class B common stock, none of which were vested as of such date. |
| (7) | As of December 31, 2015, Mr. Singh held options for the purchase of 30,000 shares of our Class B common stock, none of shares were vested as of such date. |
For further information regarding the equity compensation of our non-employee directors, see the section of this prospectus captioned “Executive Compensation—Employee Benefit and Stock Plans.”
Post-IPO Director Compensation
The compensation committee retained Radford, a national compensation consultant, to provide recommendations on director compensation following this offering based on an analysis of market data compiled from certain public technology companies. Based on the recommendation of Radford, our board of directors approved certain compensation to our non-employee directors under our Outside Director Compensation Policy, which was adopted by our board of directors in 2016 and
-114-
Table of Contents
is expected to be approved by our stockholders prior to completion of this offering. The Outside Director Compensation Policy provides for the following cash compensation program for non-employee directors, effective upon the effective date of the registration statement of which this prospectus forms a part:
| • | $8,750 retainer per quarter for each non-employee director; |
| • | $6,250 retainer per quarter for the chairman of our board of directors; |
| • | $3,750 retainer per quarter for our lead director (if applicable); |
| • | $5,000 retainer per quarter for the chairman of the audit committee or $2,500 retainer per quarter for each other member of the audit committee; |
| • | $2,500 retainer per quarter for the chairman of the compensation committee or $1,250 retainer per quarter for each other member of the compensation committee; and |
| • | $1,750 retainer per quarter for the chairman of the nominating and governance committee or $875 retainer per quarter for each other member of the nominating and governance committee. |
In addition to the cash compensation structure described above, our Outside Director Compensation Policy provides for the following equity incentive compensation program for non-employee directors effective upon the effective date of the registration statement of which this prospectus forms a part. Each non-employee director who first joins us (other than a director who becomes a non-employee director as a result of terminating employment with us) automatically will be granted a one-time, initial restricted stock unit award with a value of $300,000. Further, on the date of each of our annual stockholder meetings, each non-employee director who is continuing as a director following our annual stockholders meeting automatically will be granted an annual restricted stock unit award with a value of $150,000 (provided that the director has provided services as a non-employee director for at least nine months prior to the award’s grant date). Unless otherwise determined by our board of directors or our compensation committee, the number of restricted stock units will be determined based on the fair market value of the shares of our common stock subject thereto. Each initial restricted stock unit award is scheduled to vest over a period of three years following the award’s date of grant, with one-third of the award scheduled to vest on the one-year anniversary of the date of grant and the remainder scheduled to vest quarterly thereafter in equal installments over the remaining two years, subject to continued service through each relevant vesting date. Each annual restricted stock unit award is scheduled to vest as to 100% of the underlying shares on the earlier of the one-year anniversary of the award’s grant date or the date of our next annual stockholder meeting, subject to continued service through such date. In the event of a change in control of our company, all equity awards granted to a non-employee director pursuant to our outside director compensation policy or otherwise under our 2016 equity incentive plan will fully vest and become immediately exercisable.
In any fiscal year, a non-employee director may be issued cash payments with a value of no more than $200,000, increased to $250,000 for any non-employee director serving as chairman of our board of directors, lead director, or chairman of the audit committee. Further, in any fiscal year, a non-employee director may be granted equity awards with an aggregate grant date fair value of no more than $450,000, increased to $600,000 in the fiscal year of his or her initial service as a non-employee director. Equity awards or other compensation granted to a non-employee director while he or she was an employee or consultant (other than a non-employee director) will not count toward these limits.
For further information regarding the equity compensation of our non-employee directors, see the section of this prospectus captioned “Executive Compensation—Employee Benefit and Stock Plans—2016 Equity Incentive Plan.”
-115-
Table of Contents
Summary Compensation Table
The following table provides information regarding the compensation of our named executive officers during 2015 and 2014.
| Name and Principal Position |
Year | Salary ($) |
Bonus ($) |
Stock Awards ($) |
Option Awards ($)(1) |
Non-Equity Incentive Plan Compensation ($)(2) |
All Other Compensation ($)(3) |
Total ($) |
||||||||||||||||||||||||
| Sunny Gupta |
2015 | 300,000 | — | — | 2,289,557 | 143,588 | 2,550 | 2,735,695 | ||||||||||||||||||||||||
| President and Chief Executive Officer |
2014 | 300,000 | — | — | 1,042,425 | 127,350 | 2,497 | 1,472,272 | ||||||||||||||||||||||||
| Kurt Shintaffer |
2015 | 226,500 | 17,500(4) | — | 1,137,388 | 97,250 | 2,371 | 1,481,009 | ||||||||||||||||||||||||
| Chief Financial Officer |
||||||||||||||||||||||||||||||||
| John Morrow |
2015 | 235,417 | — | — | 654,109 | 67,500 | 2,498 | 959,524 | ||||||||||||||||||||||||
| Executive Vice President, Corporate Development, General Counsel and Secretary |
2014 | (5) | 56,068 | — | — | 633,168 | 13,125 | 601 | 702,962 | |||||||||||||||||||||||
| (1) | The dollar amounts in this column represent the aggregate grant date fair value of stock option awards granted in 2015. These amounts have been computed in accordance with FASB ASC Topic 718, using the Black-Scholes option pricing model. Pursuant to SEC rules, the amounts shown exclude the impact of estimated forfeitures related to service-based vesting conditions. For a discussion of valuation assumptions, see the notes to our financial statements included elsewhere in this prospectus. |
| (2) | The amounts reported in the Non-Equity Incentive Plan Compensation column for 2015 represent the amounts earned and payable under the 2015 Executive Bonus Plan, all of which were paid in 2016. The amounts reported for 2014 represent the amounts earned and payable under the 2014 Executive Bonus Plan, all of which were paid in 2015. |
| (3) | These amounts represent the value of company paid parking and group life insurance premiums and imputed income. |
| (4) | This amount represents a special bonus for Mr. Shintaffer of $5,000 per month for his three-and-a-half months of service as interim Chief Financial Officer. |
| (5) | Mr. Morrow joined us in September 2014. |
Non-Equity Incentive Plan Compensation
2015 Bonus Payments
Each of our named executive officers during 2015 participated in our 2015 Executive Bonus Plan pursuant to which the participant was eligible to receive cash incentive-based compensation for 2015 based on achievement of specified performance goals. Mr. Gupta’s bonus was subject to achievement of corporate performance goals relating to new subscription performance, year-over-year retention rate of customer revenue and operating cash flow burn. Messrs. Shintaffer’s and Morrow’s bonuses were contingent on the achievement of corporate performance goals relating to new subscription performance and year-over-year retention rate of customer revenue, as well as various individual performance objectives. Following the end of 2015, in reviewing the level of achievement of the individual and corporate performance goals for the year, our compensation committee and, in the case of Mr. Gupta, our board of directors, took into account various relevant factors and approved payment of the bonuses set forth in the Summary Compensation Table above.
2014 Bonus Payments
Each of our named executive officers during 2014 participated in our 2014 Executive Bonus Plan pursuant to which the participant was eligible to receive cash incentive-based compensation for fiscal year 2014 based on achievement of specified performance goals. Mr. Gupta’s bonus was subject to achievement of corporate performance goals relating to new subscription bookings, year-over-year
-116-
Table of Contents
retention rate of customer revenue and operating cash flow burn. Mr. Morrow’s bonus was subject to achievement of various individual performance goals. Mr. Morrow joined us in September 2014. As a result, his 2014 bonus was prorated based on the number of months he was employed with us during the year. Following the end of 2014, in reviewing the level of achievement of the individual and corporate performance goals for the year, our compensation committee and, in the case of Mr. Gupta, our board of directors, took into account various relevant factors and approved payment of the bonuses set forth in the Summary Compensation Table above.
Employment Arrangements
Each of our named executive officers has executed our standard form of confidential information, invention assignment and arbitration agreement.
Sunny Gupta
For 2015, Mr. Gupta’s annual base salary was $300,000 and his target bonus opportunity was $150,000. Upon the closing of this offering, Mr. Gupta’s salary will increase to $330,000 effective as of the date of such closing, and his bonus target for 2016 will increase to $240,000 for the full 2016 year. We also have granted Mr. Gupta certain equity awards. The terms of his awards outstanding as of the end of 2015 are described further below. Mr. Gupta is eligible to participate in the employee benefit plans generally available to our employees and maintained by us.
Kurt Shintaffer
For 2015, Mr. Shintaffer’s salary was (1) $200,000 at the beginning of 2015, (2) increased to $206,000 effective as of April 1, 2015, and (3) increased to $250,000 effective as of July 1, 2015. For 2015, Mr. Shintaffer’s target bonus opportunity was $100,000. Upon the closing of this offering, Mr. Shintaffer’s salary will increase to $275,000 effective as of the date of such closing, and his bonus target for 2016 will increase to $125,000 effective for the full 2016 year. We also have granted Mr. Shintaffer certain equity awards. The terms of his awards outstanding as of the end of 2015 are described further below. Mr. Shintaffer is eligible to participate in the employee benefit plans generally available to our employees and maintained by us.
John Morrow
We entered into a written offer letter with Mr. Morrow dated September 6, 2014, in connection with his hire as our Senior Vice President, General Counsel and Secretary. Mr. Morrow’s offer letter provides for an annual base salary of $210,000 and a target bonus opportunity equal to 25% of his salary. For 2015, Mr. Morrow’s salary was (1) $210,000 at the beginning of 2015, (2) increased to $225,000 effective as of April 1, 2015, (3) increased to $235,000 effective as of May 1, 2015, and (4) increased to $250,000 effective as of July 1, 2015. For 2015, Mr. Morrow’s target bonus opportunity was $67,500. Upon the closing of this offering, Mr. Morrow’s salary will remain $250,000, and his bonus target for 2016 will increase to $87,500 effective for the full 2016 year. We also have granted Mr. Morrow certain equity awards. The terms of his awards outstanding as of the end of 2015 are described further below. Mr. Morrow is eligible to participate in the employee benefit plans generally available to our employees and maintained by us.
-117-
Table of Contents
Outstanding Equity Awards as of December 31, 2015
The following table presents information concerning equity awards held by our named executive officers as of December 31, 2015.
| Option Awards(1) | ||||||||||||||||||||
| Vesting Commencement Date |
Number of Securities Underlying Unexercised Options (#) |
Option Exercise Price ($) |
Option Expiration Date |
|||||||||||||||||
| Exercisable | Unexercisable | |||||||||||||||||||
| Sunny Gupta |
|
10/11/11 4/1/14 5/1/16 |
(5) |
|
450,000 182,000 — |
(2)(3) (2)(4)
|
|
— — 400,000 |
(5) |
|
2.39 11.46 14.31 |
|
|
12/20/2021 6/18/2024 11/6/2025 |
| |||||
| Kurt Shintaffer |
|
4/1/14 4/1/15 5/1/15 5/1/16 |
(5) |
|
10,416 — — — |
(4)
|
|
14,584 20,000 15,000 160,000 |
(4) (4) (4) (5) |
|
11.46 13.55 13.99 14.31 |
|
|
6/18/2024 2/20/2025 5/7/2025 11/6/2025 |
| |||||
| John Morrow |
|
9/22/14 4/1/15 5/1/15 5/1/16 |
(5) |
|
31,250 — — — |
(4)
|
|
68,750 25,000 15,000 70,000 |
(4) (4) (4) (5) |
|
12.64 13.55 13.99 14.31 |
|
|
9/30/2024 2/20/2025 5/7/2025 11/6/2025 |
| |||||
| (1) | All options listed are options to purchase shares of our Class B common stock and were granted from our 2011 Plan. |
| (2) | The options listed are subject to an early exercise right and may be exercised in full prior to vesting of the shares underlying the option. Any shares issued upon early exercise of the options, are subject to our right of repurchase to the extent they remain unvested if the named executive officer ceases to provide continued services with us. Vesting of all options is subject to continued service through the applicable vesting date. |
| (3) | Twenty-five percent of the shares subject to the option are scheduled to vest on the one year anniversary of the vesting commencement date and 1/48 of the shares subject to the option are scheduled to vest each month thereafter on the same day of the month as the vesting commencement date, subject to the named executive officer’s continued service through each such date. Notwithstanding the foregoing, in the event of a change in control, 25% of the shares subject to the option shall vest, and if the named executive officer’s employment is terminated other than for cause any time following such change in control or such named executive officer resigns for good reason anytime following such change in control, an additional 25% of shares subject to the option shall vest. |
| (4) | Twenty-five percent of the shares subject to the option are scheduled to vest on the one year anniversary of the vesting commencement date and 1/48 of the shares subject to the option are scheduled to vest each month thereafter on the same day of the month as the vesting commencement date, subject to the named executive officer’s continued service through each such date. Notwithstanding the foregoing, in the event of a change in control, 25% of the shares subject to the option shall vest, and if the named executive officer’s employment is terminated other than for cause anytime following such change in control or such named executive officer resigns for good reason upon or within 365 days following such change in control, an additional 25% of shares subject to the option shall vest. |
| (5) | The vesting commencement date for 1/2 of the shares subject to the option, or the First Vesting Commencement Date, is May 1, 2016. The vesting commencement date for the remaining 1/2 of the shares subject to the option, or the Second Vesting Commencement Date, is the day immediately following the closing date of this offering, if the offering prices before December 31, 2016. If the offering has not priced prior to December 31, 2016, and a change in control has not occurred prior to such date, the portion of the option subject to the Second Vesting Commencement date shall terminate. 1/8 of the shares subject to the option are scheduled to vest on the first anniversary of the First Vesting Commencement Date, and 1/96 of the shares subject to the option are scheduled to vest each month thereafter on the same day of the month as the First Vesting Commencement Date for the next 36 months, subject to the named executive officer’s continued service through each such date. Similarly, 1/8 of the shares subject to the option are scheduled to vest on the first anniversary of the Second Vesting Commencement Date, and 1/96 of the shares subject to the option are scheduled to vest each month thereafter on the same day of the month as the Second Vesting Commencement Date for the next 36 months, subject to the named executive officer’s continued service through each such date. Notwithstanding the foregoing, if the named executive officer’s employment is terminated other than for cause anytime following a change in control or such named executive officer resigns for good reason upon or within 365 days following such change in control, 100% of the shares subject to the option shall vest, except with respect to any previously terminated portion. |
-118-
Table of Contents
Employee Benefit and Stock Plans
2016 Equity Incentive Plan
Our board of directors adopted, and our stockholders approved, our 2016 Equity Incentive Plan, or our 2016 Plan, in September 2016. Our 2016 Plan will be effective on the business day immediately prior to the date of effectiveness of the registration statement of which this prospectus forms a part. Our 2016 Plan provides for the grant of incentive stock options, within the meaning of Section 422 of the Internal Revenue Code, to our employees and any of our parent and subsidiaries’ employees, and for the grant of nonstatutory stock options, restricted stock, restricted stock units, stock appreciation rights, performance units and performance shares to our employees, directors and consultants, and our parent and subsidiaries’ employees and consultants.
Authorized Shares
Currently, no awards are issued and outstanding under our 2016 Plan. The total number of shares of Class A common stock reserved for issuance under our 2016 Plan is equal to (1) 3,800,000 shares plus (2) a number of shares of Class A common stock equal to the number of shares of Class B common stock subject to awards granted under our 2007 Stock Plan and 2011 Executive Equity Incentive Plan, or our Existing Plans, that, on or after the date of effectiveness of the registration statement of which this prospectus forms a part, expire or otherwise terminate without having been exercised in full and a number of shares of Class A common stock equal to the number of shares of Class B common stock issued pursuant to awards granted under our Existing Plans that are forfeited to or repurchased by us, provided that the maximum number of shares of Class A common stock that may be added to our 2016 Plan pursuant to (2) is 11,663,388 shares. The shares of Class A common stock may be authorized, but unissued, reacquired shares of Class A common stock. The number of shares of Class A common stock available for issuance under our 2016 Plan also will include an annual increase on the first day of each fiscal year beginning with the 2017 fiscal year, equal to the least of:
| • | 5,500,000 shares of Class A common stock; |
| • | 5% of the outstanding shares of all classes of our common stock as of the last day of our immediately preceding fiscal year; and |
| • | such other amount as our board of directors may determine on or before the last day of our immediately preceding fiscal year. |
Shares issued pursuant to awards under our 2016 Plan that we repurchase or that are forfeited due to the failure to vest, shares subject to awards under our 2016 Plan that expire or become unexercisable without having been exercised in full or are surrendered under an exchange program, and shares used to pay the exercise price of an award or to satisfy the tax withholding obligations related to an award, will become available for future grant under our 2016 Plan. In addition, to the extent that an award is paid out in cash rather than shares, such cash payment will not reduce the number of shares available for issuance under our 2016 Plan.
-119-
Table of Contents
Administration
Our compensation committee will administer our 2016 Plan. In the case of options intended to qualify as “performance-based compensation” within the meaning of Section 162(m) of the Internal Revenue Code, the committee will consist of two or more “outside directors” within the meaning of Section 162(m).
Subject to the provisions of our 2016 Plan, the administrator has the power to determine the terms of the awards, including the recipients, the exercise price, the number of shares subject to each such award, the exercisability of the awards, and the form of consideration, if any, payable upon exercise. The administrator also has the authority to amend awards, and may implement an exchange program under which (1) outstanding awards are surrendered or cancelled in exchange for awards of the same type (which may have higher or lower exercise prices and different terms), awards of a different type, and/or cash, (2) award holders have an opportunity to transfer outstanding awards to a financial institution or other person or entity selected by the administrator, or (3) the exercise price of an outstanding award is increased or reduced. The administrator further may prescribe rules and construe and interpret our 2016 Plan and awards granted under our 2016 Plan. The administrator’s decisions are final and binding on all award recipients and any other holders of awards.
Stock Options
Stock options may be granted under our 2016 Plan. The per share exercise price of options granted under our 2016 Plan must be equal to at least the fair market value of a share of Class A common stock on the date of grant. The term of an incentive stock option may not exceed 10 years, except that with respect to any participant who owns more than 10% of the voting power of all classes of our outstanding stock, the term must not exceed five years and the exercise price must equal at least 110% of the fair market value on the grant date. Subject to the provisions of our 2016 Plan, the administrator determines the terms of all options, including the acceptable form of consideration for exercising an option.
After the termination of service of an employee, director, or consultant, he or she may exercise his or her option for the period of time stated in his or her award agreement. In the absence of a specified time in an award agreement, an option generally will remain exercisable for three months following an individual’s termination (or 12 months, if the termination of service is due to death or disability. However, in no event may an option be exercised later than the expiration of its term.
Stock Appreciation Rights
Stock appreciation rights may be granted under our 2016 Plan. Stock appreciation rights allow the recipient to receive the appreciation in the fair market value of Class A common stock between the exercise date and the date of grant. Subject to the provisions of our 2016 Plan, the administrator determines the terms of stock appreciation rights, including when such rights become exercisable and whether to pay any increased appreciation in cash, shares of Class A common stock, or a combination of both. The per share exercise price for the shares to be issued pursuant to the exercise of a stock appreciation right will be no less than 100% of the fair market value per share on the date of grant. The term of a stock appreciation right may not exceed 10 years. The administrator will determine the period of time after a participant’s termination of service during which the participant may exercise his or her stock appreciation right. In the absence of a specified time in an award agreement, a stock appreciation right generally will remain exercisable for three months following an individual’s termination (or 12 months, if the termination of service is due to death or disability). However, in no event may a stock appreciation right be exercised later than the expiration of its term.
-120-
Table of Contents
Restricted Stock
Restricted stock may be granted under our 2016 Plan. Restricted stock awards are grants of shares of Class A common stock that vest in accordance with terms and conditions established by the administrator. The administrator will determine the number of shares of restricted stock granted and may impose whatever conditions to vesting it determines to be appropriate. The administrator, in its sole discretion, may accelerate the time at which any restrictions will lapse or be removed. Recipients of restricted stock generally will have voting and dividend rights with respect to such shares upon grant without regard to vesting, unless the administrator provides otherwise. Shares of restricted stock that have not vested are subject to our right of repurchase or forfeiture.
Restricted Stock Units
Restricted stock units may be granted under our 2016 Plan. Restricted stock units are bookkeeping entries representing an amount equal to the fair market value of one share of Class A common stock. The administrator determines the terms and conditions of restricted stock units, including the number of units granted, the vesting criteria (which may include accomplishing specified performance criteria or continued service to us) and the form and timing of payment. The administrator, in its sole discretion may accelerate the time at which any restrictions will lapse or be removed. The administrator determines in its sole discretion whether an award will be settled in cash, shares of Class A common stock, or a combination of both.
Performance Units and Performance Shares
Performance units and performance shares may be granted under our 2016 Plan. Performance units and performance shares are awards that will result in a payment to a participant only if performance goals established by the administrator are achieved or the awards otherwise vest. Performance units have an initial dollar value established by the administrator on or before the date of grant. Performance shares will have an initial value equal to the fair market value of a share on the date of grant. The administrator may set performance objectives based on company-wide, divisional, business unit or individual performance goals or any other basis the administrator determines in its discretion, which, depending on the extent to which they are met, will determine the number and/or the value of performance units and performance shares to be paid out to participants. After the grant of a performance unit or performance share, the administrator, in its sole discretion, may reduce or waive any performance objectives or other vesting provisions for such performance units or performance shares. The administrator, in its sole discretion, may pay earned performance units or performance shares in the form of cash, shares of Class A common stock, or a combination of both.
Non-Employee Directors
Our 2016 Plan provides that all non-employee directors will be eligible to receive all types of awards (except for incentive stock options) under our 2016 Plan subject to annual per person limits in our Outside Director Compensation Policy. Please see the description of our non-employee director compensation in the section of this prospectus captioned “Management—Director Compensation.”
Non-Transferability of Awards
Unless the administrator provides otherwise, our 2016 Plan generally does not allow for the transfer of awards other than by will or the laws of descent or distribution, and only the recipient of an award may exercise an award during his or her lifetime.
-121-
Table of Contents
Certain Adjustments
In the event of certain changes in our capitalization, in order to prevent diminution or enlargement of the benefits or potential benefits to be made available under the 2016 Plan, the administrator will adjust the number and class of shares that may be delivered under our 2016 Plan and/or the number, class, and price of shares covered by each outstanding award. In the event of our proposed liquidation or dissolution, the administrator will notify participants as soon as practicable prior to the proposed transaction, and all awards will terminate immediately prior to the closing of the proposed transaction.
Change in Control
Our 2016 Plan provides that in the event of a change in control, as defined in our 2016 Plan, each outstanding award will be treated as the administrator determines, including that the successor corporation or its parent or subsidiary will assume or substitute an equivalent award for each outstanding award. The administrator is not required to treat all awards similarly in the transaction. If there is no assumption or substitution of outstanding awards, the awards will fully vest, all restrictions will lapse, all performance goals or other vesting criteria will be deemed achieved at 100% of target levels, and the options and stock appreciation rights will become fully exercisable for a specified period prior to the transaction after the administrator notifies the participants. The options and stock appreciation rights will terminate upon the expiration of the specified period of time. With respect to awards granted to non-employee directors, in the event of a change in control, the participant will fully vest in options and stock appreciation rights, all restrictions on his or her restricted stock and restricted stock units will lapse, and all performance goals or other vesting requirements for his or her performance shares and units will be deemed achieved at 100% of target levels, and all other terms and conditions met.
Clawback
Awards will be subject to any clawback policy of ours, and the administrator also may specify in an award agreement that the participant’s rights, payments, and/or benefits with respect to an award will be subject to reduction, cancellation, forfeiture, and/or recoupment upon the occurrence of certain specified events. Our board of directors may require a participant to forfeit, return, or reimburse us all or a portion of the award and/or shares issued under the award, any amounts paid under the award, and any payments or proceeds paid or provided upon disposition of the shares issued under the award in order to comply with such clawback policy or applicable laws.
Plan Amendment and Termination
The administrator has the authority to amend, suspend, or terminate our 2016 Plan provided such action does not materially impair the existing rights of any participant unless mutually agreed in writing between the participant and the administrator. Our 2016 Plan will terminate automatically in 2026, unless we terminate it sooner.
2016 Employee Stock Purchase Plan
Our board of directors adopted, and our stockholders approved, our 2016 Employee Stock Purchase Plan, or our ESPP, in September 2016. Our ESPP includes a component that is intended to qualify as an “employee stock purchase plan” under Section 423 of the Internal Revenue Code of 1986, as amended, referred to as the 423 Component, and a component that does not comply with Section 423, referred to as the Non-423 Component. For purposes of this disclosure, a reference to the
-122-
Table of Contents
“ESPP” will mean the 423 Component. Unless determined otherwise by the administrator, only our non-U.S. subsidiaries designated by the administrator as eligible to participate in the ESPP will participate in a separate offering.
Authorized Shares
A total of 750,000 shares of Class A common stock are available for issuance under our ESPP. In addition, our ESPP provides for annual increases in the number of shares available for issuance under our ESPP on the first day of each fiscal year beginning in 2017, equal to the least of:
| • | 1,600,000 shares of Class A common stock; |
| • | 1% of the outstanding shares of all classes of our common stock on the last day of the immediately preceding fiscal year; and |
| • | such other amount as our board of directors may determine on or before the last day of the immediately preceding year. |
Administration
Our compensation committee will administer our ESPP. The administrator will have authority to administer the plan, including but not limited to, full and exclusive authority to interpret the terms of our ESPP, designate separate offerings under the plan, designate subsidiaries and affiliates as participating in the 423 Component or the Non-423 Component, determine eligibility, adjudicate all disputed claims filed under our ESPP, and establish such procedures that it deems necessary for the administration of our ESPP (including, without limitation, adopt such procedures and sub-plans as are necessary or appropriate to permit the participation in our ESPP by employees who are foreign nationals or employed outside the U.S., the terms of which sub-plans may take precedence over other provisions of our ESPP except with respect to our ESPP’s share reserve limits).
Eligibility
Generally, any of our employees are eligible to participate if they are employed by us, or any participating subsidiary, for at least 20 hours per week and more than five months in any calendar year. However, an employee may not be granted an option to purchase stock under our ESPP if such employee:
| • | immediately after the grant would own stock and/or hold outstanding options to purchase such stock possessing 5% or more of the total combined voting power or value of all classes of our capital stock; or |
| • | holds rights to purchase stock under all of our employee stock purchase plans that accrue at a rate that exceeds $25,000 worth of stock for each calendar year. |
Our ESPP is intended to qualify under Section 423 of the Code, and provides for six-month offering periods. The offering periods are scheduled to start on the first trading day on or after May 31 and November 30 of each year, except for the first offering period, which will commence on the first trading day on or after the effective date of the registration statement of which this prospectus forms a part and will end on the first trading day on or after May 31, 2017. The administrator may change the duration of future offering periods if the change is announced prior to the beginning of the first affected offering period.
-123-
Table of Contents
Contributions
Our ESPP permits participants to purchase shares of Class A common stock through payroll deductions of up to 15% of their eligible compensation, which includes a participant’s base straight time gross earnings and payments for overtime and shift premium but does not include payments for incentive compensation, bonuses, equity compensation income and other similar compensation. A participant may purchase a maximum of 5,000 shares during each offering period. The administrator may allow all employees participating in a separate offering to contribute amounts to our ESPP via cash, check or other means set forth in the participants’ subscription agreement prior to an exercise date in an offering period.
Exercise of Purchase Right
Amounts deducted and accumulated by the participant are used to purchase shares of Class A common stock at the end of each six-month offering period. The purchase price of the shares will be 85% of the lower of the fair market value of Class A common stock on the first trading day of each offering period or on the exercise date. Participants may end their participation at any time during an offering period and will be paid their accrued contributions that have not yet been used to purchase shares of Class A common stock. Participation ends automatically upon termination of employment with us.
Non-Transferability
A participant may not transfer rights granted under our ESPP other than by will, the laws of descent and distribution, or as otherwise provided under our ESPP.
Certain Adjustments
In the event of certain changes in our capitalization, to prevent dilution or enlargement of the benefits or potential benefits intended to be made available under our ESPP, the administrator will make adjustments to the number and class of shares that may be delivered under our ESPP and/or the purchase price per share and number of shares covered by each option under our ESPP that has not yet been exercised, and the numerical share limits under our ESPP. In the event of our proposed dissolution or liquidation, any offering period then in progress will be shortened by setting a new exercise date and all awards will terminate immediately prior to the completion of the transaction, unless the administrator determines otherwise. Prior to the new exercise date, the administrator will provide notice to participants that the exercise date has been changed to the new exercise date and that the participant’s option will be exercised automatically unless the participant already has withdrawn from the offering period.
Merger or Change in Control
In the event of our merger or change in control, as defined under our ESPP, a successor corporation may assume or substitute for each outstanding option. If the successor corporation refuses to assume or substitute for the option, the offering period then in progress will be shortened, and a new exercise date will be set to occur prior to the date of the proposed merger or change in control. The administrator will notify each participant that the exercise date has been changed and that the participant’s option will be exercised automatically on the new exercise date unless prior to such date the participant has withdrawn from the offering period.
Plan Amendment and Termination
Our ESPP will terminate automatically in 2036, unless we terminate it sooner. Our board of directors has the authority to amend, suspend or terminate our ESPP.
-124-
Table of Contents
2011 Executive Equity Incentive Plan
Our board of directors adopted, and our stockholders approved, our 2011 Executive Equity Incentive Plan, or our 2011 Plan, in November and December 2011, respectively. The 2011 Plan most recently was amended in August 2016. On the business day immediately prior to the date of effectiveness of the registration statement of which this prospectus forms a part, the 2011 Plan will be terminated, and we will not grant any additional awards under the 2011 Plan. However, the 2011 Plan will continue to govern the terms and conditions of outstanding awards granted under it.
Authorized Shares
As of June 30, 2016, an aggregate of 4,385,000 shares of Class B common stock have been authorized for issuance under the 2011 Plan. As of June 30, 2016, options to purchase 3,512,129 shares of Class B common stock at a weighted average exercise price of $9.92 were outstanding under the 2011 Plan. Shares may be authorized but unissued, or reacquired Class B common stock. Shares issued pursuant to awards under our 2011 Plan that expire or become unexercisable without having been exercised in full, are surrendered under an exchange program, or with respect to restricted stock are repurchased at the original purchase price while unvested will become available for future grant under the 2011 Plan while the 2011 Plan remains in effect.
Administration
Our 2011 Plan is administered by our board of directors or a committee appointed by it. Subject to the provisions of our 2011 Plan, the administrator has the power to construe and interpret our 2011 Plan and any awards granted under it, determine the terms of awards, including the recipients, the number of shares subject to each award, the exercise price, the fair market value of a share of Class B common stock, the vesting schedule of awards, together with any vesting acceleration, and the award agreements for use under the 2011 Plan. The administrator of the 2011 Plan may amend awards as well as implement a program under which (1) outstanding awards are surrendered or cancelled in exchange for awards of the same type (which may have lower or higher exercise prices and different terms), awards of a different type, and/or cash, (2) award holders have an opportunity to transfer outstanding awards to a financial institution or other person or entity selected by the administrator, or (3) the exercise price of an outstanding award is increased or reduced. The administrator may establish rules and regulations, including sub-plans for satisfying applicable laws in jurisdictions outside of the U.S.
Stock Options
Stock options may be granted under our 2011 Plan to members of our board of directors and any of our employees or employees of our affiliates who provide services in the role of president, vice president in charge of a principal business unit, division or function, any other officer who performs a policy making function, or any other person who performs similar policy making functions (collectively referred to as the eligible key service providers), provided that incentive stock options may be granted only to our employees and the employees of our parent or subsidiaries. The exercise price per share of all options must equal at least 100% of the fair market value per share of our Class B common stock on the date of grant. The term of an option granted under the 2011 Plan may not exceed ten years. An incentive stock option to be granted to a participant who owns more than 10% of the total combined voting power of all classes of our stock or the stock of any parent or subsidiary corporations on the date of grant, may not have a term in excess of five years and must have an exercise price of at least 110% of the fair market value per share of our Class B common stock on the date of grant.
-125-
Table of Contents
The administrator determines the methods of payment of the exercise price of an option as well as the period of time after a participant’s termination of service during which the participant may exercise his or her option. In the absence of a period specified in an award agreement, such period generally is three months (or 12 months in the event of the participant’s termination of service as a result of death or disability). However, in no event may an option be exercised later than the expiration of its term.
Restricted Stock
Restricted stock awards may be granted under our 2011 Plan to eligible key service providers. Restricted stock awards are grants of shares of Class B common stock that are subject to various restrictions, including restrictions on transferability and forfeiture provisions. Shares of restricted stock vest, and the restrictions on such shares lapse, in accordance with terms and conditions established by the administrator. Unless determined otherwise by the administrator, shares that have not vested under the restricted stock award can be repurchased from the participant upon exercise of the repurchase option within 90 days following his or her termination of service for any reason, at a purchase price equal to the original purchase price paid by the participant. Once shares of restricted stock are issued, the participant generally has the rights equivalent to those of a stockholder.
Non-transferability of Awards
Our 2011 Plan generally does not allow for the transfer of awards except by will or the laws of descent and distribution, and only the recipient of the award may exercise such award during his or her lifetime.
Certain Adjustments
In the event of certain changes in our capitalization or other changes in our corporate structure affecting shares of Class B common stock, in order to prevent diminution or enlargement of the benefits or potential benefits intended to be made available under the 2011 Plan, the administrator will adjust the number and class of shares that may be delivered under the 2011 Plan and/or the number, class, and price of shares of Class B common stock covered by each outstanding award. In the event of our proposed dissolution or liquidation, the administrator will notify participants as soon as practicable prior to the effective date of such proposed transaction and all awards will terminate immediately prior to the completion of such proposed transaction.
Merger or Change in Control
Our 2011 Plan provides that in the event of our merger or change in control (as defined in our 2011 Plan), each outstanding award will be treated as the administrator determines, including, without limitation, that each award be assumed or an equivalent award substituted by the successor corporation or a parent or subsidiary of the successor corporation. The administrator is not required to treat all awards similarly in the transaction.
Awards that are not assumed or substituted will become fully vested and exercisable, and any other restrictions subject thereto will lapse. The administrator will notify participants that their awards that are not assumed or substituted for will be fully vested and exercisable for a period of time determined by the administrator in its sole discretion, and such awards will terminate upon the expiration of such period for no consideration, unless otherwise determined by the administrator.
-126-
Table of Contents
Amendment; Termination
Our board of directors has the authority to amend, alter, suspend or terminate the 2011 Plan at any time, provided that such action does not impair the rights of any participant, unless mutually agreed otherwise between the participant and the administrator. Upon closing of this offering, our 2011 Plan will be terminated and no further awards will be granted under it. All outstanding awards will continue to be governed by their existing terms.
2007 Stock Plan
Our board of directors adopted, and our stockholders approved, our 2007 Stock Plan, or our 2007 Plan, in October 2007. The 2007 Plan most recently was amended in August 2016. Upon the effectiveness of the registration statement of which this prospectus forms a part, the 2007 Plan will be terminated, and we will not grant any additional awards under the 2007 Plan. However, the 2007 Plan will continue to govern the terms and conditions of outstanding awards granted under it.
Authorized Shares
As of June 30, 2016, an aggregate of 11,386,719 shares of Class B common stock have been authorized for issuance under the 2007 Plan. As of June 30, 2016, options to purchase 7,878,758 shares of Class B common stock at a weighted average exercise price of $8.99 were outstanding under the 2007 Plan. Shares may be authorized but unissued, or reacquired common stock. Shares issued pursuant to awards under our 2007 Plan that expire or become unexercisable without having been exercised in full, are surrendered under an exchange program, or with respect to restricted stock are repurchased at the original purchase price while unvested will become available for future grant under the 2007 Plan while the 2007 Plan remains in effect.
Administration
Our 2007 Plan is administered by our board of directors or a committee appointed by it. Subject to the provisions of our 2007 Plan, the administrator has the power to construe and interpret our 2007 Plan and any awards granted under it, determine the terms of awards, including the recipients, the number of shares subject to each award, the exercise price, the fair market value of a share of Class B common stock, the vesting schedule of awards, together with any vesting acceleration, and the award agreements for use under the 2007 Plan. The administrator of the 2007 Plan may amend awards as well as implement a program under which (1) outstanding awards are surrendered or cancelled in exchange for awards of the same type (which may have lower or higher exercise prices and different terms), awards of a different type, and/or cash, (2) award holders have an opportunity to transfer outstanding awards to a financial institution or other person or entity selected by the administrator, or (3) the exercise price of an outstanding award is increased or reduced. The administrator may establish rules and regulations, including sub-plans for satisfying applicable laws in jurisdictions outside of the U.S.
Stock Options
Stock options may be granted under our 2007 Plan to members of our board of directors, our employees and consultants, and employees and consultants of our parent or subsidiaries, provided that incentive stock options may be granted only to our employees and the employees of our parent or subsidiaries. The exercise price per share of all options must equal at least 100% of the fair market value per share of our Class B common stock on the date of grant. The term of an option granted under the 2007 Plan may not exceed ten years. An incentive stock option to be granted to a participant who owns more than 10% of the total combined voting power of all classes of our stock or the stock of
-127-
Table of Contents
any parent or subsidiary corporations on the date of grant, may not have a term in excess of five years and must have an exercise price of at least 110% of the fair market value per share of our Class B common stock on the date of grant.
The administrator determines the methods of payment of the exercise price of an option as well as the period of time after a participant’s termination of service during which the participant may exercise his or her option. In the absence of a period specified in an award agreement, such period generally is three months (or 12 months in the event of the participant’s termination of service as a result of death or disability). However, in no event may an option be exercised later than the expiration of its term.
Restricted Stock
Restricted stock awards may be granted under our 2007 Plan to members of our board of directors, our employees and consultants, and employees and consultants of our parent or subsidiaries. Restricted stock awards are grants of shares of Class B common stock that are subject to various restrictions, including restrictions on transferability and forfeiture provisions. Shares of restricted stock vest, and the restrictions on such shares lapse, in accordance with terms and conditions established by the administrator. Unless determined otherwise by the administrator, shares that have not vested under the restricted stock award can be repurchased from the participant upon exercise of the repurchase option within 90 days following his or her termination of service for any reason, at a purchase price equal to the original purchase price paid by the participant. Once shares of restricted stock are issued, the participant generally has the rights equivalent to those of a stockholder.
Non-transferability of Awards
Our 2007 Plan generally does not allow for the transfer of awards except by will or the laws of descent and distribution, and only the recipient of the award may exercise such award during his or her lifetime.
Certain Adjustments
In the event of certain changes in our capitalization or other changes in our corporate structure affecting shares of Class B common stock, in order to prevent diminution or enlargement of the benefits or potential benefits intended to be made available under the 2007 Plan, the administrator will adjust the number and class of shares that may be delivered under the 2007 Plan and/or the number, class, and price of shares of Class B common stock covered by each outstanding award. In the event of our proposed dissolution or liquidation, the administrator will notify participants as soon as practicable prior to the effective date of such proposed transaction and all awards will terminate immediately prior to the completion of such proposed transaction.
Merger or Change in Control
Our 2007 Plan provides that in the event of our merger or change in control (as defined in our 2007 Plan), each outstanding award will be treated as the administrator determines, including, without limitation, that each award be assumed or an equivalent award substituted by the successor corporation or a parent or subsidiary of the successor corporation. The administrator is not required to treat all awards similarly in the transaction.
Awards that are not assumed or substituted will become fully vested and exercisable, and any other restrictions subject thereto will lapse. The administrator will notify participants that their awards
-128-
Table of Contents
that are not assumed or substituted for will be fully vested and exercisable for a period of time determined by the administrator in its sole discretion, and such awards will terminate upon the expiration of such period for no consideration, unless otherwise determined by the administrator.
Amendment; Termination
Our board of directors has the authority to amend, alter, suspend or terminate the 2007 Plan at any time, provided that such action does not impair the rights of any participant, unless mutually agreed otherwise between the participant and the administrator. Upon the closing of this offering, our 2007 Plan will be terminated and no further awards will be granted under it. All outstanding awards will continue to be governed by their existing terms.
Executive Change in Control Severance Plan
Our board of directors adopted an Executive Change in Control Severance Plan, or our Change in Control Plan, in September 2016. We intend to enter into a participation agreement with each of our named executive officers (as well as certain other executives) prior to the closing of this offering pursuant to which the individual will become a participant in the Change in Control Plan. Under the Change in Control Plan, for the period from the date of a change in control (as defined in the Change in Control Plan) until 12 months following the change in control, if the participant in the Change in Control Plan is terminated for any reason other than cause (as defined in the Change in Control Plan), death or disability or the participant voluntarily resigns for good reason (as defined in the Change in Control Plan), the participant will receive the following severance benefits, subject to signing and not revoking a release of claims in our favor: (1) a lump sum cash amount equal to 100% (or 150% in the case of Mr. Gupta) of the greater of (a) his or her annualized base salary as of immediately before his or her termination of employment or (b) his or her annualized base salary as of immediately before the change in control; provided, in each case, that if the termination is due to good reason based on a material reduction in base salary, then his or her annualized base salary amount as in effect immediately prior to such reduction, (2) a lump sum cash amount equal to 100% (or 150% in the case of Mr. Gupta) of the greater of (a) his or her annualized target bonus amount under the applicable bonus plan as of the fiscal year in which his or her termination of employment occurs or (b) his or her annualized target bonus amount under the applicable bonus plan as of the fiscal year in which the change in control occurs; provided, in each case, that if the termination is due to good reason based on a material reduction in target bonus, then such target bonus amount as in effect immediately prior to such reduction, (3) any earned but unpaid bonus for a previously completed year, or fiscal period, and (4) reimbursement of continued health coverage under COBRA for a period of 12 months (or 18 months in the case of Mr. Gupta) following termination.
Executive Incentive Compensation Plan
We maintain an Executive Incentive Compensation Plan, referred to as our Bonus Plan. Our Bonus Plan allows our compensation committee to provide cash incentive awards to selected employees, including our NEOs, determined by our compensation committee, based upon performance goals established by our compensation committee. Our compensation committee, in its sole discretion, establishes a target award for each participant under the Bonus Plan, which may be expressed as a percentage of the participant’s average annual base salary for the applicable performance period, a fixed dollar amount, or such other amount or based on such other formula as it determines to be appropriate.
Under the Bonus Plan, our compensation committee determines the performance goals applicable to awards, which goals may include, without limitation: attainment of research and
-129-
Table of Contents
development milestones, sales bookings, business divestitures and acquisitions, cash flow, cash position, earnings (which may include any calculation of earnings, including but not limited to earnings before interest and taxes, earnings before taxes, earnings before interest, taxes, depreciation and amortization and net earnings), earnings per share, net income, net profit, net sales, operating cash flow, operating expenses, operating income, operating margin, overhead or other expense reduction, product defect measures, product release timelines, productivity, profit, return on assets, return on capital, return on equity, return on investment, return on sales, revenue, revenue growth, sales results, sales growth, stock price, time to market, total stockholder return, working capital, and individual objectives such as MBOs, peer reviews or other subjective or objective criteria. Performance goals that include the Company’s financial results may be determined in accordance with U.S. generally accepted accounting principles, or GAAP, or such financial results may consist of non-GAAP financial measures and any actual results may be adjusted by our compensation committee for one-time items or unbudgeted or unexpected items and/or payments of actual awards under the Bonus Plan when determining whether the performance goals have been met. The goals may be on the basis of any factors our compensation committee determines relevant, and may be on an individual, divisional, business unit or company-wide basis. Any criteria used may be measured on such basis as our compensation committee determines. The performance goals may differ from participant to participant and from award to award. Our compensation committee also may determine that a target award or a portion thereof will not have a performance goal associated with it but instead will be granted (if at all) in the compensation committee’s sole discretion.
Our compensation committee may, in its sole discretion and at any time, increase, reduce or eliminate a participant’s actual award, and/or increase, reduce or eliminate the amount allocated to the bonus pool. The actual award may be below, at or above a participant’s target award, in our compensation committee’s discretion. Our compensation committee may determine the amount of any increase, reduction or elimination on the basis of such factors as it deems relevant, and it will not be required to establish any allocation or weighting with respect to the factors it considers.
Actual awards are paid in cash (or its equivalent) in a single lump sum only after they are earned and approved by our compensation committee. Unless otherwise determined by our compensation committee, to earn an actual award, a participant must be employed by the Company (or an affiliate of the Company, as applicable) through the date the bonus is paid. Payment of bonuses occurs as soon as administratively practicable after they are earned, but no later than the dates set forth in the Bonus Plan.
Our board of directors has the authority to amend or terminate the Bonus Plan provided such action does not alter or impair the existing rights of any participant with respect to any earned bonus. The Bonus Plan will remain in effect until terminated in accordance with the terms of the Bonus Plan.
401(k) Plan
We maintain a 401(k) retirement plan for all employees who satisfy certain eligibility requirements. Participants of our 401(k) plan are able to defer a portion of their eligible compensation, subject to applicable annual plan and Internal Revenue Code limits, on a pre-tax basis, or on a post-tax basis for those employees participating in the Roth 401(k) plan component. The statutorily prescribed limit for contributions was equal to $18,000 in 2015 and 2016 (and catch-up contributions for employees age 50 or over allow for up to an additional $6,000 in 2015 and 2016). Our 401(k) plan permits discretionary matching employer contributions. The 401(k) plan is intended to qualify under Internal Revenue Code Section 401(a) with the plan’s related trust intended to be tax exempt under Internal Revenue Code Section 501(a).
-130-
Table of Contents
CERTAIN RELATIONSHIPS AND RELATED PARTY TRANSACTIONS
The following is a summary of transactions since January 1, 2013 to which we have been a party in which the amount involved exceeded $120,000 and in which any of our executive officers, directors, promoters or beneficial holders of more than 5% of our capital stock had or will have a direct or indirect material interest, other than compensation arrangements which are described under the sections of this prospectus captioned “Management— Non-Employee Director Compensation” and “Executive Compensation.”
Related Party Transaction Policy
We have adopted a formal, written policy, which will become effective on the date of this prospectus, that our executive officers, directors (including director nominees), holders of more than 5% of any class of our voting securities, and any member of the immediate family of or any entities affiliated with any of the foregoing persons, are not permitted to enter into a related party transaction with us without the prior approval or, in the case of pending or ongoing related party transactions, ratification of our audit committee. For purposes of our policy, a related party transaction is a transaction, arrangement or relationship when we were, are or will be involved and in which a related party had, has or will have a direct or indirect material interest, other than transactions available to all of our U.S. employees.
Certain transactions with related parties, however, are excluded from the definition of a related party transaction, including, but not limited to: (1) transactions in which a related party’s interest arises only from the related party’s position as a director of another corporation or organization that is a party to the transaction and/or from the indirect or direct ownership by such related party and all other related parties of a less than 10% equity interest in another person (other than a partnership) which is a party to the transaction; (2) transactions in which a related party’s interest arises only from the related party’s position as a limited partner in a partnership in which the related party and all other related parties have an interest of less than 10%, and the related party is not a general partner of and does not hold another position in the partnership; (3) transactions where the related party’s interest arises solely from the ownership of our equity securities and all holders of our common stock received the same benefit on a pro rata basis (e.g., dividends); and (4) compensation, benefits, and other transactions available to all employees generally.
No member of the audit committee may participate in any review, consideration or approval of any related party transaction whereby such member or any of his or her immediate family members is the related party. In approving or rejecting the proposed agreement, our audit committee shall consider the relevant facts and circumstances available and deemed relevant to the audit committee, including, but not limited to: (1) the benefits and perceived benefits, or lack thereof, to our company; (2) the impact on a director’s independence in the event the related party is a director, an immediate family member of a director or an entity in which a director is a partner, stockholder or executive officer; (3) the materiality and character of the related party’s direct and indirect interest; (4) the actual or apparent conflict of interest of the related party; (5) the availability of other sources for comparable products or services; (6) the opportunity costs of alternative transactions; (7) the terms of the transaction; (8) the commercial reasonableness of the terms of the proposed transaction; and (9) terms available to unrelated third parties or to employees under the same or similar circumstances. In reviewing proposed related party transactions, the audit committee will only approve or ratify related party transactions that are in, or not inconsistent with, the best interests of our company and stockholders, as the audit committee determines in good faith.
The transactions described below were consummated prior to our adoption of the formal, written policy described above and therefore the foregoing policies and procedures were not followed
-131-
Table of Contents
with respect to the transactions. However, we believe that the terms obtained or consideration that we paid or received, as applicable, in connection with the transactions described were comparable to terms available or the amounts that would be paid or received, as applicable, in arm’s-length transactions
Sales of Securities
The following table sets forth a summary of the sale and issuance of our securities to related persons since January 1, 2013, other than compensation arrangements which are described under the sections of this prospectus captioned “Management — Non-Employee Director Compensation” and “Executive Compensation” or exercises of awards issued in connection with such compensation arrangements. For a description of beneficial ownership see the section of this prospectus captioned “Principal Stockholders.”
| Purchaser |
Series E Convertible Preferred Stock |
|||
| Executive Officers, Directors and Promoters: |
||||
| Tom Bogan |
44,063 | |||
| Matt McIlwain(1) |
201,809 | |||
| Ravi Mohan(2) |
11,022 | |||
| 5% Stockholders: |
||||
| Entities affiliated with Greylock Partners(3) |
157,746 | |||
| Entities affiliated with Madrona Venture Group(1) |
201,809 | |||
| Shasta Ventures, L.P.(2) |
11,022 | |||
| (1) | Consists of (a) 194,057 shares of Series E convertible preferred stock held by Madrona Venture Fund III, L.P. and (b) 7,752 shares of Series E convertible preferred stock held by Madrona Venture Fund III-A, L.P. Madrona Investment Partners III, L.P. is the general partner of each of Madrona Venture Fund III, L.P. and Madrona Venture Fund III-A, L.P. Madrona III General Partner, LLC is the general partner of Madrona Investment Partners III, L.P. Matt McIlwain, a member of our board of directors, Tom Alberg, Paul Goodrich, Len Jordan, Tim Porter and Scott Jacobson are the managing directors of Madrona III General Partner, LLC and each of them may be deemed to exercise voting and investment power over the shares held of record by Madrona III General Partner, LLC. |
| (2) | Consists of 11,022 shares of Series E convertible preferred stock held by Shasta Ventures, L.P. Shasta Ventures GP, LLC is the general partner of Shasta Ventures, L.P. Mr. Mohan, a member of our board of directors, Tod Francis and Robert Coneybeer are the managing members of Shasta Ventures GP, LLC and each of them may be deemed to exercise voting and investment power over the shares held by Shasta Ventures, L.P. |
| (3) | Consists of (a) 134,874 shares of Series E convertible preferred stock held by Greylock XII Limited Partnership, (b) 7,887 shares of Series E convertible preferred stock held by Greylock XII Principals LLC, and (c) 14,985 shares of Series E convertible preferred stock held by Greylock XII-A Limited Partnership. The general partner of Greylock XII Limited Partnership and Greylock XII-A Limited Partnership is Greylock XII GP LLC. William W. Helman and Aneel Bhusri are the senior managing members of Greylock XII GP LLC and Greylock Principals XII LLC, and as such, each of them may be deemed to share voting power and investment control over the shares held of record by Greylock XII Limited Partnership, Greylock XII-A Limited Partnership and Greylock Principals XII LLC. Mr. Bogan, a member of our board of directors, has an economic interest in certain Greylock Partners’ funds, including Greylock XII Limited Partnership and Greylock XII-A Limited Partnership, but does not have voting or investment power over the shares held by such entities and, accordingly, such shares are not included as beneficially owned by Mr. Bogan. |
Class B Common Stock
From January 1, 2013 through June 30, 2016, we issued and sold an aggregate of 2,442,449 shares of Class B common stock upon the exercise of options issued to certain employees, directors and consultants under 2007 Stock Plan and the 2011 Executive Equity Incentive Plan at exercise prices ranging from $0.14 to $13.99, for aggregate consideration of $5,887,325.
-132-
Table of Contents
Series E Convertible Preferred Stock
In May 2013, we issued and sold an aggregate of 1,982,851 shares of Series E convertible preferred stock at $22.6946 per share, for aggregate proceeds of $45,000,010, to a total of 23 accredited investors, including Tom Bogan, Greylock XII Limited Partnership, Greylock XII Principals LLC, Greylock XII-A Limited Partnership, Madrona Venture Fund III, LP, Madrona Venture Fund III-A, LP and Shasta Ventures, L.P.
Investors’ Rights Agreement
We have entered into an investors’ rights agreement with certain holders of Class B common stock, convertible preferred stock and warrants to purchase capital stock, including Tom Bogan, entities affiliated with Greylock Partners, entities affiliated with Madrona Venture Group, Shasta Ventures, L.P., Messrs. Gupta and Shintaffer and trusts affiliated with Mr. Gupta and Shintaffer, and certain other persons. As of June 30, 2016, the holders of 27,976,982 shares of Class B common stock, including the shares of Class B common stock issuable upon the conversion of our convertible preferred stock and exercise of outstanding warrants, are entitled to rights with respect to the registration of their shares under the Securities Act. For a description of these registration rights, see the section of this prospectus captioned “Description of Capital Stock — Registration Rights.”
Voting Agreement
The election of the members of the board of directors is governed by a voting agreement with certain of the holders of our outstanding Class B common stock, convertible preferred stock and warrants to purchase our capital stock, including entities affiliated with Greylock Partners, entities affiliated with Madrona Venture Group, Shasta Ventures, L.P., Messrs. Gupta and Shintaffer, trusts affiliated with Messrs. Gupta and Shintaffer, and certain other persons. The parties to the voting agreement have agreed, subject to certain conditions, to vote their shares so as to elect as directors: (1) one nominee designated by entities affiliated with Greylock Partners; (2) one nominee designated by entities affiliated with Madrona Venture Group; (3) one nominee designated by Shasta Ventures, L.P.; (4) two nominees designated by the holders of Class B common stock, one of whom shall be the then serving chief executive officer; and (5) two nominees designated by a majority of the other current members of the board of directors and approved by the holders of a majority of the preferred stock and Class B common stock, voting together as a single class on an as-converted basis. Upon the closing of this offering, the voting agreement will terminate and none of our stockholders will have any special rights regarding the election or designation of members of our board of directors.
Right of First Refusal and Co-Sale Agreement
We are party to a right of first refusal and co-sale agreement with holders of our convertible preferred stock and our founders, including entities affiliated with Greylock Partners, entities affiliated with Madrona Venture Group, Shasta Ventures, L.P., Messrs. Gupta and Shintaffer, trusts affiliated with Messrs. Gupta and Shintaffer, and certain other persons, pursuant to which certain holders of convertible preferred stock have a right of first refusal and co-sale in respect of certain sales of securities by our founders and our other stockholders. Upon the closing of this offering, the right of first refusal and co-sale agreement will terminate.
Other Transactions
We have entered into separate indemnification agreements with each of our directors and certain of our officers. For a description of these agreements, see the section of this prospectus captioned “Management—Limitation of Liability and Indemnification.”
-133-
Table of Contents
We have entered into employment agreements with our named executive officers that, among other things, provide for certain severance and change of control benefits. For a description of these agreements, see the section of this prospectus captioned “Executive Compensation—Employment Arrangements.”
We have granted stock options to our named executive officers, other executive officers and certain of our directors. See the sections of this prospectus captioned “Management—Non-Employee Director Compensation” and “Executive Compensation—Outstanding Equity Awards as of December 31, 2015.”
-134-
Table of Contents
The following table sets forth certain information with respect to the beneficial ownership of our common stock at July 31, 2016, as adjusted to reflect the sale of Class A common stock offered by us in this offering, for:
| • | each person, or group of affiliated persons, who we know beneficially owns more than 5% of our Class A common stock or Class B common stock; |
| • | each of our directors; |
| • | each of our named executive officers; and |
| • | all of our directors and executive officers as a group. |
The percentage of beneficial ownership prior to the offering shown in the table is based upon no shares of Class A Common stock outstanding and 31,289,539 shares of Class B common stock outstanding as of July 31, 2016. The percentage of beneficial ownership after this offering shown in the table is based on 6,000,000 shares of Class A common stock outstanding and 31,289,539 shares of Class B common stock outstanding after the closing of this offering, assuming no exercise of the underwriters’ option to purchase additional shares of Class A common stock.
Information with respect to beneficial ownership has been furnished by each director, officer or beneficial owner of more than 5% of our common stock. We have determined beneficial ownership in accordance with the rules of the SEC. These rules generally attribute beneficial ownership of securities to persons who possess sole or shared voting power or investment power with respect to those securities. In addition, the rules take into account shares of common stock issuable pursuant to the exercise of stock options or warrants that are either immediately exercisable or exercisable on or before the 60th day after July 31, 2016. Certain of the options granted to our named executive officers may be exercised prior to the vesting of the underlying shares. We refer to such options as being “early exercisable.” Shares of common stock issued upon early exercise are subject to our right to repurchase such shares until such shares have vested. These shares are deemed to be outstanding and beneficially owned by the person holding those options or a warrant for the purpose of computing the percentage ownership of that person, but they are not treated as outstanding for the purpose of computing the percentage ownership of any other person. Unless otherwise indicated, the persons or entities identified in this table have sole voting and investment power with respect to all shares shown as beneficially owned by them, subject to applicable community property laws.
-135-
Table of Contents
Except as otherwise noted below, the address for each person or entity listed in the table is c/o Apptio, Inc., 11100 NE 8th Street, Bellevue, Washington 98004.
| Beneficial Ownership Prior to the Offering |
Beneficial Ownership After the Offering |
|||||||||||||||||||||||||||||||
| Class B | % of Total Voting Power |
Class A | Class B | % of Total Voting Power |
||||||||||||||||||||||||||||
| Name of Beneficial Owner |
Shares | % | Shares | % | Shares | % | ||||||||||||||||||||||||||
| 5% Stockholders: |
||||||||||||||||||||||||||||||||
| Entities affiliated with Greylock Partners(1) |
5,155,723 | 16.5 | 16.5 | — | * | 5,155,723 | 16.5 | 16.2 | ||||||||||||||||||||||||
| Sunny Gupta(2) |
5,976,833 | 18.7 | 18.7 | — | * | 5,976,833 | 18.7 | 18.4 | ||||||||||||||||||||||||
| Gupta Family Irrevocable Trust(3) |
1,860,000 | 5.9 | 5.9 | — | * | 1,860,000 | 5.9 | 5.8 | ||||||||||||||||||||||||
| Entities affiliated with Madrona Venture Group(4) |
5,199,786 | 16.6 | 16.6 | — | * | 5,199,786 | 16.6 | 16.3 | ||||||||||||||||||||||||
| Shasta Ventures, L.P.(5) |
2,969,724 | 9.5 | 9.5 | — | * | 2,969,724 | 9.5 | 9.3 | ||||||||||||||||||||||||
| Directors and Named Executive Officers: |
||||||||||||||||||||||||||||||||
| Sunny Gupta(2) |
5,976,833 | 18.7 | 18.7 | — | * | 5,976,833 | 18.7 | 18.4 | ||||||||||||||||||||||||
| Kurt Shintaffer(6) |
1,172,802 | 3.7 | 3.7 | — | * | 1,172,802 | 3.7 | 3.7 | ||||||||||||||||||||||||
| John Morrow(7) |
63,854 | * | * | — | * | 63,854 | * | * | ||||||||||||||||||||||||
| Tom Bogan(8) |
275,618 | * | * | — | * | 275,618 | * | * | ||||||||||||||||||||||||
| Peter Klein(9) |
118,127 | * | * | — | * | 118,127 | * | * | ||||||||||||||||||||||||
| John McAdam(10) |
118,127 | * | * | — | * | 118,127 | * | * | ||||||||||||||||||||||||
| Matt McIlwain(11) |
5,229,786 | 16.7 | 16.7 | — | * | 5,229,786 | 16.7 | 16.4 | ||||||||||||||||||||||||
| Ravi Mohan(12) |
2,999,724 | 9.6 | 9.6 | — | * | 2,999,724 | 9.6 | 9.4 | ||||||||||||||||||||||||
| Rajeev Singh(13) |
30,000 | * | * | — | * | 30,000 | * | * | ||||||||||||||||||||||||
| All directors and executive officers as a group (13 persons)(14) |
17,014,623 | 50.9 | 50.9 | — | * | 17,014,623 | 50.9 | 50.0 | ||||||||||||||||||||||||
| * | Represents beneficial ownership of less than 1% |
| (1) | Consists of (a) 4,408,144 shares held of record by Greylock XII Limited Partnership (“Greylock XII”); (b) 257,786 shares held of record by Greylock XII Principals LLC (“Greylock XII LLC”); and (c) 489,793 shares held of record by Greylock XII-A Limited Partnership (“Greylock XII-A”). The general partner of Greylock XII and Greylock XII-A is Greylock XII GP LLC. William W. Helman and Aneel Bhusri are the senior managing members of Greylock XII GP LLC and Greylock XII LLC, and as such, each of them may be deemed to share voting power and investment control over the shares held of record by Greylock XII, Greylock XII-A and Greylock XII LLC. The address for each of the foregoing entities is 2550 Sand Hill Road, Suite 200, Menlo Park, CA 94025. Mr. Bogan, a member of our board of directors, has an economic interest in certain Greylock funds, including Greylock XII Limited Partnership and Greylock XII-A Limited Partnership, but does not have voting or investment power over the shares held by such entities and, accordingly, such shares are not included as beneficially owned by Mr. Bogan. |
| (2) | Consists of (a) 3,844,833 shares held of record by Mr. Gupta, (b) 1,500,000 shares held of record by PG GRAT of 2016 and (c) 632,000 shares issuable pursuant to stock options exercisable within 60 days of July 31, 2016, of which 559,958 shares are vested as of September 29, 2016. Excludes 1,860,000 shares held by the Gupta Family Irrevocable Trust, as to which Mr. Gupta disclaims beneficial ownership. Neither Mr. Gupta nor his spouse is a beneficiary of the Gupta Family Irrevocable Trust, nor does Mr. Gupta or his spouse exercise voting or investment control over such shares. |
| (3) | Consists of 1,860,000 shares held of record by Gupta Family Irrevocable Trust. Vineet Gupta, the sole trustee of the Gupta Family Irrevocable Trust, exercises voting and investment control over the shares held of record by Gupta Family Irrevocable Trust. |
| (4) | Consists of (a) 5,000,040 shares held of record by Madrona Venture Fund III, L.P. (“Madrona III”) and (b) 199,746 shares held of record by Madrona Venture Fund III-A, L.P. (“Madrona III-A”). Madrona Investment Partners III, L.P. (“Madrona Investment Partners III”) is the general partner of each of Madrona Venture Fund III and Madrona Venture Fund III-A. Madrona III General Partner, LLC is the general partner of Madrona Investment Partners III. Matt McIlwain, a member of our board of directors, Tom Alberg, Paul Goodrich, Len Jordan, Tim Porter and Scott Jacobson are the managing directors of Madrona III General Partner, LLC and each of them may be deemed to exercise voting and investment power over the shares held of record by Madrona III General Partner, LLC. The address for each of the foregoing entities is 999 Third Avenue, 34th Floor, Seattle, WA 98104. |
| (5) | Consists of 2,969,724 shares held of record by Shasta Ventures, L.P. Shasta Ventures GP, LLC is the general partner of Shasta Ventures, L.P. Mr. Mohan, a member of our board of directors, Tod Francis and Robert Coneybeer are the managing members of Shasta Ventures GP, LLC and each of them may be deemed to exercise voting and investment power over the shares held of record by Shasta Ventures, L.P. The address for each of the foregoing entities is 2440 Sand Hill Road, Suite 300, Menlo Park, CA 94025. |
-136-
Table of Contents
| (6) | Consists of 27,187 shares issuable pursuant to stock options exercisable within 60 days of July 31, 2016, all of which are vested as of September 29, 2016, 957,877 shares held of record by Mr. Shintaffer, 87,738 shares held by the KCS 2012 GRAT, 87,738 shares held by the KDS 2012 GRAT, and 12,262 shares held by Kylee D. Shintaffer, Mr. Shintaffer’s spouse. |
| (7) | Consists of 63,854 shares issuable pursuant to stock options exercisable within 60 days of July 31, 2016, all of which are vested as of September 29, 2016. |
| (8) | Consists of (a) 245,618 shares held of record by Mr. Bogan and (b) 30,000 shares issuable pursuant to stock options exercisable within 60 days of July 31, 2016, none of which are vested as of September 29, 2016. |
| (9) | Consists of 118,127 shares issuable pursuant to stock options exercisable within 60 days of July 31, 2016, of which 62,423 shares are vested as of September 29, 2016. |
| (10) | Consists of 118,127 shares issuable pursuant to stock options exercisable within 60 days of July 31, 2016, of which 80,783 shares are vested as of September 29, 2016. |
| (11) | See footnote (4) regarding Mr. McIlwain’s relationship with Madrona III and Madrona III-A. Includes 30,000 shares issuable pursuant to stock options exercisable within 60 days of July 31, 2016, none of which are vested as of September 29, 2016. |
| (12) | See footnote (5) regarding Mr. Mohan’s relationship with Shasta Ventures, L.P. Includes 30,000 shares issuable pursuant to stock options exercisable within 60 days of July 31, 2016, none of which are vested as of September 29, 2016. |
| (13) | Excludes 130,422 shares held by the Singh Irrevocable Trust of 2009, as to which Mr. Singh disclaims beneficial ownership. Neither Mr. Singh nor his spouse is a beneficiary of the Singh Irrevocable Trust of 2009, nor does Mr. Singh or his spouse exercise voting or investment control over such shares. Renuka Singh is the sole trustee of Singh Irrevocable Trust of 2009. Includes 30,000 shares issuable pursuant to stock options exercisable within 60 days of July 31, 2016, none of which are vested as of September 29, 2016. |
| (14) | Consists of (a) 14,905,576 shares held by the directors and executive officers and (b) 2,109,047 shares issuable pursuant to stock options exercisable within 60 days of July 31, 2016, of which 1,823,957 are vested as of September 29, 2016. |
-137-
Table of Contents
The following is a summary of the rights of our Class A common stock, Class B common stock and preferred stock. This summary is not complete. For more detailed information, please see our certificate of incorporation and bylaws, which are filed as exhibits to the registration statement of which this prospectus is a part.
Upon the closing of this offering and the filing of our certificate of incorporation, our authorized capital stock will consist of 451,000,000 shares of Series A common stock, par value of $0.0001 per share, 44,000,000 shares of Class B common stock, par value $0.0001 per share, and 5,000,000 shares of preferred stock, par value $0.0001 per share.
Upon the closing of this offering, all the outstanding shares of convertible preferred stock will automatically convert into an aggregate of 18,239,475 shares of Class B common stock. In addition, upon the closing of this offering and after giving effect to the conversion of convertible preferred stock into Class B common stock, warrants to purchase an aggregate of 75,214 shares of Class B common stock will remain outstanding if they are not exercised prior to closing of this offering.
Common Stock
Outstanding Shares
Prior to the closing of this offering, we had one class of common stock. Upon the closing of this offering, we will have authorized a new class of Class A common stock and a new class of Class B common stock. All currently outstanding shares of our common stock and convertible preferred stock (including shares to be issued upon the exercise of the warrants described below immediately prior to the closing of this offering) will convert into shares of our new Class B common stock. In addition, all currently outstanding options to purchase shares of our capital stock will become exercisable for shares of our new Class B common stock.
There will be 6,000,000 shares of Class A common stock and 31,285,839 shares of Class B common stock outstanding upon the closing of this offering. As of June 30, 2016, we had 253 record holders of Class B common stock.
As of June 30, 2016, there were 75,214 shares of Class B common stock subject to outstanding warrants, and 11,394,824 shares of Class B common stock subject to outstanding options.
Voting Rights
The holders of Class A common stock are entitled to one vote per share, and holders of Class B common stock are entitled to 10 votes per share. The holders of Class A common stock and Class B common stock will generally vote together as a single class on all matters submitted to a vote of our stockholders, unless otherwise required by Delaware law or our certificate of incorporation. Delaware law could require holders of Class A common stock or Class B common stock to vote separately as a single class in the following circumstances:
| • | if we were to seek to amend our certificate of incorporation to increase or decrease the par value of a class of our capital stock, then that class would be required to vote separately to approve the proposed amendment; and |
| • | if we were to seek to amend our certificate of incorporation in a manner that alters or changes the powers, preferences or special rights of a class of our capital stock in a manner that affected its holders adversely, then that class would be required to vote separately to approve the proposed amendment. |
-138-
Table of Contents
Our certificate of incorporation and bylaws do not provide for cumulative voting rights. Because of this, the holders of a plurality of the voting power of our shares of common stock entitled to vote in any election of directors can elect all of the directors standing for election, if they should so choose. With respect to matters other than the election of directors, at any meeting of the stockholders at which a quorum is present or represented, the affirmative vote of a majority of the voting power of the shares present in person or represented by proxy at such meeting and entitled to vote on the subject matter shall be the act of the stockholders, except as otherwise required by law. The holders of a majority of the voting power of the stock issued and outstanding and entitled to vote, present in person or represented by proxy, shall constitute a quorum for the transaction of business at all meetings of the stockholders.
Conversion
Each share of Class B common stock is convertible at any time at the option of the holder into one share of Class A common stock. In addition, each share of Class B common stock will convert automatically into one share of Class A common stock upon any transfer, whether or not for value, except for certain transfers described in our certificate of incorporation, including, without limitation, transfers for tax and estate planning purposes, so long as the transferring holder of Class B common stock continues to hold exclusive voting and dispositive power with respect to the shares transferred.
All shares of Class B common stock will convert automatically into shares of Class A common stock upon the earlier of (1) the seventh anniversary of the closing of this offering and (2) the date on which the Class B common stock ceases to represent at least 25% of our outstanding common stock.
Once converted into a share of Class A common stock, a converted share of Class B common stock will not be reissued. Following the conversion of all outstanding shares of Class B common stock, no further shares of Class B common stock will be issued.
Dividends
Subject to preferences that may be applicable to any then outstanding preferred stock, holders of Class A common stock and Class B common stock are entitled to receive dividends, if any, as may be declared from time to time by our board of directors out of legally available funds. For more information see the section of this prospectus captioned “Dividend Policy.” If a dividend is paid in the form of Class A common stock or Class B common stock, then holders of Class A common stock shall receive Class A common stock and holders of Class B common stock shall receive Class B common stock.
Liquidation
In the event of our liquidation, dissolution or winding up, holders of Class A common stock and Class B common stock will be entitled to share ratably in the net assets legally available for distribution to stockholders after the payment of all of our debts and other liabilities and the satisfaction of any liquidation preference granted to the holders of any then outstanding shares of preferred stock.
Rights and Preferences
Holders of Class A common stock and Class B common stock have no preemptive, conversion, subscription or other rights, and there are no redemption or sinking fund provisions applicable to Class A common stock or Class B common stock. The rights, preferences and privileges of the holders of Class A common stock and Class B common stock are subject to and may be adversely affected by, the rights of the holders of shares of any series of preferred stock that we may designate in the future.
-139-
Table of Contents
Fully Paid and Nonassessable
All of our outstanding shares of Class B common stock are, and the shares of Class A common stock to be issued pursuant to this offering, when paid for, will be fully paid and nonassessable.
Preferred Stock
Upon the closing of this offering, our board of directors will have the authority, without further action by the stockholders, to issue up to 5,000,000 shares of preferred stock in one or more series and to fix the rights, preferences, privileges and restrictions thereof. These rights, preferences and privileges could include dividend rights, conversion rights, voting rights, redemption rights, liquidation preferences, sinking fund terms and the number of shares constituting any series or the designation of such series, any or all of which may be greater than the rights of Class A common stock or Class B common stock. The issuance of preferred stock could adversely affect the voting power of holders of Class A common stock and Class B common stock and the likelihood that such holders will receive dividend payments and payments upon liquidation. In addition, the issuance of preferred stock could have the effect of delaying, deferring or preventing change in our control or other corporate action. Upon closing of this offering, no shares of preferred stock will be outstanding, and we have no present plan to issue any shares of preferred stock.
Warrants
As of June 30, 2016, we had the following warrants issued and outstanding:
| • | Warrant to purchase 27,321 shares of Series A convertible preferred stock with an exercise price of $1.37255 per share and an expiration date in October 2018. |
| • | Warrant to purchase 21,444 shares of Class B common stock with an exercise price of $13.99 per share and an expiration date in June 2025. See the section of this prospectus captioned “Management’s Discussion and Analysis of Financial Condition and Results of Operations—Credit Facilities” for additional information regarding this warrant. |
| • | Warrants to purchase an aggregate of 26,449 shares of Class B common stock with an exercise price of $14.31 per share and an expiration date in April 2026. See the section of this prospectus captioned “Management’s Discussion and Analysis of Financial Condition and Results of Operations—Credit Facilities” for additional information regarding this warrant. |
These warrants have a net exercise provision under which their holders may, in lieu of payment of the exercise price in cash, surrender the warrant and receive a net amount of shares based on the fair market value of our stock at the time of exercise of the warrants after deduction of the aggregate exercise price. In addition, these warrants will automatically be exercised if the fair market value of our stock at the expiration date of the warrants is greater than the exercise price. These warrants contain provisions for adjustment of the exercise price and number of shares issuable upon the exercise of warrants in the event of certain stock dividends, stock splits, reorganizations, reclassifications and consolidations.
In connection with the closing of this offering, the warrant to purchase Series A convertible preferred stock will become exercisable for a number of shares of Class B common stock equal to the number of shares of our convertible preferred stock that underlie such warrant.
-140-
Table of Contents
Registration Rights
Under our investors’ rights agreement, following the closing of this offering, the holders of approximately 18,239,475 shares of Class B common stock issuable upon conversion of outstanding convertible preferred stock, or their transferees, have the right to require us to register the offer and sale of their shares, which we refer to as registration rights. In addition, holders of approximately 27,976,982 shares of Class B common stock, including the shares issuable upon conversion of outstanding convertible preferred stock, and including the shares underlying a warrant described in “Shares Eligible for Future Sale — Warrants”, have the right to include their shares in any registration statement we file. Each case is described below.
Demand Registration Rights
At any time after six months after the date of this prospectus the holders of at least a majority of the shares having demand registration rights have the right to demand that we use best efforts to file a registration statement for the registration of the offer and sale of at least such number of shares with anticipated offering proceeds in excess of $10 million. We are only obligated to file up to two registration statements in connection with the exercise of demand registration rights. These registration rights are subject to specified conditions and limitations, including the right of the underwriters to limit the number of shares included in any such registration under certain circumstances and our ability to defer the filing of a registration statement with respect to an exercise of such demand registration rights for up to 120 days under certain circumstances.
Form S-3 Registration Rights
At any time after we are qualified to file a registration statement on Form S-3, the holders of at least 15% of the shares having S-3 registration rights have the right to demand that we file a registration statement on Form S-3 so long as the aggregate number of shares to be offered and sold under such registration statement on Form S-3 is at least $1.0 million. We are not obligated to file any registration statements within 90 days of a registration statement that we propose. These investor registration rights are subject to specified conditions and limitations, including our ability to defer the filing of a registration statement with respect to an exercise of such Form S-3 registration rights for up to 90 days under certain circumstances.
Piggyback Registration Rights
At any time after the closing of this offering, if we propose to register the offer and sale of any of our securities under the Securities Act either for our own account or for the account of other stockholders, a stockholder with registration rights will have the right, subject to certain exceptions, to include their shares of common stock in the registration statement. These registration rights are subject to specified conditions and limitations, including the right of the underwriters to limit the number of shares included in any such registration statement under certain circumstances, but not below 30% of the total number of shares covered by the registration statement, except in the case of our initial public offering, in which case all such shares may be excluded.
Expenses of Registration
We will pay all expenses relating to any demand registrations, Form S-3 registrations and piggyback registrations, other than underwriting discounts and selling commissions.
Termination
The registration rights terminate upon the earliest of (1) the date that is five years after the closing of this offering, (2) as to a given holder of registration rights, when such holder of registration
-141-
Table of Contents
rights can sell all of such holder’s registrable securities in a three month-period pursuant to Rule 144 promulgated under the Securities Act and (3) a change in control of our company.
Anti-Takeover Effects of Delaware and Washington Law and Our Certificate of Incorporation and Bylaws
Delaware Law
We are subject to Section 203 of the Delaware General Corporation Law. Section 203 generally prohibits a publicly held Delaware corporation from engaging in a “business combination” with any “interested stockholder” for a period of three years after the date of the transaction in which the person became an interested stockholder, unless:
| • | prior to the date of the transaction, the board of directors of the corporation approved either the business combination or the transaction which resulted in the stockholder becoming an interested stockholder; |
| • | upon consummation of the transaction which resulted in the stockholder becoming an interested stockholder, the interested stockholder owned at least 85% of the voting stock of the corporation outstanding at the time the transaction commenced, excluding for purposes of determining the number of shares outstanding (1) shares owned by persons who are directors and also officers and (2) shares owned by employee stock plans in which employee participants do not have the right to determine confidentially whether shares held subject to the plan will be tendered in a tender or exchange offer; or |
| • | on or subsequent to the date of the transaction, the business combination is approved by the board and authorized at an annual or special meeting of stockholders, and not by written consent, by the affirmative vote of at least two-thirds of the outstanding voting stock which is not owned by the interested stockholder. |
Section 203 defines a business combination to include:
| • | any merger or consolidation involving the corporation and the interested stockholder; |
| • | any sale, transfer, pledge or other disposition involving the interested stockholder of 10% or more of the assets of the corporation; |
| • | subject to exceptions, any transaction that results in the issuance or transfer by the corporation of any stock of the corporation to the interested stockholder; |
| • | any transaction involving the corporation that has the effect of increasing the proportionate share of the stock or any class or series of the corporation beneficially owned by the interested stockholder; and |
| • | the receipt by the interested stockholder of the benefit of any loans, advances, guarantees, pledges or other financial benefits provided by or through the corporation. |
In general, Section 203 defines an interested stockholder as any entity or person beneficially owning 15% or more of the outstanding voting stock of the corporation and any entity or person affiliated with or controlling or controlled by the entity or person.
-142-
Table of Contents
Washington Business Corporation Act
The laws of Washington, where our principal executive offices are located, impose restrictions on certain transactions between certain foreign corporations and significant stockholders. In particular, the Washington Business Corporation Act, or WBCA, prohibits a “target corporation,” with certain exceptions, from engaging in certain “significant business transactions” with a person or group of persons which beneficially owns 10% or more of the voting securities of the target corporation, an “acquiring person,” for a period of five years after such acquisition, unless the transaction or acquisition of shares is approved by a majority of the members of the target corporation’s board of directors prior to the time of acquisition. Such prohibited transactions may include, among other things:
| • | any merger or consolidation with, disposition of assets to, or issuance or redemption of stock to or from, the acquiring person; |
| • | any termination of 5% or more of the employees of the target corporation as a result of the acquiring person’s acquisition of 10% or more of the shares; and |
| • | allowing the acquiring person to receive any disproportionate benefit as a stockholder. |
After the five-year period, a significant business transaction may take place as long as it complies with certain fair price provisions of the statute or is approved at an annual or special meeting of stockholders.
We will be considered a “target corporation” so long as our principal executive office is located in Washington, and: (1) a majority of our employees are residents of the state of Washington or we employ more than one thousand residents of the state of Washington; (2) a majority of our tangible assets, measured by market value, are located in the state of Washington or we have more than $50 million worth of tangible assets located in the state of Washington; and (3) any one of the following: (a) more than 10% of our stockholders of record are resident in the state of Washington; (b) more than 10% of our shares are owned of record by state residents; or (c) 1,000 or more of our stockholders of record are resident in the state.
If we meet the definition of a target corporation, the WBCA may have the effect of delaying, deferring or preventing a change of control.
Certificate of Incorporation and Bylaws
Provisions of the certificate of incorporation and bylaws may delay or discourage transactions involving an actual or potential change in our control or change in our management, including transactions in which stockholders might otherwise receive a premium for their shares, or transactions that our stockholders might otherwise deem to be in their best interests. Therefore, these provisions could adversely affect the price of Class A common stock. Among other things, the certificate of incorporation and bylaws:
| • | provide that holders of shares of Class B common stock shall be entitled to 10 votes for each share of Class B common stock held; |
| • | permit the board of directors to issue up to 5,000,000 shares of preferred stock, with any rights, preferences and privileges as they may designate, including the right to approve an acquisition or other change in our control; |
| • | provide that the authorized number of directors may be changed only by resolution of the board of directors; |
-143-
Table of Contents
| • | provide that all vacancies, including newly created directorships, may, except as otherwise required by law, be filled by the affirmative vote of a majority of directors then in office, even if less than a quorum; |
| • | divide the board of directors into three classes; |
| • | provide that a director may only be removed from the board of directors by the stockholders for cause; |
| • | require that any action to be taken by our stockholders must be effected at a duly called annual or special meeting of stockholders and not be taken by written consent; |
| • | provide that stockholders seeking to present proposals before a meeting of stockholders or to nominate candidates for election as directors at a meeting of stockholders must provide notice in writing in a timely manner, and also meet specific requirements as to the form and content of a stockholder’s notice; |
| • | not provide for cumulative voting rights (therefore allowing the holders of a plurality of the shares of common stock entitled to vote in any election of directors to elect all of the directors standing for election, if they should so choose); |
| • | provide that special meetings of our stockholders may be called only by the chairman of the board, our chief executive officer or by the board of directors pursuant to a resolution adopted by a majority of the total number of authorized directors; |
| • | provide that stockholders will be permitted to amend the bylaws only upon receiving at least two-thirds of the votes entitled to be cast by holders of all outstanding shares then entitled to vote generally in the election of directors, voting together as a single class; and |
| • | provide that, unless we otherwise consent in writing, a federal or state court located in the State of Delaware shall be the sole and exclusive forum for (1) any derivative action or proceeding brought on behalf of the company, (2) any action asserting a claim of breach of a fiduciary duty owed by any of our directors or officers to the company or our stockholders, (3) any action asserting a claim against the company arising pursuant to any provision of the Delaware General Corporation Law or our certificate of incorporation or bylaws, or (4) any action asserting a claim against the company governed by the internal affairs doctrine. |
The amendment of any of these provisions would require approval by the holders of at least two-thirds of our then outstanding common stock, voting as a single class.
Transfer Agent and Registrar
The transfer agent and registrar for our common stock is American Stock Transfer & Trust Company, LLC. The transfer agent and registrar’s address is 6201 15th Avenue, Brooklyn, New York 11219.
Listing
Our common stock has been approved for listing on The NASDAQ Global Market under the symbol “APTI.”
-144-
Table of Contents
SHARES ELIGIBLE FOR FUTURE SALE
Prior to this offering, there has been no public market for our Class A common stock, and although our Class A common stock has been approved for listing on The NASDAQ Global Market, we cannot assure investors that there will be an active public market for our common public offerings or private placements, in connection with exercise of stock options, vesting of restricted stock units and other issuances relating to our employee benefit plans and as consideration for future acquisitions, investments or other purposes. The number of shares of Class A common stock that we may issue may be significant, depending on the events surrounding such issuances. In some cases, the shares we issue may be freely tradable without restriction or further registration under the Securities Act; in other cases, we may grant registration rights covering the shares issued in connection with these issuances, in which case the holders of the Class A common stock will have the right, under certain circumstances, to cause us to register any resale of such shares to the public.
Lock-up Arrangements
We, our directors and officers and substantially all of the holders of our equity securities have agreed, subject to certain exceptions, not to offer, sell or transfer any common stock or securities convertible into or exchangeable or exercisable for common stock, for 180 days after the date of this prospectus without first obtaining the written consent of Goldman, Sachs & Co. and J.P. Morgan Securities LLC on behalf of the underwriters, after the date of this prospectus. These agreements are described in the section of this prospectus captioned “Underwriting.”
Goldman, Sachs & Co. and J.P. Morgan Securities LLC have advised us that they have no present intent or arrangement to release any shares subject to a lock-up, and will consider the release of any lock-up on a case-by-case basis. Upon a request to release any shares subject to a lock-up, Goldman, Sachs & Co. and J.P. Morgan Securities LLC would consider the particular circumstances surrounding the request, including, but not limited to, the length of time before the lock-up expires, the number of shares requested to be released, reasons for the request, the possible impact on the market or our Class A common stock and whether the holder of our shares requesting the release is an officer, director or other affiliate of ours.
In addition to the restrictions contained in the lock-up agreement described above, we have entered into agreements with certain securityholders, including the investors’ rights agreement and our standard form option agreement, that contain market stand-off provisions imposing restrictions on the ability of such securityholders to offer, sell or transfer our equity securities for a period of 180 days following the date of this prospectus.
Rule 144
In general, under Rule 144, beginning 90 days after the date of this prospectus, a person who is not our affiliate and has not been our affiliate for purposes of the Securities Act at any time during the preceding three months will be entitled to sell any shares of our common stock that such person has beneficially owned for at least six months, including the holding period of any prior owner other than one of our affiliates, without being required to comply with the notice, manner of sale or public information requirements or volume limitation provisions of Rule 144. Sales of our common stock by any such person would be subject to the availability of current public information about us if the shares to be sold were beneficially owned by such person for less than one year.
-145-
Table of Contents
In addition, under Rule 144, a person may sell shares of our common stock acquired from us immediately upon the closing of this offering, without regard to the registration requirements of the Securities Act or the availability of public information about us, if:
| • | the person is not our affiliate and has not been our affiliate at any time during the preceding three months; and |
| • | the person has beneficially owned the shares to be sold for at least one year, including the holding period of any prior owner other than one of our affiliates. |
Beginning 90 days after the date of this prospectus, our affiliates who have beneficially owned shares of our common stock for at least six months, including the holding period of any prior owner other than one of our affiliates, would be entitled to sell within any three-month period a number of shares that does not exceed the greater of:
| • | 1% of the number of shares of Class A common stock then outstanding, which will equal approximately shares immediately after this offering; and |
| • | the average weekly trading volume in Class A common stock on The NASDAQ Global Market during the four calendar weeks preceding the date of filing of a notice on Form 144 with respect to the sale. |
Sales under Rule 144 by our affiliates are also subject to manner of sale provisions and notice requirements and to the availability of current public information about us. To the extent that shares were acquired from one of our affiliates, a person’s holding period for the purpose of effecting a sale under Rule 144 would commence on the date of transfer from the affiliate.
Rule 701
In general, under Rule 701 a person who purchased shares of our common stock pursuant to a written compensatory plan or contract and who is not deemed to have been one of our affiliates during the immediately preceding 90 days may sell these shares in reliance upon Rule 144, but without being required to comply with the notice, manner of sale or public information requirements or volume limitation provisions of Rule 144. Rule 701 also permits affiliates to sell their Rule 701 shares under Rule 144 without complying with the holding period requirements of Rule 144. All holders of Rule 701 shares, however, are required to wait until 90 days after the date of this prospectus before selling such shares pursuant to Rule 701.
As of June 30, 2016, 2,956,413 shares of outstanding Class B common stock had been issued in reliance on Rule 701 as a result of exercises of stock options. All of these shares, however, are subject to lock-up agreements or market stand-off provisions as discussed above, and, as a result, these shares will only become eligible for sale at the earlier of the expiration of the lock-up period or upon obtaining the consent of Goldman, Sachs & Co. and J.P. Morgan Securities LLC on behalf of the underwriters to release all or any portion of these shares from the lock-up agreements.
Stock Options
As of June 30, 2016, options to purchase an aggregate 11,394,824 shares of Class B common stock were outstanding. We intend to file one or more registration statements on Form S-8 under the Securities Act to register the offer and sale of all shares of our common stock subject to outstanding stock options and all shares issued or issuable under our stock plans. We expect to file the registration statement covering these shares after the date of this prospectus, which will permit the resale of such
-146-
Table of Contents
shares by persons who are non-affiliates of ours in the public market without restriction under the Securities Act, subject, with respect to certain of the shares, to the provisions of the lock-up agreements and market stand-off provisions described above.
Warrants
Upon closing of this offering, warrants entitling holders to purchase an aggregate of 75,214 shares of Class B common stock at a weighted-average exercise price of $9.52 per share, after conversion of the convertible preferred stock, will remain outstanding. See the section of this prospectus captioned “Description of Capital Stock — Warrants” for additional information. Such shares issued upon exercise of the warrants may be able to be sold after the expiration of the lock-up period described above subject to the requirements of Rule 144 described above.
Registration Rights
Upon closing of this offering, the holders of approximately 27,976,982 shares of Class B common stock (including the shares underlying the warrants described in “— Warrants” above), will be eligible to exercise certain rights to cause us to register their shares for resale under the Securities Act, subject to various conditions and limitations. These registration rights are described under the caption “Description of Capital Stock — Registration Rights.” Upon the effectiveness of a registration statement covering these shares, the shares would become freely tradable, and a large number of shares may be sold into the public market. If that occurs, the market price of Class A common stock could be adversely affected.
-147-
Table of Contents
MATERIAL U.S. FEDERAL INCOME AND ESTATE TAX CONSEQUENCES
TO NON-U.S. HOLDERS OF CLASS A COMMON STOCK
The following is a summary of the material U.S. federal income and estate tax consequences to non-U.S. holders (as defined below) of the ownership and disposition of Class A common stock purchased in this offering, but is for general information only and does not purport to be a complete analysis of all the potential tax considerations relating thereto. This summary is based upon the provisions of the U.S. Internal Revenue Code, or the Code, U.S. Treasury Regulations promulgated thereunder, administrative rulings and judicial decisions, all as of the date hereof, all of which are subject to change, possibly with retroactive effect, which could result in U.S. federal income and estate tax consequences different than those summarized below. We have not sought, and do not intend to seek, a ruling from the Internal Revenue Service, or the IRS, with respect to the statements made and the conclusions reached in the following summary, and there can be no assurance that the IRS will agree with such statements and conclusions.
This summary does not address the potential application of the alternative minimum tax provisions of the Code or the federal tax on net investment income or the tax considerations arising under the laws of any state, local or other jurisdiction or under any non-income tax laws, including U.S. federal gift and estate tax laws, except to the limited extent set forth below, and is limited to investors who will hold Class A common stock as a capital asset for tax purposes (generally, property held for investment). This summary does not address all tax considerations that may be important to a particular investor in light of the investor’s circumstances or to certain categories of non-U.S. investors that may be subject to special rules, such as:
| • | banks, insurance companies or other financial institutions (except to the extent specifically set forth below); |
| • | tax-exempt organizations or governmental organizations; |
| • | regulated investment companies and real estate investment trusts; |
| • | controlled foreign corporations, passive foreign investment companies and corporations that accumulate earnings to avoid U.S. federal income tax; |
| • | brokers or dealers in securities or currencies; |
| • | traders in securities that elect to use a mark-to-market method of accounting for their securities holdings; |
| • | persons that own, or are deemed to own, more than 5% of our capital stock (except to the extent specifically set forth below); |
| • | tax-qualified retirement plans; |
| • | entities treated as partnerships for U.S. federal income tax purposes or other pass-through entities (and investors therein); |
| • | certain former citizens or long-term residents of the United States; |
| • | persons who hold Class A common stock as a position in a hedging transaction, “straddle,” “conversion transaction” or other risk reduction transaction; |
-148-
Table of Contents
| • | persons who hold or receive Class A common stock pursuant to the exercise of any employee stock option or otherwise as compensation; or |
| • | persons deemed to sell Class A common stock under the constructive sale provisions of the Code. |
In addition, if a partnership (including any entity classified as a partnership for U.S. federal income tax purposes) holds our Class A common stock, the tax treatment of a partner generally will depend on the status of the partner and upon the activities of the partnership. Accordingly, partnerships that hold our Class A common stock and partners in such partnerships should consult their tax advisors.
You are urged to consult your tax advisor with respect to the application of the U.S. federal income and estate tax laws to your particular situation, as well as any tax consequences of the purchase, ownership and disposition of our Class A common stock arising under other U.S. federal tax rules or under the laws of any state, local, non-U.S. or other taxing jurisdiction or under any applicable tax treaty.
Non-U.S. Holder Defined
For purposes of this discussion, you are a non-U.S. holder if you are a beneficial owner of Class A common stock other than (1) an individual U.S. citizen or U.S. resident alien for U.S. federal income tax purposes, (2) a corporation or other entity taxable as a corporation for U.S. federal income tax purposes that was created or organized in or under the laws of the United States, any state thereof or the District of Columbia, (3) an estate whose income is subject to U.S. federal income taxation regardless of its source, (4) a trust that either (a) is subject to the supervision of a court within the United States and has one or more U.S. persons with authority to control all of its substantial decisions, or (b) has a valid election in effect under applicable U.S. Treasury Regulations to be treated as a U.S. person or (5) an entity treated as a partnership for U.S. federal income tax purposes.
Distributions on Class A Common Stock
As described in the section of this prospectus captioned “Dividend Policy,” we have never declared or paid cash dividends on Class A common stock and do not anticipate paying any dividends on Class A common stock in the foreseeable future. If we make distributions on Class A common stock, these distributions generally will constitute dividends for U.S. tax purposes to the extent paid from our current or accumulated earnings and profits, as determined under U.S. federal income tax principles. To the extent these distributions exceed both our current and our accumulated earnings and profits, the excess will constitute a return of capital and will first reduce your basis in Class A common stock, but not below zero, and then will be treated as gain from the sale of stock as described below under “—Gain on Disposition of Class A Common Stock.”
Subject to the discussions below on effectively connected income and foreign accounts, any dividend paid to you generally will be subject to U.S. withholding either at a rate of 30% of the gross amount of the dividend or such lower rate as may be specified by an applicable income tax treaty. In order to receive a reduced treaty rate, you must provide us with an IRS Form W-8BEN, IRS Form W-8BEN-E or other appropriate version of IRS Form W-8 certifying qualification for the reduced rate. If you are eligible for a reduced rate of withholding pursuant to an income tax treaty, you may obtain a refund of any excess amounts withheld by timely filing an appropriate claim for refund with the IRS. If you hold Class A common stock through a financial institution or other agent acting on your behalf, you will be required to provide appropriate documentation to the agent, which then will be required to provide certification to us or our paying agent, either directly or through other intermediaries.
-149-
Table of Contents
Dividends received by you that are effectively connected with your conduct of a U.S. trade or business (and, if an income tax treaty applies, attributable to a permanent establishment or fixed base maintained by you in the United States) are exempt from withholding if you satisfy certain certification and disclosure requirements. In order to claim this exemption, you must provide us with an IRS Form W-8ECI or other applicable IRS Form W-8 properly certifying exemption. Such effectively connected dividends, although not subject to withholding, are taxed at the same graduated U.S. federal income tax rates applicable to U.S. persons, net of certain deductions and credits. In addition, if you are a corporate non-U.S. holder, dividends you receive that are effectively connected with your conduct of a U.S. trade or business may also be subject to a branch profits tax at a rate of 30% or such lower rate as may be specified by an applicable income tax treaty. You should consult your tax advisor regarding any applicable tax treaties that may provide for different rules.
Gain on Disposition of Class A Common Stock
Subject to the discussion below regarding backup withholding and foreign accounts, a non-U.S. holder generally will not be subject to U.S. federal income tax on any gain realized upon the sale, exchange or other disposition of Class A common stock unless:
| • | the gain is effectively connected with your conduct of a U.S. trade or business (and, if an income tax treaty applies, the gain is attributable to a permanent establishment or fixed base maintained by you in the U.S.); |
| • | you are a non-resident alien individual who is present in the United States for a period or periods aggregating 183 days or more during the calendar year in which the sale or disposition occurs and certain other conditions are met; or |
| • | Class A common stock constitutes a U.S. real property interest by reason of our status as a “United States real property holding corporation,” or USRPHC, for U.S. federal income tax purposes at any time within the shorter of the five-year period preceding your disposition of, or your holding period for, Class A common stock. |
If you are described in the first bullet above, you will generally be required to pay tax on the net gain derived from the sale at the same graduated U.S. federal income tax rates applicable to U.S. persons (net of certain deductions and credits), and if you are a corporate non-U.S. holder, you may be subject to branch profits tax at a rate of 30% or such lower rate as may be specified by an applicable income tax treaty. If you are described in the second bullet above, you will be required to pay a flat 30% tax (or such lower rate specified by an applicable income tax treaty) on the gain derived from the sale, which gain may be offset by U.S. source capital losses for the year (even though you are not considered a resident of the United States), provided you have timely filed U.S. federal income tax returns with respect to such losses.
We believe that we are not currently and will not become a USRPHC for U.S. federal income tax purposes, and the remainder of this discussion so assumes. However, because the determination of whether we are a USRPHC depends on the fair market value of our U.S. real property relative to the fair market value of our other business assets, there can be no assurance that we will not become a USRPHC in the future. Even if we become a USRPHC, however, as long as Class A common stock is regularly traded on an established securities market, Class A common stock will be treated as a U.S. real property interest only if you actually or constructively hold more than 5% of such regularly traded Class A common stock at any time during the applicable period described in the third bullet above.
-150-
Table of Contents
Federal Estate Tax
Class A common stock beneficially owned by an individual who is not a citizen or resident of the United States (as defined for U.S. federal estate tax purposes) at the time of death generally will be includable in the decedent’s gross estate for U.S. federal estate tax purposes. Such stock, therefore, may be subject to U.S. federal estate tax, unless an applicable estate tax treaty provides otherwise.
Backup Withholding and Information Reporting
Generally, we must report annually to the IRS the amount of dividends paid to you, your name and address, and the amount of tax withheld, if any. A similar report will be sent to you. Pursuant to applicable income tax treaties or other agreements, the IRS may make these reports available to tax authorities in your country of residence.
Payments of dividends on or the gross proceeds of a disposition of Class A common stock may be subject to information reporting and backup withholding at a current rate of 28% unless you establish an exemption, for example by properly certifying your non-U.S. status on an IRS Form W-8BEN, IRS Form W-8BEN-E or another appropriate version of IRS Form W-8. Notwithstanding the foregoing, backup withholding and information reporting may apply if either we or our paying agent has actual knowledge, or reason to know, that you are a U.S. person.
Backup withholding is not an additional tax. Any amounts withheld from a payment to you under the backup withholding rules will be allowed as a credit against your U.S. federal income tax liability and backup withholding resulting in an overpayment of taxes may entitle you to a refund, provided that the required information or returns are furnished to the IRS in a timely manner.
Foreign Accounts
The Foreign Account Tax Compliance Act, or FATCA, generally imposes a U.S. federal withholding tax of 30% on dividends on, and the gross proceeds of a disposition of, Class A common stock to a “foreign financial institution” (as specifically defined for this purpose) unless such institution enters into an agreement with the U.S. government to, among other things, withhold on certain payments and to collect and provide to the U.S. tax authorities substantial information regarding U.S. account holders of such institution (which includes certain equity and debt holders of such institution, as well as certain account holders that are foreign entities with U.S. owners) or such institution otherwise qualifies for an exemption. FATCA also generally imposes a U.S. federal withholding tax of 30% on dividends on, and the gross proceeds of a disposition of, our Class A common stock to a “non-financial foreign entity” (as specifically defined for this purpose) unless such entity provides the withholding agent with either a certification that it does not have any substantial direct or indirect U.S. owners, information regarding direct and indirect U.S. owners of the entity, or such entity otherwise qualifies for an exemption. The withholding provisions under FATCA generally apply to dividends on our Class A common stock, and under current transitional rules are expected to apply with respect to the gross proceeds of a disposition of Class A common stock on or after January 1, 2019. Under certain circumstances, a non-U.S. holder might be eligible for refunds or credits of such taxes. An intergovernmental agreement between the United States and an applicable foreign country may modify the requirements described in this paragraph. You should consult your tax advisors regarding the application of these withholding provisions to you.
Each prospective investor should consult its own tax advisor regarding the particular U.S. federal, state, local and non-U.S. tax consequences of purchasing, holding and disposing of Class A common stock, including the consequences of any proposed change in applicable laws.
-151-
Table of Contents
We and the underwriters named below have entered into an underwriting agreement with respect to the shares being offered. Subject to certain conditions, the underwriters have severally agreed to purchase the number of shares indicated in the following table. Goldman, Sachs & Co., J.P. Morgan Securities LLC and Merrill Lynch, Pierce, Fenner & Smith Incorporated are the representatives of the underwriters.
| Underwriters |
Number of Shares |
|||
| Goldman, Sachs & Co. |
||||
| J.P. Morgan Securities LLC |
||||
| Merrill Lynch, Pierce, Fenner & Smith Incorporated |
||||
| Barclays Capital Inc. |
||||
| Jefferies LLC |
||||
| RBC Capital Markets, LLC |
||||
| Pacific Crest Securities, a division of KeyBanc Capital Markets Inc. |
||||
|
|
|
|||
| Total |
6,000,000 | |||
|
|
|
|||
The underwriters are committed to take and pay for all of the shares being offered, if any are taken, other than the shares covered by the option described below unless and until this option is exercised.
The underwriters have an option to buy up to an additional 900,000 shares from us. They may exercise that option for 30 days. If any shares are purchased pursuant to this option, the underwriters will severally purchase shares in approximately the same proportion as set forth in the table above.
The following tables show the per share and total underwriting discounts and commissions to be paid to the underwriters by us. Such amounts are shown assuming both no exercise and full exercise of the underwriters’ option to purchase 900,000 additional shares.
| No Exercise | Full Exercise | |||||||
| Per Share |
$ | $ | ||||||
| Total |
$ | $ | ||||||
Shares sold by the underwriters to the public will initially be offered at the initial public offering price set forth on the cover page of this prospectus. Any shares sold by the underwriters to securities dealers may be sold at a discount of up to $ per share from the initial public offering price. After the initial offering of the shares, the representatives may change the offering price and the other selling terms. The offering of the shares by the underwriters is subject to receipt and acceptance and subject to the underwriters’ right to reject any order in whole or in part.
We and our officers, directors, and holders of substantially all of our common stock, have agreed with the underwriters, subject to certain exceptions, not to dispose of or hedge any of our or their common stock or securities convertible into or exchangeable for shares of common stock during the period from the date of this prospectus continuing through the date 180 days after the date of this prospectus, except with the prior written consent of the Goldman, Sachs & Co. and J.P. Morgan Securities LLC. This agreement does not apply to any existing employee benefit plans. See the section of this prospectus captioned “Shares Eligible for Future Sale” for a discussion of certain transfer restrictions.
-152-
Table of Contents
Prior to the offering, there has been no public market for the shares. The initial public offering price will be negotiated among us and the representatives. Among the factors to be considered in determining the initial public offering price of the shares, in addition to prevailing market conditions, will be our historical performance, estimates of the business potential and earnings prospects of our company, an assessment of our management and the consideration of the above factors in relation to market valuation of companies in related businesses.
Our Class A common stock will be listed on The NASDAQ Global Market under the symbol “APTI.”
In connection with the offering, the underwriters may purchase and sell shares of Class A common stock in the open market. These transactions may include short sales, stabilizing transactions and purchases to cover positions created by short sales. Short sales involve the sale by the underwriters of a greater number of shares than they are required to purchase in the offering, and a short position represents the amount of such sales that have not been covered by subsequent purchases. A “covered short position” is a short position that is not greater than the amount of additional shares for which the underwriters’ option described above may be exercised. The underwriters may cover any covered short position by either exercising their option to purchase additional shares or purchasing shares in the open market. In determining the source of shares to cover the covered short position, the underwriters will consider, among other things, the price of shares available for purchase in the open market as compared to the price at which they may purchase additional shares pursuant to the option described above. “Naked” short sales are any short sales that create a short position greater than the amount of additional shares for which the option described above may be exercised. The underwriters must cover any such naked short position by purchasing shares in the open market. A naked short position is more likely to be created if the underwriters are concerned that there may be downward pressure on the price of the Class A common stock in the open market after pricing that could adversely affect investors who purchase in the offering. Stabilizing transactions consist of various bids for or purchases of Class A common stock made by the underwriters in the open market prior to the closing of the offering.
The underwriters may also impose a penalty bid. This occurs when a particular underwriter repays to the underwriters a portion of the underwriting discount received by it because the representatives have repurchased shares sold by or for the account of such underwriter in stabilizing or short covering transactions.
Purchases to cover a short position and stabilizing transactions, as well as other purchases by the underwriters for their own accounts, may have the effect of preventing or retarding a decline in the market price of our Class A common stock, and together with the imposition of the penalty bid, may stabilize, maintain, or otherwise affect the market price of our Class A common stock. As a result, the price of our Class A common stock may be higher than the price that otherwise might exist in the open market. The underwriters are not required to engage in these activities and may end any of these activities at any time. These transactions may be effected on the The NASDAQ Global Market, in the over-the-counter market or otherwise.
The underwriters do not expect sales to discretionary accounts to exceed five percent of the total number of shares offered.
We estimate that our share of the total expenses of the offering, excluding underwriting discounts and commissions, will be approximately $3.3 million.
We have agreed to indemnify the several underwriters against certain liabilities, including liabilities under the Securities Act.
-153-
Table of Contents
The underwriters and their respective affiliates are full service financial institutions engaged in various activities, which may include sales and trading, commercial and investment banking, advisory, investment management, investment research, principal investment, hedging, market making, brokerage, and other financial and non-financial activities and services. Certain of the underwriters and their respective affiliates have provided, and may in the future provide, a variety of these services to the issuer and to persons and entities with relationships with the issuer, for which they received or will receive customary fees and expenses. In addition, certain of the underwriters are customers of our company.
In the ordinary course of their various business activities, the underwriters and their respective affiliates, officers, directors, and employees may purchase, sell, or hold a broad array of investments and actively trade securities, derivatives, loans, commodities, currencies, credit default swaps, and other financial instruments for their own account and for the accounts of their customers, and such investment and trading activities may involve or relate to assets, securities, and/or instruments of the issuer (directly, as collateral securing other obligations or otherwise), and/or persons and entities with relationships with the issuer. The underwriters and their respective affiliates may also communicate independent investment recommendations, market color, or trading ideas and/or publish or express independent research views in respect of such assets, securities, or instruments and may at any time hold, or recommend to clients that they should acquire, long and/or short positions in such assets, securities and instruments.
European Economic Area
In relation to each Member State of the European Economic Area which has implemented the Prospectus Directive (each, a Relevant Member State), each underwriter has represented and agreed that with effect from and including the date on which the Prospectus Directive is implemented in that Relevant Member State (the Relevant Implementation Date) it has not made and will not make an offer of shares to the public in that Relevant Member State prior to the publication of a prospectus in relation to the shares which has been approved by the competent authority in that Relevant Member State or, where appropriate, approved in another Relevant Member State and notified to the competent authority in that Relevant Member State, all in accordance with the Prospectus Directive, except that it may, with effect from and including the Relevant Implementation Date, make an offer of shares to the public in that Relevant Member State at any time:
| (A) | to legal entities which are authorized or regulated to operate in the financial markets or, if not so authorized or regulated, whose corporate purpose is solely to invest in securities; |
| (B) | to any legal entity which has two or more of (1) an average of at least 250 employees during the last financial year; (2) a total balance sheet of more than €43.0 million and (3) an annual net turnover of more than €50.0 million, as shown in its last annual or consolidated accounts; |
| (C) | to fewer than 100 natural or legal persons (other than qualified investors as defined in the Prospectus Directive) subject to obtaining the prior consent of the representatives for any such offer; or |
| (D) | in any other circumstances which do not require the publication by the Issuer of a prospectus pursuant to Article 3 of the Prospectus Directive. |
For the purposes of this provision, the expression an “offer of shares to the public” in relation to any shares in any Relevant Member State means the communication in any form and by any means of sufficient information on the terms of the offer and the shares to be offered so as to enable an investor to decide to purchase or subscribe the shares, as the same may be varied in that Relevant Member
-154-
Table of Contents
State by any measure implementing the Prospectus Directive in that Relevant Member State and the expression Prospectus Directive means Directive 2003/71/EC and includes any relevant implementing measure in each Relevant Member State.
United Kingdom
Each underwriter has represented and agreed that:
| (A) | it has only communicated or caused to be communicated and will only communicate or cause to be communicated an invitation or inducement to engage in investment activity (within the meaning of Section 21 of the FSMA) received by it in connection with the issue or sale of the shares in circumstances in which Section 21(1) of the FSMA does not apply to the Issuer; and |
| (B) | it has complied and will comply with all applicable provisions of the FSMA with respect to anything done by it in relation to the shares in, from or otherwise involving the United Kingdom. |
Hong Kong
The shares may not be offered or sold by means of any document other than (A) in circumstances which do not constitute an offer to the public within the meaning of the Companies Ordinance (Cap. 32, Laws of Hong Kong), or (B) to “professional investors” within the meaning of the Securities and Futures Ordinance (Cap. 571, Laws of Hong Kong) and any rules made thereunder, or (C) in other circumstances which do not result in the document being a “prospectus” within the meaning of the Companies Ordinance (Cap. 32, Laws of Hong Kong), and no advertisement, invitation or document relating to the shares may be issued or may be in the possession of any person for the purpose of issue (in each case whether in Hong Kong or elsewhere), which is directed at, or the contents of which are likely to be accessed or read by, the public in Hong Kong (except if permitted to do so under the laws of Hong Kong) other than with respect to shares which are or are intended to be disposed of only to persons outside Hong Kong or only to “professional investors” within the meaning of the Securities and Futures Ordinance (Cap. 571, Laws of Hong Kong) and any rules made thereunder.
Singapore
This prospectus has not been registered as a prospectus with the Monetary Authority of Singapore. Accordingly, this prospectus and any other document or material in connection with the offer or sale, or invitation for subscription or purchase, of the shares may not be circulated or distributed, nor may the shares be offered or sold, or be made the subject of an invitation for subscription or purchase, whether directly or indirectly, to persons in Singapore other than (A) to an institutional investor under Section 274 of the Securities and Futures Act, Chapter 289 of Singapore (the “SFA”), (B) to a relevant person, or any person pursuant to Section 275(1A), and in accordance with the conditions, specified in Section 275 of the SFA, or (C) otherwise pursuant to, and in accordance with the conditions of, any other applicable provision of the SFA.
Where the shares are subscribed or purchased under Section 275 by a relevant person which is: (A) a corporation (which is not an accredited investor) the sole business of which is to hold investments and the entire share capital of which is owned by one or more individuals, each of whom is an accredited investor; or (B) a trust (where the trustee is not an accredited investor) whose sole purpose is to hold investments and each beneficiary is an accredited investor, shares, debentures and units of shares and debentures of that corporation or the beneficiaries’ rights and interest in that trust
-155-
Table of Contents
shall not be transferable for 6 months after that corporation or that trust has acquired the shares under Section 275 except: (1) to an institutional investor under Section 274 of the SFA or to a relevant person, or any person pursuant to Section 275(1A), and in accordance with the conditions, specified in Section 275 of the SFA; (2) where no consideration is given for the transfer; or (3) by operation of law.
Japan
The securities have not been and will not be registered under the Financial Instruments and Exchange Law of Japan (the Financial Instruments and Exchange Law) and each underwriter has agreed that it will not offer or sell any securities, directly or indirectly, in Japan or to, or for the benefit of, any resident of Japan (which term as used herein means any person resident in Japan, including any corporation or other entity organized under the laws of Japan), or to others for re-offering or resale, directly or indirectly, in Japan or to a resident of Japan, except pursuant to an exemption from the registration requirements of, and otherwise in compliance with, the Financial Instruments and Exchange Law and any other applicable laws, regulations, and ministerial guidelines of Japan.
Canada
The securities may be sold only to purchasers purchasing, or deemed to be purchasing, as principal that are accredited investors, as defined in National Instrument 45-106 Prospectus Exemptions or subsection 73.3(1) of the Securities Act (Ontario), and are permitted clients, as defined in National Instrument 31-103 Registration Requirements, Exemptions and Ongoing Registrant Obligations. Any resale of the securities must be made in accordance with an exemption from, or in a transaction not subject to, the prospectus requirements of applicable securities laws.
Securities legislation in certain provinces or territories of Canada may provide a purchaser with remedies for rescission or damages if this prospectus (including any amendment thereto) contains a misrepresentation, provided that the remedies for rescission or damages are exercised by the purchaser within the time limit prescribed by the securities legislation of the purchaser’s province or territory. The purchaser should refer to any applicable provisions of the securities legislation of the purchaser’s province or territory for particulars of these rights or consult with a legal advisor.
Pursuant to section 3A.3 (or, in the case of securities issued or guaranteed by the government of a non-Canadian jurisdiction, section 3A.4) of National Instrument 33-105 Underwriting Conflicts (NI 33-105), the underwriters are not required to comply with the disclosure requirements of NI 33-105 regarding underwriter conflicts of interest in connection with this offering.
-156-
Table of Contents
The validity of the shares of Class A common stock offered hereby will be passed upon for us by Wilson Sonsini Goodrich & Rosati, Professional Corporation, Seattle, Washington. Cooley LLP, Seattle, Washington, is representing the underwriters.
The consolidated financial statements as of December 31, 2014 and 2015 and for each of the two years in the period ended December 31, 2015 included in this prospectus have been so included in reliance on the report of PricewaterhouseCoopers LLP, an independent registered public accounting firm, given on the authority of said firm as experts in auditing and accounting.
WHERE YOU CAN FIND ADDITIONAL INFORMATION
We have filed with the SEC a registration statement on Form S-1 under the Securities Act with respect to the shares of Class A common stock offered by this prospectus. This prospectus, which constitutes a part of the registration statement, does not contain all of the information set forth in the registration statement, some items of which are contained in exhibits to the registration statement as permitted by the rules and regulations of the SEC. For further information with respect to us and our Class A common stock, we refer you to the registration statement, including the exhibits filed as a part of the registration statement. Statements contained in this prospectus concerning the contents of any contract or document referred to are not necessarily complete. If a contract or document has been filed as an exhibit to the registration statement, please see the copy of the contract or document that has been filed. Each statement in this prospectus relating to a contract or document filed as an exhibit is qualified in all respects by the filed exhibit.
You may read and copy the registration statement, including the exhibits and schedules thereto, at the Public Reference Section of the SEC, 100 F Street, N.E., Room 1580, Washington, D.C. 20549. You may obtain information on the operation of the public reference rooms by calling the SEC at 1-800-SEC-0330. The SEC also maintains an Internet website that contains reports, proxy statements and other information about issuers, like us, that file electronically with the SEC. The address of that website is www.sec.gov. We also maintain a website at www.apptio.com, at which you may access these materials free of charge as soon as reasonably practicable after they are electronically filed with, or furnished to, the SEC. Information contained on our website is not a part of this prospectus and the inclusion of our website address in this prospectus is an inactive textual reference only.
As a result of this offering, we will become subject to the information and reporting requirements of the Exchange Act and, in accordance with this law, will file periodic reports, proxy statements and other information with the SEC. These periodic reports, proxy statements and other information will be available for inspection and copying at the SEC’s public reference facilities and the website of the SEC referred to above.
-157-
Table of Contents
INDEX TO CONSOLIDATED FINANCIAL STATEMENTS
| Page | ||||
| F-2 | ||||
| F-3 | ||||
| F-4 | ||||
| F-5 | ||||
| Consolidated Statements of Changes in Convertible Preferred Stock and Stockholders’ Deficit |
F-6 | |||
| F-7 | ||||
| F-8 | ||||
F-1
Table of Contents
Report of Independent Registered Public Accounting Firm
To the Board of Directors and Stockholders of Apptio, Inc.:
In our opinion, the accompanying consolidated balance sheets and the related consolidated statements of operations, of comprehensive loss, of changes in convertible preferred stock and stockholders’ deficit, and of cash flows present fairly, in all material respects, the financial position of Apptio, Inc. and its subsidiaries at December 31, 2014 and 2015, and the results of their operations and their cash flows for each of the two years in the period ended December 31, 2015 in conformity with accounting principles generally accepted in the United States of America. These financial statements are the responsibility of the Company’s management. Our responsibility is to express an opinion on these financial statements based on our audits. We conducted our audits of these statements in accordance with the standards of the Public Company Accounting Oversight Board (United States). Those standards require that we plan and perform the audit to obtain reasonable assurance about whether the financial statements are free of material misstatement. An audit includes examining, on a test basis, evidence supporting the amounts and disclosures in the financial statements, assessing the accounting principles used and significant estimates made by management, and evaluating the overall financial statement presentation. We believe that our audits provide a reasonable basis for our opinion.
/s/ PricewaterhouseCoopers LLP
Seattle, Washington
February 16, 2016
F-2
Table of Contents
Apptio, Inc. and Subsidiaries
| December 31, 2014 |
December 31, 2015 |
June 30, 2016 |
Pro Forma June 30, 2016 |
|||||||||||||
| (unaudited) | ||||||||||||||||
| (in thousands, except share and per share amounts) | ||||||||||||||||
| Assets |
||||||||||||||||
| Current assets |
||||||||||||||||
| Cash and cash equivalents |
$ | 19,686 | $ | 17,256 | $ | 42,052 | $ | 42,052 | ||||||||
| Short-term investments |
14,856 | 6,260 | — | — | ||||||||||||
| Accounts receivable, net of allowance for doubtful accounts of $450, $289 and $513 |
46,694 | 52,887 | 44,344 | 44,344 | ||||||||||||
| Prepaid expenses and other current assets |
3,447 | 3,990 | 4,993 | 4,993 | ||||||||||||
|
|
|
|
|
|
|
|
|
|||||||||
| Total current assets |
84,683 | 80,393 | 91,389 | 91,389 | ||||||||||||
| Long-term assets |
||||||||||||||||
| Property and equipment, net |
14,832 | 13,487 | 12,977 | 12,977 | ||||||||||||
| Long-term investments |
5,617 | — | — | — | ||||||||||||
| Restricted cash |
2,585 | 2,500 | — | — | ||||||||||||
| Deferred initial public offering costs |
— | 1,973 | 2,479 | 2,479 | ||||||||||||
| Other long-term assets, net |
745 | 798 | 640 | 640 | ||||||||||||
|
|
|
|
|
|
|
|
|
|||||||||
| Total assets |
$ | 108,462 | $ | 99,151 | $ | 107,485 | $ | 107,485 | ||||||||
|
|
|
|
|
|
|
|
|
|||||||||
| Liabilities, Convertible Preferred Stock and Stockholders’ Deficit |
||||||||||||||||
| Current liabilities |
||||||||||||||||
| Accounts payable |
$ | 5,370 | $ | 3,462 | $ | 5,451 | $ | 5,451 | ||||||||
| Accrued payroll and other expenses |
12,094 | 14,732 | 12,740 | 12,740 | ||||||||||||
| Deferred revenue |
61,993 | 82,422 | 79,932 | 79,932 | ||||||||||||
| Deferred rent |
609 | 613 | 644 | 644 | ||||||||||||
| Capital leases |
36 | 42 | 42 | 42 | ||||||||||||
| Current portion of long-term debt, net of debt issuance costs |
— | — | 547 | 547 | ||||||||||||
|
|
|
|
|
|
|
|
|
|||||||||
| Total current liabilities |
80,102 | 101,271 | 99,356 | 99,356 | ||||||||||||
| Long-term liabilities |
||||||||||||||||
| Deferred revenue, net of current portion |
1,296 | 803 | 2,252 | 2,252 | ||||||||||||
| Deferred rent, net of current portion |
4,440 | 4,810 | 4,446 | 4,446 | ||||||||||||
| Capital leases, net of current portion |
65 | 95 | 72 | 72 | ||||||||||||
| Long-term debt, net of debt issuance costs |
— | — | 18,885 | 18,885 | ||||||||||||
| Preferred stock warrant liability |
357 | 414 | 406 | — | ||||||||||||
| Asset retirement obligation |
220 | 210 | 190 | 190 | ||||||||||||
|
|
|
|
|
|
|
|
|
|||||||||
| Total liabilities |
86,480 | 107,603 | 125,607 | 125,201 | ||||||||||||
|
|
|
|
|
|
|
|
|
|||||||||
| Commitments and contingencies (Note 11) |
||||||||||||||||
| Convertible preferred stock |
||||||||||||||||
| Convertible preferred stock – par value $0.0001 per share; 18,430,604 shares authorized as of December 31, 2014 and 2015 and June 30, 2016 (unaudited); 18,239,475 shares issued and outstanding with aggregate liquidation preference of $136,000 as of December 31, 2014 and 2015 and June 30, 2016 (unaudited); no shares issued and outstanding as of June 30, 2016 pro forma (unaudited) |
133,809 | 133,809 | 133,809 | — | ||||||||||||
| Stockholders’ deficit |
||||||||||||||||
| Common stock – par value $0.0001 per share; 43,000,000 shares authorized as of December 31, 2014 and 2015 and 44,100,000 shares authorized as of June 30, 2016 (unaudited); 12,310,382, 12,897,001 and 13,046,364 shares issued and outstanding as of December 31, 2014 and 2015 and June 30, 2016 (unaudited); no shares issued and outstanding, as of June 30, 2016 pro forma (unaudited) |
1 | 1 | 1 | — | ||||||||||||
| Class A common stock — par value $0.0001 per share; 451,000,000 shares authorized as of June 30, 2016 pro forma (unaudited); no shares issued and outstanding, as of June 30, 2016 pro forma (unaudited) |
— | — | — | — | ||||||||||||
| Class B common stock — par value $0.0001 per share; 44,000,000 shares authorized as of June 30, 2016 pro forma (unaudited); 31,285,839 issued and outstanding as of June 30, 2016 pro forma (unaudited) |
— | — | — | 3 | ||||||||||||
| Additional paid-in capital |
15,934 | 26,509 | 31,720 | 165,933 | ||||||||||||
| Accumulated other comprehensive income |
2 | — | — | — | ||||||||||||
| Accumulated deficit |
(127,764 | ) | (168,771 | ) | (183,652 | ) | (183,652 | ) | ||||||||
|
|
|
|
|
|
|
|
|
|||||||||
| Total stockholders’ deficit |
(111,827 | ) | (142,261 | ) | (151,931 | ) | (17,716 | ) | ||||||||
|
|
|
|
|
|
|
|
|
|||||||||
| Total liabilities, convertible preferred stock and stockholders’ deficit |
$ | 108,462 | $ | 99,151 | $ | 107,485 | $ | 107,485 | ||||||||
|
|
|
|
|
|
|
|
|
|||||||||
The accompanying notes are an integral part of these consolidated financial statements.
F-3
Table of Contents
Apptio, Inc. and Subsidiaries
Consolidated Statements of Operations
| Year Ended December 31, | Six Months Ended June 30, | |||||||||||||||
| 2014 | 2015 | 2015 | 2016 | |||||||||||||
| (unaudited) | ||||||||||||||||
| (in thousands, except per share amounts) | ||||||||||||||||
| Revenue |
||||||||||||||||
| Subscription |
$ | 78,719 | $ | 99,924 | $ | 47,242 | $ | 61,681 | ||||||||
| Professional services |
27,896 | 29,327 | 14,913 | 13,941 | ||||||||||||
|
|
|
|
|
|
|
|
|
|||||||||
| Total revenue |
106,615 | 129,251 | 62,155 | 75,622 | ||||||||||||
| Cost of revenue |
||||||||||||||||
| Subscription |
14,686 | 23,457 | 11,142 | 13,039 | ||||||||||||
| Professional services |
25,731 | 25,720 | 13,036 | 12,712 | ||||||||||||
|
|
|
|
|
|
|
|
|
|||||||||
| Total cost of revenue |
40,417 | 49,177 | 24,178 | 25,751 | ||||||||||||
|
|
|
|
|
|
|
|
|
|||||||||
| Gross profit |
66,198 | 80,074 | 37,977 | 49,871 | ||||||||||||
|
|
|
|
|
|
|
|
|
|||||||||
| Operating expenses |
||||||||||||||||
| Research and development |
23,099 | 30,553 | 14,674 | 17,057 | ||||||||||||
| Sales and marketing |
60,775 | 71,337 | 33,274 | 35,956 | ||||||||||||
| General and administrative |
14,245 | 17,763 | 7,698 | 10,684 | ||||||||||||
|
|
|
|
|
|
|
|
|
|||||||||
| Total operating expenses |
98,119 | 119,653 | 55,646 | 63,697 | ||||||||||||
|
|
|
|
|
|
|
|
|
|||||||||
| Loss from operations |
(31,921 | ) | (39,579 | ) | (17,669 | ) | (13,826 | ) | ||||||||
| Other income (expense) |
||||||||||||||||
| Interest income (expense) and other, net |
2 | (18 | ) | 19 | (434 | ) | ||||||||||
| Foreign exchange loss |
(697 | ) | (1,301 | ) | (607 | ) | (407 | ) | ||||||||
|
|
|
|
|
|
|
|
|
|||||||||
| Loss before provision for income taxes |
(32,616 | ) | (40,898 | ) | (18,257 | ) | (14,667 | ) | ||||||||
| Provision for income taxes |
(256 | ) | (109 | ) | (149 | ) | (214 | ) | ||||||||
|
|
|
|
|
|
|
|
|
|||||||||
| Net loss |
$ | (32,872 | ) | $ | (41,007 | ) | $ | (18,406 | ) | $ | (14,881 | ) | ||||
|
|
|
|
|
|
|
|
|
|||||||||
| Net loss per share attributable to common stockholders, basic and diluted |
$ | (2.72 | ) | $ | (3.24 | ) | $ | (1.47 | ) | $ | (1.14 | ) | ||||
|
|
|
|
|
|
|
|
|
|||||||||
| Weighted-average shares used to compute net loss per share attributable to common stockholders, basic and diluted |
12,080 | 12,653 | 12,485 | 13,016 | ||||||||||||
|
|
|
|
|
|
|
|
|
|||||||||
| Pro forma net loss per share attributable to common stockholders, basic and diluted (unaudited) |
$ | (1.33 | ) | $ | (0.48 | ) | ||||||||||
|
|
|
|
|
|||||||||||||
| Weighted-average shares used to compute pro forma net loss per share attributable to common stockholders, basic and diluted (unaudited) |
30,893 | 31,256 | ||||||||||||||
|
|
|
|
|
|||||||||||||
The accompanying notes are an integral part of these consolidated financial statements.
F-4
Table of Contents
Apptio, Inc. and Subsidiaries
Consolidated Statements of Comprehensive Loss
| Year Ended December 31, | Six Months Ended June 30, | |||||||||||||||
| 2014 | 2015 | 2015 | 2016 | |||||||||||||
| (unaudited) |
||||||||||||||||
| (in thousands) | ||||||||||||||||
| Net loss |
$ | (32,872 | ) | $ | (41,007 | ) | $ | (18,406 | ) | $ | (14,881 | ) | ||||
|
|
|
|
|
|
|
|
|
|||||||||
| Other comprehensive loss |
||||||||||||||||
| Unrealized loss on available-for-sale securities |
(11 | ) | (2 | ) | (2 | ) | — | |||||||||
|
|
|
|
|
|
|
|
|
|||||||||
| Total comprehensive loss |
$ | (32,883 | ) | $ | (41,009 | ) | $ | (18,408 | ) | $ | (14,881 | ) | ||||
|
|
|
|
|
|
|
|
|
|||||||||
The accompanying notes are an integral part of these consolidated financial statements.
F-5
Table of Contents
Consolidated Statements of Changes in Convertible Preferred Stock and Stockholders’ Deficit
|
Convertible Preferred Stock |
Common Stock |
Additional Paid-In Capital |
Accumulated Deficit |
Accumulated Other Comprehensive Income (Loss) |
Total Stockholders’ Deficit |
|||||||||||||||||||||||||||||||||||
| Shares | Amount | Shares | Amount | |||||||||||||||||||||||||||||||||||||
| (in thousands) | ||||||||||||||||||||||||||||||||||||||||
| Balances at January 1, 2014 |
18,240 | $ | 133,809 | 11,668 | $ | 1 | $ | 8,731 | $ | (94,892 | ) | $ | 13 | $ | (86,147 | ) | ||||||||||||||||||||||||
| Stock option exercises |
— | — | 642 | — | 1,437 | — | — | 1,437 | ||||||||||||||||||||||||||||||||
| Stock-based compensation |
— | — | — | — | 5,766 | — | — | 5,766 | ||||||||||||||||||||||||||||||||
| Comprehensive loss |
— | — | — | — | — | (32,872 | ) | (11 | ) | (32,883 | ) | |||||||||||||||||||||||||||||
|
|
|
|
|
|
|
|
|
|
|
|
|
|
|
|
|
|||||||||||||||||||||||||
| Balances at December 31, 2014 |
18,240 | $ | 133,809 | 12,310 | $ | 1 | $ | 15,934 | $ | (127,764 | ) | $ | 2 | $ | (111,827 | ) | ||||||||||||||||||||||||
| Stock option exercises |
— | — | 587 | — | 2,670 | — | — | 2,670 | ||||||||||||||||||||||||||||||||
| Stock-based compensation |
— | — | — | — | 7,815 | — | — | 7,815 | ||||||||||||||||||||||||||||||||
| Issuance of common stock warrants |
— | — | — | — | 90 | — | — | 90 | ||||||||||||||||||||||||||||||||
| Comprehensive loss |
— | — | — | — | — | (41,007 | ) | (2 | ) | (41,009 | ) | |||||||||||||||||||||||||||||
|
|
|
|
|
|
|
|
|
|
|
|
|
|
|
|
|
|||||||||||||||||||||||||
| Balances at December 31, 2015 |
18,240 | $ | 133,809 | 12,897 | $ | 1 | $ | 26,509 | $ | (168,771 | ) | $ | — | $ | (142,261 | ) | ||||||||||||||||||||||||
| Stock option exercises (unaudited) |
— | — | 149 | — | 511 | — | — | 511 | ||||||||||||||||||||||||||||||||
| Stock-based compensation (unaudited) |
— | — | — | — | 4,415 | — | — | 4,415 | ||||||||||||||||||||||||||||||||
| Issuance of common stock warrants (unaudited) |
— | — | — | — | 285 | — | — | 285 | ||||||||||||||||||||||||||||||||
| Comprehensive loss (unaudited) |
— | — | — | — | — | (14,881 | ) | — | (14,881 | ) | ||||||||||||||||||||||||||||||
|
|
|
|
|
|
|
|
|
|
|
|
|
|
|
|
|
|||||||||||||||||||||||||
| Balances at June 30, 2016 (unaudited) |
18,240 | $ | 133,809 | 13,046 | $ | 1 | $ | 31,720 | $ | (183,652 | ) | $ | — | $ | (151,931 | ) | ||||||||||||||||||||||||
|
|
|
|
|
|
|
|
|
|
|
|
|
|
|
|
|
|||||||||||||||||||||||||
The accompanying notes are an integral part of these consolidated financial statements.
F-6
Table of Contents
Apptio, Inc. and Subsidiaries
Consolidated Statements of Cash Flows
| Years Ended December 31, | Six Months Ended June 30, | |||||||||||||||
| 2014 | 2015 | 2015 | 2016 | |||||||||||||
| (unaudited) | ||||||||||||||||
| (in thousands) | ||||||||||||||||
| Cash flows from operating activities |
||||||||||||||||
| Net loss |
$ | (32,872 | ) | $ | (41,007 | ) | $ | (18,406 | ) | $ | (14,881 | ) | ||||
| Adjustments to reconcile net loss to net cash used in operating activities |
||||||||||||||||
| Depreciation and amortization |
5,229 | 6,486 | 3,188 | 2,985 | ||||||||||||
| Amortization of premiums on investments |
228 | 87 | 44 | 15 | ||||||||||||
| (Gain) loss on disposal of property and equipment |
— | (9 | ) | (12 | ) | 25 | ||||||||||
| Stock-based compensation |
5,766 | 7,815 | 3,855 | 4,415 | ||||||||||||
| Accretion of capitalized loan fees |
18 | 62 | 12 | 72 | ||||||||||||
| Remeasurement of preferred stock warrant liability |
116 | 57 | 47 | (8 | ) | |||||||||||
| Change in operating assets and liabilities |
||||||||||||||||
| Accounts receivable |
(15,201 | ) | (6,193 | ) | 15,764 | 8,543 | ||||||||||
| Prepaid expenses and other current assets |
(2,009 | ) | (970 | ) | (1,516 | ) | (761 | ) | ||||||||
| Accounts payable |
1,407 | 666 | (1,381 | ) | 1,475 | |||||||||||
| Accrued expenses |
2,473 | 2,095 | (179 | ) | (1,942 | ) | ||||||||||
| Deferred revenue |
17,031 | 19,936 | (5,064 | ) | (1,041 | ) | ||||||||||
| Deferred rent |
(143 | ) | 384 | 336 | (306 | ) | ||||||||||
|
|
|
|
|
|
|
|
|
|||||||||
| Net cash used in operating activities |
(17,957 | ) | (10,591 | ) | (3,312 | ) | (1,409 | ) | ||||||||
|
|
|
|
|
|
|
|
|
|||||||||
| Cash flows from investing activities |
||||||||||||||||
| Purchases of property and equipment |
(6,319 | ) | (7,643 | ) | (4,759 | ) | (2,320 | ) | ||||||||
| Proceeds from maturities of investments |
28,385 | 16,839 | 11,109 | 6,245 | ||||||||||||
| Purchases of investments |
(20,744 | ) | (2,715 | ) | (2,017 | ) | — | |||||||||
| (Payment for) return of security deposits |
(716 | ) | 177 | 150 | (52 | ) | ||||||||||
| (Deposits for) return of restricted cash |
(85 | ) | 85 | 85 | 2,500 | |||||||||||
|
|
|
|
|
|
|
|
|
|||||||||
| Net cash provided by investing activities |
521 | 6,743 | 4,568 | 6,373 | ||||||||||||
|
|
|
|
|
|
|
|
|
|||||||||
| Cash flows from financing activities |
||||||||||||||||
| Proceeds from exercise of common stock options |
1,437 | 2,670 | 1,722 | 511 | ||||||||||||
| Principal payments on capital lease obligations |
(41 | ) | (45 | ) | (27 | ) | (23 | ) | ||||||||
| Payment of capitalized loan fees |
— | (78 | ) | (69 | ) | (236 | ) | |||||||||
| Payment of deferred initial public offering costs |
— | (1,092 | ) | — | (218 | ) | ||||||||||
| Proceeds from long-term debt |
— | — | — | 20,000 | ||||||||||||
|
|
|
|
|
|
|
|
|
|||||||||
| Net cash provided by financing activities |
1,396 | 1,455 | 1,626 | 20,034 | ||||||||||||
|
|
|
|
|
|
|
|
|
|||||||||
| Foreign currency effect on cash and cash equivalents |
(90 | ) | (37 | ) | (51 | ) | (202 | ) | ||||||||
|
|
|
|
|
|
|
|
|
|||||||||
| Net (decrease) increase in cash and cash equivalents |
(16,130 | ) | (2,430 | ) | 2,831 | 24,796 | ||||||||||
| Cash and cash equivalents |
||||||||||||||||
| Beginning of period |
35,816 | 19,686 | 19,686 | 17,256 | ||||||||||||
|
|
|
|
|
|
|
|
|
|||||||||
| End of period |
$ | 19,686 | $ | 17,256 | $ | 22,517 | $ | 42,052 | ||||||||
|
|
|
|
|
|
|
|
|
|||||||||
| Supplemental disclosures |
||||||||||||||||
| Cash paid for interest |
$ | 18 | $ | 13 | $ | 5 | $ | 189 | ||||||||
| Purchases under capital lease obligations |
4 | 102 | 102 | — | ||||||||||||
| Property and furniture additions in accounts payable and accrued expenses |
2,970 | 234 | 1,103 | 418 | ||||||||||||
| Leasehold improvements paid directly by lessor |
1,268 | — | — | — | ||||||||||||
| Non-cash capitalized loan fees |
— | 90 | 90 | 285 | ||||||||||||
| Deferred initial public offering cost accruals |
— | 881 | — | 288 | ||||||||||||
The accompanying notes are an integral part of these consolidated financial statements.
F-7
Table of Contents
Notes to Consolidated Financial Statements
| 1. | Description of Operations and Summary of Significant Accounting Policies |
Operations
Apptio, Inc. (the “Company”) was incorporated on October 2, 2007 and is headquartered in Bellevue, Washington. The Company develops and sells Technology Business Management, or TBM, solutions. The Company’s cloud-based platform and SaaS applications enable IT leaders to analyze, optimize and plan technology investments, and benchmark their financial and operational performance against peers. The Company operates in the United States, the United Kingdom, Germany, Denmark, the Netherlands, Australia, Canada, France and Singapore.
Certain Significant Risks and Uncertainties
The Company continues to be subject to the risks and challenges associated with other companies at a similar stage of development, including risks associated with: dependence on key personnel; successful marketing and sale of its solutions and adaptation of such solutions to changing market dynamics and customer preferences; competition from alternative products and services, including from larger companies, that have greater name recognition, longer operating histories, more and better established customer relationships and greater resources than the Company; and the ability to raise additional capital to support future growth. Since inception through June 30, 2016, the Company has incurred losses from operations, and accumulated a deficit of $183.7 million (unaudited), and has been dependent on equity and debt financing to fund operations.
Principles of Consolidation
The consolidated financial statements include the accounts of the Company and its wholly owned subsidiaries. All intercompany transactions and accounts have been eliminated.
Unaudited Pro Forma Information
Prior to the closing of the Company’s initial public offering, or IPO, the Company had one class of common stock. Upon the closing of the Company’s IPO the Company will have authorized a new class of Class A common stock and a new class of Class B common stock. All currently outstanding shares of common stock and convertible preferred stock will automatically convert into shares of the Company’s Class B common stock and warrants to purchase shares of convertible preferred stock will automatically convert into warrants to purchase shares of Class B common stock. The unaudited pro forma balance sheet information shows the effect of the conversion of the common stock and convertible preferred stock and the conversion of the preferred stock warrants as of June 30, 2016. The effect of this conversion on the pro forma balance sheet will reduce stockholders’ deficit by $134.2 million (unaudited). Additionally, the Company has calculated unaudited pro forma basic and diluted net loss per share to give effect to the convertible preferred stock and warrant impact as though such shares had been converted to common stock as of the beginning of the period.
Unaudited Interim Financial Information
The accompanying interim consolidated balance sheet as of June 30, 2016 and the consolidated interim statements of operations, of comprehensive loss and of cash flows during the six months ended June 30, 2015 and 2016 are unaudited. The unaudited interim consolidated financial statements have been prepared on a basis consistent with the annual audited consolidated
F-8
Table of Contents
Apptio, Inc. and Subsidiaries
Notes to Consolidated Financial Statements—(Continued)
financial statements and, in the opinion of management, reflect all adjustments, consisting only of normal recurring adjustments, which are considered necessary to state fairly the Company’s consolidated financial position as of June 30, 2016 and its consolidated statements of operations, of comprehensive loss, and of cash flows during the six months ended June 30, 2015 and 2016. The financial data and other financial information disclosed in these notes to the consolidated financial statements as of and for the six months ended June 30, 2015 and 2016 are also unaudited.
Accounting Principles
The consolidated financial statements and accompanying notes were prepared in accordance with accounting principles generally accepted in the United States of America, or GAAP.
Use of Estimates
The preparation of consolidated financial statements in conformity with GAAP requires management to make estimates and assumptions that affect the reported amounts of assets and liabilities and the disclosure of contingent assets and liabilities at the date of the consolidated financial statements and the reported amounts of revenue and expenses during the reporting period. Actual results could differ materially from those estimates.
Operating Segments
The Company follows the authoritative literature that establishes annual and interim reporting standards for an enterprise’s operating segments and related disclosures about its products and services, geographic regions and major customers.
The Company operates its business as one operating segment. Its chief operating decision makers, or CODMs, are its Chief Executive Officer and Chief Financial Officer. The CODMs review separate revenue information for the Company’s subscription and professional services revenue, and all other financial information presented on a consolidated basis, for purposes of making operating decisions, assessing financial performance and allocating resources.
Foreign Currency
The functional currency of the Company’s international subsidiaries is the U.S. dollar. The results of operations for the Company’s international subsidiaries are remeasured from the local currency into U.S. dollars using average exchange rates during each period. The majority of assets and liabilities are remeasured using exchange rates at the end of each period. All equity transactions and certain assets are remeasured using historical rates.
Comprehensive Loss
Certain gains and losses are recognized in comprehensive loss, but excluded from net loss. Comprehensive loss includes net loss and unrealized gains and losses on available-for-sale securities.
Cash and Cash Equivalents
The Company considers all highly liquid investments, including money market investments with an original maturity of three months or less at the date of purchase, to be cash equivalents.
F-9
Table of Contents
Apptio, Inc. and Subsidiaries
Notes to Consolidated Financial Statements—(Continued)
Investments
The Company classifies its investment securities as available-for-sale. Investment securities are stated at fair value with any unrealized gains or losses included as a component of accumulated other comprehensive income (loss) in stockholders’ deficit. Realized gains and losses and declines in value of securities judged to be other than temporary are included in interest income (expense) and other, net. The cost of investments for purposes of computing realized and unrealized gains and losses is based on the specific identification method. Investments in securities with maturities of less than one year, or where management’s intent is to use the investments to fund current operations, are classified as short-term investments. Investments with maturities of greater than one year are classified as long-term investments.
Restricted Cash
Included in long-term assets at December 31, 2014 and 2015 is restricted cash of $2.6 million and $2.5 million, respectively, for two irrevocable letters of credit in relation to office leases for the Company’s corporate headquarters in Bellevue, WA and a sales office in New York, NY. In April 2016, in connection with amending the senior credit facility, the restriction on the $2.5 million (unaudited) cash balance related to the letter of credit was removed. The letter of credit for the Bellevue headquarters was still in effect as of June 30, 2016; however, $2.5 million in cash collateral is no longer required to secure the Company’s reimbursement obligation with respect to the letter of credit. The letter of credit for the New York sales office was still in effect as of December 31, 2015; however, the restriction on the cash balance was removed during the year ended December 31, 2015. These letters of credit name the lessors as the beneficiaries, and are required to fulfill lease requirements if the Company should default on the office lease obligations.
Fair Value of Financial Instruments
At December 31, 2014 and 2015 and at June 30, 2016 (unaudited), the Company has the following financial instruments: cash equivalents, marketable securities, accounts receivable, restricted cash, accounts payable and accrued liabilities. Based on the paragraph above, the Company no longer has restricted cash at June 30, 2016.
The fair value of the Company’s accounts receivable, restricted cash, accounts payable, and certain accrued liabilities approximates their respective carrying amounts. The Company measures its cash equivalents, marketable securities, and preferred stock warrants using the fair value measurement principles under GAAP, which requires that fair value be based on the assumptions that market participants would use when pricing an asset or liability.
Fair value principles require disclosures regarding the manner in which fair value is determined for assets and liabilities and establishes a three-tiered fair value hierarchy into which these assets and liabilities must be grouped, based upon significant levels of inputs as follows:
| Level 1 | Observable inputs, such as quoted prices (unadjusted) in active markets for identical assets or liabilities at the measurement date. |
| Level 2 | Observable inputs, other than Level 1 prices, such as quoted prices in active markets for similar assets and liabilities, quoted prices in markets that are not active, or other inputs that are observable or can be corroborated by observable market data for substantially the full term of the assets or liabilities. |
F-10
Table of Contents
Apptio, Inc. and Subsidiaries
Notes to Consolidated Financial Statements—(Continued)
| Level 3 | Unobservable inputs that are supported by little or no market activity and that are significant to the fair value of the assets or liabilities. |
The lowest level of significant input determines the placement of the entire fair value measurement in the hierarchy. Management’s assessment of the significance of a particular input to the fair value measurement in its entirety requires management to make judgments and consider factors specific to the asset or liability.
Allowance for Doubtful Accounts
The Company performs initial and ongoing evaluations of its customers’ financial positions, and generally extends credit on account, without collateral. The Company determines the need for an allowance for doubtful accounts based upon various factors, including past collection experience, credit quality of the customer, age of the receivable balance, and current economic conditions.
If the financial condition of the Company’s customers were to deteriorate, resulting in an impairment of their ability to make payments, additional allowances might be required. Accounts are charged against the allowance for doubtful accounts once collection efforts are unsuccessful.
Activity within the allowance for doubtful accounts was as follows:
| December 31, | June 30, | |||||||||||
| 2014 | 2015 | 2016 | ||||||||||
| (unaudited) | ||||||||||||
| (in thousands) | ||||||||||||
| Balance at beginning of period |
$ | 288 | $ | 450 | $ | 289 | ||||||
| Charges, net of reversals |
176 | (3 | ) | 298 | ||||||||
| Write-offs |
(14 | ) | (158 | ) | (74 | ) | ||||||
|
|
|
|
|
|
|
|||||||
| Balance at end of period |
$ | 450 | $ | 289 | $ | 513 | ||||||
|
|
|
|
|
|
|
|||||||
Concentration of Credit Risk
Financial instruments that potentially subject the Company to concentrations of credit risk are primarily cash, cash equivalents, restricted cash and accounts receivable. The Company maintains its cash accounts with financial institutions where, at times, deposits exceed federal insurance limits. The Company has credit risk regarding trade accounts receivable. No individual customers represented more than 10% of accounts receivable at December 31, 2014. One customer accounted for 10.5% of accounts receivable at December 31, 2015 and one customer accounted for 10.2% of accounts receivable at June 30, 2016 (unaudited). No individual customer represented more than 10% of revenue during 2014 or 2015, or the six months ended June 30, 2015 (unaudited) and 2016 (unaudited).
Advertising
Advertising costs are charged to operations as incurred or the first time the advertising takes place, based on the nature of the advertising, and include direct marketing, events, public relations, sales collateral materials and partner programs. Advertising expenses were approximately $6.5 million and $7.5 million for the years ended December 31, 2014 and 2015, respectively, and $3.0 million (unaudited) and $2.8 million (unaudited) for the six months ended June 30, 2015 and 2016, respectively.
F-11
Table of Contents
Apptio, Inc. and Subsidiaries
Notes to Consolidated Financial Statements—(Continued)
Interest Expense
Interest expense consists of interest on capital leases and debt and fair value adjustments for preferred stock warrant liability. No interest was capitalized during 2014 or 2015 or during the six months ended June 30, 2015 (unaudited) and 2016 (unaudited).
Property and Equipment
Property and equipment are recorded at cost and depreciated over their estimated useful lives using the straight-line method and the following estimated useful lives:
| Computer and office equipment |
2-3 years | |
| Software |
1-3 years | |
| Furniture |
3 years |
Leasehold improvements are amortized over the shorter of the lease term or the estimated useful life of the related asset. Upon retirement or sale, the cost of assets disposed of, and the related accumulated depreciation, is removed from the accounts and any resulting gain or loss is reflected in the consolidated statements of operations. Repair and maintenance costs are expensed as incurred.
In 2014, the Company recorded an asset retirement obligation related to certain leased facilities and a corresponding leasehold improvement which is depreciated over the expected term of the lease. Revisions to either the timing or the amount of the original expected cash flows are recorded to the related assets and liabilities. The accrued asset retirement obligation is included in other long-term liabilities. The asset retirement obligation in total, and the period over period changes for the years ended December 31, 2014 and 2015, and for the six months ended June 30, 2015 (unaudited) and 2016 (unaudited), are immaterial to the financial statements.
Preferred Stock Warrant Liability
The Company classifies its warrants to purchase preferred stock as a liability. The Company adjusts the carrying value of the warrant liability to fair value at the end of each reporting period utilizing the Black-Scholes option pricing model. The preferred stock warrant liability is included on the Company’s balance sheets and its warrant revaluation is recorded as interest expense and is included in interest income (expense) and other, net.
Revenue Recognition
The Company derives its revenue from two sources: (1) subscription revenue, which is comprised of subscription fees from customers utilizing the Company’s applications, fees for additional support beyond the standard support that is included in the basic subscription fees, which are referred to as premium support offerings, and fees for subscription based online training offerings; and (2) professional services, which consist of fees associated with the implementation and configuration of the Company’s applications, as well as fees for in-person training and TBM Council conference registration and sponsorship fees. Implementation and configuration services primarily consist of consultative services, such as data mapping and establishing best practices. Implementation and configuration services do not result in any significant customization or modification of the software platform or user interface. The Company presents revenue from each of these sources separately in its consolidated statements of operations.
F-12
Table of Contents
Apptio, Inc. and Subsidiaries
Notes to Consolidated Financial Statements—(Continued)
The Company recognizes revenue when all of the following conditions are met: (1) there is persuasive evidence of an arrangement; (2) the service has been provided to the customer; (3) the collection of related fees is reasonably assured; and (4) the amount of fees to be paid by the customer is fixed or determinable. If collection is not reasonably assured, the Company defers the revenue recognition until collectability becomes reasonably assured. In addition, in instances where final acceptance of non-standard service deliverables are required before revenue is recognized, revenue and the associated costs are deferred until all acceptance criteria have been met. The Company’s arrangements do not contain general rights of return.
The Company enters into arrangements with multiple deliverables that primarily include subscription and professional services, but may also include premium support, online training and in-person training. The professional services are not considered essential to the functionality of the software. To qualify as a separate unit of accounting, the delivered item must have value to the customer on a stand-alone basis. The Company believes its subscription offerings and its professional services offerings have stand-alone value. The Company’s subscriptions have stand-alone value because such services are often sold separately from other professional services. The Company’s professional services have stand-alone value because those services may be sold separately by other vendors and there are trained third-party consultants capable of performing the professional services. Deliverables that are accounted for separately consist of software subscription, professional services, training, premium support and online training.
When arrangements involve multiple elements that qualify as separate units of accounting, the Company allocates revenue to each deliverable in a multiple-deliverable arrangement based upon its relative selling price. The estimated selling price for each element is based upon the following hierarchy, in order of priority: (1) vender-specific objective evidence, or VSOE, of selling price, if available; (2) third-party evidence, or TPE, of selling price, if VSOE of selling price is not available; or (3) best estimate of selling price, or BESP, if neither VSOE of selling price nor TPE of selling price is available.
The Company determines VSOE of selling price based on historical stand-alone sales to customers. In determining VSOE, the Company requires that a substantial majority of the selling prices for its subscription or professional services fall within a reasonably narrow pricing range of the applicable median selling price. The Company has not yet been able to establish VSOE for its subscription and professional services because it has not historically priced its service offerings within a sufficiently narrow range. When VSOE cannot be established, the Company applies judgment with respect to whether it can establish a selling price based on TPE. TPE is determined based on third-party prices for similar deliverables when sold separately. Generally, the Company’s pricing strategy differs from that of its peers and its services and solutions contain a significant level of differentiation such that the comparable pricing of other offerings with similar functionality cannot be obtained. Furthermore, the Company is unable to reliably determine what similar competitor services’ selling prices are on a stand-alone basis. As a result, the Company uses BESP as the selling price for its services.
The Company estimates BESP for subscriptions, premium support and online training based on the historical amounts for such deliverables on a stand-alone basis. The BESP for professional services is based on the historical average rate per hour charged, and BESP for in-person training is based on historical amounts on a per-seat basis.
The Company recognizes revenue for subscription fees from customers utilizing its applications ratably over the subscription term, which are typically one to three years. The Company’s subscription arrangements generally do not allow the customer the contractual right to take possession
F-13
Table of Contents
Apptio, Inc. and Subsidiaries
Notes to Consolidated Financial Statements—(Continued)
of the software; as such, the arrangements are considered to be service contracts. In those limited situations where the customer takes possession of the software, the Company follows the guidance in Accounting Standards Codification, or ASC, 985, Software Revenue Recognition. Fees for premium support offerings and subscription-based online training are generally one-year agreements billed upfront, and are recognized ratably over the term of the support or training agreement. The Company’s premium support offerings include all of the Company’s standard incident support services, with enhanced response times, dedicated support resources, access to architecture and configuration experts and other services not included with standard support. The Company’s subscription-based online training provides self-directed training for customers via access to recorded training sessions.
Professional services revenue consists of fees associated with application configuration, integration, change management, education and training services, and conference registration and sponsorship fees. The Company’s professional services engagements are priced either on a time and-materials basis or on a fixed-fee basis. The duration of the Company’s professional services engagements varies based on the scope of services requested, but typically ranges between three and six months. For time-and-materials arrangements, the Company recognizes revenue as hours are worked. For fixed-fee arrangements, the Company recognizes professional services revenue as delivered using the percentage of completion, or POC, method measured on an hours incurred basis. Under the POC method of accounting, revenue and expenses are recognized as work is performed based on the relationship between actual hours incurred and total estimated hours at the completion of the project. Changes to the original estimates may be required during the life of the project. Estimates of both hours and costs to complete a project are reviewed periodically and the effect of any change in the estimated hours to complete a project is reflected as an adjustment to revenue in the period the change becomes known.
If current estimated costs to complete a project exceed the revenue allocated to the project, a loss equal to the amount of estimated excess costs will be recognized in the period the change becomes known. The use of the POC method of accounting involves considerable use of estimates in determining revenue, costs and profits and in assigning the amounts to accounting periods. Associated out-of-pocket travel expenses related to the delivery of professional services are typically reimbursed by the customer. Out-of-pocket expense reimbursements are recognized as revenue and cost of service expense.
Fees for in-person training are billed in advance of the training and are recognized in the period the training occurs. Conference registration and sponsorship fees are for TBM Council conferences and related TBM Council activities. Registration fees for TBM Council conferences are billed in advance of the conference and are recognized in the period the conference occurs. TBM Council sponsorship fees are paid in advance and are recognized in the period the sponsorship activities occur, or ratably over the contractual period if the sponsorship entails ongoing activities beyond a single event.
On occasion, the Company sells its subscriptions through third-party resellers. These arrangements typically call for the reseller to retain a portion of the price to the customer as compensation. Since the Company is typically responsible for the acceptability of the services purchased by the customer, the Company is the primary obligor in the transaction and, therefore, records revenue on a gross basis based on the amount billed to the customer. Reseller fees are recognized as sales and marketing expense as incurred.
F-14
Table of Contents
Apptio, Inc. and Subsidiaries
Notes to Consolidated Financial Statements—(Continued)
Deferred revenue represents the unearned revenue on cash receipts or accounts receivable for the sale of subscriptions and for professional services for which services have not yet been provided. The substantial majority of deferred revenue relates to subscription revenue.
Research and Development
Research and development costs are expensed as incurred and primarily include payroll, employee benefits, consulting services, stock-based compensation expense and other headcount-related costs associated with product development and depreciation of equipment used in research and development.
Capitalized Software Costs
For development costs related to the Company’s software solutions and internal use software, qualifying internally developed software costs, including payroll and stock-based compensation costs, incurred during the application development stage are capitalized and recorded in property and equipment, net. Costs related to preliminary project activities and post-implementation activities are expensed as incurred. The Company capitalized $448,000, $774,000, $371,000 (unaudited) and $253,000 (unaudited), for software development costs during the year ended December 31, 2014 and 2015 and the six months ended June 30, 2015 and 2016 respectively. Stock-based compensation costs included in capitalized software costs were $25,000, $38,000, $23,000 (unaudited) and $20,000 (unaudited), for 2014 and 2015 and the six months ended June 30, 2015 and 2016 respectively. The Company recorded amortization expense of $21,000, $398,000, $116,000 (unaudited) and $174,000 (unaudited) for 2014 and 2015 and for the six months ended June 30, 2015 and 2016, respectively.
Cost Allocation
The Company allocates certain overhead and information technology operating costs between cost of goods sold, research and development, sales and marketing, and general and administration expense based upon the number of employees in the related departments.
Sales Commissions
The Company pays sales commissions to employees shortly after executing customer agreements related to initial sales and subsequent renewals of all subscriptions and related services. Sales commission obligations are accrued to sales and marketing at the time of the initial sale for the full amount of the contract.
Income Taxes
The Company follows the asset and liability method of accounting for income taxes. This method requires recognition of deferred tax assets and liabilities for the expected future tax consequences of temporary differences between the carrying amounts and the tax basis of assets and liabilities. A valuation allowance has been established for the full amount of the net deferred tax assets as the Company has determined that the future realization of the tax benefit is not more likely than not.
The Company recognizes the tax benefit from uncertain tax positions only if it is more likely than not that the tax position will be sustained on examination by the tax authorities, based on the
F-15
Table of Contents
Apptio, Inc. and Subsidiaries
Notes to Consolidated Financial Statements—(Continued)
technical merits of the position. The tax benefit is measured based on the largest benefit that is more likely than not of being realized upon ultimate settlement. The Company recognizes interest and penalties on amounts due to taxing authorities as a component of income tax expense.
The Company’s quarterly income tax provision and its corresponding annual effective tax rate are based on expected income, statutory tax rates and tax planning opportunities available in the various jurisdictions in which the Company operates. For interim financial reporting, the Company estimates the annual effective tax rate based on projected taxable income for the full year and records a quarterly tax provision in accordance with the expected annual effective tax rate. As the year progresses, the Company refines the estimates of the year’s taxable income as new information becomes available, including year-to-date financial results. This continual estimation process may result in a change to the Company’s expected annual effective tax rate for the year. When this occurs, the Company adjusts the income tax provision during the quarter in which the change in estimate occurs so that the year-to-date income tax provision reflects the expected annual effective tax rate. Significant judgment is required in determining the Company’s annual effective tax rate and in evaluating the Company’s tax positions.
Stock-Based Compensation
The Company recognizes expense related to the fair value of stock-based compensation. Compensation cost recognized for 2014 and 2015 and for the six months ended June 30, 2015 and 2016 includes costs for all share-based compensation arrangements based on the grant-date fair value and is recognized using the straight-line attribution method.
The Company’s stock price volatility and expected option life involve management’s best estimates, both of which impact the fair value of the option calculated under the Black-Scholes option pricing model and, ultimately, the expense that will be recognized over the life of the option. The Company is required to recognize compensation expense for only the portion of options expected to vest. Therefore, management applies an estimated forfeiture rate that is derived from historical employee termination behavior. If the actual number of forfeitures differs from these estimates, additional adjustments to compensation expense may be required.
Recently Adopted Accounting Pronouncements
In April 2015, the Financial Accounting Standards Board, or FASB, issued Accounting Standards Update, or ASU, 2015-03, Interest – Imputation of Interest, requiring entities to present debt issuance costs related to a debt liability as a reduction of the carrying amount of the liability. In August 2015, the FASB issued ASU 2015-15, Interest – Imputation of Interest: Presentation and Subsequent Measurement of Debt Issuance Costs Associated with Line-of-Credit Arrangements, to provide additional guidance pertaining to debt issuance costs related to line-of-credit arrangements. The guidance is effective for public entities for fiscal years and interim periods beginning after December 15, 2015. For all other entities, the guidance is effective for fiscal years beginning after December 15, 2015, and interim periods within fiscal years beginning after December 15, 2016. Early adoption is permitted. The Company early adopted this standard in the first quarter of 2016. The adoption of this guidance did not have a material impact on the Company’s financial statements.
In April 2015, the FASB issued ASU 2015-05, Customer’s Accounting for Fees Paid in a Cloud Computing Arrangement. The new standard provides guidance to customers about whether a cloud computing arrangement includes a software license. If a cloud computing arrangement includes a software license, the customer should account for the software license element of the arrangement
F-16
Table of Contents
Apptio, Inc. and Subsidiaries
Notes to Consolidated Financial Statements—(Continued)
consistent with the acquisition of other software licenses. If a cloud computing arrangement does not include a software license, the customer should account for the arrangement as a service contract. The new standard does not change the accounting for a customer’s accounting for service contracts. The new standard is effective for public entities for interim and annual reporting periods beginning after December 15, 2015. For all other entities, the new standard is effective for annual periods beginning after December 15, 2015, and interim periods within annual periods beginning after December 15, 2016. Early adoption is permitted. The Company early adopted this standard in the first quarter of 2016. The adoption of this new standard did not have a material impact on the Company’s financial statements.
In November 2015, the FASB issued ASU 2015-17, Balance Sheet Classification of Deferred Taxes, which requires deferred tax assets and liabilities, along with related valuation allowances, to be classified as non-current on the balance sheet. For public entities, the new standard is effective for fiscal years beginning after December 15, 2016, with early adoption permitted. For all other entities, the new standard is effective for fiscal years beginning after December 15, 2017, and interim periods within annual periods beginning after December 15, 2018. The Company early adopted this new standard retrospectively in the fourth quarter of 2015. The adoption of this new standard did not have a material impact on the Company’s financial statements.
New Accounting Pronouncements Not Yet Adopted
In March 2016, the FASB issued ASU 2016-09, Stock Compensation (Topic 718): Improvements to Employee Share-Based Payment Accounting, which simplifies several aspects of the accounting for employee share-based payment transactions, including the accounting for income taxes, forfeitures, and statutory tax withholding requirements, as well as classification in the statement of cash flows. For public entities, ASU 2016-09 is effective for fiscal years beginning after December 15, 2016, including interim periods within those fiscal years. For all other entities, the guidance is effective for fiscal years beginning after December 15, 2017, and interim periods within those annual periods beginning after December 15, 2018. The Company is currently evaluating the impact this guidance will have on the Company’s financial statements.
In February 2016, the FASB issued ASU 2016-02, Leases (Topic 842). The objective of the update is to improve financial reporting by increasing transparency and comparability among organizations by recognizing lease assets and lease liabilities on the balance sheet and disclosing key information about leasing arrangements. For public entities, the new standard is effective for interim and annual reporting periods beginning after December 15, 2018. For all other entities, the new standard is effective for annual reporting periods beginning after December 15, 2019, and for interim periods within those annual periods beginning after December 15, 2020. Early application of the amendments is permitted for all entities. The Company is currently evaluating the impact this guidance will have on the Company’s financial statements.
In May 2014, the FASB issued ASU 2014-09, Revenue from Contracts with Customers (Topic 606), outlining a single comprehensive model for entities to use in accounting for revenue arising from contracts with customers that supersedes most current revenue recognition guidance. This guidance requires an entity to recognize revenue when it transfers promised goods or services to customers in an amount that reflects the consideration to which the entity expects to be entitled in exchange for those goods or services. Additionally, this guidance expands related disclosure requirements. In August 2015, the FASB issued ASU 2015-14, Revenue from Contracts with Customers (Topic 606): Deferral of the Effective date, which delayed the effective date of ASU No. 2014-09 by one year and is allowing earlier adoption; however, entities reporting under GAAP are not permitted to adopt the standard earlier than the original effective date for public entities. For public
F-17
Table of Contents
Apptio, Inc. and Subsidiaries
Notes to Consolidated Financial Statements—(Continued)
entities, the new standard is effective for annual periods and interim periods within those annual periods, beginning after December 15, 2017. For all other entities, the new standard is effective for annual periods beginning after December 15, 2018, and interim periods within those annual periods beginning after December 15, 2019. The new standard will require full or modified retrospective application. In March 2016, the FASB issued ASU 2016-08, Revenue from Contracts with Customers (Topic 606): Principal versus Agent Considerations (Reporting Revenue Gross versus Net), which is intended to improve the operability and understandability of the implementation guidance on principal versus agent considerations. The effective date for ASU 2016-08 is the same as the effective date for ASU 2014-09. In April 2016, the FASB issued ASU 2016-10, Revenue from Contracts with Customers (Topic 606): Identifying Performance Obligations and Licensing, which clarifies the implementation guidance on identifying performance obligations and licensing. The effective date for ASU 2016-10 is the same as the effective date for ASU 2014-09. In May 2016, the FASB issued ASU 2016-12, Revenue from Contracts with Customers (Topic 606): Narrow-Scope Improvements and Practical Expedients, which clarifies the implementation guidance on collectability, noncash consideration, presentation of sales tax and transition. The Company is currently evaluating the impact this guidance will have on the Company’s financial statements as well as the expected adoption method and timing.
In August 2014, the FASB issued ASU No. 2014-15, Presentation of Financial Statements – Going Concern (Subtopic 205-40), related to the disclosures around going concern. The new standard provides guidance around management’s responsibility to evaluate whether there is substantial doubt about an entity’s ability to continue as a going concern and to provide related footnote disclosures. The new standard is effective for fiscal years beginning after December 15, 2016, with early adoption permitted. The adoption of this standard is not expected to have a material impact on the Company’s financial statements.
| 2. | Fair Value Measurements |
The following tables present information about the Company’s financial assets and liabilities that have been measured at fair value as of December 31, 2014 and 2015 and June 30, 2016 (unaudited), and indicates the fair value hierarchy of the valuation inputs utilized to determine such fair value:
| Fair Value Measurement at December 31, 2014 | ||||||||||||||||
| Level 1 | Level 2 | Level 3 | Total | |||||||||||||
| (in thousands) | ||||||||||||||||
| Money market funds |
$ | 10,722 | $ | — | $ | — | $ | 10,722 | ||||||||
| Corporate notes and obligations |
— | 8,187 | — | 8,187 | ||||||||||||
| U.S. agency securities |
— | 11,286 | — | 11,286 | ||||||||||||
| U.S. government treasury securities |
1,000 | — | — | 1,000 | ||||||||||||
| Preferred stock warrant liability |
— | — | (357 | ) | (357 | ) | ||||||||||
|
|
|
|
|
|
|
|
|
|||||||||
| $ | 11,722 | $ | 19,473 | $ | (357 | ) | $ | 30,838 | ||||||||
|
|
|
|
|
|
|
|
|
|||||||||
| Fair Value Measurement at December 31, 2015 | ||||||||||||||||
| Level 1 | Level 2 | Level 3 | Total | |||||||||||||
| (in thousands) | ||||||||||||||||
| Money market funds |
$ | 8,015 | $ | — | $ | — | $ | 8,015 | ||||||||
| Corporate notes and obligations |
— | 2,245 | — | 2,245 | ||||||||||||
| U.S. agency securities |
— | 3,015 | — | 3,015 | ||||||||||||
| U.S. government treasury securities |
1,000 | — | — | 1,000 | ||||||||||||
| Preferred stock warrant liability |
— | — | (414 | ) | (414 | ) | ||||||||||
|
|
|
|
|
|
|
|
|
|||||||||
| $ | 9,015 | $ | 5,260 | $ | (414 | ) | $ | 13,861 | ||||||||
|
|
|
|
|
|
|
|
|
|||||||||
F-18
Table of Contents
Apptio, Inc. and Subsidiaries
Notes to Consolidated Financial Statements—(Continued)
| Fair Value Measurement at June 30, 2016 | ||||||||||||||||
| Level 1 | Level 2 | Level 3 | Total | |||||||||||||
| (unaudited) | ||||||||||||||||
| (in thousands) | ||||||||||||||||
| Money market funds |
$ | 28,322 | $ | — | $ | — | $ | 28,322 | ||||||||
| Preferred stock warrant liability |
— | — | (406 | ) | (406 | ) | ||||||||||
|
|
|
|
|
|
|
|
|
|||||||||
| $ | 28,322 | $ | — | $ | (406 | ) | $ | 27,916 | ||||||||
|
|
|
|
|
|
|
|
|
|||||||||
At December 31, 2014 and 2015 and June 30, 2016 (unaudited), the Company utilized the market approach to value its money market mutual funds and U.S. government treasury securities using Level 1 valuation inputs because published net asset values were readily available. The Company’s Level 2 marketable securities are valued using the market approach based on broker or dealer quotations, actual trade data, recent observable transaction information for similar securities, benchmark yields or alternative pricing sources with reasonable levels of price transparency, and include the Company’s investments in U.S. government agency securities and corporate notes and obligations.
The Company’s preferred stock warrants are categorized as Level 3 because they were valued based on unobservable inputs and management’s judgment due to the absence of quoted mark prices, inherent lack of liquidity and the long-term nature of such financial instruments. The Company engages a third party to perform a fair value assessment of the preferred stock warrant inputs on a quarterly basis using a hybrid allocation methodology. The following allocation methodologies are used: the Black-Scholes option pricing model, the Probability-Weighted Expected Return Method, or PWERM, and secondary transactions. In determining the inputs, the results of the various allocation methodologies are weighted based on multiple factors, including management’s expectations on various exit outcomes and the similarities between the Company and its comparable companies in areas such as overall business model, level of revenue, market share, maturity of business and other metrics. The assumptions used in the hybrid allocation methodology are inherently subjective and involve significant judgment. Any change in fair value is recognized as interest expense and is included in interest (expense) income and other, net in the consolidated statements of operations.
The following table presents a reconciliation of the preferred stock warrant liability measured at fair value using significant unobservable inputs (in thousands):
| Balance as of December 31, 2014 |
$ | 357 | ||
| Increases in fair value of underlying warrant securities |
57 | |||
|
|
|
|||
| Balance as of December 31, 2015 |
414 | |||
| Decreases in fair value of underlying warrant securities (unaudited) |
(8 | ) | ||
|
|
|
|||
| Balance as of June 30, 2016 (unaudited) |
$ | 406 | ||
|
|
|
F-19
Table of Contents
Apptio, Inc. and Subsidiaries
Notes to Consolidated Financial Statements—(Continued)
| 3. | Investments |
Available-for-sale investments consist of fixed-income securities that are accounted for at fair value. Premiums and discounts paid on securities at the time of purchase are recorded as accrued interest and amortized over the period of maturity. At June 30, 2016, the Company did not hold any available-for-sale investments. The amortized cost and fair value on the available-for-sale investments and unrealized gains and losses as of December 31, 2014 and 2015 were as follows:
| As of December 31, 2014 | ||||||||||||||||
| Amortized Cost | Gross Unrealized Gains |
Gross Unrealized Losses |
Fair Value | |||||||||||||
| (in thousands) | ||||||||||||||||
| Amounts maturing in one year or less: |
||||||||||||||||
| Corporate notes and obligations |
$ | 6,643 | $ | — | $ | — | $ | 6,643 | ||||||||
| U.S. agency securities |
8,209 | 5 | (1 | ) | 8,213 | |||||||||||
|
|
|
|
|
|
|
|
|
|||||||||
| Total short-term available-for-sale debt securities |
$ | 14,852 | $ | 5 | $ | (1 | ) | $ | 14,856 | |||||||
|
|
|
|
|
|
|
|
|
|||||||||
| Amounts maturing in greater than one year: |
||||||||||||||||
| Corporate notes and obligations |
$ | 1,546 | $ | — | $ | (2 | ) | $ | 1,544 | |||||||
| U.S. agency securities |
3,074 | — | (1 | ) | 3,073 | |||||||||||
| U.S. government treasury securities |
999 | 1 | — | 1,000 | ||||||||||||
|
|
|
|
|
|
|
|
|
|||||||||
| Total long-term available-for-sale debt securities |
$ | 5,619 | $ | 1 | $ | (3 | ) | $ | 5,617 | |||||||
|
|
|
|
|
|
|
|
|
|||||||||
| As of December 31, 2015 | ||||||||||||||||
| Amortized Cost | Gross Unrealized Gains |
Gross Unrealized Losses |
Fair Value | |||||||||||||
| (in thousands) | ||||||||||||||||
| Amounts maturing in one year or less: |
||||||||||||||||
| Corporate notes and obligations |
$ | 2,245 | $ | — | $ | — | $ | 2,245 | ||||||||
| U.S. agency securities |
3,016 | — | (1 | ) | 3,015 | |||||||||||
| U.S. government treasury securities |
999 | 1 | — | 1,000 | ||||||||||||
|
|
|
|
|
|
|
|
|
|||||||||
| Total short-term available-for-sale debt securities |
$ | 6,260 | $ | 1 | $ | (1 | ) | $ | 6,260 | |||||||
|
|
|
|
|
|
|
|
|
|||||||||
As of December 31, 2014 and 2015, the Company did not consider any of the unrealized losses on its investments to be other-than-temporarily impaired based on its evaluation of available evidence. None of the investments held as of December 31, 2014 and 2015 have been in a continuous unrealized loss position for more than 12 months. Realized gains and losses on sales of available for-sale securities were immaterial for both periods presented.
F-20
Table of Contents
Apptio, Inc. and Subsidiaries
Notes to Consolidated Financial Statements—(Continued)
| 4. | Property and Equipment |
A summary of property and equipment is as follows:
| December 31, | June 30, | |||||||||||
| 2014 | 2015 | 2016 | ||||||||||
| (unaudited) | ||||||||||||
| (in thousands) | ||||||||||||
| Computer and office equipment |
$ | 16,155 | $ | 14,253 | $ | 15,262 | ||||||
| Software |
1,540 | 2,485 | 2,710 | |||||||||
| Furniture |
1,240 | 1,278 | 1,265 | |||||||||
| Leasehold improvements |
7,855 | 8,245 | 8,214 | |||||||||
|
|
|
|
|
|
|
|||||||
| 26,790 | 26,261 | 27,451 | ||||||||||
| Less: Accumulated depreciation and amortization |
(11,958 | ) | (12,774 | ) | (14,474 | ) | ||||||
|
|
|
|
|
|
|
|||||||
| Property and equipment, net |
$ | 14,832 | $ | 13,487 | $ | 12,977 | ||||||
|
|
|
|
|
|
|
|||||||
Depreciation and amortization expense related to property and equipment was $5.2 million and $6.5 million for 2014 and 2015, respectively, and $3.2 million (unaudited) and $3.0 million (unaudited) for the six months ended June 30, 2015 and 2016, respectively. During 2015 and the six months ended June 30, 2016, the Company retired $5.5 million and $1.2 million (unaudited) of fully depreciated property and equipment, respectively. Property and equipment includes $212,000, $260,000 and $260,000 (unaudited) of capital leases at December 31, 2014 and 2015 and June 30, 2016, respectively. Accumulated depreciation of these leased assets was $128,000, $137,000 and $156,000 (unaudited) at December 31, 2014 and 2015 and June 30, 2016, respectively. These leased assets are included in the computer and office equipment category in the table above.
The Company has an asset retirement obligation related to certain leased facilities. The accrued asset retirement obligation at December 31, 2014 and 2015 and June 30, 2016 was $220,000, $210,000 and $190,000 (unaudited), respectively.
| 5. | Warrants |
The Company issued a warrant to purchase 27,321 shares of Series A convertible preferred stock in conjunction with a loan and security agreement with Silicon Valley Bank in 2008. The warrant has a 10-year term and an exercise price of $1.37255 per share. The loan and security agreement expired in March 2010. The total value of the warrant at issuance was $29,000, determined using the Black-Scholes option pricing model. The fair value at December 31, 2014 and 2015 and at June 30, 2016 was $357,000, $414,000 and $406,000 (unaudited), respectively. This warrant is subject to remeasurement at each reporting period. The warrant expires on October 31, 2018.
In connection with entering into a new senior credit facility, as described in Note 12, in June 2015, the Company issued a warrant to purchase 10,722 shares of common stock. The warrant has a 10 year term and an exercise price of $13.99 per share. The total value of the warrants at issuance was $90,000 determined using the Black-Scholes option pricing model. The warrants were recorded as additional paid-in capital and capitalized as debt issuance costs on the balance sheet. On January 27, 2016, the Company incurred $10 million principal amount of term borrowings under the senior credit facility. Pursuant to the terms of the warrant, the number of shares issuable upon exercise of this warrant was automatically adjusted as a result of the borrowings, such that the holder of the warrant shall have the right to purchase an additional 10,722 shares of common stock at the same $13.99 per
F-21
Table of Contents
Apptio, Inc. and Subsidiaries
Notes to Consolidated Financial Statements—(Continued)
share exercise price. The total value of the additional 10,722 shares available under the warrant was $83,000 (unaudited) determined using the Black-Scholes option pricing model. The warrants were recorded as additional paid-in capital and as a reduction to long-term debt on the balance sheet.
In April 2016, in connection with amending the senior credit facility, the Company issued to the lender a warrant to purchase 5,241 shares (unaudited) of common stock. The warrant has a ten-year term and an exercise price of $14.31 per share. In addition, in connection with entering into the subordinated loan agreement, the Company issued warrants to purchase an aggregate of 21,208 shares (unaudited) of common stock. The warrants have an exercise price of $14.31 per share and a ten-year term. Pursuant to the terms of the warrants, if the Company incurs any additional borrowings under the subordinated term loan, the number of shares issuable upon exercise of the warrants will automatically be adjusted such that the holders shall have the right to purchase up to an aggregate of 42,215 shares at the same $14.31 exercise price. The total value of the additional 26,449 shares available under the warrants was $202,000 (unaudited) determined using the Black-Scholes option pricing model. The warrants were recorded as additional paid-in capital and as a reduction to long-term debt on the balance sheet.
| 6. | Stockholders’ Equity |
Common Stock
At December 31, 2014 and 2015, the Company was authorized to issue 43,000,000 shares of common stock, with a par value of $0.0001 per share. In May 2016, the Company’s board of directors approved an increase in the number of authorized shares of common stock from 43,000,000 to 44,100,000 (unaudited).
Preferred Stock
Preferred stock is issuable in one or more series, each with such designations, rights, qualifications, limitations, and restrictions as set forth in the Company’s certificate of incorporation.
The following table summarizes the issuances for each series of preferred stock and the number authorized as of December 31, 2014 and 2015 (in thousands, except share and per share amounts):
| Share Series |
Date of Issuance | Authorized Shares |
Issued Shares |
Price per Share |
Aggregate Issuance Price and Liquidation Preference |
Carrying Amount |
||||||||||||||||||
| (in thousands, except per share amounts) | ||||||||||||||||||||||||
| Series A |
November 8, 2007 | 5,155 | 5,100 | $ | 1.37255 | $ | 7,000 | $ | 6,928 | |||||||||||||||
| Series B |
August 12, 2009 | 5,153 | 5,153 | $ | 2.71686 | 14,000 | 13,935 | |||||||||||||||||
| Series C |
August 20, 2010 | 2,651 | 2,651 | $ | 6.22480 | 16,500 | 16,399 | |||||||||||||||||
| Series C |
November 3, 2010 | 562 | 562 | $ | 6.22480 | 3,500 | 3,478 | |||||||||||||||||
| Series D |
March 9, 2012 | 2,900 | 2,791 | $ | 17.91690 | 50,000 | 48,828 | |||||||||||||||||
| Series E |
May 2, 2013 | 2,010 | 1,983 | $ | 22.69460 | 45,000 | 44,241 | |||||||||||||||||
|
|
|
|
|
|
|
|
|
|||||||||||||||||
| 18,431 | 18,240 | $ | 136,000 | $ | 133,809 | |||||||||||||||||||
|
|
|
|
|
|
|
|
|
|||||||||||||||||
F-22
Table of Contents
Apptio, Inc. and Subsidiaries
Notes to Consolidated Financial Statements—(Continued)
All shares of preferred stock were issued with a par value of $0.0001 per share. The terms of the Series A, B, C, D and E convertible preferred stock are summarized below:
Conversion. Each share of preferred stock is convertible at the option of the holder into such number of common stock as is determined by dividing the original issue price of the applicable series of preferred stock by the conversion price for the applicable series of preferred stock in effect at the time of the conversion. Pursuant to the terms of the Company’s certificate of incorporation, each share of outstanding preferred stock will automatically be converted into shares of common stock at the then applicable conversion rate upon the closing of an initial public offering of shares of the Company’s common stock that results in aggregate net proceeds to the Company of not less than $50 million. Each share of preferred stock is currently convertible into one share of common stock, and the conversion price of each series of preferred stock is subject to certain price based antidilution adjustments and adjustment for stock splits, stock dividends and similar transactions.
Liquidation Preference. In the event of a voluntary or involuntary liquidation, dissolution, change of control or winding up of the Company, the holders of convertible preferred stock will be entitled to receive, prior and in preference to any distribution of any of the assets of the Company to the holders of common stock, an amount per share equal to the applicable original issue price (as adjusted for stock splits, stock dividends, reclassifications and the like) for each share of convertible preferred stock held by them, plus declared but unpaid dividends on each such share. Due to these liquidation preferences, the convertible preferred stock has been presented as convertible preferred stock within the mezzanine section in the consolidated balance sheets.
Redemption. The convertible preferred stock is not redeemable at any future certain date.
Voting. The holder of each share of convertible preferred stock has the right to one vote for each full share of common stock into which its respective shares of preferred stock would be convertible on the record date for the vote.
Dividends. The holders of convertible preferred stock are entitled to receive dividends out of any assets legally available, prior and in preference to any declaration or payment of any dividends to holders of common stock. Dividends are payable when declared by the board of directors without cumulative preferences for convertible preferred stock at the rate of 8% of the applicable original issue price.
| 7. | Equity Incentive Plans |
2007 Stock Plan
On October 11, 2007, the Company adopted its 2007 stock plan, as amended, or the 2007 Plan, which provides for the issuance of incentive and nonqualified options to purchase up to 11.4 million shares of common stock to employees, directors, officers and consultants of the Company.
The term of each option issued under the 2007 Plan shall be no more than 10 years. The options generally vest over a four-year period. As of December 31, 2014 and 2015 and June 30, 2016, there were 563,054, 705,088 and 551,548 (unaudited) shares available for issuance under the 2007 Plan, respectively.
F-23
Table of Contents
Apptio, Inc. and Subsidiaries
Notes to Consolidated Financial Statements—(Continued)
2011 Executive Equity Incentive Plan
On December 20, 2011, the Company adopted its 2011 executive equity incentive plan as amended, or the 2011 Plan, which provides for the issuance of incentive and nonqualified options to purchase up to 4.4 million shares of common stock to directors and officers as defined in the 2011 Plan document.
The term of each option issued under the 2011 Plan shall be no more than 10 years. The options generally vest over a four-year period. As of December 31, 2014 and 2015 and June 30, 2016, there were 320,179, 7,295 and 222,920 (unaudited) shares available for issuance under the 2011 Plan, respectively.
The following table summarizes stock option activity for the 2007 and 2011 Plans:
| Options Outstanding |
Weighted- Average Exercise Price per Share |
Weighted- Average Remaining Contractual Life (years) |
Total Intrinsic Value |
|||||||||||||
| (in thousands, except per share and weighted-average figures) | ||||||||||||||||
| Outstanding at December 31, 2014 |
8,803 | $ | 6.38 | |||||||||||||
| Options granted |
3,193 | 14.06 | ||||||||||||||
| Options exercised |
(587 | ) | 4.55 | |||||||||||||
| Options forfeited or canceled |
(903 | ) | 9.89 | |||||||||||||
|
|
|
|||||||||||||||
| Outstanding at December 31, 2015 |
10,506 | $ | 8.51 | 7.49 | $ | 60,911 | ||||||||||
|
|
|
|||||||||||||||
| Options granted (unaudited) |
1,655 | $ | 14.31 | |||||||||||||
| Options exercised (unaudited) |
(149 | ) | 3.42 | |||||||||||||
| Options forfeited or canceled (unaudited) |
(617 | ) | 11.15 | |||||||||||||
|
|
|
|||||||||||||||
| Outstanding at June 30, 2016 (unaudited) |
11,395 | $ | 9.28 | 7.39 | $ | 57,333 | ||||||||||
|
|
|
|||||||||||||||
| Vested and expected to vest - December 31, 2015 |
9,793 | $ | 8.25 | 7.39 | $ | 59,331 | ||||||||||
| Exercisable - December 31, 2015 |
5,800 | $ | 5.29 | 6.27 | $ | 52,303 | ||||||||||
The weighted-average grant date fair value per share of options granted during 2014 and 2015 and the six months ended June 30, 2015 and 2016 was $5.73, $6.05, $6.18 (unaudited) and $5.64 (unaudited), respectively. The total fair value of shares vested during 2014 and 2015 and the six months ended June 30, 2015 and 2016 was $5.1 million, $7.6 million, $4.1 million (unaudited) and $4.4 million (unaudited), respectively.
The total intrinsic value of options exercised during 2014 and 2015 and the six months ended June 30, 2015 and 2016 was $5.7 million, $5.4 million, $2.6 million (unaudited) and $1.6 million (unaudited), respectively. During 2014 and 2015 and the six months ended June 30, 2015 and 2016, the Company received $1.4 million, $2.7 million, $1.7 million (unaudited) and $0.5 million (unaudited) respectively, from exercises of stock options. Shares are issued from plan reserves upon exercise.
F-24
Table of Contents
Apptio, Inc. and Subsidiaries
Notes to Consolidated Financial Statements—(Continued)
The fair value of stock options granted was estimated on the date of grant using the Black-Scholes option pricing model with the following assumptions:
| Year Ended December 31, | Six Months Ended June 30, | |||||||
| 2014 | 2015 | 2015 | 2016 | |||||
| (unaudited) | ||||||||
| Dividend yield |
0.0% | 0.0% | 0.0% | 0.0% | ||||
| Risk-free interest rate |
1.7%-2.2% | 1.3%-2.0% | 1.3%-1.9% | 1.1%-1.5% | ||||
| Expected life |
5.6-9.6 | 5.0-6.1 | 5.0-6.1 | 5.9-6.1 | ||||
| Expected volatility |
46.9%-51.3% | 38.9%-47.0% | 44.2%-47.0% | 38.7%-39.0% | ||||
The weighted-average volatility used in the fair value calculations of option grants for 2014 and 2015 and the six months ended June 30, 2015 and 2016 was 50.5%, 42.7%, 45.5% (unaudited) and 38.8% (unaudited), respectively.
The Company has not declared or paid any dividends. The risk-free interest rate used in the Black-Scholes option pricing model is based on the implied yield available at the time of the option grant in U.S. Treasury securities at maturity with a term equivalent to the expected life of the option. Expected volatility is based on an average volatility of stock prices for a group of publicly traded companies with similar software product offerings. The expected life of options represents the period that the stock-based awards are expected to be outstanding. Consideration was given to the contractual terms of the stock-based awards, vesting schedules and expectations of future employee behavior. Given the absence of an active market for the Company’s common stock, the Company’s board of directors was required to estimate the fair value of the Company’s common stock at the time of each option grant based on several factors, including consideration of input from management and contemporaneous third-party valuations. These valuations include consideration of enterprise value and assessment of other common and convertible preferred stock transactions occurring during the period.
Stock-based compensation expense recognized in the Company’s statement of comprehensive loss was as follows:
| Year Ended December 31, | Six Months Ended June 30, |
|||||||||||||||
| 2014 | 2015 | 2015 | 2016 | |||||||||||||
| (unaudited) | ||||||||||||||||
| (in thousands) | ||||||||||||||||
| Cost of revenue |
||||||||||||||||
| Subscription |
$ | 220 | $ | 482 | $ | 196 | $ | 332 | ||||||||
| Professional services |
609 | 738 | 395 | 367 | ||||||||||||
| Research and development |
1,465 | 2,283 | 1,160 | 1,267 | ||||||||||||
| Sales and marketing |
2,006 | 2,477 | 1,210 | 1,441 | ||||||||||||
| General and administrative |
1,466 | 1,835 | 894 | 1,008 | ||||||||||||
|
|
|
|
|
|
|
|
|
|||||||||
| Total stock-based compensation |
$ | 5,766 | $ | 7,815 | $ | 3,855 | $ | 4,415 | ||||||||
|
|
|
|
|
|
|
|
|
|||||||||
As of December 31, 2015 and June 30, 2016, there was a total of $22.9 million and $24.0 million (unaudited), respectively, of unrecognized compensation cost related to unvested stock-based compensation arrangements granted under the 2007 and 2011 Plans. That cost is expected to be recognized over a weighted-average remaining expected term of 3.38 years and 3.19 years (unaudited) as of December 31, 2015 and June 30, 2016, respectively. Included in unrecognized
F-25
Table of Contents
Apptio, Inc. and Subsidiaries
Notes to Consolidated Financial Statements—(Continued)
compensation costs at December 31, 2015 are $6.6 million in stock options granted during 2015 with performance-based conditions and either a three- or four-year requisite service period. Performance-based conditions are considered met upon a successful initial public offering, after which time compensation expense will be recognized over the remaining requisite service period. In May 2016, the Company modified a portion of these grants such that they are no longer subject to the performance-based conditions and therefore, compensation expense is now being recognized prospectively over the remaining requisite service period. The remaining grants remain subject to the performance-based conditions as described above. Included in unrecognized compensation costs at June 30, 2016 are $2.9 million (unaudited) in stock options granted during 2015 with performance-based conditions.
| 8. | Net Loss per Share Attributable to Common Stockholders |
The Company calculates basic and diluted net loss per share attributable to common stockholders in conformity with the two-class method required for companies with participating securities. The Company considers all series of convertible preferred stock to be participating securities. Under the two-class method, the net loss attributable to common stockholders is not allocated to the convertible preferred stock as the holders of convertible preferred stock do not have a contractual obligation to share in losses.
The diluted net loss per share attributable to common stockholders is computed by giving effect to all potential dilutive common stock equivalents outstanding for the period. For purposes of this calculation, convertible preferred stock, options to purchase common stock and warrants to purchase common stock and convertible preferred stock are considered common stock equivalents but have been excluded from the calculation of diluted net loss per share attributable to common stockholders as their effect is antidilutive. Basic and diluted net loss per share was the same for each period presented, as the inclusion of all potential common shares outstanding would have been antidilutive.
The following table sets forth the computation of basic and diluted net loss per share:
| Year Ended December 31, | Six Months Ended June 30, |
|||||||||||||||
| 2014 | 2015 | 2015 | 2016 | |||||||||||||
| (unaudited) | ||||||||||||||||
| (in thousands, except per share amounts) | ||||||||||||||||
| Numerator: |
||||||||||||||||
| Net loss attributable to common stockholders |
$ | (32,872 | ) | $ | (41,007 | ) | $ | (18,406 | ) | $ | (14,881 | ) | ||||
|
|
|
|
|
|
|
|
|
|||||||||
| Denominator: |
||||||||||||||||
| Weighted-average common shares outstanding-basic |
12,080 | 12,653 | 12,485 | 13,016 | ||||||||||||
| Dilutive effect of share equivalents resulting from stock options, common stock warrant, convertible preferred stock warrant and convertible preferred shares (as converted) |
— | — | — | — | ||||||||||||
|
|
|
|
|
|
|
|
|
|||||||||
| Weighted-average common shares outstanding—diluted |
12,080 | 12,653 | 12,485 | 13,016 | ||||||||||||
|
|
|
|
|
|
|
|
|
|||||||||
| Net loss per common share, basic and diluted |
$ | (2.72 | ) | $ | (3.24 | ) | $ | (1.47 | ) | $ | (1.14 | ) | ||||
|
|
|
|
|
|
|
|
|
|||||||||
F-26
Table of Contents
Apptio, Inc. and Subsidiaries
Notes to Consolidated Financial Statements—(Continued)
The following weighted-average outstanding shares of common stock equivalents were excluded from the computation of diluted net loss per share attributable to common stockholders for the periods presented because the impact of including them would have been antidilutive:
| Year Ended December 31, | Six Months Ended June 30, |
|||||||||||||||
| 2014 | 2015 | 2015 | 2016 | |||||||||||||
| (unaudited) | ||||||||||||||||
| (in thousands) |
||||||||||||||||
| Options to purchase common shares |
8,283 | 9,294 | 8,963 | 10,515 | ||||||||||||
| Common stock warrant |
— | 6 | 1 | 30 | ||||||||||||
| Convertible preferred shares (as converted) |
18,240 | 18,240 | 18,240 | 18,240 | ||||||||||||
| Preferred stock warrant |
27 | 27 | 27 | 27 | ||||||||||||
|
|
|
|
|
|
|
|
|
|||||||||
| 26,550 | 27,567 | 27,231 | 28,812 | |||||||||||||
|
|
|
|
|
|
|
|
|
|||||||||
Unaudited Pro Forma Net Loss per Share Attributable to Common Stockholders
Upon closing of the proposed IPO, all shares of convertible preferred stock will automatically convert into 18,239,475 shares of common stock. The unaudited pro forma net loss per common share, basic and diluted, 2015 has been computed to give effect to the convertible preferred stock as if such shares had been converted to common stock as of the beginning of the period.
A reconciliation of the numerator and denominator used in the calculation of unaudited pro forma basic and diluted loss per share is as follows:
| Year Ended December 31, 2015 |
Six Months Ended June 30, 2016 |
|||||||
| (unaudited) |
||||||||
| (in thousands, except per |
||||||||
| Numerator: |
||||||||
| Net loss attributable to common stockholders |
$ | (41,007 | ) | $ | (14,881 | ) | ||
| Remeasurement of convertible preferred stock warrant liability |
57 | (8 | ) | |||||
|
|
|
|
|
|||||
| Net loss attributable to common stockholders pro forma |
$ | (40,950 | ) | $ | (14,889 | ) | ||
|
|
|
|
|
|||||
| Denominator: |
||||||||
| Weighted-average common shares outstanding-basic |
12,653 | 13,016 | ||||||
| Pro forma adjustment for assumed conversion of convertible preferred stock to common stock upon the closing of the proposed IPO |
18,240 | 18,240 | ||||||
| Dilutive effect of share equivalents resulting from stock options and common stock warrants |
— | — | ||||||
|
|
|
|
|
|||||
| Weighted-average common shares outstanding - diluted |
30,893 | 31,256 | ||||||
|
|
|
|
|
|||||
| Net loss per common share, basic and diluted |
$ | (1.33 | ) | $ | (0.48 | ) | ||
|
|
|
|
|
|||||
F-27
Table of Contents
Apptio, Inc. and Subsidiaries
Notes to Consolidated Financial Statements—(Continued)
| 9. | Income Taxes |
The components of loss before provision for income taxes were as follows:
| Year Ended December 31, | ||||||||
| 2014 | 2015 | |||||||
| (in thousands) | ||||||||
| United States |
$ | (33,155 | ) | $ | (40,805 | ) | ||
| Foreign |
539 | (93 | ) | |||||
|
|
|
|
|
|||||
| Total |
$ | (32,616 | ) | $ | (40,898 | ) | ||
|
|
|
|
|
|||||
The components of the provision for income taxes were as follows:
| Year Ended December 31, | ||||||||
| 2014 | 2015 | |||||||
| (in thousands) | ||||||||
| Current: |
||||||||
| Federal |
$ | — | $ | — | ||||
| State |
— | 21 | ||||||
| Foreign |
256 | 88 | ||||||
|
|
|
|
|
|||||
| Total |
$ | 256 | $ | 109 | ||||
|
|
|
|
|
|||||
| Deferred: |
||||||||
| Federal |
— | — | ||||||
| State |
— | — | ||||||
| Foreign |
— | — | ||||||
| Total |
— | — | ||||||
|
|
|
|
|
|||||
| Provision for income taxes |
$ | 256 | $ | 109 | ||||
|
|
|
|
|
|||||
The items accounting for the difference between income taxes computed at the federal statutory income tax rate of 34% and the provision for income taxes consisted of the following:
| Year Ended December 31, | ||||||||
| 2014 | 2015 | |||||||
| (in thousands) | ||||||||
| Income tax benefit at statutory rate |
$ | (11,089 | ) | $ | (13,832 | ) | ||
| State taxes, net of federal benefit |
10 | 14 | ||||||
| Impact of foreign income taxes |
73 | 119 | ||||||
| Stock based compensation |
1,043 | 1,629 | ||||||
| Change in valuation allowance |
10,434 | 12,673 | ||||||
| Research and development credits |
(408 | ) | (674 | ) | ||||
| Other |
193 | 180 | ||||||
|
|
|
|
|
|||||
| Provision for income taxes |
$ | 256 | $ | 109 | ||||
|
|
|
|
|
|||||
At December 31, 2015, the Company has U.S. net operating loss carryforwards of $145.8 million, which may be used to offset future taxable income. The carryforwards expire in years ranging from 2027 through 2034. Carryforwards of net operating losses are subject to possible limitation should a change in ownership of the Company occur, as defined by Internal Revenue Code Section 382.
F-28
Table of Contents
Apptio, Inc. and Subsidiaries
Notes to Consolidated Financial Statements—(Continued)
Approximately $3.1 million of net operating loss carryforwards relate to tax deductible stock-based compensation in excess of amounts recognized for financial statement purposes. To the extent that net operating loss carryforwards, if realized, relate to excess stock-based compensation, the resulting tax benefits will be recorded to stockholders’ deficit, rather than to results of operations.
The Company’s net deferred tax assets consisted of the following at December 31, 2014 and 2015:
| Year Ended December 31, | ||||||||
| Deferred tax assets (liabilities) | 2014 | 2015 | ||||||
| (in thousands) | ||||||||
| Deferred tax assets: |
||||||||
| Net operating loss carryforwards |
$ | 39,361 | $ | 52,145 | ||||
| Deferred revenue |
450 | 80 | ||||||
| Tax credits |
1,392 | 2,065 | ||||||
| Accrued payroll |
842 | 1,071 | ||||||
| Accrued expenses not currently deductible |
2,051 | 2,171 | ||||||
| Non-qualified stock options |
1,511 | 1,716 | ||||||
| Other |
166 | 128 | ||||||
|
|
|
|
|
|||||
| Gross deferred tax assets |
45,773 | 59,376 | ||||||
| Valuation allowance |
(45,011 | ) | (58,542 | ) | ||||
|
|
|
|
|
|||||
| Total deferred tax assets, net of valuation allowance |
762 | 834 | ||||||
| Deferred tax liabilities: |
||||||||
| Depreciation and amortization |
(762 | ) | (399 | ) | ||||
| Unrealized foreign currency gain/loss |
— | (435 | ) | |||||
|
|
|
|
|
|||||
| Total deferred tax liabilities |
(762 | ) | (834 | ) | ||||
|
|
|
|
|
|||||
| Net deferred tax assets |
$ | — | $ | — | ||||
|
|
|
|
|
|||||
The Company has established a full valuation allowance equal to the net deferred tax asset balance due to the uncertainty of future realization of the net deferred tax assets.
The valuation allowance as of December 31, 2014 and 2015 is primarily related to net operating losses. The net change in the total valuation allowance was an increase of $10.7 million and $13.5 million for 2014 and 2015, respectively.
The calculation of the Company’s tax obligations involves dealing with uncertainties in the application of complex tax laws and regulations. ASC 740, Income Taxes, provides that a tax benefit from an uncertain tax position may be recognized when it is more likely than not that the position will be sustained upon examination, including resolutions of any related appeals or litigation processes, on the basis of the technical merits. The Company has assessed its income tax positions and recorded tax benefits for all years subject to examination, based upon its evaluation of the facts, circumstances and information available at each period end. For those tax positions where the Company has determined there is a greater than 50% likelihood that a tax benefit will be sustained, the Company has recorded the largest amount of tax benefit that may potentially be realized upon ultimate settlement with a taxing authority that has full knowledge of all relevant information. For those income tax positions where it is determined there is less than 50% likelihood that a tax benefit will be sustained, no tax benefit has been recognized.
F-29
Table of Contents
Apptio, Inc. and Subsidiaries
Notes to Consolidated Financial Statements—(Continued)
Although the Company believes that it has adequately reserved for its uncertain tax positions, it can provide no assurance that the final tax outcome of these matters will not be materially different. As the Company expands internationally, it will face increased complexity, and its unrecognized tax benefits may increase in the future. The Company makes adjustments to its reserves when facts and circumstances change, such as the closing of a tax audit or the refinement of an estimate. To the extent that the final tax outcome of these matters is different than the amounts recorded, such differences will affect the provision for income taxes in the period in which such determination is made.
The total balance of unrecognized gross tax benefits was as follows:
| Year Ended December 31, | ||||||||
| 2014 | 2015 | |||||||
| (in thousands) |
||||||||
| Unrecognized tax benefits at beginning of year |
$ | 255 | $ | 1,391 | ||||
| Additions for tax positions in prior years |
408 | — | ||||||
| Additions for tax positions in the current year |
728 | 674 | ||||||
|
|
|
|
|
|||||
| Unrecognized tax benefits at end of year |
$ | 1,391 | $ | 2,065 | ||||
|
|
|
|
|
|||||
The Company files income tax returns in the U.S. federal jurisdiction, various state jurisdictions, and internationally in the United Kingdom, Germany, Denmark, Netherlands, Canada and Australia. As of December 31, 2014 and 2015, there is no accrued interest or penalties associated with income taxes recorded in the consolidated financial statements. The 2009 through 2015 tax years are open to review by taxing authorities.
| 10. | Segments |
As previously discussed in Note 1 – Operating Segments, the Company operates in one operating segment.
Revenue
The following table sets forth the Company’s total revenue by geographic areas for 2014 and 2015 and for the six months ended June 30, 2015 and 2016 (unaudited), as determined based on the billing address of the customer:
| Year Ended December 31, | Six Months Ended June 30, |
|||||||||||||||
| 2014 | 2015 | 2015 | 2016 | |||||||||||||
| (unaudited) | ||||||||||||||||
| (in thousands) | ||||||||||||||||
| North America |
$ | 86,565 | $ | 101,192 | $ | 48,778 | $ | 57,400 | ||||||||
| Europe |
16,077 | 22,296 | 10,377 | 15,193 | ||||||||||||
| APAC |
3,973 | 5,763 | 3,000 | 3,029 | ||||||||||||
|
|
|
|
|
|
|
|
|
|||||||||
| $ | 106,615 | $ | 129,251 | $ | 62,155 | $ | 75,622 | |||||||||
|
|
|
|
|
|
|
|
|
|||||||||
Revenue attributed to the United States was approximately 98% of North America revenue for the year ended December 31, 2014 and the six months ended June 30, 2015 (unaudited), respectively, and 99% for the year ended December 31, 2015 and the six months ended June 30, 2016 (unaudited), respectively.
F-30
Table of Contents
Apptio, Inc. and Subsidiaries
Notes to Consolidated Financial Statements—(Continued)
Long-lived Assets
The following table sets forth the Company’s long-lived assets, net of accumulated depreciation, by geographic areas as of December 31, 2014 and 2015 and June 30, 2016 (unaudited):
| December 31, | June 30, | |||||||||||
| 2014 | 2015 | 2016 | ||||||||||
| (unaudited) | ||||||||||||
| (in thousands) | ||||||||||||
| North America |
$ | 13,167 | $ | 11,353 | $ | 11,069 | ||||||
| Europe |
950 | 1,435 | 1,356 | |||||||||
| APAC |
715 | 699 | 552 | |||||||||
|
|
|
|
|
|
|
|||||||
| $ | 14,832 | $ | 13,487 | $ | 12,977 | |||||||
|
|
|
|
|
|
|
|||||||
| 11. | Commitments and Contingencies |
Leases
The Company has entered into non-cancellable operating leases, primarily related to rental of office space and certain office equipment. Certain lease agreements include rent payment escalation clauses and free rent (rent holidays). In addition, certain leases entered into in 2014 included approximately $1.3 million in landlord incentives paid directly to contractors by the landlord for construction of leasehold improvements, which are deemed property of the landlord at the termination of the lease. Such amounts are recorded in property and equipment and a corresponding deferred rent liability. The total amount of base rentals over the term of the leases is charged to expense using the straight-line method with the amount of the rental expense in excess of lease payments recorded as a deferred rent liability. Total rent expense for operating leases for 2014 and 2015, and for the six months ended June 30, 2015 and 2016, was $2.8 million, $3.5 million, $1.8 million (unaudited) and $1.8 million (unaudited), respectively.
In 2014, the Company amended its primary office space lease by adding an additional 18,000 square feet and extending the lease term to January 31, 2023. In May 2016, the Company amended its primary office space lease by adding an additional 9,000 square feet (unaudited).
The Company also finances the purchase of certain office equipment under capital lease arrangements.
Other Commitments
The Company has entered into certain other non-cancellable agreements for software and marketing services.
F-31
Table of Contents
Apptio, Inc. and Subsidiaries
Notes to Consolidated Financial Statements—(Continued)
Future minimum payments under non-cancellable operating and capital lease agreements and other non-cancellable agreements as of December 31, 2015 were as follows:
| Years Ending December 31, |
Operating Leases |
Capital Leases |
Other Obligations |
|||||||||
| (in thousands) | ||||||||||||
| 2016 |
$ | 4,171 | $ | 47 | $ | 985 | ||||||
| 2017 |
3,856 | 47 | 236 | |||||||||
| 2018 |
3,856 | 26 | — | |||||||||
| 2019 |
3,885 | 22 | — | |||||||||
| 2020 |
3,120 | 6 | — | |||||||||
| Thereafter |
6,726 | — | — | |||||||||
|
|
|
|
|
|
|
|||||||
| Total Minimum Lease Payments |
$ | 25,614 | $ | 148 | $ | 1,221 | ||||||
|
|
|
|
|
|
|
|||||||
| Less amounts representing interest |
(11 | ) | ||||||||||
|
|
|
|||||||||||
| Present value of capital lease obligations |
137 | |||||||||||
| Less: Current portion |
$ | (42 | ) | |||||||||
|
|
|
|||||||||||
| Long-term portion of capital lease obligations |
$ | 95 | ||||||||||
|
|
|
|||||||||||
Future minimum payments under non-cancellable operating and capital lease agreements and other non-cancellable agreements as of June 30, 2016 (unaudited) were as follows:
| Years Ending December 31, |
Operating Leases |
Capital Leases |
Other Obligations |
|||||||||
| (in thousands) | ||||||||||||
| Remainder of 2016 |
2,249 | 23 | 295 | |||||||||
| 2017 |
4,254 | 46 | 253 | |||||||||
| 2018 |
4,249 | 24 | — | |||||||||
| 2019 |
4,268 | 22 | — | |||||||||
| 2020 |
3,485 | 6 | — | |||||||||
| Thereafter |
7,515 | — | — | |||||||||
|
|
|
|
|
|
|
|||||||
| Total Minimum Lease Payments |
$ | 26,020 | $ | 121 | $ | 548 | ||||||
|
|
|
|
|
|
|
|||||||
| Less amounts representing interest |
(7 | ) | ||||||||||
|
|
|
|||||||||||
| Present value of capital lease obligations |
114 | |||||||||||
| Less: Current portion |
$ | (42 | ) | |||||||||
|
|
|
|||||||||||
| Long-term portion of capital lease obligations |
$ | 72 | ||||||||||
|
|
|
|||||||||||
Legal Matters
From time to time, the Company has become involved in claims and other legal matters arising in the ordinary course of business. The Company investigates these claims as they arise. Although claims are inherently unpredictable, the Company is currently not aware of any matters that may have a material adverse effect on the Company’s business, financial position, results of operations or cash flows, individually or in the aggregate.
The Company accrues estimates for resolution of legal and other contingencies when losses are probable and estimable. From time to time, the Company is a party to litigation and subject to claims incident to the ordinary course of business, including intellectual property claims, labor and employment claims, and threatened claims, breach of contract claims, and other matters.
F-32
Table of Contents
Apptio, Inc. and Subsidiaries
Notes to Consolidated Financial Statements—(Continued)
Although the results of litigation and claims are inherently unpredictable, the Company believes that there was not at least a reasonable possibility that it had incurred a material loss with respect to such loss contingencies, as of December 31, 2014 and 2015 and June 30, 2016 (unaudited), therefore, the Company has not recorded a reserve for any material contingencies.
| 12. | Credit Facilities |
Senior Credit Facility
On June 16, 2015, the Company entered into a revolving credit agreement, the senior credit facility, with Silicon Valley Bank, or SVB, which consists of up to $10 million aggregate principal amount of term loan borrowings and up to $15 million aggregate principal amount of revolver borrowings. No amounts were outstanding under the senior credit facility at December 31, 2015. In January 2016, the Company borrowed $10 million against the term loan. On April 20, 2016, the Company amended the senior credit facility with SVB and entered into a new subordinated loan and security Agreement, or subordinated loan agreement, with SVB and ORIX Ventures, LLC, or ORIX (unaudited).
Interest on the term loan borrowings under the senior credit facility is determined at the time of borrowing and accrues at a floating rate equal to the prime rate plus 1.25%. Prior to the amendment, term loan borrowings were required to be made by April 30, 2016, the term loan matured on April 1, 2019, and the Company was required to pay only interest on outstanding term loan borrowings on a monthly basis through April 30, 2016. The April 2016 amendment extended the maturity dates of the term loan and the revolver as well as the interest only period on the term loan by 12 months. The term loan now matures on April 20, 2020. Following the expiration of the interest only payment period, the Company is required to pay principal and interest in 36 equal monthly payments. The Company can also incur revolver borrowings based on a borrowing base tied to the amount of eligible accounts receivable, not to exceed $15.0 million. Interest on the revolver borrowings accrues at a floating rate equal to the prime rate and is payable monthly. The revolver matures on June 16, 2017. No amounts were outstanding under the revolver at June 30, 2016 (unaudited). In addition, the amendment released the restriction on $2.5 million (unaudited) previously held to secure a letter of credit related to an office lease for the Company’s Bellevue headquarters office.
In connection with obtaining the senior credit facility, the Company incurred $78,000 of loan fees which were recorded as debt issuance costs and are being amortized over the term of the facility. The Company also issued a warrant to SVB to purchase 10,722 shares of the Company’s common stock. The warrant has a 10-year term and an exercise price of $13.99 per share. The value of the warrant was $90,000, determined using the Black-Scholes option pricing model, and was recorded as additional paid-in capital and as debt issuance costs. At June 30, 2016, there was a remaining balance of $64,000 (unaudited) of unamortized debt issuance costs related to these warrants and other deferred issuance costs.
As a result of the term loan borrowings under the senior credit facility in January 2016, the number of shares issuable upon exercise of the warrant that was issued to SVB was automatically adjusted such that the holder of the warrant shall have the right to purchase an additional 10,722 shares of the Company’s common stock at the same $13.99 per share exercise price. The value of the additional 10,722 shares available under the warrant was $83,000 (unaudited), determined using the Black-Scholes option pricing model, and was recorded as additional paid-in capital and reported on the
F-33
Table of Contents
Apptio, Inc. and Subsidiaries
Notes to Consolidated Financial Statements—(Continued)
balance sheet as a direct reduction from the face amount of the term borrowings and will be amortized over the term of the senior credit facility. At June 30, 2016, there was a remaining balance of $74,000 (unaudited) of unamortized debt issuance costs related to these warrants.
In connection with the amendment, the Company incurred $8,000 in loan fees and issued a warrant to purchase 5,241 shares (unaudited) of common stock. The warrant has a ten-year life and an exercise price of $14.31 per share. The value of the warrant was $41,000 (unaudited), determined using the Black-Scholes option pricing model, and was recorded as additional paid-in capital and reported on the balance sheet as a direct reduction to long-term debt and will be amortized over the term of the credit agreement. At June 30, 2016, there was a remaining balance of $48,000 (unaudited) of unamortized debt issuance costs related to these warrants and other deferred issuance costs.
Subordinated Loan and Security Agreement
The subordinated loan agreement provides for an additional $20.0 million of term loan borrowings. Interest on the subordinated term loan accrues at a fixed rate of 9.5% per year. Through the maturity of the subordinated term loans, the Company is required to pay only interest on outstanding subordinated term loans on a monthly basis. The full principal amount is due at maturity on April 20, 2019. Upon closing the subordinated loan agreement, the Company was required to incur $10.0 million of subordinated term loan borrowings. In addition, the subordinated loan agreement requires a 1% per year fee, measured quarterly for the initial 12 months, on the average undrawn portion of the subordinated term loans. In connection with entering into the subordinated loan agreement, the Company incurred $228,000 (unaudited) of loan fees which were recorded as debt issuance costs and are being amortized over the term of the subordinated loan agreement. In addition, the Company issued warrants to purchase 10,604 shares (unaudited) of common stock to both SVB and ORIX, or an aggregate of 21,208 shares. The warrants have a ten-year life and an exercise price of $14.31 per share. The value of the warrants was $161,000 (unaudited) determined using the Black-Scholes option pricing model, and was recorded as additional paid-in capital and reported on the balance sheet as a direct reduction from long-term debt and will be amortized over the term of the subordinated loan agreement. Pursuant to the terms of the warrants, if the Company incurs any additional borrowings under the subordinated term loan agreement, the number of shares issuable upon exercise of the warrants will automatically be adjusted such that the holders shall have the right to purchase up to an aggregate of 42,215 shares at the same exercise price of $14.31 per share. At June 30, 2016, there was a remaining balance of $367,000 (unaudited) of unamortized debt issuance costs related to these warrants and other deferred issuance costs.
The senior credit facility and subordinated loan agreement contains customary conditions to borrowing, events of default and covenants, including covenants that restrict our ability to dispose of assets, merge with or acquire other entities, incur indebtedness, incur encumbrances, make distributions to holders of our capital stock, make investments or engage in transactions with our affiliates. If the Company’s cash and cash equivalents, as defined in the senior credit facility, are below $25 million as of the last day of the applicable monthly measuring period, the Company will be required to comply with a financial covenant based on subscription and professional services bookings. This financial covenant is measured both monthly and quarterly, generally on a trailing six month basis. The Company was in compliance with all covenants as of June 30, 2016 (unaudited). The Company’s obligations under the senior credit facility and subordinated loan agreement are secured by substantially all of the assets of the Company other than intellectual property.
F-34
Table of Contents
Apptio, Inc. and Subsidiaries
Notes to Consolidated Financial Statements—(Continued)
2013 Credit Facility
On March 8, 2013, the Company entered into a revolving credit agreement with SVB, the 2013 credit facility, which included a revolving line of credit in the principal amount of up to $10 million for cash advances. There were no minimum principal payment requirements under the terms of this facility so long as the Company remained in compliance with the terms of the facility. The 2013 credit facility for cash advances expired on March 31, 2015 and was replaced by the senior credit facility noted above. At June 30, 2016, there was a remaining balance of $15,000 (unaudited) of unamortized debt issuance costs related to the 2013 credit facility.
Outstanding long-term debt at June 30, 2016 (unaudited) consisted of the following (in thousands):
| Principal | Current portion of long-term debt, net |
Long-term debt, net |
||||||||||
| Senior credit facility term loan, prime rate plus 1.25%, due |
$ | 10,000 | $ | 556 | $ | 9,444 | ||||||
| Subordinated loan agreement, 9.5%, due April 20, 2019 |
10,000 | — | 10,000 | |||||||||
| Unamortized debt issuance costs |
(568 | ) | (9 | ) | (559 | ) | ||||||
|
|
|
|
|
|
|
|||||||
| $ | 19,432 | $ | 547 | $ | 18,885 | |||||||
|
|
|
|
|
|
|
|||||||
As of June 30, 2016, $20.0 million (unaudited) of term loan borrowings, excluding unamortized debt issuance costs of $568,000 (unaudited), were outstanding. Scheduled principal payments as of June 30, 2016 were as follows (in thousands) (unaudited):
| 2016 |
$ | — | ||
| 2017 |
2,222 | |||
| 2018 |
3,333 | |||
| 2019 |
13,334 | |||
| 2020 |
1,111 | |||
|
|
|
|||
| $ | 20,000 | |||
|
|
|
| 13. | Subsequent Events |
The Company has evaluated subsequent events through February 16, 2016, which is the date the annual audited consolidated financial statements were issued.
| 14. | Subsequent Events (unaudited) |
The Company has evaluated subsequent events from July 1, 2016 through August 3, 2016, the date the unaudited interim financial statements were issued.
On July 26, 2016, August 18 and September 6, 2016, the Company granted stock options to its employees to purchase an aggregate of 235,200 shares, 90,500 shares and 82,500 shares, respectively, of the Company’s common stock at an exercise price of $14.31 per share.
F-35
Table of Contents

Table of Contents
Table of Contents
PART II
INFORMATION NOT REQUIRED IN THE PROSPECTUS
| Item 13. | Other Expenses of Issuance and Distribution. |
Estimated expenses, other than underwriting discounts and commissions, payable by the registrant in connection with the sale of the common stock being registered under this registration statement are as follows:
| SEC registration fee |
$ | 10,423 | ||
| FINRA filing fee |
16,025 | |||
| Exchange listing fee |
150,000 | |||
| Printing and engraving expenses |
350,000 | |||
| Legal fees and expenses |
1,650,000 | |||
| Accounting fees and expenses |
764,000 | |||
| Transfer agent and registrar fees and expenses |
5,000 | |||
| Miscellaneous |
354,552 | |||
|
|
|
|||
| Total |
$ | 3,300,000 | ||
|
|
|
| Item 14. | Indemnification of Directors and Officers. |
Section 145 of the Delaware General Corporation Law empowers a corporation to indemnify its directors and officers and to purchase insurance with respect to liability arising out of their capacity or status as directors and officers, provided that the person acted in good faith and in a manner the person reasonably believed to be in its best interests, and, with respect to any criminal action, had no reasonable cause to believe the person’s actions were unlawful. The Delaware General Corporation Law further provides that the indemnification permitted thereunder shall not be deemed exclusive of any other rights to which the directors and officers may be entitled under the corporation’s bylaws, any agreement, a vote of stockholders or otherwise. The certificate of incorporation of the registrant provides for the indemnification of the registrant’s directors and officers to the fullest extent permitted under the Delaware General Corporation Law. In addition, the bylaws of the registrant require the registrant to fully indemnify any person who was or is a party or is threatened to be made a party to any threatened, pending or completed action, suit or proceeding (whether civil, criminal, administrative or investigative) by reason of the fact that such person is or was a director, or officer of the registrant, or is or was a director or officer of the registrant serving at the registrant’s request as a director, officer, employee or agent of another corporation, partnership, joint venture, trust or other enterprise, against expenses (including attorney’s fees), judgments, fines and amounts paid in settlement actually and reasonably incurred by such person in connection with such action, suit or proceeding, to the fullest extent permitted by applicable law.
Section 102(b)(7) of the Delaware General Corporation Law permits a corporation to provide in its certificate of incorporation that a director of the corporation shall not be personally liable to the corporation or its stockholders for monetary damages for breach of fiduciary duty as a director, except (1) for any breach of the director’s duty of loyalty to the corporation or its stockholders, (2) for acts or omissions not in good faith or which involve intentional misconduct or a knowing violation of law, (3) for payments of unlawful dividends or unlawful stock repurchases or redemptions or (4) for any transaction from which the director derived an improper personal benefit. The registrant’s certificate of incorporation provides that the registrant’s directors shall not be personally liable to it or its stockholders for monetary damages for breach of fiduciary duty as a director and that if the Delaware
II-1
Table of Contents
General Corporation Law is amended to authorize corporate action further eliminating or limiting the personal liability of directors, then the liability of the registrant’s directors shall be eliminated or limited to the fullest extent permitted by the Delaware General Corporation Law, as so amended.
Section 174 of the Delaware General Corporation Law provides, among other things, that a director who willfully or negligently approves of an unlawful payment of dividends or an unlawful stock purchase or redemption may be held liable for such actions. A director who was either absent when the unlawful actions were approved, or dissented at the time, may avoid liability by causing his or her dissent to such actions to be entered in the books containing minutes of the meetings of the board of directors at the time such action occurred or immediately after such absent director receives notice of the unlawful acts.
As permitted by the Delaware General Corporation Law, the registrant has entered into separate indemnification agreements with each of the registrant’s directors and certain of the registrant’s officers which require the registrant, among other things, to indemnify them against certain liabilities which may arise by reason of their status as directors, officers or certain other employees.
The registrant expects to obtain and maintain insurance policies under which its directors and officers are insured, within the limits and subject to the limitations of those policies, against certain expenses in connection with the defense of, and certain liabilities which might be imposed as a result of, actions, suits or proceedings to which they are parties by reason of being or having been directors or officers. The coverage provided by these policies may apply whether or not the registrant would have the power to indemnify such person against such liability under the provisions of the Delaware General Corporation Law.
These indemnification provisions and the indemnification agreements entered into between the registrant and the registrant’s officers and directors may be sufficiently broad to permit indemnification of the registrant’s officers and directors for liabilities (including reimbursement of expenses incurred) arising under the Securities Act of 1933.
The underwriting agreement between the registrant and the underwriters filed as Exhibit 1.1 to this registration statement provides for the indemnification by the underwriters of the registrant’s directors and officers and certain controlling persons against specified liabilities, including liabilities under the Securities Act with respect to information provided by the underwriters specifically for inclusion in the registration statement.
| Item 15. | Recent Sales of Unregistered Securities. |
The following list sets forth information regarding all unregistered securities sold by us in the past three years. No underwriters were involved in the sales and the certificates representing the securities sold and issued contain legends restricting transfer of the securities without registration under the Securities Act or an applicable exemption from registration.
| (a) | From June 2013 to date, we have granted stock options under our 2007 Stock Plan to purchase an aggregate of 6,375,371 shares of Class B common stock with exercise prices ranging between $8.95 and $14.31 per share to service providers. |
| (b) | From June 2013 to date, 1,466,028 shares of Class B common stock were issued upon exercise of options granted pursuant to the 2007 Stock Plan with exercise prices ranging between $0.14 and $13.99 per share. |
| (c) | From June 2013 to date, we have granted stock options under our 2011 Executive Equity Incentive Plan to purchase an aggregate of 3,569,127 shares of Class B common stock with exercise prices ranging between $8.95 and $14.31 per share to service providers. |
II-2
Table of Contents
| (d) | From June 2013 to date, 267,196 shares of Class B common stock were issued upon exercise of options granted pursuant to the 2011 Executive Equity Incentive Plan with exercise prices ranging between $2.39 and $9.01 per share. |
| (e) | In March 2014, we granted a non plan stock option to purchase 3,937 shares of Class B common stock with an exercise price of $10.16 per share to a service provider. |
| (f) | In June 2015, we issued a warrant to a lender for the purchase of an aggregate of 21,444 shares of Class B common stock at an exercise price of $13.99 per share as consideration for entering into the senior credit facility. |
| (g) | In April 2016, we issued warrants to lenders for the purchase of a total of 5,241 and 21,208 shares of Class B common stock at an exercise price of $14.31 per share as consideration for amending the senior credit facility, and entering into the subordinated loan and security agreement, respectively. Pursuant to the terms of the warrants for the subordinated loan and security agreement, if we incur any additional borrowings under the subordinated term loan, the number of shares issuable upon exercise of such warrants will automatically be adjusted such that the holders shall have the right to purchase up to an aggregate of 42,215 shares at the same $14.31 exercise price. |
The offers, sales and issuances of the securities described in Items 15(a) and 15(b) were exempt from registration under the Securities Act under Rule 701 in that the transactions were made pursuant to compensatory benefit plans and contracts relating to compensation as provided under Rule 701. The recipients of such securities were the registrant’s employees, consultants or directors and received the securities under the registrant’s 2007 Stock Plan. The recipients of securities in each of these transactions represented their intention to acquire the securities for investment only and not with view to or for sale in connection with any distribution thereof and appropriate legends were affixed to the securities issued in these transactions.
The offers, sales, and issuances of the securities described in Items 15(c) through 15(g) were exempt from registration under the Securities Act under Section 4(a)(2) of the Securities Act or Regulation D promulgated thereunder as transactions by an issuer not involving a public offering. The recipients of securities in each of these transactions acquired the securities for investment only and not with a view to or for sale in connection with any distribution thereof and appropriate legends were affixed to the securities issued in these transactions. Each of the recipients of securities in these transactions was an accredited investor and had adequate access, through employment, business or other relationships, to information about the registrant.
| Item 16. | Exhibits and Financial Statement Schedules. |
(a) Exhibits.
| Exhibit |
Description | |
| 1.1† | Form of Underwriting Agreement | |
| 3.1 | Form of Amended and Restated Certificate of Incorporation | |
| 3.2 | Form of Amended and Restated Bylaws | |
| 4.1† | Form of Specimen Stock Certificate | |
| 4.2† | Amended and Restated Investors’ Rights Agreement, dated May 3, 2013, by and among the registrant and the investors and founders named therein | |
| 4.2A† | Amendment to the Amended and Restated Investors’ Rights Agreement October 11, 2013 | |
| 5.1 | Opinion of Wilson Sonsini Goodrich & Rosati, Professional Corporation |
II-3
Table of Contents
| Exhibit |
Description | |
| 10.1† | Amended and Restated Loan and Security Agreement, dated June 16, 2015, by and between the registrant and Silicon Valley Bank | |
| 10.2† | First Amendment to Amended and Restated Loan and Security Agreement, dated April 20, 2016, by and between the Registrant and Silicon Valley Bank | |
| 10.3† | Subordinated Loan and Security Agreement, dated April 20, 2016, by and among Silicon Valley Bank; SVB, Orix Ventures, LLC; and the Registrant | |
| 10.4† | Warrant to purchase Series A Convertible Preferred Stock, issued to Silicon Valley Bank on October 31, 2008 | |
| 10.5† | Warrant to purchase Common Stock, issued to Silicon Valley Bank on June 16, 2015 | |
| 10.6† | Warrant to purchase Common Stock, issued to Silicon Valley Bank on April 20, 2016 | |
| 10.7† | Form of Warrant to purchase Common Stock, issued to lenders on April 20, 2016 | |
| 10.8† | Office Lease, dated May 15, 2012, by and between the registrant and Plaza East Property LLC | |
| 10.8A† | First Amendment to the Office Lease Agreement dated August 20, 2012 | |
| 10.8B† | Second Amendment to the Office Lease Agreement dated July 31, 2014 | |
| 10.8C† | Third Amendment to the Office Lease Agreement dated May 13, 2016 | |
| 10.9†+ | Offer Letter, dated September 6, 2014 by and between John Morrow and the registrant | |
| 10.10†+ | Form of Director and Executive Officer Indemnification Agreement | |
| 10.11+ | 2007 Stock Plan, as amended | |
| 10.12†+ | UK Addendum to 2007 Stock Plan, as amended | |
| 10.13†+ | Form of Stock Option Grant Notice and Stock Option Agreement under the 2007 Stock Plan, as amended | |
| 10.14†+ | Form of Stock Option Grant Notice and Stock Option Agreement permitting early exercise under the 2007 Stock Plan, as amended | |
| 10.15†+ | Form of Notice of Stock Purchase Right and Restricted Stock Purchase Agreement under the 2007 Stock Plan | |
| 10.16†+ | Canadian Addendum to Forms of Stock Option Agreements under the 2007 Stock Plan, as amended | |
| 10.17†+ | 2011 Executive Equity Incentive Plan, as amended | |
| 10.18†+ | Form of Stock Option Grant Notice and Stock Option Agreement under the 2011 Executive Equity Incentive Plan, as amended | |
| 10.19†+ | Form of Stock Option Grant Notice and Stock Option Agreement permitting early exercise under the 2011 Executive Equity Incentive Plan, as amended | |
| 10.20+ | 2016 Equity Incentive Plan | |
| 10.21+ | Form of Stock Option Grant Notice and Stock Option Agreement under the 2016 Equity Incentive Plan | |
| 10.22+ | Form of Restricted Stock Grant Notice and Restricted Stock Agreement under the 2016 Equity Incentive Plan | |
| 10.23+ | Form of Restricted Stock Unit Grant Notice and Restricted Stock Unit Agreement under the 2016 Equity Incentive Plan | |
| 10.24+ | 2016 Employee Stock Purchase Plan | |
| 10.25+ | Executive Change in Control Severance Plan |
II-4
Table of Contents
| Exhibit |
Description | |
| 10.26+ | Outside Director Compensation Policy | |
| 10.27†+ | Executive Incentive Compensation Plan | |
| 23.1 | Consent of PricewaterhouseCoopers LLP, Independent Registered Public Accounting Firm | |
| 23.2 | Consent of Wilson Sonsini Goodrich & Rosati, Professional Corporation (included in Exhibit 5.1) | |
| 24.1† | Powers of Attorney | |
| † | Previously filed. |
| + | Indicates a management contract or compensatory plan. |
(b) Financial statement schedules.
Schedules have been omitted because the information required to be set forth therein is not applicable or is shown in the financial statements or notes thereto.
| Item 17. | Undertakings. |
The undersigned registrant hereby undertakes to provide to the underwriters at the closing specified in the underwriting agreements, certificates in such denominations and registered in such names as required by the underwriters to permit prompt delivery to each purchaser.
Insofar as indemnification for liabilities arising under the Securities Act of 1933 may be permitted to directors, officers and controlling persons of the registrant pursuant to the foregoing provisions, or otherwise, the registrant has been advised that in the opinion of the Securities and Exchange Commission such indemnification is against public policy as expressed in the Securities Act of 1933 and is, therefore, unenforceable. If a claim for indemnification against such liabilities (other than the payment by the registrant of expenses incurred or paid by a director, officer or controlling person of the registrant in the successful defense of any action, suit or proceeding) is asserted by such director, officer or controlling person in connection with the securities being registered, the registrant will, unless in the opinion of its counsel the matter has been settled by controlling precedent, submit to a court of appropriate jurisdiction the question whether such indemnification by it is against public policy as expressed in the Securities Act of 1933 and will be governed by the final adjudication of such issue.
The undersigned registrant hereby undertakes that:
(1) For purposes of determining any liability under the Securities Act of 1933, the information omitted from the form of prospectus filed as part of this registration statement in reliance upon Rule 430A and contained in a form of prospectus filed by the registrant pursuant to Rule 424(b)(1) or (4) or 497(h) under the Securities Act shall be deemed to be part of this registration statement as of the time it was declared effective.
(2) For the purpose of determining any liability under the Securities Act of 1933, each post-effective amendment that contains a form of prospectus shall be deemed to be a new registration statement relating to the securities offered therein, and the offering of such securities at that time shall be deemed to be the initial bona fide offering thereof.
II-5
Table of Contents
SIGNATURES
Pursuant to the requirements of the Securities Act of 1933, the registrant has duly caused this Amendment No. 1 to the registration statement to be signed on its behalf by the undersigned, thereunto duly authorized, in the City of Bellevue, State of Washington, on September 12, 2016.
| APPTIO, INC. | ||
| By: |
/s/ Sachin Gupta | |
| Sachin Gupta | ||
| President and Chief Executive Officer | ||
Pursuant to the requirements of the Securities Act of 1933, this Amendment No. 1 to the registration statement has been signed by the following persons in the capacities indicated below:
|
Signature |
Title |
Date | ||
| /s/ Sachin Gupta Sachin Gupta |
President, Chief Executive Officer and Director (Principal Executive Officer) |
September 12, 2016 | ||
| /s/ Kurt Shintaffer Kurt Shintaffer |
Chief Financial Officer (Principal Accounting and Financial Officer) | September 12, 2016 | ||
| * Thomas Bogan |
Chairman of the Board and Director | September 12, 2016 | ||
| * Peter Klein |
Director | September 12, 2016 | ||
| * John McAdam |
Director | September 12, 2016 | ||
| * Matthew McIlwain |
Director | September 12, 2016 | ||
| * Ravi Mohan |
Director | September 12, 2016 | ||
| * Rajeev Singh |
Director | September 12, 2016 | ||
| *By: | /s/ Sachin Gupta
| |
| Sachin Gupta Attorney-in-fact |
II-6
Table of Contents
EXHIBIT INDEX
| Exhibit |
Description | |
| 1.1† | Form of Underwriting Agreement | |
| 3.1 | Form of Amended and Restated Certificate of Incorporation | |
| 3.2 | Form of Amended and Restated Bylaws | |
| 4.1† | Form of Specimen Stock Certificate | |
| 4.2† | Amended and Restated Investors’ Rights Agreement, dated May 3, 2013, by and among the registrant and the investors and founders named therein | |
| 4.2A† | Amendment to the Amended and Restated Investors’ Rights Agreement October 11, 2013 | |
| 5.1 | Opinion of Wilson Sonsini Goodrich & Rosati, Professional Corporation | |
| 10.1† | Amended and Restated Loan and Security Agreement, dated June 16, 2015, by and between the registrant and Silicon Valley Bank | |
| 10.2† | First Amendment to Amended and Restated Loan and Security Agreement, dated April 20, 2016, by and between the Registrant and Silicon Valley Bank | |
| 10.3† | Subordinated Loan and Security Agreement, dated April 20, 2016, by and among Silicon Valley Bank; SVB, Orix Ventures, LLC; and the Registrant | |
| 10.4† | Warrant to purchase Series A Convertible Preferred Stock, issued to Silicon Valley Bank on October 31, 2008 | |
| 10.5† | Warrant to purchase Common Stock, issued to Silicon Valley Bank on June 16, 2015 | |
| 10.6† | Warrant to purchase Common Stock, issued to Silicon Valley Bank on April 20, 2016 | |
| 10.7† | Form of Warrant to purchase Common Stock, issued to lenders on April 20, 2016 | |
| 10.8† | Office Lease, dated May 15, 2012, by and between the registrant and Plaza East Property LLC | |
| 10.8A† | First Amendment to the Office Lease Agreement dated August 20, 2012 | |
| 10.8B† | Second Amendment to the Office Lease Agreement dated July 31, 2014 | |
| 10.8C† | Third Amendment to the Office Lease Agreement dated May 13, 2016 | |
| 10.9†+ | Offer Letter, dated September 6, 2014 by and between John Morrow and the registrant | |
| 10.10†+ | Form of Director and Executive Officer Indemnification Agreement | |
| 10.11+ | 2007 Stock Plan, as amended | |
| 10.12†+ | UK Addendum to 2007 Stock Plan, as amended | |
| 10.13†+ | Form of Stock Option Grant Notice and Stock Option Agreement under the 2007 Stock Plan, as amended | |
| 10.14†+ | Form of Stock Option Grant Notice and Stock Option Agreement permitting early exercise under the 2007 Stock Plan, as amended | |
| 10.15†+ | Form of Notice of Stock Purchase Right and Restricted Stock Purchase Agreement under the 2007 Stock Plan | |
| 10.16†+ | Canadian Addendum to Forms of Stock Option Agreements under the 2007 Stock Plan, as amended | |
| 10.17†+ | 2011 Executive Equity Incentive Plan, as amended | |
| 10.18†+ | Form of Stock Option Grant Notice and Stock Option Agreement under the 2011 Executive Equity Incentive Plan, as amended | |
| 10.19†+ | Form of Stock Option Grant Notice and Stock Option Agreement permitting early exercise under the 2011 Executive Equity Incentive Plan, as amended | |
| 10.20+ | 2016 Equity Incentive Plan | |
| 10.21+ | Form of Stock Option Grant Notice and Stock Option Agreement under the 2016 Equity Incentive Plan |
Table of Contents
| Exhibit |
Description | |
| 10.22+ | Form of Restricted Stock Grant Notice and Restricted Stock Agreement under the 2016 Equity Incentive Plan | |
| 10.23+ | Form of Restricted Stock Unit Grant Notice and Restricted Stock Unit Agreement under the 2016 Equity Incentive Plan | |
| 10.24+ | 2016 Employee Stock Purchase Plan | |
| 10.25+ | Executive Change in Control Severance Plan | |
| 10.26+ | Outside Director Compensation Policy | |
| 10.27†+ | Executive Incentive Compensation Plan | |
| 23.1 | Consent of PricewaterhouseCoopers LLP, Independent Registered Public Accounting Firm | |
| 23.2 | Consent of Wilson Sonsini Goodrich & Rosati, Professional Corporation (included in Exhibit 5.1) | |
| 24.1† | Powers of Attorney |
| † | Previously filed. |
| + | Indicates a management contract or compensatory plan. |