Attached files
| file | filename |
|---|---|
| 8-K - FORM 8-K - Atlantic Coast Financial CORP | v448479_8k.htm |
Exhibit 99.1
ATLANTIC COAST FINANCIAL CORPORATION Investor Presentation September 2016
This presentation, as well as other written or oral communications made from time to time by us, may contain forward - looking statements, as defined by Federal Securities Laws, relating to present or future trends or factors affecting the operations, markets and products of Atlantic Coast Financial Corporation (Atlantic Coast, ACFC, or the Company) . These statements are provided to assist in the understanding of future financial performance . Any such statements are based on current expectations and assumptions that may not prove to be correct, and involve a number of risks and uncertainties that may cause our actual performance or achievements to be materially different from any future results, levels of activity, performance or achievements expressed or implied by such forward - looking statements . For a discussion of factors that may cause such forward - looking statements to differ materially from actual results, please refer to ACFC’s most recent Form 10 - Q and Form 10 - K filed with the Securities Exchange Commission . ACFC undertakes no obligation to release revisions to these forward - looking statements or reflect events or circumstances after the date of this presentation . This presentation, as well as other written or oral communications made from time to time by us, may contain the discussion of non - GAAP financial measures . A "non - GAAP financial measure" is generally defined as a numerical measure of a company's historical or future financial performance, financial position, or cash flows that either excludes or includes amounts, or is subject to adjustments, so as to be different from the most directly comparable measure calculated and presented in accordance with generally accepted accounting principles (GAAP) . ACFC management believes that the non - GAAP financial measures, when considered together with GAAP financial measures, provide information that is useful to investors in understanding period - over - period operating results separate and apart from items that may, or could, have a disproportionately positive or negative impact on results in any particular period . ACFC management also believes that the non - GAAP financial measures enhance the ability of investors to analyze the Company's business trends and to understand the Company's performance . In addition, the Company may utilize non - GAAP financial measures as guides in forecasting, budgeting and long - term planning processes and to measure operating performance for some management compensation purposes . Non - GAAP financial measures should be considered in addition to, and not as a substitute for, or superior to, financial measures prepared in accordance with GAAP . Certain of the information contained herein may have been derived from information provided by industry sources . ACFC believes that such information is accurate and that the sources from which it has been obtained are reliable . ACFC cannot guarantee the accuracy of such information, however, and has not independently verified such information . Forward - Looking Statements 2
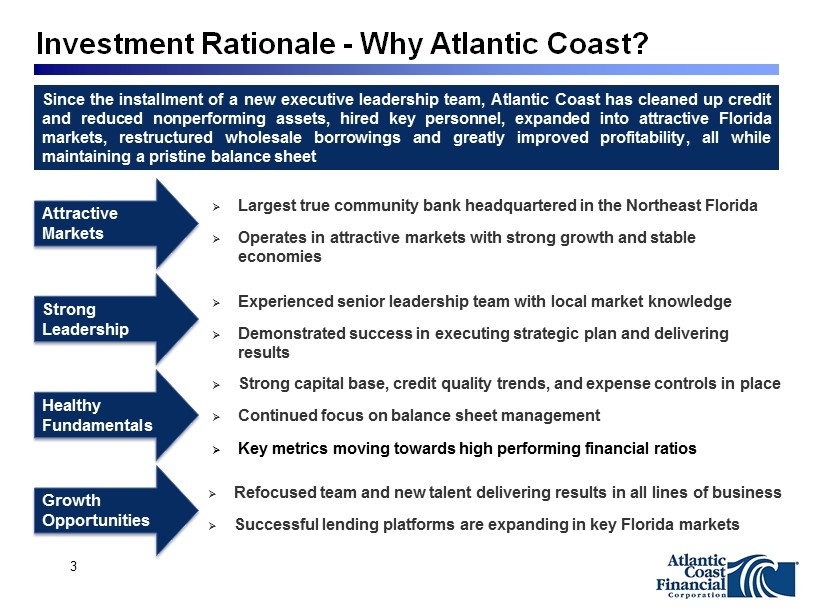
Investment Rationale - Why Atlantic Coast? » Largest true community bank headquartered in the Northeast Florida » Operates in attractive markets with strong growth and stable economies » Experienced senior leadership team with local market knowledge » Demonstrated success in executing strategic plan and delivering results » Strong capital base, credit quality trends, and expense controls in place » Continued focus on balance sheet management » Key metrics moving towards high performing financial ratios » Refocused team and new talent delivering results in all lines of business » Successful lending platforms are expanding in key Florida markets Attractive Markets Strong Leadership Healthy Fundamentals Growth Opportunities Since the installment of a new executive leadership team, Atlantic Coast has cleaned up credit and reduced nonperforming assets, hired key personnel, expanded into attractive Florida markets, restructured wholesale borrowings and greatly improved profitability, all while maintaining a pristine balance sheet 3
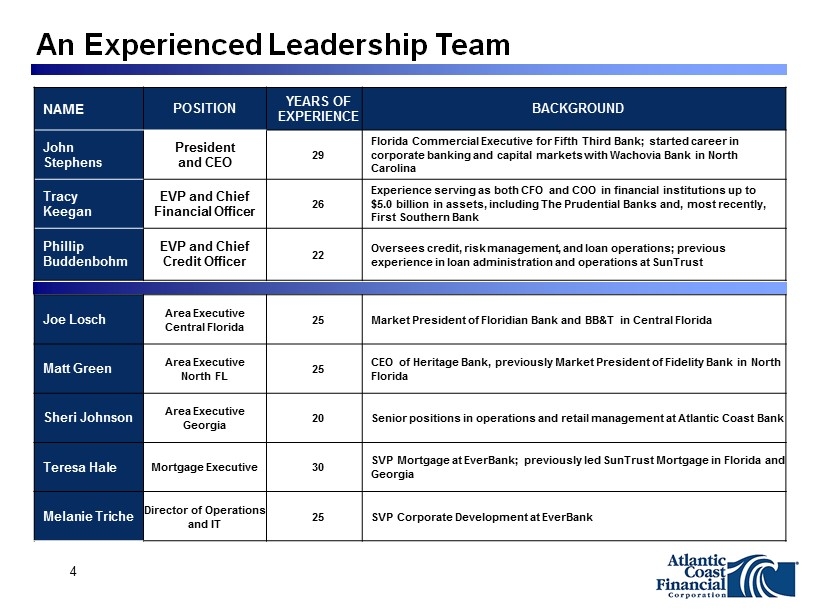
An Experienced Leadership Team NAME POSITION YEARS OF EXPERIENCE BACKGROUND John Stephens President and CEO 29 Florida Commercial Executive for Fifth Third Bank; started career in corporate banking and capital markets with Wachovia Bank in North Carolina Tracy Keegan EVP and Chief Financial Officer 26 Experience serving as both CFO and COO in financial institutions up to $5.0 billion in assets, including The Prudential Banks and, most recently, First Southern Bank Phillip Buddenbohm EVP and Chief Credit Officer 22 Oversees credit, risk management, and loan operations; previous experience in loan administration and operations at SunTrust Joe Losch Area Executive Central Florida 25 Market President of Floridian Bank and BB&T in Central Florida Matt Green Area Executive North FL 25 CEO of Heritage Bank, previously Market President of Fidelity Bank in North Florida Sheri Johnson Area Executive Georgia 20 Senior positions in operations and retail management at Atlantic Coast Bank Teresa Hale Mortgage Executive 30 SVP Mortgage at EverBank; previously led SunTrust Mortgage in Florida and Georgia Melanie Triche Director of Operations and IT 25 SVP Corporate Development at EverBank 4
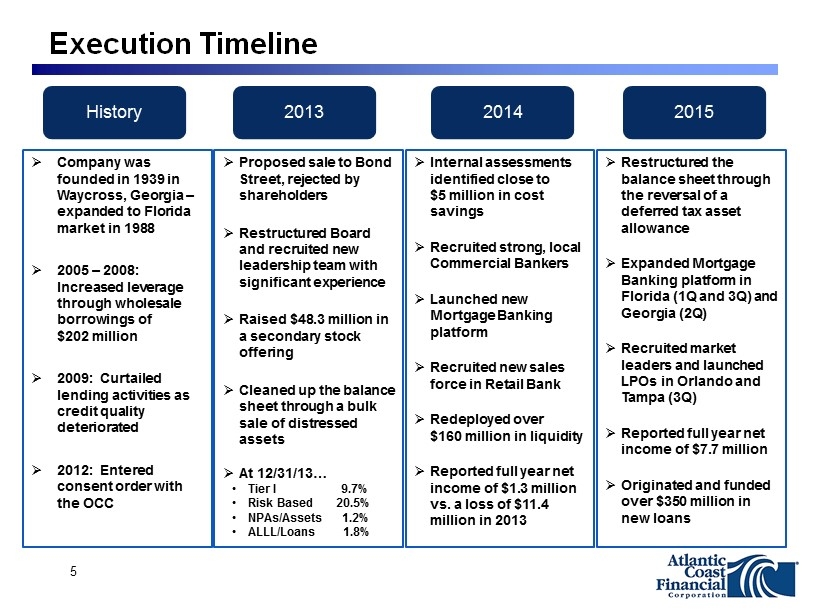
Execution Timeline History 2013 2014 2015 » Proposed sale to Bond Street, rejected by shareholders » Restructured Board and recruited new leadership team with significant experience » Raised $48.3 million in a secondary stock offering » Cleaned up the balance sheet through a bulk sale of distressed assets » At 12/31/13… • Tier I 9.7% • Risk Based 20.5% • NPAs/Assets 1.2% • ALLL/Loans 1.8% » Internal assessments identified close to $5 million in cost savings » Recruited strong, local Commercial Bankers » Launched new Mortgage Banking platform » Recruited new sales force in Retail Bank » Redeployed over $160 million in liquidity » Reported full year net income of $1.3 million vs. a loss of $11.4 million in 2013 » Restructured the balance sheet through the reversal of a deferred tax asset allowance » Expanded Mortgage Banking platform in Florida (1Q and 3Q) and Georgia (2Q) » Recruited market leaders and launched LPOs in Orlando and Tampa (3Q) » Reported full year net income of $7.7 million » Originated and funded over $350 million in new loans » Company was founded in 1939 in Waycross, Georgia – expanded to Florida market in 1988 » 2005 – 2008: Increased leverage through wholesale borrowings of $202 million » 2009: Curtailed lending activities as credit quality deteriorated » 2012: Entered consent order with the OCC 5
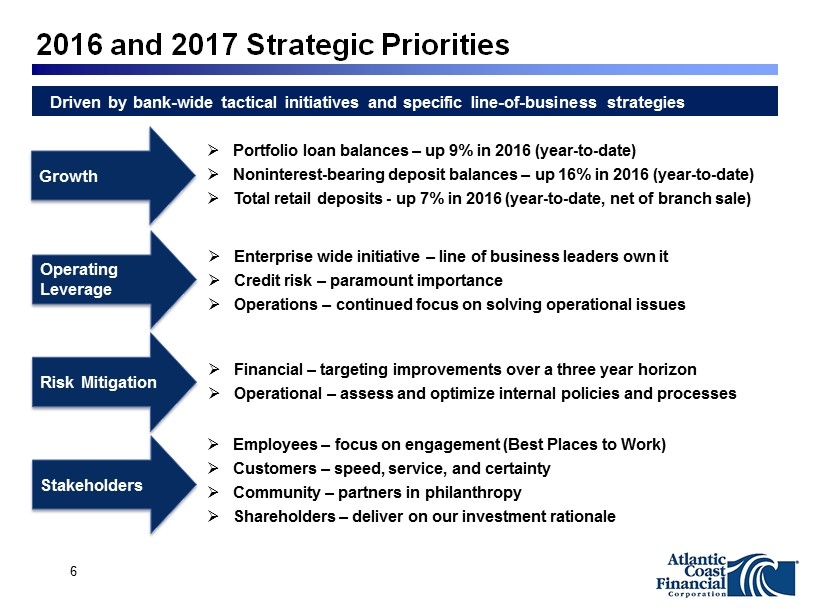
2016 and 2017 Strategic Priorities » Portfolio loan balances – up 9% in 2016 (year - to - date) » Noninterest - bearing deposit balances – up 16% in 2016 (year - to - date) » Total retail deposits - up 7% in 2016 ( year - to - date, net of branch sale) » Enterprise wide initiative – line of business leaders own it » Credit risk – paramount importance » Operations – continued focus on solving operational issues » Employees – focus on engagement (Best Places to Work) » Customers – speed, service, and certainty » Community – partners in philanthropy » Shareholders – deliver on our investment rationale » Financial – targeting improvements over a three year horizon » Operational – assess and optimize internal policies and processes Growth Operating Leverage Risk Mitigation Stakeholders Driven by bank - wide tactical initiatives and specific line - of - business strategies 6
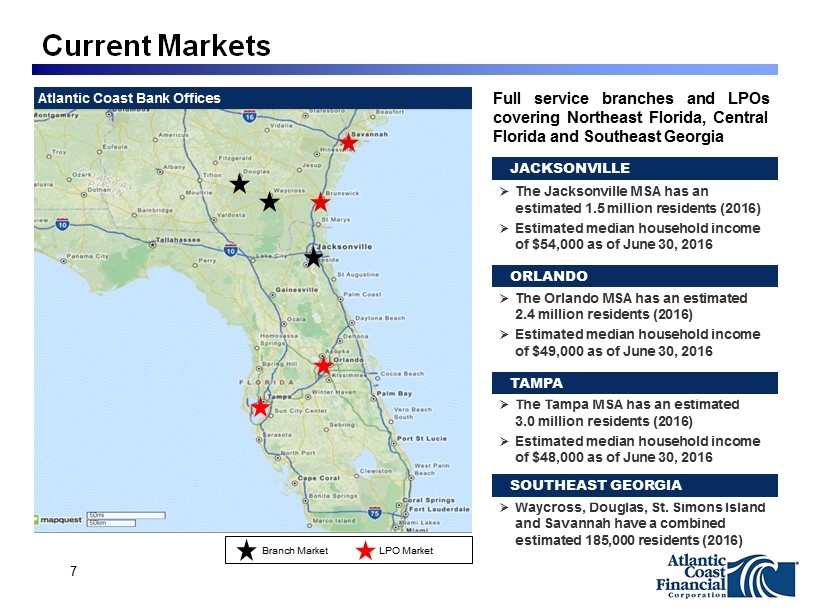
7 Current Markets Atlantic Coast Bank Offices Full service branches and LPOs covering Northeast Florida, Central Florida and Southeast Georgia » The Jacksonville MSA has an estimated 1.5 million residents (2016) » Estimated median household income of $54,000 as of June 30, 2016 » The Orlando MSA has an estimated 2.4 million residents (2016) » Estimated median household income of $49,000 as of June 30, 2016 » The Tampa MSA has an estimated 3.0 million residents (2016) » Estimated median household income of $48,000 as of June 30, 2016 » Waycross, Douglas, St. Simons Island and Savannah have a combined estimated 185,000 residents (2016) JACKSONVILLE ORLANDO TAMPA SOUTHEAST GEORGIA Branch Market LPO Market

Florida Economic Trends » The median sales price for single - family existing homes in Florida was $223,200 in July 2016, up 11.6% from the previous year » Dollar volume increased 17.4% in 2015, to $73.5 billion (from $62.6 billion in 2014) » Statewide inventory is down to 94,518 units or 4.3 months supply as of July 2016 , 4.4% lower than the July 2015 SOURCE: FloridaRealtors.org » Florida’s $800 billion economy is 70% larger than any other state in the southeast » A total population of approximately 20 million, ranks Florida as the 3 rd most populous state in the U.S » 9 of 18 cities Bloomberg Business predicted to have the most economic growth in 2016 were in Florida » Tourism continues to rise, with a record 105 million visitors to the state in 2015 (compared to 99 million in 2014), and a new goal has been set at 115 million Residential Housing Florida Historical Visitor Trends 8
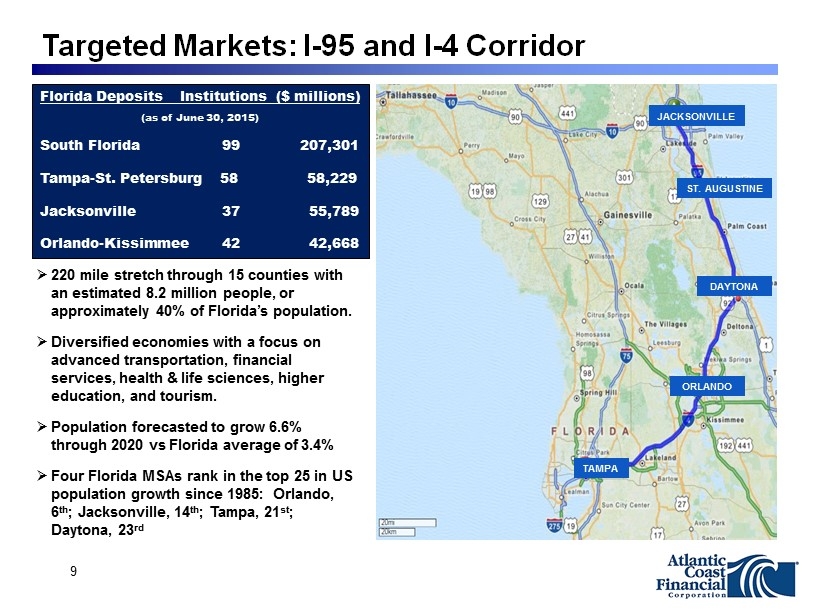
Targeted Markets: I - 95 and I - 4 Corridor JACKSONVILLE DAYTONA ORLANDO TAMPA ST. AUGUSTINE Florida Deposits Institutions ($ millions) (as of June 30, 2015) South Florida 99 207,301 Tampa - St. Petersburg 58 58,229 Jacksonville 37 55,789 Orlando - Kissimmee 42 42,668 » 220 mile stretch through 15 counties with an estimated 8.2 million people, or approximately 40% of Florida’s population. » Diversified economies with a focus on advanced transportation, financial services, health & life sciences, higher education, and tourism. » Population forecasted to grow 6.6% through 2020 vs Florida average of 3.4% » Four Florida MSAs rank in the top 25 in US population growth since 1985: Orlando, 6 th ; Jacksonville, 14 th ; Tampa, 21 st ; Daytona, 23 rd 9
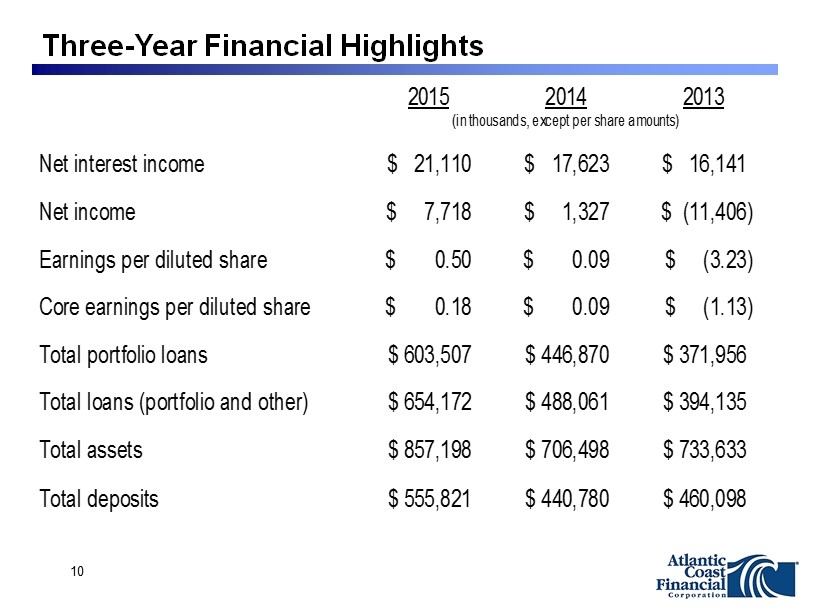
Three - Year Financial Highlights 2015 2014 2013 Net interest income 21,110$ 17,623$ 16,141$ Net income 7,718$ 1,327$ (11,406)$ Earnings per diluted share 0.50$ 0.09$ (3.23)$ Core earnings per diluted share 0.18$ 0.09$ (1.13)$ Total portfolio loans 603,507$ 446,870$ 371,956$ Total loans (portfolio and other) 654,172$ 488,061$ 394,135$ Total assets 857,198$ 706,498$ 733,633$ Total deposits 555,821$ 440,780$ 460,098$ (in thousands, except per share amounts) 10

Six Month Financial Highlights 2016 2015 % Change Net interest income 12,494$ 9,405$ 32.8% Net income 2,860$ 6,021$ -52.5% Earnings per diluted share 0.19$ 0.39$ -51.3% Core earnings per diluted share 0.15$ 0.05$ 200.0% Total portfolio loans 657,625$ 475,455$ 38.3% Total loans (portfolio and other) 758,620$ 583,345$ 30.0% Total assets 921,811$ 810,427$ 13.7% Total deposits 570,478$ 501,095$ 13.8% June 30, (in thousands, except per share amounts) 11

Transitioning into a Highly Profitable Growth Franchise Gross Loans ($ in millions) Total Deposits ($ in millions) PP Net Revenue ($ in millions) Core EPS Source: SNL Financial. (1) FBR Estimate $401 $495 $662 $767 $300 $400 $500 $600 $700 $800 $900 2013Y 2014Y 2015Y 2016Q2 $460 $441 $556 $570 $0 $100 $200 $300 $400 $500 $600 $700 $800 ($1.5) $2.4 $4.2 $6.5 ($4) $0 $4 $8 $12 $16 $20 ($1.13) $ 0.09 $0 .18 $0.35 ($ 1.50) ($0.75) $ 0.00 $0.12 $0.24 $0.36 (1) (1) 12 $48 million capital raise in Dec. 2013 2013Y 2014Y 2015Y 2016Y (1) 2013Y 2014Y 2015Y 2016Q2 2013Y 2014Y 2015Y 20 16Y (1)
» Prepaid a total of $116.3 million of wholesale debt in 2Q15 ($60 million of FHLB borrowings and $56.3 million of Repos) • Minimal reliance on Repo financing since the restructuring; trend expected to continue » Restructured $50 million of FHLB borrowings • FHLB borrowings carry a weighted - average rate of 1.06% as of 2Q16, a steep decline from 2.93% at 1Q15 » Significant enhancement of earnings
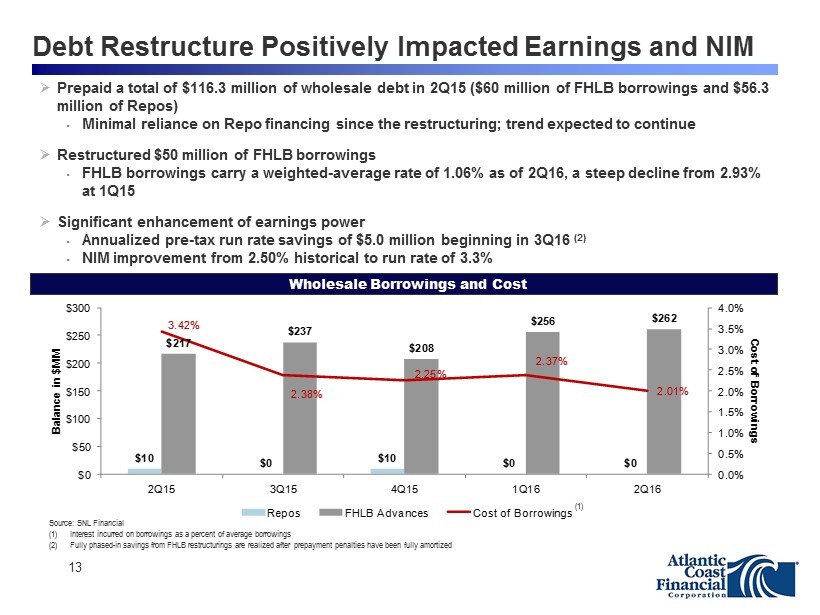
» Prepaid a total of $116.3 million of wholesale debt in 2Q15 ($60 million of FHLB borrowings and $56.3 million of Repos) • Minimal reliance on Repo financing since the restructuring; trend expected to continue » Restructured $50 million of FHLB borrowings • FHLB borrowings carry a weighted - average rate of 1.06% as of 2Q16, a steep decline from 2.93% at 1Q15 » Significant enhancement of earnings power • Annualized pre - tax run rate savings of $5.0 million beginning in 3Q16 (2) • NIM improvement from 2.50% historical to run rate of 3.3% Wholesale Borrowings and Cost $10 $0 $10 $0 $0 $217 $237 $208 $256 $262 3.42% 2.38% 2.25% 2.37% 2.01% 0.0% 0.5% 1.0% 1.5% 2.0% 2.5% 3.0% 3.5% 4.0% $0 $50 $100 $150 $200 $250 $300 2Q15 3Q15 4Q15 1Q16 2Q16 Cost of Borrowings Balance in $MM Repos FHLB Advances Cost of Borrowings Source: SNL Financial (1) Interest incurred on borrowings as a percent of average borrowings (2) Fully phased - in savings from FHLB restructurings are realized after prepayment penalties have been fully amortized 13 (1) Debt Restructure Positively Impacted Earnings and NIM
power • Annualized pre - tax run rate savings of $5.0 million beginning in 2Q16 (2) • NIM improvement from 2.50% historical to run rate of 3.3% Wholesale Borrowings and Cost $10 $0 $10 $0 $0 $217 $237 $208 $256 $262 3.42% 2.38% 2.25% 2.37% 2.01% 0.0% 0.5% 1.0% 1.5% 2.0% 2.5% 3.0% 3.5% 4.0% $0 $50 $100 $150 $200 $250 $300 2Q15 3Q15 4Q15 1Q16 2Q16 Cost of Borrowings Balance in $MM Repos FHLB Advances Cost of Borrowings Source: SNL Financial (1) Interest incurred on borrowings as a percent of average borrowings (2) Fully phased - in savings from FHLB restructurings are realized after prepayment penalties have been fully amortized 13 (1) Debt Restructure Positively Impacted Earnings and NIM
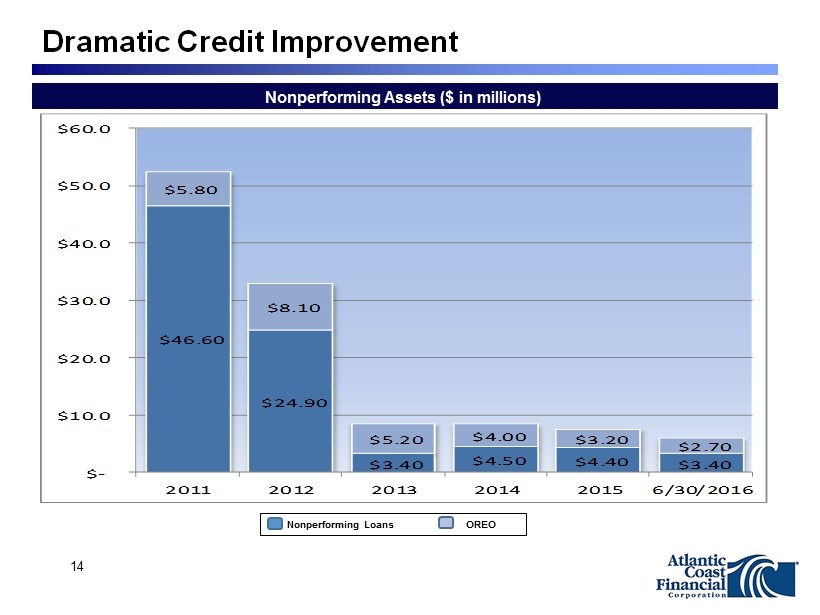
Dramatic Credit Improvement Nonperforming Assets ($ in millions) $46.60 $24.90 $3.40 $4.50 $4.40 $3.40 $5.80 $8.10 $5.20 $4.00 $3.20 $2.70 $- $10.0 $20.0 $30.0 $40.0 $50.0 $60.0 2011 2012 2013 2014 2015 6/30/2016 Nonperforming Loans OREO 14
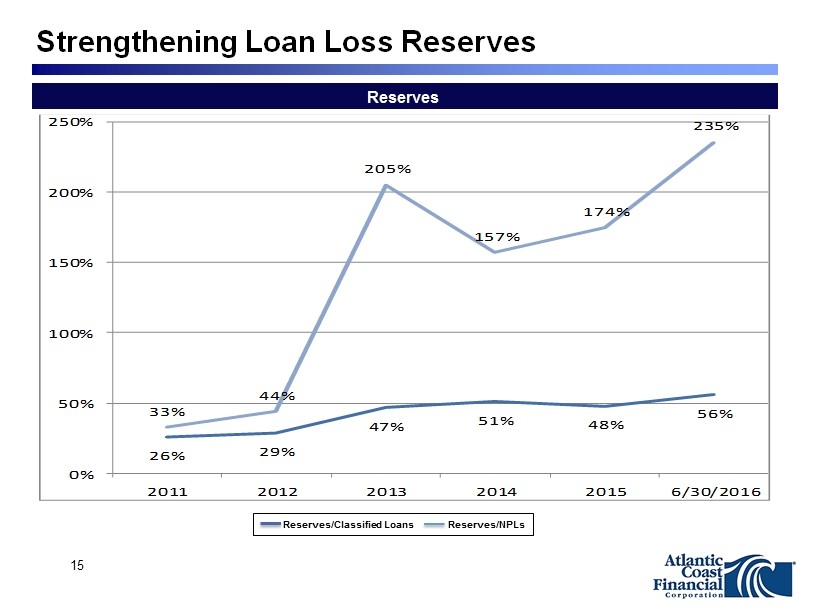
Strengthening Loan Loss Reserves 26% 29% 47% 51% 48% 56% 33% 44% 205% 157% 174% 235% 0% 50% 100% 150% 200% 250% 2011 2012 2013 2014 2015 6/30/2016 Reserves Reserves/Classified Loans Reserves/NPLs 15
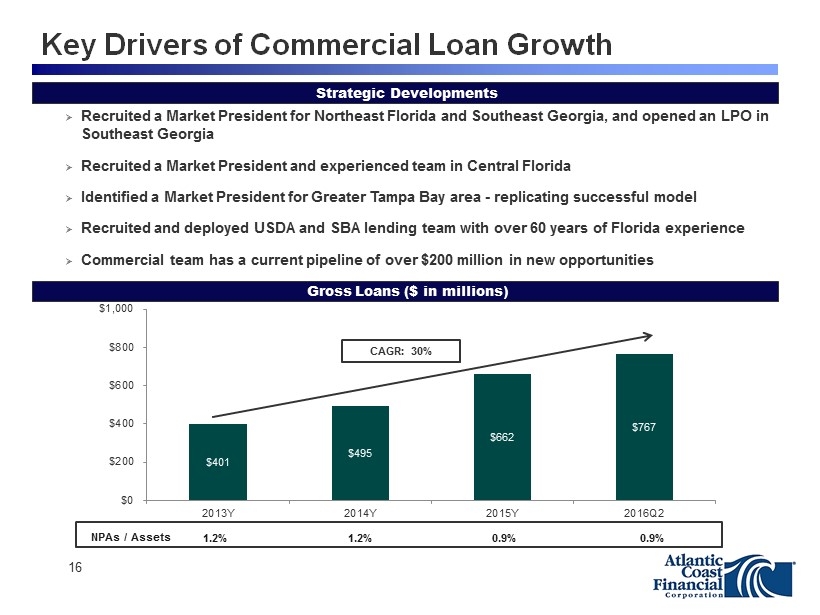
Key Drivers of Commercial Loan Growth Strategic Developments » Recruited a Market President for Northeast Florida and Southeast Georgia, and opened an LPO in Southeast Georgia » Recruited a Market President and experienced team in Central Florida » Identified a Market President for Greater Tampa Bay area - replicating successful model » Recruited and deployed USDA and SBA lending team with over 60 years of Florida experience » Commercial team has a current pipeline of over $200 million in new opportunities $401 $495 $662 $767 $0 $200 $400 $600 $800 $1,000 2013Y 2014Y 2015Y 2016Q2 Gross Loans ($ in millions) NPAs / Assets 1.2% 1.2% 0.9% 0.9% CAGR: 30% 16
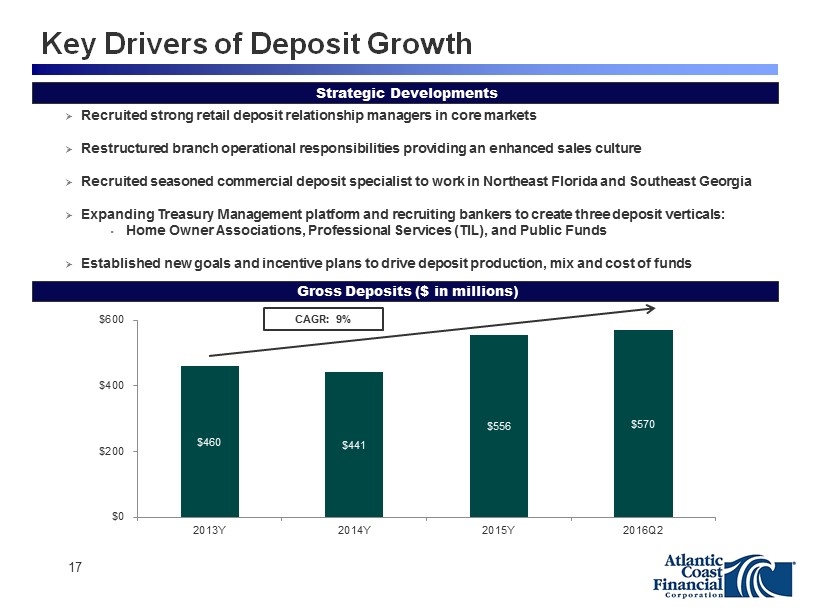
Key Drivers of Deposit Growth » Recruited strong retail deposit relationship managers in core markets » Restructured branch operational responsibilities providing an enhanced sales culture » Recruited seasoned commercial deposit specialist to work in Northeast Florida and Southeast Georgia » Expanding Treasury Management platform and recruiting bankers to create three deposit verticals: • Home Owner Associations, Professional Services (TIL), and Public Funds » Established new goals and incentive plans to drive deposit production, mix and cost of funds $460 $441 $556 $570 $0 $200 $400 $600 2013Y 2014Y 2015Y 2016Q2 CAGR: 9 % Strategic Developments Gross Deposits ($ in millions) 17
» Experienced leadership team with local connectivity » Well positioned in highly attractive Florida markets » Strong foundation, poised for line of business and geographic expansion » Proven ability to deliver high performance growth » Capital and liquidity well positioned to support strategic initiatives » Key metrics moving towards high performing financial institution ratios Investment Rationale - Why Atlantic Coast? Robust EPS growth and 80% increase in stock price since secondary offering 18
NASDAQ: ACFC www.AtlanticCoastBank.net