Attached files
| file | filename |
|---|---|
| 8-K - 8-K - 99 CENTS ONLY STORES LLC | a16-18103_28k.htm |
Exhibit 99.1
Q2FY17CONFERENCECALL SUPPLEMENTAL OPERATING & FINANCIAL DATA September 8, 2016
FORWARD LOOKING STATEMENTS This presentation contains forward looking statements under the Private Securities Litigation Reform Act of 1995. The words expect, estimate, anticipate, plan, predict, believe, intend, and similar expressions and variations thereof are intended to identify forward looking statements. Such statements include comments regarding the intent, belief, or current expectations of the Company with respect to, among other things, trends affecting the financial condition or results of operations of the Company; the business and growth strategies of the Company, including new store openings; the results of the Company’s operational and other initiatives, including pursuant to the Company’s profit improvement plans; the results of operations for future periods and potential uses of capital. These statements do not guarantee future performance and therefore, undue reliance should not be placed upon them. For a more detailed discussion of the factors that can cause actual results to differ materially from those projected in any forward-looking statements, the Company refers you to 99 Cents Only Stores’ most recent 10-Q and 10-K filed with the SEC or posted on the Company’s website. Please note that this presentation will refer to certain financial information of the Company that can be found at the end of the earnings release issued earlier today, September 8, 2016, and is presented on a non-GAAP basis. The Company cautions that these non-GAAP financial measures should be viewed in addition and not as an alternative to the Company’s complete consolidated financial statements and financial notes prepared in accordance with GAAP. Definitions and reconciliation of these non-GAAP measures to their most directly comparable GAAP measure are included in the earnings release. 2
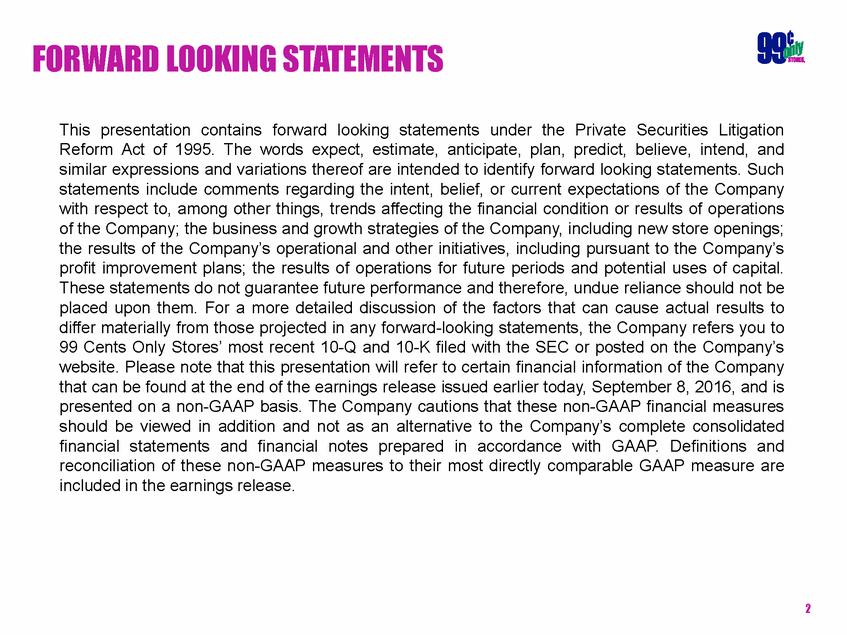
IMMEDIATE AREAS OF EMPHASIS 3 Creating a culture of safety The 5 R’s: the Right product to the Right store at the Right time in the Right quantity with the Right inventory Reduce shrink and manage scrap Improve the customer shopping experience
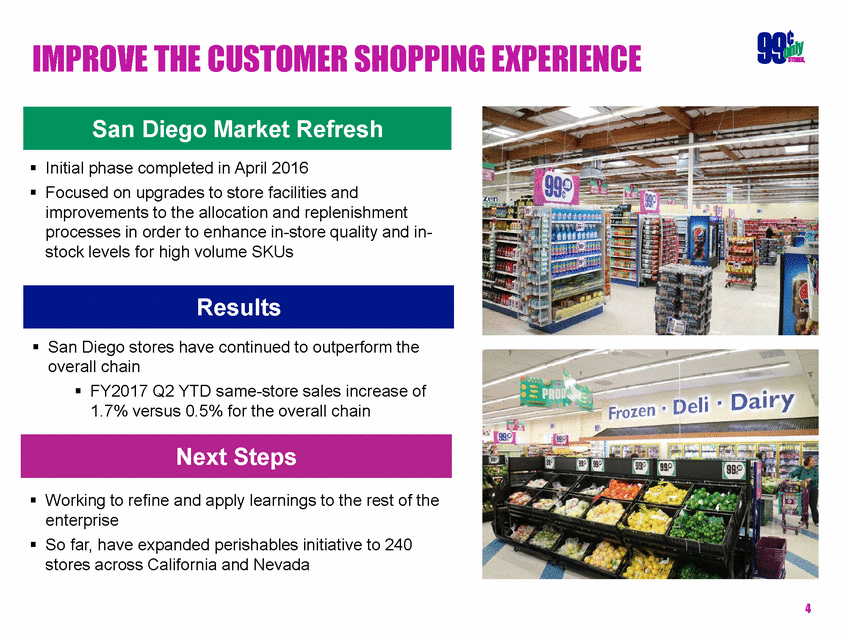
IMPROVE THE CUSTOMER SHOPPING EXPERIENCE Initial phase completed in April 2016 Focused on upgrades to store facilities and improvements to the allocation and replenishment processes in order to enhance in-store quality and in-stock levels for high volume SKUs San Diego stores have continued to outperform the overall chain FY2017 Q2 YTD same-store sales increase of 1.7% versus 0.5% for the overall chain Working to refine and apply learnings to the rest of the enterprise So far, have expanded perishables initiative to 240 stores across California and Nevada 4 Next Steps Results San Diego Market Refresh
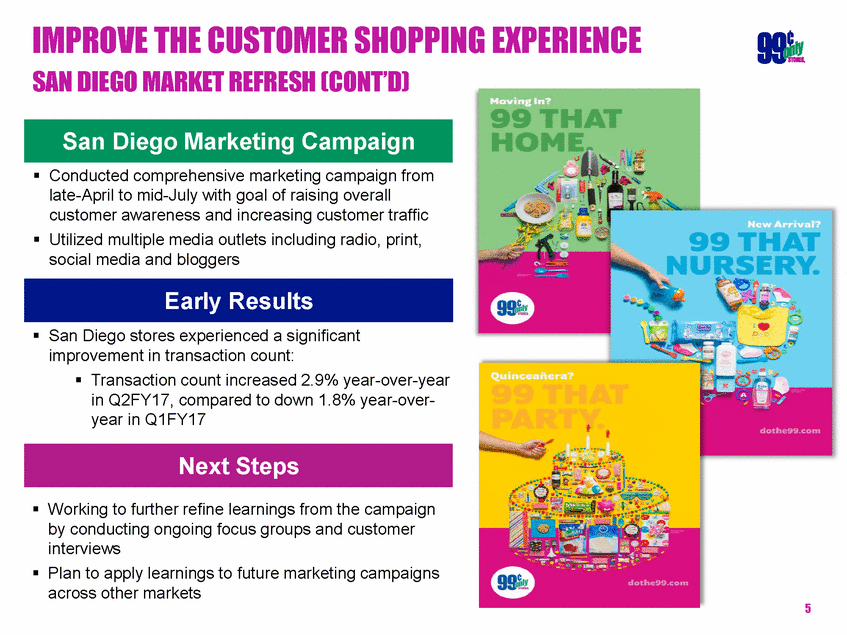
IMPROVE THE CUSTOMER SHOPPING EXPERIENCE SAN DIEGO MARKET REFRESH (CONT’D) Conducted comprehensive marketing campaign from late-April to mid-July with goal of raising overall customer awareness and increasing customer traffic Utilized multiple media outlets including radio, print, social media and bloggers San Diego stores experienced a significant improvement in transaction count: Transaction count increased 2.9% year-over-year in Q2FY17, compared to down 1.8% year-over-year in Q1FY17 Working to further refine learnings from the campaign by conducting ongoing focus groups and customer interviews Plan to apply learnings to future marketing campaigns across other markets 5 Next Steps Early Results San Diego Marketing Campaign
REDUCE SHRINK AND MANAGE SCRAP In-store pilot to gather detailed SKU-level data on shrink and identifying areas of opportunity Implement store perpetual inventory system (Store Inventory Module, or “SIM”) In-house loss prevention team SKU-Level Shrink Pilot Pilot to manually provide SKU-level shrink data by comprehensively measuring all product in-flows and out-flows Initial three-store pilot identified areas of improvement at stores and warehouses Currently conducting pilot at an additional three stores to validate results and learnings Store Inventory Module (“SIM”) Expanded pilot to six stores to test the underlying processes Leveraging learnings from pilot to develop roll-out plan for the rest of the chain Expect to implement SIM in all stores by the end of the first quarter of fiscal 2018 6 Recent Updates Current Initiatives
THE 5 R’S Achieved significant inventory reductions over the past year, notwithstanding the slight increase in the second quarter related to seasonal merchandise for Halloween Total inventory reduction of nearly $100 million compared to the second quarter of fiscal 2016 Inventory reduction has resulted in rationalizing our warehouse footprint during fiscal 2017 Exited 2 warehouse facilities in Q1 2017 Completed the sale of an owned facility in Southern California in Q2 2017 for $29 million, expect to fully exit the warehouse by end of fiscal 2017 Will operate in five warehouse/distribution facilities heading into fiscal 2018 7 Right Inventory
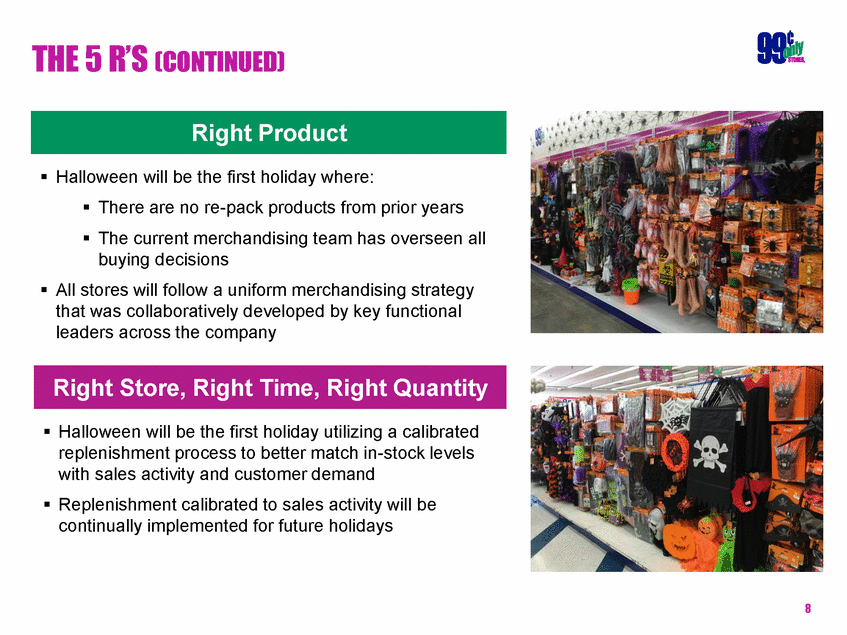
THE 5 R’S (CONTINUED) Halloween will be the first holiday where: There are no re-pack products from prior years The current merchandising team has overseen all buying decisions All stores will follow a uniform merchandising strategy that was collaboratively developed by key functional leaders across the company Halloween will be the first holiday utilizing a calibrated replenishment process to better match in-stock levels with sales activity and customer demand Replenishment calibrated to sales activity will be continually implemented for future holidays 8 Right Store, Right Time, Right Quantity Right Product
CREATING A CULTURE OF SAFETY Dedicated leadership team to spearhead key safety initiatives Comprehensive store manager training, including “safety first” messaging and communication Engaged third party risk management providers to support best practice claims management Year to Date Results: 45% reduction in claims across 16 stores participating in the safety pilot program 25% reduction in claims across all stores Expanding safety initiatives from pilot to entire organization: Currently implemented in all California stores Roll-out to remaining company locations in Texas, Nevada and Arizona will be complete by September 9th 9 Recent Updates Current Initiatives
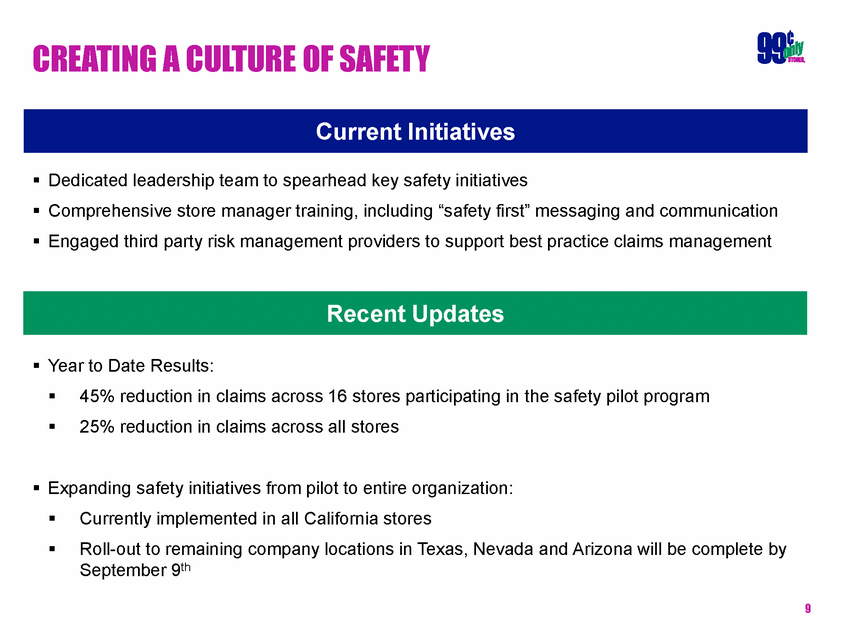
EXPANSION ACTIVITY Opened four new stores in diverse markets: West Covina, CA – located in Los Angeles County, grand opening April 28, 2016 Los Banos – located in Merced County, grand opening May 25, 2016 Chula Vista – located in San Diego County, grand opening June 28, 2016 One of the top performing stores in the entire chain for 12 weeks since grand opening Expanded refrigeration and enhanced merchandise assortment fits blueprint for new stores in fiscal 2018 Apple Valley – located in San Bernardino County, grand opening July 6, 2016 Expect to open one additional new store in the second half of fiscal 2017 10 Fiscal 2017 Year-to-Date
Q2 FINANCIAL REVIEW

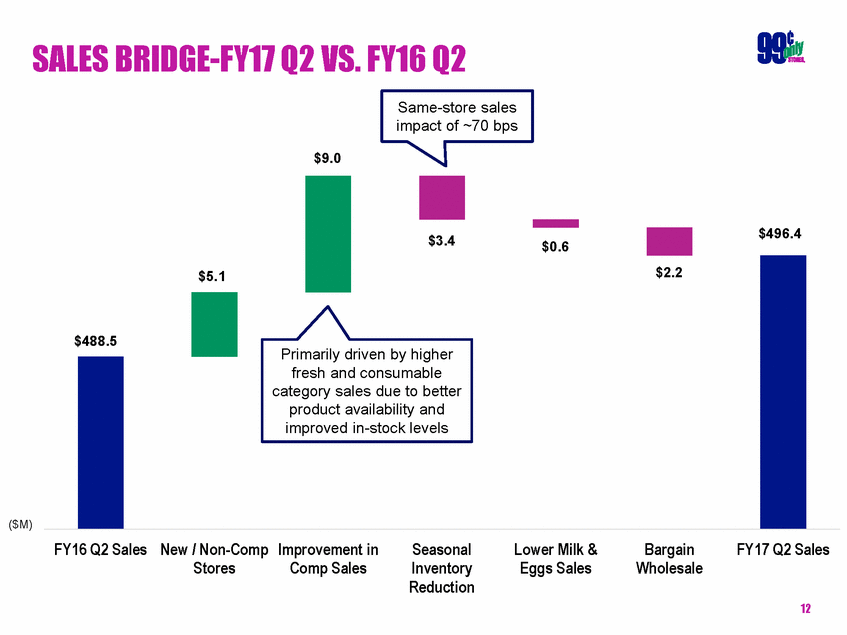
SALES BRIDGE-FY17 Q2 VS. FY16 Q2 Same-store sales impact of ~70 bps $9.0 $496.4 $3.4 $0.6 Primarily driven by higher ($M) FY16 Q2 SalesNew / Non-Comp Stores Improvement in Comp Sales Seasonal Inventory Reduction Lower Milk & Eggs Sales Bargain Wholesale FY17 Q2 Sales 12 $5.1$2.2 $488.5 fresh and consumable category sales due to better product availability and improved in-stock levels
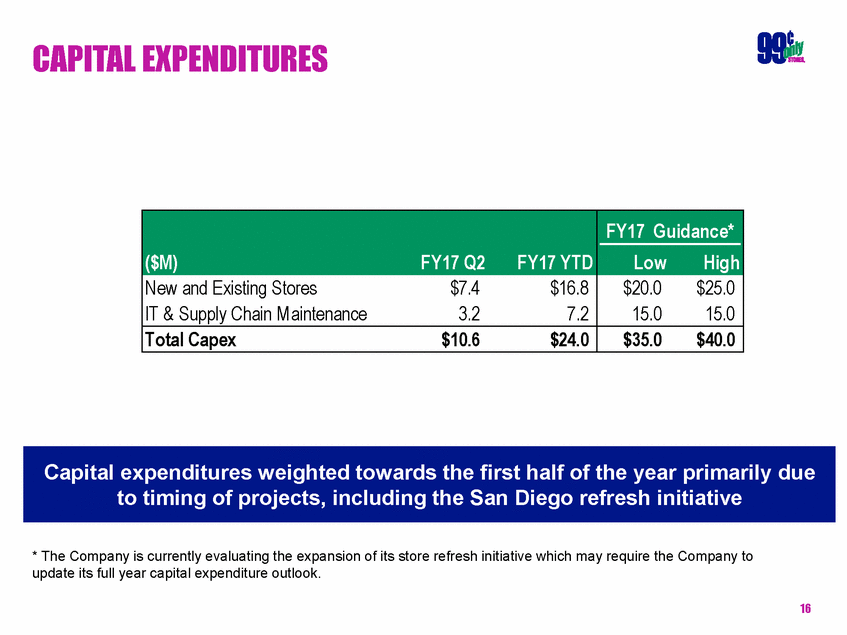
GROSS MARGIN BRIDGE-FY17 Q2 VS. FY16 Q2 28.4% 0.4% 0.5% 27.8% FY16 Q2 Gross Margin Shrink & Scrap Product Margin Distribution & Transportation Other Misc. FY17 Q2 Gross Margin 13 0.0% 0.3%
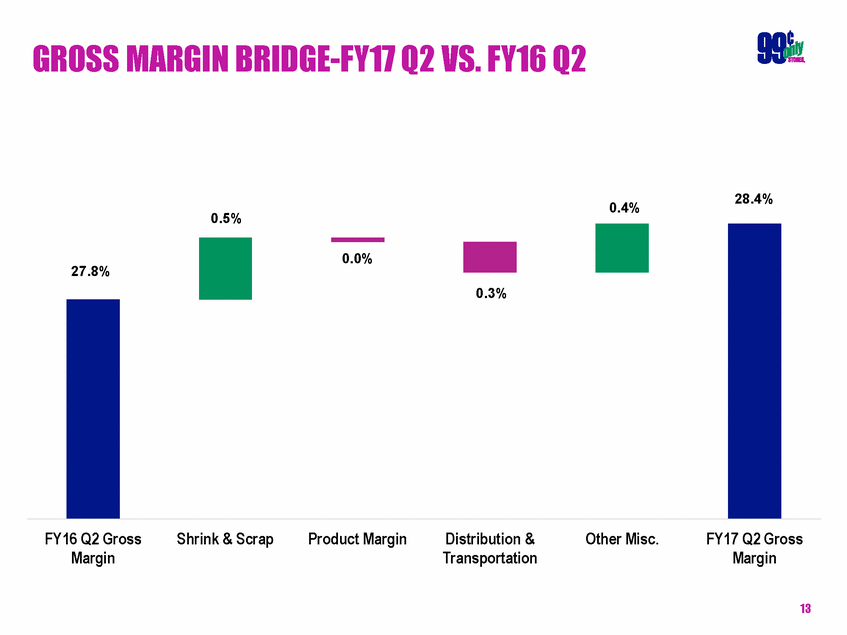
ADJUSTED EBITDA BRIDGE-FY17 Driven by ~50 bps improvement in shrink and scrap Q2 VS. FY16 Q2 Driven by CA minimum wage increase $4.8 Higher performance compensation expenses and in-store security spend $1.2 $3.2 $3.3 $0.2 $0.6 $6.9 product margin for and fresh offerings FY16 Q2 Adjusted EBITDA Earnings from Net Sales Increase Change in Product Margin Shrink, Scrap & Misc. COGs Distribution & Transportation Store Labor Store Occupancy Corporate & Other Store Exp. FY17 Q2 Adjusted EBITDA ($M) 14 Note: Adjusted EBITDA excludes impact of non-cash, one-time and non-recurring items Driven by lower$5.2 general merchandise$4.3
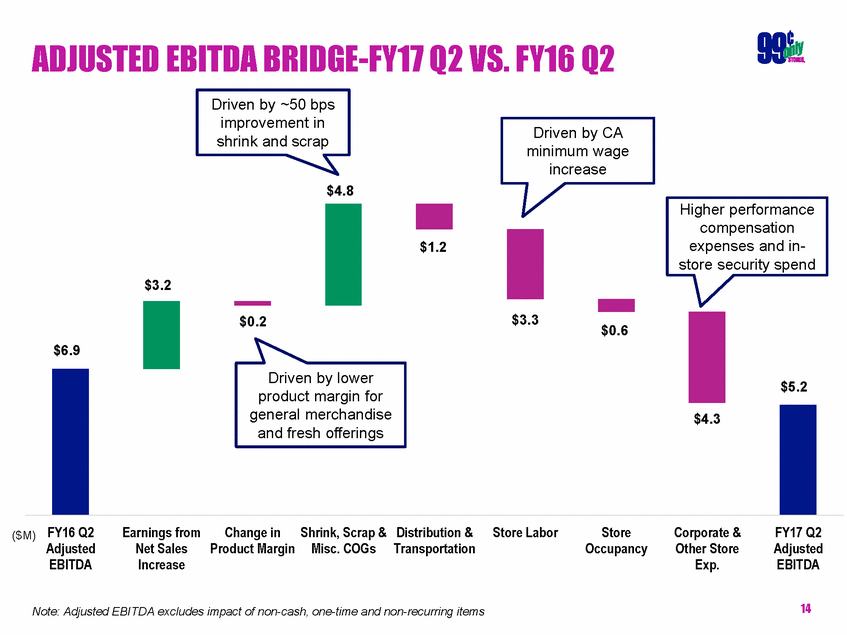
BALANCE SHEET ITEMS $M) Jul-15 Oct-15 Jan-16 Apr-16 Jul-16 15 Significantly improved liquidity position – cash borrowings under ABL facility at the lowest levels in over two years Cash Borrowings Under Revolver $120 $100 $80 $60 $40 $20 (– Balance as of Quarter Ended ($M)15-Jul15-Oct16-Jan16-Apr16-Jul Inventory$275$266$197$167$176 AP$86$99$79$75$105 Revolver Cash$107$76$48$40$21 Borrowings
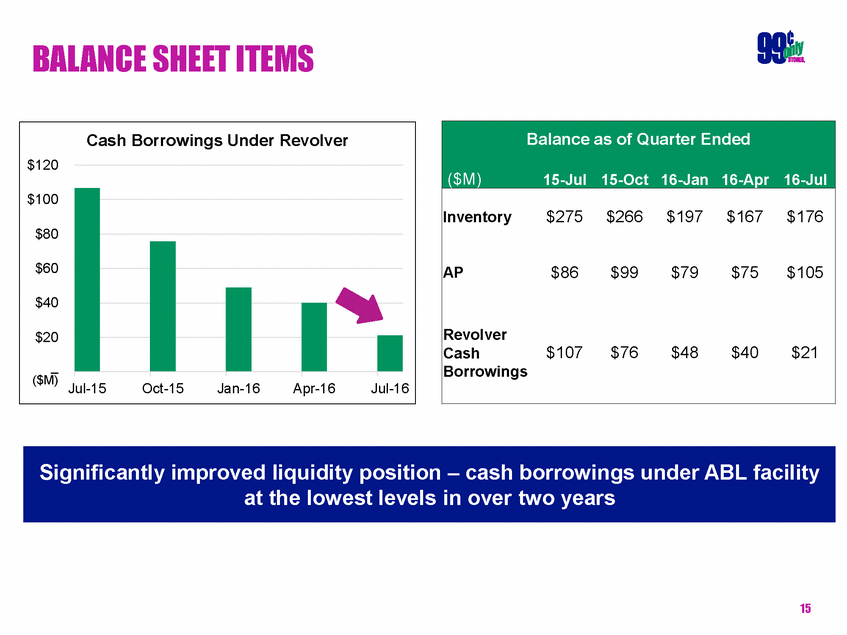
CAPITAL EXPENDITURES * The Company is currently evaluating the expansion of its store refresh initiative which may require the Company to update its full year capital expenditure outlook. 16 Capital expenditures weighted towards the first half of the year primarily due to timing of projects, including the San Diego refresh initiative ($M) FY17 Q2 FY17 YTD FY17 Guidance* Low High New and Existing Stores $7.4 $16.8 IT & Supply Chain Maintenance 3.2 7.2 $20.0 $25.0 15.0 15.0 Total Capex $10.6 $24.0 $35.0 $40.0
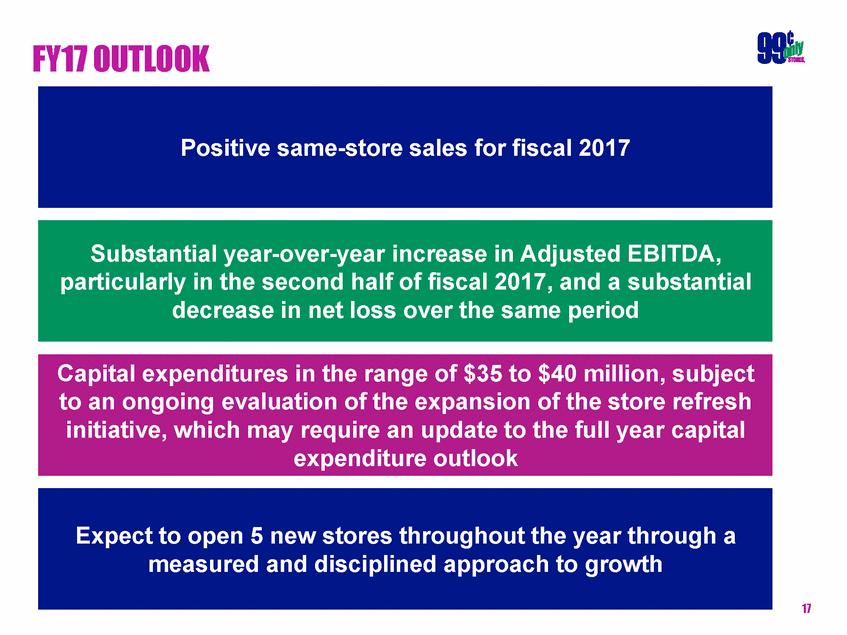
FY17 OUTLOOK 17 Expect to open 5 new stores throughout the year through a measured and disciplined approach to growth Capital expenditures in the range of $35 to $40 million, subject to an ongoing evaluation of the expansion of the store refresh initiative, which may require an update to the full year capital expenditure outlook Substantial year-over-year increase in Adjusted EBITDA, particularly in the second half of fiscal 2017, and a substantial decrease in net loss over the same period Positive same-store sales for fiscal 2017
