Attached files
| file | filename |
|---|---|
| EX-23.1 - EX-23.1 - FB Financial Corp | d241660dex231.htm |
| EX-10.18 - EX-10.18 - FB Financial Corp | d241660dex1018.htm |
| EX-10.17 - EX-10.17 - FB Financial Corp | d241660dex1017.htm |
| EX-10.16 - EX-10.16 - FB Financial Corp | d241660dex1016.htm |
| EX-10.15 - EX-10.15 - FB Financial Corp | d241660dex1015.htm |
| EX-10.14 - EX-10.14 - FB Financial Corp | d241660dex1014.htm |
| EX-10.13 - EX-10.13 - FB Financial Corp | d241660dex1013.htm |
| EX-10.12 - EX-10.12 - FB Financial Corp | d241660dex1012.htm |
| EX-10.9 - EX-10.9 - FB Financial Corp | d241660dex109.htm |
| EX-10.8 - EX-10.8 - FB Financial Corp | d241660dex108.htm |
| EX-10.7 - EX-10.7 - FB Financial Corp | d241660dex107.htm |
| EX-10.6 - EX-10.6 - FB Financial Corp | d241660dex106.htm |
| EX-10.5 - EX-10.5 - FB Financial Corp | d241660dex105.htm |
| EX-10.4 - EX-10.4 - FB Financial Corp | d241660dex104.htm |
| EX-10.3 - EX-10.3 - FB Financial Corp | d241660dex103.htm |
| EX-5.1 - EX-5.1 - FB Financial Corp | d241660dex51.htm |
| EX-3.1 - EX-3.1 - FB Financial Corp | d241660dex31.htm |
Table of Contents
Index to Financial Statements
As Filed with the Securities and Exchange Commission on September 6, 2016
Registration No. 333-213210
UNITED STATES
SECURITIES AND EXCHANGE COMMISSION
Washington, D.C. 20549
AMENDMENT NO. 1
TO
FORM S-1
REGISTRATION STATEMENT
UNDER
THE SECURITIES ACT OF 1933
FB Financial Corporation
(Exact Name of Registrant as Specified in Its Charter)
| Tennessee | 6022 | 62-1216058 | ||
| (State or Other Jurisdiction of Incorporation or Organization) |
(Primary Standard Industrial Classification Code Number) |
(I.R.S. Employer Identification Number) |
211 Commerce Street, Suite 300,
Nashville, Tennessee 37201
(615) 313-0080
(Address, Including Zip Code, and Telephone Number, Including Area Code, of Registrant’s Principal Executive Offices)
Christopher T. Holmes
Chief Executive Officer
FB Financial Corporation
211 Commerce Street, Suite 300,
Nashville, Tennessee 37201
(615) 313-0080
(Name, Address, Including Zip Code, and Telephone Number, Including Area Code, of Agent For Service)
Copies to:
| Mark C. Kanaly Kyle G. Healy Alston & Bird LLP One Atlantic Center 1201 West Peachtree Street Atlanta, GA 30309 (404) 881-7000 |
Marc D. Jaffe Keith L. Halverstam Latham & Watkins LLP 885 Third Avenue New York, NY 10022 (212) 906-1200 |
Approximate date of commencement of proposed sale to the public: As soon as practicable after the effective date of this Registration Statement.
If any of the securities being registered on this form are to be offered on a delayed or continuous basis pursuant to Rule 415 under the Securities Act of 1933, check the following box. ¨
If this form is filed to register additional securities for an offering pursuant to Rule 462(b) under the Securities Act, check the following box and list the Securities Act registration statement number of the earlier effective registration statement for the same offering. ¨
If this form is a post-effective amendment filed pursuant to Rule 462(c) under the Securities Act, check the following box and list the Securities Act registration statement number of the earlier effective registration statement for the same offering. ¨
If this form is a post-effective amendment filed pursuant to Rule 462(d) under the Securities Act, check the following box and list the Securities Act registration statement number of the earlier effective registration statement for the same offering. ¨
Indicate by check mark whether the registrant is a large accelerated filer, an accelerated filer, a non-accelerated filer, or a smaller reporting company. See the definitions of “large accelerated filer,” “accelerated filer” and “smaller reporting company” in Rule 12b-2 of the Exchange Act.
| Large accelerated filer | ¨ | Accelerated filer | ¨ | |||
| Non-accelerated filer | x (Do not check if a smaller reporting company) | Smaller reporting company | ¨ |
CALCULATION OF REGISTRATION FEE
|
| ||||||||
| Title of Each Class of Securities to be Registered |
Amount to be Registered(1) |
Proposed Maximum Offering Price per Share |
Proposed Maximum Offering Price(2) |
Amount of Registration Fee(3) | ||||
| Common Stock, $1.00 par value per share |
6,764,704 | $18.00 | $121,764,672 | $12,261.70 | ||||
|
| ||||||||
|
| ||||||||
| (1) | Includes 882,352 shares of common stock issuable upon exercise of an option to purchase additional shares granted to the underwriters. |
| (2) | Estimated solely for the purpose of calculating the amount of the registration fee in accordance with Rule 457(a) under the Securities Act of 1933, as amended. |
| (3) | $11,580.50 of such fee was previously paid. |
The Registrant hereby amends this registration statement on such date or dates as may be necessary to delay its effective date until the registrant shall file a further amendment which specifically states that this registration statement shall thereafter become effective in accordance with Section 8(a) of the Securities Act of 1933 or until the registration statement shall become effective on such date as the Commission, acting pursuant to said Section 8(a), may determine.
Table of Contents
Index to Financial Statements
The information in this prospectus is not complete and may be changed. We may not sell these securities until the registration statement filed with the Securities and Exchange Commission is effective. This prospectus is not an offer to sell these securities and we are not soliciting offers to buy these securities in any state where the offer or sale is not permitted.
Subject to completion, dated September 6, 2016
Preliminary prospectus
5,882,352 Shares

Common stock
This is the initial public offering of common stock of FB Financial Corporation, a bank holding company headquartered in Nashville, Tennessee. We operate primarily through our wholly-owned subsidiary, FirstBank, the third largest bank headquartered in Tennessee.
We are offering 5,882,352 shares of our common stock. In connection with the termination of our status as an S Corporation, we intend to use approximately $65.1 million of the net proceeds to us from the offering to (i) fund a cash distribution to our sole shareholder immediately after the closing of this offering in the amount of $55 million, which is intended to be non-taxable to our sole shareholder and represents a significant portion of our S Corporation earnings that have been, or will be, taxed to our sole shareholder, but not previously distributed to him, and (ii) subject to regulatory approval, to repay all $10.1 million aggregate principal amount of subordinated notes held by our sole shareholder, plus any accrued and unpaid interest thereon. See “Use of proceeds.”
Prior to this offering, there has been no established public market for our common stock. We currently estimate the public offering price of our common stock will be between $16.00 and $18.00 per share. Our common stock has been approved for listing on the New York Stock Exchange under the symbol “FBK.”
We are an “emerging growth company” as defined in the Jumpstart Our Business Startups Act of 2012 and, as a result, are subject to reduced public company disclosure standards. See “Implication of being an emerging growth company.”
| Per share | Total | |||||||
| Initial public offering price of our common stock |
$ | $ | ||||||
| Underwriting discounts and commissions(1) |
$ | $ | ||||||
| Proceeds to us, before expenses |
$ | $ | ||||||
| (1) | See “Underwriting” beginning on page 211 of this prospectus for additional information regarding underwriting compensation. |
The underwriters have an option to purchase up to an additional 882,352 shares of our common stock at the initial public offering price less the underwriting discount, within 30 days of the date of this prospectus. See “Underwriting.”
Investing in our common stock involves risks. See “Risk factors” to read about factors you should consider before investing in our common stock.
Neither the Securities and Exchange Commission nor any state securities commission has approved or disapproved of these securities or passed upon the accuracy or adequacy of this prospectus. Any representation to the contrary is a criminal offense.
These securities are not deposits, savings accounts or other obligations of any bank or savings association and are not insured or guaranteed by the Federal Deposit Insurance Corporation or any other governmental agency and are subject to investment risks, including the possible loss of the entire amount you invest.
The underwriters expect to deliver the shares of our common stock to purchasers on or about , 2016, subject to customary closing conditions.
| J.P. Morgan | UBS Investment Bank | Keefe, Bruyette & Woods A Stifel Company |
| Raymond James | Sandler O’Neill + Partners, L.P. | Stephens Inc. |
The date of this prospectus is , 2016.
Table of Contents
Index to Financial Statements
| i | ||||
| i | ||||
| ii | ||||
| 1 | ||||
| 12 | ||||
| 15 | ||||
| 24 | ||||
| 53 | ||||
| 56 | ||||
| 57 | ||||
| 59 | ||||
| 60 | ||||
| 61 | ||||
| 68 | ||||
| Management’s discussion and analysis of financial condition and results of operations |
110 | |||
| 174 | ||||
| 180 | ||||
| 193 | ||||
| 194 | ||||
| 198 | ||||
| 204 | ||||
| Certain material U.S. federal income tax consequences for non-U.S. holders of common stock |
207 | |||
| 211 | ||||
| 219 | ||||
| 219 | ||||
| 219 | ||||
| F-1 | ||||
Table of Contents
Index to Financial Statements
You should rely only on the information contained in this prospectus. Neither we nor the underwriters have authorized anyone to provide you with different or additional information. We and the underwriters take no responsibility for, and can provide no assurance as to the reliability of, any different or additional information that others may give you. If anyone provides you with different or inconsistent information, you should not rely on it.
We are offering to sell shares of our common stock, and intend to seek offers to buy shares of our common stock, only in jurisdictions where offers and sales are permitted. The information contained in this prospectus is accurate only as of the date of this prospectus, regardless of the time of the delivery of this prospectus or any sale of our common stock. Our business, financial condition, results of operations and growth prospects may have changed since that date. Information contained on, or accessible through, our website is not part of this prospectus.
In this prospectus, “we,” “our,” “us,” “FB Financial Corporation” or “the Company” refers to FB Financial Corporation, a Tennessee corporation, and our consolidated banking subsidiary, FirstBank, a Tennessee state chartered bank, unless the context indicates that we refer only to the parent company, FB Financial Corporation. In this prospectus, “Bank” or “FirstBank” refers to FirstBank, our consolidated banking subsidiary.
Unless otherwise indicated or the context requires, all information in this prospectus assumes the underwriters’ option to purchase additional shares of our common stock to cover over-allotments is not exercised.
S Corporation status
Since 2001, we have elected to be taxed for U.S. federal income tax purposes as an “S Corporation” under the provisions of Sections 1361 through 1379 of the Internal Revenue Code of 1986, as amended (the “Code”). As a result, our net income has not been subject to, and we have not paid, U.S. federal income tax, and no provision or liability for U.S. federal income tax has been included in our consolidated financial statements. Instead, for U.S. federal income tax purposes our taxable income is “passed through” to our shareholder. Unless specifically noted otherwise, no amount of our consolidated net income or our earnings per share presented in this prospectus, including in our consolidated financial statements and the accompanying notes appearing in this prospectus, reflects any provision for or accrual of any expense for U.S. federal income tax liability for our Company for any period presented. Upon the consummation of this offering, our status as an S Corporation will terminate. Thereafter, our net income will be subject to U.S. federal income tax and the Company will bear the liability for those taxes.
This prospectus includes statistical and other industry and market data that we obtained from governmental reports and other third party sources. Our internal data, estimates and forecasts are based on information obtained from governmental reports, trade and business organizations and other contacts in the markets in which we operate and our management’s understanding of industry conditions. Although we believe that this information (including the industry publications and third party research, surveys and studies) is accurate and reliable, we have not independently verified such information. In addition, estimates, forecasts and assumptions are necessarily subject to a high degree of uncertainty and risk due to a variety of factors, including those described in the “Risk factors” section and elsewhere in this prospectus.
i
Table of Contents
Index to Financial Statements
Implication of being an emerging growth company
As a company with less than $1.0 billion in revenue during our last fiscal year, we qualify as an “emerging growth company” under the Jumpstart Our Business Startups Act of 2012, or the JOBS Act. An emerging growth company may take advantage of specified reduced reporting requirements and is relieved of certain other significant requirements that are otherwise generally applicable to other public companies. As an emerging growth company:
| • | we may present only two years of audited financial statements, discuss only our results of operations for two years in related “Management’s discussions and analysis of financial condition and results of operations” and provide less than five years of selected financial data in this registration statement; |
| • | we are exempt from the requirement to provide an auditor attestation from our auditors on management’s assessment of our internal control over financial reporting pursuant to the Sarbanes-Oxley Act of 2002, as amended, or the Sarbanes-Oxley Act; |
| • | we may choose not to comply with any new requirements adopted by the Public Company Accounting Oversight Board, or PCAOB, requiring mandatory audit firm rotation or a supplement to the auditor’s report providing additional information about the audit and our audited financial statements; |
| • | we are permitted to provide less extensive disclosure regarding our executive compensation arrangements pursuant to the rules applicable to smaller reporting companies, which means we do not have to include a compensation discussion and analysis and certain other disclosure regarding our executive compensation in this prospectus; and |
| • | we are not required to hold nonbinding advisory votes on executive compensation or golden parachute arrangements. |
We may take advantage of these provisions for up to five years unless we earlier cease to be an emerging growth company. We will cease to be an emerging growth company if we have more than $1.0 billion in annual gross revenues, have more than $700.0 million in market value of our common stock held by non-affiliates, or issue more than $1.0 billion of non-convertible debt in a three-year period. We have elected to adopt the reduced disclosure requirements described above regarding our executive compensation arrangements for purposes of the registration statement of which this prospectus is a part. In addition, we expect to take advantage of certain of the reduced reporting and other requirements of the JOBS Act with respect to the periodic reports we will file with the SEC and proxy statements that we use to solicit proxies from our shareholders.
The JOBS Act also permits us an extended transition period for complying with new or revised financial accounting standards affecting public companies until they would apply to private companies. However, we have elected not to take advantage of this extended transition period, which means that the financial statements included in this prospectus, as well as any financial statements that we file in the future, will be subject to all new or revised accounting standards generally applicable to public companies. Our election not to take advantage of the extended transition period is irrevocable.
ii
Table of Contents
Index to Financial Statements
This summary highlights selected information contained in this prospectus. This summary does not contain all the information that you should consider before investing in our common stock. You should read the entire prospectus carefully, including the “Risk factors,” “Cautionary note regarding forward-looking statements” and “Management’s discussion and analysis of financial condition and results of operations” sections, the historical financial statements and the accompanying notes included in this prospectus.
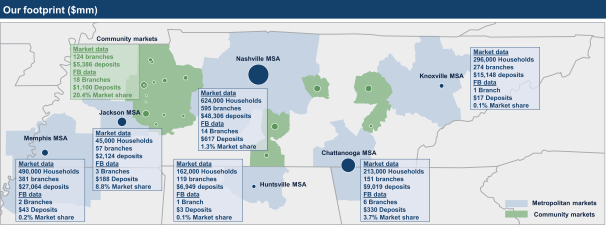
Overview
We are a bank holding company, headquartered in Nashville, Tennessee. Our wholly-owned bank subsidiary, FirstBank, is the third largest Tennessee-headquartered bank, based on total assets. FirstBank provides a comprehensive suite of commercial and consumer banking services to clients in select markets in Tennessee, North Alabama and North Georgia. Our footprint includes 45 full-service bank branches serving the Tennessee metropolitan markets of Nashville, Chattanooga, Knoxville, Memphis, Jackson, and Huntsville (AL) in addition to 12 community markets. FirstBank also provides mortgage banking services utilizing its bank branch network and mortgage banking offices strategically located throughout the southeastern United States in addition to a national internet delivery channel. As of June 30, 2016, we had total assets of $2.9 billion, total loans of $2.1 billion, deposits of $2.5 billion, and shareholder’s equity of $266 million.
Throughout our history, we have steadfastly maintained a community banking approach of personalized relationship-based service. As we have grown, maintaining this relationship-based approach utilizing local, talented and experienced bankers in each market has been an integral component of our success. Our bankers leverage their local knowledge and relationships to deliver timely solutions to our clients. We empower these bankers by giving them local decision making authority complemented by appropriate risk oversight. In our experience, business owners and operators prefer to deal with decision makers and our banking model is built to place the decision maker as close to the client as possible. We have designed our operations, technology, and centralized risk oversight processes to specifically support our operating model. We deploy this operating model universally in each of our markets, regardless of size. We believe we have a competitive advantage in our markets versus both smaller community banks, larger regional and national banks. Our robust offering of products, services and capabilities differentiates us from community banks and our significant local market knowledge, client service level and the speed with which we are able to make decisions and deliver our services to customers differentiate us from larger regional and national banks.
We seek to leverage our operating model by focusing on profitable growth opportunities across our footprint, consisting of both high-growth metropolitan markets and stable community markets. As a result, we are able to strategically deploy our capital across our markets to take advantage of the opportunities with the greatest certainty of profitable growth and the highest returns.
Our operating model is executed by a talented management team lead by our Chief Executive Officer, Christopher Holmes. Mr. Holmes, a 24-year banking veteran originally from Lexington, Tennessee, joined the Bank in 2010 as Chief Banking Officer and was named Chief Executive Officer in 2013. Mr. Holmes has an extensive background in both metropolitan and community banking gained from his time at several larger public financial institutions. Mr. Holmes has assembled a highly effective management team, blending members that have a long history with FirstBank and members that have significant banking experience at other in-market banks. This leadership team offers us a fresh perspective and implemented a new strategic plan in 2012 that called for significant incremental investments in the Nashville, Tennessee market.
1
Table of Contents
Index to Financial Statements
Our execution of the plan has driven balanced, profitable growth by increasing our presence in the high-growth Nashville market while maintaining our strong presence in community markets and providing a replicable model for additional metropolitan market growth.
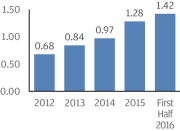
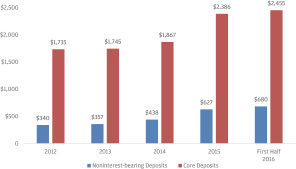
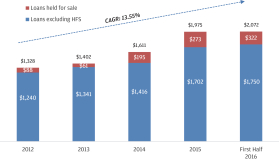
Our team has delivered strong financial results under our strategic plan, as evidenced by consistent improvement in our tax-adjusted return on average assets, net interest margin, core and noninterest bearing deposit balances, and loan balances. We believe that these strong results validate our operating model and strategies and position us for continued profitable growth and improved efficiencies.
| Tax-adjusted ROAA (%) | Fully tax equivalent net interest margin (%) | |
|

| |
| Deposits ($ in millions) | Total loans ($ in millions) | |
|
|
|
Note: Our tax-adjusted return on average assets includes a pro forma provision for federal income taxes using a combined effective income tax rate of 33.76%, 35.37%, 35.63%, 35.08% and 37.39% for the years ended December 31, 2012, 2013, 2014 and 2015 and the six months ended June 30, 2016, respectively. Our net interest margin is shown on a tax-equivalent basis. Core deposits and net interest margin on a tax equivalent basis are non-GAAP financial measures. See our reconciliation of non-GAAP financial measures to their most directly comparable GAAP financial measures under the caption “Selected historical consolidated financial data: GAAP reconciliation and management explanation of non-GAAP financial measures.”
Our history
Originally chartered in 1906, we are one of the longest continually operating banks in Tennessee. While our deep community roots go back over 100 years, our growth trajectory changed in 1984 when Tennessee businessman James W. Ayers, our Chairman and sole shareholder, acquired Farmers State Bank with an associate. In 1988, we purchased the assets of First National Bank of Lexington, Tennessee and changed our name to FirstBank, forming the foundation of our current franchise. In 1990, Mr. Ayers became the sole shareholder and has remained our sole owner since that time. Under Mr. Ayers’ ownership, we have grown from a community bank with only $14 million in assets in 1984 to the third largest bank headquartered in Tennessee, based on total assets.
2
Table of Contents
Index to Financial Statements
From 1984 to 2001, we operated as a rural community bank growing organically and through small acquisitions in community markets in West Tennessee. In 2001, our strategy evolved from serving purely community markets to include a modest presence in metropolitan markets, expanding our reach and enhancing our growth. We entered Nashville and Memphis in 2001 by opening a branch in each of those markets. In 2004 and 2008, we opened our first branches in Knoxville and Chattanooga, respectively. Although we experienced some growth in each metropolitan market, it did not become a major strategic focus until we implemented our current metropolitan growth strategy in the Nashville metropolitan statistical area (MSA) in 2012. The successful implementation of this strategy has resulted in 73% deposit growth in the Nashville MSA from December 31, 2012 to June 30, 2016, making it our largest market with 42% of our loans held for investment and 31% of our total deposits, as of June 30, 2016. As a result of this evolution, we now operate a balanced business model that serves a diverse customer base in both metropolitan and community markets.
On September 18, 2015, we completed our acquisition of Northwest Georgia Bank, a 110-year old institution with six branches, serving clients in the Chattanooga MSA. Including the effects of purchase accounting adjustments, we acquired net assets with a fair value of $272 million which includes a bargain purchase gain of $2.8 million, loans with a fair value of $79 million and deposits with a fair value of $246 million. We believe that this acquisition will accelerate our already planned expansion in Chattanooga by significantly augmenting our client base, increasing our brand awareness and providing us with the scale to attract leading bankers to further enhance our market penetration and profitable growth. In connection with the acquisition, we merged two of our existing FirstBank branches into NWGB branches in May 2016.
Our services
We are dedicated to serving the banking needs of businesses, professionals and individuals in our metropolitan and community markets through our community banking approach of personalized, relationship-based service. We deliver a wide range of banking products and services tailored to meet the needs of our clients across our footprint. Through the Bank, we offer a broad range of lending products to our clients, which includes businesses with up to $250 million in annual revenues, business owners, real estate investors and consumers. Our commercial lending products include working capital lines of credit, equipment loans, owner-occupied and non-owner-occupied real estate construction loans, “mini-perm” real estate term loans, and cash flow loans to a diversified mix of clients, including small and medium sized businesses. Our consumer lending products include first and second mortgage loans, home equity lines of credit and consumer installment loans to purchase cars, boats and other recreational vehicles. We also offer a full range of transaction and interest bearing depository products and services to meet the demands of each segment within our client base.
We offer a wide range of residential mortgage products and services through mortgage offices strategically located throughout the southeastern United States and through our internet delivery channel. We also offer smaller community banks and mortgage companies a host of diverse, third-party mortgage services. Our goal is to sell all of the mortgage loans our mortgage banking segment originates to Ginnie Mae, Fannie Mae, Freddie Mac or, to a lesser extent, an array of private national mortgage investors. We sold approximately $2.7 billion of the $2.8 billion of mortgage loans that we originated in 2015. In 2014, we expanded our mortgage business by beginning to service loans that we originate, or acquire through our third party origination contracts, and that we sell in the secondary markets in an effort to capture additional revenue and create cross-selling opportunities for our banking products. As of June 30, 2016, we serviced approximately $4.0 billion of residential mortgage loans.
3
Table of Contents
Index to Financial Statements
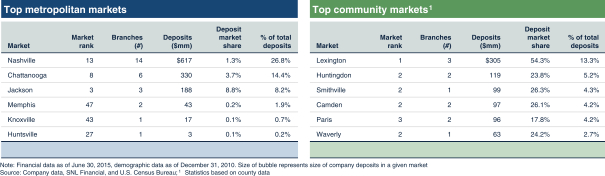
Our markets
Our market area is the southeastern United States, centered around Tennessee, and includes portions of North Alabama and North Georgia. The market area has attractive economic, population, and household income growth statistics that provide a favorable business environment. We believe that the strong economic growth in our market area has created a favorable operating environment for us.
Tennessee has no individual income tax and it has a favorable business climate, as evidenced by the following:
| • | Tennessee was ranked #4 in the country for business by Chief Executive magazine in May 2016; |
| • | Tennessee was named 2014 State of the Year for economic development by Business Facilities magazine in January 2015 and ranked #2 best business climate by Business Facilities magazine in July 2015 |
| • | Tennessee was ranked #4 for foreign direct investment job commitments in 2014 according to the 2015 Global Location Trends report by IBM Institute for Business Value; and |
| • | Tennessee was ranked #4 in the country for doing business by Area Development magazine in September 2015. |
The following tables show our deposit market share ranking among all banks and community banks (which we define as banks with less than $15 billion in assets) in Tennessee as of June 30, 2015. Of the 10 largest banks in the state based on total deposits, 7 are national or regional banks, which we believe provides us with significant opportunities to gain market share from these banks.
4
Table of Contents
Index to Financial Statements
Top 10 banks in Tennessee
| Rank | Company name | Headquarters | Branches (#) |
Total deposits ($bn) |
Deposit market share (%) |
% of company deposits |
||||||||||||||
| 1 |
First Horizon National Corp. (TN) | Memphis, TN | 153 | 17.8 | 13.8 | 94.8 | ||||||||||||||
| 2 |
Regions Financial Corp. (AL) | Birmingham, AL | 237 | 17.5 | 13.6 | 18.3 | ||||||||||||||
| 3 |
SunTrust Banks Inc. (GA) | Atlanta, GA | 139 | 12.2 | 9.5 | 8.6 | ||||||||||||||
| 4 |
Bank of America Corp. (NC) | Charlotte, NC | 58 | 10.5 | 8.2 | 0.9 | ||||||||||||||
| 5 |
Pinnacle Financial Partners (TN) | Nashville, TN | 48 | 6.9 | 5.3 | 100.0 | ||||||||||||||
| 6 |
U.S. Bancorp (MN) | Minneapolis, MN | 104 | 2.7 | 2.1 | 1.0 | ||||||||||||||
| 7 |
BB&T Corp. (NC) | Winston-Salem, NC | 49 | 2.5 | 1.9 | 1.5 | ||||||||||||||
| 8 |
FB Financial Corp (TN) | Nashville, TN | 45 | 2.0 | 1.6 | 91.2 | ||||||||||||||
| 9 |
Simmons First National Corp. (AR) | Pine Bluff, AR | 40 | 2.0 | 1.5 | 30.1 | ||||||||||||||
| 10 |
Wells Fargo & Co. (CA) | San Francisco, CA | 19 | 1.7 | 1.4 | 0.2 | ||||||||||||||
|
|
||||||||||||||||||||
Top 10 banks under $15bn assets in Tennessee
| Rank | Company name | Headquarters | Branches (#) |
Total deposits ($bn) |
Deposit market share (%) |
% of company deposits |
||||||||||||||
| 1 |
Pinnacle Financial Partners (TN) | Nashville, TN | 48 | 6.9 | 5.3 | 100.0 | ||||||||||||||
| 2 |
FB Financial Corp (TN) | Nashville, TN | 45 | 2.0 | 1.6 | 91.2 | ||||||||||||||
| 3 |
Simmons First National Corp. (AR) | Pine Bluff, AR | 40 | 2.0 | 1.5 | 30.1 | ||||||||||||||
| 4 |
Wilson Bank Holding Co. (TN) | Lebanon, TN | 25 | 1.7 | 1.3 | 100.0 | ||||||||||||||
| 5 |
Home Federal Bank of Tennessee (TN) | Knoxville, TN | 23 | 1.7 | 1.3 | 100.0 | ||||||||||||||
| 6 |
Franklin Financial Network Inc (TN) | Franklin, TN | 14 | 1.6 | 1.2 | 100.0 | ||||||||||||||
| 7 |
Capital Bank Finl Corp (NC) | Charlotte, NC | 57 | 1.4 | 1.1 | 19.7 | ||||||||||||||
| 8 |
First Citizens Bancshares Inc. (TN) | Dyersburg, TN | 23 | 1.3 | 1.0 | 100.0 | ||||||||||||||
| 9 |
First Farmers Merchants Corp. (TN) | Columbia, TN | 19 | 1.1 | 0.8 | 100.0 | ||||||||||||||
| 10 |
Clayton Bank and Trust (TN) | Knoxville, TN | 29 | 1.0 | 0.8 | 100.0 | ||||||||||||||
|
|
||||||||||||||||||||
Note: Market data sourced from SNL Financial and gives pro forma effect to any acquisitions announced as of August 26, 2016 as if they occurred on June 30, 2015; total assets as of June 30, 2016.
Our six metropolitan markets.
We currently operate in the six metropolitan markets listed below.
Nashville is the largest MSA in Tennessee, our largest market and one of the fastest growing cities in the U.S., with a booming cultural scene, vibrant healthcare industry, established music and entertainment industry, and 24 universities and colleges. Nashville has experienced 37% population growth from 2000 to 2015, and its population is expected to double in the next 20 years. Between 2010 and 2015, Nashville’s job growth of 18.1% was 10 percentage points higher than that of the U.S. Nashville’s diverse economy and strong business community are major attractions for corporations and professionals. Nashville was ranked as the national leader in advanced industry job growth by the Brookings Institute in August 2016. Nashville was ranked #2 in KPMG’s April 2014 listing of the Most Attractive Mid-Sized Cities for Business and #5 on Forbes’ May 2015 listing of the Best Big Cities for Jobs. We believe that these positive trends will continue, providing us with ample opportunity for future growth in the Nashville MSA.
Memphis is the 2nd largest MSA in Tennessee. It has a diversified business base and the busiest cargo airport in North America. Memphis is headquarters to 240 companies employing over 91,000 people, including Fortune
5
Table of Contents
Index to Financial Statements
500 companies AutoZone, International Paper and FedEx, which alone employs over 32,000 people in Memphis. Memphis benefits from 10 million tourists visiting annually, which generated approximately $3 billion for the local economy during 2014. In 2015, Memphis was named a Top 25 Best City for Jobs by Glassdoor, a leading online job search community.
Knoxville is the 3rd largest MSA in Tennessee. It has 120 automotive component manufacturers in the area, which provide approximately 13,000 jobs. The University of Tennessee is located in Knoxville, generating over $1.5 billion in income annually and supporting in excess of 30,000 jobs during 2014. The tourism industry is beginning to grow and Knoxville is taking its place alongside Chattanooga and Asheville, N.C. as a destination city in the Southern Appalachian Mountains. Knoxville was ranked by Forbes in 2015 as the second most affordable city in the United States and is currently experiencing accelerated employment growth.
Chattanooga is the 4th largest MSA in Tennessee. It has a diverse economy with over 28,000 businesses that employ over 260,000 people and generate an estimated $41 billion in annual sales. Chattanooga has experienced population growth of 11% between 2000 and 2010 and is expected to experience 20% population growth by 2021. Chattanooga was recently ranked #4 on Wallethub’s Best Cities to Start a Business list and was named a Best to Invest city by Site Selection magazine.
Jackson is the 6th largest MSA in Tennessee and is the 2nd largest city in West Tennessee following Memphis. Given a high-quality workforce, favorable tax environment and efficient logistical foundation, Jackson has developed into a leading industrial and distribution center in the state of Tennessee, with particular strength in manufacturing. Employers such as Berry Plastics, Delta Faucets, Gerdau, Kellogg’s, LyondellBassell Industries, Owens Corning and Stanley Black & Decker have established meaningful operations in the Jackson area. Further aiding the bright economic future of the region is a diverse complex of six accredited higher educational institutions and two state-of-the-art technical and professional training vocational schools. Jackson also enjoys a vibrant cultural community, with symphony concerts, blues fests, and community theater, as well as minor league professional baseball and a host of collegiate and local athletic organizations.
Huntsville has one of the strongest technology economies in the nation, with over 300 companies performing sophisticated government, commercial and university research. Huntsville has a high concentration of engineers and Ph.D.’s and has a number of major government programs, including NASA and the U.S. Army, including the Redstone Arsenal, which contains a government and contractor work force that employs approximately 40,000. Huntsville also has one of the highest concentrations of Inc. 500 companies and a number of offices of Fortune 500 companies.
Our community markets.
We are a leading bank in Tennessee’s community markets. These community markets continue to offer us opportunities to profitably grow our market share. The table below shows our presence, as of June 30, 2015, in community markets where we have over $60 million in deposits.
Top FirstBank community markets
| Market |
FB market rank |
FB branches (#) |
FB deposits ($mm) |
FB deposit market share |
Percent of total FB deposits |
|||||||||||||||
| Lexington |
1 | 3 | $ | 305 | 54.3% | 13.3% | ||||||||||||||
| Huntingdon |
2 | 2 | 119 | 23.8% | 5.2% | |||||||||||||||
| Smithville |
2 | 1 | 99 | 26.3% | 4.3% | |||||||||||||||
| Camden |
2 | 2 | 97 | 26.1% | 4.2% | |||||||||||||||
| Paris |
3 | 2 | 96 | 17.8% | 4.2% | |||||||||||||||
| Waverly |
2 | 1 | 63 | 24.2% | 2.7% | |||||||||||||||
|
|
||||||||||||||||||||
Note: Market data sourced from SNL Financial and gives pro forma effect to any acquisitions announced as of July 22, 2016 as if they occurred on June 30, 2015
6
Table of Contents
Index to Financial Statements
Market characteristics and mix.
Metropolitan markets. Our metropolitan markets are characterized by attractive demographics and strong economies and offer substantial opportunity for future growth. Our metropolitan markets collectively have approximately $108 billion of total deposits and a total population in excess of 5.2 million people, with a projected weighted average annual population growth rate of 4.9% through 2021 according to SNL Financial, as compared to a national average of 3.7%. We compete in these markets with national and regional banks that currently have the largest market share positions and with community banks primarily focused only on a particular geographic area or business niche. We believe we are well positioned to grow our market penetration among our target clients of small to medium sized businesses and the consumer base working and living in these metropolitan markets. In our experience, such clients demand the product sophistication of a larger bank, but prefer the customer service, relationship focus and local connectivity of a community bank. We believe that our size, product suite and operating model offer us a competitive advantage in these markets versus our smaller competitors, many of which are focused only on specific counties or industries. Our operating model driven by local talent with strong community ties and local authority serves as a key competitive advantage over our larger competitors. We believe that, as a result, we are well positioned to leverage our existing franchise to expand our market share in our metropolitan markets.
Community markets. Our community markets tend to be more stable throughout various economic cycles, with primarily retail and small business customer opportunities and more limited competition. This leads to an attractive profitability profile and smaller ticket, more granular loan and deposit portfolios. We increased our deposits in our community markets by 5% from 2012 through the first half of 2016. Our community markets are standalone markets and not suburbs of larger markets. We primarily compete in these markets with community banks that have less than $1 billion in total assets. We compete effectively against these smaller community banks by providing a broader and more sophisticated set of products and capabilities while still maintaining our local service model. These markets are being deemphasized by national and regional banks. As a result, we are often the employer of choice for talented bankers in these communities. We believe that our operating model and long-term success in these markets positions us well for continued growth in our existing community markets and to take advantage of attractive opportunities in other community markets.
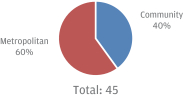
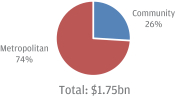
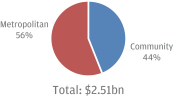
Market mix. The charts below show our branch, loan and deposit mix between our metropolitan and community markets as of June 30, 2016.
| Branches: | Loans Held for Investment: | Total deposits: | ||
|
|
| ||
Our competitive strengths
We believe the following strengths provide us with competitive advantages over other banks in our markets and provide us with the necessary foundation to successfully execute our growth strategies.
7
Table of Contents
Index to Financial Statements
Depth and experience of senior management team. We have a deep and experienced senior management team. The team, as evidenced by the leaders of our banking markets and mortgage segment highlighted below, combines long histories at FirstBank with significant market and industry knowledge gained from employment with other successful banks.
Christopher Holmes: President and Chief Executive Officer. Mr. Holmes has served as President of FirstBank since 2012 and as President and Chief Executive Officer since 2013. Originally from Lexington, Tennessee, Mr. Holmes has a background in both rural communities and urban metro centers that is uniquely suited for leadership at FirstBank. As President and Chief Executive Officer, he is responsible for leading and managing all facets of the bank’s operations, including establishing its long-term goals, strategies and corporate vision. Prior to joining FirstBank in 2010 as Chief Banking Officer, Mr. Holmes served as the Director of Corporate Financial Services and the Chief Retail Banking Officer for Greenville, S.C.-based The South Financial Group. Previously, he worked for 20 years in the Memphis market, first as a certified public accountant with Ernst & Young and then in several management positions for National Bank of Commerce (which was acquired by SunTrust) and Trustmark National Bank.
James Gordon: Chief Financial Officer. Mr. Gordon was appointed as our Chief Financial Officer in January 2016. Prior to joining us, Mr. Gordon was a Partner at Horne LLP from 2011 to 2016. Horne LLP served as our independent accounting firm before our appointment of RSM US LLP as our independent auditor in 2015 and Mr. Gordon served as our lead audit partner while at Horne. Before joining Horne, Mr. Gordon served as CFO of The South Financial Group, a large publicly traded bank holding company headquartered in Greenville, SC, from 2007 to 2010. In his capacity as CFO of The South Financial Group, his primary responsibilities included overseeing all of the accounting, financial, investor relations and related functions as well as the Mortgage, SBA Lending and Information Technology divisions. Previously, he was the Chief Risk Officer for Union Planters from 2002 to 2004, Chief Accounting Officer for National Bank of Commerce for 2004 and as Partner with PricewaterhouseCoopers and BDO.
Wilburn (Wib) Evans: President, FirstBank Ventures. As President of FirstBank Ventures, Mr. Evans has overall responsibility for our mortgage banking business and investment services, including strategies for fee income businesses. Mr. Evans joined FirstBank in 1987 as Chief Financial Officer, a position that he held for almost 10 years before being promoted to Executive Vice President in 1996 and later to Chief Operating Officer. Prior to joining FirstBank, Mr. Evans worked as a certified public accountant with BDO.
Allen Oakley: Middle and East Tennessee Regional President. In his role, Mr. Oakley oversees the banking operations in Middle and East Tennessee and plays an important role in achieving strategic growth goals for the region. Mr. Oakley has more than 33 years of banking experience, mostly in the Tennessee market. Prior to joining FirstBank in 2012, Mr. Oakley served for 5 years as Executive Vice President and Middle Tennessee Manager of the Corporate, Commercial, and Public and Institutional Groups of Regions Bank. Prior to that role, Mr. Oakley worked for SunTrust as Managing Director for the Corporate and Investment Banking Division from the late 1990’s to 2006.
David Burden: West Tennessee Regional President. In his role as the West Tennessee Regional President, Mr. Burden has authority over banking operations in Memphis, Huntsville, and West Tennessee, which includes most of our leading market share legacy markets. Mr. Burden has more than 15 years of experience at FirstBank and 30 years in banking. Before joining FirstBank, Mr. Burden held the positions of senior vice president and senior lending officer for Union Planters Bank and First American Bank. Early in his career, he served as a federal regulator for 4 years.
8
Table of Contents
Index to Financial Statements
In addition to our senior management team, our market leaders have an average of over 28 years of experience and an average tenure of 15 years with us. We believe that we also have significant depth in our overall management in lending, credit administration, finance, operations and information technology.
Strong growth coupled with profitability. We have delivered attractive growth and returns since the implementation of our strategic plan designed to leverage our competitive advantages in both metropolitan and community markets in 2012. Our execution of the plan has delivered strong growth, primarily from our Nashville metropolitan strategy and mortgage expansion, coupled with positive returns from our legacy community markets.
| 2012 | 2013 | 2014 | 2015 |
Six months ended |
||||||||||||||||
| Net Income (in millions) |
$ | 20.5 | $ | 26.9 | $ | 32.5 | $ | 47.9 | $30.4 | |||||||||||
| Pro forma net income(1) |
$ | 14.6 | $ | 18.6 | $ | 22.4 | $ | 33.1 | $20.4 | |||||||||||
| Tax-Adjusted ROAA(1) |
0.68 | % | 0.84 | % | 0.97 | % | 1.28 | % | 1.42 | % | ||||||||||
| Core Deposits (in billions)(2) |
$ | 1.74 | $ | 1.75 | $ | 1.87 | $ | 2.39 | $2.46 | |||||||||||
| Loans held for investment (in billions) |
$ | 1.24 | $ | 1.34 | $ | 1.42 | $ | 1.70 | $1.75 | |||||||||||
| Nonperforming loans/loans(3) |
4.17 | % | 2.12 | % | 1.21 | % | 0.71 | % | 0.66 | % | ||||||||||
|
|
||||||||||||||||||||
| (1) | Our pro forma net income and tax-adjusted return on average assets include a pro forma provision for federal income taxes using a combined effective income tax rate of 33.76%, 35.37%, 35.63%, 35.08% and 37.39% for the years ended December 31, 2012, 2013 and 2014 and 2015 and six months ended June 30, 2016, respectively. |
| (2) | Core deposits is a non-GAAP financial measure, and, as we calculate core deposits, the most directly comparable GAAP financial measure is total deposits. See our reconciliation of non-GAAP financial measures to their most directly comparable GAAP financial measures under the caption “Selected historical consolidated financial data: GAAP reconciliation and management explanation of non-GAAP financial measures.” |
| (3) | Excludes loans acquired from Northwest Georgia Bank, and therefore is a non-GAAP measure. See our reconciliation of non-GAAP measures to their most comparable GAAP measures under the caption “Selected historical consolidated financial data: GAAP reconciliation and management explanation of non-GAAP financial measures.” |
Ability to recruit and retain talented people. The success of our operating model, which depends on local knowledge and decision making, is directly related to our ability to attract and retain talented bankers in each of our markets. We strive to attract and retain these bankers by fostering an entrepreneurial environment, empowering them with local authority and providing them with sufficient infrastructure and resources to support their growth while also providing management with appropriate oversight. We believe that our family culture built around respect, teamwork and empowerment makes us attractive for talented bankers and associates across our geographic footprint. We pride ourselves on being a great place to work, which is evidenced by our recognition as a Top Workplace for 2015 by The Tennessean, Nashville’s principal newspaper. In the Nashville market alone, we have added 15 new bankers since 2012, including the current President of our Middle and East Tennessee region, Allen Oakley, a 32-year banking veteran.
Scalable, decentralized operating model. We operate each of our markets as individual markets, with an experienced market leader in charge of each market. Each of our market leaders and bankers is empowered to make local decisions up to specified limits set by the Bank’s board of directors and our senior management team based on experience and track record. We believe that the delivery by our bankers of in-market client decisions, coupled with strong, centralized risk and credit support, allows us to best serve our clients. This operating model has been proven successful in our existing markets and we believe it is highly replicable and scalable. We have a robust infrastructure bolstered by our recent conversion to a new core processing system in the second quarter of 2016, that can support our model as we grow in existing and new markets either organically or through opportunistic acquisitions.
9
Table of Contents
Index to Financial Statements
Disciplined and deliberate risk management. Risk management is a cornerstone of our culture and is emphasized throughout every area of the organization. Our decentralized operating model is balanced by individual lending authorities based on demonstrated experience and expertise. Larger credit decisions involve credit officers and/or senior management. We have invested in technology to monitor all credits, ensuring compliance with our policies. We strive for a balanced loan portfolio taking into consideration borrower and industry concentrations. Our risk management strategy also includes rigorous systems and processes to monitor liquidity, interest rate, operations and compliance risk.
Preferred acquirer. We have a strong record of adding value through acquisitions and have completed seven bank and two mortgage company acquisitions under our current ownership. Our acquisition of Northwest Georgia Bank is the most recent example of an attractive strategic and financial transaction. Our key operational associates have integration experience with FirstBank and other institutions. We are a disciplined acquirer focused on opportunities that meet our internal return targets, maintain or enhance our earnings per share and add to our strong core deposit franchise. Our long-term personal relationships with many of the bank owners and CEOs in our markets lead to a natural dialogue when they choose to explore a sale of their company. Additionally, we believe that our size and ability to operate effectively in both community and metropolitan markets make us an attractive option to smaller banks seeking an acquirer.
Our business strategy
We believe there are significant growth opportunities across our footprint. Our competitive strengths position us to take advantage of these opportunities to deliver strong growth and attractive returns by focusing on the following core strategies.
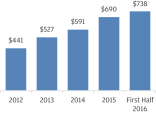
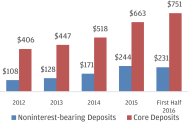
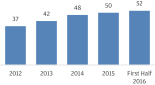
Enhance market penetration in metropolitan markets. In recent years, we have successfully grown our franchise in the Nashville MSA by executing our metropolitan growth strategy. The strategy is centered on the following: recruiting the best bankers and empowering them with local authority; developing branch density; building brand awareness and growing our business and consumer banking presence; and expanding our product offering and capabilities. These strategies coupled with our personalized, relationship-based client service have contributed significantly to our success. Additionally, we believe that our scale, resources and sophisticated range of products provides us with a competitive advantage over the smaller community banks in the Nashville MSA and our other MSAs. As a result of these competitive advantages and growth strategies, the Nashville MSA has become our largest market. With approximately a 1.6% market share, based on deposits as of June 30, 2015, we are still in the early stage of executing our Nashville growth strategy and intend to continue to efficiently increase our market penetration. The following charts show our significant growth in the Nashville MSA since 2012.
| Nashville loans ($ in millions)
|
Nashville deposits ($ in millions)
|
Nashville bankers (#)
| ||
|
|
|
Note: The loan and deposit charts reflect our loans, noninterest bearing deposits and core deposits in our Nashville market as of the end of each period. The banker chart reflects the total number of our bankers in our Nashville market as of the end of each period.
10
Table of Contents
Index to Financial Statements
Based on market and competitive similarities, we believe our growth strategies are transferable to our other metropolitan markets. We intend to implement these strategies with an initial focus on the Chattanooga MSA. Our acquisition of Northwest Georgia Bank will accelerate our growth in Chattanooga and, we believe, will give us the necessary scale to enhance operating leverage and drive profitability in that market.
Pursue opportunistic acquisitions. While most of our growth has been organic, we have completed nine acquisitions under our current ownership, including our recent acquisition of Northwest Georgia Bank. We pursue acquisition opportunities that meet our internal return targets, enhance market penetration, and possess strong core deposits. We believe that numerous small to mid-sized banks or branch networks will be available for acquisition in metropolitan and community markets throughout Tennessee as well as in attractive contiguous markets in the coming years due to industry trends, such as scale and operational challenges, regulatory pressure, management succession issues and shareholder liquidity needs. In Tennessee alone, there are approximately 150 banks with total assets of less than $1 billion. We believe that we are positioned as a natural consolidator because of our financial strength, reputation and operating model.
Improve efficiency by leveraging technology and consolidating operations. We have invested significantly in our bankers, infrastructure and technology in recent years, including our conversion to a new core processing system in the second quarter of 2016, which we believe has created a scalable platform that will support future growth across all of our markets. Our bankers and branches, especially in the Nashville MSA, continue to scale in size and we believe there is capacity to grow our business without adding significantly to our branch network. We plan to continue to invest, as needed, in our technology and business infrastructure to support our future growth and increase operating efficiencies. We intend to leverage these investments to consolidate and centralize our operations and support functions while protecting our decentralized client service model.
Seize opportunities to expand noninterest income. While our primary focus is on capturing opportunities in our core banking business, we have successfully seized opportunities to grow our noninterest income by providing our people with the flexibility to take advantage of market opportunities. As part of our strategic focus to grow our noninterest income, we have significantly expanded our mortgage business by hiring experienced loan officers, implementing our consumer direct internet delivery channel in 2014 and offering our mortgage clients the personalized attention that is the cornerstone of our Bank. As a result, our mortgage banking income has grown from $19.0 million in annual revenues in 2012 to $70.2 million in annual revenues in 2015 and has already generated $54.6 million in revenues during the first half of 2016. We have also successfully expanded our fee-based businesses to include more robust treasury management and investment services. We intend to continue emphasizing these business lines, which we believe will serve as strong customer acquisition channels and provide us with a range of cross-selling opportunities, while making our business stronger and more profitable.
Our corporate information
Our principal executive office is located at 211 Commerce Street, Suite 300, Nashville, Tennessee 37201, and our telephone number is (615) 313-0080. Through FirstBank, we maintain an Internet website at www.firstbankonline.com. The information contained on or accessible from our website does not constitute a part of this prospectus and is not incorporated by reference herein.
11
Table of Contents
Index to Financial Statements
The following summary of the offering contains basic information about the offering and our common stock and is not intended to be complete. It does not contain all the information that may be important to you. For a more complete understanding of our common stock, please refer to the section of this prospectus entitled “Description of our capital stock.”
| Common stock offered by us |
5,882,352 shares. |
| 6,764,704 shares if the underwriters’ option is exercised in full. |
| Common stock to be outstanding after this offering |
23,121,176 shares. |
| 24,003,528 shares if the underwriters’ option is exercised in full. |
| Unless otherwise noted, references in this prospectus to the number of shares of our common stock outstanding after this offering are based on 17,180,000 shares of our common stock issued and outstanding as of August 31, 2016 and the 58,824 fully vested shares of our common stock being granted in connection with this offering to certain of our employees, and exclude the 727,257 shares of our common stock issuable upon the optional stock settlement of our outstanding EBI Units, the 917,648 shares of our common stock underlying the restricted stock units and deferred stock units being granted in connection with this offering and the additional 1,723,528 shares of our common stock reserved for future issuance under our 2016 Incentive Plan and the 2,500,000 shares of our common stock reserved for future issuance under our Employee Stock Purchase Plan, and in every case assumes an initial public offering price of $17.00 per share (the midpoint of the range set forth on the cover page of this prospectus). For a summary of the equity awards being granted to certain of our executive officers and employees in connection with this offering and the conversion of outstanding EBI plan units (at the plan participants’ option) and Mr. Holmes’ existing deferred compensation arrangement from cash settled awards to stock settled awards in connection with this offering, see “Executive compensation and other matters: Summary of one-time IPO equity awards, conversion of deferred compensation and conversion of EBI units.” Except as otherwise indicated, references in this prospectus to the number of shares of our common stock outstanding after this offering do not give effect to the exercise of the underwriters’ option to purchase additional shares of our common stock from us. |
| Use of proceeds |
We estimate that the net proceeds to us from this offering, after deducting underwriting discounts and commissions and the estimated offering expenses, will be approximately $89.1 million, or approximately $103.1 million if the underwriters’ option is exercised in full, assuming an initial offering price of $17.00 per share (the midpoint of the range set forth on the cover page of this prospectus). We intend to use approximately $65.1 million of the net proceeds to |
12
Table of Contents
Index to Financial Statements
| us from this offering to (i) fund the $55 million distribution to our sole shareholder described below and (ii) subject to regulatory approval, to repay all $10.1 million aggregate principal amount of subordinated notes held by our sole shareholder, plus any accrued and unpaid interest thereon. We intend to use the remaining net proceeds to us from this offering to support our growth, including to fund organic growth and implement our strategic initiatives, which may include the potential expansion of our business through opportunistic acquisitions, for working capital and other general corporate purposes, and to strengthen our regulatory capital position. |
| See “Use of proceeds.” |
| Distribution to our sole shareholder |
We have in excess of $55 million of S Corporation earnings, which have been, or will be, taxed to our sole shareholder, but have not been distributed to him. As a result and in connection with the termination of our status as an S Corporation, we are able to make a cash distribution to our sole shareholder in an amount equal to these taxed, yet undistributed, earnings that is intended to be non-taxable to him. |
| In connection with this offering, our board of directors has approved a cash distribution to our sole shareholder in the amount of $55 million, which is intended to be non-taxable to our sole shareholder and represents a significant portion of our S Corporation earnings that have been, or will be, taxed to our sole shareholder, but not distributed to him. The distribution is contingent upon, and payable to our sole shareholder immediately following, the closing of this offering. Purchasers of our common stock in this offering will not be entitled to receive any portion of this distribution. We also intend to make a distribution to our sole shareholder in an amount between $4 million and $5 million prior to the completion of this offering to fund the payment of the estimated third quarter taxes that will be “passed through” to him by virtue of our status as an S Corporation. |
| In addition, subject to regulatory approval, we intend to use a portion of the net proceeds to us from this offering to fund the repayment of all $10.1 million aggregate principal amount of the subordinated notes held by our sole shareholder, plus any accrued and unpaid interest thereon. |
| Dividend policy |
Historically, we have been an S Corporation, and as such, we have paid distributions to our sole shareholder to assist him in paying the U.S. federal income taxes on our taxable income that is “passed through” to him as well as additional amounts for returns on capital. Following this offering, our dividend policy and practice will change because we will be taxed as a C Corporation and, therefore, we will no longer pay distributions to provide our shareholders with funds to pay U.S. federal income tax on their pro rata portion of our taxable income. |
| After this offering, we intend to retain our future earnings, if any, to fund the development and growth of our business and we do not anticipate paying any dividends to the holders of our common stock in the foreseeable future. |
13
Table of Contents
Index to Financial Statements
| For additional information, see “Dividend policy.” |
| Directed share program |
At our request, the underwriters have reserved up to 12.5% of the common stock being offered by this prospectus for sale at the initial public offering price to our directors, officers, and other individuals associated with us and members of their families. The sales will be made by UBS Financial Services Inc., a selected dealer affiliated with UBS Securities LLC, an underwriter of this offering, through a directed share program. We do not know if these persons will choose to purchase all or any portion of these reserved shares, but any purchases they do make will reduce the number of shares available to the general public. Any reserved shares not so purchased will be offered by the underwriters to the general public on the same terms as the other shares of common stock. Participants in the directed share program who purchase more than $250,000 of shares shall be subject to a 60-day lock-up with respect to any shares sold to them pursuant to that program. This lock-up will have similar restrictions and an identical extension provision to the lock-up agreements described below. Any shares sold in the directed share program to our directors, executive officers or selling stockholders shall be subject to the lock-up agreements described below. UBS Financial Services Inc. will receive a customary selling concession with respect to shares sold through the directed share program. See “Underwriting.” |
| New York Stock Exchange listing |
Our common stock has been approved for listing on the New York Stock Exchange under the symbol “FBK.” |
| Risk factors |
An investment in shares of our common stock involves a high degree of risk. You should carefully read and consider the risks discussed in the “Risk factors” and “Cautionary note regarding forward-looking statements” sections of this prospectus and all other information in this prospectus before making a decision to invest in shares of our common stock. |
14
Table of Contents
Index to Financial Statements
Summary historical consolidated financial data
The following tables set forth (i) our summary historical condensed consolidated financial data as of and for six months ended June 30, 2016 and 2015, (ii) our summary consolidated financial data as of and for the years ended December 31, 2015, 2014 and 2013, (iii) other data as of and for the periods indicated and (iv) certain pro forma information to reflect our conversion from a subchapter S Corporation to a C Corporation in connection with this offering as if it had occurred at the beginning of each period. The summary historical consolidated financial data as of and for the years ended December 31, 2015, 2014 and 2013 have been derived from, and qualified by reference to, the Company’s audited financial statements included elsewhere in this prospectus and should be read in conjunction with those consolidated financial statements and notes thereto. The summary historical consolidated financial data as of and for the six months ended June 30, 2016 and 2015 have been derived from our unaudited interim consolidated financial statements included elsewhere in this prospectus. The summary historical consolidated financial data reflects the 100-for-one stock split that was effectuated prior to this offering. As such, all share and per share amounts have been retroactively adjusted to reflect the stock split for all periods presented and are based on 17,180,000 shares of our common stock outstanding as of June 30, 2016 and 2015 and December 31, 2015, 2014 and 2013 after giving effect to such stock split.
The following summary historical consolidated financial data of the Company should be read in conjunction with, and are qualified by reference to, “Management’s discussion and analysis of financial condition and results of operations” and the consolidated financial statements and notes thereto included elsewhere in this prospectus. Our historical results for any prior period are not necessarily indicative of results to be expected in any future period.
| As of and for the six months ended June 30, (unaudited) |
As of and for year ended December 31, | |||||||||||||||||||
| (dollars in thousands, except per share data and ratio) | ||||||||||||||||||||
| 2016 | 2015 | 2015 | 2014 | 2013 | ||||||||||||||||
| Statement of Income Data |
||||||||||||||||||||
| Total interest income |
$ | 58,922 | $ | 48,846 | $ | 102,782 | $ | 92,889 | $ | 87,082 | ||||||||||
| Total interest expense |
4,621 | 4,405 | 8,910 | 9,513 | 11,606 | |||||||||||||||
|
|
|
|||||||||||||||||||
| Net interest income |
54,301 | 44,441 | 93,872 | 83,376 | 75,476 | |||||||||||||||
| Provision for loan losses |
(798 | ) | 222 | (3,064 | ) | (2,716 | ) | (1,519 | ) | |||||||||||
| Total noninterest income |
69,391 | 41,223 | 92,380 | 50,802 | 41,386 | |||||||||||||||
| Total noninterest expense |
91,942 | 61,033 | 138,492 | 102,163 | 89,584 | |||||||||||||||
|
|
|
|||||||||||||||||||
| Net income before income taxes |
32,548 | 24,409 | 50,824 | 34,731 | 28,797 | |||||||||||||||
| State income tax expense |
2,174 | 1,649 | 2,968 | 2,269 | 1,894 | |||||||||||||||
|
|
|
|||||||||||||||||||
| Net income |
$ | 30,374 | $ | 22,760 | $ | 47,856 | $ | 32,462 | $ | 26,903 | ||||||||||
|
|
|
|||||||||||||||||||
| Net interest income (tax—equivalent |
$ | 55,412 | $ | 45,472 | $ | 95,887 | $ | 85,487 | $ | 77,640 | ||||||||||
| Per Common Share |
||||||||||||||||||||
| Basic and diluted net income |
$ | 1.77 | $ | 1.32 | $ | 2.79 | $ | 1.89 | $ | 1.57 | ||||||||||
| Book value(1)(2) |
15.47 | 13.19 | 13.78 | 12.53 | 11.04 | |||||||||||||||
| Tangible book value(2)(6) |
12.41 | 10.30 | 10.66 | 9.59 | 8.01 | |||||||||||||||
|
|
||||||||||||||||||||
15
Table of Contents
Index to Financial Statements
| As of and for the six months ended June 30, (unaudited) |
As of and for year ended December 31, | |||||||||||||||||||
| (dollars in thousands, except per share data and ratio) | ||||||||||||||||||||
| 2016 | 2015 | 2015 | 2014 | 2013 | ||||||||||||||||
| Pro Forma Statement of Income and Per Common Share Data(2)(5) |
||||||||||||||||||||
| Pro forma combined provision for income tax |
$ | 12,169 | $ | 8,964 | $ | 17,896 | $ | 12,374 | $ | 10,185 | ||||||||||
| Pro forma net income |
20,379 | 15,445 | 33,118 | 22,357 | 18,612 | |||||||||||||||
| Pro forma net income per common share—basic and diluted |
1.19 | 0.90 | 1.93 | 1.30 | 1.08 | |||||||||||||||
| Summary Balance Sheet Data |
||||||||||||||||||||
| Cash and due from banks |
$ | 52,122 | $ | 56,119 | $ | 53,893 | $ | 40,093 | $ | 41,943 | ||||||||||
| Loans held for investment |
1,750,304 | 1,507,632 | 1,701,863 | 1,415,896 | 1,341,347 | |||||||||||||||
| Allowance for loan losses |
(23,734 | ) | (29,030 | ) | (24,460 | ) | (29,030 | ) | (32,353 | ) | ||||||||||
| Loans held for sale |
322,249 | 328,300 | 273,196 | 194,745 | 61,062 | |||||||||||||||
| Available-for-sale securities, fair value |
550,307 | 573,179 | 649,387 | 652,601 | 685,547 | |||||||||||||||
| Foreclosed real estate, net |
9,902 | 6,199 | 11,641 | 7,259 | 8,796 | |||||||||||||||
| Total assets |
2,917,958 | 2,532,836 | 2,899,420 | 2,428,189 | 2,258,387 | |||||||||||||||
| Total deposits |
2,514,297 | 2,026,505 | 2,438,474 | 1,923,569 | 1,803,567 | |||||||||||||||
| Core deposits(6) |
2,455,298 | 1,975,861 | 2,386,154 | 1,866,535 | 1,745,492 | |||||||||||||||
| Borrowings |
55,785 | 135,988 | 74,616 | 143,850 | 137,861 | |||||||||||||||
| Total shareholder’s equity(2) |
265,768 | 226,607 | 236,674 | 215,228 | 189,687 | |||||||||||||||
| Summary Ratios |
||||||||||||||||||||
| Return on average: |
||||||||||||||||||||
| Assets(3) |
2.11% | 1.86% | 1.86% | 1.40% | 1.22% | |||||||||||||||
| Shareholder’s equity(3) |
23.94% | 20.46% | 20.91% | 15.94% | 13.98% | |||||||||||||||
| Average shareholder’s equity to average assets |
8.82% | 9.09% | 8.88% | 8.81% | 8.73% | |||||||||||||||
| Net interest margin (tax-equivalent basis)(6) |
4.20% | 4.02% | 3.97% | 3.93% | 3.75% | |||||||||||||||
| Efficiency ratio (tax-equivalent basis)(6) |
69.54% | 71.60% | 73.26% | 76.15% | 75.43% | |||||||||||||||
| Loans to deposit ratio |
69.61% | 74.40% | 69.79% | 73.61% | 74.37% | |||||||||||||||
| Yield on interest-earning assets |
4.55% | 4.41% | 4.34% | 4.37% | 4.31% | |||||||||||||||
| Cost of interest-bearing liabilities |
0.47% | 0.51% | 0.49% | 0.56% | 0.70% | |||||||||||||||
| Cost of total deposits |
0.28% | 0.32% | 0.30% | 0.36% | 0.48% | |||||||||||||||
| Pro Forma Summary Ratios |
||||||||||||||||||||
| Pro forma return on average assets(3)(5) |
1.42% | 1.27% | 1.28% | 0.97% | 0.84% | |||||||||||||||
| Pro forma return on average equity(3)(5) |
16.06% | 13.91% | 14.47% | 10.98% | 9.67% | |||||||||||||||
|
|
||||||||||||||||||||
16
Table of Contents
Index to Financial Statements
| As of and for the six months ended June 30, (unaudited) |
As of and for year ended December 31, | |||||||||||||||||||
| (dollars in thousands, except per share data and ratio) | ||||||||||||||||||||
| 2016 | 2015 | 2015 | 2014 | 2013 | ||||||||||||||||
| Credit Quality Ratios |
||||||||||||||||||||
| Allowance for loan losses to loans, net of unearned |
1.41% | 1.93% | 1.50% | 2.05% | 2.41% | |||||||||||||||
| Allowance for loan losses to nonperforming loans |
213.70% | 177.09% | 211.10% | 168.75% | 113.83% | |||||||||||||||
| Nonperforming loans to loans, net of unearned |
0.66% | 1.09% | 0.68% | 1.21% | 2.12% | |||||||||||||||
| Capital Ratios (Company) |
||||||||||||||||||||
| Shareholder’s equity to assets |
9.11% | 8.95% | 8.16% | 8.86% | 8.40% | |||||||||||||||
| Tier 1 leverage capital (to average assets) |
7.98% | 8.35% | 7.64% | 8.10% | 7.97% | |||||||||||||||
| Tier 1 capital (to risk-weighted assets(4) |
9.57% | 10.63% | 9.58% | 11.32% | 11.47% | |||||||||||||||
| Total capital (to risk-weighted assets)(4) |
11.00% | 12.40% | 11.15% | 13.18% | 13.41% | |||||||||||||||
| Tangible common equity to tangible assets(6) |
7.44% | 7.13% | 6.43% | 6.93% | 6.24% | |||||||||||||||
| Common Equity Tier 1 (to risk-weighted assets) (CET1)(4) |
8.30% | 9.07% | 8.23% | N/A | N/A | |||||||||||||||
| Capital Ratios (Bank) |
||||||||||||||||||||
| Shareholder’s equity to assets |
10.12% | 10.11% | 9.17% | 10.09% | 9.73% | |||||||||||||||
| Tier 1 leverage capital (to average assets) |
8.02% | 8.31% | 7.65% | 8.10% | 7.98% | |||||||||||||||
| Tier 1 capital (to risk-weighted assets)(4) |
9.65% | 10.66% | 9.63% | 11.34% | 11.54% | |||||||||||||||
| Total capital to (risk-weighted assets)(4) |
10.92% | 12.22% | 11.02% | 12.96% | 13.20% | |||||||||||||||
| Tangible common equity to tangible assets(6) |
8.47% | 8.31% | 7.46% | 8.47% | 7.60% | |||||||||||||||
| Common Equity Tier 1 (to risk-weighted assets) (CET1)(4) |
9.65% | 10.66% | 9.63% | N/A | N/A | |||||||||||||||
|
|
||||||||||||||||||||
| (1) | Book value per share equals our total shareholder’s equity as of the date presented divided by the number of shares of our common stock outstanding as of the date presented. The number of shares of our common stock outstanding as of June 30, 2016 and 2015 and December 31, 2015, 2014 and 2013 was 17,180,000. |
| (2) | If we gave effect to our conversion from a subchapter S Corporation to a subchapter C Corporation in connection with this offering as of June 30, 2016, we would have recorded a deferred tax liability of approximately $15.1 million along with a corresponding $12.8 million decrease to shareholder’s equity. This pro forma adjustment is not reflected in the amounts presented above. |
| (3) | We have calculated our return on average assets and return on average equity for a year by dividing net income for that period by our average assets and average equity, as the case may be, for that period. We have calculated our pro forma return on average assets and pro forma return |
17
Table of Contents
Index to Financial Statements
| on average equity for a period by calculating our pro forma net income for that period as described in footnote 5 below and dividing that by our average assets and average equity, as the case be, for that period. We calculate our average assets and average equity for a period by dividing the sum of our total asset balance or total stockholder’s equity balance, as the case may be, as of the close of business on each day in the relevant period and dividing by the number of days in the period. |
| (4) | We calculate our risk-weighted assets using the standardized method of the Basel III Framework as of December 31, 2015 and June 30, 2016 and the Basel II Framework for all previous periods, as implemented by the Federal Reserve and the FDIC. |
| (5) | We have calculated our pro forma net income, pro forma net income per share, pro forma returns on average assets and pro forma return on average equity for each period shown by calculating a pro forma provision for federal income tax using an assumed combined effective income tax rate of 37.39% and 36.72% for six months ended June 30, 2016 and 2015 and 35.08%, 35.63% and 35.37% for the years ended December 31, 2015, 2014 and 2013, respectively, and adjusting our historical net income for each period to give effect to the pro forma provision for U.S. federal income tax for such period. |
| (6) | These measures are not measures recognized under generally accepted accounting principles (United States) (“GAAP”), and are therefore considered to be non-GAAP financial measures. See “GAAP reconciliation and management explanation of non-GAAP financial measures” for a reconciliation of these measures to their most comparable GAAP measures. |
| (7) | Excludes loans acquired from Northwest Georgia Bank. |
GAAP reconciliation and management explanation of non-GAAP financial measures
We identify certain of the financial measures discussed in our summary historical consolidated financial data as being “non-GAAP financial measures.” In accordance with the SEC’s rules, we classify a financial measure as being a non-GAAP financial measure if that financial measure excludes or includes amounts, or is subject to adjustments that have the effect of excluding or including amounts, that are included or excluded, as the case may be, in the most directly comparable measure calculated and presented in accordance with generally accepted accounting principles as in effect from time to time in the United States in our statements of income, balance sheets or statements of cash flows.
Net interest income (tax-equivalent basis), net interest margin (tax-equivalent basis) and efficiency ratios (tax-equivalent basis) include the effects of taxable-equivalent adjustments using a combined federal and state income tax rate of 39.225% to increase tax-exempt interest income to a tax-equivalent basis.
The non-GAAP financial measures that we discuss in our summary historical consolidated financial data should not be considered in isolation or as a substitute for the most directly comparable or other financial measures calculated in accordance with GAAP. Moreover, the manner in which we calculate the non-GAAP financial measures that we discuss in our summary historical consolidated financial data may differ from that of other companies reporting measures with similar names. You should understand how such other banking organizations calculate their financial measures similar or with names similar to the non-GAAP financial measures we have discussed in our summary historical consolidated financial data when comparing such non-GAAP financial measures. The following reconciliation table provides a more detailed analysis of these non-GAAP financial measures
Tax-equivalent net interest income and net interest margin
Net Interest Income on a tax-equivalent basis is a non-GAAP measure that adjusts for the tax-favored status of net interest income from loans and investments. We believe this measure to be the preferred industry measurement of net interest income and it enhances comparability of net interest income arising from taxable and tax-exempt sources. The most directly comparable financial measure calculated in accordance with GAAP is our net interest income.
Net interest margin on a tax-equivalent basis is net interest income on a tax-equivalent basis divided by average interest-earning assets on a tax-equivalent basis. The most directly comparable financial measure calculated in accordance with GAAP is net interest margin.
18
Table of Contents
Index to Financial Statements
The following table presents, as of the dates set forth below, net interest income on a tax-equivalent basis compared with net interest income and presents net interest margin on a tax-equivalent basis compared with net interest margin:
| Six months June 30, |
Six months June 30, |
Year ended December 31, | ||||||||||||||||||
| (dollars in thousands) | (unaudited) | (unaudited) | 2015 | 2014 | 2013 | |||||||||||||||
| Net interest income (tax-equivalent basis) |
||||||||||||||||||||
| Net Interest Income |
$ | 54,301 | $ | 44,441 | $ | 93,872 | $ | 83,376 | $ | 75,476 | ||||||||||
| Adjustments: |
||||||||||||||||||||
| Tax-equivalent adjustment |
1,111 | 1,031 | 2,015 | 2,111 | 2,164 | |||||||||||||||
|
|
|
|||||||||||||||||||
| Net interest income (tax-equivalent basis) |
$ | 55,412 | $ | 45,472 | $ | 95,887 | $ | 85,487 | $ | 77,640 | ||||||||||
|
|
|
|||||||||||||||||||
| Net interest margin (tax-equivalent basis) |
||||||||||||||||||||
| Net Interest Margin |
4.11% | 3.93% | 3.89% | 3.83% | 3.65% | |||||||||||||||
| Adjustments: |
||||||||||||||||||||
| Tax-equivalent adjustment |
0.08% | 0.09% | 0.08% | 0.10% | 0.10% | |||||||||||||||
|
|
|
|||||||||||||||||||
| Net interest margin (tax-equivalent basis) |
4.20% | 4.02% | 3.97% | 3.93% | 3.75% | |||||||||||||||
|
|
||||||||||||||||||||
Tax-equivalent efficiency ratio
The efficiency ratio on a tax-equivalent basis is a non-GAAP measure that provides a measure of productivity in the banking industry. This ratio is calculated to measure the cost of generating one dollar of revenue. That is, the ratio is designed to reflect the percentage of one dollar which must be expended to generate that dollar of revenue. We calculate this ratio by dividing noninterest expense by the sum of net interest income on a tax-equivalent basis and noninterest income, excluding gains (losses) on sales of investment securities.
19
Table of Contents
Index to Financial Statements
The following table presents, as of the dates set forth below, the calculation of our efficiency ratio on a tax-equivalent basis.
| Six months June 30, |
Six months June 30, |
Year ended December 31, | ||||||||||||||||||
| (dollars in thousands, except per share data) | (unaudited) | (unaudited) | 2015 | 2014 | 2013 | |||||||||||||||
| Efficiency ratio (tax-equivalent basis) |
||||||||||||||||||||
| Total noninterest expense |
$ | 91,942 | $ | 61,033 | $ | 138,492 | $ | 102,163 | $ | 89,584 | ||||||||||
| Less merger and conversion expenses |
2,146 | 287 | 3,543 | — | — | |||||||||||||||
| Less temporary impairment of mortgage servicing rights |
5,687 | — | 194 | — | — | |||||||||||||||
|
|
|
|||||||||||||||||||
| Adjusted noninterest expense |
84,109 | 60,746 | 134,755 | 102,163 | 89,584 | |||||||||||||||
| Net interest income (tax-equivalent basis) |
55,412 | 45,472 | 95,887 | 85,487 | 77,640 | |||||||||||||||
| Total noninterest income |
69,391 | 41,223 | 92,380 | 50,802 | 41,386 | |||||||||||||||
| Less bargain purchase gain |
— | — | 2,794 | — | — | |||||||||||||||
| Less gain on sales or write-downs of other real estate |
(142 | ) | 62 | (317 | ) | 132 | 225 | |||||||||||||
| Less gain on sales of securities |
3,991 | 1,795 | 1,844 | 2,000 | 34 | |||||||||||||||
|
|
|
|||||||||||||||||||
| Adjusted noninterest income |
65,542 | 39,366 | 88,059 | 48,670 | 41,127 | |||||||||||||||
|
|
|
|||||||||||||||||||
| Adjusted operating revenue |
120,954 | 84,838 | 183,946 | 134,157 | 118,767 | |||||||||||||||
|
|
|
|||||||||||||||||||
| Efficiency ratio (tax-equivalent basis) |
69.54% | 71.60% | 73.26% | 76.15% | 75.43% | |||||||||||||||
|
|
||||||||||||||||||||
Tangible book value per common share and tangible common equity to tangible assets
Tangible book value per common share and tangible common equity to tangible assets are non-GAAP measures generally used by investors to evaluate capital adequacy. We calculate: (i) tangible common equity as total shareholder’s equity less goodwill and other intangible assets; (ii) tangible assets as total assets less goodwill and other intangible assets, (iii) tangible book value per common share as tangible common equity (as described in clause (i)) divided by shares of common stock outstanding and (iv) tangible common equity to tangible assets is the ratio of tangible common equity (as described in clause (i)) to tangible assets (as described in clause (ii)). For tangible book value per common share, the most directly comparable financial measure calculated in accordance with GAAP is our book value per common share and for tangible common equity to tangible assets, the most directly comparable financial measure calculated in accordance with GAAP is our total shareholder’s equity to total assets.
We believe that these non-GAAP financial measures are important information to be provided to you because, as do our management, banking regulators, many investors, you can use the tangible book value in conjunction with more traditional bank capital ratios to assess our capital adequacy without the effect of our goodwill and other intangible assets and compare our capital adequacy with the capital adequacy of other banking organizations with significant amounts of goodwill and/or other intangible assets, which typically stem from the use of the purchase accounting method of accounting for mergers and acquisitions.
20
Table of Contents
Index to Financial Statements
The following table presents, as of the dates set forth below, tangible common equity compared with total shareholder’s equity, tangible book value per common share compared with our book value per common share and common equity to tangible assets compared to total shareholder’s equity to total assets:
| As of June 30, 2016 |
As of June 30, 2015 |
As of December 31, | ||||||||||||||||||
| (dollars in thousands, except per share data) | (unaudited) | (unaudited) | 2015 | 2014 | 2013 | |||||||||||||||
| Tangible Assets |
||||||||||||||||||||
| Total assets |
$ | 2,917,958 | $ | 2,532,836 | $ | 2,899,420 | $ | 2,428,189 | $ | 2,258,387 | ||||||||||
| Adjustments: |
||||||||||||||||||||
| Goodwill |
(46,867 | ) | (46,904 | ) | (46,904 | ) | (46,904 | ) | (46,904 | ) | ||||||||||
| Core deposit intangibles |
(5,616 | ) | (2,689 | ) | (6,695 | ) | (3,495 | ) | (5,108 | ) | ||||||||||
|
|
|
|||||||||||||||||||
| Tangible assets |
$ | 2,865,475 | $ | 2,483,243 | $ | 2,845,821 | $ | 2,377,790 | $ | 2,206,375 | ||||||||||
|
|
|
|||||||||||||||||||
| Tangible Common Equity |
||||||||||||||||||||
| Total shareholder’s equity |
$ | 265,768 | $ | 226,607 | $ | 236,674 | $ | 215,228 | $ | 189,687 | ||||||||||
| Adjustments: |
||||||||||||||||||||
| Goodwill |
(46,867 | ) | (46,904 | ) | (46,904 | ) | (46,904 | ) | (46,904 | ) | ||||||||||
| Core deposit intangibles |
(5,616 | ) | (2,689 | ) | (6,695 | ) | (3,495 | ) | (5,108 | ) | ||||||||||
|
|
|
|||||||||||||||||||
| Tangible common equity |
$ | 213,285 | $ | 177,014 | $ | 183,075 | $ | 164,829 | $ | 137,675 | ||||||||||
|
|
|
|||||||||||||||||||
| Common shares outstanding |
17,180,000 | 17,180,000 | 17,180,000 | 17,180,000 | 17,180,000 | |||||||||||||||
| Book value per common share |
$ | 15.47 | $ | 13.19 | $ | 13.78 | $ | 12.53 | $ | 11.04 | ||||||||||
| Tangible book value per common share |
12.41 | 10.30 | 10.66 | 9.59 | 8.01 | |||||||||||||||
| Total shareholder’s equity to total assets |
9.11% | 8.95% | 8.16% | 8.86% | 8.40% | |||||||||||||||
| Tangible common equity to tangible assets |
7.44% | 7.13% | 6.43% | 6.93% | 6.24% | |||||||||||||||
|
|
||||||||||||||||||||
Core deposits
Core deposits are a non-GAAP measure used by management and investors to evaluate organic growth of deposits and the quality of deposits as a funding source. We calculate core deposits by excluding jumbo time deposits (greater than $250,000) from total deposits. For core deposits the most directly comparable financial measure calculated in accordance with GAAP is total deposits.
The following table presents, as of the dates set forth below, core deposits compared total deposits:
| June 30, 2016 | June 30, 2015 | As of December 31, | ||||||||||||||||||
| (dollars in thousands) | (unaudited) | (unaudited) | 2015 | 2014 | 2013 | |||||||||||||||
| Core deposits |
||||||||||||||||||||
| Total deposits |
$ | 2,514,297 | $ | 2,026,505 | $ | 2,438,474 | $ | 1,923,569 | $ | 1,803,567 | ||||||||||
| Less jumbo time deposits |
58,999 | 50,644 | 52,320 | 57,034 | 58,075 | |||||||||||||||
|
|
|
|||||||||||||||||||
| Core deposits |
$ | 2,455,298 | $ | 1,975,861 | $ | 2,386,154 | $ | 1,866,535 | $ | 1,745,492 | ||||||||||
|
|
||||||||||||||||||||
21
Table of Contents
Index to Financial Statements
Allowance for loan losses to loans, net of unearned income and nonperforming loans to loans, net of unearned income
Allowance for loan losses to loans, net of unearned income, and nonperforming loans to loans, net of unearned income, are financial measures used to determine the credit quality of our loan portfolio. Due to the difference of accounting for and disclosing acquired loans, we believe that excluding the acquired loans from our credit quality measures provides a more meaningful representation of our credit quality. For allowance for loan losses to loans, net of unearned income, and nonperforming loans to loans, net of unearned income, the most directly comparable financial measure calculated in accordance with GAAP is the allowance for loan losses and nonperforming loans, respectively.
The following table presents, as of the dates set forth below, allowance for loan losses to loans, net of unearned income, and nonperforming loans to loans, net of unearned income:
| As of June 30, 2016 (unaudited) |
As of June 30, 2015 |
As of December 31, | ||||||||||||||||||
| (dollars in thousands) | 2015 | 2014 | 2013 | |||||||||||||||||
| Allowance for loan losses |
$ | 23,734 | $ | 29,030 | $ | 24,460 | $ | 29,030 | $ | 32,353 | ||||||||||
| Loans, net of unearned income |
1,750,304 | 1,507,632 | $ | 1,701,863 | $ | 1,415,896 | $ | 1,341,347 | ||||||||||||
|
|
|
|||||||||||||||||||
| Adjustments: |
||||||||||||||||||||
| Less acquired loans, net of unearned income |
62,173 | — | 76,601 | — | — | |||||||||||||||
|
|
|
|||||||||||||||||||
| Adjusted loans, net of unearned income |
$ | 1,688,131 | $ | 1,507,632 | $ | 1,625,262 | $ | 1,415,896 | $ | 1,341,347 | ||||||||||
|
|
|
|||||||||||||||||||
| Allowance for loan losses to loans, net of unearned income |
1.36% | 1.93% | 1.44% | 2.05% | 2.41% | |||||||||||||||
|
|
|
|||||||||||||||||||
| Adjustment: |
||||||||||||||||||||
| Acquired loans, net of unearned income |
0.05% | 0.00% | 0.06% | 0.00% | 0.00% | |||||||||||||||
|
|
|
|||||||||||||||||||
| Adjusted allowance for loan losses to loans, net of unearned income |
1.41% | 1.93% | 1.50% | 2.05% | 2.41% | |||||||||||||||
|
|
||||||||||||||||||||
22
Table of Contents
Index to Financial Statements
| As of June 30, 2016 (unaudited) |
As of June 30, 2015 (unaudited) |
As of December 31, | ||||||||||||||||||
| (dollars in thousands) | 2015 | 2014 | 2013 | |||||||||||||||||
| Nonperforming loans |
$ | 11,106 | $ | 16,393 | $ | 11,587 | $ | 17,203 | $ | 28,422 | ||||||||||
| Loans, net of unearned income |
1,750,304 | 1,507,632 | 1,701,863 | 1,415,896 | 1,341,347 | |||||||||||||||
|
|
|
|||||||||||||||||||
| Adjustments: |
||||||||||||||||||||
| Less acquired loans, net of unearned income |
62,173 | — | 76,601 | — | — | |||||||||||||||
|
|
|
|||||||||||||||||||
| Total loans, net of unearned income |
$ | 1,688,131 | $ | 1,507,632 | $ | 1,625,262 | $ | 1,415,896 | $ | 1,341,347 | ||||||||||
|
|
|
|||||||||||||||||||
| Nonperforming loans to loans, net of unearned income |
0.63% | 1.09% | 0.68% | 1.21% | 2.12% | |||||||||||||||
|
|
|
|||||||||||||||||||
| Adjustment: |
||||||||||||||||||||
| Acquired loans, net of unearned income |
0.03% | 0.00% | 0.03% | 0.00% | 0.00% | |||||||||||||||
|
|
|
|||||||||||||||||||
| Adjusted nonperforming loans to loans, net of unearned income |
0.66% | 1.09% | 0.71% | 1.21% | 2.12% | |||||||||||||||
|
|
||||||||||||||||||||
23
Table of Contents
Index to Financial Statements
Investing in our common stock involves a high degree of risk. Before you decide to invest in our common stock, you should carefully consider the risks described below, together with all other information included in this prospectus, including our historical financial statements and accompanying notes thereto. We believe the risks described below are the risks that are material to us as of the date of this prospectus. If any of the following risks actually occur, our business, financial condition, results of operations and growth prospects could be materially and adversely affected. In that case, you could experience a partial or complete loss of your investment.
Risks related to our business
Our business concentration in Tennessee imposes risks resulting from any regional or local economic downturn affecting Tennessee, and if we do not effectively manage our asset quality and credit risk, we would experience loan losses which could have a material adverse effect on our financial condition and results of operation.
We conduct our banking operations primarily in Tennessee as a significant majority of the loans in our loan portfolios as of June 30, 2016 were secured by properties and collateral located in Tennessee. Likewise, as of such date, approximately 89% of the loans in our loan portfolio were made to borrowers who live and/or primarily conduct business in Tennessee. This geographic concentration imposes risks from lack of geographic diversification, as adverse economic developments in Tennessee (including the Nashville MSA, our largest market), among other things, could affect the volume of loan originations, increase the level of nonperforming assets, increase the rate of foreclosure losses on loans and reduce the value of our loans and loan servicing portfolio. Any regional or local economic downturn that affects Tennessee or existing or prospective borrowers or property values in such areas may affect us and our profitability more significantly and more adversely than our competitors whose operations are less geographically concentrated.
In addition, making any loan involves risk, including risks inherent in dealing with individual borrowers, risks of nonpayment, risks resulting from uncertainties as to the future value of collateral and cash flows available to service debt, and risks resulting from changes in economic and market conditions. Our credit risk approval and monitoring procedures may fail to identify or reduce these credit risks, and they cannot completely eliminate all credit risks related to our loan portfolio. If the overall economic climate, including employment rates, real estate markets, interest rates and general economic growth, in the United States, generally, or Tennessee (particularly the Nashville MSA), specifically, experiences material disruption, our borrowers may experience difficulties in repaying their loans, the collateral we hold may decrease in value or become illiquid, and the level of nonperforming loans, charge-offs and delinquencies could rise and require additional provisions for loan losses, which would cause our net income and return on equity to decrease.
Because a significant portion of our loan portfolio is comprised of real estate loans, negative changes in the economy affecting real estate values and liquidity could impair the value of collateral securing our real estate loans and result in loan and other losses.
As of June 30, 2016, approximately 75% of our loan portfolio was comprised of loans with real estate as a primary or secondary component of collateral. This includes collateral consisting of income producing and residential construction properties, which properties tend to be more sensitive to general economic conditions and downturns in real estate markets. As a result, adverse developments affecting real estate values in our market areas could increase the credit risk associated with our real estate loan portfolio. The market value of real estate can fluctuate significantly in a short period of time as a result of market conditions in the area in which the real estate is located. Adverse changes affecting real estate values and the liquidity of real estate in one or more of our markets could increase the credit risk associated with our loan portfolio, and could result in
24
Table of Contents
Index to Financial Statements
losses that would adversely affect credit quality, financial condition, and results of operation. Negative changes in the economy affecting real estate values and liquidity in our market areas could significantly impair the value of property pledged as collateral on loans and affect our ability to sell the collateral upon foreclosure without a loss or additional losses. Collateral may have to be sold for less than the outstanding balance of the loan, which could result in losses on such loans. Such declines and losses could have a material adverse impact on our business, results of operations and growth prospects. If real estate values decline, it is also more likely that we would be required to increase our allowance for loan losses, which could adversely affect our financial condition, results of operations and cash flows.
We are exposed to higher credit risk by commercial real estate, commercial and industrial and construction based lending as well as relationship exposure with a number of large borrowers.
Commercial real estate, commercial and industrial and construction based lending usually involve higher credit risks than 1-4 family residential real estate lending. As of June 30, 2016, the following loan types accounted for the stated percentages of our loan portfolio: commercial real estate (both owner-occupied and non-owner occupied)—35%; commercial and industrial—20%; and construction—12%. These types of loans also involve larger loan balances to a single borrower or groups of related borrowers. These higher credit risks are further heightened when the loans are concentrated in a small number of larger borrowers leading to relationship exposure. As of June 30, 2016, we had 11 relationships with over $10 million of outstanding borrowings with us. While we are not dependent on any of these relationships and while none of these large relationships have directly impacted our allowance for loan losses, a deterioration of any of these large credits could require us to increase our allowance for loan losses or result in significant losses to us.
Non-owner occupied commercial real estate loans may be affected to a greater extent than residential loans by adverse conditions in real estate markets or the economy because commercial real estate borrowers’ ability to repay their loans depends on successful development of their properties, in addition to the factors affecting residential real estate borrowers. These loans also involve greater risk because they generally are not fully amortizing over the loan period, but have a balloon payment due at maturity. A borrower’s ability to make a balloon payment typically will depend on being able to either refinance the loan or sell the underlying property in a timely manner.
The banking regulators are giving commercial real estate lending greater scrutiny, and may require banks with higher levels of commercial real estate loans to implement improved underwriting, internal controls, risk management policies and portfolio stress testing, as well as possibly higher levels of allowances for losses and capital levels as a result of commercial real estate lending growth and exposures.
Commercial and industrial loans and owner-occupied commercial real estate loans are typically based on the borrowers’ ability to repay the loans from the cash flow of their businesses. These loans may involve greater risk because the availability of funds to repay each loan depends substantially on the success of the business itself. In addition, the assets securing the loans have the following characteristics: (i) they depreciate over time, (ii) they are difficult to appraise and liquidate, and (iii) they fluctuate in value based on the success of the business.
Risk of loss on a construction loan depends largely upon whether our initial estimate of the property’s value at completion of construction or development equals or exceeds the cost of the property construction or development (including interest), the availability of permanent take-out financing and the builder’s ability to ultimately sell the property. During the construction or development phase, a number of factors can result in delays and cost overruns. If estimates of value are inaccurate or if actual construction costs exceed estimates, the value of the property securing the loan may be insufficient to ensure full repayment when completed through a permanent loan or by seizure of collateral.
25
Table of Contents
Index to Financial Statements
Commercial real estate loans, commercial and industrial loans and construction loans are more susceptible to a risk of loss during a downturn in the business cycle. Our underwriting, review and monitoring cannot eliminate all of the risks related to these loans.
We also make both secured and unsecured loans to our commercial clients. Secured commercial loans are generally collateralized by real estate, accounts receivable, inventory, equipment or other assets owned by the borrower or may include a personal guaranty of the business owner. Unsecured loans generally involve a higher degree of risk of loss than do secure loans because, without collateral, repayment is wholly dependent upon the success of the borrowers’ businesses. Because of this lack of collateral, we are limited in our ability to collect on defaulted unsecured loans. Furthermore, the collateral that secures our secured commercial and industrial loans typically includes inventory, accounts receivable and equipment, which if the business is unsuccessful, usually has a value that is insufficient to satisfy the loan without a loss.
In addition, in recent years, a number of judicial decisions have upheld the right of borrowers to sue lending institutions on the basis of various evolving legal theories, collectively termed “lender liability.” Generally, lender liability is founded on the premise that a lender has either violated a duty, whether implied or contractual, of good faith and fair dealing owed to the borrower or has assumed a degree of control over the borrower resulting in the creation of a fiduciary duty owed to the borrower or its other creditors or shareholders. In the future, we could become subject to claims based on this or other evolving legal theories.
Our success is largely dependent upon our ability to successfully execute our business strategy and if we are unable to successfully execute our business strategy, our business, growth prospectus, financial results and operations could be materially and adversely impaired.
Our success, including our ability to achieve our growth and profitability goals, is dependent on the ability of our management team to execute on our long-term business strategy, which requires them to, among other things:
| • | attract and retain experienced and talented bankers in each of our markets; |
| • | maintain adequate funding sources, including by continuing to attract stable, low-cost deposits; |
| • | enhance our market penetration in our metropolitan markets and maintain our leadership position in our community markets; |
| • | increase our operating efficiency; |
| • | implement new technologies to enhance the client experience, keep pace with our competitors and improve efficiency; |
| • | attract and maintain commercial banking relationships with well-qualified businesses, real estate developers and investors with proven track records in our market areas; |
| • | attract sufficient loans that meet prudent credit standards, including in our commercial and industrial and owner-occupied commercial real estate loan categories; |
| • | originate conforming residential mortgage loans for resale into secondary market to provide mortgage banking income; |
| • | maintain adequate liquidity and regulatory capital and comply with applicable federal and state banking regulations; |
| • | obtain federal and state regulatory approvals; |
26
Table of Contents
Index to Financial Statements
| • | manage our credit, interest rate and liquidity risk; |
| • | develop new, and grow our existing, streams of noninterest income; |
| • | oversee the performance of third party service providers that provide material services to our business; and |
| • | maintain expenses in line with their current projections. |
Failure to achieve these strategic goals could adversely affect our ability to successfully implement our business strategies and could negatively impact our business, growth prospects, financial condition and results of operations. Furthermore, if we do not manage our growth effectively, our business, financial condition, results of operations and future prospects could be negatively affected, and we may not be able to continue to implement our business strategy and successfully conduct our operations.
The success of our operating model depends on our ability to attract and retain talented bankers and associates in each of our markets. If we are unable to attract and retain talented bankers in our markets, our business, growth prospects and financial results could be materially and adversely affected.
The success of our operating model depends on our ability to attract and retain talented bankers and associates in each of our markets. We strive to attract and retain these bankers by fostering an entrepreneurial environment, empowering them with local decision making authority and providing them with sufficient infrastructure and resources to support their growth while also providing management with appropriate oversight. However, the competition for bankers in each of our markets is intense. We compete for talent with both smaller banks that may be able to offer bankers with more responsibility, autonomy and local relationships and larger banks that may be able to offer bankers with higher compensation, resources and support. As a result, we may not be able to effectively compete for talent across our markets. Furthermore, our bankers may leave us to work for our competitors and, in some instances, may take important banking and lending relationships with them to our competitors. If we are unable to attract and retain talented bankers in our markets, our business, growth prospects and financial results could be materially and adversely affected.
We depend on our executive officers and other key individuals to continue the implementation of our long-term business strategy and could be harmed by the loss of their services and our inability to make up for such loss with qualified replacements.
We believe that our continued growth and future success will depend in large part on the skills of our management team and our ability to motivate and retain these individuals and other key individuals. In particular, we rely on the leadership and experience in the banking industry of James Ayers, our founder and Chairman, Christopher Holmes, our President and Chief Executive Officer, James Gordon, our Chief Financial Officer, Wilburn Evans, President of FirstBank Ventures, Tim Johnson, our Chief Risk Officer, David Burden, West Tennessee Regional President, Allen Oakley, Middle and East Tennessee Regional President, Wade Peery, our Director of Operations and Technology, Wyndell Renee Bunch, Chief Financial Officer of FirstBank Ventures, Paul Craig, Director of Corporate Development and Jeanie Rittenberry, Director of Marketing and Communications. The loss of any of their service could reduce our ability to successfully implement our long-term business strategy, our business could suffer and the value of our common stock could be materially adversely affected. Leadership changes will occur from time to time and we cannot predict whether significant resignations will occur or whether we will be able to recruit additional qualified personnel. We believe our management team possesses valuable knowledge about the banking industry and that their knowledge and relationships would be very difficult to replicate. Our success also depends on the experience of our market presidents, bankers and lending officers and on their relationships with the clients and communities they serve. The loss of key personnel, or the inability to recruit and retain qualified and talented personnel in the future, could have an adverse effect on our business, financial condition or operating results.
27
Table of Contents
Index to Financial Statements
We face strong competition from financial services companies and other companies that offer banking services.
We conduct our banking operations primarily in Tennessee, with our largest market being the Nashville MSA, which is a highly competitive banking market. Many of our competitors offer the same, or a wider variety of, banking services within our market areas. These competitors include banks with nationwide operations, regional banks and community banks. In many instances these national and regional banks have greater resources than we do and the smaller community banks may have stronger ties in local markets than we do, which may put us at a competitive disadvantage. We also face competition from many other types of financial institutions, including savings and loan institutions, finance companies, brokerage firms, insurance companies, credit unions, mortgage banks and other financial intermediaries. In addition, a number of out-of-state financial institutions have opened production offices, or otherwise solicit deposits and loans, in our market areas. Increased competition in our markets may result in reduced loans and deposits, as well as reduced net interest margin and profitability. Ultimately, we may not be able to compete successfully against current and future competitors. If we are unable to attract and retain banking clients, we may be unable to continue to grow our loan and deposit portfolios, and our business, financial condition and results of operations may be adversely affected.
Furthermore, a number of larger banks have recently entered the greater Nashville, Tennessee market, and we believe this trend will continue as banks look to gain a foothold in this growing market. This trend will likely result in greater competition in one of our key markets and may impair our ability to grow our share of the Nashville market.
We follow a relationship-based operating model and our ability to maintain our reputation is critical to the success of our business and the failure to do so may materially adversely affect our performance.
We are a community bank, and our reputation is one of the most valuable components of our business. As such, we strive to conduct our business in a manner that enhances our reputation. This is done, in part, by recruiting, hiring and retaining bankers and other associates who share our core values of being an integral part of the communities we serve, delivering superior service to our clients and caring about our clients and associates. Furthermore, maintaining our reputation also depends on our ability to protect our brand name and associated trademarks. If our reputation is negatively affected by the actions of our associates or otherwise, our business and, therefore, our operating results may be materially adversely affected.
Interest rate shifts may reduce net interest income and otherwise negatively impact our financial condition and results of operations.
The majority of our banking assets are monetary in nature and subject to risk from changes in interest rates. Like most financial institutions, our earnings are significantly dependent on our net interest income, the principal component of our earnings, which is the difference between interest earned by us from our interest-earning assets, such as loans and investment securities, and interest paid by us on our interest-bearing liabilities, such as deposits and borrowings. We expect that we will periodically experience “gaps” in the interest rate sensitivities of our assets and liabilities, meaning that either our interest-bearing liabilities will be more sensitive to changes in market interest rates than our interest-earning assets, or vice versa. In either event, if market interest rates should move contrary to our position, this “gap” will negatively impact our earnings. The impact on earnings is more adverse when the slope of the yield curve flattens, that is, when short-term interest rates increase more than long-term interest rates or when long-term interest rates decrease more than short-term interest rates. Many factors impact interest rates, including governmental monetary policies, inflation, recession, changes in unemployment, the money supply, and international disorder and instability in domestic and foreign financial markets.
28
Table of Contents
Index to Financial Statements
Interest rate increases often result in larger payment requirements for our borrowers, which increase the potential for default. At the same time, the marketability of the property securing a loan may be adversely affected by any reduced demand resulting from higher interest rates. In a declining interest rate environment, there may be an increase in prepayments on loans as borrowers refinance their loans at lower rates.
Changes in interest rates also can affect the value of loans, securities and other assets. An increase in interest rates that adversely affects the ability of borrowers to pay the principal or interest on loans may lead to an increase in nonperforming assets and a reduction of income recognized, which could have a material adverse effect on our results of operations and cash flows. Further, when we place a loan on nonaccrual status, we reverse any accrued but unpaid interest receivable, which decreases interest income. At the same time, we continue to have a cost to fund the loan, which is reflected as interest expense, without any interest income to offset the associated funding expense. Thus, an increase in the amount of nonperforming assets would have an adverse impact on net interest income.
If short-term interest rates remain at their historically low levels for a prolonged period, and assuming longer term interest rates fall further, we could experience net interest margin compression as our interest earning assets would continue to re-price downward while our interest-bearing liability rates could fail to decline in tandem. Such an occurrence would have a material adverse effect on our net interest income and our results of operations.
Decreased residential mortgage origination, volume and pricing decisions of competitors may adversely affect our profitability.
Our mortgage operation originates and sells residential mortgage loans, services residential mortgage loans, and provides third party origination services to other community banks and mortgage companies. Changes in interest rates, housing prices, regulations by the applicable governmental authorities and pricing decisions by our loan competitors may adversely affect demand for our residential mortgage loan products, the revenue realized on the sale of loans, revenues received from servicing such loans for others, and ultimately reduce our net income. New regulations, increased regulatory reviews, and/or changes in the structure of the secondary mortgage markets which we would utilize to sell mortgage loans may be introduced and may increase costs and make it more difficult to operate a residential mortgage origination business. Our revenue from mortgage banking income was $70.2 million in 2015, and was $54.6 million in the first half of 2016, which revenue could significantly decline in future periods if interest rates were to rise and the other risks highlighted in this paragraph were realized.
Our mortgage banking profitability could significantly decline if we are not able to originate and resell a high volume of mortgage loans and securities.
Mortgage production, especially refinancing activity, declines in rising interest rate environments. While we have been experiencing historically low interest rates, the low interest rate environment likely will not continue indefinitely. While we have not yet experienced a slowdown in our mortgage origination volume, due in part to our expansion of our mortgage banking business and rates remaining favorable, our mortgage origination volume could be materially and adversely affected by rising interest rates. We expect to see declining origination volume in 2016 across the industry, however we are still experiencing growth through the first half of 2016. Moreover, when interest rates increase further, there can be no assurance that our mortgage production will continue at current levels. Furthermore, nearly half of our mortgages are originated through our consumer direct internet delivery channel, which targets national customers. As a result, loan originations through this channel are particularly susceptible to the interest rate environment and the national housing market. Because we sell a substantial portion of the mortgage loans we originate, the profitability of our mortgage banking business also depends in large part on our ability to aggregate a high volume of loans and
29
Table of Contents
Index to Financial Statements
sell them in the secondary market at a gain. In fact, as rates rise, we expect increasing industry-wide competitive pressures related to changing market conditions to reduce our pricing margins and mortgage revenues generally. Thus, in addition to our dependence on the interest rate environment, we are dependent upon (i) the existence of an active secondary market and (ii) our ability to profitably sell loans or securities into that market. If our level of mortgage production declines, the profitability will depend upon our ability to reduce our costs commensurate with the reduction of revenue from our mortgage operations.
Our ability to originate and sell mortgage loans readily is dependent upon the availability of an active secondary market for single-family mortgage loans, which in turn depends in part upon the continuation of programs currently offered by government-sponsored entities (“GSEs”) and other institutional and non-institutional investors. These entities account for a substantial portion of the secondary market in residential mortgage loans. Because the largest participants in the secondary market are Ginnie Mae, Fannie Mae and Freddie Mac, GSEs whose activities are governed by federal law, any future changes in laws that significantly affect the activity of these GSEs could, in turn, adversely affect our operations. In September 2008, Fannie Mae and Freddie Mac were placed into conservatorship by the U.S. government. The federal government has for many years considered proposals to reform Fannie Mae and Freddie Mac, but the results of any such reform, and their impact on us, are difficult to predict. To date, no reform proposal has been enacted.
Our mortgage production and servicing revenue can be volatile.
We earn revenue from fees we receive for originating mortgage loans, servicing mortgage loans and providing third party origination services to other community banks and mortgage companies. When rates rise, the demand for mortgage loans usually tends to fall, reducing the revenue we receive from loan originations and providing third party origination services to other community banks and mortgage companies. Under the same conditions, net revenue from our mortgage servicing rights can increase through reductions in the decay, or amortization, of the mortgage servicing right asset. When rates fall, mortgage originations usually tend to increase and mortgage servicing income tends to decline given increases in the decay, or amortization, of the mortgage servicing right asset. Even though the mortgage servicing right asset can act as a “natural hedge,” the hedge is not perfect, nor is it designed to be, either in amount or timing. Servicing income can also be impacted by the change in the fair value of the mortgage servicing right asset due to changes in market interest rates and other assumptions, exclusive of decay of the mortgage servicing right asset.
Furthermore, due to capital limitations and other considerations, we intend to sell a significant portion of our mortgage servicing rights during the remainder of 2016. We expect to incur between $1.5 million and $2.5 million of transaction expenses in connection with these anticipated sales. However, the actual timing and expenses associated with these sales may differ from our current expectations depending on market conditions and transaction-specific details. In conjunction with the anticipated sales of these mortgage servicing rights, we may incur additional impairment charges if we are unable to sell these mortgage servicing rights at the carrying value of the associated mortgage servicing right asset on our financial statements, which could result from changing market conditions and changing interest rates. Additionally, based upon market conditions and market data gained from these anticipated sales, we could be required to incur additional impairment charges on our remaining mortgage servicing right asset if such sales are at lower prices than the carrying value of remaining mortgage servicing right assets.
We typically use derivatives and other instruments to hedge our mortgage banking interest rate risk. We generally do not hedge all of our risk, and we may not be successful in hedging any of the risk. Hedging is a complex process, requiring sophisticated models and constant monitoring. We may use hedging instruments tied to U.S. Treasury rates, LIBOR or Eurodollars that may not perfectly correlate with the value or income being hedged. We could incur significant losses from our hedging activities. There may be periods where we elect not to use derivatives and other instruments to hedge mortgage banking interest rate risk.
30
Table of Contents
Index to Financial Statements
We may be terminated as a servicer of mortgage loans, be required to repurchase a mortgage loan or reimburse investors for credit losses on a mortgage loan, or incur costs, liabilities, fines and other sanctions if we fail to satisfy our servicing obligations, including our obligations with respect to mortgage loan foreclosure actions.
We act as servicer, through a subservicing contract with Cenlar Federal Savings Bank, or Cenlar, for approximately $4,023 million of mortgage loans owned by third parties as of June 30, 2016. As a servicer for those loans we have certain contractual obligations, including foreclosing on defaulted mortgage loans or, to the extent applicable, considering alternatives to foreclosure such as loan modifications or short sales. If we commit a material breach of our obligations as servicer, we may be subject to termination if the breach is not cured within a specified period of time following notice, causing us to lose servicing income.
For certain investors and/or certain transactions, we may be contractually obligated to repurchase a mortgage loan or reimburse the investor for credit losses incurred on the loan as a remedy for origination errors with respect to the loan. If we have increased repurchase obligations because of claims that we did not satisfy our obligations as a servicer, or increased loss severity on such repurchases, we may have a significant reduction to net servicing income within our mortgage banking noninterest income. We may incur costs if we are required to, or if we elect to, re-execute or re-file documents or take other action in our capacity as a servicer in connection with pending or completed foreclosures. We may incur litigation costs if the validity of a foreclosure action is challenged by a borrower. If a court were to overturn a foreclosure because of errors or deficiencies in the foreclosure process, we may have liability to the borrower and/or to any title insurer of the property sold in foreclosure if the required process was not followed. These costs and liabilities may not be legally or otherwise reimbursable to us. In addition, if certain documents required for a foreclosure action are missing or defective, we could be obligated to cure the defect or repurchase the loan. We may incur liability to securitization investors relating to delays or deficiencies in our processing of mortgage assignments or other documents necessary to comply with state law governing foreclosures. The fair value of our mortgage servicing rights may be negatively affected to the extent our servicing costs increase because of higher foreclosure costs. We may be subject to fines and other sanctions imposed by federal or state regulators as a result of actual or perceived deficiencies in our foreclosure practices or in the foreclosure practices of other mortgage loan servicers. Any of these actions may harm our reputation or negatively affect our home lending or servicing business.
We depend on a third-party service provider for our mortgage loan servicing business and a failure by this third party to perform its obligations could adversely affect our reputation, results of operations or financial condition.
We depend on a third-party service provider, Cenlar, to provide our mortgage loan servicing business with certain primary and special servicing services that are essential to this business. Primary servicing includes the collection of regular payments, processing of tax and insurance, processing of payoffs, handling borrower inquiries and reporting to the borrower. Special servicing is focused on borrowers who are delinquent or on loans which are more complex or in need of more hands-on attention. In the event that our current third-party service provider, or any other third-party service provider that we may use in the future, fails to perform its servicing duties or performs those duties inadequately, we could experience a temporary interruption in collecting principal and interest, sustain credit losses on our loans or incur additional costs to obtain a replacement servicer and there can be no assurance that a replacement servicer could be retained in a timely manner or at similar rates. Furthermore, our servicing rights could be terminated or we may be required to repurchase mortgage loans or reimburse investors due to such failures of our third party service providers.
We may be required to repurchase mortgage loans or indemnify buyers against losses in some circumstances, which could harm liquidity, results of operations and financial condition.
In 2015, we sold approximately $2.7 billion of the $2.8 billion of mortgage loans that we originated. When mortgage loans are sold, whether as whole loans or pursuant to a securitization, we are required to make
31
Table of Contents
Index to Financial Statements
customary representations and warranties to purchasers, guarantors and insurers, including the GSEs, about the mortgage loans and the manner in which they were originated. Whole loan sale agreements require repurchase or substitute mortgage loans, or indemnification of buyers against losses, in the event we breach these representations or warranties. In addition, we may be required to repurchase mortgage loans as a result of early payment default of the borrower on a mortgage loan, resulting in these mortgage loans being placed on our books and subjecting us to the risk of a potential default. With respect to loans that are originated through our broker or correspondent channels, the remedies available against the originating broker or correspondent, if any, may not be as broad as the remedies available to purchasers, guarantors and insurers of mortgage loans against us. We face further risk that the originating broker or correspondent, if any, may not have financial capacity to perform remedies that otherwise may be available. Therefore, if a purchaser, guarantor or insurer enforces its remedies against us, we may not be able to recover losses from the originating broker or correspondent. If repurchase and indemnity demands increase and such demands are valid claims and are in excess of our provision for potential losses, our liquidity, results of operations and financial condition may be adversely affected.
If we are unable to grow our noninterest income, our growth prospects will be impaired.
Taking advantage of opportunities to develop new, and expand existing, streams of noninterest income, including our mortgage business, cash management services, investment services and interchange fees, is a part of our long-term growth strategy. These lines of business are heavily regulated and as a bank holding company we may be prohibited from entering into new lines of business or may be unable to operate these lines of business profitably. Specifically, we expect a decline in our mortgage revenues in the future due to expected higher prevailing interest rates, increased competition, seasonality and increased regulation. If we are unsuccessful in our attempts to grow our noninterest income, especially in light of the expected decline in mortgage revenues given the expectation of higher prevailing interest rates in the following years, our long-term growth will be impaired. Furthermore, focusing on these noninterest income streams may divert management’s attention and resources away from our core banking business, which could impair our core business, financial condition and operating results. We also derive a meaningful amount of our noninterest income from non-sufficient funds and overdraft fees and such fees are subject to increased regulatory scrutiny, which could result in an erosion of such fees that materially impairs our future noninterest income.
We may pursue acquisitions in the future, which would expose us to financial, execution and operational risks that could have a material adverse effect on our business, financial condition, results of operations and growth prospects.
We may pursue acquisitions of other financial institutions, bank branches and or mortgage operations in target markets. Such an acquisition strategy will involve significant risks, including the following:
| • | finding suitable markets for expansion; |
| • | finding suitable candidates for acquisition; |
| • | finding suitable financing sources to fund acquisitions; |
| • | maintaining asset quality; |
| • | attracting and retaining qualified management; |
| • | maintaining adequate regulatory capital; |
| • | obtaining federal and state regulatory approvals; and |
| • | consummating suitable acquisitions on terms that are favorable to us. |
Acquisitions of financial institutions also involve operational risks and uncertainties, and acquired companies may have unknown or contingent liabilities with no available manner of recourse that we are not able to discover during the course of our due diligence, exposure to unexpected asset quality problems, key employee
32
Table of Contents
Index to Financial Statements
and client retention problems and other problems that could negatively affect our organization. We may not be able to complete future acquisitions or, if completed, we may not be able to successfully integrate the operations, management, products and services of the entities that we acquire and eliminate redundancies. The integration process may also require significant time and attention from our management that they would otherwise direct toward servicing existing business and developing new business. Moreover, undiscovered liabilities as a result of an acquisition could bring civil, criminal and financial liabilities against us, our management and the management of the institutions we acquire. We also may not possess the requisite knowledge or relationships to be successful as we enter into new markets. Acquisitions typically involve the payment of a premium over book and market values and, therefore, some dilution of our tangible book value and net income per common share may occur in connection with any future transaction. Furthermore, we may issue additional shares of our common stock to finance our acquisitions, which could result in dilution to our existing shareholders, or incur debt to finance our acquisitions or terms that may not be favorable to us. Failure to successfully integrate the entities we acquire into our existing operations may increase our operating costs significantly and adversely affect our business and earnings.
System failure or breaches of our network security, including as a result of cyber-attacks or data security breaches could subject us to increased operating costs as well as litigation and other liabilities.
The computer systems and network infrastructure we use may be vulnerable to physical theft, fire, power loss, telecommunications failure or a similar catastrophic event, as well as security breaches, denial of service attacks, viruses, worms and other disruptive problems caused by hackers. Any damage or failure that causes breakdowns or disruptions in our client relationship management, general ledger, deposit, loan and other systems could damage our reputation, result in a loss of client business, subject us to additional regulatory scrutiny for failure to comply with required information security standards, or expose us to civil litigation and possible financial liability, any of which could have a material adverse effect on us.
Computer break-ins, phishing and other disruptions could also jeopardize the security of information stored in and transmitted through our computer systems and network infrastructure. Information security risks have generally increased in recent years in part because of the proliferation of new technologies, the use of the Internet and telecommunications technologies to conduct financial transactions, and the increased sophistication and activities of organized crime, hackers, terrorists, activists, and other external parties. Our operations rely on the secure processing, transmission and storage of confidential information in our computer systems and networks. In addition, to access our products and services, our clients may use personal smartphones, tablet PC’s, and other mobile devices that are beyond our control systems. Although we believe we have robust information security procedures and controls, our technologies, systems, networks, and our clients’ devices may become the target of cyber-attacks or information security breaches that could result in the unauthorized release, gathering, monitoring, misuse, loss or destruction of the Bank’s or our clients’ confidential, proprietary and other information, or otherwise disrupt the Bank’s or our clients’ or other third parties’ business operations. As cyber threats continue to evolve, we may be required to expend significant additional resources to continue to modify or enhance our protective measures or to investigate and remediate any information security vulnerabilities.
The Bank is under continuous threat of loss due to hacking and cyber-attacks especially as we continue to expand client capabilities to utilize internet and other remote channels to transact business. Two of the most significant cyber-attack risks that we face are e-fraud and loss of sensitive client data. Loss from e-fraud occurs when cybercriminals breach and extract funds directly from client or our accounts and of which we have been a victim. Attempts to breach sensitive client data, such as account numbers and social security numbers, are less frequent but would present significant reputational, legal and/or regulatory costs to us if successful. Our risk and exposure to these matters remains heightened because of the evolving nature and complexity of these threats from cybercriminals and hackers, our plans to continue to provide internet banking and mobile banking
33
Table of Contents
Index to Financial Statements
channels, and our plans to develop additional remote connectivity solutions to serve our clients. While we are not aware of any successful hacking or cyber attacks into our computer or other IT systems, there can be no assurance that we will not be the victim of successful hacking or cyber attacks in the future that could cause us to suffer material losses. The occurrence of any cyber-attack or information security breach could result in potential liability to clients, reputational damage and the disruption of our operations, and regulatory concerns, all of which could adversely affect our business, financial condition or results of operations.
The financial services industry is undergoing rapid technological changes and, as a result, we have a continuing need to stay current with those changes to compete effectively and increase our efficiencies. We may not have the resources to implement new technology to stay current with these changes.
The financial services industry is undergoing rapid technological changes with frequent introductions of new technology-driven products and services. In addition to better serving clients, the effective use of technology increases efficiency and enables financial institutions to reduce costs. Our future success will depend in part upon our ability to address the needs of our clients by using technology to provide products and services that will satisfy client demands for convenience as well as to provide secure electronic environments and create additional efficiencies in our operations as we continue to grow and expand our market area. In connection with implementing new technology enhancements or products in the future, we may experience certain operational challenges (e.g. human error, system error, incompatibility, etc.) which could result in us not fully realizing the anticipated benefits from such new technology or require us to incur significant costs to remedy any such challenges in a timely manner.
Many of our larger competitors have substantially greater resources to invest in technological improvements and have invested significantly more than us in technological improvements. As a result, they may be able to offer additional or more convenient products compared to those that we will be able to provide, which would put us at a competitive disadvantage. Accordingly, we may not be able to effectively implement new technology-driven products and services or be successful in marketing such products and services to our clients, which could impair our growth and profitability.
We depend on a number of third-party service providers and our operations could be interrupted if these third-party service providers experience difficulty, terminate their services or fail to comply with banking regulations.
We depend on a number of relationships with third-party service providers. Specifically, we receive core systems processing, essential web hosting and other Internet systems, deposit processing and other processing services from third-party service providers. If these third-party service providers experience difficulties, or terminate their services, and we are unable to replace them with other service providers, particularly on a timely basis, our operations could be interrupted. If an interruption were to continue for a significant period of time, our business, financial condition and results of operations could be adversely affected, perhaps materially. Even if we are able to replace third party service providers, it may be at a higher cost to us, which could adversely affect our business, financial condition and results of operations.
We are subject to certain operational risks, including, but not limited to, client or employee fraud and data processing system failures and errors.
Employee errors and employee and client misconduct could subject us to financial losses or regulatory sanctions and seriously harm our reputation. Misconduct by our employees could include hiding unauthorized activities from us, improper or unauthorized activities on behalf of our clients or improper use of confidential information. It is not always possible to prevent employee errors and misconduct, and the precautions we take to prevent and detect this activity may not be effective in all cases. Employee errors could also subject us to financial claims for negligence.
34
Table of Contents
Index to Financial Statements
We maintain a system of internal controls and insurance coverage to mitigate against operational risks, including data processing system failures and errors and client or employee fraud. If our internal controls fail to prevent or detect an occurrence, or if any resulting loss is not insured or exceeds applicable insurance limits, it could have a material adverse effect on our business, financial condition and results of operations.
In addition, we rely heavily upon information supplied by third parties, including the information contained in credit applications, property appraisals, title information, equipment pricing and valuation and employment and income documentation, in deciding which loans we will originate, as well as the terms of those loans. If any of the information upon which we rely is misrepresented, either fraudulently or inadvertently, and the misrepresentation is not detected prior to asset funding, the value of the asset may be significantly lower than expected, or we may fund a loan that we would not have funded or on terms we would not have extended. Whether a misrepresentation is made by the applicant or another third party, we generally bear the risk of loss associated with the misrepresentation. A loan subject to a material misrepresentation is typically unsellable or subject to repurchase if it is sold prior to detection of the misrepresentation. The sources of the misrepresentations are often difficult to locate, and it is often difficult to recover any of the monetary losses we may suffer.
Our allowance for loan losses may prove to be insufficient to absorb potential losses in our loan portfolio, which may adversely affect our business, financial condition and results of operations.
We establish our allowance for loan losses and maintain it at a level considered adequate by management, consistent with applicable regulatory requirements and supervisory guidance, to absorb probable loan losses based on our analysis of our portfolio, market environment and historical loss experience. The allowance for loan losses represents our estimate of probable losses in the portfolio at each balance sheet date and is based upon relevant information available to us. The allowance contains provisions for probable losses that have been identified relating to specific borrowing relationships, as well as probable losses inherent in the loan portfolio and credit undertakings that are not specifically identified. Additions to the allowance for loan losses, which are charged to earnings through the provision for loan losses, are determined based on a variety of factors, including an analysis of the loan portfolio, historical loss experience and an evaluation of current economic conditions in our market areas. The actual amount of loan losses is affected by changes in economic, operating and other conditions within our markets, as well as changes in the financial condition, cash flows, and operations of our borrowers, all of which are beyond our control, and such losses may exceed current estimates.
As of June 30, 2016, our allowance for loan losses as a percentage of loans was 1.36% and as a percentage of total nonperforming loans was 213.70%. While our allowance for loan losses as a percentage of loans has decreased since 2012 as a result of the general improvement in the credit quality across all of our markets, additional loan losses will likely occur in the future and may occur at a rate greater than we have previously experienced. We may be required to take additional provisions for loan losses in the future to further supplement the allowance for loan losses, either due to management’s decision to do so or requirements by our banking regulators. In addition, bank regulatory agencies will periodically review our allowance for loan losses and the value attributed to nonaccrual loans or to real estate acquired through foreclosure. Such regulatory agencies may require us to recognize future charge-offs. These adjustments may adversely affect our business, financial condition and results of operations.
Our small to medium-sized business clients may have fewer financial resources than larger entities to weather a downturn in the economy, which may impair a borrower’s ability to repay a loan, and such impairment could adversely affect our results of operations and financial condition.
Our primary business clients are small to medium-sized businesses. These small to medium-sized businesses generally have fewer financial resources in terms of capital or borrowing capacity than larger entities. In
35
Table of Contents
Index to Financial Statements
addition many of our small and medium-sized business clients are rural based businesses that have limited growth opportunities compared to small and medium-sized business clients in other markets and, as a result, may not be able to generate sufficient capital to repay their loans.
If general economic conditions negatively impact Tennessee, particularly the Nashville MSA, and small to medium-sized businesses are adversely affected, our results of operations and financial condition may be negatively affected. Furthermore, our results of operations could be further impaired due to conditions that primarily or disproportionately affect our rural or agricultural based clients, such as weather, market conditions and governmental agricultural policies.
Our lending limit may restrict our growth and prevent us from effectively implementing our business strategy.
We are limited by law in the amount we can loan in the aggregate to a single borrower or related borrowers by the amount of our capital. The Bank is a Tennessee chartered bank and therefore all branches, regardless of location, fall under the legal lending limits of the state of Tennessee. Tennessee’s legal lending limit is a safety and soundness measure intended to prevent one person or a relatively small and economically related group of persons from borrowing an unduly large amount of a bank’s funds. It is also intended to safeguard a bank’s depositors by diversifying the risk of loan losses among a relatively large number of creditworthy borrowers engaged in various types of businesses. Generally, under Tennessee law, loans and extensions of credit to a borrower may not exceed 15% of our Bank’s Tier 1 capital, plus an additional 10% of the Bank’s Tier 1 capital, with approval of the Bank’s board. Further, the Bank may elect to conform to similar standards applicable to national banks under federal law, in lieu of Tennessee law. Because the federal law and Tennessee state law standards are determined as a percentage of the Bank’s capital, these state and federal limits both increase or decrease as the Bank’s capital increases or decreases. Based upon the capitalization of the Bank at June 30, 2016, the Bank’s legal lending limits were approximately $34 million (15%) and $57 million (25%). Therefore, based upon our current capital levels, the amount we may lend may be significantly less than that of many of our larger competitors and may discourage potential borrowers who have credit needs in excess of our lending limit from doing business with us. We may accommodate larger loans by selling participations in those loans to other financial institutions, but this strategy may not always be available. In addition to these legally imposed lending limits, we also employ appropriate limits on our overall loan portfolio and requirements with respect to certain types of lending and individual lending relationships. If we are unable to compete effectively for loans from our target clients, we may not be able to effectively implement our business strategy, which could have a material adverse effect on our business, financial condition, results of operations and prospects.
Our current asset mix and our current investments may not be indicative of our future asset mix and investments, which may make it difficult to predict our future financial and operating performance.
Certain factors make it difficult to predict our future financial and operating performance including, among others: (i) our current asset mix may not be representative of our anticipated future asset mix and may change as we continue to execute on our plans for organic loan origination and banking activities and potentially grow through future acquisitions; (ii) our significant liquid securities portfolio may not necessarily be representative of our future liquid securities position; and (iii) our cost structure and capital expenditure requirements during the periods for which financial information is available may not be reflective of our anticipated cost structure and capital spending as we continue to realize efficiencies in our business, integrate future acquisitions and continue to grow our organic banking platform.
Our funding sources may prove insufficient to replace deposits and support our future growth.
Deposits and investment securities for sale are the primary source of funds for our lending activities and general business purposes. However, from time to time we also obtain advances from the Federal Home Loan Bank, purchase federal funds, and engage in overnight borrowing from the Federal Reserve, correspondent
36
Table of Contents
Index to Financial Statements
banks, and enter into client purchase agreements. Although we have historically been able to replace maturing deposits and advances if desired, we may not be able to replace such funds in the future if our financial condition, the financial condition of the Federal Home Loan Bank or market conditions were to change. While we believe our current funding sources to be adequate, our financial flexibility will be severely constrained if we are unable to maintain our access to funding or if adequate financing is not available to accommodate future growth at acceptable interest rates. We have also meaningfully decreased our cost of deposits in recent years by increasing our noninterest bearing deposits and allowing higher-cost time deposits and borrowed funds to mature. If we are unable to successfully maintain and grow our low-cost deposits, our cost of funding will increase. Finally, if we are required to rely more heavily on more expensive funding sources to support future growth, our revenues may not increase proportionately to cover our costs. In this case, our profitability would be adversely affected.
Federal Home Loan Bank borrowings and other current sources of liquidity may not be available or, if available, sufficient to provide adequate funding for operations. Furthermore, our own actions could result in a loss of adequate funding. For example, our availability at the Federal Home Loan Bank could be reduced if we are deemed to have poor documentation or processes. Accordingly, we may seek additional higher-cost borrowings in the future to achieve our long-term business objectives. Additional borrowings, if sought, may not be available to us or, if available, may not be available on favorable terms. If additional financing sources are unavailable or are not available on reasonable terms, our growth and future prospects could be adversely affected.
A lack of liquidity could adversely affect our operations and jeopardize our business, financial condition, and results of operations.
Liquidity is essential to our business. We rely on our ability to generate deposits and effectively manage the repayment and maturity schedules of our loans and investment securities, respectively, to ensure that we have adequate liquidity to fund our operations. An inability to raise funds through deposits, borrowings, the sale of our investment securities, Federal Home Loan Bank advances, the sale of loans, and other sources could have a substantial negative effect on our liquidity. Our most important source of funds consists of deposits. Deposit balances can decrease when clients perceive alternative investments as providing a better risk/return tradeoff. If clients move money out of bank deposits and into other investments, we would lose a relatively low-cost source of funds, increasing our funding costs and reducing our net interest income and net income.
Other primary sources of funds consist of cash flows from operations, including from our mortgage business, investment maturities and sales of investment securities. Additional liquidity is provided by the ability to borrow from the Federal Reserve Bank and the Federal Home Loan Bank. We also may borrow funds from third-party lenders, such as other financial institutions, or issue equity or debt securities to investors in the future. Our access to funding sources in amounts adequate to finance or capitalize our activities, or on terms that are acceptable to us, could be impaired by factors that affect us directly or the financial services industry or economy in general, such as disruptions in the financial markets or negative views and expectations about the prospects for the financial services industry. Our liquidity may also be adversely impacted if there is a decline in our mortgage revenues from the expected higher prevailing interest rates in the following years.
Any decline in available funding could adversely impact our ability to originate loans, invest in securities, meet our expenses, pay dividends to our shareholders, or to fulfill obligations such as repaying our borrowings or meeting deposit withdrawal demands, any of which could have a material adverse impact on our liquidity, business, financial condition and results of operations.
37
Table of Contents
Index to Financial Statements
We may need to raise additional capital in the future, and if we fail to maintain sufficient capital, whether due to losses, an inability to raise additional capital or otherwise, our financial condition, liquidity and results of operations, as well as our ability to maintain compliance with regulatory capital requirements, would be adversely affected.
We face significant capital and other regulatory requirements as a financial institution. In addition, the Company, on a consolidated basis, and the Bank, on a stand-alone basis, must meet certain regulatory capital requirements and maintain sufficient liquidity. We may need to raise additional capital in the future to provide us with sufficient capital resources and liquidity to meet our commitments and business needs, which could include the possibility of financing acquisitions. Our ability to raise additional capital depends on conditions in the capital markets, economic conditions and a number of other factors, including investor perceptions regarding the banking industry, market conditions and governmental activities, and on our financial condition and performance. Accordingly, we cannot assure you that we will be able to raise additional capital if needed or on terms acceptable to us. If we fail to maintain capital to meet regulatory requirements, our financial condition, liquidity and results of operations would be materially and adversely affected.
We could recognize losses on securities held in our securities portfolio, particularly if interest rates increase or economic and market conditions deteriorate.
While we attempt to invest a significant percentage of our assets in loans (our loan to deposit ratio was 69.6% as of June 30, 2016), we also invest a percentage of our total assets (approximately 18.9% as of June 30, 2016) in investment securities as part of our overall liquidity strategy. As of June 30, 2016, the fair value of our securities portfolio was approximately $550.3 million and consisted primarily of U.S. Government agency securities, municipal securities and mortgage-based securities. Factors beyond our control can significantly influence the fair value of securities in our portfolio and can cause potential adverse changes to the fair value of these securities. For example, fixed-rate securities are generally subject to decreases in market value when market interest rates rise. Additional factors include, but are not limited to, rating agency downgrades of the securities, defaults by the issuer or individual borrowers with respect to the underlying securities, and continued instability in the credit markets. Any of the foregoing factors could cause an other-than-temporary impairment in future periods and result in realized losses. The process for determining whether impairment is other-than-temporary usually requires difficult, subjective judgments about the future financial performance of the issuer and any collateral underlying the security in order to assess the probability of receiving all contractual principal and interest payments on the security. Because of changing economic and market conditions affecting market interest rates, the financial condition of issuers of the securities and the performance of the underlying collateral, we may recognize realized and/or unrealized losses in future periods, which could have an adverse effect on our financial condition and results of operations.
Our risk management framework may not be effective in mitigating risks and/or losses to us.
Our risk management framework is comprised of various processes, systems and strategies, and is designed to manage the types of risk to which we are subject, including, among others, credit, market, liquidity, interest rate and compliance. Our framework also includes financial or other modeling methodologies that involve management assumptions and judgment. Our risk management framework may not be effective under all circumstances and may not adequately mitigate any risk or loss to us. If our framework is not effective, we could suffer unexpected losses and our business, financial condition, results of operations or prospects could be materially and adversely affected. We may also be subject to potentially adverse regulatory consequences, such as formal or informal enforcement actions, civil money penalties and potential criminal penalties.
38
Table of Contents
Index to Financial Statements
The requirements of being a public company may strain our resources and distract our management, which could make it difficult to manage our business, particularly after we are no longer an “emerging growth company.”
Following the completion of this offering, we will be required to comply with various regulatory and reporting requirements as a publicly-traded company, including those required by the SEC. Complying with these reporting and other regulatory requirements will be time-consuming and will result in increased costs to us and could have a negative effect on our business, financial condition and results of operations. Furthermore, as an “emerging growth company” we intend to take advantage of certain reduced regulatory and reporting requirements and our costs of being a public company will likely increase further once we no longer qualify as an “emerging growth company.”
As a public company, we will be subject to the reporting requirements of the Securities Exchange Act of 1934 (as amended, the “Exchange Act”), and requirements of the Sarbanes-Oxley Act. We are inexperienced with these reporting and accounting requirements, and as such these requirements may place a strain on our systems and resources. The Exchange Act requires that we file annual, quarterly and current reports with respect to our business and financial condition. The Sarbanes-Oxley Act requires that we maintain effective disclosure controls and procedures and internal controls over financial reporting. To maintain and improve the effectiveness of our disclosure controls and procedures, we will need to commit significant resources, hire additional staff and provide additional management oversight. We will be implementing additional procedures and processes for the purpose of addressing the standards and requirements applicable to public companies. Sustaining our growth also will require us to commit additional management, operational and financial resources to identify new professionals to join our firm and to maintain appropriate operational and financial systems to adequately support expansion. These activities will likely divert management’s attention from other business concerns, including implementing our growth strategy, which could have a material adverse effect on our business, financial condition, results of operations and future growth.
We could be subject to environmental risks and associated costs on our foreclosed real estate assets, which could materially and adversely affect us.
A significant portion of our loan portfolio is comprised of loans collateralized by real estate. There is a risk that hazardous or toxic waste could be discovered on the properties that secure our loans. If we acquire such properties as a result of foreclosure, we could be held responsible for the cost of cleaning up or removing this waste, and this cost could exceed the value of the underlying properties and materially and adversely affect us.
We may be adversely affected by the lack of soundness of other financial institutions or market utilities.
Our ability to engage in routine funding and other transactions could be adversely affected by the actions and commercial soundness of other financial institutions. Financial institutions are interrelated as a result of trading, clearing, counterparty or other relationships. Defaults by, or even rumors or questions about, one or more financial institutions or market utilities, or the financial services industry generally, may lead to market-wide liquidity problems and losses of depositor, creditor and counterparty confidence and could lead to losses or defaults by us or by other institutions.
The borrowing needs of our clients may be unpredictable, especially during a challenging economic environment. We may not be able to meet our unfunded credit commitments, or adequately reserve for losses associated with our unfunded credit commitments, which could have a material adverse effect on our business, financial condition, results of operations and reputation.
A commitment to extend credit is a formal agreement to lend funds to a client as long as there is no violation of any condition established under the agreement. The actual borrowing needs of our clients under these credit commitments have historically been lower than the contractual amount of the commitments. A significant portion of these commitments expire without being drawn upon. Because of the credit profile of our clients, we
39
Table of Contents
Index to Financial Statements
typically have a substantial amount of total unfunded credit commitments, which is reflected off our balance sheet. Actual borrowing needs of our clients may exceed our expected funding requirements, especially during a challenging economic environment when our client companies may be more dependent on our credit commitments due to the lack of available credit elsewhere, the increasing costs of credit, or the limited availability of financings from venture firms. In addition, limited partner investors of our venture capital clients may fail to meet their underlying investment commitments due to liquidity or other financing issues, which may increase our clients’ borrowing needs. Any failure to meet our unfunded credit commitments in accordance with the actual borrowing needs of our clients may have a material adverse effect on our business, financial condition, results of operations and reputation.
Our financial condition may be affected negatively by the costs of litigation.
We may be involved from time to time in a variety of litigation, investigations or similar matters arising out of our business. In many cases, we may seek reimbursement from our insurance carriers to cover such costs and expenses. Our insurance may not cover all claims that may be asserted against us, and any claims asserted against us, regardless of merit or eventual outcome, may harm our reputation. Should the ultimate judgments or settlements in any litigation or investigation significantly exceed our insurance coverage, they could have a material adverse effect on our business, financial condition and results of operations.
Changes in accounting standards could materially impact our financial statements.
From time to time, the Financial Accounting Standards Board or the SEC may change the financial accounting and reporting standards that govern the preparation of our financial statements. Such changes may result in us being subject to new or changing accounting and reporting standards. In addition, the bodies that interpret the accounting standards (such as banking regulators or outside auditors) may change their interpretations or positions on how these standards should be applied. These changes may be beyond our control, can be hard to predict and can materially impact how we record and report our financial condition and results of operations. In some cases, we could be required to apply a new or revised standard retrospectively, or apply an existing standard differently, also retrospectively, in each case resulting in our needing to revise or restate prior period financial statements.
Risks related to this offering and an investment in our common stock
An active trading market for our common stock may not develop, and you may not be able to sell your common stock at or above the initial public offering price.
Prior to this offering there has been no public market for our common stock. An active trading market for shares of our common stock may never develop or be sustained following this offering. If an active trading market does not develop, you may have difficulty selling your shares of common stock at an attractive price, or at all. The initial public offering price for our common stock will be determined by negotiations between us and the representative of the underwriters and may not be indicative of prices that will prevail in the open market following this offering. Consequently, you may not be able to sell your common stock at or above the initial public offering price or at any other price or at the time that you would like to sell. An inactive market may also impair our ability to raise capital by selling our common stock and may impair our ability to expand our business by using our common stock as consideration.
Applicable laws and regulations restrict both the ability of the Bank to pay dividends to the Company and the ability of the Company to pay dividends to our shareholders.
Both the Company and the Bank are subject to various regulatory restrictions relating to the payment of dividends. In addition, the Federal Reserve has the authority to prohibit bank holding companies from engaging in unsafe or unsound practices in conducting their business. These federal and state laws, regulations and
40
Table of Contents
Index to Financial Statements
policies are described in greater detail in “Business: Supervision and regulation: Bank regulation: Bank dividends” and “Business: Supervision and regulation: Holding company regulation: Restriction on bank holding company dividends,” but generally look to factors such as previous results and net income, capital needs, asset quality, existence of enforcement or remediation proceedings, and overall financial condition.
For the foreseeable future, the majority, if not all, of the Company’s revenue will be from any dividends paid to the Company by the Bank. Accordingly, our ability to pay dividends also depends on the ability of the Bank to pay dividends to us. Furthermore, the present and future dividend policy of the Bank is subject to the discretion of its board of directors.
We cannot guarantee that the Company or the Bank will be permitted by financial condition or applicable regulatory restrictions to pay dividends, that the board of directors of the Bank will elect to pay dividends to us, nor can we guarantee the timing or amount of any dividend actually paid. See “Dividend policy.”
We do not anticipate paying any cash dividends in the foreseeable future.
We currently intend to retain our future earnings, if any, for the foreseeable future, to repay indebtedness and to fund the development and growth of our business. We do not intend to pay any dividends to holders of our common stock following the offering. As a result, capital appreciation in the price of our common stock, if any, will be your only source of gain on an investment in our common stock.
Our management will have broad discretion as to the use of proceeds from this offering, and you may not agree with the manner in which we use the proceeds.
We intend to use a portion of the net proceeds of this offering to support our growth, including to fund organic growth and implement our strategic initiatives, which may include the potential expansion of our business through opportunistic acquisitions, for working capital and other general corporate purposes, and to strengthen our regulatory capital position, although at present we do not have any current plans, arrangements or understandings to make any material capital investments or make any acquisitions. The Company has not formally designated the amount of net proceeds that it will contribute to the Bank or that the Company will use for any particular purpose. Accordingly, our management will have broad discretion as to the application of the net proceeds of this offering and could use them for purposes other than those contemplated at the time of this offering. Our shareholders may not agree with the manner in which our management chooses to allocate and invest the net proceeds. We may not be successful in using the net proceeds from this offering to increase our profitability or market value, and we cannot predict whether the proceeds will be invested to yield a favorable return.
We are controlled by James W. Ayers, whose interests in our business may be different than yours.
Mr. Ayers, our sole shareholder and Chairman, currently controls 100% of our common stock and is able to control our affairs in all cases. Following this offering and the special, one-time equity awards being granted in connection with this offering and the conversion of outstanding EBI plan units and Mr. Holmes’ existing deferred compensation arrangement from cash settled awards to stock settled awards in connection with this offering, Mr. Ayers will continue to own approximately 74.3% of our common stock (or 71.6% if the underwriters exercise their option to purchase additional shares in full). Furthermore, pursuant to the shareholder’s agreement that we intend to enter into with Mr. Ayers prior to or upon completion of this offering, Mr. Ayers will have the right to designate up to a majority of our board of directors. As a result, Mr. Ayers or his nominees to our board of directors will have the ability to control the appointment of our management, the entering into of mergers, material acquisitions and dispositions and other extraordinary transactions and to influence amendments to our charter, bylaws and other corporate governance documents. See “Certain relationships and related person transactions.” So long as Mr. Ayers continues to own a majority of our common stock, he will have the ability to control the vote in any election of directors and will have the
41
Table of Contents
Index to Financial Statements
ability to prevent any transaction that requires shareholder approval regardless of whether others believe the transaction is in our best interests. In any of these matters, the interests of Mr. Ayers may differ from or conflict with the interests of our other shareholders. Moreover, this concentration of stock ownership may also adversely affect the trading price for our common stock to the extent investors perceive disadvantages in owning stock of a company with a controlling shareholder.
We are a “controlled company” within the meaning of the rules of NYSE and, as a result, qualify for, and may rely on, exemptions from certain corporate governance requirements. As a result, you will not have the same protections afforded to shareholders of companies that are subject to such requirements.
Following the consummation of this offering, Mr. Ayers will continue to control a majority of the voting power of our outstanding common stock. As a result, we will be a “controlled company” within the meaning of the corporate governance standards of NYSE. Under these rules, a company of which more than 50% of the voting power is held by an individual, group or another company is a “controlled company” and may elect not to comply with certain corporate governance requirements, including the requirements that a majority of the board of directors consist of independent directors and to have executive compensation committee and nominating and corporate governance committee consisting entirely of independent directors.
We may take advantage of certain of these exemptions for as long as we continue to qualify as a “controlled company”, and following this offering we intend to rely on these exemptions to not have a nominating and corporate governance committee. While exempt, we may also choose not to have a majority of independent directors or compensation committee that consists entirely of independent directors. Accordingly, our shareholders may not have the same protections afforded to shareholders of companies that are subject to all of the corporate governance requirements of NYSE.
We will enter into a tax sharing agreement with our current shareholder, James W. Ayers, and could become obligated to make payments to Mr. Ayers for any additional federal, state or local income taxes assessed against him for tax periods prior to the completion of this offering.
We historically have been treated as an S Corporation for U.S. federal income tax purposes. Because we have been an S Corporation Mr. Ayers, our sole shareholder, as an individual has been taxed on our income. Therefore Mr. Ayers has received certain distributions (“tax distributions”) from us that were generally intended to equal the amount of tax Mr. Ayers was required to pay with respect to our income. In connection with this offering, our S Corporation status will terminate and we will thereafter be subject to federal and increased state income taxes. In the event of an adjustment to our reported taxable income for periods prior to termination of our S Corporation status, it is possible that Mr. Ayers would be liable for additional income taxes for those prior periods. Therefore, we will enter into an agreement with Mr. Ayers prior to or upon consummation of this offering. Pursuant to this agreement, upon our filing any tax return (amended or otherwise), in the event of any restatement of our taxable income or pursuant to a determination by, or a settlement with, a taxing authority, for any period during which we were an S Corporation, depending on the nature of the adjustment we may be required to make a payment to Mr. Ayers in an amount equal to Mr. Ayers’ incremental tax liability, which amount may be material. In addition, we will indemnify Mr. Ayers with respect to unpaid income tax liabilities to the extent that such unpaid income tax liabilities are attributable to an adjustment to our taxable income for any period after our S Corporation status terminates. In both cases the amount of the payment will be based on the assumption that Mr. Ayers is taxed at the highest rate applicable to individuals for the relevant periods. We will also indemnify Mr. Ayers for any interest, penalties, losses, costs or expenses arising out of any claim under the agreement. However, Mr. Ayers will indemnify us with respect to our unpaid tax liabilities (including interest and penalties) to the extent that such unpaid tax liabilities are attributable to a decrease in the shareholder’s taxable income for any for tax period and a corresponding increase in the Company’s taxable income for any period.
42
Table of Contents
Index to Financial Statements
Prior to this offering, we were treated as an S Corporation, and claims of taxing authorities related to our prior status as an S Corporation could harm us.
Upon consummation of this offering, our status as an S Corporation will terminate and we will be treated as a “C Corporation” under the provisions of Sections 301 – 385 of the Code, which treat the corporation as an entity that is subject to U.S. federal income tax. If the unaudited, open tax years in which we were an S Corporation are audited by the Internal Revenue Service, which we refer to as the IRS, and we are determined not to have qualified for, or to have violated, our S Corporation status, we will be obligated to pay back tax, interest and penalties. The amounts that we would be obligated to pay could include tax on all of our taxable income while we were an S Corporation. Any such claims could result in additional costs to us and could have a material adverse effect on our results of operations and financial condition.
There are substantial regulatory limitations on changes of control of bank holding companies.
We are a bank holding company regulated by the Federal Reserve. Subject to certain exceptions, the Change in Bank Control Act of 1978, as amended (“CIBCA”), and its implementing regulations require that any individual or company acquiring “control” of a bank or bank holding company, either directly or indirectly, give the Federal Reserve 60 days’ prior written notice of the proposed acquisition. If within that time period the Federal Reserve has not issued a notice disapproving the proposed acquisition, extended the period for an additional period up to 90 days or requested additional information, the acquisition may proceed. An acquisition may be made before expiration of the disapproval period if the Federal Reserve issues written notice that it intends not to disapprove the acquisition. Acquisition of 25 percent or more of any class of voting securities constitutes control, and it is generally presumed for purposes of the CIBCA that the acquisition of 10 percent or more of any class of voting securities would constitute the acquisition of control, although such a presumption of control may be rebutted.
Also, under the CIBCA, the shareholdings of individuals and companies that are deemed to be “acting in concert” would be aggregated for purposes of determining whether such holders “control” a bank or bank holding company. “Acting in concert” under the CIBCA generally means knowing participation in a joint activity or parallel action towards the common goal of acquiring control of a bank or a bank holding company, whether or not pursuant to an express agreement. The manner in which this definition is applied in individual circumstances can vary and cannot always be predicted with certainty. Many factors can lead to a rebuttable presumption of acting in concert, including where: (i) the shareholders are commonly controlled or managed; (ii) the shareholders are parties to an oral or written agreement or understanding regarding the acquisition, voting or transfer of control of voting securities of a bank or bank holding company; (iii) the shareholders are immediate family members; or (iv) both a shareholder and a controlling shareholder, partner, trustee or management official of such shareholder own equity in the bank or bank holding company.
Furthermore, under the Bank Holding Company Act of 1956, as amended (“BHCA”) and its implementing regulations, and subject to certain exceptions, any company would be required to obtain Federal Reserve approval prior to obtaining control of a bank or bank holding company. Control under the BHCA exists where a company acquires 25 percent or more of any class of voting securities, has the ability to elect a majority of a bank holding company’s directors, is found to exercise a “controlling influence” over a bank or bank holding company’s management and policies, and in certain other circumstances. There is a presumption of non-control for any holder of less than 5% of any class of voting securities. In addition, in 2008 the Federal Reserve issued a policy statement on equity investments in banks and bank holding companies, which sets out circumstances under which a minority investor would not be deemed to control a bank or bank holding company for purposes of the BHCA. Among other things, the 2008 policy statement permits a minority investor to hold up to 24.9% (or 33.3% under certain circumstances) of the total equity (voting and non-voting combined) and have at least one representative on the company’s board of directors (with two directors permitted under certain circumstances).
43
Table of Contents
Index to Financial Statements
Regulatory determination of “control” of a depository institution or holding company, under either the BHCA or CIBCA, is based on all of the relevant facts and circumstances. Potential investors are advised to consult with their legal counsel regarding the applicable regulations and requirements.
Our corporate organizational documents and the provisions of Tennessee law to which we are subject contain certain provisions that could have an anti-takeover effect and may delay, make more difficult or prevent an attempted acquisition of the Company that you may favor.
Our charter and bylaws contain various provisions that could have an anti-takeover effect and may delay, discourage or prevent an attempted acquisition or change of control of the Company. These provisions include:
| • | a provision that directors cannot be removed except for cause; |
| • | a provision that any special meeting of our shareholders may be called only by the chairman of our board of directors, our chief executive officer or a majority of our board of directors; |
| • | a provision that requires the affirmative vote of eighty percent (80%) of the shares outstanding to amend certain provisions of the Company’s charter; and |
| • | a provision establishing certain advance notice procedures for nomination of candidates for election as directors and for shareholder proposals to be considered only at an annual or special meeting of shareholders. |
Our charter provides for noncumulative voting for directors and authorizes the board of directors to issue shares of its preferred stock without shareholder approval and upon such terms as the board of directors may determine. The issuance of our preferred stock, while providing desirable flexibility in connection with possible acquisitions, financings and other corporate purposes, could have the effect of making it more difficult for a third party to acquire, or of discouraging a third party from acquiring, a controlling interest in us. In addition, certain provisions of Tennessee law, including a provision which restricts certain business combinations between a Tennessee corporation and certain affiliated shareholders, may delay, discourage or prevent an attempted acquisition or change in control of the Company. Also, our charter prohibits shareholder action by written consent. See “Description of our capital stock.”
We have the ability to incur debt and pledge our assets, including our stock in the Bank, to secure that debt.
We have the ability to incur debt and pledge our assets to secure that debt. Absent special and unusual circumstances, a holder of indebtedness for borrowed money has rights that are superior to those of holders of common stock. For example, interest must be paid to the lender before dividends can be paid to the shareholders, and loans must be paid off before any assets can be distributed to shareholders if we were to liquidate. Furthermore, we would have to make principal and interest payments on our indebtedness, which could reduce our profitability or result in net losses on a consolidated basis even if the Bank were profitable.
The price of our common stock could be volatile following this offering and our stock price may fall below the initial public offering price at the time you desire to sell your shares of our common stock, in which case, you would incur a loss on your investment.
The market price of our common stock following this offering may be volatile and could be subject to wide fluctuations in price in response to various factors, some of which are beyond our control. These factors include, among other things:
| • | actual or anticipated variations in our quarterly and annual results of operations; |
| • | recommendations or lack thereof by securities analysts; |
| • | failure to meet market predictions of our earnings; |
44
Table of Contents
Index to Financial Statements
| • | operating and stock price performance of other companies that investors deem comparable to us; |
| • | news reports relating to trends, concerns and other issues in the financial services industry, including the failures of other financial institutions in the recent economic downturn; |
| • | perceptions in the marketplace regarding us and/or our competitors; |
| • | new technology used, or services offered, by competitors; and |
| • | changes in government regulations. |
In addition, if the market for stocks in our industry, or the stock market in general, experiences a loss of investor confidence, the trading price of our common stock could decline for reasons unrelated to our business, financial condition or results of operations. If any of the foregoing occurs, it could cause our stock price to fall and may expose us to lawsuits that, even if unsuccessful, could be costly to defend and a distraction to management. Furthermore, bank stocks in Tennessee have enjoyed higher trading multiples compared to bank stocks in other markets and there is no guarantee that this trend will continue or if we will benefit from these same multiples.
If equity research analysts do not publish research or reports about our business, or if they do publish such reports but issue unfavorable commentary or downgrade our common stock, the price and trading volume of our common stock could decline.
The trading market for our common stock could be affected by whether and to what extent equity research analysts publish research or reports about us and our business. We cannot predict at this time whether any research analysts will cover us and our common stock or whether they will publish research and reports on us. If one or more equity analysts cover us and publish research reports about our common stock, the price of our stock could decline if one or more securities analysts downgrade our stock or if those analysts issue other unfavorable commentary or cease publishing reports about us.
If any of the analysts who elect to cover us downgrade their recommendation with respect to our common stock, our stock price could decline rapidly. If any of these analysts ceases coverage of us, we could lose visibility in the market, which in turn could cause our common stock price or trading volume to decline and our common stock to be less liquid.
You will incur immediate dilution as a result of this offering.
If you purchase common stock in this offering, you will pay more for your shares than our existing net tangible book value per share. As a result, you will incur immediate dilution of $6.48 per share, representing the difference between the assumed initial public offering price of $17.00 per share (based on the midpoint of the range set forth on the cover of this prospectus) and our adjusted net tangible book value per share after giving effect to this offering. This represents 38.1% dilution from the assumed initial public offering price.
Future equity issuances could result in dilution, which could cause our common stock price to decline.
We are generally not restricted from issuing additional shares of our common stock up to the authorized shares in our charter. In addition, in connection with this offering, our board of directors has approved a special, one-time equity grant under our Incentive Plan to substantially all of our employees having an aggregate value of $13,600,000 and the conversion of outstanding EBI plan units (at the plan participants’ option) and Mr. Holmes’ existing deferred compensation arrangement from cash settled awards to stock settled awards in connection with this offering. See “Executive compensation and other matters: Summary of one-time IPO equity awards, conversion of deferred compensation and conversion of EBI units” for a further discussion of these awards. In addition, we may issue additional shares of our common stock in the future pursuant to current or future
45
Table of Contents
Index to Financial Statements
employee stock option plans, employee stock grants, upon exercise of warrants or in connection with future acquisitions or financings. If we choose to raise capital by selling shares of our common stock or securities convertible into common stock for any reason, the issuance would have a dilutive effect on the holders of our common stock and could have a material negative effect on the market price of our common stock.
Future sales of our common stock could depress the market price of our common stock.
Sales of a substantial number of shares of our common stock in the public market following this offering, or the perception that large sales could occur, could cause the market price of our common stock to decline or limit our future ability to raise capital through an offering of equity securities.
After completion of this offering, there will be 23,121,176 shares of our common stock outstanding or 24,003,528 shares if the underwriters’ option is exercised in full. All of the shares of common stock sold in this offering will be freely tradable without restriction or further registration under the federal securities laws unless purchased by our “affiliates” within the meaning of Rule 144 under the Securities Act of 1933 (as amended, the “Securities Act”), which shares will be subject to the resale limitations of Rule 144, or shares purchased by participants in the directed share program who purchase more than $250,000 of shares pursuant to that program, which shares will be subject to a 60-day lock-up period. Our directors and executive officers, including our sole shareholder, have agreed to enter into lock-up agreements generally providing, subject to limited exceptions, that they will not, without the prior written consent of J.P. Morgan Securities LLC, UBS Securities LLC and Keefe, Bruyette & Woods, Inc., directly or indirectly, during the period ending 180 days after the date of this prospectus, offer to sell, or otherwise dispose of any shares of our common stock, including any shares purchased by them under the directed share program.
Following the completion of this offering, we also intend to file a registration statement on Form S-8 under the Securities Act covering the 6,020,700 shares of our common stock that have been reserved for issuance, or issued, in the case of the 58,824 fully vested shares being granted in connection with this offering as part of the special, one-time equity grants, in connection with our 2016 Incentive Plan, our Employee Stock Purchase Plan and the optional stock settlement of our outstanding EBI units. Accordingly, subject to certain vesting requirements, shares registered under that registration statement will be available for sale in the open market immediately by persons other than our executive officers and directors and immediately after the lock-up agreements expire by our executive officers and directors. In addition, Mr. Ayers, our sole shareholder and Executive Chairman, will have the benefit of certain registration rights covering all of his shares of our common stock following this offering pursuant to the registration rights agreement that we intend to enter into with Mr. Ayers prior to or upon completion of this offering.
We will incur initial and ongoing compensation expense related to certain compensation arrangements and equity awards being entered into prior to and in connection with this offering that will impact our earnings.
As described in the “Executive compensation and other matters” section of this prospectus, we will provide certain compensation benefits to executive officers and employees in the form of restricted and deferred stock units and other awards prior to and in connection with this offering. As a result, we expect to record approximately $3.66 million in additional pretax compensation expense in the third quarter of 2016 and additional ongoing compensation expense over the vesting period (up to five years in some cases) of these awards.
The accuracy of our financial statements and related disclosures could be affected if the judgments, assumptions or estimates used in our critical accounting policies are inaccurate.
The preparation of financial statements and related disclosure in conformity with accounting principles generally accepted in the United States requires us to make judgments, assumptions and estimates that affect the amounts reported in our consolidated financial statements and accompanying notes. Our critical accounting
46
Table of Contents
Index to Financial Statements
policies, which are included in the section captioned “Management’s discussion and analysis of financial condition and results of operations” in this prospectus, describe those significant accounting policies and methods used in the preparation of our consolidated financial statements that we consider “critical” because they require judgments, assumptions and estimates that materially affect our consolidated financial statements and related disclosures. As a result, if future events differ significantly from the judgments, assumptions and estimates in our critical accounting policies, those events or assumptions could have a material impact on our consolidated financial statements and related disclosures.
Our internal controls over financial reporting may not be effective and our management may not be able to certify as to their effectiveness, which could impair our ability to accurately report our financials and have a significant and adverse effect on our business, reputation and the market price of our common stock.
As a public company, our management is responsible for establishing and maintaining adequate internal control over financial reporting and for evaluating and reporting on that system of internal control. Internal control over financial reporting is a process designed to provide reasonable assurance regarding the reliability of financial reporting and the preparation of financial statements for external purposes in accordance with generally accepted accounting principles. We are currently in the process of enhancing our internal controls over financial reporting to enable us to comply with our obligations under the federal securities laws and other applicable legal requirements. We are not currently required to comply with SEC rules that implement Section 404 of the Sarbanes-Oxley Act and are therefore not required to make a formal assessment of the effectiveness of our internal controls over financial reporting for that purpose. When evaluating our internal controls over financial reporting, we may identify material weaknesses that we may not be able to remediate in time to meet the applicable deadline imposed upon us for compliance with the requirements of Section 404 of the Sarbanes-Oxley Act. In addition, if we fail to achieve and maintain the adequacy of our internal controls, as such standards are modified, supplemented or amended from time to time, we may not be able to ensure that we can conclude on an ongoing basis that we have effective internal controls over financial reporting in accordance with Section 404 of the Sarbanes-Oxley Act. We cannot be certain as to the timing of completion of our evaluation, testing and any remediation actions or the impact of the same on our operations. If we are not able to implement the requirements of Section 404 of the Sarbanes-Oxley Act in a timely manner or with adequate compliance, our independent registered public accounting firm may issue an adverse opinion due to ineffective internal controls over financial reporting, and we may be subject to sanctions or investigation by regulatory authorities, such as the SEC. As a result, there could be a negative reaction in the financial markets due to a loss of confidence in the reliability of our financial statements.
In connection with their audit of our financial statements for the year ended December 31, 2015, our independent registered accounting firm identified one significant deficiency in our internal controls over financial reporting. At the direction of our senior management, we have taken, and are continuing to take, what we believe are appropriate actions to remediate and/or mitigate this significant deficiency.
Furthermore, as we transition to a public company, we intend to continue to improve the effectiveness of our internal controls by hiring additional personnel, utilizing outside consultants and accountants to supplement our internal staff as needed, improving our IT systems, and implementing additional policies and procedures. We anticipate incurring costs in connection with these improvements to our internal control system. If we are unsuccessful in implementing these improvements, we may not be able to accurately and timely report our financial results, conclude on an ongoing basis that we have effective controls over financial reporting or prevent a material weakness in our internal controls over financial reporting, each of which could have a significant and adverse effect on our business, reputation and the market price of our common stock.
47
Table of Contents
Index to Financial Statements
We are an emerging growth company, and we cannot be certain if the reduced disclosure requirements applicable to emerging growth companies will make our common stock less attractive to investors.
We are an “emerging growth company,” as defined in the JOBS Act, and we intend to take advantage of certain exemptions from various regulatory and reporting requirements that are applicable to public companies that are not emerging growth companies, including, but not limited to, exemptions from being required to comply with the auditor attestation requirements of Section 404 of the Sarbanes-Oxley Act, reduced disclosure obligations regarding executive compensation in our periodic reports and proxy statements, and exemptions from the requirements of holding a nonbinding advisory vote on executive compensation and shareholder approval of any golden parachute payments not previously approved. In addition, even if we comply with the greater obligations of public companies that are not emerging growth companies immediately after this offering, we may avail ourselves of the reduced requirements applicable to emerging growth companies from time to time in the future, so long as we are an emerging growth company. We will remain an emerging growth company for up to five years, though we will cease to be an emerging growth company earlier if we have more than $1.0 billion in annual gross revenues, have more than $700.0 million in market value of our common stock held by non-affiliates, or issue more than $1.0 billion of non-convertible debt in a three-year period. Investors and securities analysts may find it more difficult to evaluate our common stock because we will rely on one or more of these exemptions, and, as a result, investor confidence and the market price of our common stock may be materially and adversely affected.
An investment in our common stock is not an insured deposit and is not guaranteed by the FDIC, so you could lose some or all of your investment.
An investment in our common stock is not a bank deposit and, therefore, is not insured against loss or guaranteed by the FDIC, any other deposit insurance fund or by any other public or private entity. An investment in our common stock is inherently risky for the reasons described herein. As a result, if you acquire our common stock, you could lose some or all of your investment.
Risks related to the business environment and our industry
Legislative and regulatory actions taken now or in the future may increase our costs and impact our business, governance structure, financial condition or results of operations.
We and our subsidiaries are subject to extensive regulation at federal and state level by multiple regulatory bodies. These regulations may affect the manner and terms of delivery of our services. If we do not comply with governmental regulations, we may be subject to fines, penalties, lawsuits or material restrictions on our businesses in the jurisdiction where the violation occurred, which may adversely affect our business operations. Changes in these regulations can significantly affect the services that we provide as well as our costs of compliance with such regulations. In addition, adverse publicity and damage to our reputation arising from the failure or perceived failure to comply with legal, regulatory or contractual requirements could affect our ability to attract and retain clients.
The Dodd-Frank Act brought about a significant overhaul of many aspects of the regulation of the financial services industry, addressing, among other things, systemic risk, capital adequacy, deposit insurance assessments, consumer financial protection, interchange fees, derivatives, lending limits, mortgage lending practices, registration of investment advisors and changes among the bank regulatory agencies. Key provisions of the Dodd-Frank Act that have impacted or are likely to impact our operations include:
| • | creation of the Consumer Financial Protection Bureau (“CFPB”), with centralized authority, including rulemaking, examination and enforcement authority, for consumer protection in the banking industry. |
48
Table of Contents
Index to Financial Statements
| • | new and heightened regulatory requirements affecting consumer mortgages, and impacting the secondary mortgage market. |
| • | new limitations on federal preemption. |
| • | new prohibitions and restrictions on the ability of a banking entity and nonbank financial company to engage in proprietary trading and have certain interests in, or relationships with, a hedge fund or private equity fund (the “Volcker Rule”). |
| • | application of new regulatory capital requirements, including changes to leverage and risk-based capital standards and changes to the components of permissible tiered capital. |
| • | changes to the assessment base for deposit insurance premiums. |
| • | permanently raising the FDIC’s standard maximum deposit insurance amount to $250,000 limit for federal deposit insurance. |
| • | repeal of the prohibition on the payment of interest on demand deposits, thereby permitting depository institutions to pay interest on business transaction and other accounts. |
| • | restrictions on compensation, including a prohibition on incentive-based compensation arrangements that encourage inappropriate risk taking by covered financial institutions and are deemed to be excessive, or that may lead to material losses. |
| • | requirement that sponsors of asset-backed securities retain a percentage of the credit risk of the assets underlying the securities. |
| • | requirement that banking regulators remove references to and requirements of reliance upon credit ratings from their regulations and replace them with appropriate alternatives for evaluating credit worthiness. |
Some of these and other major changes could materially impact the profitability of our business, the value of assets we hold or the collateral available for our loans, require changes to business practices or force us to discontinue businesses and expose us to additional costs, taxes, liabilities, enforcement actions and reputational risk. Many of these provisions became effective upon enactment of the Dodd-Frank Act, while others were subject to further study, rulemaking, and the discretion of regulatory bodies and have only recently taken effect or will take effect in coming years. In light of these significant changes and the discretion afforded to federal regulators, we cannot fully predict the effect that compliance with the Dodd-Frank Act or any implementing regulations will have on our businesses or ability to pursue future business opportunities. Additional regulations resulting from the Dodd-Frank Act may materially adversely affect our business, financial condition or results of operations.
See “Business: Supervision and regulation.”
New proposals for legislation continue to be introduced in the U.S. Congress that could further alter regulation of the financial services industry. Federal and state regulatory agencies also frequently adopt changes to their regulations or change the manner in which existing regulations are applied. Certain aspects of current or proposed regulatory or legislative changes to laws applicable to the financial industry, if enacted or adopted, may impact the profitability of our business activities, require more oversight or change certain of our business practices, including the ability to offer new products, obtain financing, attract deposits, make loans, and achieve satisfactory interest spreads, and could expose us to additional costs, including increased compliance costs. These changes also may require us to invest significant management attention and resources to make any necessary changes to operations in order to comply, and could therefore also materially and adversely affect our business, financial condition and results of operations.
49
Table of Contents
Index to Financial Statements
Such proposals and legislation, if finally adopted, would change banking laws, our operating environment and the operating environment of our subsidiaries in substantial and unpredictable ways. We cannot determine whether such proposals and legislation will be adopted, or the ultimate effect that such proposals and legislation, if enacted, or regulations issued to implement the same, would have upon our business, financial condition or results of operations. Also, in recent years, regulatory oversight and enforcement have increased substantially, imposing additional costs and increasing the potential risks associated with our operations. If these regulatory trends continue, they could adversely affect our business and, in turn, our consolidated results of operations.
Monetary policies and regulations of the Federal Reserve could adversely affect our business, financial condition and results of operations.
In addition to being affected by general economic conditions, our earnings and growth are affected by the policies of the Federal Reserve. An important function of the Federal Reserve is to regulate the money supply and credit conditions. Among the instruments used by the Federal Reserve to implement these objectives are open market operations in U.S. government securities, adjustments of the discount rate and changes in reserve requirements against bank deposits. These instruments are used in varying combinations to influence overall economic growth and the distribution of credit, bank loans, investments and deposits. Their use also affects interest rates charged on loans or paid on deposits.
The monetary policies and regulations of the Federal Reserve have had a significant effect on the operating results of commercial banks in the past and are expected to continue to do so in the future. The effects of such policies upon our business, financial condition and results of operations cannot be predicted.
The Federal Reserve may require us to commit capital resources to support the Bank.
The Federal Reserve, which examines us and the Bank, requires a bank holding company to act as a source of financial and managerial strength to a subsidiary bank and to commit resources to support such subsidiary bank. Under the “source of strength” doctrine, the Federal Reserve may require a bank holding company to make capital injections into a troubled subsidiary bank and may charge the bank holding company with engaging in unsafe and unsound practices for failure to commit resources to such a subsidiary bank. In addition, the Dodd-Frank Act directs the federal bank regulators to require that all companies that directly or indirectly control an insured depository institution serve as a source of strength for the institution. Under these requirements, in the future, we could be required to provide financial assistance to the Bank if it experiences financial distress.
A capital injection may be required at times when we do not have the resources to provide it, and therefore we may be required to borrow the funds. In the event of a bank holding company’s bankruptcy, the bankruptcy trustee will assume any commitment by the holding company to a federal bank regulatory agency to maintain the capital of a subsidiary bank. Moreover, bankruptcy law provides that claims based on any such commitment will be entitled to a priority of payment over the claims of the holding company’s general unsecured creditors, including the holders of its note obligations. Thus, any borrowing that must be done by the holding company in order to make the required capital injection becomes more difficult and expensive and will adversely impact the holding company’s cash flows, financial condition, results of operations and prospects.
Federal and state banking agencies periodically conduct examinations of our business, including compliance with laws and regulations, and our failure to comply with any supervisory actions to which we become subject as a result of such examinations could materially and adversely affect us.
Tennessee and federal banking agencies, including the Tennessee Department of Financial Institutions, the Board of Governors of the Federal Reserve System, and the Federal Deposit Insurance Corporation, periodically conduct examinations of our business, including compliance with laws and regulations. If, as a result of an
50
Table of Contents
Index to Financial Statements
examination, a Tennessee or federal banking agency were to determine that the financial condition, capital resources, asset quality, earnings prospects, management, liquidity or other aspects of our operations had become unsatisfactory, or that the Company or its management was in violation of any law or regulation, including violations of consumer financial services protection laws and regulations, it may take a number of different remedial actions as it deems appropriate. These actions include the power to enjoin “unsafe or unsound” practices, to require affirmative actions to correct any conditions resulting from any violation or practice, to issue an administrative order that can be judicially enforced, to direct an increase in our capital, to restrict our growth, to change the asset composition of our portfolio or balance sheet, to assess civil monetary penalties against the Bank, our officers or directors, to remove officers and directors and, if it is concluded that such conditions cannot be corrected or there is an imminent risk of loss to depositors, to terminate our deposit insurance and place the bank in receivership or conservatorship. If we become subject to such regulatory actions, we could be materially and adversely affected.
We may be materially and adversely affected by the creditworthiness and liquidity of other financial institutions.
Financial services institutions are interrelated as a result of trading, clearing, counterparty, or other relationships. We have exposure to many different industries and counterparties, and routinely execute transactions with counterparties in the financial services industry, including commercial banks, brokers and dealers, investment banks, and other institutional clients. Many of these transactions expose us to credit risk in the event of a default by, or questions or concerns about the creditworthiness of, a counterparty or client. In addition, our credit risk may be exacerbated when the collateral held by us cannot be realized upon or is liquidated at prices not sufficient to recover the full amount of the credit or derivative exposure due to us. Any such losses could have a material adverse effect on us.
Federal, state and local consumer lending laws may restrict our ability to originate certain mortgage loans or increase our risk of liability with respect to such loans and could increase our cost of doing business.
Federal, state and local laws have been adopted that are intended to eliminate certain lending practices considered “predatory.” These laws prohibit practices such as steering borrowers away from more affordable products, selling unnecessary insurance to borrowers, repeatedly refinancing loans and making loans without a reasonable expectation that the borrowers will be able to repay the loans irrespective of the value of the underlying property. Since 2013, the CFPB has issued several rules on mortgage lending, notably a rule requiring all home mortgage lenders to determine a borrower’s ability to repay the loan. The origination of loans with certain terms and conditions and that otherwise meet the definition of a “qualified mortgage” may protect us from liability to a borrower for failing to make the necessary determinations. In either case, we may find it necessary to tighten our mortgage loan underwriting standards in response to the CFPB rules, which may constrain our ability to make loans consistent with our business strategies. It is our policy not to make predatory loans and to determine borrowers’ ability to repay, but the law and related rules create the potential for increased liability with respect to our lending and loan investment activities. They increase our cost of doing business and, ultimately, may prevent us from making certain loans and cause us to reduce the average percentage rate or the points and fees on loans that we do make.
We are subject to federal and state fair lending laws, and failure to comply with these laws could lead to material penalties.
Federal and state fair lending laws and regulations, such as the Equal Credit Opportunity Act and the Fair Housing Act, impose nondiscriminatory lending requirements on financial institutions. The Department of Justice, CFPB and other federal and state agencies are responsible for enforcing these laws and regulations. Private parties may also have the ability to challenge an institution’s performance under fair lending laws in private class action litigation. A successful challenge to our performance under the fair lending laws and
51
Table of Contents
Index to Financial Statements
regulations could adversely impact our rating under the Community Reinvestment Act and result in a wide variety of sanctions, including the required payment of damages and civil money penalties, injunctive relief, imposition of restrictions on merger and acquisition activity and restrictions on expansion activity, which could negatively impact our reputation, business, financial condition and results of operations.
We could face a risk of noncompliance and enforcement action with the Bank Secrecy Act and other anti-money laundering statutes and regulations.
The Bank Secrecy Act of 1970, the Uniting and Strengthening America by Providing Appropriate Tools Required to Intercept and Obstruct Terrorism Act of 2001 and other laws and regulations require financial institutions, among other duties, to institute and maintain effective anti-money laundering programs and file suspicious activity and currency transaction reports as appropriate. The Financial Crimes Enforcement Network, established by the U.S. Department of the Treasury to administer the Bank Secrecy Act, is authorized to impose significant civil money penalties for violations of those requirements and engages in coordinated enforcement efforts with the individual federal banking regulators, as well as the U.S. Department of Justice, Drug Enforcement Administration and IRS. There is also increased scrutiny of compliance with the rules enforced by the Office of Foreign Assets Control related to U.S. sanctions regimes. If our policies, procedures and systems are deemed deficient or the policies, procedures and systems of the financial institutions that we have already acquired or may acquire in the future are deficient, we would be subject to liability, including fines and regulatory actions such as restrictions on our ability to pay dividends and the necessity to obtain regulatory approvals to proceed with certain aspects of our business plan, including our acquisition plans, which would negatively impact our business, financial condition and results of operations. Failure to maintain and implement adequate programs to combat money laundering and terrorist financing could also have serious reputational consequences for us. See “Business: Supervision and regulation.”
52
Table of Contents
Index to Financial Statements
Cautionary note regarding forward-looking statements
Certain statements contained in this prospectus are forward-looking statements within the meaning of Section 27A of the Securities Act and Section 21E of the Exchange Act. These forward-looking statements include statements relating to our projected growth, anticipated future financial performance, financial condition, credit quality and management’s long-term performance goals, as well as statements relating to the anticipated effects on our business, financial condition and results of operations from expected developments or events, our business, growth and strategies. These statements, which are based on certain assumptions and estimates and describe our future plans, results, strategies and expectations, can generally be identified by the use of the words and phrases “may,” “will,” “should,” “could,” “would,” “goal,” “plan,” “potential,” “estimate,” “project,” “believe,” “intend,” “anticipate,” “expect,” “target,” “aim,” “predict,” “continue,” “seek,” “projection” and other variations of such words and phrases and similar expressions.
We have made the forward-looking statements in this prospectus based on assumptions and estimates that we believe to be reasonable in light of the information available to us at this time. However, these forward-looking statements are subject to significant risks and uncertainties, and could be affected by many factors. Factors that could have a material adverse effect on our business, financial condition, results of operations and future growth prospects can be found in the “Risk factors” and “Management’s discussion and analysis of financial condition and results of operations” sections of this prospectus and elsewhere in this prospectus. These factors include, but are not limited to, the following:
| • | business and economic conditions nationally, regionally and in our target markets, particularly in Tennessee and the geographic areas in which we operate; |
| • | concentration of our loan portfolio in real estate loans and changes in the prices, values and sales volumes of commercial and residential real estate; |
| • | the concentration of our business within our geographic areas of operation in Tennessee and neighboring markets; |
| • | credit and lending risks associated with our commercial real estate, commercial and industrial, and construction portfolios; |
| • | increased competition in the banking and mortgage banking industry, nationally, regionally or locally; |
| • | our ability to execute our business strategy to achieve profitable growth; |
| • | the dependence of our operating model on our ability to attract and retain experienced and talented bankers in each of our markets; |
| • | risks that our cost of funding could increase, in the event we are unable to continue to attract stable, low-cost deposits and reduce our cost of deposits; |
| • | our ability to increase our operating efficiency; |
| • | failure to keep pace with technological change or difficulties when implementing new technologies; |
| • | risks related to the recent conversion of our core operating platform; |
| • | negative impact in our mortgage banking services, including declines in our mortgage originations or profitability due to rising interest rates and increased competition and regulation, the Bank’s or third party’s failure to satisfy mortgage servicing obligations, and the possibility of the Bank being required to repurchase mortgage loans or indemnify buyers; |
53
Table of Contents
Index to Financial Statements
| • | our ability to attract and maintain business banking relationships with well-qualified businesses, real estate developers and investors with proven track records in our market areas; |
| • | our ability to attract sufficient loans that meet prudent credit standards, including in our commercial and industrial and owner-occupied commercial real estate loan categories; |
| • | failure to maintain adequate liquidity and regulatory capital and comply with evolving federal and state banking regulations; |
| • | inability of our risk management framework to effectively mitigate credit risk, interest rate risk, liquidity risk, price risk, compliance risk, operational risk, strategic risk and reputational risk; |
| • | develop new, and grow our existing, streams of noninterest income; |
| • | oversee the performance of third party service providers that provide material services to our business; |
| • | maintain expenses in line with their current projections; |
| • | our dependence on our management team and our ability to motivate and retain our management team; |
| • | risks related to our acquisition of Northwest Georgia Bank; |
| • | risks related to any future acquisitions, including failure to realize anticipated benefits from future acquisitions; |
| • | inability to find acquisition candidates that will be accretive to our financial condition and results of operations; |
| • | system failures, data security breaches, including as a result of cyber-attacks, or failures to prevent breaches of our network security; |
| • | data processing system failures and errors; |
| • | fraudulent and negligent acts by our clients, employees or vendors; |
| • | fluctuations in the market value and its impact in the securities held in our securities portfolio; |
| • | the adequacy of our reserves (including allowance for loan losses) and the appropriateness of our methodology for calculating such reserves; |
| • | the makeup of our asset mix and investments; |
| • | our focus on small and mid-sized businesses; |
| • | an inability to raise necessary capital to fund our growth strategy, operations or to meet increased minimum regulatory capital levels; |
| • | the sufficiency of our capital, including sources of such capital and the extent to which capital may be used or required; |
| • | interest rate shifts and its impact on our financial condition and results of operation; |
| • | the expenses that we will incur to operate as a public company and our inexperience complying with the requirements of being a public company; |
| • | the institution and outcome of litigation and other legal proceeding against us or to which we become subject; |
| • | changes in our accounting standards; |
| • | the impact of recent and future legislative and regulatory changes; |
54
Table of Contents
Index to Financial Statements
| • | governmental monetary and fiscal policies; |
| • | changes in the scope and cost of Federal Deposit Insurance Corporation, or FDIC, insurance and other coverage; |
| • | dilution related to the special, one-time equity grants under our 2016 Incentive Plan to substantially all of our employees and the conversion of outstanding EBI plan units (at the plan participants’ option) and Mr. Holmes’ existing deferred compensation arrangement from cash settled awards to stock settled awards, in each case in connection with this offering, and future issuances under our 2016 Incentive Plan and our Employee Stock Purchase Plan; and |
| • | other factors and risks described under the “Risk factors” and “Management’s discussion and analysis of financial condition and results of operations” sections herein. |
Because of these risks and other uncertainties, our actual results, performance or achievement, or industry results, may be materially different from the anticipated or estimated results discussed in the forward-looking statements in this prospectus. Our past results of operations are not necessarily indicative of our future results. You should not rely on any forward-looking statements, which represent our beliefs, assumptions and estimates only as of the dates on which they were made, as predictions of future events. We undertake no obligation to update these forward-looking statements, even though circumstances may change in the future, except as required under federal securities law. We qualify all of our forward-looking statements by these cautionary statements.
55
Table of Contents
Index to Financial Statements
Assuming an initial public offering price of $17.00 per share (the midpoint of the range set forth on the cover page of this prospectus), we estimate that the net proceeds to us from this offering, after deducting underwriting discounts and commissions and the estimated offering expenses, will be approximately $89.1 million, or approximately $103.1 million if the underwriters’ over-allotment option is exercised in full. Each $1 increase (decrease) in the initial public offering price per share would increase (decrease) our net proceeds, after deducting underwriting discounts and commissions and the estimated offering expenses, by $5.5 million (assuming no exercise of the underwriters’ over-allotment option). See “Underwriting” for additional information regarding offering expenses and underwriting commissions and discounts.
We intend to use the net proceeds to us from this offering (i) to fund a cash distribution to our sole shareholder immediately after the closing of this offering in the amount of $55 million, which is intended to be non-taxable to our sole shareholder and represents a significant portion of our S Corporation earnings that have been taxed to our sole shareholder, but not distributed to him, and (ii) subject to regulatory approval, to repay all $10.1 million aggregate principal amount of subordinated notes held by our sole shareholder, plus any accrued and unpaid interest thereon. We intend to use the remainder of the net proceeds to us from this offering, which we estimate to be approximately $24.0 million, to support our growth, including to fund our organic growth and implement our strategic initiatives, which may include the potential expansion of our business through opportunistic acquisitions of depository institutions and other complementary businesses, and selective acquisitions of assets, deposits and branches that we believe present attractive risk—adjusted returns or provide a strategic benefit to our growth strategy, for working capital and for other general corporate purposes, and to strengthen our regulatory capital.
Our management will have broad discretion in the application of the net proceeds from this offering to us, and investors will be relying on the judgment of our management regarding the application of the proceeds. Pending their use, we plan to invest our net proceeds from this offering in short term, interest bearing obligations, investment grade instruments, certificates of deposit, or direct or guaranteed obligations of the U.S. government.
The subordinated notes held by our sole shareholder consist of three series of subordinated notes with aggregate principal amounts outstanding of $775 thousand, $3.3 million and $6.0 million, respectively. These series of notes accrue interest (i) at an annual rate equal to the prime rate less 100 basis points, in the case of the $775 thousand principal amount of notes, (ii) at a quarterly rate equal to the 30 day LIBOR rate plus 200 basis points, in the case of the $3.3 million principal amount of notes, and (iii) at a quarterly rate equal to the 90 day LIBOR rate plus 170 basis points, in the case of the $6.0 million principal amount of notes. The maturity date of each series of subordinated notes is December 31, 2021.
56
Table of Contents
Index to Financial Statements
Dividends
As an S Corporation, we have historically made distributions to our shareholder to provide him with funds to pay U.S. federal income tax on our taxable income that was “passed through” to him. We have also historically paid additional dividends to our shareholder as a return on his investment from time to time. Following this initial public offering, our dividend policy and practice will change because we will be taxed as a C Corporation and, therefore, we will no longer pay distributions to provide our shareholders with funds to pay U.S. federal income tax on their pro rata portion of our taxable income.
After this offering and the payment of the distribution of S Corporation earnings to our sole shareholder described below, we intend to retain our future earnings, if any, to fund the development and growth of our business and we do not anticipate paying any dividends to the holders of our common stock in the foreseeable future. Any future determination relating to our dividend policy will be made by our board of directors and will depend on a number of factors, including general and economic conditions, industry standards, our financial condition and operating results, our available cash and current and anticipated cash needs, capital requirements, banking regulations, contractual, legal, tax and regulatory restrictions and implications on the payment of dividends by us to our shareholders or by the Bank to us, and such other factors as our board of directors may deem relevant.
The following table shows the dividends (other than the distribution of S Corporation earnings described below) that have been declared on our common stock with respect to the periods indicated below. Per share amounts are presented to the nearest cent. In addition to the dividends set forth in the table below, we intend to make a distribution to our sole shareholder in an amount between $4 million and $5 million prior to the completion of this offering to fund the payment of the estimated third quarter taxes that will be “passed through” to him by virtue of our status as an S Corporation.
| (dollars in thousands, except share amounts and per share data) | ||||||||
| Quarterly period | Amount per share |
Total cash dividend |
||||||
| First Quarter 2014 |
$ | 0.49 | $ | 8,500 | ||||
| Second Quarter 2014 |
0.15 | 2,500 | ||||||
| Third Quarter 2014 |
0.22 | 3,850 | ||||||
| Fourth Quarter 2014 |
0.10 | 1,750 | ||||||
| First Quarter 2015 |
0.40 | 6,900 | ||||||
| Second Quarter 2015 |
0.20 | 3,500 | ||||||
| Third Quarter 2015 |
0.62 | 10,700 | ||||||
| Fourth Quarter 2015 |
0.15 | 2,500 | ||||||
| First Quarter 2016 |
0.29 | 5,000 | ||||||
| Second Quarter 2016 |
0.25 | 4,300 | ||||||
|
|
||||||||
Distribution of S Corporation earnings
We have in excess of $55 million of S Corporation earnings, which have been, or will be, taxed to our sole shareholder, but have not been distributed to him. As a result and in connection with the termination of our status as an S Corporation, we are able to make a cash distribution to our sole shareholder in an amount equal to these taxed, yet undistributed, earnings that is intended to be non-taxable to him.
Our board of directors intends to declare a cash distribution to our sole shareholder in the amount of $55 million, which is intended to be non-taxable to our sole shareholder and represents a significant portion of our S Corporation earnings that have been, or will be, taxed to our sole shareholder, but not distributed to him. The distribution will be contingent upon, and payable to our sole shareholder immediately following, the closing of this offering. Purchasers of our common stock in this offering will not be entitled to receive any portion of this distribution.
57
Table of Contents
Index to Financial Statements
Dividend restriction
As a bank holding company, any dividends paid by us are subject to various federal and state regulatory limitations and also may be subject to the ability of the Bank to make distributions or pay dividends to us. See “Business: Supervision and regulation: Holding company regulation: Restrictions on bank holding company dividends” for a more detailed discussion of these regulatory limitations. The Bank is also subject to various legal, regulatory and other restrictions on its ability to pay dividends and make other distributions and payments to us. See “Business: Supervision and regulation: Bank regulation: Bank dividends.” Our ability to pay dividends is limited by minimum capital and other requirements prescribed by law and regulation. Furthermore, we are generally prohibited under Tennessee corporate law from making a distribution to a shareholder to the extent that, at the time of the distribution, after giving effect to the distribution, we would not be able to pay our debts as they become due in the usual course of business or our total assets would be less than the sum of its total liabilities plus (unless the charter permits otherwise) the amount that would be needed, if we were to be dissolved at the time of the distribution, to satisfy the preferential rights upon dissolution of any shareholders who may have preferential rights superior to those receiving the distribution. In addition, financing arrangements that we may enter into in the future may include restrictive covenants that may limit our ability to pay dividends.
58
Table of Contents
Index to Financial Statements
The following table sets forth our capitalization and regulatory capital ratios on a consolidated basis as of June 30, 2016:
| • | on an actual basis; and |
| • | on an as adjusted basis after giving effect to (i) the sale of 5,882,352 shares of our common stock by us in this offering at an assumed initial public offering price of $17.00 per share (the midpoint of the range set forth on the cover page of this prospectus), (ii) the payment of the $55 million distribution to our sole shareholder immediately after the closing of this offering, (iii) the repayment of all $10.1 million aggregate principal amount of subordinated notes held by our sole shareholder, plus any accrued and unpaid interest thereon, (iv) the special, one-time equity awards being granted in connection with this offering and the conversion of outstanding EBI plan units (at the plan participants’ option) and Mr. Holmes’ existing deferred compensation arrangement from cash settled awards to stock settled awards in connection with this offering and (v) the deduction of the underwriting discounts and commissions and the estimated expenses incurred in connection with this offering, and, in each case, not assuming the sale of any shares of common stock upon the exercise of the underwriters’ option to purchase additional shares. Each $1 increase (decrease) in the initial public offering price per share could increase (decrease) our total shareholder’s equity and total capitalization by $5.5 million, not assuming the sale of any shares of common stock upon the exercise of the underwriters’ option to purchase additional shares. |
The following should be read in conjunction with “Use of proceeds,” “Management’s discussion and analysis of financial condition and results of operations,” “Selected historical consolidated financial data” and our consolidated financial statements and accompanying notes that are included elsewhere in this prospectus.
| As of June 30,
2016 (unaudited) |
||||||||
| (dollars in thousands, except share amounts and per share data) | Actual | As adjusted | ||||||
| Long-term debt(1) |
$ | 41,005 | 30,930 | |||||
| Shareholder’s equity |
||||||||
| Common stock, $1.00 par value; 25,000,000 shares authorized and 17,180,000 (actual) and 75,000,000 authorized and 23,121,176 (as adjusted) shares issued(2) |
17,180 | 23,121 | ||||||
| Additional paid-in capital |
94,544 | 189,419 | ||||||
| Retained earnings |
143,567 | 72,591 | ||||||
| Accumulated other comprehensive income |
10,477 | 10,477 | ||||||
| Total shareholder’s equity |
265,768 | 295,608 | ||||||
| Total capitalization |
306,773 | 326,538 | ||||||
| Capital Ratios |
||||||||
| Tier 1 capital to average assets |
7.98% | 9.55% | ||||||
| Tier 1 capital to risk-weighted assets |
9.57% | 11.46% | ||||||
| Total capital to risk-weighted assets |
11.00% | 12.47% | ||||||
| Common equity Tier 1 capital to risk-weighted assets |
8.30% | 10.19% | ||||||
| Total shareholder’s equity to total assets |
9.11% | 10.20% | ||||||
|
|
||||||||
| (1) | Excludes Federal Home Loan Bank Advances of $14.8 million. |
| (2) | The number of authorized shares was increased to 75,000,000 in connection with this offering. |
59
Table of Contents
Index to Financial Statements
If you invest in our common stock, your interest will be diluted to the extent of the difference between the initial public offering price per share and the net tangible book value per share after this offering.
As of June 30, 2016, we had net tangible book value of approximately $213.3 million, or $12.41 per share. Net tangible book value per share represents the book value of our total tangible assets less the book value of our total liabilities divided by the number of shares of common stock then issued and outstanding. After giving effect to the sale of shares of our common stock in this offering (assuming the underwriters do not exercise their option to purchase additional shares), based upon an assumed initial public offering price of $17.00 per share (the midpoint of the range set forth on the cover page of this prospectus) and after deducting estimated underwriting discounts and commission and estimated offering expenses payable by us, our as adjusted net tangible book value as of June 30, 2016 would have been approximately $243.1 million, or $10.52 per share. This represents an immediate decrease in net tangible book value of $1.89 per share to our existing shareholder and an immediate dilution of $6.48 per share to new investors purchasing common stock in this offering.
The following table illustrates this dilution on a per share basis:
| Per share | ||||
| Assumed initial public offering price per share of common stock |
$ | 17.00 | ||
| Net tangible book value per share as of June 30, 2016 |
$ | 12.41 | ||
| Decrease in net tangible book value per share of our common stock attributable to this offering |
$ | 1.89 | ||
|
|
|
|||
| As adjusted net tangible book value per share of common stock after this offering |
$ | 10.52 | ||
|
|
|
|||
| Dilution per share to new investors in this offering |
$ | 6.48 | ||
|
|
||||
If the underwriters exercise in full their option to purchase additional shares in this offering, our as adjusted net tangible book value per share would be $10.71 per share of common stock and the dilution to new investors in this offering would be $6.29 per share of common stock.
Each $1.00 increase (decrease) in the assumed initial offering price would increase (decrease) our as adjusted net tangible book value after this offering by approximately $5.5 million, or approximately $0.24 per share, and the dilution per share to new investors by approximately $0.24, assuming the number of shares offered by us, as set forth on the cover page of this prospectus, remains the same and after deducting underwriting discounts and commissions and estimated offering expenses payable by us. An increase (decrease) of 1.0 million in the number of shares offered by us would increase (decrease) our as adjusted net tangible book value after this offering by approximately $15.8 million, or approximately $0.66 per share, and the dilution per share to new investors by approximately $0.66, assuming the public offering price of $17.00 per share of common stock, which is the midpoint of the price range set forth on the cover page of this prospectus, remains the same and after deducting underwriting discounts and commissions and estimated offering expenses payable by us. The as adjusted information discussed above is illustrative only and will adjust based on the actual initial public offering price and other terms of this offering determined at pricing.
During the past five years, none of our officers, directors or affiliates acquired any shares of our common stock or have had the right to acquire any shares of our common stock, other than the equity awards being granted to certain of our executive officers and employees in connection with this offering and the conversion of outstanding EBI plan units (at the plan participants’ option) and Mr. Holmes’ existing deferred compensation arrangement from cash settled awards to stock settled awards in connection with this offering, in each case as described under “Executive compensation and other matters: Summary of one-time IPO equity awards, conversion of deferred compensation and conversion of EBI units.”
60
Table of Contents
Index to Financial Statements
Selected historical consolidated financial data
The following tables set forth (i) our selected historical consolidated financial data as of and for the six months ended June 30, 2016 and 2015, (ii) our selected historical consolidated financial data as of and for the ears ended December 31, 2015, 2014, 2013, 2012 and 2011, (iii) other data as of and for the periods indicated and (iv) certain pro forma information to reflect our conversion from a subchapter S Corporation to a C Corporation in connection with this offering as if it had occurred at the beginning of each period. The selected historical consolidated financial data as of and for the years ended December 31, 2015, 2014 and 2013 have been derived from, and qualified by reference to, the Company’s audited financial statements included elsewhere in this prospectus and should be read in conjunction with those consolidated financial statements and notes thereto. The selected historical consolidated financial data as of and for the year ended December 31, 2012 and 2011 has been derived from our audited financial statements not included in this prospectus. The summary historical consolidated financial data as of and for the six months ended June 30, 2016 and 2015 have been derived from our unaudited interim consolidated financial statements included elsewhere in this prospectus. The selected historical consolidated financial data reflects the 100-for-one stock split that was effectuated prior to this offering. As such, all share and per share amounts have been retroactively adjusted to reflect the stock split for all periods presented and are based on 17,180,000 shares of our common stock outstanding as of June 30, 2016 and 2015 and December 31, 2015, 2014 and 2013 after giving effect to such stock split.
The following selected historical consolidated financial data of the Company should be read in conjunction with, and are qualified by reference to, “Management’s discussion and analysis of financial condition and results of operations” and the consolidated financial statements and notes thereto included elsewhere in this prospectus. Our historical results for any prior period are not necessarily indicative of results to be expected in any future period.
| As of and for the
six June 30, (unaudited) |
As of and for year ended December 31, | |||||||||||||||||||||||||||
| (dollars in thousands, except per share data and ratio) | ||||||||||||||||||||||||||||
| 2016 | 2015 | 2015 | 2014 | 2013 | 2012 | 2011 | ||||||||||||||||||||||
| Statement of Income Data |
||||||||||||||||||||||||||||
| Total interest income |
$ | 58,922 | $ | 48,846 | $ | 102,782 | $ | 92,889 | $ | 87,082 | $ | 89,315 | $ | 89,961 | ||||||||||||||
| Total interest expense |
4,621 | 4,405 | 8,910 | 9,513 | 11,606 | 20,986 | 28,255 | |||||||||||||||||||||
|
|
|
|||||||||||||||||||||||||||
| Net interest income |
54,301 | 44,441 | 93,872 | 83,376 | 75,476 | 68,329 | 61,706 | |||||||||||||||||||||
| Provision for loan losses |
(798 | ) | 222 | (3,064 | ) | (2,716 | ) | (1,519 | ) | 528 | 3,363 | |||||||||||||||||
| Total noninterest income |
69,391 | 41,223 | 92,380 | 50,802 | 41,386 | 38,047 | 27,847 | |||||||||||||||||||||
| Total noninterest expense |
91,942 | 61,033 | 138,492 | 102,163 | 89,584 | 83,874 | 70,854 | |||||||||||||||||||||
|
|
|
|||||||||||||||||||||||||||
| Net income before income taxes |
32,548 | 24,409 | 50,824 | 34,731 | 28,797 | 21,974 | 15,336 | |||||||||||||||||||||
| State income tax expense |
2,174 | 1,649 | 2,968 | 2,269 | 1,894 | 1,457 | 1,020 | |||||||||||||||||||||
|
|
|
|||||||||||||||||||||||||||
| Net income |
$ | 30,374 | $ | 22,760 | $ | 47,856 | $ | 32,462 | $ | 26,903 | $ | 20,517 | $ | 14,316 | ||||||||||||||
|
|
|
|||||||||||||||||||||||||||
| Net interest income (tax—equivalent basis)(6) |
$ | 55,412 | $ | 45,472 | $ | 95,887 | $ | 85,487 | $ | 77,640 | $ | 70,602 | $ | 63,935 | ||||||||||||||
| Per Common Share |
||||||||||||||||||||||||||||
| Basic and diluted net income |
$ | 1.77 | $ | 1.32 | $ | 2.79 | $ | 1.89 | $ | 1.57 | $ | 1.19 | $ | 0.83 | ||||||||||||||
| Book value(1)(2) |
15.47 | 13.19 | 13.78 | 12.53 | 11.04 | 11.49 | 10.34 | |||||||||||||||||||||
| Tangible book value(2)(6) |
12.41 | 10.30 | 10.66 | 9.59 | 8.01 | 8.36 | 7.11 | |||||||||||||||||||||
| Pro Forma Statement of Income and Per Common Share Data(2)(5) |
||||||||||||||||||||||||||||
| Pro forma provision for income tax |
$ | 12,169 | $ | 8,964 | $ | 17,896 | $ | 12,374 | $ | 10,185 | $ | 7,419 | $ | 4,654 | ||||||||||||||
| Pro forma net income |
20,379 | 15,445 | 33,118 | 22,357 | 18,612 | 14,555 | 10,681 | |||||||||||||||||||||
| Pro forma net income per common share—basic and diluted |
1.19 | 0.90 | 1.93 | 1.30 | 1.08 | 0.85 | 0.62 | |||||||||||||||||||||
| Selected Balance Sheet Data |
||||||||||||||||||||||||||||
| Cash and due from banks |
$ | 52,122 | $ | 56,119 | $ | 53,893 | $ | 40,093 | $ | 41,943 | $ | 45,522 | $ | 34,914 | ||||||||||||||
| Loans held for investment |
1,750,304 | 1,507,632 | 1,701,863 | 1,415,896 | 1,341,347 | 1,239,677 | 1,181,168 | |||||||||||||||||||||
| Allowance for loan losses |
(23,734 | ) | (29,030 | ) | (24,460 | ) | (29,030 | ) | (32,353 | ) | (38,538 | ) | (39,711 | ) | ||||||||||||||
| Loans held for sale |
322,249 | 328,300 | 273,196 | 194,745 | 61,062 | 88,125 | 51,946 | |||||||||||||||||||||
| Available-for-sale securities, fair value |
550,307 | 573,179 | 649,387 | 652,601 | 685,547 | 746,062 | 674,446 | |||||||||||||||||||||
| Foreclosed real estate, net |
9,902 | 6,199 | 11,641 | 7,259 | 8,796 | 10,772 | 25,955 | |||||||||||||||||||||
| Total assets |
2,917,958 | 2,532,836 | 2,899,420 | 2,428,189 | 2,258,387 | 2,232,440 | 2,095,109 | |||||||||||||||||||||
| Total deposits |
2,514,297 | 2,026,505 | 2,438,474 | 1,923,569 | 1,803,567 | 1,820,745 | 1,727,959 | |||||||||||||||||||||
| Core deposits(6) |
2,455,298 | 1,975,861 | 2,386,154 | 1,866,535 | 1,745,492 | 1,735,259 | 1,637,470 | |||||||||||||||||||||
| Borrowings |
55,785 | 135,988 | 74,616 | 143,850 | 137,861 | 170,351 | 111,185 | |||||||||||||||||||||
| Total shareholder’s equity(2) |
265,768 | 226,607 | 236,674 | 215,228 | 189,687 | 197,372 | 177,647 | |||||||||||||||||||||
|
|
||||||||||||||||||||||||||||
61
Table of Contents
Index to Financial Statements
| As of and for the
six June 30, (unaudited) |
As of and for year ended December 31, | |||||||||||||||||||||||||||
| (dollars in thousands, except per share data and ratio) | ||||||||||||||||||||||||||||
| 2016 | 2015 | 2015 | 2014 | 2013 | 2012 | 2011 | ||||||||||||||||||||||
| Selected Ratios |
||||||||||||||||||||||||||||
| Return on average: |
||||||||||||||||||||||||||||
| Assets(3) |
2.11% | 1.86% | 1.86% | 1.40% | 1.22% | 0.96% | 0.69% | |||||||||||||||||||||
| Shareholder’s equity(3) |
23.94% | 20.46% | 20.91% | 15.94% | 13.98% | 10.85% | 8.92% | |||||||||||||||||||||
| Average shareholder’s equity to average assets |
8.82% | 9.09% | 8.88% | 8.81% | 8.73% | 8.82% | 7.79% | |||||||||||||||||||||
| Net interest margin (tax-equivalent basis)(6) |
4.20% | 4.02% | 3.97% | 3.93% | 3.75% | 3.52% | 3.33% | |||||||||||||||||||||
| Efficiency ratio (tax-equivalent basis)(6) |
69.54% | 71.60% | 73.26% | 76.15% | 75.43% | 77.67% | 80.33% | |||||||||||||||||||||
| Loans held for investment to deposit ratio |
69.61% | 74.40% | 69.79% | 73.61% | 74.37% | 68.09% | 68.36% | |||||||||||||||||||||
| Yield on interest-earning assets |
4.55% | 4.41% | 4.34% | 4.37% | 4.31% | 4.56% | 4.79% | |||||||||||||||||||||
| Cost of interest-bearing liabilities |
0.47% | 0.51% | 0.49% | 0.56% | 0.70% | 1.28% | 1.56% | |||||||||||||||||||||
| Cost of total deposits |
0.28% | 0.32% | 0.30% | 0.36% | 0.48% | 0.78% | 1.00% | |||||||||||||||||||||
| Pro Forma Selected Ratios |
||||||||||||||||||||||||||||
| Pro forma return on average assets(3)(5) |
1.42% | 1.27% | 1.28% | 0.97% | 0.84% | 0.68% | 0.52% | |||||||||||||||||||||
| Pro forma return on average equity(3)(5) |
16.06% | 13.91% | 14.47% | 10.98% | 9.67% | 7.70% | 6.65% | |||||||||||||||||||||
| Credit Quality Ratios |
||||||||||||||||||||||||||||
| Allowance for loan losses to loans, net of unearned income(6)(7) |
1.41% | 1.93% | 1.50% | 2.05% | 2.41% | 3.11% | 3.36% | |||||||||||||||||||||
| Allowance for loan losses to nonperforming loans |
213.70% | 177.09% | 211.10% | 168.75% | 113.83% | 74.56% | 59.54% | |||||||||||||||||||||
| Nonperforming loans to loans, net of unearned income(6)(7) |
0.66% | 1.09% | 0.68% | 1.21% | 2.12% | 4.17% | 5.65% | |||||||||||||||||||||
| Capital Ratios (Company) |
` | |||||||||||||||||||||||||||
| Shareholder’s equity to assets |
9.11% | 8.95% | 8.16% | 8.86% | 8.40% | 8.84% | 8.48% | |||||||||||||||||||||
| Tier 1 capital (to average assets) |
7.98% | 8.35% | 7.64% | 8.10% | 7.97% | 7.31% | 8.71% | |||||||||||||||||||||
| Tier 1 capital (to risk-weighted assets(4) |
9.57% | 10.63% | 9.58% | 11.32% | 11.47% | 11.10% | 13.17% | |||||||||||||||||||||
| Total capital (to risk-weighted assets)(4) |
11.00% | 12.40% | 11.15% | 13.18% | 13.41% | 13.09% | 15.22% | |||||||||||||||||||||
| Tangible common equity to tangible assets(6) |
7.44% | 7.13% | 6.43% | 6.93% | 6.24% | 6.59% | 5.99% | |||||||||||||||||||||
| Common Equity Tier 1 (to risk-weighted assets) (CET1)(4) |
8.30% | 9.07% | 8.23% | N/A | N/A | N/A | N/A | |||||||||||||||||||||
| Capital Ratios (Bank) |
||||||||||||||||||||||||||||
| Shareholder’s equity to assets |
10.12% | 10.11% | 9.17% | 10.09% | 9.73% | 8.98% | 11.86% | |||||||||||||||||||||
| Tier 1 capital (to average assets) |
8.02% | 8.31% | 7.65% | 8.10% | 7.98% | 7.35% | 8.79% | |||||||||||||||||||||
| Tier 1 capital (to risk-weighted assets)(4) |
9.65% | 10.66% | 9.63% | 11.34% | 11.54% | 11.19% | 13.32% | |||||||||||||||||||||
| Total capital to (risk-weighted assets)(4) |
10.92% | 12.22% | 11.02% | 12.96% | 13.20% | 12.89% | 15.06% | |||||||||||||||||||||
| Tangible common equity to tangible assets(6) |
8.47% | 8.31% | 7.46% | 8.47% | 7.60% | 7.90% | 9.43% | |||||||||||||||||||||
| Common Equity Tier 1 (to risk-weighted assets) (CET1)(4) |
9.65% | 10.66% | 9.63% | N/A | N/A | N/A | N/A | |||||||||||||||||||||
|
|
||||||||||||||||||||||||||||
| (1) | Book value per share equals our total shareholder’s equity as of the date presented divided by the number of shares of our common stock outstanding as of the date presented. The number of shares of our common stock outstanding as of June 30, 2016 and 2015 and December 31, 2015, 2014, 2013, 2012 and 2011 was 17,180,000. |
| (2) | If we gave effect to our conversion from a subchapter S Corporation to a subchapter C Corporation in connection with this offering as of June 30, 2016, we would have recorded a deferred tax liability of approximately $15.1 million along with a corresponding $12.8 million decrease to shareholder’s equity. This pro forma adjustment is not reflected in the amounts presented above. |
| (3) | We have calculated our return on average assets and return on average equity for a period by dividing net income for that period by our average assets and average equity, as the case may be, for that period. We have calculated our pro forma return on average assets and pro forma return on average equity for a period by calculating our pro forma net income for that period as described in footnote 5 below and dividing that by our average assets and average equity, as the case be, for that period. We calculate our average assets and average equity for a period by dividing the sum of our total asset balance or total stockholder’s equity balance, as the case may be, as of the close of business on each day in the relevant period and dividing by the number of days in the period. |
| (4) | We calculate our risk-weighted assets using the standardized method of the Basel III Framework as of December 31, 2015 and June 30, 2016 and the Basel II Framework for all previous periods, as implemented by the Federal Reserve and the FDIC. |
| (5) | We have calculated our pro forma net income, pro forma net income per share, pro forma returns on average assets and pro forma return on average equity for each period shown by calculating a pro forma provision for federal income tax using a combined effective income tax rate of 37.39% and 36.72% for the six months ended June 30, 2016 and 2015 and 35.08%, 35.63%,35.37%, 33.76% and 30.35% for the years ended December 31, 2015, 2014, 2013, 2012 and 2011, respectively, and adjusting our historical net income for each period to give effect to the pro forma provision for U.S. federal income tax for such period. |
62
Table of Contents
Index to Financial Statements
| (6) | These measures are not measures recognized under generally accepted accounting principles (United States) (“GAAP”), and are therefore considered to be non-GAAP financial measures. See “GAAP reconciliation and management explanation of non-GAAP financial measures” for a reconciliation of these measures to their most comparable GAAP measures. |
| (7) | Excludes loans acquired from Northwest Georgia Bank. |
GAAP reconciliation and management explanation of non-GAAP financial measures
We identify certain of the financial measures discussed in our selected historical consolidated financial data as being “non-GAAP financial measures.” In accordance with the SEC’s rules, we classify a financial measure as being a non-GAAP financial measure if that financial measure excludes or includes amounts, or is subject to adjustments that have the effect of excluding or including amounts, that are included or excluded, as the case may be, in the most directly comparable measure calculated and presented in accordance with generally accepted accounting principles as in effect from time to time in the United States in our statements of income, balance sheets or statements of cash flows.
Net interest income (tax-equivalent basis), net interest margin (tax-equivalent basis) and efficiency ratios (tax-equivalent basis) include the effects of taxable-equivalent adjustments using a combined federal and state income tax rate of 39.225% to increase tax-exempt interest income to a tax-equivalent basis.
The non-GAAP financial measures that we discuss in our selected historical consolidated financial data should not be considered in isolation or as a substitute for the most directly comparable or other financial measures calculated in accordance with GAAP. Moreover, the manner in which we calculate the non-GAAP financial measures that we discuss in our selected historical consolidated financial data may differ from that of other companies reporting measures with similar names. You should understand how such other banking organizations calculate their financial measures similar or with names similar to the non-GAAP financial measures we have discussed in our selected historical consolidated financial data when comparing such non-GAAP financial measures. The following reconciliation tables provide a more detailed analysis of these non-GAAP financial measures
Tax-equivalent net interest income and net interest margin
Net Interest Income on a tax-equivalent basis is a non-GAAP measure that adjusts for the tax-favored status of net interest income from loans and investments using a combined federal and state income tax rate of 39.225% to increase tax-exempt interest income to a tax-equivalent basis. We believe this measure to be the preferred industry measurement of net interest income and it enhances comparability of net interest income arising from taxable and tax-exempt sources. The most directly comparable financial measure calculated in accordance with GAAP is our net interest income.
Net interest margin on a tax-equivalent basis is net interest income on a tax-equivalent basis divided by average interest-earning assets on a tax-equivalent basis. The most directly comparable financial measure calculated in accordance with GAAP is our net interest margin.
63
Table of Contents
Index to Financial Statements
The following table presents, as of the dates set forth below, net interest income on a tax-equivalent basis compared with net interest income and presents net interest margin on a tax-equivalent basis compared with net interest margin:
| Six months June 30, |
Six months June 30, |
Year ended December 31, | ||||||||||||||||||||||||||
| (dollars in thousands) | (unaudited) | (unaudited) | 2015 | 2014 | 2013 | 2012 | 2011 | |||||||||||||||||||||
| Net interest income (tax-equivalent basis) |
||||||||||||||||||||||||||||
| Net Interest Income |
$ | 54,301 | $ | 44,441 | $ | 93,872 | $ | 83,376 | $ | 75,476 | $ | 68,329 | $ | 61,706 | ||||||||||||||
| Adjustments: |
||||||||||||||||||||||||||||
| Tax-equivalent adjustment |
1,111 | 1,031 | 2,015 | 2,111 | 2,164 | 2,273 | 2,229 | |||||||||||||||||||||
|
|
|
|||||||||||||||||||||||||||
| Net interest income (tax- equivalent basis) |
$ | 55,412 | $ | 45,472 | $ | 95,887 | $ | 85,487 | $ | 77,640 | $ | 70,602 | $ | 63,935 | ||||||||||||||
|
|
|
|||||||||||||||||||||||||||
| Net interest margin (tax-equivalent basis) |
||||||||||||||||||||||||||||
| Net Interest Margin |
4.11% | 3.93% | 3.89% | 3.83% | 3.65% | 3.41% | 3.21% | |||||||||||||||||||||
| Adjustments: |
||||||||||||||||||||||||||||
| Tax-equivalent adjustment |
0.08% | 0.09% | 0.08% | 0.10% | 0.10% | 0.11% | 0.12% | |||||||||||||||||||||
|
|
|
|||||||||||||||||||||||||||
| Net interest margin (tax- equivalent basis) |
4.20% | 4.02% | 3.97% | 3.93% | 3.75% | 3.52% | 3.33% | |||||||||||||||||||||
|
|
||||||||||||||||||||||||||||
Tax-equivalent efficiency ratio
The efficiency ratio on a tax-equivalent basis is a non-GAAP measure that provides a measure of productivity in the banking industry. This ratio is calculated to measure the cost of generating one dollar of revenue. That is, the ratio is designed to reflect the percentage of one dollar which must be expended to generate that dollar of revenue. We calculate this ratio by dividing noninterest expense by the sum of net interest income on a tax-equivalent basis and noninterest income using a combined federal and state income tax rate of 39.225% to increase tax-exempt interest income to a tax-equivalent basis, excluding gains (losses) on sales of investment securities.
64
Table of Contents
Index to Financial Statements
The following table presents, as of the dates set forth below, the calculation of our efficiency ratio on a tax-equivalent basis.
| Six months June 30, |
Six months June 30, |
Year ended December 31, | ||||||||||||||||||||||||||
| (dollars in thousands, except per Share data) | (unaudited) | (unaudited) | 2015 | 2014 | 2013 | 2012 | 2011 | |||||||||||||||||||||
| Efficiency ratio (tax-equivalent basis) |
||||||||||||||||||||||||||||
| Total noninterest expense |
$ | 91,942 | $ | 61,033 | $ | 138,492 | $ | 102,163 | $ | 89,584 | $ | 83,874 | $ | 70,854 | ||||||||||||||
| Less merger and conversion expenses |
2,146 | 287 | 3,543 | — | — | — | — | |||||||||||||||||||||
| Less loss on sales or write-downs of other real estate |
— | — | — | — | — | 2,339 | 1,996 | |||||||||||||||||||||
| Less temporary impairment of mortgage servicing rights |
5,687 | — | 194 | — | — | — | — | |||||||||||||||||||||
|
|
|
|||||||||||||||||||||||||||
| Adjusted noninterest expense |
84,109 | 60,746 | 134,755 | 102,163 | 89,584 | 81,535 | 68,858 | |||||||||||||||||||||
| Net interest income (tax-equivalent basis) |
55,412 | 45,472 | 95,887 | 85,487 | 77,640 | 70,602 | 63,935 | |||||||||||||||||||||
| Total noninterest income |
69,391 | 41,223 | 92,380 | 50,802 | 41,386 | 38,047 | 27,847 | |||||||||||||||||||||
| Less bargain purchase gain |
— | — | 2,794 | — | — | — | — | |||||||||||||||||||||
| Less gain on sales or write-downs of other real estate |
(142 | ) | 62 | (317 | ) | 132 | 225 | — | — | |||||||||||||||||||
| Less gain on sales of securities |
3,991 | 1,795 | 1,844 | 2,000 | 34 | 3,670 | 6,060 | |||||||||||||||||||||
|
|
|
|||||||||||||||||||||||||||
| Adjusted noninterest income |
65,542 | 39,366 | 88,059 | 48,670 | 41,127 | 34,377 | 21,787 | |||||||||||||||||||||
|
|
|
|||||||||||||||||||||||||||
| Adjusted operating revenue |
120,954 | 84,838 | 183,946 | 134,157 | 118,767 | 104,979 | 85,722 | |||||||||||||||||||||
|
|
||||||||||||||||||||||||||||
| Efficiency ratio (tax-equivalent basis) |
69.54% | 71.60% | 73.26% | 76.15% | 75.43% | 77.67% | 80.33% | |||||||||||||||||||||
|
|
||||||||||||||||||||||||||||
Tangible book value per common share and tangible common equity to tangible assets
Tangible book value per common share and tangible common equity to tangible assets are non-GAAP measures generally used by investors to evaluate capital adequacy. We calculate: (i) tangible common equity as total shareholder’s equity less goodwill and other intangible assets; (ii) tangible assets as total assets less goodwill and other intangible assets, (iii) tangible book value per common share as tangible common equity (as described in clause (i)) divided by shares of common stock outstanding and (iv) tangible common equity to tangible assets is the ratio of tangible common equity (as described in clause (i)) to tangible assets (as described in clause (ii)). For tangible book value per common share, the most directly comparable financial measure calculated in accordance with GAAP is our book value per common share and for tangible common equity to tangible assets, the most directly comparable financial measure calculated in accordance with GAAP is our total shareholder’s equity to total assets.
We believe that these non-GAAP financial measures are important information to be provided to you because, as do our management, banking regulators, many investors, you can use the tangible book value in conjunction with more traditional bank capital ratios to assess our capital adequacy without the effect of our goodwill and other intangible assets and compare our capital adequacy with the capital adequacy of other banking organizations with significant amounts of goodwill and/or other intangible assets, which typically stem from the use of the purchase accounting method of accounting for mergers and acquisitions.
65
Table of Contents
Index to Financial Statements
The following table presents, as of the dates set forth below, tangible common equity compared with total shareholder’s equity, tangible book value per common share compared with our book value per common share and common equity to tangible assets compared to total shareholder’s equity to total assets:
| As of June 30, 2016 |
As of June 30, 2015 |
As of December 31, | ||||||||||||||||||||||||||
| (dollars in thousands, except per share data) |
(unaudited) | (unaudited) | 2015 | 2014 | 2013 | 2012 | 2011 | |||||||||||||||||||||
| Tangible Assets |
||||||||||||||||||||||||||||
| Total assets |
$ | 2,917,958 | $ | 2,532,836 | $ | 2,899,420 | $ | 2,428,189 | $ | 2,258,387 | $ | 2,232,440 | $ | 2,095,109 | ||||||||||||||
| Adjustments: |
||||||||||||||||||||||||||||
| Goodwill |
(46,867 | ) | (46,904 | ) | (46,904 | ) | (46,904 | ) | (46,904 | ) | (46,904 | ) | (46,804 | ) | ||||||||||||||
| Core deposit intangibles |
(5,616 | ) | (2,689 | ) | (6,695 | ) | (3,495 | ) | (5,108 | ) | (6,834 | ) | (8,702 | ) | ||||||||||||||
|
|
|
|||||||||||||||||||||||||||
| Tangible assets |
$ | 2,865,475 | $ | 2,483,243 | $ | 2,845,821 | $ | 2,377,790 | $ | 2,206,375 | $ | 2,178,702 | $ | 2,039,603 | ||||||||||||||
|
|
|
|||||||||||||||||||||||||||
| Tangible Common Equity |
||||||||||||||||||||||||||||
| Total shareholder’s equity |
$ | 265,768 | $ | 226,607 | $ | 236,674 | $ | 215,228 | $ | 189,687 | $ | 197,372 | $ | 177,647 | ||||||||||||||
| Adjustments: |
||||||||||||||||||||||||||||
| Goodwill |
(46,867 | ) | (46,904 | ) | (46,904 | ) | (46,904 | ) | (46,904 | ) | (46,904 | ) | (46,804 | ) | ||||||||||||||
| Core deposit intangibles |
(5,616 | ) | (2,689 | ) | (6,695 | ) | (3,495 | ) | (5,108 | ) | (6,834 | ) | (8,702 | ) | ||||||||||||||
|
|
|
|||||||||||||||||||||||||||
| Tangible common equity |
$ | 213,285 | $ | 177,014 | $ | 183,075 | $ | 164,829 | $ | 137,675 | $ | 143,634 | $ | 122,141 | ||||||||||||||
|
|
|
|||||||||||||||||||||||||||
| Common shares outstanding |
17,180,000 | 17,180,000 | 17,180,000 | 17,180,000 | 17,180,000 | 17,180,000 | 17,180,000 | |||||||||||||||||||||
| Book value per common share |
$ | 15.47 | $ | 13.19 | $ | 13.78 | $ | 12.53 | $ | 11.04 | $ | 11.49 | $ | 10.34 | ||||||||||||||
| Tangible book value per common share |
12.41 | 10.30 | 10.66 | 9.59 | 8.01 | 8.36 | 7.11 | |||||||||||||||||||||
| Total shareholder’s equity to total assets |
9.11% | 8.95% | 8.16% | 8.86% | 8.40% | 8.84% | 8.48% | |||||||||||||||||||||
| Tangible common equity to tangible assets |
7.44% | 7.13% | 6.43% | 6.93% | 6.24% | 6.59% | 5.99% | |||||||||||||||||||||
|
|
||||||||||||||||||||||||||||
Core deposits
Core deposits are a non-GAAP measure used by management and investors to evaluate organic growth of deposits and the quality of deposits as a funding source. We calculate e core deposits by excluding jumbo time deposits (greater than $250,000) from total deposits. For core deposits the most directly comparable financial measure calculated in accordance with GAAP is total deposits.
The following table presents, as of the dates set forth below, core deposits compared total deposits:
| As of June 30, |
As of June 30, |
As of December 31, | ||||||||||||||||||||||||||
| (dollars in thousands) | (unaudited) | (unaudited) | 2015 | 2014 | 2013 | 2012 | 2011 | |||||||||||||||||||||
| Core deposits |
||||||||||||||||||||||||||||
| Total deposits |
$ | 2,514,297 | $ | 2,026,505 | $ | 2,438,474 | $ | 1,923,569 | $ | 1,803,567 | $ | 1,820,745 | $ | 1,727,959 | ||||||||||||||
| Less jumbo time deposits |
58,999 | 50,644 | 52,320 | 57,034 | 58,075 | 85,486 | 90,489 | |||||||||||||||||||||
|
|
|
|||||||||||||||||||||||||||
| Core deposits |
$ | 2,455,298 | $ | 1,975,861 | $ | 2,386,154 | $ | 1,866,535 | $ | 1,745,492 | $ | 1,735,259 | 1,637,470 | |||||||||||||||
|
|
||||||||||||||||||||||||||||
Allowance for loan losses to loans, net of unearned income and adjusted nonperforming loans to loans, net of unearned income
Adjusted allowance for loan losses to loans, net of unearned income, and adjusted nonperforming loans to loans, net of unearned income, are financial measures used to determine the credit quality of our loan portfolio. Due to the difference of accounting for and disclosing acquired loans, we believe that excluding the acquired loans from our credit quality measures provides a more meaningful representation of our credit quality. For allowance for loan losses to loans, net of unearned income and nonperforming loans to loans, net of unearned income, the most directly comparable financial measure calculated in accordance with GAAP is the allowance for loan losses and nonperforming loans, respectively.
66
Table of Contents
Index to Financial Statements
The following table presents, as of the dates set forth below, adjusted allowance for loan losses to loans, net of unearned income, and adjusted nonperforming loans to loans, net of unearned income:
| As of June 30, |
As of June 30, |
As of December 31, | ||||||||||||||||||||||||||
| (dollars in thousands) | (unaudited) | (unaudited) | 2015 | 2014 | 2013 | 2012 | 2011 | |||||||||||||||||||||
| Allowance for loan losses |
$ | 23,734 | $ | 29,030 | $ | 24,460 | $ | 29,030 | $ | 32,353 | $ | 38,538 | $ | 39,711 | ||||||||||||||
| Loans, net of unearned income |
1,750,304 | 1,507,632 | $ | 1,701,863 | $ | 1,415,896 | $ | 1,341,347 | $ | 1,239,677 | $ | 1,181,168 | ||||||||||||||||
|
|
|
|||||||||||||||||||||||||||
| Adjustments: |
||||||||||||||||||||||||||||
| Less acquired loans, net of unearned income |
62,173 | — | 76,601 | — | — | — | — | |||||||||||||||||||||
|
|
|
|||||||||||||||||||||||||||
| Total loans, net of unearned income |
$ | 1,688,131 | $ | 1,507,632 | $ | 1,625,262 | $ | 1,415,896 | $ | 1,341,347 | $ | 1,239,677 | $ | 1,181,168 | ||||||||||||||
|
|
|
|||||||||||||||||||||||||||
| Allowance for loan losses to loans, net of unearned income |
1.36% | 1.93% | 1.44% | 2.05% | 2.41% | 3.11% | 3.36% | |||||||||||||||||||||
|
|
|
|||||||||||||||||||||||||||
| Adjustment: |
||||||||||||||||||||||||||||
| Acquired loans, net of unearned income |
0.05% | 0.00% | 0.06% | 0.00% | 0.00% | 0.00% | 0.00% | |||||||||||||||||||||
|
|
|
|||||||||||||||||||||||||||
| Adjusted allowance for loan losses to loans, net of unearned income |
1.41% | 1.93% | 1.50% | 2.05% | 2.41% | 3.11% | 3.36% | |||||||||||||||||||||
|
|
||||||||||||||||||||||||||||
| Nonperforming loans |
$ | 11,106 | $ | 16,393 | $ | 11,587 | $ | 17,203 | $ | 28,422 | $ | 51,685 | $ | 66,697 | ||||||||||||||
| Loans, net of unearned income |
1,750,304 | 1,507,632 | 1,701,863 | 1,415,896 | 1,341,347 | 1,239,677 | 1,181,168 | |||||||||||||||||||||
|
|
|
|||||||||||||||||||||||||||
| Adjustments: |
||||||||||||||||||||||||||||
| Less acquired loans, net of unearned income |
62,173 | — | 76,601 | — | — | — | — | |||||||||||||||||||||
|
|
|
|||||||||||||||||||||||||||
| Total loans, net of unearned income |
$ | 1,688,131 | $ | 1,507,632 | $ | 1,625,262 | $ | 1,415,896 | $ | 1,341,347 | $ | 1,239,677 | $ | 1,181,168 | ||||||||||||||
|
|
|
|||||||||||||||||||||||||||
| Nonperforming loans to loans, net of unearned income |
0.63% | 1.09% | 0.68% | 1.21% | 2.12% | 4.17% | 5.65% | |||||||||||||||||||||
|
|
|
|||||||||||||||||||||||||||
| Adjustment: |
||||||||||||||||||||||||||||
| Acquired loans, net of unearned income |
0.03% | 0.00% | 0.03% | 0.00% | 0.00% | 0.00% | 0.00% | |||||||||||||||||||||
|
|
|
|||||||||||||||||||||||||||
| Adjusted nonperforming loans to loans, net of unearned income |
0.66% | 1.09% | 0.71% | 1.21% | 2.12% | 4.17% | 5.65% | |||||||||||||||||||||
|
|
||||||||||||||||||||||||||||
67
Table of Contents
Index to Financial Statements
Overview
We are a bank holding company, headquartered in Nashville, Tennessee. Our wholly-owned bank subsidiary, FirstBank, is the third largest Tennessee-headquartered bank, based on total assets. FirstBank provides a comprehensive suite of commercial and consumer banking services to clients in select markets in Tennessee, North Alabama and North Georgia. Our footprint includes 45 full-service bank branches serving the metropolitan markets of Nashville, Chattanooga, Knoxville, Memphis, Jackson and Huntsville (AL) in addition to 12 community markets. FirstBank also provides mortgage banking services utilizing its bank branch network and mortgage banking offices strategically located throughout the southeastern United States in addition to national internet delivery channel. As of June 30, 2016, we had total assets of $2.9 billion, loans of $1.8 billion, total deposits of $2.5 billion, and total shareholder’s equity of $266 million.
Throughout our history, we have steadfastly maintained a community banking approach of personalized relationship-based service. As we have grown, maintaining this relationship-based approach utilizing local, talented and experienced bankers in each market has been an integral component of our success. Our bankers leverage their local knowledge and relationships to deliver timely solutions to our clients. We empower these bankers by giving them local decision making authority supplemented by appropriate risk oversight. In our experience, business owners and operators prefer to deal with decision makers and our banking model is built to place the decision maker as close to the client as possible. We have designed our operations, technology, and centralized risk oversight processes to specifically support our operating model. We deploy this operating model universally in each of our markets, regardless of size. We believe we have a competitive advantage in our markets versus both smaller community banks and larger regional and national banks. Our robust offering of products, services and capabilities differentiate us from community banks and our significant local market knowledge, client service level and the speed with which we are able to make decisions and deliver our services to customers differentiate us from larger regional and national banks.
We seek to leverage our operating model by focusing on profitable growth opportunities across our footprint, consisting of both high-growth metropolitan markets and more stable community markets. As a result, we are able to strategically deploy our capital across our markets to take advantage of the opportunities with the greatest certainty of profitable growth and the highest returns.
Our operating model is executed by a talented management team lead by our Chief Executive Officer, Chris Holmes. Mr. Holmes, a 24-year banking veteran originally from Lexington, Tennessee, joined the Bank in 2010 as Chief Banking Officer and was named Chief Executive Officer in 2013. Mr. Holmes has an extensive background in both metropolitan and community banking gained from his time at community banks and larger public financial institutions. Mr. Holmes has assembled a highly effective management team, blending members that have a long history with FirstBank and members that have significant banking experience at other in-market banks. This leadership team offers us a fresh perspective and implemented a new strategic plan in 2012 that called for significant incremental investments in the Nashville, Tennessee market. Our execution of the plan has driven balanced, profitable growth by increasing our presence in the high-growth Nashville market while maintaining our strong presence in community markets and providing a replicable model for future metropolitan growth.
68
Table of Contents
Index to Financial Statements
Our team has delivered strong financial results under our strategic plan, as evidenced by consistent improvement in our tax-adjusted return on average assets, net interest margin, core and noninterest bearing deposit balances, and loan balances. We believe that these strong results validate our operating model and strategies and position us for continued profitable growth and improved efficiencies.
| Tax-adjusted ROAA (%) | Net interest margin (%) | |
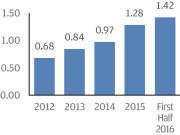
|
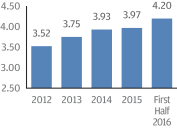
| |
| Deposits ($ in millions) | Total loans ($ in millions) | |
|
|
| |
Note: Our tax-adjusted return on average total assets includes a pro forma provision for taxes using an effective income tax rate of 33.76%, 35.37%, 35.63%, 35.08% and 37.39% for the years ended December 31, 2012, 2013, 2014 and 2015 and the six months ended June 30, 2016, respectively. Our net interest margin is shown on a tax-equivalent basis. Core deposits and net interest margin on a tax-equivalent basis are non-GAAP financial measures. See our reconciliation of non-GAAP financial measures to their most directly comparable GAAP financial measures under the caption “Selected historical consolidated financial data: GAAP reconciliation and management explanation of non-GAAP financial measures.
Our history
Originally chartered in 1906, we are one of the longest continually operating banks in Tennessee. While our deep community roots go back over 100 years, our growth trajectory changed in 1984 when Tennessee businessman Jim Ayers, our Chairman and sole shareholder, acquired Farmers State Bank with an associate. In 1988, we purchased the assets of First National Bank of Lexington, Tennessee and changed our name to FirstBank, forming the foundation of our current franchise. In 1990, Mr. Ayers became the sole shareholder and has remained our sole owner since that time. Under Mr. Ayers’ ownership, we have grown from a community bank with only $14 million in assets in 1984 to the third largest bank headquartered in Tennessee, based on total assets.
From 1984 to 2001, we operated as a rural community bank growing organically and through small acquisitions in community markets in West Tennessee. In 2001, our strategy evolved from serving purely community markets to include a modest presence in metropolitan markets, expanding our reach and enhancing our growth. We entered Nashville and Memphis in 2001 by opening a branch in each of those markets. In 2004 and
69
Table of Contents
Index to Financial Statements
2008, we opened our first branches in Knoxville and Chattanooga, respectively. Although we experienced some growth in each metropolitan market, it did not become a major strategic focus until we implemented our current metropolitan growth strategy in the Nashville metropolitan statistical area (MSA) in 2012. The successful implementation of this strategy has resulted in 73% deposit growth in the Nashville MSA from December 31, 2012 to June 30, 2016, making it our largest market with 31% of our total deposits, as of June 30, 2016. As a result of this evolution, we now operate a more balanced business model that serves a diverse customer base in both metropolitan and community markets.
On September 18, 2015, we completed our acquisition of Northwest Georgia Bank, a 110-year old institution with six branches, serving clients in the Chattanooga MSA. Including the effects of purchase accounting adjustments, we acquired net assets with a fair value of $272 million which includes a bargain purchase gain of $3 million, loans with a fair value of $79 million and deposits with a fair value of $246 million. We believe that this acquisition will accelerate our already planned expansion in Chattanooga by significantly augmenting our client base, increasing our brand awareness and providing us with the scale to attract leading bankers to further accelerate our market penetration and profitable growth. In connection with the acquisition, we merged two of our existing FirstBank branches in May 2016.
Our markets
Our market area is the southeastern United States, centered around Tennessee and includes portions of North Alabama and North Georgia. The market area has attractive economic, population, and household income growth statistics that provide a favorable business environment. We believe that the strong economic growth in our market area has created a favorable operating environment for us.
70
Table of Contents
Index to Financial Statements
Our core client profile across our footprint includes small businesses, corporate clients, commercial real estate owners and consumers. We target business clients with substantial operating history that have annual revenues of up to $250 million. Our typical business client would keep business deposit accounts with us, and we would look to provide banking services to the owners and employees of the business as well. We also have an active consumer lending business that includes mortgages, home equity lines and small consumer finance loans. We continuously strive to build deeper relationships by actively cross-selling incremental products to meet the banking needs of our clients. The long-standing relationships that we have developed throughout our history form the foundation of our attractive returns and stable growth.
Tennessee has no individual income tax and it has a favorable business climate, as evidenced by the following:
| • | Tennessee was ranked #4 in the country for business by Chief Executive magazine in May 2015; |
| • | Tennessee was named 2014 State of the Year for economic development by Business Facilities magazine in January 2015; |
| • | Tennessee was ranked #1 for foreign direct investment job commitments in 2013 according to the 2014 Global Location Trends report by IBM Institute for Business Value; and |
| • | Tennessee was ranked #5 in the country for doing business by Area Development magazine in September 2014. |
The following tables show our deposit market share ranking among all banks and community banks (which we define as banks with less than $15 billion in assets) in Tennessee as of June 30, 2015. Of the 10 largest banks in the state based on total deposits, 7 are national or regional banks, which we believe provides us with significant opportunities to gain market share from these banks.
Top 10 Banks in Tennessee:
| Rank | Company name | Headquarters | Branches (#) |
Total deposits ($bn) |
Deposit market share (%) |
% of company deposits |
||||||||||||||||||
| 1 |
First Horizon National Corp. (TN) | Memphis, TN | 153 | 17.8 | 13.8 | 94.8 | ||||||||||||||||||
| 2 |
Regions Financial Corp. (AL) | Birmingham, AL | 237 | 17.5 | 13.6 | 18.3 | ||||||||||||||||||
| 3 |
SunTrust Banks Inc. (GA) | Atlanta, GA | 139 | 12.2 | 9.5 | 8.6 | ||||||||||||||||||
| 4 |
Bank of America Corp. (NC) | Charlotte, NC | 58 | 10.5 | 8.2 | 0.9 | ||||||||||||||||||
| 5 |
Pinnacle Financial Partners (TN) | Nashville, TN | 48 | 6.9 | 5.3 | 100.0 | ||||||||||||||||||
| 6 |
U.S. Bancorp (MN) | Minneapolis, MN | 104 | 2.7 | 2.1 | 1.0 | ||||||||||||||||||
| 7 |
BB&T Corp. (NC) | Winston-Salem, NC | 49 | 2.5 | 1.9 | 1.5 | ||||||||||||||||||
| 8 |
FB Financial Corp (TN) | Nashville, TN | 45 | 2.0 | 1.6 | 91.2 | ||||||||||||||||||
| 9 |
Simmons First National Corp. (AR) | Pine Bluff, AR | 40 | 2.0 | 1.5 | 30.1 | ||||||||||||||||||
| 10 |
Wells Fargo & Co. (CA) | San Francisco, CA | 19 | 1.7 | 1.4 | 0.2 | ||||||||||||||||||
|
|
||||||||||||||||||||||||
71
Table of Contents
Index to Financial Statements
Top 10 banks under $15bn assets in Tennessee
| Rank | Company name | Headquarters | Branches (#) |
Total deposits ($bn) |
Deposit market share (%) |
% of company deposits |
||||||||||||||
| 1 |
Pinnacle Financial Partners (TN) | Nashville, TN | 48 | 6.9 | 5.3 | 100.0 | ||||||||||||||
| 2 |
FB Financial Corp (TN) | Nashville, TN | 45 | 2.0 | 1.6 | 91.2 | ||||||||||||||
| 3 |
Simmons First National Corp. (AR) | Pine Bluff, AR | 40 | 2.0 | 1.5 | 30.1 | ||||||||||||||
| 4 |
Wilson Bank Holding Co. (TN) | Lebanon, TN | 25 | 1.7 | 1.3 | 100.0 | ||||||||||||||
| 5 |
Home Federal Bank of Tennessee (TN) | Knoxville, TN | 23 | 1.7 | 1.3 | 100.0 | ||||||||||||||
| 6 |
Franklin Financial Network Inc (TN) | Franklin, TN | 14 | 1.6 | 1.2 | 100.0 | ||||||||||||||
| 7 |
Capital Bank Finl Corp (NC) | Charlotte, NC | 57 | 1.4 | 1.1 | 19.7 | ||||||||||||||
| 8 |
First Citizens Bancshares Inc. (TN) | Dyersburg, TN | 23 | 1.3 | 1.0 | 100.0 | ||||||||||||||
| 9 |
First Farmers Merchants Corp. (TN) | Columbia, TN | 19 | 1.1 | 0.8 | 100.0 | ||||||||||||||
| 10 |
Clayton Bank and Trust (TN) | Knoxville, TN | 29 | 1.0 | 0.8 | 100.0 | ||||||||||||||
|
|
||||||||||||||||||||
Note: Market data sourced from SNL Financial and gives pro forma effect to any acquisitions announced as of August 26, 2016 as if they occurred on June 30, 2015; total assets as of June 30, 2016.
Our six metropolitan markets.
We currently operate in the six metropolitan markets listed below.
Nashville is the largest MSA in Tennessee, our largest market and one of the fastest growing cities in the U.S., with a booming cultural scene, vibrant healthcare industry, established music and entertainment industry, and 24 universities and colleges. Nashville has experienced 37% population growth from 2000 to 2014, and its population is expected to double in the next 20 years. Between 2010 and 2014, Nashville’s job growth of 18.4% was 10 percentage points higher than that of the U.S. Nashville’s diverse economy and strong business community are major attractions for corporations and professionals. Nashville was ranked #2 in KPMG’s April 2014 listing of the Most Attractive Mid-Sized Cities for Business and #5 on Forbes’ May 2014 listing of the Best Big Cities for Jobs. We believe that these positive trends will continue, providing us with ample opportunity for future growth in the Nashville MSA.
Memphis is the 2nd largest MSA in Tennessee. It has a diversified business base and the busiest cargo airport in North America. Memphis is headquarters to 240 companies, including AutoZone, International Paper and FedEx, which alone employs over 32,000 people in Memphis. Memphis benefits from 10 million tourists visiting annually, which generated approximately $3 billion for the local economy during 2014. Memphis was recently named a Top 25 Best City for Jobs by Glassdoor, a leading online employee community. A recent report from the Federal Reserve predicted that the Memphis region could add as many as 10,000 new jobs during 2015.
Knoxville is the 3rd largest MSA in Tennessee. It has 120 automotive component manufacturers in the area, which provide approximately 13,000 jobs. The University of Tennessee is located in Knoxville, generating over $1.5 billion in income annually and supporting in excess of 30,000 jobs during 2014. The tourism industry is beginning to grow and Knoxville is taking its place alongside Chattanooga and Asheville, N.C. as a destination city in the Southern Appalachian Mountains. Knoxville is ranked by Forbes as the second most affordable city and is currently experiencing accelerated employment growth.
Chattanooga is the 4th largest MSA in Tennessee. It has a diverse economy with over 28,000 businesses that employ over 260,000 people and generate an estimated $41 billion in annual sales. Chattanooga has experienced population growth of 11% between 2000 and 2010 and is expected to experience 19% population growth by 2019. Chattanooga was recently ranked #4 on Wallethub’s Best Cities to Start a Business list and was named a Best to Invest city by Site Selection magazine.
72
Table of Contents
Index to Financial Statements
Jackson is the 6th largest MSA in Tennessee and is the 2nd largest city in West Tennessee following Memphis. Given a high-quality workforce, favorable tax environment and efficient logistical foundation, Jackson has developed into a leading industrial and distribution center in the state of Tennessee, with particular strength in manufacturing. Employers such as Berry Plastics, Delta Faucets, Gerdau, Kellogg’s, LyondellBassell Industries, Owens Corning and Stanley Black & Decker have established meaningful operations in the Jackson area. Further aiding the bright economic future of the region is a diverse complex of six accredited higher educational institutions and two state-of-the-art technical and professional training vocational schools. Jackson also enjoys a vibrant cultural community, with symphony concerts, blues fests, and community theater, as well as minor league professional baseball and a host of collegiate and local athletic organizations.
Huntsville has one of the strongest technology economies in the nation, with over 300 companies performing sophisticated government, commercial and university research. Huntsville has a high concentration of engineers and Ph.D.‘s and has a number of major government programs, including NASA and the U.S. Army, including the Redstone Arsenal, which contains a government and contractor work force that employs approximately 40,000. Huntsville also has one of the highest concentrations of Inc. 500 companies and a number of offices of Fortune 500 companies.
Our community markets.
We are a leading bank in Tennessee’s community markets. These community markets continue to offer us opportunities to profitably grow our market share. The table below shows our presence, as of June 30, 2015 in community markets where we have over $60 million in deposits.
Top FirstBank community markets
| Market |
FB market rank |
FB branches (#) |
FB deposits ($mm) |
FB deposit market share |
Percent of total FB deposits |
|||||||||||||||
| Lexington |
1 | 3 | 305 | 54.3% | 13.3% | |||||||||||||||
| Huntingdon |
2 | 2 | 119 | 23.8% | 5.2% | |||||||||||||||
| Smithville |
2 | 1 | 99 | 26.3% | 4.3% | |||||||||||||||
| Camden |
2 | 2 | 97 | 26.1% | 4.2% | |||||||||||||||
| Paris |
3 | 2 | 96 | 17.8% | 4.2% | |||||||||||||||
| Waverly |
2 | 1 | 63 | 24.2% | 2.7% | |||||||||||||||
|
|
||||||||||||||||||||
Note: Market data sourced from SNL Financial and gives pro forma effect to any acquisitions announced as of July 22, 2016 as if they occurred on June 30, 2015.
Market characteristics and mix.
Metropolitan markets. Our metropolitan markets are characterized by attractive demographics and strong economies and offer substantial opportunity for future growth. Our metropolitan markets collectively have approximately $108 billion of total deposits and a total population in excess of 5.2 million people, with a projected weighted average annual population growth rate of 4.9% through 2020 according to SNL Financial, as compared to a national average of 3.7%. We compete in these markets with national and regional banks that currently have the largest market share positions and with community banks primarily focused only on a particular geographic area or business niche. We believe we are well positioned to grow our market penetration among our target clients of small to medium sized businesses and the consumer base working and living in these metropolitan markets. In our experience, such clients demand the product sophistication of a larger bank, but prefer the customer service, relationship focus and local connectivity of a community bank. We believe that our size, product suite and operating model offer us a competitive advantage in these markets versus our
73
Table of Contents
Index to Financial Statements
smaller competitors, many of which are focused only on specific counties or industries. Our operating model driven by local talent with strong community ties and local authority serves as a key competitive advantage over our larger competitors. We believe that, as a result, we are well positioned to leverage our existing franchise to expand our market share in our metropolitan markets.
Community markets. Our community markets tend to be more stable throughout various economic cycles, with primarily retail and small business customer opportunities and more limited competition. This leads to an attractive profitability profile and smaller ticket, more granular loan and deposit portfolios. We increased our deposits in our community markets by 10% from 2010 to 2015. Our community markets are standalone markets and not suburbs of larger markets. We primarily compete in these markets with community banks that have less than $1 billion in total assets. We compete effectively against these smaller community banks by providing a broader and more sophisticated set of products and capabilities while still maintaining our local service model. These markets are being deemphasized by national and regional banks. As a result, we are often the employer of choice for talented bankers in these communities. We believe that our operating model and long-term success in these markets positions us well for continued growth in our existing community markets and to take advantage of attractive opportunities in other community markets.
Market mix. The charts below show our branch, loan and deposit mix between our metropolitan and community markets as of June 30, 2016.
| Branches: | Loans Held for Investment: | Total deposits: | ||
|
|
|
| ||
Our competitive strengths
We believe the following strengths provide us with competitive advantages over other banks in our markets and provide us with the necessary foundation to successfully execute our growth strategies.
Depth and experience of senior management team. We have a deep and experienced senior management team. The team, as evidenced by the leaders of our banking markets and mortgage segment highlighted below, combines long histories at FirstBank with significant market and industry knowledge gained from employment with other successful banks.
Christopher Holmes: President and Chief Executive Officer. Mr. Holmes has served as President of FirstBank since 2012 and as President and Chief Executive Officer since 2013. Originally from Lexington, Tennessee, Mr. Holmes has a background in both rural communities and urban metro centers that is uniquely suited for leadership at FirstBank. As President and Chief Executive Officer, he is responsible for leading and managing all facets of the bank’s operations, including establishing its long-term goals, strategies and corporate vision. Prior to joining FirstBank in 2010 as Chief Banking Officer, Mr. Holmes served as the Director of Corporate Financial Services and the Chief Retail Banking Officer for Greenville, S.C.-based South Financial Group. Previously, he worked for 20 years in the Memphis market, first as a certified public accountant with Ernst & Young and then in several management positions for National Bank of Commerce (which was acquired by SunTrust) and Trustmark National Bank.
74
Table of Contents
Index to Financial Statements
James Gordon: Chief Financial Officer. Mr. Gordon was appointed as our Chief Financial Officer in January 2016. Prior to joining us, Mr. Gordon was a Partner at Horne LLP from 2011 to 2016. Horne LLP served as our independent accounting firm before our appointment of RSM US LLP as our independent auditor in 2015 and Mr. Gordon served as our lead audit partner while at Horne. Before joining Horne, Mr. Gordon served as CFO of the South Financial Group, a large publicly traded bank holding company headquartered in Greenville, SC, from 2007 to 2010. In his capacity as CFO of the South Financial Group, his primary responsibilities included overseeing all of the accounting, financial and related functions as well as the Mortgage, SBA Lending and Information Technology divisions.
Wilburn (Wib) Evans: President, FirstBank Ventures. As President of FirstBank Ventures, Mr. Evans has overall responsibility for our mortgage banking business and investment function, including strategies for fee income businesses. Mr. Evans joined FirstBank in 1987 as Chief Financial Officer, a position that he held for almost 10 years before being promoted to Executive Vice President in 1996 and later to Chief Operating Officer. Prior to joining FirstBank, Mr. Evans worked as a certified public accountant with BDO.
Allen Oakley: Middle and East Tennessee Regional President. In his role, Mr. Oakley oversees the banking operations in Middle and East Tennessee and plays an important role in achieving strategic growth goals for the region. Mr. Oakley has more than 32 years of banking experience, mostly in the Tennessee market. Prior to joining FirstBank in 2012, Mr. Oakley served for 5 years as Executive Vice President and Middle Tennessee Manager of the Corporate, Commercial, and Public and Institutional Groups of Regions Bank. Prior to that role, Mr. Oakley worked for SunTrust as Managing Director for the Corporate and Investment Banking Division from the late 1990’s to 2006.
David Burden: West Tennessee Regional President. In his role as the West Tennessee Regional President, Mr. Burden has authority over banking operations in Memphis and West Tennessee, which includes most of our leading market share legacy markets. Mr. Burden has more than 14 years of experience at FirstBank and 30 years in banking. Before joining FirstBank, Mr. Burden held the positions of senior vice president and senior lending officer for Union Planters Bank and First American Bank. Early in his career, he served as a federal regulator for 4 years.
Wyndell “Winnie” Bunch: Chief Financial Officer, FirstBank Ventures. As Chief Financial Officer of FirstBank Ventures, Ms. Bunch oversees the finance and accounting division of our mortgage banking business and investment function. She brings more than 31 years of experience in accounting and financial services to the FirstBank senior management team and has been with FirstBank over 20 years. Before she was named Chief Financial Officer of FirstBank Ventures in 2015, Mrs. Bunch served as FirstBank’s chief financial officer, accountant and director of internal audit. Prior to joining FirstBank, Mrs. Bunch worked as a public accountant in Atlanta and as fiscal director for two large nonprofit agencies in Jackson, Tennessee.
Timothy Johnson: Chief Risk Officer. Mr. Johnson is responsible for FirstBank’s enterprise risk management activities including credit, compliance, audit, physical security, information security, facilities management, loan review and portfolio analysis. Mr. Johnson brings 27 years of experience in financial services to this role. His background in credit, mortgage, municipal finance, retail banking, commercial lending, consulting and regulatory relations has proven valuable in helping FirstBank meet its profit and growth objectives. Mr. Johnson joined FirstBank in 1999 in credit and loan administration before being promoted to Senior Vice President of Loan Administration in 2000. In 2013, he was appointed to the position of Chief Risk Officer.
Wade Peery: Director of Operations and Technology. Mr. Peery joined FirstBank in 2012 as Director of Treasury Management Sales and Operations, bringing 24 years of experience in the industry. His responsibilities now include oversight of loan and deposit operations, technology and retail and commercial banking support. Prior to joining FirstBank, Mr. Peery served as the Middle Tennessee Manager for Regions Bank’s Treasury
75
Table of Contents
Index to Financial Statements
Management Department, after previously holding the positions of Retail Area Sales Manager and Community Bank President for Regions Bank. He has extensive experience managing retail and commercial operations and has worked in both community and metropolitan banking environments.
Paul Craig: Director of Corporate Development. Mr. Craig is the Senior Vice President and Director of Corporate Development for FirstBank. In this role, he is responsible for leading the planning and execution of a wide range of special projects to meet FirstBank’s organizational objectives and seize new opportunities to help grow and improve the business. Mr. Craig joined FirstBank in 2011 and previously served as a Senior Vice President in the Commercial Real Estate Group. With a proven background of success in both special assets and commercial real estate, Mr. Craig brings strong business acumen and a valuable non-bank perspective to FirstBank. Prior to joining FirstBank, Mr. Craig worked in the real estate sector and as a certified public accountant with Arthur Andersen and LBMC.
Jeanie Rittenberry: Director of Marketing and Communications. Mrs. Rittenberry joined FirstBank in 2013 as Senior Vice President and Director of Marketing and Communications. In this role, Mrs. Rittenberry is responsible for marketing and communications as well as training, professional growth and leadership development programs. With more than 16 years of banking industry experience, Mrs. Rittenberry has worked with both community banks and national banks across the United States. Prior to joining FirstBank, she was senior vice president and director of marketing and client services for a division of National Bank of Commerce.
In addition to our senior management team, our market leaders have an average of over 28 years of experience and an average tenure of 15 years with us. We believe that we also have significant depth in our overall management in lending, credit administration, finance, operations and information technology.
Strong growth coupled with profitability. We have delivered attractive growth and returns since the implementation of our strategic plan designed to leverage our competitive advantages in both metropolitan and community markets in 2012. Our execution of the plan has delivered strong growth, primarily from our Nashville metropolitan strategy and mortgage expansion, coupled with positive returns from our legacy community markets.
| 2012 | 2013 | 2014 | 2015 |
Six months ended |
||||||||||||||||
| Net Income (in millions) |
$ | 20.5 | $ | 26.9 | $ | 32.5 | $ | 47.9 | $ | 30.4 | ||||||||||
| Pro forma net income(1) |
$ | 14.6 | $ | 18.6 | $ | 22.4 | $ | 33.1 | $ | 20.4 | ||||||||||
| Tax-Adjusted ROAA(1) |
0.68 | % | 0.84 | % | 0.97 | % | 1.28 | % | 1.42 | % | ||||||||||
| Core Deposits (in billions)(2) |
$ | 1.74 | $ | 1.75 | $ | 1.87 | $ | 2.39 | $ | 2.46 | ||||||||||
| Loans held for investment (in billions) |
$ | 1.24 | $ | 1.34 | $ | 1.42 | $ | 1.70 | $ | 1.75 | ||||||||||
| Nonperforming loans/loans(3) |
4.17 | % | 2.12 | % | 1.21 | % | 0.71 | % | 0.66 | % | ||||||||||
|
|
||||||||||||||||||||
| (1) | Our pro forma net income and tax-adjusted return on average assets include a pro forma provision for federal income taxes using a combined effective income tax rate of 33.76%, 35.37%, 35.63%, 35.08% and 37.32% for the years ended December 31, 2012, 2013, 2014 and 2015 and the six months ended June 30, 2016, respectively. |
| (2) | Core deposits is a non-GAAP financial measure, and, as we calculate core deposits, the most directly comparable GAAP financial measure is total deposits. See our reconciliation of non-GAAP financial measures to their most directly comparable GAAP financial measures under the caption “Selected historical consolidated financial data: GAAP reconciliation and management explanation of non-GAAP financial measures.” |
| (3) | Excludes loans acquired from Northwest Georgia Bank and therefore is a non-GAAP measure, and as we calculate nonperforming loans/loans, the most directly comparable GAAP measure is nonperforming loans. See our reconciliation of non-GAAP measures to their most comparable GAAP measures under the caption “Selected historical consolidated financial data: GAAP reconciliation and management explanation of non-GAAP financial measures.” |
Ability to recruit and retain talented people. The success of our operating model, which depends on local knowledge and decision making, is directly related to our ability to attract and retain talented bankers in each of our markets. We strive to attract and retain these bankers by fostering an entrepreneurial environment, empowering them with local authority and providing them with sufficient infrastructure and resources to
76
Table of Contents
Index to Financial Statements
support their growth while also providing management with appropriate oversight. We believe that our family culture built around respect, teamwork and empowerment makes us attractive for talented bankers and associates across our geographic footprint. We pride ourselves on being a great place to work, which is evidenced by our recognition as a Top Workplace for 2015 by The Tennessean, Nashville’s principal newspaper. In the Nashville market alone, we have added 19 new relationship bankers since 2011, including the current President of our Middle and East Tennessee region, Allen Oakley, a 32-year banking veteran.
Scalable, decentralized operating model. We operate each of our markets as individual markets, with an experienced market leader in charge of each market. Each of our market leaders and bankers is empowered to make local decisions up to specified limits set by the Bank’s board of directors and our senior management team based on experience and track record. We believe that the delivery by our bankers of in-market client decisions, coupled with strong, centralized risk and credit support, allows us to best serve our clients. This operating model has been proven successful in our existing markets and we believe it is highly replicable and scalable. We have a robust infrastructure, bolstered by our conversion to a new core processing system in the second quarter of 2016, that can support our model as we grow in existing and new markets either organically or through opportunistic acquisitions.
Disciplined and deliberate risk management. Risk management is a cornerstone of our culture and is emphasized throughout every area of the organization. Our decentralized operating model is balanced by individual lending authorities based on demonstrated experience and expertise. Larger credit decisions involve credit officers and/or senior management. We have invested in technology to monitor all credits, ensuring compliance with our policies. We strive for a balanced loan portfolio taking into consideration borrower and industry concentrations. Our risk management strategy also includes rigorous systems and processes to monitor liquidity, interest rate, operations, and compliance risk.
Preferred acquirer. We have a strong record of adding value through acquisitions and have completed seven bank and two mortgage company acquisitions under our current ownership. Our acquisition of Northwest Georgia Bank is the most recent example of an attractive strategic and financial transaction. Our key operational associates have integration experience with FirstBank and other institutions. We are a disciplined acquirer focused on opportunities that meet our internal return targets, maintain or enhance our earnings per share and add to our strong core deposit franchise. Our long-term personal relationships with many of the bank owners and CEOs in our markets lead to a natural dialogue when they choose to explore a sale of their company. Additionally, we believe that our size and ability to operate effectively in both community and metropolitan markets make us an attractive option to smaller banks seeking an acquirer.
Our business strategy
We believe there are significant growth opportunities across our footprint. Our competitive strengths position us to take advantage of these opportunities to deliver strong growth and attractive returns by focusing on the following core strategies.
Enhance market penetration in metropolitan markets. In recent years, we have successfully grown our franchise in the Nashville MSA by executing our metropolitan growth strategy. The strategy is centered on the following: recruiting the best bankers and empowering them with local authority; developing branch density; building brand awareness and growing our business and consumer banking presence; and expanding our product offering and capabilities. These strategies coupled with our personalized, relationship-based client service have contributed significantly to our success. Additionally, we believe that our scale, resources and sophisticated range of products provides us with a competitive advantage over the smaller community banks in the Nashville MSA and our other MSAs. As a result of these competitive advantages and growth strategies, the Nashville MSA has become our largest market. With approximately a 1.6% market share, based on deposits as
77
Table of Contents
Index to Financial Statements
of June 30, 2015, we are still in the early stage of executing our Nashville growth strategy and intend to continue to efficiently increase our market penetration. The following charts show our significant growth in the Nashville MSA since 2012.
| Nashville loans ($ in millions) | Nashville deposits ($ in millions) | Nashville bankers (#) | ||||
|
|
|
|
||||
Note: The loan and deposit charts reflect our loans, noninterest bearing deposits and core deposits in our Nashville market as of the end of each period. The banker chart reflects the total number of our relationship team bankers in our Nashville market as of the end of each period.
Based on market and competitive similarities, we believe our growth strategies are transferable to our other metropolitan markets. We intend to implement these strategies with an initial focus on the Chattanooga MSA. Our recent acquisition of Northwest Georgia Bank will accelerate our growth in Chattanooga and, we believe, will give us the necessary scale to enhance operating leverage and drive profitability in that market.
Pursue opportunistic acquisitions. While most of our growth has been organic, we have completed nine acquisitions under our current ownership, including our recent acquisition of Northwest Georgia Bank. We pursue acquisition opportunities that meet our internal return targets, enhance market penetration, and possess strong core deposits. We believe that numerous small to mid-sized banks or branch networks will be available for acquisition in metropolitan and community markets throughout Tennessee as well as in attractive contiguous markets in the coming years due to industry trends, such as scale and operational challenges, regulatory pressure, management succession issues and shareholder liquidity needs. In Tennessee alone, there are approximately 150 banks with total assets of less than $1 billion. We believe that we are positioned as a natural consolidator because of our financial strength, reputation and operating model.
Improve efficiency by leveraging technology and consolidating operations. We have invested significantly in our bankers, infrastructure and technology in recent years, including our conversion to a new core processing system in the second quarter of 2016, which we believe has create a scalable platform that will support and drive future organic and non-organic growth across all of our markets. Our bankers and branches, especially in the Nashville MSA, continue to scale in size and we believe there is capacity to grow our business without adding significantly to our branch network. We plan to continue to invest, as needed, in our technology and business infrastructure to support our future growth and increase operating efficiencies. We intend to leverage these investments to consolidate and centralize our operations and support functions while protecting our decentralized client service model.
Seize opportunities to expand noninterest income. While our primary focus is on capturing opportunities in our core banking business, we have successfully seized opportunities to grow our noninterest income by providing our people with the flexibility to take advantage of market opportunities. As part of our strategic focus to grow our noninterest income, we have significantly expanded our mortgage business by hiring experienced loan officers, implementing our consumer direct internet delivery channel in 2014 and offering our mortgage clients the personalized attention that is the cornerstone of our Bank. As a result, our mortgage banking income has grown from $19.0 million in 2012 to $70.2 million in 2015 and has already generated $54.6 million in revenues during the first half of 2016. We have also successfully expanded our fee-based businesses
78
Table of Contents
Index to Financial Statements
to include more robust treasury management services. We intend to continue to emphasize these business lines, which we believe will serve as strong customer acquisition channels and provide us with a range of cross-selling opportunities, while making our business stronger and more profitable.
Our banking services
While we operate through two segments, community banking and mortgage banking, community banking has been, and is, the cornerstone of our operations and underlying philosophy since our beginnings in 1906. As the third largest Tennessee headquartered bank, we are dedicated to serving the banking needs of businesses, professionals and individuals in our metropolitan and community markets through our community banking approach of personalized, relationship-based service. We strive to become trusted advisers to our clients and achieve long-term relationships. We deliver a wide range of banking products and services tailored to meet the needs of our clients across our footprint.
Lending activities
Through the Bank, we offer a broad range of lending products to our clients, which includes businesses with up to $250 million in annual revenues, business owners, real estate investors and consumers. Our commercial lending products include working capital lines of credit, equipment loans, owner-occupied and non-owner-occupied real estate construction loans, “mini-perm” real estate term loans, and cash flow loans to a diversified mix of clients, including small and medium sized businesses. Our consumer lending products include first and second residential mortgage loans, home equity lines of credit and consumer installment loans to purchase cars, boats and other recreational vehicles. At June 30, 2016, we had loans held for investment of $1.75 billion. Throughout the following discussion of our banking services we present our loan information as loans excluding loans held for sale.
Lending strategy
Our strategy is to grow our loan portfolio by originating commercial and consumer loans that produce revenues consistent with our financial objectives. Through our operating model and strategies, we seek to be the leading provider of lending products and services in our market areas to our clients. We market our lending products and services to our clients through our high-touch personalized service. As a general practice, we originate substantially all of our loans, but we occasionally participate in syndications, limiting participations to loans originated by lead banks with which we have a close relationship and which share our credit philosophies.
We also actively pursue and maintain a balanced loan portfolio by type, size and location. Our loans are generally secured and supported by personal guarantees.
79
Table of Contents
Index to Financial Statements
The following chart shows our loan portfolio mix by type as of June 30, 2016. We believe our loan portfolio is well-balanced, which provides us with the opportunity to take advantage of growth opportunities without concern of concentrations by category.
Loan portfolio mix as of June 30, 2016
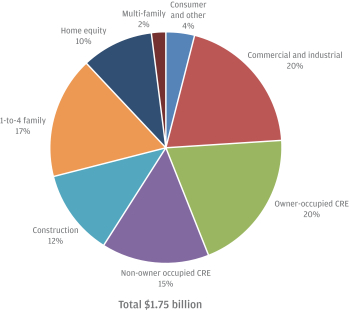
Commercial and industrial loans. Our commercial and industrial loans are typically made to small- and medium-sized manufacturing, wholesale, retail and service businesses for working capital and operation needs and business expansions, including the purchase of capital equipment. Commercial and industrial loans generally include lines of credit and loans with maturities of five years or less. Because we are a community bank with long standing ties to the businesses and professionals operating in our market areas, we are able to tailor our commercial and industrial loan programs to meet the needs of our clients. We target high-quality businesses in our markets with a proven track record and up to $250 million in annual revenues. As of June 30, 2016, we had outstanding commercial and industrial loans, of $355.6 million, or 20% of our loan portfolio. Growing our commercial and industrial loan portfolio is an important area of emphasis for us and we intend to continue to grow this portfolio. As a result of our growth efforts to date, our commercial and industrial loans have experienced a CAGR of 16.72% for the period from December 31, 2012 to June 30, 2016.
Commercial and industrial loans are generally made with operating cash flows as the primary source of repayment, but may also include collateralization by inventory, accounts receivable, equipment and personal guarantees. As a result, the repayment risk is subject to the ongoing business operations of the borrower. Any interruption or discontinuance of operating cash flows from the business, which may be influenced by events not under the control of the borrower such as economic events and changes in governmental regulations, could materially affect the ability of the borrower to repay the loan. Further, commercial and industrial loans may be secured by the collateral described above, which if the business is unsuccessful, typically have values insufficient to satisfy the loan without a loss.
Commercial real estate loans. Our commercial real estate loans consist of both owner-occupied and non-owner occupied commercial real estate loans. The total amount of commercial real estate loans outstanding as of June 30, 2016 was $609.9 million or 35% of our loan portfolio. Our commercial real estate loans have shown growth, with a CAGR, of 9.22% for the period from December 31, 2012 to June 30, 2016. The real estate securing
80
Table of Contents
Index to Financial Statements
our existing commercial real estate loans includes a wide variety of property types, such as offices, warehouses, production facilities, health care facilities, hotels, mixed-use residential/commercial, retail centers, restaurants, churches, assisted living facilities and agricultural based facilities. As of June 30, 2016, $346.0 million of our commercial real estate loan portfolio, or 20% of our loan portfolio, was owner-occupied commercial real estate loans, and $263.9 million of our commercial real estate loan portfolio, or 15% of our loan portfolio, was non-owner occupied commercial real estate loans. We are primarily focused on growing the owner-occupied portion of our commercial real estate loan portfolio.
With respect to our owner-occupied commercial real estate loans, we target local companies with a proven operating history that tend to be business-operators and professionals within our markets. Owner-occupied real estate loans are typically repaid through the ongoing business operations of the borrower, and hence are dependent on the success of the underlying business for repayment and are more exposed to general economic conditions.
With respect to our non-owner occupied commercial real estate loans, we target experienced, local real estate developers and investors with whom our bankers have long-standing relationships. Our non-owner occupied commercial real estate loans also tend to involve retail, hotel, office, warehouse and industrial properties. Non-owner occupied real estate loans are typically repaid with the funds received from the sale of the completed property or rental proceeds from such property, and are therefore more sensitive to adverse conditions in the real estate market, which can also be affected by general economic conditions.
Commercial real estate loans are often larger and involve greater risks than other types of lending. Adverse developments affecting commercial real estate values in our market areas could increase the credit risk associated with these loans, impair the value of property pledged as collateral for these loans, and affect our ability to sell the collateral upon foreclosure without a loss. Furthermore, adverse developments affecting the business operations of the borrowers of our owner-occupied commercial real estate loans could significantly increase the credit risk associated with these loans. Due to the larger average size of commercial real estate loans, we face the risk that losses incurred on a small number of commercial real estate loans could have a material adverse impact on our financial condition and results of operations.
Residential real estate loans. Our residential real estate loans consist of 1-4 family loans, home equity loans and multi-family loans. The residential real estate loans described below exclude mortgage loans that are held for sale. As of June 30, 2016, the total amount of residential real estate loans outstanding was $501.9 million, or 29%, of our loan portfolio.
Our 1-4 family mortgage loans are primarily made with respect to and secured by single family homes, which are both owner-occupied and investor owned. We seek to make our 1-4 family mortgage loans to well-qualified homeowners and investors with a proven track record that satisfy our credit and underwriting standards. As of June 30, 2016, our 1-4 family mortgage loans comprised $286.3 million, or 17%, of loans.
Our home equity loans are primarily revolving, open-end lines of credit secured by 1-4 family residential properties. We seek to make our home equity loans to well-qualified borrowers that satisfy our credit and underwriting standards. Our home equity loans as of June 30, 2016 comprised $174.5 million, or 10%, of loans.
Our multi-family residential loans are primarily secured by multi-family properties, primarily apartment and condominium buildings. We seek to make multi-family residential loans to experienced real estate investors with a proven track record. These loans are primarily repaid from the rental payments generated by the multifamily properties. Our multifamily loans as of June 30, 2016 comprised $41.0 million, or 2%, or loans.
We expect to continue to make residential real estate mortgage loans at a similar pace so long as housing values in our markets do not deteriorate from current prevailing levels and we are able to make such loans consistent with our current credit and underwriting standards. Like our commercial real estate loans, our
81
Table of Contents
Index to Financial Statements
residential real estate loans are secured by real estate, the value of which may fluctuate significantly over a short period of time as a result of market conditions in the area in which the real estate is located. Adverse developments affecting real estate values in our market areas could therefore increase the credit risk associated with these loans, impair the value of property pledged as collateral on loans and affect our ability to sell the collateral upon foreclosure without a loss or additional losses. We primarily make our residential real estate loans to qualified individuals and investors in accordance with our real estate lending policies, which detail maximum loan to value ratios and maturities and, as result, the repayment of these loans are also affected by adverse personal circumstances.
Construction loans. Our construction real estate loans include commercial construction, land acquisition and land development loans and single-family interim construction loans to small- and medium-sized businesses and individuals. We target experienced local developers primarily focused on multifamily, hospitality, commercial building, retail and warehouse developments. These loans are typically disbursed as construction progresses and carry variable interest rates. As of June 30, 2016, the outstanding balance of our construction loans was $210.0 million, or 12% of our loan portfolio. We expect to continue to make construction loans at a similar pace so long as demand continues and the market for and values of such properties remain stable or continue to improve in our markets.
Construction loans carry a high risk because repayment of these loans is dependent, in part, on the success of the ultimate project or, to a lesser extent, the ability of the borrower to refinance the loan or sell the property upon completion of the project, rather than the ability of the borrower or guarantor to repay principal and interest. Moreover, these loans are typically based on future estimates of value and economic circumstances, which may differ from actual results or be affected by unforeseen events. If the actual circumstances differ from the estimates made at the time of approval of these loans, we face the risk of having inadequate security for the repayment of the loan. Further, these loans are typically secured by the underlying development and even if we foreclose on the loan, we may be required to fund additional amounts to complete the project and may have to hold the property for an unspecified period of time while we attempt to dispose of it.
Consumer and other loans. We offer a variety of consumer loans, such as installment loans to individuals for personal, family and household purposes, including car, boat and other recreational vehicle loans. Our consumer loans typically are part of an overall client relationship designed to support the individual consumer borrowing needs of our commercial loan and deposit clients, and are well diversified across our markets. As of June 30, 2016, we had outstanding $73.0 million of consumer and other loans, excluding residential real estate loans, representing 4% of our loan portfolio. Consumer loans typically have shorter terms, lower balances, higher yields and higher risks of default than residential real estate mortgage loans. Consumer loan collections are dependent on the borrower’s continuing financial stability and are therefore more likely to be affected by adverse personal circumstances, such as the loss of employment, unexpected medical costs or divorce. These loans are often secured by the underlying personal property, which typically has insufficient value to satisfy the loan without a loss due to damage to the collateral and general depreciation.
Deposits and other banking services
We offer a full range of transaction and interest bearing depository products and services to meet the demands of each segment within our client base. Our target segments include consumer, small business, and corporate entities with up to $250 million in annual revenues. We solicit deposits from these target segments through our local bankers, sophisticated product offering and our brand-awareness initiatives, such as our community focused marketing and high-visibility branch locations. We offer demand, negotiable order of withdrawal, money market accounts, certificates of deposit, municipal deposits, savings, and deposit accounts. To complement our account offerings, we also have in place technology to support electronic banking activities, including consumer online banking and mobile banking. In addition to these electronic banking activities, we
82
Table of Contents
Index to Financial Statements
make deposit services accessible to our clients by offering direct deposit, wire transfer, night depository, banking-by-mail and remote capture for non-cash items. Our commercial clients are served by a well-developed cash management technology platform.
The following charts show our deposit composition as of June 30, 2016, as well as the growth of our noninterest bearing deposits as a percentage of total deposits and the resulting improvement in our cost of deposits since 2012.
| Deposit mix as of June 30, 2016 | Noninterest bearing deposit and cost of deposits | |
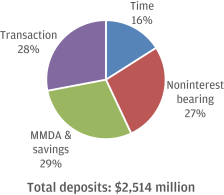
|
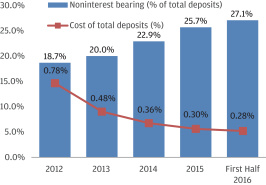
| |
The growth of low-cost deposits is an important aspect of our strategic plan, and we believe it is a significant driver of our value. The primary driver of our noninterest bearing deposit growth has been our ability to acquire new commercial clients. This has resulted from the addition of relationship bankers in our Nashville market, improved technology in the cash management area, and the addition of experienced cash management sales and operational specialists. Our cash management product offering includes a well-developed online banking platform complemented by a host of ancillary services including lockbox remittance processing, remote check deposit capture, remote cash capture, fraud protection services, armored car services, commercial and business card products, and merchant processing solutions. In addition to the growth of noninterest bearing deposits, cash management account analysis fees have grown from approximately $1.0 million in 2013 to $1.5 million in 2015.
Our consumer offering is anchored on our Rewards based checking product where we currently hold over $200 million in deposit balances in approximately 28,000 accounts. The Rewards checking product incents our clients to use their FirstBank debit card as a primary method of payment at point of sale, utilize online and mobile banking, electronic bill pay, direct deposit, and receive electronic statements. When meeting certain criteria, clients receive a premium interest rate on balances. The bank benefits from higher interchange revenue, lower expense on a per account basis as compared to traditional products, and better client retention.
The coupling of these strategies delivered through our relationship-based sales model has allowed us to grow noninterest bearing deposits and noninterest income without expanding our account level fee structure. This differentiating approach has set us apart from national and regional competitors and has built loyalty and satisfaction within our client segments.
Mortgage banking activities
We offer full-service residential mortgage products and services through our bank branches, our mortgage offices strategically located throughout the southeastern United States both in and outside our community banking footprint and our national internet delivery channel. We also offer smaller community banks and
83
Table of Contents
Index to Financial Statements
mortgage companies a host of diverse, third-party mortgage services. Our mortgage business has a strong track record of profitability and growth driven by our experienced mortgage executive team, diversified distribution channels and correspondent relationships with other community banks and mortgage companies.
While we have always offered, and continue to offer, home mortgage loans to retail customers through our bank branches, we began the expansion and diversification of our mortgage business beyond our traditional bank branch channel in 2010 by opening loan production offices in certain of our Tennessee markets in an effort to take advantage of attractive opportunities to grow our mortgage revenues and attract new customers to the Bank. We continued this expansion in 2011 with the acquisition of the assets and certain employees of Henger Rast Mortgage, with loan production offices in Alabama and Georgia, and the acquisition of our third party origination group in Greer, South Carolina. We also opened additional mortgage offices outside of our community banking footprint in strategically located markets across the Southeast and continued to hire experienced loan officers across our footprint. In 2014, we started our consumer direct internet delivery channel to target clients across the nation and to compete against on-line mortgage providers. In the first quarter of 2016, we acquired certain assets of Finance of America Mortgage LLC, further expanding our third party origination channel. As a result of these initiatives, we have expanded our mortgage banking business beyond the traditional home mortgage loans offered by our bank branches and now offer our residential mortgage products and services and third party mortgage services through four diverse delivery channels: (1) Retail Mortgage, which provides residential mortgages to consumers in the Southeast primarily through our bank branches and mortgage offices; (2) Third Party Origination consisting of both correspondent and wholesale lending, which provides mortgage processing and resale services to smaller banks and mortgage companies in Tennessee and other states nationally. (3) ConsumerDirect, which provides residential mortgages on a national basis via internet channels; and (4) Reverse Mortgage, which provides reverse mortgage products to clients in Tennessee, Alabama, Georgia, and other states nationally.
The residential mortgage products and services originated in our community banking footprint and related revenues and expenses are included in our community banking segment while the residential mortgage products and services originated outside of our community banking footprint and related revenues and expenses are included in our mortgage banking segment. The mortgage banking segment also includes our ConsumerDirect internet delivery channels, our Third Party Origination group, Reverse Mortgage channels and our mortgage servicing activities.
We intend to continue to take advantage of opportunities to grow our mortgage business as they present themselves, including by continuing to expand our mortgage business outside of our community banking footprint, improving the client experience through an enhanced fulfillment process, attracting experienced loan officers and improving profitability through centralized efficiencies and our capital markets execution. We have also successfully expanded our ConsumerDirect internet delivery channel over the past year by opening call center operations in North Carolina and expanding our call center operations in Florida, increasing our marketing of this channel. We have managed to grow our mortgage business while maintaining a high-degree of scalability to control costs in the event of a downturn in our mortgage business. Our mortgage loan office leases are primarily short-term in nature and over 60% of our mortgage-related compensation is in the form of variable compensation. Further, as interest rate cycles vary, we can increase or decrease lead generating marketing dollars in both our ConsumerDirect and Reverse Mortgage channels to scale the velocity of mortgage originations. Our mortgage business offers attractive cross-selling opportunities for our consumer banking products through the origination process and our mortgage servicing book.
We look to originate quality mortgage loans with a focus on purchase money mortgages. In accordance with our lending policy, each loan undergoes a detailed underwriting process which incorporates uniform underwriting standards and oversight that satisfies secondary market standards as outlined by our investors and mortgage
84
Table of Contents
Index to Financial Statements
offices to the size and complexity of the lending relationship. Mortgage loans are subject to the same uniform lending policies referenced below and consist primarily of loans with relatively stronger borrower credit scores, with an average FICO score of 749 during the first half of 2016.
The residential mortgage industry is highly competitive and we compete with other community banks, regional banks, national banks, credit unions, mortgage companies, financial service companies and online mortgage companies. Due to the highly competitive nature of the residential mortgage industry, we expect to face industry-wide competitive pressures related to changing market conditions that will reduce our pricing margins and mortgage revenues generally, especially in a rising rate environment.
Our mortgage banking business is also directly impacted by the interest rate environment, increased regulations, consumer demand, driven in large part by general economic conditions and the real estate markets, and investor demand for mortgage securities. Mortgage production, especially refinancing activity, declines in rising interest rate environments. While we have been experiencing historically low interest rates, the low interest rate environment likely will not continue indefinitely. While we have not yet experienced a slowdown in our mortgage origination volume, due in part to our expansion of our mortgage banking business and rates remaining favorable, our mortgage origination volume could be materially and adversely affected by rising interest rates and we expect to see declining origination volume in the second half of 2016 within the industry.
During the year ended December 31, 2015, we originated $2.8 billion of mortgage loans, with 48% of these loans being purchase money mortgage loans. Please see below for a breakdown of our mortgage originations by distribution channel since 2013 and by product type for the six months ended June 30, 2016 and the year ended December 31, 2015:
Originations by line of business ($ in millions)
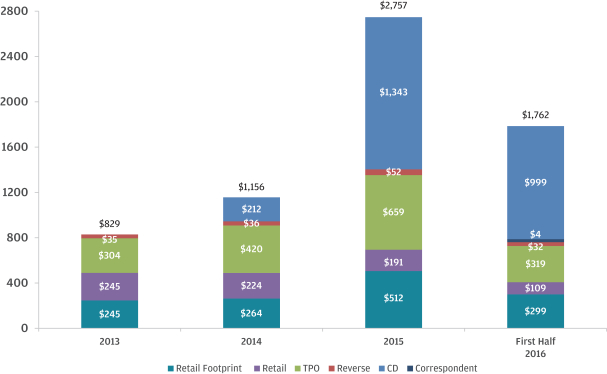
85
Table of Contents
Index to Financial Statements
Originations by product type (Six months ended June 30, 2016)
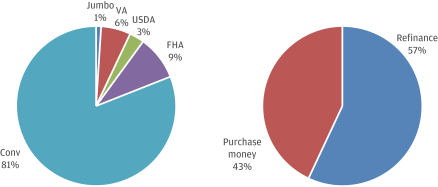
Originations by product type (year ended December 31, 2015)
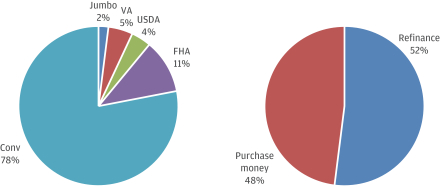
Note: Conv = Conventional; VA = Veterans Affairs; USDA = USDA Rural Housing Mortgage; FHA = Federal Housing Administration
Sale of residential mortgages. We sell substantially all of the residential mortgage loans we originate through our mortgage banking business to Fannie Mae, Freddie Mac or, to a lesser extent, an array of private national mortgage investors. As part of our overall asset/liability management objectives, we may also retain certain residential loans that we originate and, in such an instance, would bear the risk of default with respect to these loans. To reduce the interest rate risk associated with commitments made to borrowers for mortgage loans that have not yet been closed and that we intend to sell in the secondary markets, we routinely enter into commitments (considered to be derivatives) to hedge the interest rate risk. Derivative instruments are recognized at fair value in our consolidated balance sheets as either assets or liabilities. We monitor our interest rate risk position daily to maintain appropriate coverage of our loan commitments made to borrowers.
Loan servicing. Traditionally, we have sold our servicing rights to loans that we originated and sold in the secondary market. However, in 2014, we expanded our mortgage business by beginning to service loans that we originate, or acquire through our third party origination contracts, and that we sell in the secondary markets in an effort to capture additional revenue and create cross-selling opportunities for our banking products. We receive a fee for performing mortgage servicing activities on mortgage loans that are not owned by us and are not included on our balance sheet. This process involves collecting monthly mortgage payments on behalf of investors, reporting information to those investors on a timely basis and maintaining custodial escrow accounts for the payment of principal and interest to investors, and property tax and insurance premiums on behalf of borrowers. We provide this servicing for third parties through a nationwide independent subservice provider, Cenlar. At June 30, 2016, we had approximately 19,648 loans serviced for others totaling approximately $4,023 million.
86
Table of Contents
Index to Financial Statements
As compensation for our mortgage servicing activities, we receive servicing fees of approximately 0.25% per year of the loan balances serviced, plus any late charges collected from the delinquent borrowers and other fees incidental to the services provided, offset by applicable subservicing fees. In the event of a default by the borrower, we receive no servicing fees until the default is cured. In times when interest rates are rising or at high levels, servicing mortgage loans can represent a steady source of noninterest income and can, at times, offset decreases in gains on sales of mortgage loans. Conversely, in times when interest rates are falling or at very low levels, servicing mortgage loans can become comparatively less profitable due to the rapid payoff of loans. We account for our mortgage servicing rights at the lower of cost or market value. The amount of mortgage servicing rights initially recorded is based on the market value of the mortgage servicing rights determined on the date when the underlying loan is sold. Our determination of fair value and the amount we record is based on a valuation model using discounted cash-flow analysis and available market pricing. Third party valuations of the mortgage servicing rights portfolio are obtained on a regular basis and are used to determine the fair value of the servicing rights at the end of the reporting period. Estimates of fair value reflect the following variables:
| • | anticipated prepayment speeds; |
| • | product type (i.e., conventional, government, balloon); |
| • | fixed or adjustable rate of interest; |
| • | interest rate; |
| • | servicing costs per loan; |
| • | impairment; |
| • | discounted yield rate; |
| • | estimate of ancillary income; and |
| • | geographic location of the loan. |
We monitor the level of our investment in mortgage servicing rights in relation to our other mortgage banking activities in order to limit our exposure to significant fluctuations in loan servicing income. Since we began the servicing activities in February 2014, the volume and dollar amount of our mortgage servicing rights has grown significantly, due to a strong mortgage origination environment. As a result, our exposure to volatility in total mortgage banking income has also increased as well as exposure to future impairment or to unfavorable changes in underlying fair value assumptions for prepayment speeds and discount rates. In the future, we may sell our mortgage servicing rights depending on a variety of factors, including capital sufficiency, the size of the mortgage servicing rights portfolio relative to total assets, and current market conditions. In addition, for certain investors and/or certain transactions, we may be contractually obligated to repurchase a mortgage loan or reimburse the investor for credit losses incurred on the loan as a remedy for deficiencies in both origination and servicing with respect to the loan.
Throughout the remainder of 2016 due to capital limitations and other considerations, we intend to sell a significant portion of our existing mortgage servicing rights. We expect to incur between $1.5 million and $2.5 million of transaction expenses in connection with these anticipated sales. However, the actual timing and expenses associated with these sales may differ from our current expectations depending on market conditions and transaction-specific details. In conjunction with the anticipated sales of these mortgage servicing rights, we may incur additional impairment charges if we are unable to sell these mortgage servicing rights at the carrying value of the associated mortgage servicing right asset on our financial statements. Furthermore, based upon market conditions and market data gained from these anticipated sales, we could be required to incur additional impairment charges on our remaining mortgage servicing right asset if such sales are at lower prices than the carrying value of remaining mortgage servicing right assets. We also intend to establish an ongoing arrangement whereby we could sell some or all of our ongoing mortgage servicing rights through a co-issue flow mechanism to facilitate future sales without incurring ongoing transaction costs.
87
Table of Contents
Index to Financial Statements
Third party origination services. Through our Third Party Origination Services channel, we provide flexible mortgage packages and solutions for smaller community banks and mortgage companies. Generally speaking, these smaller banks and mortgage companies originate loans but have reduced access to the secondary market in which mortgages are sold to investors, and for a fee, we provide them with mortgage processing, purchase and re-sale services.
Investment services
The Bank provides our individual clients access to investment services offered by INVEST Financial Corporation, an independent third-party broker-dealer that maintains offices in 34 of our bank branches. A full range of investment choices are available through INVEST for our clients, including equities, mutual funds, bonds, tax-exempt municipals, and annuities, as well as money management consultation. Life insurance products are also offered to our clients through FirstBank Insurance, Inc., a wholly-owned insurance agency. We also offer our business clients restructured group retirement plans. We primarily market these services to retirees or pre-retirees with $100,000 of investable assets, high income professionals earning more than $200,000 and businesses with group retirements plans that have more than $1 million in assets. We earn noninterest income from the investment and life insurance sales arrangements.
Risk management
General
Our operating model demands a strong risk culture built to address multiple areas of risk, including credit risk, interest rate risk, liquidity risk, price risk, compliance risk, operational risk, strategic risk and reputational risk. Our risk culture is supported by significant investments in the right people and technologies to protect our business. Our board of directors and the Bank’s board of directors are ultimately responsibility for overseeing risk management at the holding company and bank level, respectively. We have a Chief Risk Officer who oversees risk management across our business and reports directly to our Chief Executive Officer. Our board, Chief Executive Officer and Chief Risk Officer are supported by the heads of other functional areas at the Bank, including legal, IT, audit, compliance, capital markets and information and physical security. Our comprehensive risk management framework is designed to complement our core strategy of empowering our experienced, local bankers with local-decision making to better serve our clients.
Our credit policies support our goal of maintaining sound credit quality standards while achieving balance sheet growth, earnings growth, appropriate liquidity and other key objectives. We maintain a risk management infrastructure that includes local authority, centralized policymaking and a strong system of checks and balances. The fundamental principles of our credit policy and procedures are to maintain credit quality standards, which enhance our long-term value to our clients, associates, shareholders and communities. Our loan policies provide our bankers with a sufficient degree of flexibility to permit them to deliver responsive and effective lending solutions to our clients while maintaining appropriate credit quality. Furthermore, our bankers and associates are hired for the long-term and they are incentivized to focus on long-term credit quality. Since lending represents credit risk exposure, the Bank’s board of directors and its duly appointed committees seek to ensure that the Bank maintains appropriate credit quality standards. We have established asset oversight committees to administer the loan portfolio. These committees include our audit committee and credit committee, and they meet at least quarterly to review the lending activities of the Bank.
Credit concentration
Diversification of risk is a key factor in prudent asset management. Our loan portfolio is balanced between our metropolitan and community markets and by type, thereby diversifying our loan concentration. Our granular
88
Table of Contents
Index to Financial Statements
loan portfolio reflects a balanced mix of consumer and commercial clients across these markets that we think provides a natural hedge to industry and market cycles. In addition, risk from concentration is actively managed by management and reviewed by the board of directors of the Bank, and exposures relating to borrower, industry and commercial real estate categories are tracked and measured against established policy limits. These limits are reviewed as part of our periodic review of the loan policy, which underwent a comprehensive review in 2013. Loan concentration levels are monitored by the credit administration department and reported to the board of directors of the Bank.
Loan approval process
The loan approval process at the Bank is characterized by local authority supported by a risk control environment that provides for prompt and thorough underwriting of loans. Our localized decision making is reinforced through a centralized review process supported by technology that monitors all credits to ensure compliance with our credit policies. Our loan approval method is based on a hierarchy of individual lending authorities for new credits and renewals granted to our individual bankers, market presidents, credit officers, senior management and credit committee. The Bank’s board of directors establishes the maximum individual lending limits at each level and our senior management team sets individual authorities within these maximum limits to each individual based on demonstrated experience and expertise, and are periodically reviewed and updated. We believe that the ability to have individual loan authority up to specified levels based on experience and track record coupled with appropriate approval limits for our market presidents and credit officers allows us to provide prompt and appropriate responses to our clients while still allowing for the appropriate level of oversight.
As a relationship-oriented lender, rather than transaction-oriented lender, substantially all of our loans are made to borrowers located or operating in our market area. This provides us with better understanding of their business, creditworthiness and the economic conditions in their market and industry. Furthermore, our associates are held accountable for all of their decisions, which effectively aligns their incentives to reflect appropriate risk management.
In considering loans, we follow the conservative underwriting principles set forth in our loan policy with a primary focus on the following factors:
| • | a relationship with our clients that provides us with a complete understanding of their financial condition and ability to repay the loan; |
| • | verification that the primary and secondary sources of repayment are adequate in relation to the amount of the loan; |
| • | observation of appropriate loan to value guidelines for real estate secured loans; |
| • | targeted levels of diversification for the loan portfolio, both as to type of borrower and type of collateral; and |
| • | proper documentation of loans, including perfected liens on collateral. |
As part of the approval process for any given loan, we seek to minimize risk in a variety of ways, including the following:
| • | analysis of the borrower’s financial condition, cash flow, liquidity, and leverage; |
| • | assessment of the project’s operating history, operating projections, location and condition; |
| • | review of appraisals, title commitment and environmental reports; |
| • | consideration of the management’s experience and financial strength of the principals of the borrower; and |
| • | understanding economic trends and industry conditions. |
89
Table of Contents
Index to Financial Statements
The board of directors of the Bank reviews and approves loan policy changes, monitors loan portfolio trends and credit trends, and reviews and approves loan transactions that exceed management thresholds as set forth in our loan policies. Loan pricing is established in conjunction with the loan approval process based on pricing guidelines for loans that are set by the Bank’s senior management. We believe that our loan approval process provides for thorough internal controls, underwriting, and decision making.
Lending limits
The Bank is limited in the amount it can loan in the aggregate to a single borrower or related borrowers by the amount of our capital. The Bank is a Tennessee chartered bank and therefore all branches, regardless of location, fall under the legal lending limits of the state of Tennessee. Tennessee’s legal lending limit is a safety and soundness measure intended to prevent one person or a relatively small and economically related group of persons from borrowing an unduly large amount of a bank’s funds. It is also intended to safeguard a bank’s depositors by diversifying the risk of loan losses among a relatively large number of creditworthy borrowers engaged in various types of businesses. Generally, under Tennessee law, loans and extensions of credit to a borrower may not exceed 15% of our bank’s Tier 1 capital, plus an additional 10 % of the bank’s Tier 1 capital, with approval of the bank’s board. Further, the Bank may elect to conform to similar standards applicable to national banks under federal law, in lieu of Tennessee law. Because the federal law and Tennessee state law standards are determined as a percentage of the Bank’s capital, these state and federal limits both increase or decrease as the Bank’s capital increases or decreases. Based upon the capitalization of the Bank at June 30, 2016, the Bank’s legal lending limits were approximately $34 million (15%) and $57 million (25%). The Bank may seek to sell participations in our larger loans to other financial institutions, which will allow us to manage the risk involved in these loans and to meet the lending needs of our clients requiring extensions of credit in excess of these limits.
In addition to these legally imposed lending limits, we also employ appropriate limits on our overall loan portfolio and requirements with respect to certain types of lending and individual lending relationships. For example, we have lending limits related to maximum borrower, industry and certain types of commercial real estate exposures.
Enterprise risk management
We maintain an enterprise risk management program that enables us to identify, manage, monitor and control potential risks that may affect us, including credit risk, interest rate risk, liquidity risk, price risk, compliance risk, operational risk, strategic risk and reputational risk. Our operating model demands a strong risk culture built naturally to address the multiple areas of risk we face, and our risk management strategy is supported by significant investments in the right people and technologies to protect the organization.
Our comprehensive risk management framework and risk identification is a continuous process and occurs at both the transaction level and the portfolio level. While our local bankers and associates support our day-to-day risk practices, management seeks to identify interdependencies and correlations across portfolios and lines of business that may amplify risk exposure through a thorough centralized review process. Risk measurement enables us to effectively control and monitor risk levels and is based on the sophistication of the risk measurement tools used to reflect the complexity and levels of assumed risk. We monitor risks and ensure compliance with our risk policies by timely reviewing risk positions and exceptions, investing in the technology to monitor all credits, requiring senior management authority sign-off on larger credit requests and granting credit authority to bankers and officers based on demonstrated experience and expertise. This monitoring process ensures that management’s decisions are implemented for all geographies, products and legal entities.
We control risks through limits that are communicated through policies, standards, procedures and processes that define responsibility and authority. Such limits serve as a means to control exposures to the various risks
90
Table of Contents
Index to Financial Statements
associated with our activities, and are meaningful management tools that can be adjusted if conditions or risk tolerances change. In addition, we maintain a process to authorize exceptions or changes to risk limits when warranted. These risk management practices help to ensure effective reporting, compliance with all laws, rules and regulations, avoid damage to our reputation and related consequences, and attain our strategic goals while avoiding pitfalls and surprises along the way.
The board of directors of the Bank approves policies that set operational standards and risk limits, and any changes require approval by the Bank’s board of directors. Management is responsible for the implementation, integrity and maintenance of our risk management systems ensuring the directives are implemented and administered in compliance with the approved policy. Our Chief Risk Officer supervises the overall management of our risk management program, reports to management and yet also retains independent access to the Bank’s board of directors.
Credit risk management
Credit risk management is a key component of our risk management program. We employ consistent analysis and underwriting to examine credit information and prepare underwriting documentation. We monitor and approve exceptions to our credit policies as required, and we also track and address technical exceptions.
Each loan officer has the primary responsibility for appropriately risk rating each loan that is made. In addition, our credit administration department is responsible for the ongoing monitoring of loan portfolio performance through the review of ongoing financial reports, loan officer reports, audit reviews and exception reporting and concentration analysis. This monitoring process also includes an ongoing review of loan risk ratings and management of our allowance for loan losses. We have a Chief Credit Officer responsible for maintaining the integrity of our portfolio within the parameters of the credit policy. We utilize a risk grading system that enables management to differentiate individual loan quality and forecast future profitability and portfolio loss potential.
We assign a credit risk rating at the time a commercial loan is made and adjust it promptly as conditions warrant. Portfolio monitoring systems allow management to proactively assess risk and make decisions that will minimize the impact of negative developments. We promote open communication to minimize or eliminate surprises. Successful credit management is achieved by lenders consistently meeting with clients and reviewing their financial conditions regularly. This enables both the recognition of future opportunities and potential weaknesses early.
The Bank’s board of directors supports a strong loan review program and is committed to its effectiveness as part of the independent process of assessing our lending activities. We have communicated to our credit and lending staff that the identification of emerging problem loans begins with the lending personnel knowing their client and, supported by credit personnel, actively monitoring their client relationships. The loan review process is meant to augment this active management of client relationships and to provide an independent and broad-based look into our lending activities. We believe that our strong client relationships support our ability to identify potential deterioration of our credits at an early stage enabling us to address these issues early on to minimize potential losses.
We maintain a robust loan review function by utilizing an internal loan review team as well as third-party loan review firms that report to the board of directors of the Bank to ensure independence and objectivity. The examinations performed by the loan review department are based on risk assessments of individual loan commitments within our loan portfolio over a period of time. At the conclusion of each review, the auditors provide management and the board of directors with a report that summarizes the findings of the review. At a minimum, the report addresses risk rating accuracy, compliance with regulations and policies, loan documentation accuracy, the timely receipt of financial statements, and any additional material issues.
91
Table of Contents
Index to Financial Statements
When delinquencies in our loans exist, we rigorously monitor the levels of such delinquencies for any negative or adverse trends. From time to time, we may modify loans to extend the term or make other concessions to help a borrower with a deteriorating financial condition stay current on their loan and to avoid foreclosure. We generally do not forgive principal or interest on loans or modify the interest rates on loans to rates that are below market rates. Furthermore, we are committed to collecting on all of our loans and, as a result, at times have lower net charge-offs compared to our peer banks. This practice often results in us carrying higher nonperforming assets on our books than our peers, as we believe our peers are quicker to charge-off loans than we are. However, our commitment to collecting on all of our loans, coupled with our knowledge of our borrowers results in higher loan recoveries. We believe that we are well reserved for losses resulting from our non-performing assets.
Liquidity and interest rate risk management
Our liquidity planning framework is focused on ensuring the lowest cost of funding available and planning for unpredictable funding circumstances. To achieve the foregoing, we utilize a simple funding and capital structure consisting primarily of deposits and common equity. We are particularly focused on gathering core deposits to fund our balance sheet growth and have successfully lowered our cost of total deposits since 2012. The following chart shows our simple funding structure as of June 30, 2016.
Funding structure as of June 30, 2016
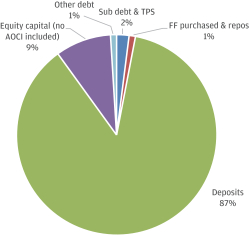
In addition, we monitor our liquidity risk by adopting policies to define potential liquidity problems, reviewing and maintaining an updated liquidity contingency plan and providing a prudent capital structure consistent with our credit standing and plans for strategic growth.
Our interest risk management system is overseen by our board of directors, who has the authority to approve acceptable rate risk levels. Our board of directors has established the Asset Liability Committee to ensure appropriate risk appetite by requiring:
| • | quarterly testing interest rate risk exposure, |
| • | proactive risk identification and measurement, |
| • | senior management quarterly risk presentations, and |
| • | independent review of the risk management process. |
92
Table of Contents
Index to Financial Statements
Competition
We conduct our core banking operations primarily in Tennessee and compete in the commercial banking industry solely through our wholly-owned banking subsidiary, FirstBank. The banking industry is highly competitive, and we experience competition in our market areas from many other financial institutions. We compete with commercial banks, credit unions, savings institutions, mortgage banking firms, online mortgage lenders, consumer finance companies, securities brokerage firms, insurance companies, money market funds and other mutual funds, as well as super-regional, national and international financial institutions that operate offices in our market areas and elsewhere. In addition, a number of out-of-state financial intermediaries have opened production offices, or otherwise solicit deposits, in our market areas. Increased competition in our markets may result in reduced loans and deposits, as well as reduced net interest margin and profitability. Furthermore, the Tennessee market has grown increasingly competitive in recent years with a number of banks entering this market, with a primary focus on the state’s metropolitan markets. We believe this trend will continue as banks look to gain a foothold in this growing market. This trend will result in greater competition primarily in our metropolitan markets. However, we firmly believe that our market position and client-focused operating model enhances our ability to attract and retain clients.
See “Our markets” in this section above for a further discussion of the markets we compete in and the competitive landscape in these markets.
Our associates
As of June 30, 2016, we had 1,013 full-time associates and 25 part-time associates. We pride ourselves on maintaining good relations with our associates.
Information technology systems
We have recently made and continue to make significant investments in our technology platforms. In 2014 we completed an upgrade to our consumer online banking, mobile and voice platforms deploying competitive technology to support consumer self-service banking behavior. During 2015, we completed the installation of a dedicated commercial cash management platform that is configurable at a client segment level supporting a broad range of client needs. We are also developing a commercial mobile and tablet app that we anticipate launching in 2016.
During the second quarter of 2016, we successfully converted our core operating platform to the Jack Henry Silverlake platform. This core conversion includes the replacement of our core, teller platform, loan and deposit platforms, as well as a number of other ancillary systems. We believe that the automation and integration improvements that will result from this core conversation will create a scalable and efficient operations function. Additionally, we believe this positions us to offer new products and services that will improve our overall customer experience and enhance our ability to attract new households.
Properties
Our principal executive offices and FirstBank’s main office are located 211 Commerce Street, Suite 300, Nashville, Tennessee 37201. We currently operate 42 full-service banking branches in Tennessee, two in Georgia and one in Alabama and mortgage offices located throughout the Southeast. We own 33 of these full-service banking branches and lease our other banking branches, our mortgage offices, and our principal executive office. Our mortgage banking offices are typically leased for short-terms. We believe that our facilities are in good condition and are adequate to meet our operating needs for the foreseeable future.
93
Table of Contents
Index to Financial Statements
Legal proceedings
From time to time we are named or threatened to be named as a defendant or counter-defendant in various lawsuits pertaining to our business. Management, following consultation with legal counsel, believes that it is not currently subject to any pending or threatened litigation which individually or in the aggregate, would have a material adverse effect on our business.
Supervision and regulation
The following is a general summary of the material aspects of certain statutes and regulations applicable to FB Financial Corporation and FirstBank. These summary descriptions are not complete, and you should refer to the full text of the statutes, regulations, and corresponding guidance for more information. These statutes and regulations are subject to change, and additional statutes, regulations, and corresponding guidance may be adopted. We are unable to predict these future changes or the effects, if any, that these changes could have on our business, revenues, and financial results.
General
As a registered bank holding company, we are subject to regulation, supervision, and examination by the Board of Governors of the Federal Reserve System, or Federal Reserve, under the BHCA. In addition, as a Tennessee state-chartered bank that is not a member of the Federal Reserve System, the Bank is subject to primary regulation, supervision, and examination by the Federal Deposit Insurance Corporation, or FDIC, and the Bank’s state banking regulator, the Tennessee Department of Financial Institutions, or TDFI. Supervision, regulation, and examination of the Company and the Bank by the bank regulatory agencies are intended primarily for the protection of consumers, bank depositors and the Deposit Insurance Fund of the FDIC, rather than holders of our capital stock.
Changes as a result of the Dodd-Frank Act
As a result of the Dodd-Frank Wall Street Reform and Consumer Protection Act of 2010, or Dodd-Frank Act, the regulatory framework under which the Company and the Bank operate has changed and will continue to change substantially over the next several years. The Dodd-Frank Act brought about a significant overhaul of many aspects of the regulation of the financial services industry, addressing issues including, among others, systemic risk, capital adequacy, deposit insurance assessments, consumer financial protection, interchange fees, lending limits, mortgage lending practices, registration of investment advisers and changes among the bank regulatory agencies. In particular, we anticipate that portions of the Dodd-Frank Act that will be key to us and the Bank include, but are not limited to:
| • | The Dodd-Frank Act created the CFPB, a new federal regulatory body with broad authority to regulate the offering and provision of consumer financial products and services. The authority to examine depository institutions with $10.0 billion or less in assets, such as the Bank, for compliance with federal consumer laws remained largely with the Bank’s primary federal regulator, the FDIC. However, the CFPB may participate in examinations of smaller institutions on a “sampling basis” and may refer potential enforcement actions against such institutions to their primary regulators. While the CFPB does not have direct supervisory authority over the Company or the Bank, it nevertheless has important rulemaking, examination and enforcement authority with regard to consumer financial products and services. |
| • | The Dodd-Frank Act imposed new duties on mortgage lenders, including a duty to determine the borrower’s ability to repay the loan, and imposed a requirement on mortgage securitizers to retain a minimum level of economic interest in securitized pools of certain mortgage types and to make certain periodic reports which will be public. |
94
Table of Contents
Index to Financial Statements
| • | The Dodd-Frank Act’s Volcker Rule substantially restricted proprietary trading and investments in hedge funds or private equity funds and requires banking entities to implement compliance programs, as described further under “Other Dodd-Frank Act reforms : Volcker Rule” below. |
| • | Other provisions, including but not limited to: new limitations on federal preemption; application of new regulatory capital requirements, including changes to leverage and risk-based capital standards and changes to the components of permissible tiered capital ; changes to the assessment base for deposit insurance premiums; permanently raising the FDIC’s standard maximum deposit insurance amount to $250,000 limit for federal deposit insurance; repeal of the prohibition on the payment of interest on demand deposits, thereby permitting depository institutions to pay interest on business transaction and other accounts; restrictions on compensation, including a prohibition on incentive-based compensation arrangements that encourage inappropriate risk taking by covered financial institutions and are deemed to be excessive, or that may lead to material losses; requirement that sponsors of asset-backed securities retain a percentage of the credit risk of the assets underlying the securities; requirement that banking regulators remove references to and requirements of reliance upon credit ratings from their regulations and replace them with appropriate alternatives for evaluating credit worthiness. |
The list above is not exhaustive. It reflects our current assessment of the Dodd-Frank Act provisions and implementing rules that are reasonably possible to have a substantial impact on us in the future.
Holding company regulation
As a regulated bank holding company, we are subject to various laws and regulations that affect our business. These laws and regulations, among other matters, prescribe minimum capital requirements, limit transactions with affiliates, impose limitations on the business activities in which we can engage, limit the dividend or distributions that the Bank can pay to us, restrict the ability of institutions to guarantee our debt, impose certain specific accounting requirements on us that may be more restrictive and may result in greater or earlier charges to earnings or reductions in our capital than generally accepted accounting principles, among other things. The Bank is also subject to various requirements and restrictions under federal and state law, including but not limited to requirements to maintain reserves against deposits, lending limits, limitations on branching activities, limitations on the types of investments that may be made, activities that may be engaged in, and types of services that may be offered. Various consumer laws and regulations also affect the operations of the Bank. Also, the Bank and certain of its subsidiaries are prohibited from engaging in certain tying arrangements in connection with extensions of credit, leases or sales of property, or furnishing products or services.
Permitted activities
Under the BHCA, a bank holding company that is not a financial holding company, as discussed below, is generally permitted to engage in, or acquire direct or indirect control of more than five percent of any class of the voting shares of any company that is not a bank or bank holding company and that is engaged in, the following activities (in each case, subject to certain conditions and restrictions and prior approval of the Federal Reserve):
| • | banking or managing or controlling banks; |
| • | furnishing services to or performing services for our subsidiaries; and |
| • | any activity that the Federal Reserve determines by regulation or order to be so closely related to banking as to be a proper incident to the business of banking, including: |
| • | factoring accounts receivable; |
| • | making, acquiring, brokering or servicing loans and usual related activities; |
95
Table of Contents
Index to Financial Statements
| • | leasing personal or real property; |
| • | operating a nonbank depository institution, such as savings association; |
| • | performing trust company functions; |
| • | conducting financial and investment advisory activities; |
| • | conducting discount securities brokerage activities; |
| • | underwriting and dealing in government obligations and money market instruments; |
| • | providing specified management consulting and counseling activities; |
| • | performing selected data processing services and support services; |
| • | acting as agent or broker in selling credit life insurance and other types of insurance in connection with credit transactions; |
| • | performing selected insurance underwriting activities; |
| • | providing certain community development activities (such as making investments in projects designed primarily to promote community welfare); and |
| • | issuing and selling money orders and similar consumer-type payment instruments. |
While the Federal Reserve has found these activities in the past acceptable for other bank holding companies, the Federal Reserve may not allow us to conduct any or all of these activities, which are reviewed by the Federal Reserve on a case by case basis upon application by a bank holding company.
The Federal Reserve has the authority to order a bank holding company or its subsidiaries to terminate any of these activities or to terminate its ownership or control of any subsidiary when it has reasonable cause to believe that the bank holding company’s continued ownership, activity or control constitutes a serious risk to the financial safety, soundness or stability of it or any of its bank subsidiaries. Under the BHCA, as amended by the Gramm-Leach-Bliley Act, or GLBA, a bank holding company may also file an election with the Federal Reserve to become a financial holding company and engage in an expanded list of financial activities in addition to those described above, subject to certain eligibility requirements, including the requirement that the bank holding company be both “well capitalized” and “well managed”, as defined in the BHCA and implementing regulations. The Company has not made an election to become a financial holding company.
Acquisitions subject to prior regulatory approval
The BHCA (or, with regard to federal savings associations or savings and loan holding companies, the Home Owners’ Loan Act) requires the prior approval of the Federal Reserve for a bank holding company to acquire substantially all the assets of a bank or to acquire direct or indirect ownership or control of more than 5% of any class of the voting shares of any bank, bank holding company, savings and loan holding company or savings association, or to increase any such non-majority ownership or control of any bank, bank holding company, savings and loan holding company or savings association, or to merge or consolidate with any bank holding company.
Under the BHCA, if “well capitalized” and “well managed”, as defined under the BHCA and implementing regulations, we or any other bank holding company located in Tennessee may purchase a bank located outside of Tennessee. Conversely, a well-capitalized and well-managed bank holding company located outside of Tennessee may purchase a bank located inside Tennessee. In each case, however, restrictions may be placed on
96
Table of Contents
Index to Financial Statements
the acquisition of a bank that has only been in existence for a limited amount of time or will result in concentrations of deposits exceeding limits specified by statute. For example, Tennessee law currently prohibits a bank holding company from acquiring control of a Tennessee-based financial institution until the target financial institution has been in operation for at least three years.
Bank holding company obligations to bank subsidiaries
Under current law and Federal Reserve policy, a bank holding company is expected to act as a source of financial and managerial strength to its depository institution subsidiaries and to maintain resources adequate to support such subsidiaries, which could require us to commit resources to support the Bank in situations where additional investments in a bank may not otherwise be warranted. These situations include guaranteeing the compliance of an “undercapitalized” bank with its obligations under a capital restoration plan, as described further under “Bank regulation : Capitalization levels and prompt corrective action” below. As a result of these obligations, a bank holding company may be required to contribute additional capital to its subsidiaries in the form of capital notes or other instruments that qualify as capital under regulatory rules. Any such loan from a holding company to a subsidiary bank is likely to be unsecured and subordinated to the bank’s depositors and perhaps to other creditors of the bank. If we were to enter bankruptcy or become subject to the orderly liquidation process established by the Dodd-Frank Act, any commitment by us to a federal bank regulatory agency to maintain the capital of the Bank would be assumed by the bankruptcy trustee or the FDIC, as appropriate, and entitled to a priority of payment.
Restrictions on bank holding company dividends.
The Federal Reserve’s policy regarding dividends is that a bank holding company should not declare or pay a cash dividend which would impose undue pressure on the capital of any bank subsidiary or would be funded only through borrowing or other arrangements that might adversely affect a bank holding company’s financial position. As a general matter, the Federal Reserve has indicated that the board of directors of a bank holding company should consult with the Federal Reserve and eliminate, defer or significantly reduce the bank holding company’s dividends if:
| • | its net income available to shareholders for the past four quarters, net of dividends previously paid during that period, is not sufficient to fully fund the dividends; |
| • | its prospective rate of earnings retention is not consistent with its capital needs and overall current and prospective financial condition; or |
| • | it will not meet, or is in danger of not meeting, its minimum regulatory capital adequacy ratios. |
Should an insured depository institution controlled by a bank holding company be “significantly undercapitalized” under the applicable federal bank capital ratios, or if the bank subsidiary is “undercapitalized” and has failed to submit an acceptable capital restoration plan or has materially failed to implement such a plan, federal banking regulators (in the case of the Bank, the FDIC) may choose to require prior Federal Reserve approval for any capital distribution by the bank holding company. For more information, see “Bank regulation: Capitalization levels and prompt corrective action.”
In addition, since our legal entity is separate and distinct from the Bank and does not conduct stand-alone operations, our ability to pay dividends depends on the ability of the Bank to pay dividends to us, which is also subject to regulatory restrictions as described below in “Bank regulation: Bank dividends.”
Under Tennessee law, we are not permitted to pay cash dividends if, after giving effect to such payment, we would not be able to pay our debts as they become due in the usual course of business or our total assets would
97
Table of Contents
Index to Financial Statements
be less than the sum of our total liabilities plus any amounts needed to satisfy any preferential rights if we were dissolving. In addition, in deciding whether or not to declare a dividend of any particular size, our board of directors must consider our current and prospective capital, liquidity, and other needs.
Capital regulations (pre- January 1, 2015)
The federal banking agencies have adopted risk-based capital adequacy guidelines for banks and bank holding companies. These risk-based capital guidelines are designed to make regulatory capital requirements more sensitive to differences in risk profiles among banks and bank holding companies, to account for off-balance sheet exposure, to minimize disincentives for holding liquid assets, and to achieve greater consistency in evaluating the capital adequacy of major banks throughout the world. As described below under “U.S. Basel III capital rules,” these requirements will increase in the coming years, beginning in 2015 for the Company and the Bank.
The following pertains to the risk-based capital adequacy guidelines for banks and bank holding companies applicable to us and the Bank prior to January 1, 2015.
Under the risk-based capital guidelines, assets and off-balance sheet items are assigned to broad risk categories each with designated weights. The resulting capital ratios represent capital as a percentage of total risk-weighted assets and off-balance sheet items.
For our 2014 results, the guidelines require all bank holding companies and federally regulated banks to maintain a minimum risk-based total capital ratio equal to 8%, of which at least 4% must be Tier 1 Capital. Tier 1 Capital, which includes common shareholders’ equity, noncumulative perpetual preferred stock, and a limited amount of cumulative perpetual preferred stock and certain trust-preferred securities, less certain goodwill items and other intangible assets, is required to equal at least 4% of risk-weighted assets. The remainder, which is referred to as Tier 2 Capital, may consist of (i) an allowance for loan losses of up to 1.25% of risk-weighted assets, (ii) any excess of qualifying perpetual preferred stock, (iii) certain hybrid capital instruments, (iv) perpetual debt, (v) mandatory convertible securities, and (vi) subordinated debt and intermediate-term preferred stock in an aggregate amount up to 50% of Tier 1 Capital. Total capital is the sum of Tier 1 and Tier 2 Capital less reciprocal holdings of other banking organizations’ capital instruments, investments in unconsolidated subsidiaries and any other deductions as determined by the appropriate regulator.
In computing total risk-weighted assets under the standardized approach, bank and bank holding company assets are given risk-weights of 0%, 20%, 50% and 100%. In addition, certain off-balance sheet items are given similar credit conversion factors to convert them to asset equivalent amounts to which an appropriate risk-weight will apply. Most loans will be assigned to the 100% risk category, except for performing first mortgage loans fully secured by one- to four-family and certain multifamily residential property, which carry a 50% risk rating. Most investment securities (including, primarily, general obligation claims on states or other political subdivisions of the United States) will be assigned to the 20% category, except for municipal or state revenue bonds, which have a 50% risk weight, and direct obligations of the U.S. Treasury or obligations backed by the full faith and credit of the U.S. Government, which have a 0% risk weight. In covering off-balance sheet items, direct credit substitutes, including general guarantees and standby letters of credit backing financial obligations, are given a 100% conversion factor. Transaction-related contingencies such as bid bonds, standby letters of credit backing non-financial obligations, and undrawn commitments (including commercial credit lines with an initial maturity of more than one year) have a 50% conversion factor. Short-term commercial letters of credit are converted at 20% and certain short-term unconditionally cancelable commitments have a 0% factor.
The federal bank regulatory authorities have also adopted regulations that supplement the risk-based guidelines. These regulations generally require banks and bank holding companies to maintain a minimum level
98
Table of Contents
Index to Financial Statements
of Tier 1 Capital to average total consolidated assets less specified items, including goodwill and mortgage servicing rights, which is referred to as the leverage ratio, of 4%. Banking organizations that are experiencing or anticipating significant growth, as well as those organizations whose financial condition or operations give rise to supervisory concerns, have generally been required to maintain a higher leverage ratio.
The bank regulators also continue to consider a “tangible Tier 1 leverage ratio” in evaluating proposals for expansion or new activities. The tangible Tier 1 leverage ratio is the ratio of a banking organization’s Tier 1 Capital, less deductions for intangibles otherwise includable in Tier 1 Capital, to total tangible assets.
U.S. Basel III capital rules (effective January 1, 2015)
In July 2013, federal banking regulators, including the Federal Reserve and the FDIC, adopted the U.S. Basel Capital Rules implementing many aspects of the Basel III Capital Standards.
The U.S. Basel III Capital Rules apply to all national and state banks and savings associations and most bank holding companies and savings and loan holding companies, which we collectively refer to herein as “covered” banking organizations. The requirements in the U.S. Basel III Capital Rules started to phase in on January 1, 2015, for many covered banking organizations, including the Company and the Bank. The requirements in the U.S. Basel III Capital Rules will be fully phased in by January 1, 2019.
The U.S. Basel III Capital Rules impose higher risk-based capital and leverage requirements than those previously in place. Specifically, the rules impose the following minimum capital requirements:
| • | a new common equity Tier 1 risk-based capital ratio of 4.5%; |
| • | a Tier 1 risk-based capital ratio of 6% (increased from the current 4% requirement); |
| • | a total risk-based capital ratio of 8% (unchanged from current requirements); |
| • | a leverage ratio of 4%; and |
| • | a new supplementary leverage ratio of 3% applicable to advanced approaches banking organizations, resulting in a leverage ratio requirement of 7% for such institutions. |
Under the U.S. Basel III Capital Rules, Tier 1 Capital is redefined to include two components: common equity Tier 1 Capital and additional Tier 1 Capital. The new and highest form of capital, Common Equity Tier 1 Capital, or CET1 Capital, consists solely of common stock (plus related surplus), retained earnings, accumulated other comprehensive income, and limited amounts of minority interests that are in the form of common stock. Additional Tier 1 Capital includes other perpetual instruments historically included in Tier 1 Capital, such as non-cumulative perpetual preferred stock.
The rules permit bank holding companies with less than $15.0 billion in total consolidated assets, such as us, to continue to include trust-preferred securities and cumulative perpetual preferred stock issued before May 19, 2010 in Tier 1 Capital, but not in CET1 Capital, subject to certain restrictions. Tier 2 capital consists of instruments that currently qualify in Tier 2 capital plus instruments that the rule has disqualified from Tier 1 Capital treatment. We have outstanding trust-preferred securities, issued as debt securities. The first issue was for $21,000,000 (21,000 securities priced at $1,000 each) plus $650,000 in the related common securities, and the second issue was for $9,000,000 (9,000 securities priced at $1,000 each) plus $280,000 in the related common securities. We do not plan to use the proceeds of this offering to pay off the outstanding trust-preferred securities.
In addition, in order to avoid restrictions on capital distributions or discretionary bonus payments to executives, a covered banking organization must maintain a capital conservation buffer on top of its minimum risk-based
99
Table of Contents
Index to Financial Statements
capital requirements. This buffer must consist solely of Tier 1 Common Equity, but the buffer applies to all three measurements (Common Equity Tier 1, Tier 1 Capital and total capital). The capital conservation buffer will be phased in incrementally over time, becoming fully effective on January 1, 2019, and will consist of an additional amount of common equity equal to 2.5% of risk-weighted assets.
The current capital rules require certain deductions from or adjustments to capital. The U.S. Basel III Capital Standards retain many of these deductions and adjustments and also provide for new ones. As a result, deductions from CET1 Capital will be required for goodwill (net of associated deferred tax liabilities); intangible assets such as non-mortgage servicing assets and purchased credit card relationships (net of associated deferred tax liabilities); deferred tax assets that arise from net operating loss and tax credit carryforwards (net of any related valuations allowances and net of deferred tax liabilities); any gain on sale in connection with a securitization exposure; any defined benefit pension fund net asset (net of any associated deferred tax liabilities) held by a bank holding company (this provision does not apply to a bank or savings association); the aggregate amount of outstanding equity investments (including retained earnings) in financial subsidiaries; and identified losses. Other deductions will be necessary from different levels of capital. The U.S. Basel III Capital Rules also increase the risk weight for certain assets, meaning that more capital must be held against such assets. For example, commercial real estate loans that do not meet certain new underwriting requirements must be risk-weighted at 150% rather than the current 100%.
Additionally, the U.S. Basel III Capital Standards provide for the deduction of three categories of assets: (i) deferred tax assets arising from temporary differences that cannot be realized through net operating loss carrybacks (net of related valuation allowances and of deferred tax liabilities), (ii) mortgage servicing assets (net of associated deferred tax liabilities) and (iii) investments in more than 10% of the issued and outstanding common stock of unconsolidated financial institutions (net of associated deferred tax liabilities). The amount in each category that exceeds 10% of CET1 Capital must be deducted from CET1 Capital. The remaining, non-deducted amounts are then aggregated, and the amount by which this total amount exceeds 15% of CET1 Capital must be deducted from CET1 Capital. Amounts of minority investments in consolidated subsidiaries that exceed certain limits and investments in unconsolidated financial institutions may also have to be deducted from the category of capital to which such instruments belong.
Accumulated other comprehensive income, or AOCI, is presumptively included in CET1 Capital and often would operate to reduce this category of capital. The U.S. Basel III Capital Rules provided a one-time opportunity at the end of the first quarter of 2015 for covered banking organizations to opt out of much of this treatment of AOCI. We elected to opt out. The rules also have the effect of increasing capital requirements by increasing the risk weights on certain assets, including high volatility commercial real estate, mortgage servicing rights not includable in CET1 Capital, equity exposures, and claims on securities firms, that are used in the denominator of the three risk-based capital ratios.
When fully phased in on January 1, 2019, the U.S. Basel III Capital Rules will require the Company and the Bank to maintain (i) a minimum ratio of CET1 Capital to risk-weighted assets of at least 4.5%, plus the 2.5% capital conservation buffer, effectively resulting in a minimum ratio of CET1 Capital to risk-weighted assets of at least 7%, (ii) a minimum ratio of Tier 1 capital to risk-weighted assets of at least 6.0%, plus the capital conservation buffer, effectively resulting in a minimum Tier 1 capital ratio of 8.5%, (iii) a minimum ratio of Total capital (that is, Tier 1 plus Tier 2) to risk-weighted assets of at least 8.0%, plus the capital conservation buffer, effectively resulting in a minimum total capital ratio of 10.5% and (iv) a minimum leverage ratio of 4%, calculated as the ratio of Tier 1 capital to average assets. Management believes that the Company and the Bank would meet all capital adequacy requirements under the U.S. Basel III Capital Rules on a fully phased-in basis if such requirements were currently effective.
The U.S. Basel III Capital Rules also make important changes to the “prompt corrective action” framework discussed below in “Bank regulation: Capitalization levels and prompt corrective action.”
100
Table of Contents
Index to Financial Statements
Restrictions on affiliate transactions
See “Bank regulation: Restrictions on transactions with affiliates” below.
Compensation and risk management
In 2010, the federal banking agencies issued guidance to regulated banks and holding companies intended to ensure that incentive compensation arrangements at financial organizations take into account risk and are consistent with safe and sound practices. The guidance is based on three “key principles” calling for incentive compensation plans to: appropriately balance risks and rewards; be compatible with effective controls and risk management; and be backed up by strong corporate governance. Further, the federal banking regulators re-proposed rules that would prohibit incentive compensation arrangements that would encourage inappropriate risks by providing excessive compensation or that could lead to a material financial loss, and include certain prescribed standards for governance and risk management for incentive compensation for institutions, such as us, that have over $1 billion in consolidated assets.
Bank regulation
The Bank is a banking institution that is chartered by and headquartered in the State of Tennessee, and it is subject to supervision and regulation by the TDFI and the FDIC. The TDFI supervises and regulates all areas of the Bank’s operations including, without limitation, the making of loans, the issuance of securities, the conduct of the Bank’s corporate affairs, the satisfaction of capital adequacy requirements, the payment of dividends, and the establishment or closing of banking offices. The FDIC is the Bank’s primary federal regulatory agency, which periodically examines the Bank’s operations and financial condition and compliance with federal consumer protection laws. In addition, the Bank’s deposit accounts are insured by the FDIC to the maximum extent permitted by law, and the FDIC has certain enforcement powers over the Bank.
As a state-chartered banking institution in the State of Tennessee, the Bank is empowered by statute, subject to the limitations contained in those statutes, to take and pay interest on, savings and time deposits, to accept demand deposits, to make loans on residential and other real estate, to make consumer and commercial loans, to invest, with certain limitations, in equity securities and in debt obligations of banks and corporations and to provide various other banking services for the benefit of the Bank’s clients. Various state consumer laws and regulations also affect the operations of the Bank, including state usury laws, consumer credit and equal credit opportunity laws, and fair credit reporting. In addition, the Federal Deposit Insurance Corporation Improvement Act of 1991, or FDICIA, generally prohibits insured state chartered institutions from conducting activities as principal that are not permitted for national banks.
Capital adequacy
See “Holding company regulation: Capital regulations.”
Capitalization levels and prompt corrective action
Federal law and regulations establish a capital-based regulatory scheme designed to promote early intervention for troubled banks and require the FDIC to choose the least expensive resolution of bank failures. The capital-based regulatory framework contains five categories of regulatory capital requirements, including “well capitalized,” “adequately capitalized,” “undercapitalized,” “significantly undercapitalized,” and “critically undercapitalized.” To qualify as a “well capitalized” institution for these purposes, a bank must have a leverage ratio of no less than 5%, a Tier 1 Capital ratio of no less than 6%, and a total risk-based capital ratio of no less than 10%, and a bank must not be under any order or directive from the appropriate regulatory agency to meet
101
Table of Contents
Index to Financial Statements
and maintain a specific capital level. Generally, a financial institution must be “well capitalized” before the Federal Reserve will approve an application by a bank holding company to acquire a bank or merge with a bank holding company, and the FDIC applies the same requirement in approving bank merger applications.
Immediately upon becoming undercapitalized, a depository institution becomes subject to the provisions of Section 38 of the Federal Deposit Insurance Act, or FDIA, which: (i) restrict payment of capital distributions and management fees; (ii) require that the appropriate federal banking agency monitor the condition of the institution and its efforts to restore its capital; (iii) require submission of a capital restoration plan; (iv) restrict the growth of the institution’s assets; and (v) require prior approval of certain expansion proposals. Bank holding companies controlling financial institutions can be called upon to boost the institutions’ capital and to partially guarantee the institutions’ performance under their capital restoration plans. The appropriate federal banking agency for an undercapitalized institution also may take any number of discretionary supervisory actions if the agency determines that any of these actions is necessary to resolve the problems of the institution at the least possible long-term cost to the deposit insurance fund, subject in certain cases to specified procedures. These discretionary supervisory actions include: (i) requiring the institution to raise additional capital; (ii) restricting transactions with affiliates; (iii) requiring divestiture of the institution or the sale of the institution to a willing purchaser; (iv) requiring the institution to change and improve its management; (iv) prohibiting the acceptance of deposits from correspondent banks; (v) requiring prior Federal Reserve approval for any capital distribution by a bank holding company controlling the institution; and (vi) any other supervisory action that the agency deems appropriate. These and additional mandatory and permissive supervisory actions may be taken with respect to significantly undercapitalized and critically undercapitalized institutions.
As of June 30, 2016, the Bank had sufficient capital to qualify as “well capitalized” under the requirements contained in the applicable regulations, policies and directives pertaining to capital adequacy, and it is unaware of any material violation or alleged material violation of these regulations, policies or directives. Rapid growth, poor loan portfolio performance, or poor earnings performance, or a combination of these factors, could change the Bank’s capital position in a relatively short period of time, making additional capital infusions necessary.
Notably, the thresholds for each of the five categories for regulatory capital requirements were revised pursuant to the U.S. Basel III Capital Rules. Under these rules, which started to phase in on January 1, 2015, a well-capitalized insured depository institution is one (i) having a total risk-based capital ratio of 10 percent or greater, (ii) having a Tier 1 risk-based capital ratio of 8 percent or greater, (iii) having a CET1 capital ratio of 6.5 percent or greater, (iv) having a leverage capital ratio of 5 percent or greater and (v) that is not subject to any order or written directive to meet and maintain a specific capital level for any capital measure.
It should be noted that the minimum ratios referred to above in this section are merely guidelines, and the bank regulators possess the discretionary authority to require higher capital ratios.
Bank reserves
The Federal Reserve requires all depository institutions, even if not members of the Federal Reserve System, to maintain reserves against some transaction accounts (primarily negotiable order of withdrawal (NOW) and Super NOW checking accounts). The balances maintained to meet the reserve requirements imposed by the Federal Reserve may be used to satisfy liquidity requirements. An institution may borrow from the Federal Reserve Bank “discount window” as a secondary source of funds, provided that the institution meets the Federal Reserve Bank’s credit standards.
102
Table of Contents
Index to Financial Statements
Bank dividends
The FDIC prohibits any distribution that would result in the bank being “undercapitalized” (<4% leverage, <4.5% CET1 Risk-Based, <6% Tier 1 Risk-Based, or <8% Total Risk-Based). Tennessee law places restrictions on the declaration of dividends by state chartered banks to their shareholders, including, but not limited to, that the board of directors of a Tennessee-chartered bank may only make a dividend from the surplus profits arising from the business of the bank, and may not declare dividends in any calendar year that exceeds the total of its retained net income of that year combined with its retained net income of the preceding two (2) years without the prior approval of the TDFI commissioner. Furthermore, the TDFI also has authority to prohibit the payment of dividends by a Tennessee bank when it determines such payment to be an unsafe and unsound banking practice.
Insurance of accounts and other assessments
The Bank pays deposit insurance assessments to the Deposit Insurance Fund, which is determined through a risk-based assessment system. The Bank’s deposit accounts are currently insured by the Deposit Insurance Fund, generally up to a maximum of $250,000 per separately insured depositor. The Bank pays assessments to the FDIC for such deposit insurance. Under the current assessment system, the FDIC assigns an institution to a risk category based on the institution’s most recent supervisory and capital evaluations, which are designed to measure risk. Under the FDIA, the FDIC may terminate a bank’s deposit insurance upon a finding that the institution has engaged in unsafe and unsound practices, is in an unsafe or unsound condition to continue operations, or has violated any applicable law, regulation, rule, order, agreement or condition imposed by the FDIC.
In addition, all FDIC-insured institutions are required to pay assessments to the FDIC to fund interest payments on bonds issued by the Financing Corporation, or FICO, a federal government corporation established to recapitalize the predecessor to the Savings Association Insurance Fund. FICO assessments are set quarterly and the assessment rate was .640 (annual) basis points for all four quarters in 2013 and .620 (annual) basis points for the first two quarters of 2014. These assessments will continue until the FICO bonds mature in 2017 through 2019.
Restrictions on transactions with affiliates
The Bank is subject to sections 23A and 23B of the Federal Reserve Act, or FRA, and the Federal Reserve’s Regulation W, as made applicable to state nonmember banks by section 18(j) of the FDIA. An affiliate of a bank is any company or entity that controls, is controlled by or is under common control with the Bank, and, in our case, includes, among others, our Chairman and sole shareholder, James W. Ayers, and the various business entities he controls. Accordingly, transactions between the Bank, on the one hand, and the Company or any affiliates, on the other hand, will be subject to a number of restrictions. Sections 23A and 23B of the FRA impose restrictions and limitations on the Bank from engaging in certain types of transactions between the Bank, on the one hand, and the Company or any affiliates, on the other hand, including making extensions of credit to, or the issuance of a guarantee or letter of credit on behalf of, the Company or other affiliates, the purchase of, or investment in, stock or other securities thereof, the taking of such securities as collateral for loans, and the purchase of assets of the Company or other affiliates. Such restrictions and limitations prevent the Company or other affiliates from borrowing from the Bank unless the loans are secured by marketable obligations of designated amounts. Furthermore, such secured loans and investments by the Bank to or in the Company or to or in any other non-banking affiliate are limited, individually, to ten percent (10%) of the Bank’s capital and surplus, and such secured loans are limited in the aggregate to twenty percent (20%) of the Bank’s capital and surplus.
103
Table of Contents
Index to Financial Statements
All such transactions must be on terms that are no less favorable to the Bank than those that would be available from nonaffiliated third parties. Moreover, state banking laws impose restrictions on affiliate transactions similar to those imposed by federal law. Federal Reserve policies also forbid the payment by bank subsidiaries of management fees which are unreasonable in amount or exceed the fair market value of the services rendered or, if no market exists, actual costs plus a reasonable profit.
Financial subsidiaries
Under the GLBA, subject to certain conditions imposed by their respective banking regulators, national and state-chartered banks are permitted to form “financial subsidiaries” that may conduct financial or incidental activities, thereby permitting bank subsidiaries to engage in certain activities that previously were impermissible. The GLBA imposes several safeguards and restrictions on financial subsidiaries, including that the parent bank’s equity investment in the financial subsidiary be deducted from the bank’s assets and tangible equity for purposes of calculating the bank’s capital adequacy. In addition, the GLBA imposed new restrictions on transactions between a bank and its financial subsidiaries similar to restrictions applicable to transactions between banks and non-bank affiliates. As of June 30, 2016, the Bank did not have any financial subsidiaries.
Loans to insiders
Loans to executive officers, directors or to any person who directly or indirectly, or acting through or in concert with one or more persons, owns, controls or has the power to vote more than 10% of any class of voting securities of a bank, which the Bank refers to as “10% Shareholders,” or to any political or campaign committee the funds or services of which will benefit those executive officers, directors, or 10% Shareholders or which is controlled by those executive officers, directors or 10% Shareholders, are subject to Sections 22(g) and 22(h) of the FRA and their corresponding regulations, which is referred to as Regulation O. Among other things, these loans must be made on terms substantially the same as those prevailing on transactions made to unaffiliated individuals and certain extensions of credit to those persons must first be approved in advance by a disinterested majority of the entire board of directors. Regulation O prohibits loans to any of those individuals where the aggregate amount exceeds an amount equal to 15% of an institution’s unimpaired capital and surplus plus an additional 10% of unimpaired capital and surplus in the case of loans that are fully secured by readily marketable collateral, or when the aggregate amount on all of the extensions of credit outstanding to all of these persons would exceed the Bank’s unimpaired capital and unimpaired surplus. Section 22(g) identifies limited circumstances in which the Bank is permitted to extend credit to executive officers.
Change in control
We are a bank holding company regulated by the Federal Reserve. Subject to certain exceptions, the CIBCA and its implementing regulations require that any individual or company acquiring “control” of a bank or bank holding company, either directly or indirectly, give the Federal Reserve 60 days’ prior written notice of the proposed acquisition. If within that time period the Federal Reserve has not issued a notice disapproving the proposed acquisition, extended the period for an additional period up to 90 days or requested additional information, the acquisition may proceed. An acquisition may be made before expiration of the disapproval period if the Federal Reserve issues written notice that it intends not to disapprove the acquisition. Acquisition of 25 percent or more of any class of voting securities constitutes control, and it is generally presumed for purposes of the CIBCA that the acquisition of 10 percent or more of any class of voting securities would constitute the acquisition of control, although such a presumption of control may be rebutted.
Also, under the CIBCA, the shareholdings of individuals and companies that are deemed to be “acting in concert” would be aggregated for purposes of determining whether such holders “control” a bank or bank
104
Table of Contents
Index to Financial Statements
holding company. “Acting in concert” under the CIBCA generally means knowing participation in a joint activity or parallel action towards the common goal of acquiring control of a bank or a bank holding company, whether or not pursuant to an express agreement. The manner in which this definition is applied in individual circumstances can vary and cannot always be predicted with certainty. Many factors can lead to a rebuttable presumption of acting in concert, including where: (i) the shareholders are commonly controlled or managed; (ii) the shareholders are parties to an oral or written agreement or understanding regarding the acquisition, voting or transfer of control of voting securities of a bank or bank holding company; (iii) the shareholders are immediate family members; or (iv) both a shareholder and a controlling shareholder, partner, trustee or management official of such shareholder own equity in the bank or bank holding company.
Furthermore, under the BHCA and its implementing regulations, and subject to certain exceptions, any company would be required to obtain Federal Reserve approval prior to obtaining control of a bank or bank holding company. Control under the BHCA exists where a company acquires 25 percent or more of any class of voting securities, has the ability to elect a majority of a bank holding company’s directors, is found to exercise a “controlling influence” over a bank or bank holding company’s management and policies, and in certain other circumstances. There is a presumption of non-control for any holder of less than 5% of any class of voting securities. In addition, in 2008 the Federal Reserve issued a policy statement on equity investments in banks and bank holding companies, which sets out circumstances under which a minority investor would not be deemed to control a bank or bank holding company for purposes of the BHCA. Among other things, the 2008 policy statement permits a minority investor to hold up to 24.9% (or 33.3% under certain circumstances) of the total equity (voting and non-voting combined) and have at least one representative on the company’s board of directors (with two directors permitted under certain circumstances).
Community Reinvestment Act
The Community Reinvestment Act, or CRA, and its corresponding regulations are intended to encourage banks to help meet the credit needs of their service areas, including low and moderate-income neighborhoods, consistent with safe and sound operations. These regulations provide for regulatory assessment of a bank’s record in meeting the credit needs of its service area. Federal banking agencies are required to make public a rating of a bank’s performance under the CRA. The federal banking agencies consider a bank’s CRA rating when a bank submits an application to establish banking centers, merge, or acquire the assets and assume the liabilities of another bank. In the case of a bank holding company, the CRA performance record of all banks involved in the merger or acquisition are reviewed in connection with the filing of an application to acquire ownership or control of shares or assets of a bank or to merge with any other financial holding company. An unsatisfactory record can substantially delay, block or impose conditions on the transaction. The Bank received a satisfactory rating on its most recent CRA assessment.
Branching
The Riegle-Neal Interstate Banking and Branching Efficiency Act of 1994, or Riegle-Neal Act, provides that adequately capitalized and managed bank holding companies are permitted to acquire banks in any state. Previously, under the Riegle-Neal Act, a bank’s ability to branch into a particular state was largely dependent upon whether the state “opted in” to de novo interstate branching. Many states did not “opt-in,” which resulted in branching restrictions in those states. The Dodd-Frank Act amended the Riegle-Neal legal framework for interstate branching to permit national banks and state banks to establish branches in any state if that state would permit the establishment of the branch by a state bank chartered in that state. Under current Tennessee law, our bank may open branch offices throughout Tennessee with the prior approval of the TDFI. All branching remains subject to applicable regulatory approval and adherence to applicable legal requirements.
105
Table of Contents
Index to Financial Statements
Anti-money laundering and economic sanctions
The USA PATRIOT Act provides the federal government with additional powers to address terrorist threats through enhanced domestic security measures, expanded surveillance powers, increased information sharing and broadened anti-money laundering requirements. By way of amendments to the BSA, the USA PATRIOT Act imposed new requirements that obligate financial institutions, such as banks, to take certain steps to control the risks associated with money laundering and terrorist financing.
Among other requirements, the USA PATRIOT Act and implementing regulations require banks to establish anti-money laundering programs that include, at a minimum:
| • | internal policies, procedures and controls designed to implement and maintain the bank’s compliance with all of the requirements of the USA PATRIOT Act, the BSA and related laws and regulations; |
| • | systems and procedures for monitoring and reporting of suspicious transactions and activities; |
| • | designated compliance officer; |
| • | employee training; |
| • | an independent audit function to test the anti-money laundering program; |
| • | procedures to verify the identity of each client upon the opening of accounts; and |
| • | heightened due diligence policies, procedures and controls applicable to certain foreign accounts and relationships. |
Additionally, the USA PATRIOT Act requires each financial institution to develop a client identification program (CIP) as part of the Bank’s anti-money laundering program. The key components of the CIP are identification, verification, government list comparison, notice and record retention. The purpose of the CIP is to enable the financial institution to determine the true identity and anticipated account activity of each client. To make this determination, among other things, the financial institution must collect certain information from clients at the time they enter into the client relationship with the financial institution. This information must be verified within a reasonable time through documentary and non-documentary methods. Furthermore, all clients must be screened against any CIP-related government lists of known or suspected terrorists. Financial institutions are also required to comply with various reporting and recordkeeping requirements. The Federal Reserve and the FDIC consider an applicant’s effectiveness in combating money laundering, among other factors, in connection with an application to approve a bank merger or acquisition of control of a bank or bank holding company.
Likewise, the U.S. Department of the Treasury’s Office of Foreign Assets Control, or OFAC, is responsible for helping to ensure that United States entities do not engage in transactions with the subjects of U.S. sanctions, as defined by various Executive Orders and Acts of Congress. Currently, OFAC administers and enforces comprehensive U.S. economic sanctions programs against certain specified countries/regions. In addition to the country/region-wide sanctions programs, OFAC also administers complete embargoes against individuals and entities identified on OFAC’s list of Specially Designated Nationals and Blocked Persons (“SDN List”). The SDN List includes over 7000 parties that are located in many jurisdictions throughout the world, including in the United States and Europe. The Bank is responsible for determining whether any potential and/or existing clients appear on the SDN List or are owned or controlled by a person on the SDN List. If any client appears on the SDN List or is owned or controlled by a person or entity on the SDN List, such client’s account must be placed on hold and a blocking or rejection report, as appropriate and if required, must be filed within 10 business days with OFAC. In addition, if a client is a citizen of, has provided an address in, or is organized under the laws of any country or region for which OFAC maintains a comprehensive sanctions program, the Bank must take certain
106
Table of Contents
Index to Financial Statements
actions with respect to such clients as dictated under the relevant OFAC sanctions program. The Bank must maintain compliance with OFAC by implementing appropriate policies and procedures and by establishing a recordkeeping system that is reasonably appropriate to administer the Bank’s compliance program. The Bank has adopted policies, procedures and controls to comply with the BSA, the USA PATRIOT Act and OFAC regulations.
Regulatory enforcement authority
Federal and state banking laws grant substantial enforcement powers to federal and state banking regulators. This enforcement authority includes, among other things, the ability to assess civil money penalties, to issue cease and desist or removal orders and to initiate injunctive actions against banking organizations and “institution-affiliated parties,” such as management, employees and agents. In general, these enforcement actions may be initiated for violations of laws, regulations and orders of regulatory authorities, or unsafe or unsound practices. Other actions or inactions, including filing false, misleading or untimely reports with regulatory authorities, may provide the basis for enforcement action. When issued by a banking regulator, cease-and-desist and similar orders may, among other things, require affirmative action to correct any harm resulting from a violation or practice, including restitution, reimbursement, indemnifications or guarantees against loss. A bank may also be ordered to restrict its growth, dispose of certain assets, rescind agreements or contracts, or take other actions determined to be appropriate by the ordering regulatory agency.
Federal home loan bank system
The Bank is a member of the Federal Home Loan Bank of Cincinnati, which is one of 12 regional Federal Home Loan Banks (FHLBs). Each FHLB serves as a reserve or central bank for its members within its assigned region. It is funded primarily from funds deposited by member institutions and proceeds from the sale of consolidated obligations of the FHLB system. It makes loans to members (i.e., advances) in accordance with policies and procedures established by the board of directors of the FHLB.
As a member of the FHLB of Cincinnati, the Bank is required to own capital stock in the FHLB in an amount generally at least equal to 0.20% (or 20 basis points) of the Bank’s total assets at the end of each calendar year, plus 4.5% of its outstanding advances (borrowings) from the FHLB of Cincinnati under the activity-based stock ownership requirement. These requirements are subject to adjustment from time to time. On June 30, 2016, the Bank was in compliance with this requirement.
Privacy and data security
Under the GLBA, federal banking regulators adopted rules limiting the ability of banks and other financial institutions to disclose nonpublic information about consumers to nonaffiliated third parties. The rules require disclosure of privacy policies to consumers and, in some circumstances, allow consumers to prevent disclosure of certain personal information to nonaffiliated third parties. The GLBA also directed federal regulators, including the FDIC, to prescribe standards for the security of consumer information. The Bank is subject to such standards, as well as standards for notifying clients in the event of a security breach.
Consumer laws and regulations
The Bank is also subject to other federal and state consumer laws and regulations that are designed to protect consumers in transactions with banks. While the list set forth below is not exhaustive, these laws and regulations include the Truth in Lending Act, the Truth in Savings Act, the Electronic Funds Transfer Act, the Expedited Funds Availability Act, the Check Clearing for the 21st Century Act, the Fair Credit Reporting Act, the Fair Debt Collection Practices Act, the Equal Credit Opportunity Act, the Fair Housing Act, the Home Mortgage
107
Table of Contents
Index to Financial Statements
Disclosure Act, the Fair and Accurate Transactions Act, the Servicemembers Civil Relief Act, the Military Lending Act, the Mortgage Disclosure Improvement Act, and the Real Estate Settlement Procedures Act, among others. These laws and regulations mandate certain disclosure requirements and regulate the manner in which financial institutions must deal with consumers when offering consumer financial products and services.
Rulemaking authority for these and other consumer financial protection laws transferred from the prudential regulators to the CFPB on July 21, 2011. In some cases, regulators such as the Federal Trade Commission and the U.S. Department of Justice also retain certain rulemaking or enforcement authority. The CFPB also has broad authority to prohibit unfair, deceptive and abusive acts and practices (UDAAP), and to investigate and penalize financial institutions that violate this prohibition. While the statutory language of the Dodd-Frank Act sets forth the standards for acts and practices that violate the prohibition on UDAAP, certain aspects of these standards are untested, and thus it is currently not possible to predict how the CFPB will exercise this authority. In addition, consumer compliance examination authority remains with the prudential regulators for smaller depository institutions ($10 billion or less in total assets).
The Dodd-Frank Act also authorized the CFPB to establish certain minimum standards for the origination of residential mortgages, including a determination of the borrower’s ability to repay. Under the Dodd-Frank Act, financial institutions may not make a residential mortgage loan unless they make a “reasonable and good faith determination” that the consumer has a “reasonable ability” to repay the loan. The act allows borrowers to raise certain defenses to foreclosure but provides a full or partial safe harbor from such defenses for loans that are “qualified mortgages.” On January 10, 2013, the CFPB published final rules to, among other things, specify the types of income and assets that may be considered in the ability-to-repay determination, the permissible sources for verification, and the required methods of calculating the loan’s monthly payments. Since then the CFPB made certain modifications to these rules. The rules extend the requirement that creditors verify and document a borrower’s “income and assets” to include all “information” that creditors rely on in determining repayment ability. The rules also provide further examples of third-party documents that may be relied on for such verification, such as government records and check-cashing or funds-transfer service receipts. The new rules were effective beginning on January 10, 2014. The rules also define “qualified mortgages,” imposing both underwriting standards—for example, a borrower’s debt-to-income ratio may not exceed 43%—and limits on the terms of their loans. Points and fees are subject to a relatively stringent cap, and the terms include a wide array of payments that may be made in the course of closing a loan. Certain loans, including interest-only loans and negative amortization loans, cannot be qualified mortgages.
Other Dodd-Frank Act reforms
Volcker Rule
The Volcker Rule generally prohibits a “banking entity” (which includes any insured depository institution, such as the Bank, or any affiliate or subsidiary of such depository institution, such as the Company) from (i) engaging in proprietary trading and (ii) acquiring or retaining any ownership interest in, sponsoring, or engaging in certain transactions with, a “covered fund”. Both the proprietary trading and covered fund-related prohibitions are subject to a number of exemptions and exclusions. The Volcker Rule became effective by statute in July 2012, and on December 10, 2013, five federal regulators including the FDIC and the Federal Reserve jointly adopted the final regulations to implement the Volcker Rule. The final regulations contain exemptions for, among others, market making, risk-mitigating hedging, underwriting, and trading in U.S. government and agency obligations and also permit certain ownership interests in certain types of funds to be retained. They also permit the offering and sponsoring of funds under certain conditions. In addition, the final regulations impose significant compliance and reporting obligations on banking entities.
108
Table of Contents
Index to Financial Statements
The final regulations became effective on April 1, 2014, and banking entities were required to conform their proprietary trading activities and investments in and relationships with covered funds that were in place after December 31, 2013 by July 21, 2015. For those banking entities whose investments in and relationships with covered funds were in place prior to December 31, 2013 (“legacy covered funds”), the Volcker Rule conformance period was recently extended by the Federal Reserve to July 21, 2017 for such legacy covered funds. In addition, the Federal Reserve has also indicated its intention to grant two additional one-year extensions of the conformance period to July 21, 2017, for banking entities to conform ownership interests in and sponsorship of activities of collateralized loan obligations, or CLOs, that are backed in part by non-loan assets and that were in place as of December 31, 2013.
Executive compensation and corporate governance
The Dodd-Frank Act requires public companies to include, at least once every three years, a separate non-binding “say on pay” vote in their proxy statement by which shareholders may vote on the compensation of the public company’s named executive officers. In addition, if such public companies are involved in a merger, acquisition, or consolidation, or if they propose to sell or dispose of all or substantially all of their assets, shareholders have a right to an advisory vote on any golden parachute arrangements in connection with such transaction (frequently referred to as “say-on-golden parachute” vote). Other provisions of the act may impact our corporate governance. For instance, the act requires the SEC to adopt rules prohibiting the listing of any equity security of a company that does not have an independent compensation committee; and requiring all exchange-traded companies to adopt clawback policies for incentive compensation paid to executive officers in the event of accounting restatements based on material non-compliance with financial reporting requirements.
Future legislative developments
Various legislative acts are from time to time introduced in Congress and the Tennessee legislature. This legislation may change banking statutes and the environment in which we operate in substantial and unpredictable ways. We cannot determine the ultimate effect that potential legislation, if enacted, or implementing regulations and interpretations with respect thereto, would have our financial condition or results of operations.
109
Table of Contents
Index to Financial Statements
Management’s discussion and analysis of financial condition and results of operations
The following discussion and analysis of our financial condition and results of operations should be read in conjunction with “Selected historical consolidated financial data” and our consolidated financial statements and the accompanying notes included elsewhere in this prospectus. This discussion and analysis contains forward-looking statements that are subject to certain risks and uncertainties and are based on certain assumptions that we believe are reasonable but may prove to be inaccurate. Certain risks, uncertainties and other factors, including those set forth under “Risk factors,” “Cautionary note regarding forward-looking statements” and elsewhere in this prospectus, may cause actual results to differ materially from those projected results discussed in the forward-looking statements appearing in this discussion and analysis. We assume no obligation to update any of these forward-looking statements.
Overview
We are a bank holding company headquartered in Nashville, Tennessee. We operate primarily through our wholly-owned bank subsidiary, FirstBank, the third largest bank headquartered in Tennessee, based on total assets. FirstBank provides a comprehensive suite of commercial and consumer banking services to clients in select markets in Tennessee, North Alabama, and North Georgia. Our footprint includes 45 full-service bank branches serving the following MSAs Nashville, Chattanooga, Knoxville, Memphis, Jackson, and Huntsville (AL) and 12 community markets throughout Tennessee. FirstBank also provides mortgage banking services utilizing its bank branch network and mortgage banking offices strategically located throughout the southeastern United States and national internet delivery channel.
We operate through two segments, community banking and mortgage banking. We generate most of our revenue in our community banking segment from interest on loans and investments, loan-related fees, mortgage originations, investment services and deposit-related fees and, in our mortgage banking segment, from origination fees and gains on sales in the secondary market of mortgage loans that we originate outside our community banking footprint or through our internet delivery channels and from servicing. Our primary source of funding for our loans is deposits, and to a lesser extent Federal Home Loan Bank advances and other borrowings.
The following discussion and analysis is intended to assist readers in their analysis and understanding of our consolidated financial statements and selected financial information appearing in this prospectus and should be read in conjunction therewith. This discussion and analysis presents our financial condition and results of operations on a consolidated basis, unless otherwise specified.
Acquisition of Northwest Georgia Bank
On September 18, 2015, we completed our acquisition of Northwest Georgia Bank, which we refer to as NWGB, pursuant to the Agreement and Plan of Merger dated April 27, 2015. We acquired the stock of NWGB for $1.5 million in cash. NWGB was a 110-year old institution with six branches, serving clients in Chattanooga, Tennessee MSA, including northern Georgia. We acquired net assets with a fair value of approximately $272 million, which includes a bargain purchase gain of $2.8 million, loans with a fair value of approximately $79 million, and assumed liabilities of approximately $268 million, including deposits with a fair value of approximately $246 million. At the acquisition date, $4.9 million of core deposit intangible assets were recorded.
Our balance sheet as of December 31, 2015 and June 30, 2016 reflects the assets and liabilities we acquired from NWGB. Our results of operations for the year ended December 31, 2015 and the six months ended June 30,
110
Table of Contents
Index to Financial Statements
2016 reflect our operation of NWGB from September 18, 2015 through the end of the year and the full six month period, which did not materially impact our results of operation for the year ended December 31, 2015. Additionally, we recorded merger and conversion related charges totaling $2.1 million and $3.5 million for the six months ended June 30, 2016 and the year ended December 31, 2015, respectively. The acquisition of NWGB is not significant for financial statement reporting purposes. See Note 2, “Acquisition of Northwest Georgia Bank” in the Notes to the consolidated financial statements for additional details regarding the acquisition.
Key factors affecting our business
Economic conditions
Our business and financial performance are affected by economic conditions generally in the United States and more directly in the markets where we primarily operate. The significant economic factors that are most relevant to our business and our financial performance include the general economic conditions in the U.S. and in our markets, unemployment rates, real estate markets and interest rates.
The United States economy expanded by 1.2% at an annual rate in the second quarter of 2016, due primarily to positive contributions from personal consumption expenditures (PCE), nonresidential fixed income, residential fixed investment, and state and local government spending. This expansion follows the growth experienced in 2014, which followed modest growth in 2013. Unemployment rates decreased slightly, following a pattern of continuous decline. According to the U.S. Bureau of Labor Statistics, the seasonally adjusted unemployment rate at June 30, 2016 was 4.9% compared to 5.0% at December 30, 2015, 5.6% at December 31, 2014, 6.7% at December 31, 2013 and 7.9% for December 31, 2012. The Federal Reserve Board has maintained very accommodative monetary policy conditions through a 25 basis points to 50 basis points federal funds target, and quantitative easing programs designed to reduce longer tenor rates. Interest rates remain low by historical standards, but are expected to increase, and general economic conditions are supportive of growth.
Existing home sales in the United States, as indicated by the National Association of Realtors, showed solid growth to a seasonally adjusted annual rate of 5.6 million as of June 30, 2016, compared to the rolling twelve months ended 5.3 million as of December 31, 2015, 4.9 million for the rolling twelve months ended December 31, 2014 and 5.1 million for the rolling twelve months ended December 31, 2013. New home sales have increased to a seasonally adjusted annual rate of 592 thousand as of June 2016, from 538 thousand as of December 31, 2015, 492 thousand for the year ended December 31, 2014 as well as increased compared to 441 thousand for the year ended December 31, 2013. Home values, as indicated by the seasonally adjusted Case-Shiller 20 city index, showed an increase of 5.24% from May 31, 2015 to May 31, 2016. Bankruptcy filings, per the U.S. Court Statistics, also improved with total filings down 8.5% for the year ended December 31, 2015, compared to the same period in 2014, with business filings down 5.4% and personal filings down 9.4%, for the year ending December 31, 2015, compared to the same period in 2014.
According to the Beige Book published by the Federal Reserve Board in July 2016, overall economic activity in the Sixth Federal Reserve District (which includes Florida, Georgia, Tennessee, Alabama and parts of Mississippi and Louisiana) remains positive as most businesses anticipate higher growth in the near term. Reports across sectors were mostly optimistic and most business contacts expect modest near-term growth. Retailer reports were mixed, with soft sales from international visitors and strong domestic results. Merchants expect sales to remain relatively flat over the next few months. Hospitality contacts experienced slightly softer activity and expect the trend to continue through the summer. Home sales were positive, with steady growth and an uptick in construction activity that is expected to continue. Commercial real estate activity improved modestly on the whole, but varies by metropolitan area. Manufacturers reported slower business activity, with new orders and production levels markedly lower. Bankers noted continuing availability of credit and an improved credit quality among borrowers. Hiring grew at a modest pace for most sectors, with some difficulty in finding workers in
111
Table of Contents
Index to Financial Statements
high-demand fields including information technology, transportation, healthcare, compliance and construction. Oil and gas firms continued with layoffs due to low prices. Businesses reported non-labor cost increases and modest wage growth.
The economy in the state of Tennessee continued to see improvements as well, according to the U.S. Bureau of Economic Analysis. The unemployment rate, as indicated by the U.S. Bureau of Labor Statistics, improved to 4.1% as of June 30, 2016, down from 5.7% of June 30, 2015. Nashville continued to maintain a stable unemployment rate of 4.0% as of June 30, 2016, down from 4.2% as of December 31, 2015 and 4.8% as of December 31, 2014.
Interest rates
Net interest income is the largest contributor to our net income and is the difference between the interest and fees earned on interest-earning assets (usually loans and investment securities) and the interest expense incurred in connection with interest-bearing liabilities (usually deposits and borrowings). The level of net interest income is primarily a function of the average balance of interest-earning assets, the average balance of interest-bearing liabilities and the spread between the yield on such assets and the rate on such liabilities. These factors are influenced by both the pricing and mix of interest-earning assets and interest-bearing liabilities which, in turn, are impacted by external factors such as local economic conditions, competition for loans and deposits, the monetary policy of the Federal Reserve Board and market interest rates.
The cost of our deposits and short-term wholesale borrowings is largely based on short-term interest rates, which are primarily driven by the Federal Reserve Board’s actions. The yields generated by our loans and securities are typically driven by short-term and long-term interest rates, which are set by the market or, at times, by the Federal Reserve Board’s actions. The level of net interest income is therefore influenced by movements in such interest rates and the pace at which such movements occur. Since 2012, short-term and long-term interest rates have remained at very low levels by historical standards, with many benchmark rates, such as the federal funds rate and one- and three-month LIBOR, near zero. Further declines in the yield curve or a decline in longer-term yields relative to short-term yields (a flatter yield curve) would have an adverse impact on our net interest margin and net interest income.
The Federal Reserve Board continues to maintain a highly accommodative monetary policy, and we expect interest rates to remain relatively low throughout 2016. However, the low interest rate environment likely will not continue in the long term. Continued rate increases may have the effect of decreasing our mortgage origination and our general mortgage banking profitability. For additional information regarding our interest rate risks factors and management, see “Risk management: Interest rate sensitivity” in this section below and “Risk factors: Risks related to our business.”
Credit trends
We focus on originating quality loans and have established loan approval policies and procedures to assist us in upholding the overall credit quality of our loan portfolio. However, credit trends in the markets in which we operate and in our loan portfolio can materially impact our financial condition and performance and are primarily driven by the economic conditions in our markets.
Credit quality improved during 2015 compared to 2014 and 2013 largely driven by the improvement in the macro-economic factors discussed above. This improvement in credit quality led to a decline in the level of our nonperforming assets and classified loans. Our nonperforming assets for the year ended December 31, 2015 were $20.5 million, decreasing from $26.1 million and $38.9 million for the years ended December 31, 2014 and 2013, respectively. The percentage of total nonperforming loans to loans also decreased to 0.71% for the year
112
Table of Contents
Index to Financial Statements
ended December 31, 2015, compared against 1.21% and 2.12% for 2014 and 2013, respectively. Our classified loans, excluding loans acquired in connection with the acquisition of NWGB, also improved due to favorable credit trends, decreasing our total substandard loans to $27.1 million and $46.0 million at December 31, 2015 and 2014, respectively, while loans totaling $64.6 million were classified substandard at December 31, 2013.
Overall credit trends continued to build on the improvements in 2015 into the first half of 2016, with nonperforming assets and substandard loans decreasing to $18.3 million and $41.7 million in the first half of 2016, as compared to $20.5 million and $48.5 million as of December 31, 2015, respectively. The percentage of total nonperforming loans to loans decreased in the first half of 2016 to 0.66% from 0.71% as of December 31, 2015.
Although we have recently experienced favorable credit trends through 2015 and currently expect these trends to continue through the remainder of 2016, we are sensitive to credit quality risks in our commercial real estate, commercial and industrial, and construction loan portfolios due to our concentration of loans in these categories. For additional information regarding credit quality risk factors for our Company, see “Risk management: Credit risk” in this section below and “Risk factors: Risks related to our business.”
Competition
Our profitability and growth are affected by the highly competitive nature of the financial services industry. We compete with commercial banks, savings banks, credit unions, non-bank financial services companies and other financial institutions operating within the areas we serve, particularly with national and regional banks that often have more resources than we do to invest in growth and technology and community banks with strong local ties, all of which target the same clients we do. Recently, we have seen increased competitive pressures on loan rates and terms and increased competition for deposits. Continued loan pricing pressure may continue to affect our financial results in the future.
For additional information, see “Business: Our markets,” “Business: Competition” and “Risk factors: Risks related to our business.”
Regulatory trends
We are subject to extensive regulation and supervision, which continue to evolve as the legal and regulatory framework governing our operations continues to change. The current operating environment also has heightened supervisory expectations in areas such as consumer compliance, the Bank Secrecy Act and anti-money laundering compliance, risk management and internal audit. As a result of these heightened expectations, we expect to incur additional costs for additional compliance, risk management and audit personnel or professional fees associated with advisors and consultants.
As described further under “Business: Supervision and regulation,” we are subject to a variety of laws and regulations, including the Dodd-Frank Act. The Dodd-Frank Act is complex, and many aspects of it are subject to final rulemaking that continues to emerge. Implementation of the Dodd-Frank Act will continue to impact our earnings through higher compliance costs and imposition of new restrictions on our business. The Dodd-Frank Act may also continue to have a material adverse impact on the value of certain assets and liabilities held on our balance sheet. The ultimate impact of the Dodd-Frank Act on our business will depend on regulatory interpretation and rulemaking as well as the success of any of our actions to mitigate the negative impacts of certain provisions. Key parts of the Dodd-Frank Act that will specifically impact our business include the repeal of a previous prohibition against payment of interest on demand deposits, the implementation of the Basel III capital adequacy standards, a change in the basis for FDIC deposit insurance assessments, substantial revisions to the regulatory regime applicable to the mortgage market, and enhanced emphasis on consumer protection generally.
See also “Risk factors: Risks related to the business environment and our industry.”
113
Table of Contents
Index to Financial Statements
Factors affecting comparability of financial results
S Corporation status
Since 2001, we have elected to be taxed for U.S. federal income tax purposes as an S Corporation. As a result, our net income has not been subject to, and we have not paid, U.S. federal income tax, and we have not been required to make any provision or recognize any liability for U.S. federal income tax in our financial statements. While we are not subject to and have not paid U.S. federal income tax, we are subject to, and have paid, Tennessee state excise tax. The consummation of this offering will result in the termination of our status as an S Corporation and in our taxation as a C Corporation for U.S. federal income tax purposes following this offering. Upon the termination of our status as an S Corporation, we will commence paying U.S. federal income tax on our pre-tax net income for each year (including the short year beginning on the date our status as an S Corporation terminates), and our financial statements will reflect a provision for U.S. federal income tax. As a result of this change, the net income and earnings per share data presented in our historical financial statements and the other financial information set forth in this prospectus (unless otherwise specified), which do not include any provision for U.S. federal income tax, will not be comparable with our future net income and earnings per share in periods after we commence to be taxed as a C Corporation, which will be calculated by including a provision for U.S. federal income tax.
The termination of our status as an S Corporation may also affect our financial condition and cash flows. Historically, we have made quarterly cash distributions to our shareholder in amounts estimated by us to be sufficient for him to pay his estimated individual U.S. federal income tax liability resulting from our taxable income that was “passed through” to him. However, these distributions have not been consistent, as sometimes the distributions have been in excess of the shareholder’s estimated individual U.S. federal income tax liability resulting from his ownership of our shares. In addition, these estimates have been based on individual U.S. federal income tax rates, which may differ from the rates imposed on the income of C Corporations. Once our status as an S Corporation terminates, no income will be “passed through” to any shareholders, but, as noted above, we will commence paying U.S. federal income tax. However, the amounts that historically we have distributed to the shareholder are not indicative of the amount of U.S. federal income tax that we will be required to pay after we commence to be taxed as a C Corporation. Depending on our effective tax rate and our future dividend rate, our future cash flows and financial condition could be positively or adversely affected compared to our historical cash flows and financial condition.
Furthermore, deferred tax assets and liabilities will be recognized for the future tax consequences attributable to differences between the financial statement carrying amounts of our existing assets and liabilities and their respective tax bases. Deferred tax assets and liabilities are measured using tax rates expected to apply to taxable income in the years in which those temporary differences are expected to be recovered or settled. The effect on deferred tax assets and liabilities of the change in tax rates resulting from becoming a C Corporation will be recognized in income in the quarter such change takes place. This difference between the financial statement carrying amounts of assets and liabilities and their respective tax bases would have been recorded as a net deferred tax liability of $15.1 million if it had been recorded on our balance sheet as of June 30, 2016, as a net deferred tax liability of $4.3 million if it had been recorded on our balance sheet as of December 31, 2015, as a net deferred tax asset of $5.2 million if it had been recorded on our balance sheet as of December 31, 2014 and as a net deferred tax asset of $11.4 million if it had been recorded on our balance sheet as of December 31, 2013.
Public company costs
Following the completion of this offering, we expect to incur additional costs associated with operating as a public company, hiring additional personnel, enhancing technology and expanding our capabilities. We expect
114
Table of Contents
Index to Financial Statements
that these costs will include legal, regulatory, accounting, investor relations and other expenses that we did not incur as a private company. Sarbanes-Oxley, as well as rules adopted by the U.S. Securities and Exchange Commission, or SEC, the FDIC and national securities exchanges requires public companies to implement specified corporate governance practices that are currently inapplicable to us as a private company. In addition, due to regulatory changes in the banking industry and the implementation of new laws, rules and regulations, we will be subject to higher regulatory compliance costs. These additional rules and regulations will increase our legal, regulatory, accounting and financial compliance costs and will make some activities more time-consuming.
Overview of recent financial performance
Results of operation
Our financial performance over the last three years primarily reflects the success of our growth strategies and the continued economic improvement in our markets, as described above. As a result, we have improved our net income and profitability over each of the last three years. Our net income increased by 47.4% in 2015 to $47.9 million from $32.5 million in 2014. This increase followed a 20.8% increase in net income in 2014 from net income of $26.9 million in 2013. Our net income represented a return on average assets, or ROAA, of 1.86%, 1.40% and 1.22% and in 2015, 2014 and 2013, respectively, and a return on average shareholder’s equity, or ROAE, of 20.91%, 15.94%, and 13.98% in 2015, 2014 and 2013, respectively. Our ratio of average shareholder’s equity to average assets in 2015, 2014 and 2013 was 8.88%, 8.81% and 8.73% respectively.
These positive trends continued in the first half of 2016, as our net income increased by 33.5% to $30.4 million from $22.8 million during the first half of 2015. Our net income represented a ROAA of 2.11% and 1.86% for the six months ended June 30, 2016 and 2015, respectively, and a ROAE of 23.94% and 20.46% for the same periods. Our ratio of average shareholder’s equity to average assets in the six months ended June 30, 2016 and 2015 was 8.82% and 9.09%, respectively.
The improvement in net income has resulted from growth in both our net interest income and noninterest income, and enhanced by consistently improved net interest margins. Net interest income increased to $93.9 million in 2015 compared to $83.4 million in 2014 and $75.5 million for 2013. The increases in net interest income were attributable to loan growth, due to strong demand for our loan products and the success of our growth initiatives, including our continued expansion in the Nashville MSA and the hiring of additional bankers, and reductions in our cost of funds, due in part to our efforts to grow our noninterest bearing deposits. Our acquisition of NWGB also contributed approximately $2.0 million to net interest income in 2015. Noninterest income for 2015 compared to 2014 increased by $41.6 million, or 81.8%, primarily due to the growth of our mortgage banking business resulting from our growth initiatives and the favorable interest rate environment. Our acquisition of NWGB also contributed approximately $1.0 million to the increase. This followed a 22.8% increase in noninterest income in 2014 from noninterest income of $41.4 million in 2013. Our net interest margin, on a tax-equivalent basis, has consistently improved over the last three years, increasing to 3.97% in 2015 as compared to 3.93% in 2014 and 3.75% in 2013. Our ongoing efforts to reduce our cost of funds helped to drive the consistent improvement in our net interest margin, along with our loan growth and lower level of borrowings. Net income in 2014 was also favorably impacted by an increase of $2.0 million in gains on sales of securities. Net interest margin on a tax-equivalent basis is a non-GAAP financial measure. See our reconciliation of non-GAAP financial measures to their most directly comparable GAAP financial measures under the caption “Selected historical consolidated financial data: GAAP reconciliation and management explanation of non-GAAP financial measures.”
In the first half of 2016, net interest income increased to $54.3 million compared to $44.4 million in the first half of 2015, which was attributable to an increase in interest income, primarily driven by higher loan balances,
115
Table of Contents
Index to Financial Statements
and lower interest expense, primarily due to the success of our initiatives to grow our low-cost deposits and our acquisition of NWGB, including recognized accretion of the credit discount taken in purchase accounting of $2.4 million in the six months ended June 30, 2016. Noninterest income for the first half of 2016 compared to the first half of 2015 increased by $28.17 million, or 68.3%, primarily due to increased mortgage banking income driven by the continued growth of our mortgage banking business and expansion into new delivery channels. Our net interest margin, on a tax-equivalent basis, increased to 4.20% as compared to 4.02% for the six months ended June 30, 2016 and 2015, respectively, due to our continued efforts to reduce our cost of funds, loan growth and increase in loan fees and accretion associated with the acquisition of the NWGB loan portfolio.
Noninterest expense increased to $138.5 million for 2015 compared to $102.2 million and $89.6 million for 2014 and 2013, respectively. The increases primarily reflect higher personnel costs, including commissions and other compensation associated with higher head count resulting from growth in our metropolitan markets and the expansion of our mortgage banking businesses. Our acquisition of NWGB also contributed approximately $1.7 million to the overall increase. Noninterest expense also increased to $91.9 million for the six months ended June 30, 2016 compared to $61.0 million for the six months ended June 30, 2015, reflecting continued increases in personnel costs associated with our growth.
Financial condition
Our total assets grew by 19.4% in 2015 to $2.90 billion at December 31, 2015 as compared to $2.43 billion at December 31, 2014. Total assets at December 31, 2013 were $2.26 billion. Additionally, loans increased by 20.2% in 2015 to $1.70 billion at December 31, 2015, driven largely by strong demand in our markets and our growth initiatives and complemented by our acquisition of NWGB which contributed $76.6 million to our loan growth. Loans were $1.42 billion at December 31, 2014, which followed a 5.6% increase in loans in 2014 from loans of $1.34 billion at December 31, 2013. These trends continued in the first half of 2016, with loans increasing by 2.8% to $1.75 billion at June 30, 2016 as compared to December 31, 2015.
In 2015, we grew total deposits by 26.8% to $2.44 billion and noninterest bearing deposits by 43.0% to $627.0 million at December 31, 2015 from $1.92 billion and $438.4 million, respectively, at December 31, 2014. Total deposits and noninterest bearing deposits as of December 31, 2013 were $1.80 billion and $356.8 million, respectively. Noninterest bearing deposits as a percentage of total deposits increased to 25.7% at December 31, 2015 from 22.8% and 19.8% at December 31, 2014 and 2013, respectively, due in part to our continued focus on reducing our cost of funds by growing noninterest bearing deposits from commercial and other clients, including as a result of the growth of our cash management services. The acquisition of NWGB contributed 10.4%, or $253.1 million, and 7.5%, or $46.8 million, of the total deposit growth and noninterest bearing deposit growth, respectively, from December 31, 2014 to December 31, 2015. Noninterest bearing deposits as a percentage of total deposits also increased to 25.7% at December 31, 2015 from 22.8% at December 31, 2014. These trends continued in the first half of 2016, with total deposits growing by 3.1% to $2.51 billion as compared to December 31, 2015. Noninterest bearing deposits as a percentage of total deposits increased to 27.1% during the first half of 2016 from 25.7% at December 31, 2015.
Business segment highlights
As discussed, we operate our business in two business segments: community banking and mortgage banking. Both of these segments are impacted by the same key factors discussed above, with our mortgage banking segment being more sensitive to changes in interest rates. See Note 21, “Segment Reporting,” in the notes to our consolidated financial statements for a description of these business segments.
During the first quarter of 2016, management evaluated the current composition of its operating segments – Community Banking and Mortgage Banking. The primary focus of the evaluation was on capturing all of the
116
Table of Contents
Index to Financial Statements
revenue and expenses from all customer activities within the Community Banking segment’s geographic footprint. Specifically, the primary product and service that was not previously captured by the Community Banking segment related to our retail mortgage origination activities occurring within our banking geographic footprint and typically within our existing branch network. Therefore, we have reclassified the revenue and associated expenses from the retail mortgage origination activities within the banking geographic footprint into the Community Banking segment from the Mortgage Banking segment for all periods presented. Based on the review and evaluation of the revised information, our chief executive officer believes that this presentation better presents the results of each segment to enhance overall resource allocation and evaluation of the Company’s performance. Additionally, we believe that the revised results of the Community Banking segment become more comparable to other banking organizations for analysis and understanding of the Community Banking segment operating results.
As discussed above, the mortgage retail origination activities within the community banking segment contributed the following to community banking segment results:
| Six Months
Ended June 30, |
Year Ended December 31, | |||||||||||||||||||
| 2016 | 2015 | 2015 | 2014 | 2013 | ||||||||||||||||
| Mortgage banking income |
$ | 13,359 | $ | 8,352 | $ | 18,718 | $ | 8,958 | 5,270 | |||||||||||
| Noninterest expense |
8,015 | 4,390 | 13,189 | 8,551 | 5,194 | |||||||||||||||
Additionally, the retail mortgage product mix within our community banking segment was as follows:
| Six Months Ended June 30, 2016 | Year Ended December 31, 2015 |
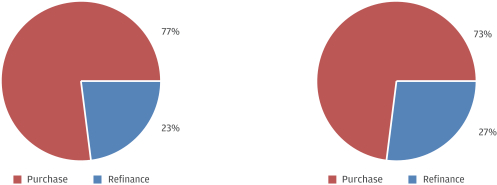
Community banking
Income before taxes increased by $9.8 million, or 47.8% in the six months ended June 30, 2016 to 30.4 million as compared to $20.6 million in the six months ended June 30, 2015. The increase reflects an improvement of $11.4 million in net interest income due to higher average loan balances driven by an improved credit environment, the overall economic climate and the implementation of our growth initiatives in addition to our acquisition of NWGB. Noninterest expense increased $12.4 million, primarily due to the investment in new branch locations and banking teams in the Nashville market and operating of NWGB for the entire period.
Income before taxes increased by $9.8 million, or 28.9%, in 2015 to $44.0 million as compared to $34.1 million in 2014. The increase reflects a $9.2 million increase in net interest income resulting from higher average loan balances outstanding during the year and overall loan origination volume driven by improved credit quality, the overall economic climate and our growth initiatives. Noninterest income increased $12.3 to $41.0 million in 2015, which includes a $2.8 million bargain purchase gain. These earnings increases were partially offset by
117
Table of Contents
Index to Financial Statements
increased noninterest expense of $12.0 million primarily due to the investment in new branch locations and banking teams in the Nashville and Huntsville markets.
Income before taxes increased by $6.1 million, or 21.8%, in 2014 to $34.1 million as compared to $28.0 million in 2013. The increase reflects an $8.1 million increase in net interest income resulting from higher average loan balances outstanding during the year and overall loan origination volume driven by improved credit quality, the overall economic climate and our growth initiatives. Continued improvement in asset quality and collections of previously charged-off loans resulted in a $2.7 million reversal of the loan loss provision in 2014 compared to a reversal of $1.5 million in 2013, increasing income before taxes by $1.2 million year over year. Noninterest income increased to $28.6 million driven primarily by a $2.0 million increase in gains on sales of securities in 2014. These earnings increases were partially offset by increased noninterest expense of $9.2 million related primarily to additional personnel and occupancy costs resulting from our growth initiative.
Mortgage banking
Income before taxes from the mortgage banking segment decreased $1.7 million in the six months ended June 30, 2016 to $2.2 million as compared to $3.9 million in the six months ended June 30, 2015. This decrease is primarily due to impairment of mortgage servicing rights during the period of $5.7 million, which is partially offset by increases in overall loan origination volume in our mortgage banking segment driven by a favorable interest rate environment and housing market. Loan originations increased $484.1 million for the six months ended June 30, 2016 to $1,762.1 million as compared to $1,278.0 million for the six months ended June 30, 2015. Noninterest income increased $18.3 million to $41.3 million for the six months ended June 30, 2016 as compared to $22.9 for the six months ended June 30, 2015, reflecting the significant increased activity in loan originations and sales. The increase in noninterest income was offset by an $18.5 million increase in noninterest expense, which includes the one-time impairment of mortgage servicing rights mentioned above.
Income before taxes from the mortgage banking segment increased significantly for the year ended 2015 to $6.9 million as compared to $631 thousand in 2014. This increase in income before taxes was primarily driven by increases in loan origination volume within our retail mortgage channel outside of our community banking footprint, third party origination and consumer direct internet delivery channels. The increase in loan origination volume within our retail mortgage channel outside of our community banking footprint and third party origination channels is primarily the result of the hiring of experienced loan officers in each of these channels to expand our market reach and penetration as well as increases in overall loan originations across our markets, driven by a favorable interest rate environment and housing market. Loan originations from our consumer direct internet channel benefitted from organic growth since 2014, as well as the general increase in loan origination volumes. The amount of mortgages originated to be sold increased to $2,757.5 million in 2015 compared to $1,156.2 million in 2014, due to the reasons discussed above. Increased profit margins were a secondary driver of improved earnings. Net interest income increased $1.3 million and noninterest income increased $29.3 million, reflecting the significant increased activity in loan originations and sales. The increase in noninterest income was offset by a $24.4 million increase in noninterest expenses primarily as a rule of increased personnel and occupancy cost related to the loan origination growth noted above, increased variable compensation costs and expenses related to the consumer direct delivery channel.
Income before taxes decreased by 20.4% in 2014 to $631 thousand as compared to $793 thousand in 2013. Noninterest income increased $3.5 million, reflecting higher activity in mortgage loan originations and sales and beginning to retain servicing rights in 2014. The increase in noninterest income was largely offset by a $3.4 million increase in noninterest expenses reflecting higher commissions and other compensation costs as well as higher occupancy costs, in each case associated with the increase in the level of mortgage sales activity and expansion. The amount of mortgages originated and sold into the secondary market, which was approximately
118
Table of Contents
Index to Financial Statements
99% of the mortgages we originated, increased to $1,156.2 million in 2014 from $829.9 million in 2013, driving increases in both gains on sales of mortgages and in personnel and occupancy costs.
Results of operation
Throughout the following discussion of our operating results, we present our net interest income, net interest margin and efficiency ratio on a fully tax-equivalent basis. The fully tax-equivalent basis adjusts for the tax-favored status of net interest income from certain loans and investments. We believe this measure to be the preferred industry measurement of net interest income, which enhances comparability of net interest income arising from taxable and tax-exempt sources. The adjustment to convert certain income to a tax-equivalent basis consists of dividing tax exempt income by one minus the combined federal and state income tax rate of 39.225%. Please refer to the discussion in “Selected historical consolidated financial data: GAAP reconciliation and management explanation of non-GAAP financial measures” for a reconciliation of these fully tax-equivalent measures to the most directly comparable GAAP financial measures.
Net interest income
Our net interest income is primarily affected by the interest rate environment, and by the volume and the composition of our interest-earning assets and interest-bearing liabilities. We utilize net interest margin, which represents net interest income divided by average interest-earning assets, to track the performance of our investing and lending activities. We earn interest income from interest, dividends and fees earned on interest-earning assets, as well as from amortization and accretion of discounts on acquired loans. Our interest-earning assets include loans, time deposits in other financial institutions and securities available for sale. We incur interest expense on interest-bearing liabilities, including interest-bearing deposits, borrowings and other forms of indebtedness as well as from amortization of premiums on purchased deposits. Our interest-bearing liabilities include deposits, advances from the FHLB, other borrowings and other liabilities.
Six months ended June 30, 2016 compared to six months ended June 30, 2015
Net interest income increased 22.2% to $54.3 million in the six months ended June 30, 2016 compared to $44.4 million in the six months ended June 30, 2015. On a tax-equivalent basis, net interest income increased $9.9 million to $55.4 million in the six months ended June 30, 2016 as compared to $45.5 million in the six months ended June 30, 2015. The increase in tax-equivalent net interest income in the six months ended June 30, 2016 was primarily driven by higher loan balances, and lower interest expense, primarily due to the success of our initiatives to grow our low-cost deposits and our acquisition of NWGB, including recognized accretion of the credit discount taken in purchase accounting of $2.4 million in the six months ended June 30, 2016.
Interest income, on a tax-equivalent basis, was $60.0 million for the six months ended June 30, 2016, compared to $49.9 million for the six months ended June 30, 2015, an increase of $10.2 million. The two largest components of interest income are loan income and investment income. Loan income consists primarily of interest earned on our loan portfolio. Investment income consists primarily of interest earned on our investment portfolio. Loan income, on a tax-equivalent basis, increased $10.2 million to $47.1 million from $36.9 million for the six months ended June 30, 2015 primarily due to increased loan balances of $298.5 million in addition to $2.4 million in accretion on loans purchased in our acquisition of NWGB, $1.5 million of which was due to pay-offs on purchased credit impaired loans and the reversal of the associated credit discounts on those loans. The tax-equivalent yield on loans was 5.51%, up 27 basis points from the six months ended June 30, 2015. The increase in yield was primarily due to accretion on loans purchased from NWGB, which yielded 0.28%, in addition to increased loan fees.
119
Table of Contents
Index to Financial Statements
The components of our loan yield, a key driver to our NIM for the six months ended June 30, 2016 and 2015 were as follows:
| As of June 30, 2016 | As of June 30, 2015 | |||||||||||||||
| (unaudited) | (unaudited) | |||||||||||||||
| (dollars in thousands) | Interest income |
Average yield |
Interest income |
Average yield |
||||||||||||
| Loan yield components: |
||||||||||||||||
| Contractual interest rate on loans held for investment |
$ | 40,757 | 4.76% | $ | 34,204 | 4.85% | ||||||||||
| Origination and other loan fee income |
3,074 | 0.36% | 2,310 | 0.33% | ||||||||||||
| Accretion of accretable yield |
923 | 0.11% | — | 0.00% | ||||||||||||
| Accretion due to prepayments |
1,458 | 0.17% | — | 0.00% | ||||||||||||
| Syndication fee income |
825 | 0.10% | 315 | 0.05% | ||||||||||||
| Tax equivalent adjustment |
111 | 0.01% | 103 | 0.01% | ||||||||||||
|
|
|
|||||||||||||||
| Total loan yield |
$ | 47,148 | 5.51% | $ | 36,932 | 5.24% | ||||||||||
|
|
||||||||||||||||
For the six months ended June 30, 2016, interest income on loans held for sale decreased by $0.3 million compared to the six months ended June 30, 2015. The decrease was primarily driven by a decrease in yield of $0.8 partially offset by the growth in volume of $0.5 million. For the six months ended June 30, 2016, investment income, on a tax-equivalent basis, increased slightly to $8.4 million for the six months ended June 30, 2016 compared to $8.2 million for the six months ended June 30, 2015. The average balance in the investment portfolio in the six months ended June 30, 2016 was $592.5 million compared to $599.0 million in the six months ended June 30, 2015. The decline in the balance is driven by the use of investment cash flow to fund loan growth.
Interest expense was $4.6 million for the six months ended June 30, 2016, an increase of $0.2 million, or 4.9%, as compared to the six months ended June 30, 2015. The increase in interest expense was due primarily to an increase in deposit interest expense due to the growth in deposits. Interest expense on deposits was $3.5 million and $3.1 million for the six months ended June 30, 2016 and 2015, respectively. The cost of total deposits was 0.28% and 0.32% for the six months ended June 30, 2016 and 2015, respectively. The cost of interest-bearing deposits was 0.38% and 0.42% for the same periods. The primary driver for the increase in total interest expense is the increase in money market interest expense to $1.0 million from $0.6 million for the six months ended June 30, 2016 and 2015, respectively, driven by an increase in rate and balances. The rate on money markets was 0.35%, up 5 basis points from six months ended June 30, 2015. Meanwhile, time deposit interest expense declined $0.1 million to $0.8 million from the six months ended June 30, 2015. The rate on time deposits was 0.49%, down 11 basis points from the six months ended June 30, 2015 due to the lower renewal rate of maturing accounts. Time deposit balances increased $32.1 million to $330.5 million from $298.4 million during the six months ended June 30, 2016. The acquisition of NWGB contributed $42.4 in time deposits as of June 30, 2016, while the legacy time deposit portfolio increased $70.8 million from June 30, 2015. The increase in time deposits from June 30, 2015 is a result of restructuring an IRA savings product to a time deposit product during the second quarter of 2016, the average balance of which was $75.7 million for the six months ended June 30, 2016. Interest expense on borrowings was $1.1 and $1.3 million for the six months ended June 30, 2016 and 2015, respectively, while the cost of total borrowings was 1.57% and 1.09% for the six months ended June 30, 2016 and 2015, respectively. For more information about our outstanding subordinated debentures, refer to the discussion in this section under the heading “Financial condition: Borrowed funds.”
Our net interest margin, on a tax-equivalent basis, increased to 4.20% during the six months ended June 30, 2016 from 4.02% in the six months ended June 30, 2015, primarily as a result of our continued efforts to reduce our cost of funds, loan growth and benefits from our acquisition of NWGB. Net interest margin and net interest income are influenced by internal and external factors. Internal factors include balance sheet changes on both volume and mix and pricing decisions, and external factors include changes in market interest rates, competition and the shape of the interest rate yield curve.
120
Table of Contents
Index to Financial Statements
Average balance sheet amounts, interest earned and yield analysis
The table below shows the average balances, income and expense and yield rates of each of our interesting-earning assets and interest-bearing liabilities on a tax-equivalent basis, if applicable, for the periods indicated.
| Six months ended June
30, (unaudited) |
||||||||||||||||||||||||
| 2016 | 2015 | |||||||||||||||||||||||
| (dollars in thousands on tax-equivalent basis) | Average balances(1) |
Interest income/ expense |
Average yield/ rate |
Average balances |
Interest income/ expense |
Average yield/ rate |
||||||||||||||||||
| Interest-earning assets: |
||||||||||||||||||||||||
| Loans(2)(4) |
$ | 1,720,545 | 47,148 | 5.51% | $ | 1,422,040 | $ | 36,932 | 5.24% | |||||||||||||||
| Loans held for sale |
264,166 | 4,153 | 3.16% | 233,570 | 4,474 | 3.86% | ||||||||||||||||||
| Securities: |
||||||||||||||||||||||||
| Taxable |
513,516 | 5,870 | 2.30% | 522,967 | 5,882 | 2.27% | ||||||||||||||||||
| Tax-exempt(4) |
78,998 | 2,550 | 6.49% | 76,049 | 2,366 | 6.27% | ||||||||||||||||||
|
|
|
|||||||||||||||||||||||
| Total Securities(4) |
592,514 | 8,420 | 2.86% | 599,016 | 8,248 | 2.78% | ||||||||||||||||||
|
|
|
|||||||||||||||||||||||
| Federal funds sold |
12,905 | 31 | 0.48% | 8,822 | 24 | 0.55% | ||||||||||||||||||
| Interest-bearing deposits with other financial institutions |
57,432 | 149 | 0.52% | 11,667 | 67 | 1.16% | ||||||||||||||||||
| FHLB stock |
6,528 | 132 | 4.07% | 6,528 | 132 | 4.08% | ||||||||||||||||||
|
|
|
|||||||||||||||||||||||
| Total interest earning assets(4) |
2,654,090 | 60,033 | 4.55% | 2,281,643 | 49,877 | 4.41% | ||||||||||||||||||
|
|
|
|||||||||||||||||||||||
| Noninterest Earning Assets: |
||||||||||||||||||||||||
| Cash and due from banks |
47,900 | 38,242 | ||||||||||||||||||||||
| Allowance for loan losses |
(24,590 | ) | (29,088 | ) | ||||||||||||||||||||
| Other assets(3) |
215,472 | 177,040 | ||||||||||||||||||||||
|
|
|
|
|
|||||||||||||||||||||
| Total noninterest earning assets |
238,782 | 186,194 | ||||||||||||||||||||||
|
|
|
|
|
|||||||||||||||||||||
| Total assets |
$ | 2,892,872 | $ | 2,467,837 | ||||||||||||||||||||
|
|
|
|
|
|||||||||||||||||||||
| Interest-bearing liabilities: |
||||||||||||||||||||||||
| Interest bearing deposits: |
||||||||||||||||||||||||
| Time deposits |
$ | 330,455 | $ | 803 | 0.49% | $ | 298,399 | $ | 889 | 0.60% | ||||||||||||||
| Money market |
571,022 | 980 | 0.35% | 414,239 | 615 | 0.30% | ||||||||||||||||||
| Negotiable order of withdrawals |
718,705 | 1,330 | 0.37% | 620,656 | 1,163 | 0.38% | ||||||||||||||||||
| Savings deposits |
202,779 | 376 | 0.37% | 171,481 | 440 | 0.52% | ||||||||||||||||||
|
|
|
|||||||||||||||||||||||
| Total interest bearing deposits |
1,822,961 | 3,489 | 0.38% | 1,504,775 | 3,107 | 0.42% | ||||||||||||||||||
|
|
|
|||||||||||||||||||||||
| Other interest-bearing liabilities: |
||||||||||||||||||||||||
| FHLB advances |
15,183 | 259 | 3.43% | 19,418 | 329 | 3.42% | ||||||||||||||||||
| Other borrowings |
88,403 | 46 | 0.10% | 178,818 | 54 | 0.06% | ||||||||||||||||||
| Long-term debt |
41,005 | 827 | 4.06% | 41,005 | 915 | 4.50% | ||||||||||||||||||
|
|
|
|||||||||||||||||||||||
| Total other interest-bearing liabilities |
144,591 | 1,132 | 1.57% | 239,241 | 1,298 | 1.09% | ||||||||||||||||||
|
|
|
|||||||||||||||||||||||
| Total Interest-bearing liabilities |
$ | 1,967,552 | $ | 4,621 | 0.47% | $ | 1,744,016 | $ | 4,405 | 0.51% | ||||||||||||||
|
|
|
|
|
|
|
|
|
|
|
|
|
|||||||||||||
| Noninterest bearing liabilities: |
||||||||||||||||||||||||
| Demand deposits |
$ | 641,538 | $ | 470,575 | ||||||||||||||||||||
| Other liabilities |
28,637 | 28,867 | ||||||||||||||||||||||
|
|
|
|
|
|||||||||||||||||||||
| Total noninterest-bearing liabilities |
670,175 | 499,442 | ||||||||||||||||||||||
|
|
|
|
|
|||||||||||||||||||||
| Total liabilities |
2,637,727 | 2,243,458 | ||||||||||||||||||||||
| Shareholder’s equity |
255,145 | 224,379 | ||||||||||||||||||||||
|
|
|
|
|
|||||||||||||||||||||
| Total liabilities and shareholder’s equity |
$ | 2,892,872 | $ | 2,467,837 | ||||||||||||||||||||
|
|
|
|
|
|||||||||||||||||||||
| Net interest income (tax-equivalent basis) |
$ | 55,412 | $ | 45,472 | ||||||||||||||||||||
|
|
|
|
|
|||||||||||||||||||||
| Interest rate spread (tax-equivalent basis) |
4.16% | 3.99% | ||||||||||||||||||||||
| Net interest margin (tax-equivalent basis) |
4.20% | 4.02% | ||||||||||||||||||||||
| Average interest-earning assets to average interesting-bearing liabilities |
134.9% | 130.8% | ||||||||||||||||||||||
|
|
||||||||||||||||||||||||
| (1) | Calculated using daily averages. |
| (2) | Average balances of nonaccrual loans are included in average loan balances. Loan fees of $3,899 and $2,625 and accretion of $2,381 and $0 are included in interest income in the six months ended June 30, 2016 and 2015 respectively. |
| (3) | Includes investments in premises and equipment, foreclosed assets, interest receivable, deposit base intangible, goodwill and other miscellaneous assets. |
| (4) | Interest income includes the effects of taxable-equivalent adjustments using a U.S. federal income tax rate and, where applicable, state income tax to increase tax-exempt interest income to a tax-equivalent basis. The net taxable-equivalent adjustment amounts included in the above table were $1.1 million and $1.0 million for the six months ended June 30, 2016 and 2015, respectively. |
| (5) | The net interest margin is calculated by dividing net interest income, on a tax-equivalent basis, by average total earning assets. |
121
Table of Contents
Index to Financial Statements
Year ended December 31, 2015 compared to year ended December 31, 2014
Net interest income increased 12.6% to $93.9 million for the year ended December 31, 2015 compared to $83.4 million for the year ended December 31, 2014. On a tax-equivalent basis, net interest income increased $10.4 million to $95.9 million for the year ended December 31, 2015 as compared to $85.5 million for the year ended December 31, 2014. The largest factor contributing to the growth in net interest income for the year ended December 31, 2015 was the $149.4 million increase in average loans resulting from strong demand for loans in our markets. The strong demand is due to continued improvements in our national and local economic climate and the success of our growth initiatives, including our continued expansion into the Nashville MSA and the hiring of additional bankers. Specifically, the year ended December 31, 2015 also includes interest income from loans generated by our residential loan team hired in April 2014 for all of 2015.
Interest income, on a tax-equivalent basis, was $104.8 million for the year ended December 31, 2015, compared to $95 million for the year ended December 31, 2014, an increase of $9.8 million. The two largest components of interest income are loan income and investment income. Loan income consists primarily of interest earned on our loan portfolio. Investment income consists primarily of interest earned on our investment portfolio. Loan income, on a tax-equivalent basis, increased $6.4 million to $78.3 million from $71.9 million for the year ended December 31, 2015 primarily due to increased average loan balances of $149.4 million in addition to loan syndication fee income of $0.7 million and $0.2 million in accretion of the accretable yield on loans purchased in our acquisition of NWGB. The tax-equivalent yield on loans was 5.12% for the year ended December 31, 2015, down 9 basis points from the year ended December 31, 2014. The decrease in yield was primarily due to new loan originations at lower current interest rates than maturing loans originated during a slightly higher interest rate environment. The components of our loan yield for the years ended December 31, 2015 and 2014 were as follows:
| Year Ended December 31, | ||||||||||||||||
| 2015 | 2014 | |||||||||||||||
| (dollars in thousands) | Interest income |
Average yield |
Interest income |
Average yield |
||||||||||||
| Loan yield components |
||||||||||||||||
| Contractual interest rate on loans held for investment |
72,772 | 4.76% | 67,283 | 4.88% | ||||||||||||
| Origination and other loan fee income |
4,356 | 0.28% | 4,368 | 0.32% | ||||||||||||
| Accretion of accretable yield |
254 | 0.02% | — | 0.00% | ||||||||||||
| Accretion due to prepayments |
— | — | — | 0.00% | ||||||||||||
| Syndication fee income |
690 | 0.05% | — | 0.00% | ||||||||||||
| Tax equivalent adjustment |
203 | 0.01% | 218 | 0.01% | ||||||||||||
|
|
|
|||||||||||||||
| Total loan yield |
78,275 | 5.12% | 71,869 | 5.21% | ||||||||||||
|
|
||||||||||||||||
For the year ended December 31, 2015, interest income on loans held for sale increased by $6.2 million compared to the year ended December 31, 2014. The increase was primarily driven by the growth in volume of $5.7 million. For the year ended December 31, 2015, investment income, on a tax-equivalent basis, decreased $2.8 million to $16.4 million from $19.2 million for the year ended December 31, 2014. The average balance in the investment portfolio for the year ended December 31, 2015 was $611.6 million compared to $668.4 million for the year ended December 31, 2014. The decline in the balance is driven by the use of investment cash flow to fund loan growth.
Interest expense was $8.9 million for the year ended December 31, 2015; a decrease of $0.6 million, or 6.3%, as compared to the year ended December 31, 2014. The decrease in interest expense was due primarily to a decline in deposit interest expense. Interest expense on deposits was $6.3 million and $6.7 million for the years ended December 31, 2015 and 2014, respectively. The cost of total deposits was 0.30% and 0.36% for the years
122
Table of Contents
Index to Financial Statements
ended December 31, 2015 and 2014, respectively. The cost of interest-bearing deposits was 0.40% and 0.46% for the same periods. The primary driver for the decline in total interest expense is the decrease in time deposit expense to $1.6 million from $2.5 million for the years ended December 31, 2015 and 2014, respectively, driven by a decline in rate and balances. The rate on time deposits was 0.51%, down 23 basis points for the year ended December 31, 2014 due to the lower renewal rate of maturing accounts. Time deposit balances decreased $30.3 million to $303.4 million from $333.7 million due to disciplined pricing. Interest expense on borrowings was $0.8 million and $1.0 million for the years ended December 31, 2015 and 2014, respectively, while the cost of total borrowings was 0.39% and 0.50% for the years ended December 31, 2015 and 2014, respectively. For more information about our outstanding subordinated debentures, refer to the discussion in this section under the heading “Financial condition: Borrowed funds.”
Our net interest margin, on a tax-equivalent basis, increased to 3.97% for the year ended December 31, 2015 from 3.93% for the year ended December 31, 2014, primarily as a result of our continued efforts to reduce our cost of funds and our strong loan growth. Net interest margin and net interest income are influenced by internal and external factors. Internal factors include balance sheet changes on both volume and mix and pricing decisions, and external factors include changes in market interest rates, competition and the shape of the interest rate yield curve.
Year ended December 31, 2014 compared to year ended December 31, 2013
Net interest income increased 10.5% to $83.4 million in 2014 compared to $75.5 million in 2013. On a tax-equivalent basis, net interest income increased $7.9 million to $85.5 million in 2014 compared to $77.6 million in 2013. The increase in tax-equivalent net interest income in 2014 was the result of a $5.8 million increase in tax-equivalent interest income and a $2.1 million decline in interest expense. The largest factor contributing to the growth in net interest income in 2014 was the $101.2 million increase in average loans resulting from strong demand for loans in our markets. The strong demand is due to continued improvements in our national and local economic climate and the success of our growth initiatives, including our continued expansion into the Nashville MSA and the hiring of additional bankers. Specifically, 2014 includes our residential loan team hired in April, 2014. This increase in average loans was partially offset by the $45.4 million decrease in average securities, as the cash flow from our investment portfolio was primarily used to fund our loan growth rather than investing in securities.
123
Table of Contents
Index to Financial Statements
Interest income, on a tax-equivalent basis, was $95.0 million for 2014 compared to $89.2 million for 2013, an increase of $5.8 million. This increase in interest income, on a tax-equivalent basis, is due primarily to the increase in average loans of $101.2 million, partially offset by the $45.4 million decrease in average securities. In 2014, loan income, on a tax-equivalent basis, increased $3.7 million to $71.9 million from $68.2 million for 2013. The tax-equivalent yield on loans was 5.21%, down 12 basis points from 2013. The decline in yield was primarily due to the replacement of higher rate maturing loans with new or renewed loans at current market rates, which are generally lower due to the current interest rate environment. The components of our loan yield for the years ended December 31, 2014 and 2013 were as follows:
| Year Ended December 31, | ||||||||||||||||
| 2014 | 2013 | |||||||||||||||
| (dollars in thousands) | Interest income |
Average yield |
Interest income |
Average yield |
||||||||||||
| Loan yield components |
||||||||||||||||
| Contractual interest rate on loans held for investment |
67,283 | 4.88% | 63,600 | 4.98% | ||||||||||||
| Origination and other loan fee income |
4,368 | 0.32% | 3,626 | 0.28% | ||||||||||||
| Syndication fee income |
— | 0.00% | 600 | 0.05% | ||||||||||||
| Tax equivalent adjustment |
218 | 0.02% | 329 | 0.02% | ||||||||||||
|
|
|
|||||||||||||||
| Total loan yield |
71,869 | 5.21% | 68,155 | 5.33% | ||||||||||||
|
|
||||||||||||||||
In 2014, investment income, on a tax-equivalent basis, increased $1.0 million to $19.2 million from $18.2 million for 2013. The average balance in the investment portfolio in 2014 decreased $45.4 million to $668.4 million compared to $713.8 million in 2013 driven by the use of portfolio cash flow to fund loan growth. The tax-equivalent yield on the investment portfolio in 2014 was 2.87%, up 31 basis points from 2013. The increase in yield was primarily a result of the decline in premium amortization due to the industry decline in mortgage pre-payment spreads.
Interest expense was $9.5 million for 2014, a decrease of $2.1 million, or 18.0%, as compared to 2013. The decrease in interest expense was due primarily to our lower cost of funds resulting from lower deposit rates, which reduced interest expense by $1.7 million in 2014. In addition, the mix of interest-bearing liabilities changed with the replacement of higher cost time deposits and borrowed funds with lower-cost deposits, further decreasing interest expense. The increase in the average balance of liabilities was due primarily to an increase in average noninterest bearing demand deposits of $54.0 million, with increases in average interest-bearing liabilities of $39.2 million also contributing to this increase. Interest expense on deposits was $6.7 million and $8.6 million for 2014 and 2013, respectively. The cost of total deposits was 0.36% and 0.48% for 2014 and 2013, respectively. The cost of interest-bearing deposits was 0.46% and 0.59% for the same periods. Interest expense on borrowings was $2.8 million and $3.1 million 2014 and 2013, respectively, while the cost of total borrowings was 1.2% and 1.5% for 2014 and 2013, respectively.
Our net interest margin, on a tax-equivalent basis, increased to 3.93% during 2014 from 3.75% in 2013. Our net interest margin in 2014 benefited from our ongoing efforts to reduce our cost of funds by growing our low-cost deposits as well as our higher level of loans and lower level of borrowings.
124
Table of Contents
Index to Financial Statements
Average balance sheet amounts, interest earned and yield analysis
The table below shows the average balances, income and expense and yield rates of each of our interesting-earning assets and interest-bearing liabilities on a tax-equivalent basis, if applicable, for the periods indicated.
| Year ended December 31, | ||||||||||||||||||||||||||||||||||||
| 2015 | 2014 | 2013 | ||||||||||||||||||||||||||||||||||
| (dollars in thousands on tax- equivalent basis) |
Average balances(1) |
Interest income/ expense |
Average yield/ rate |
Average balances |
Interest income/ expense |
Average yield/ rate |
Average balances |
Interest income/ expense |
Average yield/ rate |
|||||||||||||||||||||||||||
| Interest-earning assets: |
||||||||||||||||||||||||||||||||||||
| Loans(2) |
$ | 1,528,719 | $ | 78,275 | 5.12% | $ | 1,379,346 | $ | 71,869 | 5.21% | $ | 1,278,195 | $ | 68,155 | 5.33% | |||||||||||||||||||||
| Loans held for sale |
250,237 | 9,651 | 3.86% | 102,509 | 3,487 | 3.40% | 61,408 | 2,417 | 3.94% | |||||||||||||||||||||||||||
| Securities: |
||||||||||||||||||||||||||||||||||||
| Taxable |
537,762 | 11,783 | 2.19% | 591,329 | 14,375 | 2.43% | 640,866 | 13,563 | 2.12% | |||||||||||||||||||||||||||
| Tax-exempt(4) |
73,871 | 4,620 | 6.25% | 77,084 | 4,825 | 6.26% | 72,912 | 4,679 | 6.42% | |||||||||||||||||||||||||||
|
|
|
|||||||||||||||||||||||||||||||||||
| Total Securities(4) |
611,633 | 16,403 | 2.68% | 668,413 | 19,200 | 2.87% | 713,778 | 18,242 | 2.56% | |||||||||||||||||||||||||||
|
|
|
|||||||||||||||||||||||||||||||||||
| Federal funds sold |
8,969 | 51 | 0.57% | 8,020 | 45 | 0.56% | 5,919 | 30 | 0.51% | |||||||||||||||||||||||||||
| Interest-bearing deposits with other financial institutions |
10,508 | 155 | 1.48% | 10,156 | 137 | 1.35% | 5,076 | 139 | 2.74% | |||||||||||||||||||||||||||
| FHLB stock |
6,692 | 262 | 3.92% | 6,528 | 262 | 4.01% | 6,233 | 263 | 4.22% | |||||||||||||||||||||||||||
|
|
|
|||||||||||||||||||||||||||||||||||
| Total interest earning assets(4) |
2,416,758 | 104,797 | 4.34% | 2,174,972 | 95,000 | 4.37% | 2,070,609 | 89,246 | 4.31% | |||||||||||||||||||||||||||
|
|
|
|||||||||||||||||||||||||||||||||||
| Noninterest Earning Assets: |
||||||||||||||||||||||||||||||||||||
| Cash and due from banks |
45,987 | 35,629 | 35,674 | |||||||||||||||||||||||||||||||||
| Allowance for loan losses |
(28,688 | ) | (33,102 | ) | (35,298 | ) | ||||||||||||||||||||||||||||||
| Other assets(3) |
143,838 | 133,798 | 134,279 | |||||||||||||||||||||||||||||||||
|
|
|
|
|
|
|
|||||||||||||||||||||||||||||||
| Total noninterest earning assets |
161,137 | 136,325 | 134,655 | |||||||||||||||||||||||||||||||||
|
|
|
|
|
|
|
|||||||||||||||||||||||||||||||
| Total assets |
$ | 2,577,895 | $ | 2,311,297 | $ | 2,205,264 | ||||||||||||||||||||||||||||||
|
|
|
|
|
|
|
|||||||||||||||||||||||||||||||
| Interest-bearing liabilities: |
||||||||||||||||||||||||||||||||||||
| Interest bearing deposits: |
||||||||||||||||||||||||||||||||||||
| Time deposits |
$ | 303,354 | $ | 1,559 | 0.51% | $ | 333,680 | $ | 2,483 | 0.74% | $ | 389,166 | $ | 4,217 | 1.08% | |||||||||||||||||||||
| Money market |
455,271 | 1,477 | 0.32% | 389,152 | 1,050 | 0.27% | 368,796 | 1,036 | 0.28% | |||||||||||||||||||||||||||
| Negotiable order of withdrawals |
621,630 | 2,327 | 0.37% | 575,500 | 2,265 | 0.39% | 528,491 | 2,239 | 0.42% | |||||||||||||||||||||||||||
| Savings deposits |
183,307 | 929 | 0.51% | 162,063 | 926 | 0.57% | 157,754 | 1,062 | 0.67% | |||||||||||||||||||||||||||
|
|
|
|||||||||||||||||||||||||||||||||||
| Total interest bearing deposits |
1,563,562 | 6,292 | 0.40% | 1,460,395 | 6,724 | 0.46% | 1,444,207 | 8,554 | 0.59% | |||||||||||||||||||||||||||
|
|
|
|||||||||||||||||||||||||||||||||||
| Other interest-bearing liabilities: |
||||||||||||||||||||||||||||||||||||
| FHLB advances |
17,885 | 608 | 3.40% | 25,320 | 868 | 3.43% | 29,176 | 1,083 | 3.71% | |||||||||||||||||||||||||||
| Other borrowings |
187,630 | 184 | 0.10% | 167,653 | 106 | 0.06% | 140,746 | 150 | 0.11% | |||||||||||||||||||||||||||
| Long-term debt |
41,003 | 1,826 | 4.45% | 41,005 | 1,815 | 4.43% | 41,005 | 1,819 | 4.44% | |||||||||||||||||||||||||||
|
|
|
|||||||||||||||||||||||||||||||||||
| Total other interest-bearing liabilities |
246,518 | 2,618 | 1.06% | 233,978 | 2,789 | 1.19% | 210,927 | 3,052 | 1.45% | |||||||||||||||||||||||||||
|
|
|
|||||||||||||||||||||||||||||||||||
| Total Interest-bearing liabilities |
1,810,080 | 8,910 | 0.49% | 1,694,373 | 9,513 | 0.56% | 1,655,134 | 11,606 | 0.70% | |||||||||||||||||||||||||||
|
|
|
|||||||||||||||||||||||||||||||||||
| Noninterest-bearing liabilities: |
||||||||||||||||||||||||||||||||||||
| Demand deposits |
519,273 | 393,846 | 339,811 | |||||||||||||||||||||||||||||||||
| Other liabilities |
19,698 | 19,463 | 17,859 | |||||||||||||||||||||||||||||||||
|
|
|
|
|
|
|
|||||||||||||||||||||||||||||||
| Total noninterest-bearing liabilities |
538,971 | 413,309 | 357,670 | |||||||||||||||||||||||||||||||||
|
|
|
|
|
|
|
|||||||||||||||||||||||||||||||
| Total liabilities |
2,349,051 | 2,107,682 | 2,012,804 | |||||||||||||||||||||||||||||||||
| Shareholder’s equity |
228,844 | 203,615 | 192,460 | |||||||||||||||||||||||||||||||||
|
|
|
|
|
|
|
|||||||||||||||||||||||||||||||
| Total liabilities and shareholder’s equity |
$ | 2,577,895 | $ | 2,311,297 | $ | 2,205,264 | ||||||||||||||||||||||||||||||
|
|
|
|
|
|
|
|||||||||||||||||||||||||||||||
| Net interest income(4) |
$ | 95,887 | $ | 85,487 | $ | 77,640 | ||||||||||||||||||||||||||||||
|
|
|
|
|
|
|
|||||||||||||||||||||||||||||||
| Interest rate spread(4) |
3.93% | 3.91% | 3.72% | |||||||||||||||||||||||||||||||||
| Net interest margin(5) |
3.97% | 3.93% | 3.75% | |||||||||||||||||||||||||||||||||
| Average interest-earning assets to average interest-bearing liabilities |
133.5% | 128.4% | 125.1% | |||||||||||||||||||||||||||||||||
|
|
||||||||||||||||||||||||||||||||||||
| (1) | Calculated using daily averages. |
| (2) | Average balances of nonaccrual loans are included in average loan balances. Loan fees of $5,046, $4,368 and $4,226 and accretion of $290, $0 and $0 are included in interest income in 2015, 2014 and 2013, respectively. |
125
Table of Contents
Index to Financial Statements
| (3) | Includes investments in premises and equipment, foreclosed assets, interest receivable, deposit base intangible, goodwill and other miscellaneous assets. |
| (4) | Interest income includes the effects of taxable-equivalent adjustments using a U.S. federal income tax rate of 39.225% and, where applicable, state income tax to increase tax-exempt interest income to a tax-equivalent basis. The net taxable-equivalent adjustment amounts included in the above table were $2,015 million, $2,111 million and $2,164 million for the years ended December 31, 2015, 2014 and 2013, respectively. |
| (5) | The net interest margin is calculated by dividing net interest income, on a tax-equivalent basis, by average total earning assets. |
Rate/volume analysis
The tables below present the components of the changes in net interest income for the six months ended June 30, 2016 and 2015 and each of the years ended December 31, 2015, 2014 and 2013. For each major category of interest-earning assets and interest-bearing liabilities, information is provided with respect to changes due to average volumes and changes due to rates, with the changes in both volumes and rates allocated to these two categories based on the proportionate absolute changes in each category.
Six months ended June 30, 2016 compared to six months ended June 30, 2015
| Six months ended June 30, 2016 compared
to six months ended June 30, 2015 due to changes in (unaudited) |
||||||||||||
| (in thousands on a tax-equivalent basis) | volume | rate | Net increase (decrease) |
|||||||||
| Interest-earning assets: |
||||||||||||
| Loans(1)(2) |
$ | 8,180 | $ | 2,036 | $ | 10,216 | ||||||
| Loans held for sale |
481 | (802 | ) | (321 | ) | |||||||
| Securities available for sale and other securities: |
||||||||||||
| Taxable |
(108 | ) | 96 | (12 | ) | |||||||
| Tax Exempt(2) |
95 | 89 | 184 | |||||||||
| Federal funds sold and balances at Federal Reserve Bank |
10 | (3 | ) | 7 | ||||||||
| Time deposits in other financial institutions |
119 | (37 | ) | 82 | ||||||||
| FHLB stock |
— | — | — | |||||||||
|
|
|
|||||||||||
| Total interest income(2) |
8,777 | 1,379 | 10,156 | |||||||||
| Interest-bearing liabilities: |
||||||||||||
| Time deposits |
78 | (164 | ) | (86 | ) | |||||||
| Money market |
269 | 96 | 365 | |||||||||
| Negotiable order of withdrawal accounts |
181 | (14 | ) | 167 | ||||||||
| Savings deposits |
58 | (122 | ) | (64 | ) | |||||||
| FHLB advances |
(72 | ) | 2 | (70 | ) | |||||||
| Other borrowings |
(47 | ) | 39 | (8 | ) | |||||||
| Long-term debt |
— | (88 | ) | (88 | ) | |||||||
|
|
|
|||||||||||
| Total interest expense |
467 | (251 | ) | 216 | ||||||||
|
|
|
|||||||||||
| Change in net interest income(2) |
$ | 8,310 | $ | 1,630 | $ | 9,940 | ||||||
|
|
||||||||||||
| (1) | Average loans are gross, including non-accrual loans and overdrafts (before deduction of net fees and allowance for loan losses). Loan fees of $3,899 and $2,625 and accretion of $2,381 and $0 are included in interest income in the six months ended June 30, 2016 and 2015 respectively. |
| (2) | Interest income includes the effects of the tax-equivalent adjustments to increase tax-exempt interest income to a tax-equivalent basis. |
126
Table of Contents
Index to Financial Statements
As discussed above, the $9.9 million increase in loan and loans held for sale interest income during the six months ended June 30, 2016 compared to June 30, 2015 was the primary driver of the $9.9 increase in net interest income. The increase in loan interest income was driven by an increase in average loans of $298.5 million, or 21.0%, to $1.72 billion as of June 30, 2016, as compared to $1.42 billion as of June 30, 2015. Our loan growth during the period was driven by growth in our metropolitan markets, primarily in the Nashville MSA, resulting from the investment in new locations and banking teams and improving economic conditions in addition to the acquisition of NWGB. The increase in average loans held for sale of $30.6 million was the result of an increase in mortgage loan officers and the growth of our internet delivery channel.
Year ended December 31, 2015 compared to year ended December 31, 2014
| Year ended December 31, 2015 compared to year ended December 31, 2014 due to changes in |
||||||||||||
| (in thousands on a tax-equivalent basis) | volume | rate | Net increase (decrease) |
|||||||||
| Interest-earning assets: |
||||||||||||
| Loans(1) |
$ | 7,648 | $ | (1,242 | ) | $ | 6,406 | |||||
| Loans held for sale |
5,697 | 467 | 6,164 | |||||||||
| Securities available for sale and other securities: |
||||||||||||
| Taxable |
(1,174 | ) | (1,418 | ) | (2,592 | ) | ||||||
| Tax Exempt(2) |
(201 | ) | (4 | ) | (205 | ) | ||||||
| Federal funds sold and balances at Federal Reserve Bank |
5 | 1 | 6 | |||||||||
| Time deposits in other financial institutions |
5 | 13 | 18 | |||||||||
| FHLB stock |
6 | (6 | ) | — | ||||||||
|
|
|
|||||||||||
| Total interest income(2) |
11,986 | (2,189 | ) | 9,797 | ||||||||
| Interest-bearing liabilities: |
||||||||||||
| Time deposits |
(156 | ) | (768 | ) | (924 | ) | ||||||
| Money market |
215 | 212 | 427 | |||||||||
| Negotiable order of withdrawal accounts |
173 | (111 | ) | 62 | ||||||||
| Savings deposits |
108 | (105 | ) | 3 | ||||||||
| FHLB advances |
(253 | ) | (7 | ) | (260 | ) | ||||||
| Other borrowings |
20 | 58 | 78 | |||||||||
| Long-term debt |
— | 11 | 11 | |||||||||
|
|
|
|||||||||||
| Total interest expense |
107 | (710 | ) | (603 | ) | |||||||
|
|
|
|||||||||||
| Change in net interest income(2) |
$ | 11,879 | $ | (1,479 | ) | $ | 10,400 | |||||
|
|
||||||||||||
| (1) | Average loans are gross, including non-accrual loans and overdrafts (before deduction of net fees and allowance for loan losses). Loan fees of $5,046 and $4,368 are included in interest income in the year ended December 31, 2015 and 2014, respectively. |
| (2) | Interest income includes the effects of the tax-equivalent adjustments to increase tax-exempt interest income to a tax-equivalent basis. |
As discussed above, the $12.6 million increase in loans and loans held for sale interest income for the year ended December 31, 2015 compared to the year ended December 31, 2014 was the primary driver of the $10.4 million increase in net interest income. The increase in loan interest income was driven by an increase in average loans of $149.4 million, or 10.8%, to $1.5 billion as of December 31, 2015, as compared to $1.38 billion as of December 31, 2014. Our loan growth during the period was driven by growth in our metropolitan markets, primarily in the Nashville MSA, resulting from the investment in new locations and banking teams and improving economic conditions in addition to the acquisition of NWGB. The increase in loans held for sale of $147.7 million was the result of an increase in mortgage loan officers and the growth of our internet delivery channel.
127
Table of Contents
Index to Financial Statements
Year ended December 31, 2014 compared to year ended December 31, 2013
| Year ended December 31, 2014 compared
to year ended December 31, 2013 due to changes in |
||||||||||||
| (in thousands on a tax-equivalent basis) | volume | rate | Net increase (decrease) |
|||||||||
| Interest-earning assets: |
||||||||||||
| Loans(1)(2) |
$ | 5,270 | $ | (1,556 | ) | $ | 3,714 | |||||
| Loans held for sale |
1,398 | (328 | ) | 1,070 | ||||||||
| Securities available for sale and other securities: |
||||||||||||
| Taxable |
(1,204 | ) | 2,016 | 812 | ||||||||
| Tax Exempt(2) |
261 | (115 | ) | 146 | ||||||||
| Federal funds sold and balances at Federal Reserve Bank |
12 | 3 | 15 | |||||||||
| Time deposits in other financial institutions |
69 | (71 | ) | (2 | ) | |||||||
| FHLB stock |
12 | (13 | ) | (1 | ) | |||||||
|
|
|
|||||||||||
| Total interest income(2) |
5,818 | (64 | ) | 5,754 | ||||||||
| Interest-bearing liabilities: |
||||||||||||
| Time deposits |
(413 | ) | (1,321 | ) | (1,734 | ) | ||||||
| Money market |
55 | (41 | ) | 14 | ||||||||
| Negotiable order of withdrawal accounts |
185 | (159 | ) | 26 | ||||||||
| Savings deposits |
25 | (161 | ) | (136 | ) | |||||||
| FHLB advances |
(132 | ) | (83 | ) | (215 | ) | ||||||
| Other borrowings |
17 | (61 | ) | (44 | ) | |||||||
| Long-term debt |
— | (4 | ) | (4 | ) | |||||||
|
|
|
|||||||||||
| Total interest expense |
(263 | ) | (1,830 | ) | (2,093 | ) | ||||||
|
|
|
|||||||||||
| Change in net interest income(2) |
$ | 6,081 | $ | 1,766 | $ | 7,847 | ||||||
|
|
||||||||||||
| (1) | Average loans are gross, including non-accrual loans and overdrafts (before deduction of net fees and allowance for loan losses). Loan fees of $4,368 and $4,227 are included in interest income in 2014 and 2013, respectively. |
| (2) | Interest income includes the effects of the tax-equivalent adjustments to increase tax-exempt interest income to a tax-equivalent basis. |
As noted previously, the growth in average loans and loans held for sale was the primary driver for the $7.8 million increase in 2014 net interest income. The $101.2 million growth in average loans resulted predominantly from our growth in the Nashville MSA, resulting from our continued expansion and the favorable economic conditions in this market. The $41.1 million increase in loans held for sale was primarily driven by an increase in mortgage loan officers, the addition of internet delivery channel and favorable interest rates. Net interest income was further improved by the decline in interest expense, resulting primarily from the decrease in time deposit rates and the change in funding mix. Management’s focus on growing our core deposits resulted in the growth of average noninterest-bearing deposits of $54.0 million, primarily in the Nashville MSA. The decline in average time deposits under this strategy was $55.5 million and occurred in virtually all of our markets with the largest declines being in the Nashville MSA and our West Tennessee community markets.
Provision for loan losses
The provision for loan losses charged to operating expense is an amount which, in the judgment of management, is necessary to maintain the allowance for loan losses at a level that is believed to be adequate to meet the inherent risks of losses in our loan portfolio. Factors considered by management in determining the amount of the provision for loan losses include the internal risk rating of individual credits, historical and
128
Table of Contents
Index to Financial Statements
current trends in net charge-offs, trends in nonperforming loans, trends in past due loans, trends in the market values of underlying collateral securing loans and the current economic conditions in the markets in which we operate. The determination of the amount is complex and involves a high degree of judgment and subjectivity.
Six months ended June 30, 2016 compared to six months ended June 30, 2015. Our reversal of the provision for loan losses for the six months ended June 30, 2016 was $0.8 million as compared to a provision for loan losses of $0.2 million for the six months ended June 30, 2015, reflecting our stable operating environment and consistent credit quality throughout the first half of 2016.
Year ended December 31, 2015 compared to year ended December 31, 2014. Our reversal of the provision for loan losses for the year ended December 31, 2015 was $3.1 million as compared 2.7 million for the year ended December 31, 2014, reflecting our improved credit quality and a decrease in troubled loans throughout 2015.
Year ended December 31, 2014 compared to year ended December 31, 2013. Our reversal of the provision for loan losses for 2014 was $2.7 million as compared to $1.5 million in 2013. The 2014 provision for loan losses reflects our relatively stable operating environment and consistent credit quality improvement throughout the year.
Noninterest income
Our noninterest income includes gains on sales of mortgage loans, fees on mortgage loan originations, loan servicing fee and hedging results fees generated from deposit services, securities gains and all other noninterest income.
The following table sets forth the components of noninterest income for the periods indicated:
| Six months ended June 30, (unaudited) |
Year ended December 31, | |||||||||||||||||||
| (in thousands) | 2016 | 2015 | 2015 | 2014 | 2013 | |||||||||||||||
| Mortgage banking income |
$ | 54,636 | $ | 31,287 | $ | 70,190 | $ | 31,135 | $ | 23,968 | ||||||||||
| Service charges on deposit accounts |
4,259 | 3,364 | 7,389 | 7,333 | 6,924 | |||||||||||||||
| ATM and interchange |
3,942 | 2,938 | 6,536 | 5,633 | 5,234 | |||||||||||||||
| Bargain purchase gain |
— | — | 2,794 | — | — | |||||||||||||||
| Gain on sale of securities |
3,991 | 1,795 | 1,844 | 2,000 | 34 | |||||||||||||||
| Net (loss) gain on sales or write-downs of foreclosed assets |
(142 | ) | 62 | (317 | ) | 132 | 225 | |||||||||||||
| Other |
2,705 | 1,777 | 3,944 | 4,569 | 5,001 | |||||||||||||||
|
|
|
|||||||||||||||||||
| Total noninterest income |
69,391 | 41,223 | $ | 92,380 | $ | 50,802 | $ | 41,386 | ||||||||||||
|
|
||||||||||||||||||||
Six months ended June 30, 2016 compared to six months ended June 30, 2015
Noninterest income was $69.4 million for the six months ended June 30, 2016, an increase of $28.17 million, or 68.3%, as compared to $41.2 million for the six months ended June 30, 2015. Noninterest income to average assets (excluding any gains or losses from sale of securities) was 2.3% in the six months ended June 30, 2016 as compared to 1.6% in the six months ended June 30, 2015.
Mortgage banking income primarily includes origination fees on mortgage loans, gains and losses on the sale of mortgage loans, fees from wholesale and third party origination services provided to community banks and mortgage companies and mortgage servicing fees. Mortgage banking income was $54.6 million and $31.3
129
Table of Contents
Index to Financial Statements
million for the six months ended June 30, 2016 and 2015, respectively. Originations of mortgage loans to be sold totaled $1,762.1 million for the six months ended June 30, 2016 as compared to $1,278.0 million for the six months ended June 30, 2015. The increase in originations of mortgage loans to be sold is due to increased volume in our retail and third party origination channels as well as the expansion of the consumer direct delivery channel and a favorable interest rate environment. The margin on the origination and sales of mortgage loans was 2.84% for the six months ended June 30, 2016 compared to 2.37% for the six months ended June 30, 2015. The increase is primarily due to a favorable interest rate environment and improved execution, including increased securitization activity. The components of mortgage banking income for the six months ended June 30, 2016 and 2015 were as follows:
| Six months ended June 30, (unaudited) |
||||||||
| (in thousands) | 2016 | 2015 | ||||||
| Mortgage banking income: |
||||||||
| Origination and sales of mortgage loans |
$ | 49,985 | $ | 30,235 | ||||
| Mortgage servicing income |
4,651 | 1,052 | ||||||
|
|
|
|||||||
| Total mortgage banking income |
$ | 54,636 | $ | 31,287 | ||||
|
|
|
|
|
|||||
| Origination volume |
$ | 1,762,143 | $ | 1,278,004 | ||||
| Outstanding principal balance of mortgage loans serviced |
$ | 4,023,151 | $ | 1,399,162 | ||||
|
|
|
|
|
|
||||
Mortgage banking income attributable to our community banking segment was $13.4 million and $8.4 million for the six months ended June 30, 2016 and 2015, respectively, and mortgage banking income attributable to our mortgage banking segment was $41.3 million and $22.9 million for the six months ended June 30, 2016 and 2015, respectively.
Service charges on deposit accounts include analysis and maintenance fees on accounts, per item charges, non-sufficient funds and overdraft fees. Service charges on deposit accounts were $4.3 million, an increase of $0.9 million or 26.6% for the six months ended June 30, 2016, compared to $3.4 million for the six months ended June 30, 2015. The increase in service charges on deposit accounts in the six months ended June 30, 2016 was primarily the result of deposit account growth driven by our acquisition of NWGB.
ATM and interchange fees include debit card interchange, ATM and other consumer fees. Other charges and fees increased 34.2% to $3.9 million during the six months ended June 30, 2016 as compared to $2.9 million for the six months ended June 30, 2015 as a result of increased debit card fees from continued growth in client usage of debit cards experienced by most financial institutions.
Gains on sales of securities for the six months ended June 30, 2016 were $4.0 million, resulting from the sale of approximately $269.0 million in securities, compared to gains on sales of securities for the six months ended June 30, 2015 of $1.8 million. The gains are attributable to management taking advantage of portfolio structuring opportunities to lock in current gains while maintaining comparable interest rates and maturities and to fund current loan growth.
Net loss on sales or write-downs of foreclosed assets for the six months ended June 30, 2016 was $142 thousand compared to a net gain of $62 thousand for the six months ended June 30, 2015. This change was the result of specific sales and valuation transactions of other real estate.
Other noninterest income for the six months ended June 30, 2016 was $2.7 million as compared to other noninterest income of $1.8 million for the six months ended June 30, 2015. This $0.9 million increase in other noninterest income was partially due to a $0.4 million loss incurred on the dissolution of a limited partnership in the six months ended June 30, 2015 in addition to increased miscellaneous income items associated with our overall growth.
130
Table of Contents
Index to Financial Statements
Year ended December 31, 2015 compared to year ended December 31, 2014
Noninterest income was $92.4 million for the year ended December 31, 2015, an increase of $41.6 million, or 81.8%, as compared to $50.8 million for the year ended December 31, 2014. Our acquisition of NWGB also contributed $1.0 million to this increase. Noninterest income to average assets (excluding any gains or losses from sale of securities) was 3.6% for the year ended December 31, 2015 as compared to 2.2% for the year ended December 31, 2014.
Mortgage banking income was $70.2 million and $31.1 million for the years ended December 31, 2015 and 2014, respectively. Originations of mortgage loans to be sold totaled $2,757.5 million for the year ended December 31, 2015 as compared to $1,156.2 million for the year ended December 31, 2014. The increase in originations of mortgage loans to be sold is due to origination increases in our retail and third party origination channels as well as the expansion of the consumer direct delivery channel and a favorable interest rate environment. The margin on the origination and sales of mortgage loans was 2.41% for the year ended December 31, 2015, as compared to 2.66% for the year ended December 31, 2014. The slight decline is primarily due to the increase in ConsumerDirect, a more compressed margin delivery channel, as a percentage of total originations. The components of mortgage banking income for the years ended December 31, 2015 and 2014 were as follows:
| Year Ended December 31, | ||||||||
| (in thousands) | 2015 | 2014 | ||||||
| Mortgage banking income: |
||||||||
| Origination and sales of mortgage loans |
$ | 66,576 | $ | 30,794 | ||||
| Mortgage servicing income |
3,614 | 341 | ||||||
|
|
|
|||||||
| Total mortgage banking income |
$ | 70,190 | $ | 31,135 | ||||
|
|
|
|
|
|||||
| Origination volume |
$ | 2,757,463 | $ | 1,156,187 | ||||
| Outstanding principal balance of mortgage loans serviced |
$ | 2,545,449 | $ | 522,194 | ||||
Mortgage banking income attributable to our community banking segment was $18.7 million and $9.0 million for the years ended December 31, 2015 and 2014, respectively, and mortgage banking income attributable to our mortgage banking segment was $51.5 million and $22.2 million for the years ended December 31, 2015 and 2014.
Service charges on deposit accounts include analysis and maintenance fees on accounts, per item charges, non-sufficient funds and overdraft fees. Service charges on deposit accounts were $7.4 million for the year ended December 31, 2015, remaining relatively flat from the year ended December 31, 2014.
ATM and interchange fees include debit card interchange, ATM and other consumer fees. Other charges and fees increased 16.0% to $6.5 million for the year ended December 31, 2015 as compared to $5.6 million in the year ended December 31, 2014, as a result of increased debit card fees from continued growth in client usage of debit cards.
Bargain purchase gain of $2,794 for the year ended December 31, 2015 represents the excess fair value of net assets acquired over the purchase price in our acquisition of NWGB.
Gains on sales of securities for the year ended December 31, 2015 were $1.8 million, resulting from the sale of approximately $194.6 million in securities, compared to gains on sales of securities in the year ended December 31, 2014 of $2.0 million. The gains are attributable to management taking advantage of portfolio structuring opportunities to lock in current gains while maintaining comparable interest rates and maturities and to fund current loan growth.
131
Table of Contents
Index to Financial Statements
Net loss on sales or write-downs of foreclosed assets for the year ended December 31, 2015 was $300 thousand compared to a net gain of $100 thousand for the year ended December 31, 2014. This change was the result of specific sales and valuation transactions of other real estate.
Other noninterest income for the year ended December 31, 2015 was $3.9 million as compared to other noninterest income of $4.6 million for the year ended December 31, 2014. This $0.7 million decrease in other noninterest income was partly due to a $0.4 million loss incurred on the dissolution of a limited partnership in the year ended December 31, 2015.
Year ended December 31, 2014 compared to year ended December 31, 2013
Noninterest income was $50.8 million for the year ended December 31, 2014, an increase of $9.4 million, or 22.8%, as compared to $41.4 million for 2013. Noninterest income to average assets (excluding any gains or losses from sale of securities) was 2.2% in 2014 as compared to 1.9% in 2013.
Mortgage banking income was $31.1 million and $24.0 million for the years ended December 31, 2014 and 2013, respectively. Originations of mortgage loans to be sold totaled $1,156.2 million for 2014 as compared to $829.9 million for 2013. The increase in originations of mortgage loans to be sold and the related gain on the sales in both 2014 compared to 2013 is due to continued expansion of our mortgage banking business into new markets, the addition of internet delivery channel and favorable interest rates. Mortgage servicing rights were carried at amortized cost of $6.0 million at December 31, 2014. Prior to 2014 we did not retain any servicing rights on the mortgages we originated and sold.
The margin on the origination and sales of mortgage loans was 2.66% and 2.89% for the years ended December 31, 2014 and 2013, respectively. The decline is a result of growth of the Third Party Origination and Consumer Direct delivery channels, which traditionally have tighter margins than the retail channel. The components of our mortgage banking income for the years ended December 31, 2014 and 2013 were as follows:
| Year Ended December 31, | ||||||||
| (in thousands) | 2014 | 2013 | ||||||
| Mortgage banking income: |
||||||||
| Origination and sales of mortgage loans |
$ | 30,794 | $ | 23,968 | ||||
| Mortgage servicing income |
341 | — | ||||||
|
|
|
|
|
|||||
| Total mortgage banking income |
$ | 31,135 | $ | 23,968 | ||||
|
|
|
|
|
|||||
| Origination volume |
$ | 1,156,187 | $ | 829,911 | ||||
| Outstanding principal balance of mortgage loans serviced |
$ | 522,194 | $ | — | ||||
Mortgage banking income attributable to our community banking segment was $9.0 million and $5.3 million for the years ended December 31, 2014 and 2013, respectively, and mortgage banking income attributable to our mortgage banking segment was $22.2 million and $18.7 million for the years ended December 31, 2014 and 2013.
Service charges on deposit accounts were $7.3 million for 2014, an increase of $0.4 million or 5.9%, over 2013. The improvements in service charges on deposit accounts in 2014 were primarily due to increased analysis fees on our commercial client accounts.
Other charges and fees increased 7.6% to $5.6 million during 2014 as compared to $5.2 million for 2013. Interchange fees on debit card transactions were the primary contributor to the increases in other charges and fees.
Gains on sales of securities for 2014 were $2.0 million, resulting from the sale of approximately $68.9 million in securities, compared to gains on sales of securities for 2013 of $34.0 thousand, resulting from the sale of
132
Table of Contents
Index to Financial Statements
approximately $0.1 million in securities. The gains on sales of securities in 2014 were primarily attributable to $1.4 million in gains resulting from beneficial portfolio structuring opportunities to lock in gains on our securities portfolio while maintaining comparable or favorable interest rates and maturities in our portfolio. In addition, we sold a trust preferred security to an entity affiliated with our sole shareholder at par plus accrued interest. We recorded other than temporary impairment in prior years and the value was recorded at $110 thousand. We requested bids from six entities plus the affiliated entity to establish a fair value for the trust preferred security. We believe that the bids received by these independent parties represent market activity, and as such, represent a fair market value for the security. We recorded a gain of $582 thousand on the sale of this security.
Net gain on sales or write-downs of foreclosed assets for the year ended December 31, 2014 was $0.1 million compare to a net gain of $0.2 million for the year ended December 31, 2013. This change was primarily attributed to differences in detail sales transactions of specific properties.
Other noninterest income for 2014 was $4.6 million, a decrease of $0.4 million from 2013, primarily driven by the collection of a lease breakage fee of $0.5 million receivable from a lessor in 2013, which did not occur in 2014.
Noninterest expense
Our noninterest expense includes primarily salaries and employee benefits expense, occupancy expense, legal and professional fees, data processing expense, FDIC insurance, advertising and promotion and foreclosed asset expense, among others. We monitor the ratio of noninterest expense to the sum of net interest income plus noninterest income, which is commonly known as the efficiency ratio.
The following table sets forth the components of noninterest expense for the periods indicated:
| Six months ended June 30, (unaudited) |
Year ended December 31, | |||||||||||||||||||
| (in thousands) | 2016 | 2015 | 2015 | 2014 | 2013 | |||||||||||||||
| Salaries and employee benefits |
$ | 50,610 | $ | 38,960 | $ | 84,214 | $ | 63,863 | $ | 54,401 | ||||||||||
| Occupancy and fixed asset expense |
6,396 | 5,151 | 10,777 | 9,421 | 8,832 | |||||||||||||||
| Legal and professional fees |
1,888 | 1,142 | 3,355 | 3,175 | 2,435 | |||||||||||||||
| Merger and conversion expenses |
2,146 | 287 | 3,543 | — | — | |||||||||||||||
| Data processing expense |
1,330 | 1,009 | 2,053 | 2,430 | 2,826 | |||||||||||||||
| Amortization of core deposit intangible |
1,079 | 806 | 1,731 | 1,613 | 1,726 | |||||||||||||||
| Amortization of mortgage servicing rights |
3,425 | 779 | 2,601 | 397 | — | |||||||||||||||
| Impairment of mortgage servicing rights |
5,687 | — | 194 | — | — | |||||||||||||||
| Regulatory fees and deposit insurance assessments |
1,016 | 915 | 2,190 | 1,938 | 2,150 | |||||||||||||||
| Foreclosed assets expense |
422 | 310 | 643 | 1,121 | 1,946 | |||||||||||||||
| Software license and maintenance fees |
1,858 | 851 | 1,986 | 1,416 | 1,808 | |||||||||||||||
| Advertising |
5,851 | 3,374 | 7,866 | 2,873 | 1,390 | |||||||||||||||
| Other |
10,234 | 7,449 | 17,339 | 13,916 | 12,070 | |||||||||||||||
|
|
|
|||||||||||||||||||
| Total noninterest expense |
$ | 91,942 | $ | 61,033 | $ | 138,492 | $ | 102,163 | $ | 89,584 | ||||||||||
|
|
||||||||||||||||||||
Six months ended June 30, 2016 compared to six months ended June 30, 2015
Noninterest expense increased by $30.9 million during the six months ended June 30, 2016 to $91.9 million as compared to $61.0 million in the six months ended June 30, 2015. This increase resulted primarily from higher
133
Table of Contents
Index to Financial Statements
salaries and employee benefits expenses in addition to the one time impairment of mortgage servicing rights and increased costs associated with our growth and acquisition of NWGB.
Salaries and employee benefits expense is the largest component of noninterest expenses representing 55.0% and 63.8% of total noninterest expense in the six months ended June 30, 2016 and 2015, respectively. During the six months ended June 30, 2016, salaries and employee benefits expense increased $11.7 million, or 29.9%, to $50.6 million as compared to $39.0 million for the six months ended June 30, 2015. The increase in the six months ended June 30, 2016 was primarily due to the $6.9 million increase in mortgage banking salaries and benefits resulting from the increase in mortgage loan origination and delivery expansion and growth of our senior management team. Salaries and employee benefits expense includes amounts earned under our three management incentive plans that are based on our total assets, tangible book value of consolidated equity and contractually-defined after-tax earnings. Aggregate salaries and employee benefits expense recognized under these incentive plans totaled $1.5 million and $1.7 million for the six months ended June 30, 2016 and 2015, respectively. As described in the “Executive compensation and other matters” section of this prospectus, we will provide certain compensation benefits to certain of our executive officers and employees in the form of restricted stock grants and other awards in connection with this offering. As a result, we expect to record approximately $3.66 million in additional compensation expense during the third quarter of 2016 and additional ongoing compensation expense over the vesting period of these awards.
Occupancy and fixed asset expense in the six months ended June 30, 2016 was $6.4 million, an increase of $1.2 million, compared to $5.2 million for the six months ended June 30, 2015. This increase was attributable to new branch expansion in Nashville market in addition to the acquisition of NWGB.
Legal and professional fees were $1.9 million for the six months ended June 30, 2016 as compared to $1.1 million for the six months ended June 30, 2015. The increase in legal and professional fees is attributable to additional professional services related to our growth and volume of business.
Merger and conversion expenses related to the acquisition of NWGB were $2.1 million for the six months ended June 30, 2016 as compared to $0.3 million for the six months ended June 30, 2015. We estimate an additional $1.1 million in merger-related costs to be incurred through the fourth quarter of 2016 related to the acquisition of NWGB and conversion of our core system to Jack Henry Silverlake.
Data processing costs increased $0.3 million, or 31.8%, to $1.3 million for the six months ended June 30, 2016 from $1.0 million for the six months ended June 30, 2015. The increase for the six months ended June 30, 2016 was attributable to our growth and volume of transaction processing.
Amortization of intangible assets totaled $1.1 million for the six months ended June 30, 2016 compared to $0.8 million for the six months ended June 30, 2015. This amortization relates to core deposit intangible assets, which are being amortized over their useful lives. As of June 30, 2016 and 2015, these intangible assets have remaining estimated useful lives of approximately 1 year and 2 years, respectively.
Mortgage servicing rights are recognized as a separate asset on the date the corresponding mortgage loan is sold. Mortgage servicing rights are amortized in proportion to and over the period of estimated net servicing income. The amortization of mortgage servicing rights is determined using the level yield method based on the expected life of the loan. These servicing rights are carried at the lower of amortized cost or fair value. Fair value is determined using an income approach with various assumptions including expected cash flows, prepayment speeds, market discount rates, servicing costs and other factors. Mortgage servicing rights were carried at amortized cost less impairment of $40.4 million and $16.4 million at June 30, 2016 and 2015, respectively, and amortization expense amounted to $3.4 million and $0.8 million for the six months ended June 30, 2016 and 2015, respectively. Impairment losses on mortgage servicing rights are recognized to the
134
Table of Contents
Index to Financial Statements
extent by which the unamortized cost exceeds fair value. Impairment losses on mortgage servicing rights of $5.7 million and $0 were recognized in earnings in the six months ended June 30, 2016 and 2015, respectively.
Due to capital limitations and other considerations, we intend to sell a significant portion of our mortgage servicing rights during the remainder of 2016. We expect to incur between $1.5 million and $2.5 million of transaction expenses in connection with these anticipated sales. However, the actual timing and expenses associated with these sales may differ from our current expectations depending on market conditions and transaction-specific details. In conjunction with the anticipated sales of these mortgage servicing rights, we may incur additional impairment charges if we are unable to sell these mortgage servicing rights at the carrying value of the associated mortgage servicing right asset on our financial statements, which could result from changing market conditions and changing interest rates. Furthermore, based upon market conditions and market data gained from these anticipated sales, we could be required to incur additional impairment charges on our remaining mortgage servicing right asset if such sales are at lower prices than the carrying value of remaining mortgage servicing right assets. We also intend to establish an ongoing arrangement whereby we could sell some or all of our ongoing mortgage servicing rights through a co-issue flow mechanism to facilitate future sales without incurring ongoing transaction costs.
Regulatory fees and deposit insurance assessments were $1.0 million for six months ended June 30, 2016, an increase of $0.1 million compared to $0.9 million for the six months ended June 30, 2015. This increase is attributable to our growth in deposits.
Expenses related to foreclosed assets for the six months ended June 30, 2016 were $422 thousand, an increase of $112 thousand compared to $310 thousand for the six months ended June 30, 2015. Legal fees related to foreclosed real estate sold was the primary driver for the increase.
Software license and maintenance fees for the six months ended June 30, 2016 were $1.9 million, an increase of $1.0 million compared to $0.9 million for the six months ended June 30, 2015.
Advertising costs for the six months ended June 30, 2016 were $5.9 million, an increase of $2.5 million compared to $3.4 million for the six months ended June 30, 2015. This increase was largely driven by the mortgage banking segment’s internet delivery channel.
Other noninterest expense for six months ended June 30, 2016 was $10.2 million, an increase of $2.8 million from the six months ended June 30, 2015, reflecting an increase of various expenses in mortgage banking activities and growth associated with the acquisition of NWGB.
Year ended December 31, 2015 compared to year ended December 31, 2014
Noninterest expense increased by $36.3 million for the year ended December 31, 2015 to $138.5 million as compared to $102.2 million for the year ended December 31, 2014. This increase resulted primarily from higher salaries and employee benefits expenses associated with the expansion of our mortgage banking business. Our acquisition of NWGB contributed $1.7 million to the overall increase.
Salaries and employee benefits expense is the largest component of noninterest expenses representing 60.8% and 62.5% of total noninterest expense for the year ended December 31, 2015 and 2014, respectively. During the year ended December 31, 2015, salaries and employee benefits expense increased $20.3 million, or 31.9%, to $84.2 million as compared to $63.9 million for the year ended December 31, 2014. The increases for the year ended December 31, 2015 were primarily due to the $18.1 million increase in mortgage banking salaries and benefits resulting from the increase in mortgage loan origination and delivery expansion. Salaries and employee benefits expense includes amounts earned under our three management incentive plans that are based on our total assets, tangible book value of consolidated equity and contractually-defined after-tax
135
Table of Contents
Index to Financial Statements
earnings. Aggregate salaries and employee benefits expense recognized under these incentive plans totaled $3.2 million and $5.8 million for the years ended December 31, 2015 and 2014, respectively.
Occupancy and fixed asset expense for the year ended December 31, 2015 was $10.8 million, an increase of $1.4 million, compared to $9.4 million in the year ended December 31, 2014. This increase was attributable to new branch expansion in the Nashville and Huntsville markets.
Legal and professional fees were $3.4 million for the year ended December 31, 2015 as compared to $3.2 million for the year ended December 31, 2014. The increase in professional fees is attributable to additional professional services related to our growth and volume of business in addition to certain merger-related costs.
Merger and conversion expenses related to the acquisition of NWGB were $3.5 million for the year ended December 31, 2015. Approximately $2.2 million was related to the termination of our existing contract with our core system service provider in conjunction our planned core conversion in the second quarter of 2016.
Data processing costs decreased $300 thousand, or 15.5%, to $2.1 million for the year ended December 31, 2015 from $2.4 million for the year ended December 31, 2014. The decrease for the year ended December 31, 2015 was attributable to a change in vendors for item transaction processing.
Amortization of core deposit intangible assets totaled $1.7 million and $1.6 million for the years ended December 31, 2015 and 2014, respectively. This amortization relates to core deposit intangible assets, which are being amortized over their useful lives. As of December 31, 2015, the intangible assets which existed prior to the acquisition of NWGB have remaining estimated useful lives of approximately 1 year. As a result of the acquisition of NWGB during the fourth quarter of 2015, we acquired $4.9 million in core deposit intangible assets, which is estimated to have a useful life of approximately 10 years.
Prior to 2014, all of our mortgage loan sales transferred servicing rights to the buyer. Beginning in the first quarter of 2014, we began retaining some servicing rights. These mortgage servicing rights are recognized as a separate asset on the date the corresponding mortgage loan is sold. Mortgage servicing rights are amortized in proportion to and over the period of estimated net servicing income. The amortization of mortgage servicing rights is determined using the level yield method based on the expected life of the loan. These servicing rights are carried at the lower of amortized cost or fair value. Fair value is determined using an income approach with various assumptions including expected cash flows, prepayment speeds, market discount rates, servicing costs and other factors. Mortgage servicing rights were carried at cost less impairment of $29.7 million at December 31, 2015 as compared to at cost of $6.0 million at December 31, 2014. Impairment losses on mortgage servicing rights are recognized to the extent by which the unamortized cost exceeds fair value. Impairment losses on mortgage servicing rights of $194 thousand were recognized in earnings for the year ended December 31, 2015. No impairment was recognized for the year ended December 31, 2014.
Regulatory and deposit insurance assessments were $2.2 million and $1.9 million for the years ended December 31, 2015 and 2014, respectively. The increase was primarily due to an increase in deposits.
Expenses related to foreclosed assets for the year ended December 31, 2015 were $643 thousand, an increase of $478 thousand compared to the year ended December 31, 2014. Legal fees related to foreclosed real estate sold was the primary driver for the increase.
Software license and maintenance fees for the year ended December 31, 2015 were $2.0 million, an increase of $0.6 million compared to $1.4 million for the year ended December 31, 2014.
Advertising costs for the year ended December 31, 2015 were $7.9 million, an increase of $5.0 million compared to $2.9 million for December 31, 2014. This increase was largely driven by mortgage banking segment’s internet delivery channel.
136
Table of Contents
Index to Financial Statements
Other noninterest expense for the year ended December 31, 2015 was $17.3 million, an increase of $3.4 million from the year ended December 31, 2014, reflecting an increase of various expenses in our mortgage banking activities.
Year ended December 31, 2014 compared to year ended December 31, 2013
Noninterest expense increased by $12.6 million during 2014 to $102.2 million as compared to $89.6 million in 2013. This increase resulted primarily from higher compensation expense associated with additional headcount due to continued expansion of our banking and mortgage banking businesses and higher commissions and other compensation related to higher loan production.
Salaries and employee benefits expense was 62.5% and 60.7% of total noninterest expense in 2014 and 2013, respectively. During 2014, salaries and employee benefits expense increased $9.5 million, or 17.4%, to $63.9 million as compared to $54.4 million for 2013. The increases in 2014 were primarily due to additional headcount and higher commission-based and other compensation related to increased loan production, including, in particular, from our mortgage banking business. Aggregate salaries and employee benefits expense recognized under these incentive plans totaled $5.8 million in 2014 and $2.3 million in 2013.
Occupancy and fixed asset expense in 2014 was $9.4 million, an increase of $0.6 million, compared to $8.8 million for 2013. This increase was attributable to increased occupancy costs associated with locations added in recent years as our commercial and mortgage banking businesses have expanded.
Legal and professional fees were $3.2 million for 2014 as compared to $2.4 million for 2013. The increase in professional fees is attributable to additional professional services related to our growth and volume of business, as well as additional legal, accounting and consulting fees associated with compliance costs of banking and governmental regulation.
Data processing costs decreased $0.4 million, or 14.0%, to $2.4 million for 2014 from $2.8 million for 2013. The decrease for 2014 was attributable to a change in vendor for certain software and IT support services.
Amortization of intangible assets totaled $1.6 million for 2014 compared to $1.7 million for 2013. This amortization relates to core deposit intangible assets, which are being amortized over their useful lives. As of December 31, 2014, these intangible assets have remaining estimated useful lives of approximately two years.
Regulatory and deposit insurance assessments were $1.9 million for 2014, a decrease of $0.3 million compared to $2.2 million for 2013. This decrease is attributable to a decrease in the assessment rate charged by regulators of the Bank.
Expenses related to foreclosed assets for 2014 were $1.1 million, a decrease of $0.8 million compared to 2013. In 2014 we recognized losses for write downs of $0.3 million of the carrying value to fair value on certain pieces of property held in foreclosed assets compared to write downs of $0.8 million in 2013. Foreclosed assets with a cost basis of $4.3 million were sold during 2014, resulting in a net gain of $0.5 million compared to a net gain of $1.0 million from sales of $5.0 million in 2013.
Software license and maintenance fees for 2014 was $1.4 million, a decrease of $0.4 million compared to $1.8 million for 2013.
Advertising costs for the year ended December 31, 2014 were $2.9 million, an increase of $1.5 million compared to $1.4 million for the year ended December 31, 2013. This increase was driven by the growth in our mortgage banking business.
Other noninterest expense for 2014 was $13.9 million, an increase of $1.8 million from 2013, reflecting an increased business development expenses associated with entering new markets and new lines of business in mortgage banking, as well as an increase of $0.4 million in VISA transaction expenses.
137
Table of Contents
Index to Financial Statements
Efficiency ratio
The efficiency ratio is one measure of productivity in the banking industry. This ratio is calculated to measure the cost of generating one dollar of revenue. That is, the ratio is designed to reflect the percentage of one dollar which must be expended to generate that dollar of revenue. We calculate this ratio by dividing noninterest expense by the sum of net interest income on a fully taxable equivalent basis and noninterest income, excluding gains (losses) or sales of investment securities.
Our efficiency ratio, on a tax-equivalent basis, was 69.54% and 71.60% for the six months ended June 30, 2016 and 2015, respectively, and improved to 73.26% in 2015 as compared to 76.15% in 2014 and 75.43% in 2013 due to the Company’s ability to increase revenue at a greater rate than noninterest expense and increased profit margins. The increase in revenue is primarily driven by the increase in mortgage origination volume. For additional information, see “Selected historical consolidated financial data: GAAP reconciliation and management explanation of non-GAAP financial measures.”
Return on equity and assets
Over the past five years, we have consistently improved our profitability as a result of the success of our growth strategies to grow quality loans and low-cost deposits as well as the improving economic conditions in our markets during the periods indicated in the table below. The following table sets forth our ROAA, ROAE, dividend payout ratio and average shareholders’ equity to average assets ratio for the periods indicated:
| Six months ended June 30, (unaudited) |
Year ended December 31, | |||||||||||||||||||||||||||
| 2016 | 2015 | 2015 | 2014 | 2013 | 2012 | 2011 | ||||||||||||||||||||||
| Return on average: |
||||||||||||||||||||||||||||
| Total assets |
2.11% | 1.86% | 1.86% | 1.40% | 1.22% | 0.96% | 0.69% | |||||||||||||||||||||
| Shareholders’ equity |
23.94% | 20.46% | 20.91% | 15.94% | 13.98% | 10.85% | 8.92% | |||||||||||||||||||||
| Dividend payout ratio |
30.62% | 45.69% | 49.31% | 51.14% | 41.85% | 7.10% | N/A | |||||||||||||||||||||
| Average shareholders’ equity to average assets |
8.82% | 9.09% | 8.88% | 8.81% | 8.73% | 8.82% | 7.79% | |||||||||||||||||||||
|
|
||||||||||||||||||||||||||||
Income tax
Income tax expense was $2.2 million and $1.6 million for the six months ended June 30, 2016 and 2015, respectively, and was $3.0 million and $2.3 million for the years ended December 31, 2015 and 2014, respectively, and $1.9 million for the year ended December 31, 2013. The effective tax rates were 6.7%, 6.8%, 6.2%, 6.5% and 6.6% for the six months ended June 30, 2016 and 2015 and for the years ended December 31, 2015, 2014 and 2013, respectively. We have elected to be taxed as an S Corporation. Under these provisions, we do not pay corporate U.S. federal income tax on our taxable income. Instead, our taxable income is “passed through” to our shareholder. Our effective tax rate reflects our liability for various state corporate taxes, including Tennessee, which taxes are not “passed through” to our shareholder. See “S Corporation status” under this section for a discussion of our status as an S Corporation and “Pro forma income tax expense and net income” below for a discussion on what our income tax expense and net income would have been had we been taxed as a C Corporation.
Pro forma income tax expense and net income
As a result of our status as an S Corporation, we had no U.S. federal income tax expense for the six months ended June 30, 2016 and 2015 or for the years ended December 31, 2015, 2014 or 2013. We have determined
138
Table of Contents
Index to Financial Statements
that had we been taxed as a C Corporation and paid U.S. federal income tax for the six months ended June 30, 2016 and 2015, our combined effective income tax rate would have been 37.39% and 36.72%, respectively, and for the years ended December 31, 2015, 2014 and 2013, our combined effective federal and state income tax rates would have been 35.08%, 35.63% and 35.37% for those years, respectively. These pro forma effective rates reflect a U.S. federal income tax rate of 35.00% on corporate income and the fact that a portion of our net income in each of these periods was derived from nontaxable investment income and other nondeductible expenses. Our net income for the six months ended June 30, 2016 and 2015 was $30.4 million and $22.8 million, respectively, and our tax-equivalent interest income for such periods was $60.0 million and $49.9 million. Our net income for years ended December 31, 2015 and 2014 was $47.9 million and $32.5 million, respectively, and our tax-equivalent interest income for such periods was $104.8 million and $95.0 million, respectively. Our net income for the fiscal 2013 was $26.9 million and our tax-equivalent interest income was $89.2 million. Had we been subject to U.S. federal income tax during these periods, on a pro forma basis, our provision for combined federal and state income tax would have been $12.2 and $9.0, respectively, for the six months ended June 30, 2016 and 2015, and $17.9 million, $12.4 million and $10.2 million, respectively, for the years ended December 31, 2015, 2014 and 2013. The increases in such pro forma provision for U.S. federal income tax would have resulted primarily from the increase in our net income for such periods. As a result of the foregoing factors, our pro forma net income (after U.S. federal income tax) for the six months ended June 30, 2016 and 2015 would have been $20.4 million and $15.4 million, respectively, and for the years ended December 31, 2015 and 2014 would have been $33.1 million and $22.4 million, respectively, and for the years ended December 31, 2013 would have been $18.6 million. If we gave effect to our conversion from a subchapter S Corporation as of June 30, 2016, we would have recorded a deferred tax liability of $15.1 million along with a corresponding $12.8 million decrease to shareholder’s equity.
Financial condition
The following discussion of our financial condition compares six months ended June 30, 2016 with the years ended December 31, 2015, 2014 and 2013.
Total assets
Our total assets were $2.92 billion at June 30, 2016. This compares to total assets of $2.90 billion as of December 31, 2015, $2.43 billion at December 31, 2014 and $2.26 billion at December 31, 2013. The increasing trend in total assets is primarily attributable to increases in both loans held for sale and loan held for investment balances, driven by strong demand for our loan products in our markets and the success of our growth initiatives to grow our loans in addition to our acquisition of NWGB.
Loan portfolio
Our loan portfolio is our most significant earning asset, comprising 60.0%, 58.7%, 58.3% and 59.4% of our total assets as of June 30, 2016, December 31, 2015, 2014 and 2013, respectively. Our strategy is to grow our loan portfolio by originating quality commercial and consumer loans that comply with our credit policies and that produce revenues consistent with our financial objectives. We believe our loan portfolio is well-balanced, which provides us with the opportunity to grow while monitoring our loan concentrations.
Loans
Loans increased $48.4 million, or 2.8%, to $1.75 billion as of June 30, 2016 as compared to $1.70 billion as of December 31, 2015. Our loan growth during the six months ended June 30, 2016 has been comprised of an increase of $38.5 million or 12.1% in commercial and industrial, a decrease of $21.0 million or 9.1% in
139
Table of Contents
Index to Financial Statements
construction loans, increase of $15.8 million or 4.8% in owner occupied commercial real estate, an increase of $26.7 million or 11.2% in non-owner occupied commercial real estate as well as a decrease in residential real estate of 3.3% and an increase in consumer and other of 8.0%, respectively. The slight increase in loans during the six months ended June 30, 2016 is attributable to continued strong demand in our metropolitan markets and continued favorable economic conditions.
Loans increased $286.0 million, or 20.0% to $1.70 billion as of December 31, 2015, as compared to $1.42 billion as of December 31, 2014. Loans acquired due to the acquisition of NWGB contributed $76.6 million or 26.8%, of this increase. Our loan growth during the years ended December 31, 2015 has been comprised of an increase of $56.3 million, or 31.1%, in non-owner occupied commercial real estate. Construction loans increased by $69.2 million, or 42.8%. Commercial and industrial loans grew by $54.4 million, or 20.7%. Owner-occupied commercial real estate increased by $49.2 million, or 17.5%. Consumer and other and residential line of credit loans grew by $14.1 million and $11.7 million, respectively. The increase in loans as of December 31, 2015 was attributable to growth in our metropolitan markets, primarily in the Nashville MSA, driven by the investment in new locations and banking teams and continued favorable economic conditions in our markets, as well as our acquisition of NWGB.
Loans increased $74.5 million, or 5.6%, to $1.42 billion as of December 31, 2014, as compared to $1.34 billion as of December 31, 2013. Our loan growth during 2014 has been comprised of an increase in construction loans of $49.8 million, or 44.4%, an increase in owner occupied commercial real estate loans of $18.8 million, or 7.2%, an increase in residential 1-to-4 family real estate loans of $12.6 million, or 5.0%, partially offset by a decrease in commercial non-owner occupied real estate loans of $19.4 million, or 9.7%. The increase in construction loans was primarily a result of growth in the Nashville MSA generated by a new residential construction banking team. The decrease in commercial non-owner occupied real estate loans was driven primarily by maturities and payoffs of specific credits in the Nashville and Chattanooga MSAs. The overall increase in other types of loans in 2014 was attributable to strong demand for our loan products, driven by the success of our growth initiatives and favorable economic conditions in our market with significant loan growth occurring in the Nashville MSA.
140
Table of Contents
Index to Financial Statements
Loans by type
The following table sets forth the balance and associated percentage of each major category in our loan portfolio of loans as of the dates indicated:
| As of December 31, | ||||||||||||||||||||||||||||||||||||||||||||||||
| June 30, 2016 (unaudited) |
2015 | 2014 | 2013 | 2012 | 2011 | |||||||||||||||||||||||||||||||||||||||||||
| (dollars in thousands) |
Amount | % of total |
Amount | % of total |
Amount | % of total |
Amount | % of total |
Amount | % of total |
Amount | % of total |
||||||||||||||||||||||||||||||||||||
| Loan Type: |
||||||||||||||||||||||||||||||||||||||||||||||||
| Commercial and industrial |
$ | 355,558 | 20% | $ | 317,038 | 19% | $ | 262,682 | 18% | $ | 251,557 | 19% | $ | 206,952 | 17% | $ | 195,398 | 17% | ||||||||||||||||||||||||||||||
| Construction |
210,029 | 12% | 231,025 | 13% | 161,828 | 11% | 112,060 | 8% | 82,985 | 7% | 80,629 | 7% | ||||||||||||||||||||||||||||||||||||
| Residential real estate: |
||||||||||||||||||||||||||||||||||||||||||||||||
| 1-to-4 family |
286,335 | 17% | 287,749 | 17% | 263,899 | 19% | 251,271 | 19% | 238,487 | 19% | 236,338 | 20% | ||||||||||||||||||||||||||||||||||||
| Line of credit |
174,523 | 10% | 171,526 | 10% | 159,868 | 11% | 158,111 | 12% | 163,299 | 13% | 166,955 | 14% | ||||||||||||||||||||||||||||||||||||
| Multi-family |
41,005 | 2% | 59,510 | 4% | 52,238 | 4% | 45,497 | 3% | 24,296 | 2% | 37,788 | 3% | ||||||||||||||||||||||||||||||||||||
| Commercial real estate: |
||||||||||||||||||||||||||||||||||||||||||||||||
| Owner-Occupied |
345,999 | 20% | 330,207 | 19% | 280,972 | 20% | 262,190 | 20% | 235,035 | 19% | 221,459 | 19% | ||||||||||||||||||||||||||||||||||||
| Non-Owner Occupied |
263,893 | 15% | 237,222 | 14% | 180,929 | 13% | 200,349 | 15% | 212,832 | 17% | 168,868 | 14% | ||||||||||||||||||||||||||||||||||||
| Consumer and other |
72,962 | 4% | 67,586 | 4% | 53,480 | 4% | 60,312 | 4% | 75,791 | 6% | 73,733 | 6% | ||||||||||||||||||||||||||||||||||||
|
|
|
|||||||||||||||||||||||||||||||||||||||||||||||
| Total loans |
$ | 1,750,304 | 100% | $ | 1,701,863 | 100% | $ | 1,415,896 | 100% | $ | 1,341,347 | 100% | $ | 1,239,677 | 100% | $ | 1,181,168 | 100% | ||||||||||||||||||||||||||||||
|
|
||||||||||||||||||||||||||||||||||||||||||||||||
Loan concentrations are considered to exist when there are amounts loaned to a number of borrowers engaged in similar activities which would cause them to be similarly impacted by economic or other conditions. At June 30, 2016 and December 31, 2015, there were no concentrations of loans exceeding 10% of loans other than the categories of loans disclosed in the table above.
Loan categories
The principal categories of our loan held for investment portfolio are discussed below:
Commercial and industrial loans. We provide a mix of variable and fixed rate commercial and industrial loans. Our commercial and industrial loans are typically made to small and medium-sized manufacturing, wholesale, retail and service businesses for working capital and operating needs and business expansions, including the purchase of capital equipment and loans made to farmers relating to their operations. Commercial and industrial loans generally include lines of credit and loans with maturities of five years or less. The loans are generally made with operating cash flows as the primary source of repayment, but may also include collateralization by inventory, accounts receivable, equipment and personal guarantees. We plan to continue to make commercial and industrial loans an area of emphasis in our lending operations in the future. As of June 30, 2016, our commercial and industrial loans comprised of $355.6 million, or 20% of loans as compared to December 31, 2015, our commercial and industrial loans comprised $317.0 million, or 19%, of loans, $6.6 million, or 2.1%, of which were acquired in connection with our acquisition of NWGB. This compares to $262.7 million, or 18%, of loans and $251.6 million, or 19%, of loans as of December 31, 2014 and 2013, respectively. Commercial and industrial loan balances have grown consistently since December 31, 2011.
141
Table of Contents
Index to Financial Statements
Commercial real estate owner-occupied loans. Our commercial real estate owner-occupied loans include loans to finance commercial real estate owner occupied properties for various purposes including use as offices, warehouses, production facilities, health care facilities, retail centers, restaurants, churches and agricultural based facilities. Commercial real estate owner-occupied loans are typically repaid through the ongoing business operations of the borrower, and hence are dependent on the success of the underlying business for repayment and are more exposed to general economic conditions. As of June 30, 2016, our owner occupied commercial real estate loans comprised $346.0 million or 20% of loans, compared to $330.2 million, or 19% of loans as of December 31, 2015, $21.3 million, or 6.5% of which were acquired in connection with our acquisition of NWGB. This compares to $281.0 million, or 20%, of loans and $262.2 million, or 20%, of loans as of December 31, 2014 and 2013, respectively. Owner occupied commercial real estate loans have increased annually since December 31, 2011.
Commercial real estate non-owner occupied loans. Our commercial real estate non-owner occupied loans include loans to finance commercial real estate non-owner occupied investment properties for various purposes including use as offices, warehouses, health care facilities, hotels, mixed-use residential/commercial, retail centers, multifamily properties, assisted living facilities and agricultural based facilities. Commercial real estate non-owner occupied loans are typically repaid with the funds received from the sale of the completed property or rental proceeds from such property, and are therefore more sensitive to adverse conditions in the real estate market, which can also be affected by general economic conditions. As of June 30, 2016, our non-owner occupied commercial real estate loans comprised $263.9 million, or 15% of loans, compared to $237.2 million, or 14%, of loans as of December 31, 2015, $17.4 million, or 7.3% of which were acquired in connection with our acquisition of NWGB. This compares to $180.9 million, or 13%, of loans and $200.3 million, or 15%, of loans as of December 31, 2014 and 2013, respectively. Commercial real estate non-owner occupied loans have increased consistently since December 31, 2011 with the exception of the year ended December 31, 2014 when they decreased $19.4 million, or 9.7%, due to maturities and payoffs of specific credits in the Nashville and Chattanooga markets.
Residential real estate 1-4 family mortgage loans. Our residential real estate 1-4 family mortgage loans are primarily made with respect to and secured by single family homes, which are both owner-occupied and investor owned. We intend to continue to make residential 1-4 family housing loans at a similar pace, so long as housing values in our markets do not deteriorate from current prevailing levels and we are able to make such loans consistent with our current credit and underwriting standards. As of June 30, 2016, our residential real estate mortgage loans comprised $286.3 million, or 17% of loans, compared to $287.7 million, or 17%, of loans as of December 31, 2015, $10.4 million, or 3.6% of which were acquired in connection with our acquisition of NWGB. This compares to $263.9 million, or 19%, of loans and $251.3 million, or 19%, of loans as of December 31, 2014 and 2013, respectively. Residential real estate 1-4 family mortgages have grown each period since December 31, 2011.
Home equity loans. Our home equity loans are primarily revolving, open-end lines of credit secured by 1-4 family residential properties. We intend to continue to make home equity loans if housing values in our markets do not deteriorate from current prevailing levels and we are able to make such loans consistent with our current credit and underwriting standards. Our home equity loans as of June 30, 2016 comprised $174.5 million or 10% of loans compared to $171.5 million, or 10%, of loans as of December 31, 2015, $10.9 million, or 6.4%, of which were acquired in connection with our acquisition of NWGB. This compares to $159.9 million, or 11%, of loans and $158.1 million, or 12%, of loans as of December 31, 2014 and 2013, respectively. Home equity loan activity has been relatively flat to a slight decrease for each year since December 31, 2011, with the exception of the increase during 2015 due to the acquisition of NWGB.
Multi-family residential loans. Our multi-family residential loans are primarily secured by multi-family properties, such as apartments and condominium buildings. Our multifamily loans as of June 30, 2016 comprised $41.0 million, or 2% of loans, compared to $59.5 million, or 4%, of loans as of December 31, 2015, $0.7 million, or 1.2% of which were acquired in connection with our acquisition of NWGB. This compares to $52.2 million, or 4%, or loans and $45.5 million, or 3%, of loans as of December 31, 2014 and 2013, respectively.
142
Table of Contents
Index to Financial Statements
Construction loans. Our construction real estate loans include commercial construction, land acquisition and land development loans and single-family interim construction loans to small- and medium-sized businesses and individuals. These loans are generally secured by the land or the real property being built and are made based on our assessment of the value of the property on an as-completed basis. We expect to continue to make construction loans at a similar pace so long as demand continues and the market for and values of such properties remain stable or continue to improve in our markets. As of June 30, 2016, our construction loans comprised $210.0 million, or 12% of loans compared to $231.0 million, or 13% of loans as of December 31, 2015, $8.5 million, or 3.7%, of which were acquired in connection with our acquisition of NWGB. This compares, to $161.8 million, or 11%, of loans and $112.1 million, or 8%, of loans as of December 31, 2014 and 2013, respectively. Construction loans experienced a decline in the first quarter of 2016 as construction projects were completed and moved to other categories, such as commercial real estate. Other than the first quarter of 2016, construction loans have increased each period since December 31, 2011, primarily in the Nashville metropolitan market due to improving economic conditions and the investment in a team of residential construction bankers as well as the acquisition of NWGB.
Consumer and other loans. Consumer and other loans include consumer loans made to individuals for personal purposes, including automobile purchase loans and personal lines of credit. None of these categories of loans represents a significant portion of our loan portfolio. As June 30, 2016, our consumer and other loans comprised $73.0 million, or 4% of loans, compared to $67.6 million, or 4% of loans as of December 31, 2015, $0.8 million, or 1.2%, of which were acquired in connection with our acquisition of NWGB. This compares to $53.5 million, or 4%, of loans and $60.3 million, or 4%, of loans as of December 31, 2014 and 2013, respectively.
143
Table of Contents
Index to Financial Statements
Loan maturity and sensitivities
The following tables present the contractual maturities of our loan portfolio as of June 30, 2016 and December 31, 2015. Loans with scheduled maturities are reported in the maturity category in which the payment is due. Demand loans with no stated maturity and overdrafts are reported in the “due in 1 year or less” category. Loans that have adjustable rates are shown as amortizing to final maturity rather than when the interest rates are next subject to change. The tables do not include prepayment or scheduled repayments.
| Loan type (in thousands) |
Maturing in one year or less |
Maturing in one to five years |
Maturing after five years |
Total | ||||||||||||
| As of June 30, 2016 (unaudited) |
||||||||||||||||
| Commercial |
$ | 123,694 | $ | 176,686 | $ | 55,178 | $ | 355,558 | ||||||||
| Commercial real estate: |
||||||||||||||||
| Owner occupied |
41,104 | 240,579 | 64,316 | 345,999 | ||||||||||||
| Non-owner occupied |
42,411 | 192,554 | 28,928 | 263,893 | ||||||||||||
| Residential real estate: |
||||||||||||||||
| 1-to-4 family |
55,890 | 107,866 | 122,579 | 286,335 | ||||||||||||
| Line of credit |
23,669 | 40,759 | 110,095 | 174,523 | ||||||||||||
| Multi-family |
5,261 | 34,707 | 1,037 | 41,005 | ||||||||||||
| Construction |
133,767 | 71,732 | 4,530 | 210,029 | ||||||||||||
| Consumer and other |
31,044 | 28,848 | 13,070 | 72,962 | ||||||||||||
|
|
|
|||||||||||||||
| Total |
$ | 456,840 | $ | 893,731 | $ | 399,733 | $ | 1,750,304 | ||||||||
|
|
||||||||||||||||
| Loan type (in thousands) |
Maturing in one year or less |
Maturing in one to five years |
Maturing after five years |
Total | ||||||||||||
| As of December 31, 2015 |
||||||||||||||||
| Commercial |
$ | 149,743 | $ | 160,514 | $ | 6,781 | $ | 317,038 | ||||||||
| Commercial real estate: |
||||||||||||||||
| Owner occupied |
36,077 | 248,000 | 46,130 | 330,207 | ||||||||||||
| Non-owner occupied |
35,098 | 181,482 | 20,642 | 237,222 | ||||||||||||
| Residential real estate: |
||||||||||||||||
| 1-to-4 family |
67,837 | 127,796 | 92,116 | 287,749 | ||||||||||||
| Line of credit |
20,562 | 58,039 | 92,925 | 171,526 | ||||||||||||
| Multi-family |
5,849 | 52,485 | 1,176 | 59,510 | ||||||||||||
| Construction |
105,131 | 108,391 | 17,503 | 231,025 | ||||||||||||
| Consumer and other |
34,746 | 32,128 | 712 | 67,586 | ||||||||||||
|
|
|
|||||||||||||||
| Total |
$ | 455,043 | $ | 968,835 | $ | 277,985 | $ | 1,701,863 | ||||||||
|
|
||||||||||||||||
144
Table of Contents
Index to Financial Statements
For loans due after one year or more, the following tables present the sensitivities to changes in interest rates as of June 30, 2016 and December 31, 2015:
| Loan type (in thousands) |
Fixed interest rate |
Floating interest rate |
Total | |||||||||
| As of June 30, 2016 (unaudited) |
||||||||||||
| Commercial |
$ | 120,557 | $ | 111,307 | $ | 231,864 | ||||||
| Commercial real estate: |
||||||||||||
| Owner occupied |
210,046 | 94,849 | 304,895 | |||||||||
| Non-owner occupied |
161,291 | 60,191 | 221,482 | |||||||||
| Residential real estate: |
||||||||||||
| 1-to-4 family |
193,169 | 37,276 | 230,445 | |||||||||
| Line of credit |
576 | 150,278 | 150,854 | |||||||||
| Multi-family |
34,258 | 1,486 | 35,744 | |||||||||
| Construction |
32,548 | 43,714 | 76,262 | |||||||||
| Consumer and other |
39,743 | 2,175 | 41,918 | |||||||||
|
|
|
|||||||||||
| Total |
$ | 792,188 | $ | 501,276 | $ | 1,293,464 | ||||||
|
|
||||||||||||
| Loan type (in thousands) |
Fixed interest rate |
Floating interest rate |
Total | |||||||||
| As of December 31, 2015 |
||||||||||||
| Commercial |
$ | 87,681 | $ | 79,614 | $ | 167,295 | ||||||
| Commercial real estate: |
||||||||||||
| Owner occupied |
220,468 | 73,662 | 294,130 | |||||||||
| Non-owner occupied |
161,577 | 40,547 | 202,124 | |||||||||
| Residential real estate: |
||||||||||||
| 1-to-4 family |
194,885 | 25,027 | 219,912 | |||||||||
| Line of credit |
570 | 150,394 | 150,964 | |||||||||
| Multi-family |
52,356 | 1,305 | 53,661 | |||||||||
| Construction |
41,485 | 84,409 | 125,894 | |||||||||
| Consumer and other |
32,413 | 427 | 32,840 | |||||||||
|
|
|
|||||||||||
| Total |
$ | 719,435 | $ | 455,385 | $ | 1,246,820 | ||||||
|
|
||||||||||||
The following table presents the contractual maturities of our loan portfolio segregated into fixed and floating interest rate loans as of June 30, 2016 and December 31, 2015:
| (in thousands) |
Fixed interest rate |
Floating interest rate |
Total | |||||||||
| As of June 30, 2016 (unaudited) |
||||||||||||
| One year or less |
$ | 235,408 | $ | 221,432 | $ | 456,840 | ||||||
| One to five years |
611,400 | 282,331 | 893,731 | |||||||||
| More than five years |
180,789 | 218,944 | 399,733 | |||||||||
|
|
|
|||||||||||
| Total |
$ | 1,027,597 | $ | 722,707 | $ | 1,750,304 | ||||||
|
|
||||||||||||
145
Table of Contents
Index to Financial Statements
| (in thousands) |
Fixed interest rate |
Floating interest rate |
Total | |||||||||
| As of December 31, 2015 |
||||||||||||
| One year or less |
$ | 238,171 | $ | 216,872 | $ | 455,043 | ||||||
| One to five years |
671,594 | 297,241 | 968,835 | |||||||||
| More than five years |
119,841 | 158,144 | 277,985 | |||||||||
|
|
|
|||||||||||
| Total |
$ | 1,029,606 | $ | 672,257 | $ | 1,701,863 | ||||||
|
|
||||||||||||
Of the loans shown above with floating interest rates totaling $722.7 million as of June 30, 2016, many of such have interest rate floors as follows:
| Loans with interest rate floors (in thousands) | Maturing in one year or less |
Weighted average level of support (bps) |
Maturing in one to five years |
Weighted average level of support (bps) |
Maturing after five years |
Weighted average level of support (bps) |
||||||||||||||||||
| As of June 30, 2016 (unaudited) |
||||||||||||||||||||||||
| Loans with current rates above floors |
$ | 84,958 | — | $ | 35,307 | — | $ | 107,317 | — | |||||||||||||||
| Loans with current rates below floors: |
||||||||||||||||||||||||
| 1-25 bps |
4,840 | 21.86 | 9,841 | 10.17 | 8,021 | 13.41 | ||||||||||||||||||
| 26-50 bps |
35,675 | 45.27 | 25,276 | 44.65 | 16,022 | 44.30 | ||||||||||||||||||
| 51-75 bps |
2,552 | 74.85 | 10,212 | 52.20 | 5,632 | 58.58 | ||||||||||||||||||
| 76-100 bps |
2,047 | 96.84 | 7,045 | 99.12 | 13,849 | 87.12 | ||||||||||||||||||
| 101-125 bps |
6,726 | 109.60 | 3,800 | 112.68 | 811 | 113.12 | ||||||||||||||||||
| 126-150 bps |
15,934 | 135.94 | 14,581 | 142.68 | 1,073 | 142.47 | ||||||||||||||||||
| 151-200 bps |
343 | 189.01 | 6,699 | 192.84 | 1,311 | 161.57 | ||||||||||||||||||
| 200-250 bps |
2,721 | 209.49 | 4,042 | 204.24 | 914 | 207.18 | ||||||||||||||||||
| 251 bps and above |
614 | 558.45 | 7,518 | 285.46 | 220 | 281.46 | ||||||||||||||||||
|
|
|
|||||||||||||||||||||||
| Total loans with current rates below floors |
$ | 71,452 | 43.27 | $ | 89,014 | 74.72 | $ | 47,853 | 14.17 | |||||||||||||||
|
|
||||||||||||||||||||||||
Asset quality
In order to operate with a sound risk profile, we focus on originating loans that we believe to be of high quality. We have established loan approval policies and procedures to assist us in maintaining the overall quality of our loan portfolio. When delinquencies in our loans exist, we rigorously monitor the levels of such delinquencies for any negative or adverse trends. From time to time, we may modify loans to extend the term or make other concessions to help a borrower with a deteriorating financial condition stay current on their loan and to avoid foreclosure. We generally do not forgive principal or interest on loans or modify the interest rates on loans to rates that are below market rates. Furthermore, we are committed to collecting on all of our loans and, as a result, at times have lower net charge-offs compared to many of our peer banks. This practice often results in us carrying higher nonperforming assets on our books than our peers, as we believe our peers are quicker to charge-off loans than we are. However, we believe that our commitment to collecting on all of our loans results in higher loan recoveries.
Nonperforming assets
Our nonperforming assets consist of nonperforming loans and foreclosed real estate. Nonperforming loans are those on which the accrual of interest has stopped, as well as loans that are contractually 90 days past due on which interest continues to accrue. Generally, the accrual of interest is discontinued when the full collection of
146
Table of Contents
Index to Financial Statements
principal or interest is in doubt or when the payment of principal or interest has been contractually 90 days past due, unless the obligation is both well secured and in the process of collection. In our loan review process, we seek to identify and proactively address nonperforming loans. As of June 30, 2016 and December 31, 2015, 2014 and 2013, we had $18.3 million, $20.5 million, $26.1 million and $38.9 million, respectively, in nonperforming assets. If such nonperforming assets would have been current during the six months ended June 30, 2016 and the year ended December 31, 2015, we would have recorded an additional $323 thousand and $1.0 million of interest income, respectively. No significant amount of interest income was recognized from loans classified as nonperforming during the six months ended June 30, 2016 or the year ended December 31, 2015. We had net interest charged off of $18 thousand and net interest income of $0.3 million for the six months ended June 30, 2016 and the year ended December 31, 2015, respectively, was recognized on loans that had previously been charged off or classified as nonperforming in previous periods. The steady decline in our nonperforming assets is the result of the consistent improvement in our overall credit quality as economic conditions in our markets have continued to improve.
The following table provides details of our nonperforming assets, the ratio of such loans and foreclosed assets to total assets as of the dates presented, and certain other related information:
| June
30, (unaudited) |
As of December 31, | |||||||||||||||||||||||
| (in thousands, except %) | 2016 | 2015 | 2014 | 2013 | 2012 | 2011 | ||||||||||||||||||
| Loan Type |
||||||||||||||||||||||||
| Commercial and industrial |
$ | 1,674 | $ | 1,762 | $ | 2,214 | $ | 1,582 | $ | 2,503 | $ | 9,980 | ||||||||||||
| Construction |
265 | 305 | 3,142 | 6,230 | 11,596 | 15,469 | ||||||||||||||||||
| Residential real estate: |
||||||||||||||||||||||||
| 1-to-4 family mortgage |
2,194 | 2,392 | 4,022 | 6,000 | 5,401 | 6,762 | ||||||||||||||||||
| Residential line of credit |
1,039 | 1,437 | 1,163 | 1,389 | 1,524 | 1,776 | ||||||||||||||||||
| Multi-family mortgage |
— | — | 1,165 | 1,262 | 7,362 | 9,019 | ||||||||||||||||||
| Commercial real estate: |
||||||||||||||||||||||||
| Owner occupied |
1,762 | 1,848 | 2,528 | 5,212 | 5,827 | 6,535 | ||||||||||||||||||
| Non-owner occupied |
4,010 | 3,638 | 2,827 | 6,607 | 17,303 | 16,964 | ||||||||||||||||||
| Consumer and other |
162 | 205 | 142 | 140 | 169 | 192 | ||||||||||||||||||
| Total nonperforming loans |
11,106 | 11,587 | 17,203 | 28,422 | 51,685 | 66,697 | ||||||||||||||||||
| Other real estate owned(1) |
5,568 | 7,296 | 7,259 | 8,796 | 10,772 | 25,955 | ||||||||||||||||||
| Other |
1,654 | 1,654 | 1,654 | 1,654 | 1,672 | — | ||||||||||||||||||
| Total nonperforming assets |
$ | 18,328 | $ | 20,537 | $ | 26,116 | $ | 38,872 | $ | 64,129 | $ | 92,652 | ||||||||||||
| Total nonperforming loans as a percentage of loans(1) |
0.66% | 0.71% | 1.21% | 2.12% | 4.17% | 5.65% | ||||||||||||||||||
| Total nonperforming assets as a percentage of total assets(1) |
0.69% | 0.78% | 1.01% | 1.72% | 2.87% | 4.42% | ||||||||||||||||||
| Total accruing loans over 90 days delinquent as a percentage of total assets(1) |
0.05% | 0.03% | 0.08% | 0.12% | 0.10% | 0.17% | ||||||||||||||||||
| Loans restructured as troubled debt restructurings |
$ | 14,970 | $ | 15,289 | $ | 18,823 | $ | 36,855 | $ | 48,193 | $ | 41,595 | ||||||||||||
| Troubled debt restructurings as a percentage of loans(1) |
0.89% | 0.94% | 1.33% | 2.60% | 3.89% | 3.52% | ||||||||||||||||||
|
|
||||||||||||||||||||||||
| (1) | Excludes assets and loans acquired from Northwest Georgia Bank of $243.4 million and $62.2 million and $260.7 million and $76.6 million, as of June 30, 2016 and December 31, 2015, respectively. |
Total nonperforming loans as a percentage of non-acquired loans were 0.7% as of June 30, 2016 as compared to 0.7% as of December 31, 2015, 1.2% as of December 31, 2014 and 2.1% as of December 31, 2013. Our
147
Table of Contents
Index to Financial Statements
coverage ratio, or our allowance for loan losses as a percentage of our nonperforming loans, was 213.70% as of June 30, 2016 as compared to 211.10% as of December 31, 2015, 168.8% as of December 31, 2014 and 113.8% as of December 31, 2013.
Management has evaluated the aforementioned loans and other loans classified as nonperforming and believes that all nonperforming loans have been adequately reserved for in the allowance for loan losses at June 30, 2016. Management also continually monitors past due loans for potential credit quality deterioration. Loans 30-89 days past due were $7.5 million at June 30, 2016, as compared to $5.0 million for the year ended December 31, 2015, $6.0 million at December 31, 2014 and $10.7 million at December 31, 2013.
Under acquisition accounting rules, loans (including those considered non-performing) acquired from NWGB were recorded at their estimated fair value. We recorded the loan portfolio acquired from NWGB at fair value as of the acquisition date, which resulted in a discount to the loan portfolio’s previous carrying value. Neither the credit portion nor any other portion of the fair value mark is reflected in the reported allowance for loan and lease losses, or related allowance coverage ratios and these loans are also excluded from our non-performing ratios above. The purchased non-credit impaired loans had remaining discount that will accrete into interest income over the life of the loans of $1.6 million and $2.1, as of June 30, 2016 and December 31, 2015, respectively. The purchased impaired loan pools had remaining discount of $1.2 million and $1.6 million, as of June 30, 2016 and December 31, 2015, respectively.
Foreclosed assets consist of properties acquired through foreclosure or acceptance of a deed in lieu of foreclosure. These properties are carried at the lower of cost or fair market value based on appraised value less estimated selling costs. Losses arising at the time of foreclosure of properties are charged against the allowance for loan losses. Reductions in the carrying value subsequent to acquisition are charged to earnings and are included in “Net gain/(loss) on sales or write downs of foreclosed assets” in the accompanying consolidated statements of income. Foreclosed assets with a cost basis of $3.5 million were sold as of six months ended June 30, 2016, resulting in a net gain of $69 thousand. Foreclosed assets with a cost basis of $3.8 million were sold during the year ended December 31, 2015, resulting in a net loss of $317 thousand, and foreclosed assets with a cost basis of $4.7 million were sold during the year ended December 31, 2014, resulting in a net gain of $132 thousand, while foreclosed assets with a cost basis of $5.0 million were sold during the year ended December 31, 2013, resulting in a net gain of $225 thousand.
Classified loans
Accounting standards require the Bank to identify loans, where full repayment of principal and interest is doubtful, as impaired loans. These standards require that impaired loans be valued at the present value of expected future cash flows, discounted at the loan’s effective interest rate, or using one of the following methods: the observable market price of the loan or the fair value of the underlying collateral if the loan is collateral dependent. We have implemented these standards in our quarterly review of the adequacy of the allowance for loan losses, and identify and value impaired loans in accordance with guidance on these standards. As part of the review process, the Bank also identifies loans classified as watch, which have a potential weakness that deserves management’s close attention.
Loans totaling $41.7 million were classified substandard under the Bank’s policy at June 30, 2016 and loans totaling $48.5 million and $46.0 million were classified substandard under the Bank’s policy as of December 31, 2015 and 2014, respectively. As of June 30, 2016 and December 31, 2015, $17.6 and $21.4 of substandard loans were acquired with deteriorated credit quality in connection with our acquisition of NWGB. Loans totaling $64.6 million were classified substandard under the Bank’s policy at December 31, 2013. The following table sets forth information related to the credit quality of our loan portfolio at June 30, 2016 and December 31, 2015.
148
Table of Contents
Index to Financial Statements
| Loan type (in thousands) | Pass | Watch | Substandard | Total | ||||||||||||
| As of June 30, 2016 (unaudited) |
||||||||||||||||
| Commercial and industrial |
$ | 348,605 | $ | 2,303 | $ | 4,650 | $ | 355,558 | ||||||||
| Construction |
201,942 | 2,632 | 5,455 | 210,029 | ||||||||||||
| Residential real estate: |
||||||||||||||||
| 1-to-4 family mortgage |
266,899 | 8,317 | 11,119 | 286,335 | ||||||||||||
| Residential line of credit |
168,888 | 3,479 | 2,156 | 174,523 | ||||||||||||
| Multi-family mortgage |
40,973 | — | 32 | 41,005 | ||||||||||||
| Commercial real estate: |
||||||||||||||||
| Owner occupied |
329,737 | 8,046 | 8,216 | 345,999 | ||||||||||||
| Non-owner occupied |
234,084 | 20,083 | 9,726 | 263,893 | ||||||||||||
| Consumer and other |
72,120 | 487 | 355 | 72,962 | ||||||||||||
|
|
|
|||||||||||||||
| Total loans |
$ | 1,663,248 | $ | 45,347 | $ | 41,709 | $ | 1,750,304 | ||||||||
|
|
||||||||||||||||
| Loan type (in thousands) | Pass | Watch | Substandard | Total | ||||||||||||
| As of December 31, 2015 |
||||||||||||||||
| Commercial and industrial |
$ | 310,125 | $ | 1,060 | $ | 5,853 | $ | 317,038 | ||||||||
| Construction |
219,684 | 3,238 | 8,103 | 231,025 | ||||||||||||
| Residential real estate: |
||||||||||||||||
| 1-to-4 family mortgage |
268,046 | 9,367 | 10,336 | 287,749 | ||||||||||||
| Residential line of credit |
165,838 | 3,069 | 2,619 | 171,526 | ||||||||||||
| Multi-family mortgage |
58,234 | 166 | 1,110 | 59,510 | ||||||||||||
| Commercial real estate: |
||||||||||||||||
| Owner occupied |
310,538 | 9,852 | 9,817 | 330,207 | ||||||||||||
| Non-owner occupied |
206,645 | 20,218 | 10,359 | 237,222 | ||||||||||||
| Consumer and other |
66,794 | 460 | 332 | 67,586 | ||||||||||||
|
|
|
|||||||||||||||
| Total loans |
$ | 1,605,904 | $ | 47,430 | $ | 48,529 | $ | 1,701,863 | ||||||||
|
|
||||||||||||||||
Allowance for loan losses
The allowance for loan losses is the amount of expense that, based on our judgment, is required to absorb probable credit losses inherent in our loan portfolio and that, in management’s judgment, is appropriate under GAAP. The determination of the amount of the allowance is complex and involves a high degree of judgment and subjectivity. Among the material estimates required to establish the allowance are loss exposure at default, the amount and timing of future cash flows on impacted loans, value of collateral and determination of the loss factors to be applied to the various elements of the portfolio.
Our methodology for assessing the adequacy of the allowance for loan losses includes a general allowance for performing loans, which are grouped based on similar characteristics, and an allocated allowance for individual impaired loans. Actual credit losses or recoveries are charged or credited directly to the allowance.
The appropriate level of the allowance is established on a quarterly basis after input from management and our loan review staff and is based on an ongoing analysis of the credit risk of our loan portfolio. In making our evaluation of the credit risk of the loan portfolio, we consider factors such as the volume, growth and composition of our loan portfolio, the diversification by industry of our commercial loan portfolio, the effect of changes in the local real estate market on collateral values, trends in past dues, our experience as a lender, changes in lending policies, the effects on our loan portfolio of current economic indicators and their probable impact on borrowers, historical loan loss experience, industry loan loss experience, the amount of nonperforming loans and related collateral and the evaluation of our loan portfolio by our loan review function.
149
Table of Contents
Index to Financial Statements
In addition, on a regular basis, management and the Bank’s Board of Directors review loan ratios. These ratios include the allowance for loan losses as a percentage of loans, net charge-offs as a percentage of average loans, the provision for loan losses as a percentage of average loans, nonperforming loans as a percentage of loans and the allowance coverage on nonperforming loans. Also, management reviews past due ratios by relationship manager, individual markets and the Bank as a whole. The allowance for loan losses was $23.7 million, $24.5 million, $29.0 million and $32.4 million at June 30, 2016, December 31, 2015, 2014 and 2013, respectively.
The following table presents the allocation of the allowance for loan losses by loan category as of the periods indicated:
| June 30,
2016 (unaudited) |
As of December 31, | |||||||||||||||||||||||||||||||||||||||||||||||
| 2015 | 2014 | 2013 | 2012 | 2011 | ||||||||||||||||||||||||||||||||||||||||||||
| (in thousands, except %) |
Amount | % of Loans |
Amount | % of loans |
Amount | % of loans |
Amount | % of loans |
Amount | % of loans |
Amount | % of loans |
||||||||||||||||||||||||||||||||||||
| Loan Type: |
||||||||||||||||||||||||||||||||||||||||||||||||
| Commercial and industrial |
$ | 6,051 | 26% | $ | 5,288 | 22% | $ | 6,600 | 23% | $ | 7,009 | 22% | $ | 7,009 | 18% | $ | 9,031 | 23% | ||||||||||||||||||||||||||||||
| Construction |
4,266 | 18% | 5,030 | 21% | 3,721 | 13% | 5,047 | 16% | 4,647 | 12% | 5,286 | 13% | ||||||||||||||||||||||||||||||||||||
| Residential real estate: |
||||||||||||||||||||||||||||||||||||||||||||||||
| 1-to-4 family mortgage |
3,555 | 15% | 4,126 | 17% | 6,364 | 22% | 7,300 | 23% | 7,738 | 20% | 5,556 | 14% | ||||||||||||||||||||||||||||||||||||
| Residential line of credit |
1,922 | 8% | 2,178 | 8% | 2,790 | 9% | 2,766 | 8% | 2,213 | 6% | 4,261 | 11% | ||||||||||||||||||||||||||||||||||||
| Multi-family mortgage |
448 | 2% | 311 | 1% | 184 | 1% | 336 | 1% | 2,546 | 7% | 3,605 | 9% | ||||||||||||||||||||||||||||||||||||
| Commercial real estate: |
||||||||||||||||||||||||||||||||||||||||||||||||
| Owner occupied |
3,672 | 15% | 4,034 | 16% | 6,075 | 21% | 5,558 | 17% | 6,258 | 16% | 6,241 | 16% | ||||||||||||||||||||||||||||||||||||
| Non-owner occupied |
2,752 | 12% | 2,610 | 11% | 2,641 | 9% | 3,563 | 11% | 7,432 | 19% | 4,982 | 12% | ||||||||||||||||||||||||||||||||||||
| Consumer and other |
1,068 | 4% | 883 | 4% | 655 | 2% | 774 | 2% | 695 | 2% | 749 | 2% | ||||||||||||||||||||||||||||||||||||
|
|
|
|||||||||||||||||||||||||||||||||||||||||||||||
| Total allowance |
$ | 23,734 | 100% | $ | 24,460 | 100% | $ | 29,030 | 100% | $ | 32,353 | 100% | $ | 38,538 | 100% | $ | 39,711 | 100% | ||||||||||||||||||||||||||||||
|
|
||||||||||||||||||||||||||||||||||||||||||||||||
150
Table of Contents
Index to Financial Statements
The following table summarizes activity in our allowance for loan losses during the periods indicated:
| June 30, 2016 |
Year ended December 31, | |||||||||||||||||||||||
| (in thousands, except %) | (unaudited) | 2015 | 2014 | 2013 | 2012 | 2011 | ||||||||||||||||||
| Allowance for loan loss at beginning of period |
$ | 24,460 | $ | 29,030 | $ | 32,353 | $ | 38,538 | $ | 39,711 | $ | 45,135 | ||||||||||||
| Charge-offs: |
||||||||||||||||||||||||
| Commercial and industrial |
(198 | ) | (981 | ) | (1,514 | ) | (1,123 | ) | (401 | ) | (1,268 | ) | ||||||||||||
| Construction |
(2 | ) | (81 | ) | (292 | ) | (582 | ) | (10 | ) | (6,326 | ) | ||||||||||||
| Residential real estate: |
||||||||||||||||||||||||
| 1-to-4 family mortgage |
(53 | ) | (828 | ) | (1,486 | ) | (383 | ) | (113 | ) | (1,216 | ) | ||||||||||||
| Residential line of credit |
(75 | ) | (230 | ) | (462 | ) | (500 | ) | (1,445 | ) | (1,611 | ) | ||||||||||||
| Multi-family mortgage |
— | — | — | (4,236 | ) | — | (380 | ) | ||||||||||||||||
| Commercial real estate: |
||||||||||||||||||||||||
| Owner occupied |
(93 | ) | (1,062 | ) | (688 | ) | (36 | ) | (1,472 | ) | (338 | ) | ||||||||||||
| Non-owner occupied |
— | (54 | ) | (1,008 | ) | (14 | ) | (291 | ) | (203 | ) | |||||||||||||
| Consumer and other |
(485 | ) | (1,108 | ) | (911 | ) | (762 | ) | (707 | ) | (922 | ) | ||||||||||||
|
|
|
|||||||||||||||||||||||
| Total charge-offs |
(906 | ) | (4,344 | ) | (6,361 | ) | (7,636 | ) | (4,439 | ) | (12,264 | ) | ||||||||||||
| Recoveries: |
||||||||||||||||||||||||
| Commercial and industrial |
472 | 116 | 610 | 252 | 539 | 695 | ||||||||||||||||||
| Construction |
105 | 1,354 | 539 | 2,092 | 1,299 | 1,598 | ||||||||||||||||||
| Residential real estate: |
||||||||||||||||||||||||
| 1-to-4 family mortgage |
107 | 161 | 222 | 80 | 188 | 496 | ||||||||||||||||||
| Residential line of credit |
107 | 286 | 166 | 166 | 118 | 253 | ||||||||||||||||||
| Multi-family mortgage |
— | — | 3,065 | — | 2 | 1 | ||||||||||||||||||
| Commercial real estate: |
||||||||||||||||||||||||
| Owner occupied |
11 | 35 | 162 | 223 | 151 | 220 | ||||||||||||||||||
| Non-owner occupied |
5 | 342 | 568 | 25 | 66 | 69 | ||||||||||||||||||
| Consumer and other |
171 | 544 | 422 | 132 | 375 | 145 | ||||||||||||||||||
|
|
|
|||||||||||||||||||||||
| Total recoveries |
978 | 2,838 | 5,754 | 2,970 | 2,738 | 3,477 | ||||||||||||||||||
|
|
|
|||||||||||||||||||||||
| Net charge offs |
72 | (1,506 | ) | (607 | ) | (4,666 | ) | (1,701 | ) | (8,787 | ) | |||||||||||||
| Provision (reversal of provision) for loan loss charged to operations |
(798 | ) | (3,064 | ) | (2,716 | ) | (1,519 | ) | 528 | 3,363 | ||||||||||||||
|
|
|
|||||||||||||||||||||||
| Allowance for loan loss at the end of period |
$ | 23,734 | $ | 24,460 | $ | 29,030 | $ | 32,353 | $ | 38,538 | $ | 39,711 | ||||||||||||
|
|
|
|||||||||||||||||||||||
| Ratio of net charge-offs during the period to average loans outstanding during the period |
0.00% | (0.10)% | (0.04)% | (0.35)% | (0.14)% | (0.71)% | ||||||||||||||||||
| Allowance for loan loss as a percentage of loans at end of period |
1.41% | 1.50% | 2.05% | 2.41% | 3.11% | 3.36% | ||||||||||||||||||
| Allowance of loan loss as a percentage of nonperforming loans |
213.70% | 211.10% | 168.75% | 113.8% | 74.56% | 59.54% | ||||||||||||||||||
|
|
||||||||||||||||||||||||
151
Table of Contents
Index to Financial Statements
Mortgage loans held for sale
Mortgage loans held for sale were $322.2 million at June 30, 2016 compared to $273.2 million at December 31, 2015, $194.7 million at December 31, 2014 and $61.1 million at December 31, 2013. Originations of mortgage loans to be sold totaled $1,762.1 million for the six months ended June 30, 2016 and $2,757.5 million for the year ended December 31, 2015, $1,156.2 million in 2014 and $829.9 million in 2013. Generally, mortgage origination activity increases in lower interest rate environments and robust housing markets and decreases in rising interest rate environments and slower housing markets. Increasing originations during 2016 reflect a favorable interest rate environment and the ongoing expansion of our mortgage banking business, including our expansion of our consumer direct delivery channel and increased origination volume in our retail and third party origination channels.
Mortgage loans to be sold are sold either on a “best efforts” basis or under a mandatory delivery sales agreement. Under a “best efforts” sales agreement, residential real estate originations are locked in at a contractual rate with third party private investors or directly with government sponsored agencies, and we are obligated to sell the mortgages to such investors only if the mortgages are closed and funded. The risk we assume is conditioned upon loan underwriting and market conditions in the national mortgage market. Under a mandatory delivery sales agreement, we commit to deliver a certain principal amount of mortgage loans to an investor at a specified price and delivery date. Penalties are paid to the investor if we fail to satisfy the contract. Gains and losses are realized at the time consideration is received and all other criteria for sales treatment have been met. These loans are typically sold within thirty days after the loan is funded. Although loan fees and some interest income are derived from mortgage loans held for sale, the main source of income is gains from the sale of these loans in the secondary market.
Deposits
Deposits represent the Bank’s primary source of funds. We continue to focus on growing core deposits through our relationship driven banking philosophy, community-focused marketing programs, and initiatives such as the development of our treasury management services.
Total deposits were $2.51 billion and $2.44 billion, $1.93 billion and $1.81 billion as of June 30, 2016 and December 31, 2015, 2014 and 2013, respectively. Noninterest-bearing deposits at June 30, 2016 and December 31, 2015, 2014 and 2013 were $680.2 million and $627.0 million, $438.4 million, and $356.8 million, respectively, while interest-bearing deposits were $1,834.1 million and $1,811.5 million, $1,485.2 million and $1,446.7 million at June 30, 2016 and December 31, 2015, 2014 and 2013, respectively. Our acquisition of NWGB contributed $253.1 million to the increase in total deposits for the year ended December 31, 2015, $46.8 million to the increase in noninterest-bearing deposits and $206.3 million to the increase in interest-bearing deposits. The deposit mix shifted in the six months ended June 30, 2016 between savings and certificates of deposits due to a restructuring of an IRA savings product to a time deposit product during the second quarter of 2016. At the time of restructuring, the approximate balance of the effected accounts was $91.0 million. During the second quarter of 2016, our third party servicing provider, Cenlar, transferred certain servicing escrow deposit accounts to the Bank which totaled $43.5 million at June 30, 2016. The mix between noninterest bearing and interest bearing demand has remained relatively stagnant, however management continues to focus on strategic pricing to grow noninterest bearing deposits while allowing more costly funding sources, including certain time deposits, to mature.
Average deposit balances by type, together with the average rates per periods are reflected in the average balance sheet amounts, interest earned and yield analysis tables included above under the discussion of net interest income.
152
Table of Contents
Index to Financial Statements
The following table sets forth the distribution by type of our deposit accounts for the dates indicated:
| As of December 31, | ||||||||||||||||||||||||||||||||||||||||||||||||
| June 30, 2016 (unaudited) |
2015 | 2014 | 2013 | |||||||||||||||||||||||||||||||||||||||||||||
| (dollars in thousands) |
Amount | % of total deposits |
Average rate |
Amount | % of total deposits |
Average rate |
Amount | % of total deposits |
Average rate |
Amount | % of total deposits |
Average rate |
||||||||||||||||||||||||||||||||||||
| Deposit Type |
||||||||||||||||||||||||||||||||||||||||||||||||
| Noninterest- bearing demand |
$ | 680,165 | 27% | —% | $ | 626,955 | 26% | —% | $ | 438,360 | 23% | —% | $ | 356,844 | 20% | —% | ||||||||||||||||||||||||||||||||
| Interest- bearing demand |
1,304,606 | 52% | 0.37% | 1,273,438 | 52% | 0.35% | 1,010,079 | 53% | 0.34% | 933,705 | 52% | 0.36% | ||||||||||||||||||||||||||||||||||||
| Savings deposits |
129,944 | 5% | 0.37% | 212,522 | 9% | 0.51% | 165,017 | 9% | 0.57% | 157,788 | 9% | 0.67% | ||||||||||||||||||||||||||||||||||||
| Certificates of deposit |
399,582 | 16% | 0.49% | 325,559 | 13% | 0.51% | 310,113 | 16% | 0.74% | 355,230 | 20% | 1.08% | ||||||||||||||||||||||||||||||||||||
|
|
|
|||||||||||||||||||||||||||||||||||||||||||||||
| Total deposits |
$ | 2,514,297 | 100% | 0.57% | $ | 2,438,474 | 100% | 0.30% | $ | 1,923,569 | 100% | 0.36% | $ | 1,803,567 | 100% | 0.48% | ||||||||||||||||||||||||||||||||
|
|
|
|||||||||||||||||||||||||||||||||||||||||||||||
| Time Deposits |
||||||||||||||||||||||||||||||||||||||||||||||||
| 0.00-0.50% |
$ | 218,363 | 55% | $ | 232,255 | 71% | $ | 216,611 | 70% | $ | 212,418 | 60% | ||||||||||||||||||||||||||||||||||||
| 0.51-1.00% |
150,928 | 38% | 62,995 | 19% | 49,438 | 16% | 56,126 | 16% | ||||||||||||||||||||||||||||||||||||||||
| 1.01-1.50% |
14,338 | 3% | 11,908 | 4% | 16,296 | 5% | 30,045 | 8% | ||||||||||||||||||||||||||||||||||||||||
| 1.51-2.00% |
13,454 | 3% | 14,778 | 5% | 12,639 | 4% | 29,621 | 8% | ||||||||||||||||||||||||||||||||||||||||
| 2.01-2.50% |
2,494 | 1% | 3,498 | 1% | 9,664 | 3% | 10,849 | 3% | ||||||||||||||||||||||||||||||||||||||||
| Above 2.50% |
5 | 0% | 125 | —% | 5,465 | 2% | 16,171 | 5% | ||||||||||||||||||||||||||||||||||||||||
|
|
|
|||||||||||||||||||||||||||||||||||||||||||||||
| Total time deposits |
$ | 399,582 | 100% | $ | 325,559 | 100% | $ | 310,113 | 100% | $ | 355,230 | 100% | ||||||||||||||||||||||||||||||||||||
|
|
||||||||||||||||||||||||||||||||||||||||||||||||
The following table sets forth our time deposits segmented by months to maturity and deposit amount as of June 30, 2016 and December 31, 2015:
| As of June 30,
2016 (unaudited) |
||||||||||||
| (Dollars in thousands) | Time deposits of $100 and greater |
Time deposits of less than $100 |
Total | |||||||||
| Months to maturity: |
||||||||||||
| Three or less |
$ | 28,852 | $ | 42,548 | $ | 71,400 | ||||||
| Over Three to Six |
26,858 | 40,102 | 66,960 | |||||||||
| Over Six to Twelve |
53,331 | 66,584 | 119,915 | |||||||||
| Over Twelve |
71,817 | 69,490 | 141,307 | |||||||||
|
|
|
|||||||||||
| Total |
$ | 180,858 | $ | 218,724 | $ | 399,582 | ||||||
|
|
||||||||||||
153
Table of Contents
Index to Financial Statements
| As of December 31, 2015 | ||||||||||||
| (Dollars in thousands) | Time deposits of $100 and greater |
Time deposits of less than $100 |
Total | |||||||||
| Months to maturity: |
||||||||||||
| Three or less |
$ | 37,708 | $ | 38,225 | $ | 75,933 | ||||||
| Over Three to Six |
21,492 | 32,848 | 54,340 | |||||||||
| Over Six to Twelve |
44,336 | 59,159 | 103,495 | |||||||||
| Over Twelve |
47,079 | 44,712 | 91,791 | |||||||||
|
|
|
|||||||||||
| Total |
$ | 150,615 | $ | 174,944 | $ | 325,559 | ||||||
|
|
||||||||||||
Investment portfolio
Our investment portfolio provides liquidity and certain of our investment securities serve as collateral for certain deposits and other types of borrowings. Our investment strategy aims to maximize earnings while maintaining liquidity in securities with minimal credit risk. The types and maturities of securities purchased are primarily based on our current and projected liquidity and interest rate sensitivity positions.
The following table shows the carrying value of our total securities available for sale by investment type and the relative percentage of each investment type for the dated indicated:
| June 30, 2016 | As of December 31, | |||||||||||||||||||||||||||||||
| (unaudited) | 2015 | 2014 | 2013 | |||||||||||||||||||||||||||||
| (dollars in thousands) | Carrying value |
% of total |
Carrying value |
% of total |
Carrying value |
% of total |
Carrying value |
% of total |
||||||||||||||||||||||||
| U.S. Government agency securities |
$ | 15,510 | 3% | $ | 33,808 | 5% | $ | 28,517 | 5% | $ | 27,755 | 4% | ||||||||||||||||||||
| Mortgage-backed securities |
425,311 | 77% | 522,373 | 81% | 530,200 | 81% | 572,294 | 84% | ||||||||||||||||||||||||
| Municipals, tax exempt |
96,001 | 17% | 79,837 | 12% | 85,207 | 13% | 76,641 | 11% | ||||||||||||||||||||||||
| Treasury securities |
4,513 | 1% | 4,485 | 1% | — | —% | — | —% | ||||||||||||||||||||||||
| Corporate Securities |
— | — | — | —% | — | —% | 633 | —% | ||||||||||||||||||||||||
| Equity Securities |
8,972 | 2% | 8,884 | 1% | 8,677 | 1% | 8,224 | 1% | ||||||||||||||||||||||||
|
|
|
|||||||||||||||||||||||||||||||
| Total securities available for sale |
$ | 550,307 | 100% | $ | 649,387 | 100% | $ | 652,601 | 100% | $ | 685,547 | 100% | ||||||||||||||||||||
|
|
||||||||||||||||||||||||||||||||
The balance of our investment portfolio at June 30, 2016 was $550.3 million compared to $649.4 million at December 31, 2015, $652.6 million at December 31, 2014 and $685.5 million at December 31, 2013. At December 31, 2015, $122.1 million of our investment portfolio was made up of investment securities acquired from NWGB, of which the majority was subsequently sold and reinvested. During the six months ended June 30, 2016 and the years ended December 31, 2015, 2014 and 2013, we purchased $202.8 million, $164.9 million, $109.7 and $125.0 million in investment securities, respectively. Mortgage-backed securities and collateralized mortgage obligations, or CMOs, in the aggregate, comprised 91.0%, 97.2%, 90.6% and 96.7% of these purchases, respectively. CMOs are included in the “Mortgage-backed securities” line item in the above table. The mortgage-backed securities and CMOs held in our investment portfolio are primarily issued by government sponsored entities. U.S. Government agency securities and municipal securities accounted for 9.0%, 2.8%, 9.4% and 3.3% respectively, of total securities purchased in the six months ended June 30, 2016 and years ended December 31, 2015, 2014 and 2013. The carrying value of securities sold during six months ended June 30, 2016 and the years ended December 31, 2015, 2014 and 2013 totaled $269.0 million and $194.6 million, $68.9 million and $0.1 million respectively. Maturities and calls of securities during the six months
154
Table of Contents
Index to Financial Statements
ended June 30, 2016 and the years ended December 31, 2015, 2014 and 2013 totaled $44.2 million, $103.2 million, $84.4 million and $157.5 million respectively. As of June 30, 2016 and December 31, 2015, 2014 and 2013, net unrealized gains of $11.2 million and $2.7 million, $5.6 million and net unrealized losses of $4.7 million, respectively, were recorded on investment securities.
The following table sets forth the fair value, scheduled maturities and weighted average yields for our investment portfolio as of June 30, 2016 and December 31, 2015:
| As of June 30, 2016 | As of December 31, | |||||||||||||||||||||||
| (unaudited) | 2015 | |||||||||||||||||||||||
| (dollars in thousands) | Fair value |
% of total investment securities |
Weighted average yield(1) |
Fair value |
% of total investment securities |
Weighted average yield(1) |
||||||||||||||||||
| Treasury securities |
||||||||||||||||||||||||
| Maturing within one year |
$ | 4,513 | 0.8% | 0.00% | $ | — | 0.0% | 0.00% | ||||||||||||||||
| Maturing in one to five years |
— | 0.0% | 0.69% | 4,485 | 0.7% | 0.69% | ||||||||||||||||||
| Maturing in five to ten years |
— | 0.0% | 0.00% | — | 0.0% | 0.00% | ||||||||||||||||||
| Maturing after ten years |
— | 0.0% | 0.00% | — | 0.0% | 0.00% | ||||||||||||||||||
|
|
|
|||||||||||||||||||||||
| Total Treasury securities |
4,513 | 0.8% | 0.69% | 4,485 | 0.7% | 0.69% | ||||||||||||||||||
|
|
|
|||||||||||||||||||||||
| Government agency securities: |
||||||||||||||||||||||||
| Maturing within one year |
4,505 | 0.8% | 0.47% | 5,005 | 0.8% | 0.47% | ||||||||||||||||||
| Maturing in one to five years |
11,005 | 2.0% | 1.47% | 28,803 | 4.4% | 1.33% | ||||||||||||||||||
| Maturing in five to ten years |
— | 0.0% | 0.00% | — | 0.0% | 0.0% | ||||||||||||||||||
| Maturing after ten years |
— | 0.0% | 0.00% | — | 0.0% | 0.0% | ||||||||||||||||||
|
|
|
|||||||||||||||||||||||
| Total government agency securities |
15,510 | 2.8% | 1.21% | 33,808 | 5.2% | 1.20% | ||||||||||||||||||
|
|
|
|||||||||||||||||||||||
| Obligations of state and municipal subdivisions: |
||||||||||||||||||||||||
| Maturing within one year |
— | 0.0% | 8.81% | 296 | 0.0% | 8.83% | ||||||||||||||||||
| Maturing in one to five years |
5,074 | 0.9% | 6.20% | 4,281 | 0.7% | 6.13% | ||||||||||||||||||
| Maturing in five to ten years |
37,976 | 6.9% | 6.09% | 33,782 | 5.2% | 6.02% | ||||||||||||||||||
| Maturing after ten years |
52,951 | 9.6% | 6.09% | 41,478 | 6.4% | 6.20% | ||||||||||||||||||
|
|
|
|||||||||||||||||||||||
| Total obligations of state and municipal subdivisions |
96,001 | 17.4% | 0.38% | 79,837 | 12.3% | 6.20% | ||||||||||||||||||
|
|
|
|||||||||||||||||||||||
| Residential mortgage backed securities guaranteed by FNMA, GNMA, FHLMC and SBA: |
||||||||||||||||||||||||
| Maturing within one year |
— | 0.0% | 0.00% | — | 0.0% | 0.00% | ||||||||||||||||||
| Maturing in one to five years |
203 | 0.1% | 4.85% | 254 | 0.0% | 5.01% | ||||||||||||||||||
| Maturing in five to ten years |
342 | 0.1% | 3.31% | 13,568 | 2.1% | 1.95% | ||||||||||||||||||
| Maturing after ten years |
424,766 | 77.2% | 2.22% | 508,551 | 78.3% | 2.36% | ||||||||||||||||||
|
|
|
|||||||||||||||||||||||
| Total residential mortgage backed securities guaranteed by FNMA, GNMA, FHLMC and SBA |
425,311 | 77.4% | 2.28% | 522,373 | 80.4% | 2.36% | ||||||||||||||||||
| Total marketable equity securities |
8,972 | 1.6% | 0.27% | 8,884 | 1.4% | 1.06% | ||||||||||||||||||
|
|
|
|||||||||||||||||||||||
| Total investment securities |
$ | 550,307 | 100.0% | 2.74% | $ | 649,387 | 100.0% | 2.74% | ||||||||||||||||
|
|
||||||||||||||||||||||||
| (1) | Yields on a tax-equivalent basis. |
155
Table of Contents
Index to Financial Statements
The following table summarizes the amortized cost of securities classified as available for sale and their approximate fair values as of the dates shown:
| Dollars in thousands | Amortized cost |
Gross unrealized gains |
Gross unrealized losses |
Fair value | ||||||||||||
| Securities available for sale |
||||||||||||||||
| As of June 30, 2016 |
||||||||||||||||
| US Government agency securities |
$ | 15,504 | $ | 6 | $ | — | $ | 15,510 | ||||||||
| Mortgage-backed securities |
419,890 | 5,522 | (101 | ) | 425,311 | |||||||||||
| Municipals, tax exempt |
90,192 | 5,813 | (4 | ) | 96,001 | |||||||||||
| Treasury securities |
4,506 | 7 | — | 4,513 | ||||||||||||
| Equity securities |
9,010 | 33 | (71 | ) | 8,972 | |||||||||||
|
|
|
|||||||||||||||
| $ | 539,102 | $ | 11,381 | $ | (176 | ) | $ | 550,307 | ||||||||
|
|
|
|||||||||||||||
| As of December 31, 2015 |
||||||||||||||||
| US Government agency securities |
$ | 34,161 | $ | — | $ | (353 | ) | $ | 33,808 | |||||||
| Mortgage-backed securities |
524,141 | 3,675 | (5,443 | ) | 522,373 | |||||||||||
| Municipals, tax exempt |
74,945 | 4,892 | — | 79,837 | ||||||||||||
| Treasury securities |
4,507 | — | (22 | ) | 4,485 | |||||||||||
| Equity securities |
8,971 | 3 | (90 | ) | 8,884 | |||||||||||
|
|
|
|||||||||||||||
| $ | 646,725 | $ | 8,570 | $ | (5,908 | ) | $ | 649,387 | ||||||||
|
|
|
|||||||||||||||
| As of December 31, 2014: |
||||||||||||||||
| US Government agency securities |
$ | 29,149 | $ | — | $ | (632 | ) | $ | 28,517 | |||||||
| Mortgage-backed securities |
529,546 | 5,629 | (4,975 | ) | 530,200 | |||||||||||
| Municipals, tax exempt |
79,547 | 5,688 | (28 | ) | 85,207 | |||||||||||
| Corporate securities |
— | — | — | — | ||||||||||||
| Equity securities |
8,725 | 13 | (61 | ) | 8,677 | |||||||||||
|
|
|
|||||||||||||||
| $ | 646,967 | $ | 11,330 | $ | (5,696 | ) | $ | 652,601 | ||||||||
|
|
|
|||||||||||||||
| As of December 31, 2013: |
||||||||||||||||
| US Government agency securities |
$ | 29,148 | $ | — | $ | (1,393 | ) | $ | 27,755 | |||||||
| Mortgage-backed securities |
579,112 | 4,486 | (11,304 | ) | 572,294 | |||||||||||
| Municipals, tax exempt |
73,507 | 3,403 | (269 | ) | 76,641 | |||||||||||
| Corporate securities |
165 | 468 | — | 633 | ||||||||||||
| Equity securities |
8,334 | 4 | (114 | ) | 8,224 | |||||||||||
|
|
|
|||||||||||||||
| $ | 690,266 | $ | 8,361 | $ | (13,080 | ) | $ | 685,547 | ||||||||
|
|
||||||||||||||||
Borrowed funds
Deposits and investment securities for sale are the primary source of funds for our lending activities and general business purposes. However, we may also obtain advances from the FHLB, purchase federal funds and engage in overnight borrowing from the Federal Reserve, correspondent banks, or enter into client purchase agreements. We also use these sources of funds as part of our asset liability management process to control our long-term interest rate risk exposure, even if it may increase our short-term cost of funds. This may include match funding of fixed-rate loans. Our level of short-term borrowing can fluctuate on a daily basis depending on funding needs and the source of funds to satisfy the needs.
156
Table of Contents
Index to Financial Statements
Total borrowings include securities sold under agreements to repurchase, lines of credit, advances from the FHLB, federal funds, junior subordinated debentures and related party subordinated debt.
| As of June 30,
2016 (unaudited) |
||||||||||||
| (dollars in thousands) | Amount | % of total |
Weighted average interest rate (%) |
|||||||||
| Maturing Within: |
||||||||||||
| June 30, 2017 |
$ | 29,614 | 35% | 0.19% | ||||||||
| June 30, 2018 |
3,900 | 5% | 2.75% | |||||||||
| June 30, 2019 |
6,882 | 8% | 1.88% | |||||||||
| June 30, 2020 |
226 | 0% | 5.70% | |||||||||
| June 30, 2021 |
337 | 0% | 5.81% | |||||||||
| Thereafter |
44,103 | 52% | 3.62% | |||||||||
|
|
|
|||||||||||
| Total |
$ | 85,062 | 100% | 2.26% | ||||||||
|
|
||||||||||||
| As of December 31, 2015 | ||||||||||||
| (dollars in thousands) | Amount | % of total |
Weighted average interest rate (%) |
|||||||||
| Maturing Within: |
||||||||||||
| December 31, 2016 |
$ | 123,427 | 69% | 0.18% | ||||||||
| December 31, 2017 |
741 | —% | 5.37% | |||||||||
| December 31, 2018 |
10,282 | 7% | 2.04% | |||||||||
| December 31, 2019 |
554 | —% | 5.90% | |||||||||
| December 31, 2020 |
279 | —% | 5.47% | |||||||||
| Thereafter |
44,466 | 24% | 3.50% | |||||||||
|
|
|
|||||||||||
| Total |
$ | 179,749 | 100% | 1.16% | ||||||||
|
|
||||||||||||
Short-term borrowings
The following table summarizes short-term borrowings (borrowings with maturities of one year or less), which consist of federal funds purchased from our correspondent banks on an overnight basis at the prevailing overnight market rates, securities sold under agreements to repurchase and FHLB Cash Management variable rate advances, or CMAs, and the weighted average interest rates paid:
| Six months ended June 30, 2016 (unaudited) |
Year ended December 31, | |||||||||||||||
| (dollars in thousands) | 2015 | 2014 | 2013 | |||||||||||||
| Average daily amount of short-term borrowings outstanding during the period |
$ | 88,403 | $ | 184,743 | $ | 167,653 | $ | 140,746 | ||||||||
| Weighted average interest rate on average daily short-term borrowings |
0.20% | 0.23% | 0.13% | 0.17% | ||||||||||||
| Maximum outstanding short-term borrowings outstanding at any month-end |
$ | 120,570 | $ | 239,536 | $ | 209,346 | $ | 177,058 | ||||||||
| Short-term borrowings outstanding at period end |
$ | 29,278 | $ | 123,133 | $ | 192,494 | $ | 177,058 | ||||||||
| Weighted average interest rate on short-term borrowings at period end |
0.12% | 0.17% | 0.13% | 0.13% | ||||||||||||
|
|
||||||||||||||||
157
Table of Contents
Index to Financial Statements
Lines of credit and other borrowings.
As a member of the FHLB Cincinnati, the Bank receives advances from the FHLB pursuant to the terms of various agreements that assist in funding its mortgage and loan portfolios. Under the agreements, we pledge certain qualifying multi-family and 1 to 4 family loans as well as certain investment securities as collateral. As of June 30, 2016, December 31, 2015, 2014, and 2013 the Company had received advances from the FHLB totaling $14.8 million, $33.6 million, $23.8 million and $96.9 million, respectively.
As of June 30, 2016, December 31, 2015, 2014 and 2013, $29.2 million, $26.1 million, $27.8 million and $31.4 million, respectively, of 1 to 4 family mortgage loans were pledged to the FHLB Cincinnati, securing advances against the Bank’s line of credit. As of June 30, 2016, December 31, 2015, 2014 and 2013, $49.0 million, $43.8 million, $26.5 million and $38.8 million, respectively, of multi-family mortgage loans were pledged to the FHLB Cincinnati, securing advances against the Bank’s line.
As of December 31, 2014 and 2013 $932.7 million and $879.8 million, respectively, of commercial and industrial, consumer, construction, commercial real estate and home equity lines of credit were pledged to the Federal Reserve Bank through the Borrower-in-Custody program securing a line of credit of $661.7 million and $663.2 million, respectively. The line was not active as of December 31, 2015 or June 30, 2016.
The Bank has a secured line of credit with the FHLB for $150.0 million, and the line is secured by qualifying 1 to 4 family and multi-family mortgages in the Bank’s loan portfolio as well as U.S. Government agency securities. Borrowings against this line were $0, $18.0 million, $79.0 million and $70.0 million as of June 30, 2016, December 31, 2015, 2014 and 2013, respectively.
In addition to the FHLB line, the Bank maintains lines with certain correspondent banks that provide borrowing capacity in the form of federal fund purchases in the aggregate amount of $125.0 million, $125.0 million and $105.0 million as of June 30, 2016, December 31, 2015 and 2014, respectively. As of June 30, 2016 and December 31, 2015 there were not any borrowings under these lines.
We have two wholly-owned subsidiaries that are statutory business trusts (“Trusts”). The Trusts were created for the sole purpose of issuing 30-year capital trust preferred securities to fund the purchase of junior subordinated debentures issued by the Company. As of June 30, 2016, December 31, 2015 and 2014, our $0.9 million, $0.9 million and $1.0 million investment in the Trusts, respectively, was included in other assets in the accompanying consolidated balance sheets and our $30.9 million, $30.9 million and $30.9 million obligation is reflected as junior subordinated debt, respectively. The junior subordinated debt bears interest at floating interest rates based on a spread over 3-month LIBOR of 3.25% (3.78% and 3.75% at June 30, 2016 and December 31, 2015, respectively) for the $21.7 million debenture and 3.78% (3.88% 3.77% and 3.58% at June 30, 2016 and December 31, 2015, respectively) for the remaining $9.3 million. The $9.3 million debenture may be redeemed prior to the 2033 maturity date upon the occurrence of a special event and the $21.7 million debenture may be redeemed prior to 2033 at our option.
We have three subordinated notes payable to our shareholder. An aggregate balance of $10.1 million was outstanding at June 30, 2016, with a weighted average interest rate of 2.39% and a maturity date of December 31, 2021.
Liquidity and capital resources
Bank liquidity management
We are expected to maintain adequate liquidity at the Bank to meet the cash flow requirements of clients who may be either depositors wishing to withdraw funds or borrowers needing assurance that sufficient funds will be available to meet their credit needs. Our asset and liability management policy is intended to cause the Bank
158
Table of Contents
Index to Financial Statements
to maintain adequate liquidity and, therefore, enhance our ability to raise funds to support asset growth, meet deposit withdrawals and lending needs, maintain reserve requirements and otherwise sustain our operations. We accomplish this through management of the maturities of our interest-earning assets and interest-bearing liabilities. We believe that our present position is adequate to meet our current and future liquidity needs.
We continuously monitor our liquidity position to ensure that assets and liabilities are managed in a manner that will meet all of our short-term and long-term cash requirements. We manage our liquidity position to meet the daily cash flow needs of clients, while maintaining an appropriate balance between assets and liabilities to meet the return on investment objectives of our shareholder. We also monitor our liquidity requirements in light of interest rate trends, changes in the economy and the scheduled maturity and interest rate sensitivity of the investment and loan portfolios and deposits.
As part of our liquidity management strategy, we are also focused on minimizing our costs of liquidity and attempt to decrease these costs by growing our noninterest bearing and other low-cost deposits and replacing higher cost funding including time deposits and borrowed funds. While we do not control the types of deposit instruments our clients choose, we do influence those choices with the rates and the deposit specials we offer. As a result of these strategies, our cost of funds decreased in 2016 from 2015 and in 2015 from 2014 as our funding mix improved due to growing noninterest bearing and other low-cost deposits and allowing higher-cost time deposits to mature.
Core deposits, which we defined as deposits excluding jumbo time deposits (greater than $250,000), are a major source of funds used by the Bank to meet its liquidity. Maintaining the ability to acquire these funds as needed in a variety of markets is important to assuring the Bank’s liquidity. Management continually monitors the liquidity and non-core dependency ratios to ensure compliance with targets established by the Bank’s Asset Liability Committee.
Our investment portfolio is another alternative for meeting liquidity needs. These assets generally have readily available markets that offer conversions to cash as needed. Securities within our investment portfolio are also used to secure certain deposit types and short-term borrowings. At June 30, 2016 and December 31, 2015, securities with a carrying value of $541.3 million and $525.3 million, respectively, were pledged to secure government, public, trust and other deposits and as collateral for short- term borrowings, letters of credit and derivative instruments as compared to $588.5 million at December 31, 2014.
Additional sources of liquidity include federal funds purchased and advances from the FHLB. Interest is charged at the prevailing market rate on federal funds purchased and FHLB advances. The balance of outstanding federal funds purchased at December 31, 2015 was $18.0 million. There were no outstanding federal funds purchased at June 30, 2016 or December 31, 2014. Funds obtained from the FHLB are used primarily to match-fund fixed rate loans in order to minimize interest rate risk and also be used to meet day to day liquidity needs, particularly when the cost of such borrowing compares favorably to the rates that we would be required to pay to attract deposits. At June 30, 2016 and December 31, 2015, the balance of our outstanding advances with the FHLB was $14.8 million and $33.6 million, respectively, and a secured short-term borrowing of $0 million and $18.0 million, respectively. The total amount of the remaining credit available to us from the FHLB at June 30, 2016 and December 31, 2015 was $150.0 million and $132.0 million, respectively. We also maintain lines of credit with other commercial banks totaling $125 million. These are unsecured, uncommitted lines of credit maturing at various times within the next twelve months. There were no amounts outstanding under these lines of credit at June 30, 2016 or December 31, 2015 or 2014, respectively.
Holding company liquidity management
The Company is a corporation separate and apart from the Bank and, therefore, it must provide for its own liquidity. The Company’s main source of funding is dividends declared and paid to it by the Bank. Statutory and
159
Table of Contents
Index to Financial Statements
regulatory limitations exist that affect the ability of the Bank to pay dividends to the Company. Management believes that these limitations will not impact the Company’s ability to meet its ongoing short-term cash obligations. For additional information regarding dividend restrictions, see “Risk factors: Risks related to our business,” “Dividend policy” and “Business: Supervision and regulation.”
Due to state banking laws, the Bank may not declare dividends in any calendar year in an amount that would exceed an amount equal to the total of its net income for that year combined with its retained net income of the preceding two years, without the prior approval of the TDFI. Based upon this regulation, as of June 30, 2016 and December 31, 2015, $60.7 million and $54.5 million of the Bank’s retained earnings were available for the payment of dividends without such prior approval. In addition, dividends paid by the Bank to the Company would be prohibited if the effect thereof would cause the Bank’s capital to be reduced below applicable minimum capital requirements.
The Bank received permission from the TDFI to pay the Company dividends of approximately $15.9 million in the year ended December 31, 2014, for operational expenses, dividends to our shareholder and principal reduction of debt. The Bank also paid dividends of approximately $25.1 million and $2.3 million to the Company in the year ended December 31, 2015 and 2014, respectively, for dividends to our shareholder and operational expenses that did not require approval from the TDFI. The Bank received permission from the TDFI to pay the Company dividends of approximately $12.8 million in 2013 for the shareholder’s tax liability and our operating expenses.
Capital management and regulatory capital requirements
Our capital management consists of providing adequate equity to support our current and future operations. We are subject to various regulatory capital requirements administered by state and federal banking agencies, including the TDFI, Federal Reserve and the FDIC. Failure to meet minimum capital requirements may prompt certain actions by regulators that, if undertaken, could have a direct material adverse effect on our financial condition and results of operations. Under capital adequacy guidelines and the regulatory framework for prompt corrective action, we must meet specific capital guidelines that involve quantitative measures of our assets, liabilities and certain off-balance sheet items as calculated under regulatory accounting practices. Our capital amounts and classification are also subject to qualitative judgments by the regulators about components of capital, risk weightings and other factors.
As a result of recent developments such as the Dodd-Frank Act and Basel III, we have become subject to increasingly stringent regulatory capital requirements beginning in 2015. For further discussion of the changing regulatory framework in which we operate, see “Business: Supervision and regulation.”
160
Table of Contents
Index to Financial Statements
The Federal Reserve, the FDIC and the Office of the Comptroller of the Currency have issued guidelines governing the levels of capital that banks must maintain. Those guidelines specify capital tiers, which include the classifications set forth in the following table. As of June 30, 2016 and December 31, 2015, 2014 and 2013, we exceeded all capital ratio requirements under prompt corrective action and other regulatory requirements, as detailed in the table below:
| Actual | Required for capital adequacy purposes |
To be well capitalized under prompt corrective action provision |
||||||||||||||||||||||||||||||||||||||
| (dollars in thousands) | Amount | Ratio (%) |
Amount | Ratio (%) |
Amount | Ratio (%) |
||||||||||||||||||||||||||||||||||
| June 30, 2016 |
||||||||||||||||||||||||||||||||||||||||
| Common Equity Tier 1 (CET1) |
||||||||||||||||||||||||||||||||||||||||
| FB Financial Corporation |
$ | 195,782 | 8.30% | ³ | $ | 106,147 | ³ | 4.5% | N/A | N/A | ||||||||||||||||||||||||||||||
| FirstBank |
$ | 226,814 | 9.65% | ³ | $ | 105,768 | ³ | 4.5% | ³ | $ | 152,776 | ³ | 6.5% | |||||||||||||||||||||||||||
| Total capital (to risk weighted assets) |
||||||||||||||||||||||||||||||||||||||||
| FB Financial Corporation |
$ | 259,591 | 11.00% | ³ | $ | 188,793 | ³ | 8.0% | N/A | N/A | ||||||||||||||||||||||||||||||
| FirstBank |
$ | 256,548 | 10.92% | ³ | $ | 187,947 | ³ | 8.0% | ³ | $ | 234,934 | ³ | 10.0% | |||||||||||||||||||||||||||
| Tier 1 capital (to risk weighted assets) |
||||||||||||||||||||||||||||||||||||||||
| FB Financial Corporation |
$ | 225,782 | 9.57% | ³ | $ | 141,556 | ³ | 6.0% | N/A | N/A | ||||||||||||||||||||||||||||||
| FirstBank |
$ | 226,814 | 9.65% | ³ | $ | 141,024 | ³ | 6.0% | ³ | $ | 141,024 | ³ | 6.0% | |||||||||||||||||||||||||||
| Tier 1 Capital (to average assets) |
||||||||||||||||||||||||||||||||||||||||
| FB Financial Corporation |
$ | 225,782 | 7.98% | ³ | $ | 113,174 | ³ | 4.0% | N/A | N/A | ||||||||||||||||||||||||||||||
| FirstBank |
$ | 226,814 | 8.02% | ³ | $ | 113,124 | ³ | 4.0% | ³ | $ | 141,405 | ³ | 5.0% | |||||||||||||||||||||||||||
| December 31, 2015 |
||||||||||||||||||||||||||||||||||||||||
| Common Equity Tier 1 (CET1) |
||||||||||||||||||||||||||||||||||||||||
| FB Financial Corporation |
$ | 181,633 | 8.23% | ³ | $ | 99,313 | ³ | 4.5% | N/A | N/A | ||||||||||||||||||||||||||||||
| FirstBank |
$ | 211,780 | 9.63% | ³ | $ | 98,963 | ³ | 4.5% | ³ | $ | 142,946 | ³ | 6.5% | |||||||||||||||||||||||||||
| Total capital (to risk weighted assets) |
||||||||||||||||||||||||||||||||||||||||
| FB Financial Corporation |
$ | 246,168 | 11.15% | ³ | $ | 176,623 | ³ | 8.0% | N/A | N/A | ||||||||||||||||||||||||||||||
| FirstBank |
$ | 242,240 | 11.02% | ³ | $ | 175,855 | ³ | 8.0% | ³ | $ | 219,819 | ³ | 10.0% | |||||||||||||||||||||||||||
| Tier 1 capital (to risk weighted assets) |
||||||||||||||||||||||||||||||||||||||||
| FB Financial Corporation |
$ | 211,633 | 9.58% | ³ | $ | 132,547 | ³ | 6.0% | N/A | N/A | ||||||||||||||||||||||||||||||
| FirstBank |
$ | 211,780 | 9.63% | ³ | $ | 131,950 | ³ | 6.0% | ³ | $ | 131,950 | ³ | 6.0% | |||||||||||||||||||||||||||
| Tier 1 Capital (to average assets) |
||||||||||||||||||||||||||||||||||||||||
| FB Financial Corporation |
$ | 211,633 | 7.64% | ³ | $ | 110,803 | ³ | 4.0% | N/A | N/A | ||||||||||||||||||||||||||||||
| FirstBank |
$ | 211,780 | 7.65% | ³ | $ | 110,735 | ³ | 4.0% | ³ | $ | 138,418 | ³ | 5.0% | |||||||||||||||||||||||||||
| December 31, 2014 |
||||||||||||||||||||||||||||||||||||||||
| Total capital (to risk weighted assets) |
||||||||||||||||||||||||||||||||||||||||
| FB Financial Corporation |
$ | 219,419 | 13.18% | ³ | $ | 133,192 | ³ | 8.0% | N/A | N/A | ||||||||||||||||||||||||||||||
| FirstBank |
$ | 215,303 | 12.96% | ³ | $ | 132,887 | ³ | 8.0% | ³ | $ | 166,109 | ³ | 10.0% | |||||||||||||||||||||||||||
| Tier 1 capital (to risk weighted assets) |
||||||||||||||||||||||||||||||||||||||||
| FB Financial Corporation |
$ | 188,478 | 11.32% | ³ | $ | 66,596 | ³ | 4.0% | N/A | N/A | ||||||||||||||||||||||||||||||
| FirstBank |
$ | 188,437 | 11.34% | ³ | $ | 66,443 | ³ | 4.0% | ³ | $ | 99,665 | ³ | 6.0% | |||||||||||||||||||||||||||
| Tier 1 Capital (to average assets) |
||||||||||||||||||||||||||||||||||||||||
| FB Financial Corporation |
$ | 188,478 | 8.10% | ³ | $ | 93,028 | ³ | 4.0% | N/A | N/A | ||||||||||||||||||||||||||||||
| FirstBank |
$ | 188,437 | 8.10% | ³ | $ | 93,012 | ³ | 4.0% | ³ | $ | 116,264 | ³ | 5.0% | |||||||||||||||||||||||||||
| December 31, 2013 |
||||||||||||||||||||||||||||||||||||||||
| Total Capital (to risk-weighted assets) |
||||||||||||||||||||||||||||||||||||||||
| FB Financial Corporation |
$ | 200,211 | 13.41% | ³ | $ | 119,484 | ³ | 8.0% | N/A | N/A | ||||||||||||||||||||||||||||||
| FirstBank |
$ | 196,562 | 13.20% | ³ | $ | 119,121 | ³ | 8.0% | ³ | $ | 148,901 | ³ | 10.0% | |||||||||||||||||||||||||||
| Tier 1 Capital (to risk-weighted assets) |
||||||||||||||||||||||||||||||||||||||||
| FB Financial Corporation |
$ | 171,354 | 11.47% | ³ | $ | 59,742 | ³ | 4.0% | N/A | N/A | ||||||||||||||||||||||||||||||
| FirstBank |
$ | 171,780 | 11.54% | ³ | $ | 59,560 | ³ | 4.0% | ³ | $ | 89,340 | ³ | 6.0% | |||||||||||||||||||||||||||
| Tier 1 Capital (to average assets) |
||||||||||||||||||||||||||||||||||||||||
| FB Financial Corporation |
$ | 171,354 | 7.97% | ³ | $ | 86,053 | ³ | 4.0% | N/A | N/A | ||||||||||||||||||||||||||||||
| FirstBank |
$ | 171,780 | 7.98% | ³ | $ | 86,054 | ³ | 4.0% | ³ | $ | 107,568 | ³ | 5.0% | |||||||||||||||||||||||||||
|
|
||||||||||||||||||||||||||||||||||||||||
161
Table of Contents
Index to Financial Statements
We also have outstanding junior subordinated debentures with a carrying value of $30.9 million at June 30, 2016 and December 31, 2015 and 2014, of which $30.0 million are included in our Tier 1 capital. The Federal Reserve Board issued rules in March 2005 providing more strict quantitative limits on the amount of securities that, similar to our junior subordinated debentures, are includable in Tier 1 capital. This guidance, which became fully phased-in in March 2009, did not impact the amount of debentures we include in Tier 1 capital. In addition, although our existing junior subordinated debentures are unaffected and are included in our Tier 1 capital, on account of changes enacted as part of the Dodd-Frank Act, any trust preferred securities issued after May 19, 2010 may not be included in Tier 1 capital.
In July 2013, the Federal Reserve, the FDIC and the Office of the Comptroller of the Currency approved the implementation of the Basel III regulatory capital reforms and issued rules effecting certain changes required by the Dodd-Frank Act, which we refer to as the Basel III Rules, that call for broad and comprehensive revision of regulatory capital standards for U.S. banking organizations. The Basel III Rules implement a new common equity Tier 1 minimum capital requirement, a higher minimum Tier 1 capital requirement and other items that will affect the calculation of the numerator of a banking organization’s risk-based capital ratios. Additionally, the Basel III Rules apply limits to a banking organization’s capital distributions and certain discretionary bonus payments if the banking organization does not hold a specified amount of common equity Tier 1 capital in addition to the amount necessary to meet its minimum risk-based capital requirements.
The new common equity Tier 1 capital ratio includes common equity as defined under GAAP and does not include any other type of non-common equity under GAAP. When the Basel III Rules are fully phased in 2019, banks will be required to have common equity Tier 1 capital of 4.5% of average assets, Tier 1 capital of 6% of average assets, as compared to the current 4%, and total capital of 8% of risk-weighted assets to be categorized as adequately capitalized. The Basel III Rules do not require the phase-out of trust preferred securities as Tier 1 capital of bank holding companies of the Company’s size.
Further, the Basel III Rules changed the agencies’ general risk-based capital requirements for determining risk-weighted assets, which will affect the calculation of the denominator of a banking organization’s risk-based capital ratios. The Basel III Rules have revised the agencies’ rules for calculating risk-weighted assets to enhance risk sensitivity and incorporate certain international capital standards of the Basel Committee on Banking Supervision set forth in the standardized approach of the “International Convergence of Capital Measurement and Capital Standards: A Revised Framework”.
The calculation of risk-weighted assets in the denominator of the Basel III capital ratios are adjusted to reflect the higher risk nature of certain types of loans. Specifically, as applicable to the Company and the Bank:
| • | Commercial mortgages: Replaces the current 100% risk weight with a 150% risk weight for certain high volatility commercial real estate acquisition, development and construction loans. |
| • | Nonperforming loans: Replaces the current 100% risk weight with a 150% risk weight for loans, other than residential mortgages, that are 90 days past due or on nonaccrual status. |
| • | Securities pledged to overnight repurchase agreements. |
| • | Unfunded lines of credit one year or less. |
Generally, the new Basel III Rules became effective on January 1, 2015, although parts of the Basel III Rules will be phased in through 2019. As of December 31, 2015, the Bank and Company met all capital adequacy requirements to which it is subject. Also, as of June 30, 2015, the most recent notification from the FDIC, the Bank was well capitalized under the regulatory framework for prompt corrective action. There are no conditions or events since that notification that management believes have changed the Bank’s category.
162
Table of Contents
Index to Financial Statements
Capital Expenditures
Currently, we have not committed to enter into any material capital expenditures other than routine updates to existing facilities amounting to less than $1.0 million over the next twelve months.
Shareholder’s equity
Our total shareholder’s equity was $265.8 million at June 30, 2016 and $236.7 million, $215.2 million and $189.7 million at December 31, 2015, 2014 and 2013, respectively. Book value per share was $15.47 at June 30, 2016 and $13.78, $12.53 and $11.04 at December 31, 2015, 2014 and 2013. The growth in shareholders’ equity was attributable to earnings retention offset by dividends declared and changes in accumulated other comprehensive income. If we gave effect to our conversion from a subchapter S Corporation as of June 30, 2016 we would have recorded a deferred tax liability of $15.1 million along with a corresponding $12.8 million decrease to shareholder’s equity.
Off-balance sheet transactions
We enter into loan commitments and standby letters of credit in the normal course of our business. Loan commitments are made to accommodate the financial needs of our clients. Standby letters of credit commit us to make payments on behalf of clients when certain specified future events occur. Both arrangements have credit risk essentially the same as that involved in extending loans to clients and are subject to our normal credit policies. Collateral (e.g., securities, receivables, inventory, equipment, etc.) is obtained based on management’s credit assessment of the client.
Loan commitments and standby letters of credit do not necessarily represent our future cash requirements because while the borrower has the ability to draw upon these commitments at anytime, these commitments often expire without being drawn upon. Our unfunded loan commitments and standby letters of credit outstanding at the dates indicated were as follows:
| June
30, 2016 (unaudited) |
December 31, | |||||||||||||||
| 2015 | 2014 | 2013 | ||||||||||||||
| Loan commitments |
$ | 619,538 | $ | 554,274 | $ | 397,941 | $ | 323,161 | ||||||||
| Standby letters of credit |
20,695 | 20,338 | 12,918 | 6,787 | ||||||||||||
|
|
||||||||||||||||
We closely monitor the amount of our remaining future commitments to borrowers in light of prevailing economic conditions and adjust these commitments as necessary. We will continue this process as new commitments are entered into or existing commitments are renewed.
For more information about our off-balance sheet transactions, see Note 17, “Commitments and Contingencies,” in the notes to our consolidated financial statements.
163
Table of Contents
Index to Financial Statements
Contractual obligations
The following tables present, as of December 31, 2015, our significant fixed and determinable contractual obligations to third parties by payment date. For more information about our contractual obligations, see Note 17, “Commitments and Contingencies,” in the notes to our consolidated financial statements.
| As of December 31, 2015 payments due in: | ||||||||||||||||||||
| (in thousands) | Less than 1 year |
1 to 3 years | 3 to 5 years | More than 5 years |
Total | |||||||||||||||
| Operating Leases |
$ | 2,753 | $ | 4,571 | $ | 3,535 | $ | 8,169 | $ | 19,028 | ||||||||||
| Time Deposits(1) |
233,768 | 74,218 | 17,573 | — | 325,559 | |||||||||||||||
| Securities sold under agreements to repurchase(1) |
105,133 | — | — | — | 105,133 | |||||||||||||||
| Junior Subordinated Debt(1)(2) |
— | — | — | 30,930 | 30,930 | |||||||||||||||
| FHLB advances(1) |
294 | 11,023 | 832 | 3,462 | 15,611 | |||||||||||||||
| Other contractual obligations(3) |
586 | — | — | — | 586 | |||||||||||||||
|
|
|
|||||||||||||||||||
| Total |
$ | 342,534 | $ | 89,812 | $ | 21,940 | $ | 42,561 | $ | 496,847 | ||||||||||
|
|
||||||||||||||||||||
| (1) | Excludes interest. |
| (2) | Includes $10.1 million of subordinated notes held by our sole shareholder that we intend to repay in full utilizing proceeds from this offering, subject to regulatory approval. |
| (3) | Purchase obligations represent obligations under agreements to purchase goods or services that are enforceable and legally binding on the Company and that specify all significant terms, including: fixed or minimum quantities to be purchased; fixed, minimum or variable price provisions; and the approximate timing of the transaction. The purchase obligation amounts presented above primarily relate to certain contractual payments for capital expenditures expected to be incurred in connection with construction and remodeling projects. |
Risk management
We maintain a risk management program that assists us in identifying, managing, monitoring and controlling potential risks that may affect us. Risk identification is a continuous process and occurs at both the transaction level and the portfolio level. In addition, management seeks to identify interdependence and correlations across portfolios and lines of business that may amplify risk exposure. Risk measurement enables us to effectively control and monitor risk levels and is based on the sophistication of the risk measurement tools used to reflect the complexity and levels of assumed risk. We monitor risks by timely reviewing risk positions and exceptions.
We control risks through limits that are communicated through policies, standards, procedures and processes that define responsibility and authority. Such limits serve as a means to control exposures to the various risks associated with our activities, and are meaningful management tools that can be adjusted if conditions or risk tolerances change. In addition, we maintain a process to authorize exceptions or changes to risk limits when warranted through an infrastructure that includes local authority, centralized policymaking and a strong system of checks and balances. These risk management practices help to ensure effective reporting, compliance with all laws, rules and regulations, avoid damage to our reputation and related consequences and attain our strategic goals while avoiding pitfalls and surprises along the way.
The primary risks that are associated with the Company include, among others, credit, interest rate and liquidity risk. Credit and interest rate risk are discussed below, while liquidity risk is discussed in the previous subsection under the heading “Liquidity and capital resources.” For a more complete discussion of our risk management framework and our other risks, see “Business: Risk management.”
164
Table of Contents
Index to Financial Statements
Credit risk
Inherent in any lending activity is credit risk, that is, the risk of loss should a borrower default. We have a number of documented loan policies and procedures that set forth the approval and monitoring process of our lending function. Adherence to these policies and procedures is managed by management and reviewed by the Bank’s Board of Directors. The Bank’s Board of Directors reviews and approves loan policy changes, monitors loan portfolio trends and credit trends and reviews and approves loan transactions that exceed management thresholds as set forth in our loan policies.
The Company’s day-to-day lending operations and credit risk are monitored and managed on an ongoing basis by the Bank’s chief risk officer, chief credit officer and CEO and overseen by the Bank’s Credit Committee and the Bank’s Board of Directors. In addition, we maintain a loan review staff to independently monitor loan quality and lending practices. Each loan officer has the primary responsibility for appropriately “risk rating” each commercial loan that is made. In addition, the Bank’s Credit Committee is responsible for the ongoing monitoring of loan portfolio performance through the review of financial reports, loan officer reports, audit reviews, exceptions reporting and concentration analysis. This monitoring process also includes an ongoing review of loan risk ratings and management of our allowance for loan losses.
In compliance with our loan policy, our bankers are given lending limits based on their knowledge and experience. At the direction of the Bank’s Board of Directors, our senior management team approves loan authorities for the lending staff by periodically evaluating each lending officer’s prior performance for credit quality and compliance as a tool for establishing and enhancing lending limits. Loan requests of amounts greater than an officer’s lending limits are reviewed by senior credit officers, market presidents, regional presidents, the Credit Committee or the Board of Directors, as set forth in our loan policy. Our loan approval process is characterized by delegated authority to “in-market” individual bankers, market presidents and credit officers. We believe that the ability to have individual but limited loan authority coupled with appropriate approval limits for our market presidents and credit officers allows us to provide prompt and appropriate responses to our clients in each of our markets while still allowing for the appropriate level of oversight.
We utilize a risk grading system that enables management to differentiate individual loan quality and forecast future profitability and portfolio loss potential. We assign a credit risk rating at the time a loan is made and loan review personnel monitor and, if necessary, adjust the grades assigned to loans promptly through periodic examination, focusing its review on commercial and real estate loans rather than consumer and consumer mortgage loans. Loan quality or “risk-rating” grades are assigned based upon certain credit factors, as outlined in our loan policy.
For commercial and commercial real estate secured loans, risk-rating grades are assigned by lending, credit administration or loan review personnel, based on an analysis of the financial and collateral strength and other credit attributes underlying each loan. Loan grades range from 1 to 8, with 1 being loans with the least credit risk. Allowance factors established by management are applied to the total balance of loans in each grade to determine the amount needed in the allowance for loan losses. The allowance factors are established based on historical loss ratios and default probabilities experienced by us for these loan types, as well as the credit quality criteria underlying each grade, adjusted for trends and expectations about losses inherent in our existing portfolios. In making these adjustments to the allowance factors, management takes into consideration factors which it believes are causing, or are likely in the future to cause, losses within our loan portfolio but which may not be fully reflected in our historical loss ratios. For portfolio balances of consumer, consumer mortgage and certain other similar loan types, allowance factors are determined based on historical loss ratios and default probabilities by portfolio for the preceding 5 years and may be adjusted by other qualitative criteria.
165
Table of Contents
Index to Financial Statements
The Bank’s Credit Committee and loan review personnel monitor loans that are past due or those that have been downgraded and placed on our internal watch list due to a decline in the collateral value or cash flow of the debtor. This information is used to assist management in monitoring credit quality. In addition, the Credit Committee monitors and identifies risks within our loan portfolio by focusing its efforts on reviewing and analyzing loans which are not on our internal watch list. The Bank’s Credit Committee monitors loans in portfolios or regions which management believes could be stressed or experiencing credit deterioration.
A loan is considered impaired when, based on current information and events, it is probable that we will be unable to collect the scheduled payments of principal and interest when due according to the contractual terms of the loan agreement. Impairment is measured on a loan-by-loan basis for problem commercial loans of $250,000 or greater by either the present value of expected future cash flows discounted at the loan’s effective interest rate, the loan’s obtainable market price or the fair value of the collateral if the loan is collateral dependent. For real estate collateral, the fair market value of the collateral is based upon a recent valuation by a qualified individual or licensed appraiser of the underlying collateral. Our central appraisal review department reviews and approves third-party appraisals obtained by us on real estate collateral and monitors loan maturities to ensure updated appraisals are obtained. This department is staffed with a licensed real estate appraiser and two trained appraisal specialists. When the ultimate collectability of a loan’s principal is in doubt, wholly or partially, the loan is placed on nonaccrual.
After all collection efforts have failed, collateral securing loans may be repossessed and sold or, for loans secured by real estate, foreclosure proceedings are initiated. The collateral is sold at public auction or added to our books for fair market value (based upon recent appraisals described in the above paragraph), with fees associated with the foreclosure being deducted from the sales price. The purchase price is applied to the outstanding loan balance. If the loan balance is greater than the sales proceeds, the deficient balance is sent to the CEO and Chairman of the Board for charge-off approval. These charge-offs reduce the allowance for loan losses.
Charge-offs reflect the realization of losses in the portfolio that were recognized previously through the provision for loan losses. Net recoveries and net charge-offs for June 30, 2016 and December 31, 2015 were $72 thousand and $1.5 million, respectively, or 0.00% and 0.10%, respectively, as a percentage of average loans, compared to net charge-offs of $0.6 million, or 0.04%, for 2014. The level of net charge-offs since 2012 is a direct result of the prolonged effects of the economic downturn in our markets on borrowers’ ability to repay their loans coupled with the decline in market values of the underlying collateral securing loans, particularly real estate secured loans. Furthermore, it is our policy to diligently pursue collection for an extended period before charging-off a loan. The large inventories of both completed residential homes and land that had been developed for future residential home construction, coupled with declining consumer demand for residential real estate, caused a severe decline in the values of both homes and developed land. As a result, the 2012 and 2011 credit quality of some of the loans in our construction portfolio deteriorated. However, with the improving economy and the improving credit quality of our loan portfolios, we experienced lower levels of classified loans and nonperforming loans for the quarter ended June 30, 2016 and the years ended 2015 and 2014 as compared to 2013 resulting in fewer charged off loans.
Interest rate sensitivity
Our market risk arises primarily from interest rate risk inherent in the normal course of lending and deposit-taking activities. Management believes that our ability to successfully respond to changes in interest rates will have a significant impact on our financial results. To that end, management actively monitors and manages our interest rate risk exposure.
166
Table of Contents
Index to Financial Statements
The Asset Liability Committee (ALC), which is authorized by the Bank’s Board of Directors, monitors our interest rate sensitivity and makes decisions relating to that process. The ALC’s goal is to structure our asset/ liability composition to maximize net interest income while managing interest rate risk so as to minimize the adverse impact of changes in interest rates on net interest income and capital in either a rising or declining interest rate environment. Profitability is affected by fluctuations in interest rates. A sudden and substantial change in interest rates may adversely impact our earnings because the interest rates borne by assets and liabilities do not change at the same speed, to the same extent or on the same basis.
We monitor the impact of changes in interest rates on our net interest income and economic value of equity, or EVE, using rate shock analysis. Net interest income simulations measure the short-term earnings exposure from changes in market rates of interest in a rigorous and explicit fashion. Our current financial position is combined with assumptions regarding future business to calculate net interest income under varying hypothetical rate scenarios. EVE measures our long-term earnings exposure from changes in market rates of interest. EVE is defined as the present value of assets minus the present value of liabilities at a point in time. A decrease in EVE due to a specified rate change indicates a decline in the long-term earnings capacity of the balance sheet assuming that the rate change remains in effect over the life of the current balance sheet.
The following analysis depicts the estimated impact on net interest income and EVE of immediate changes in interest rates at the specified levels for the periods presented:
| Percentage change in: | ||||||||||||||||||||||||
| Change in interest rates | Net interest income(1) | |||||||||||||||||||||||
| Year 1 | Year 2 | |||||||||||||||||||||||
| (in basis points) | June 30, 2016 |
December 31, 2015 |
December 31, 2014 |
June 30 2016 |
December 31, 2015 |
December 31, 2014 |
||||||||||||||||||
| +400 |
16.2% | 4.7% | (1.1)% | 24.5% | 12.7% | 4.7% | ||||||||||||||||||
| +300 |
12.5% | 3.5% | (0.9)% | 18.8% | 9.7% | 3.9% | ||||||||||||||||||
| +200 |
8.7% | 2.4% | (0.8)% | 13.1% | 6.8% | 2.8% | ||||||||||||||||||
| +100 |
4.7% | 1.3% | (0.6)% | 7.1% | 3.7% | 1.5% | ||||||||||||||||||
| -100 |
(4.2)% | (3.7)% | (2.0)% | (5.7)% | (5.6)% | (3.5)% | ||||||||||||||||||
|
|
||||||||||||||||||||||||
| Percentage change in: | ||||||||||||
| Change in interest rates | Economic value of equity(2) |
|||||||||||
| (in basis points) | June 30, 2016 |
December 31, 2015 |
December 31, 2014 |
|||||||||
| +400 |
2.3% | (8.6)% | (23.6)% | |||||||||
| +300 |
3.3% | (4.9)% | (17.3)% | |||||||||
| +200 |
4.1% | (1.2)% | (10.7)% | |||||||||
| +100 |
3.8% | 2.2% | (4.6)% | |||||||||
| -100 |
(14.9)% | (8.2)% | (9.3)% | |||||||||
|
|
||||||||||||
| (1) | The percentage change represents the projected net interest income for 12 months and 24 months on a flat balance sheet in a stable interest rate environment versus the projected net income in the various rate scenarios. |
| (2) | The percentage change in this column represents our EVE in a stable interest rate environment versus EVE in the various rate scenarios. |
The results for the net interest income simulation for June 30, 2016 and December 31, 2015 resulted in an asset sensitive position rather than a slightly liability sensitive position for December 31, 2014. The change is primarily due to the increase in mortgage loans held for sale and trending growth of noninterest bearing deposits. As our mortgage loans held for sale increase, we become more asset sensitive, which has been our current trend. However, as mortgage rates rise, we expect our mortgage originations and mortgage loans held
167
Table of Contents
Index to Financial Statements
for sale to decline, which will make us less asset sensitive. Beta assumptions on loans and deposits were consistent for both time periods. The ALC also reviewed beta assumptions for time deposits and loans with industry standards and revised them accordingly. For the June 30, 2016, December 31, 2015 2014 simulations the loan and time deposit betas were 100% for all rate scenarios as is industry standard.
The preceding measures assume no change in the size or asset/liability compositions of the balance sheet. Thus, the measures do not reflect the actions the ALC may undertake in response to such changes in interest rates. The above results of the interest rate shock analysis are within the parameters set by the Bank’s Board of Directors. The scenarios assume instantaneous movements in interest rates in increments of 100, 200, 300 and 400 basis points. With the present position of the target federal funds rate, the declining rate scenarios seem improbable. Furthermore, it has been the Federal Reserve’s policy to adjust the target federal funds rate incrementally over time. As interest rates are adjusted over a period of time, it is our strategy to proactively change the volume and mix of our balance sheet in order to mitigate our interest rate risk. The computation of the prospective effects of hypothetical interest rate changes requires numerous assumptions regarding characteristics of new business and the behavior of existing positions. These business assumptions are based upon our experience, business plans and published industry experience. Key assumptions employed in the model include asset prepayment speeds, competitive factors, the relative price sensitivity of certain assets and liabilities and the expected life of non-maturity deposits. Because these assumptions are inherently uncertain, actual results may differ from simulated results.
We utilize derivative financial instruments, including rate lock commitments and forward loan sales contracts as part of its ongoing efforts to mitigate its interest rate risk exposure inherent in our mortgage pipeline and held for sale portfolio. Under the interest rate lock commitments, interest rates for a mortgage loan are locked in with the client for a period of time, typically thirty days. Once an interest rate lock commitment is entered into with a client, we also enter into a forward commitment to sell the residential mortgage loan to secondary market investors. Accordingly, we do not incur risk if the interest rate lock commitment in the pipeline fails to close. Forward loan sale contracts are contracts for delayed delivery of mortgage loans. We agree to deliver on a specified future date, a specified instrument, at a specified price or yield. The credit risk inherent to us arises from the potential inability of counterparties to meet the terms of their contracts. In the event of non-acceptance by the counterparty, we would be subject to the credit and inherent (or market) risk of the loans retained.
For more information about our derivative financial instruments, see Note 8 and Note 18, “Derivative Instruments,” in the notes to our condensed consolidated financial statements and consolidated financial statements.
Impact of inflation
The consolidated financial statements and related consolidated financial data presented herein have been prepared in accordance with U.S. generally accepted accounting principles and practices within the banking industry which require the measurement of financial position and operating results in terms of historical dollars without considering the changes in the relative purchasing power of money over time due to inflation. Unlike most industrial companies, virtually all the assets and liabilities of a financial institution are monetary in nature. As a result, interest rates have a more significant impact on a financial institution’s performance than the effects of general levels of inflation.
JOBS Act
The JOBS Act permits us an extended transition period for complying with new or revised financial accounting standards affecting public companies until they would apply to private companies. However, we have elected
168
Table of Contents
Index to Financial Statements
not to take advantage of this extended transaction period, which means that the financial statements included in this prospectus, as well as any financial statements that we file in the future, will be subject to all new or revised accounting standards generally applicable to public companies. Our election not to take advantage of the extended transition period is irrevocable.
Critical accounting policies
The accounting principles we follow and our methods of applying these principles conform with U.S. generally accepted accounting principles and with banking industry general practices. We monitor the status of proposed and newly issued accounting standards to evaluate the impact on our financial condition and results of operations. Our accounting policies, including the impact of newly issued accounting standards, are discussed in further detail in Note 1, “Summary of Significant Accounting Policies,” in the notes to our consolidated financial statements. The following discussion presents some of the more significant judgments and estimates used in preparing our financial statements.
Allowance for loan losses
The allowance for loan losses is established through a provision for loan losses charged to expense. Management periodically reviews the allowance for loan losses. Loans are charged against the allowance for loan losses when management believes that the collectability of principal is unlikely. Recoveries of amounts previously charged off are credited to the allowance. In the event management concludes that the allowance for loan losses is more than adequate to absorb potential loan losses, a reverse provision may be recorded whereby a credit is made to the expense account.
The allowance for loan losses is maintained at a level that management considers adequate to absorb probable incurred credit losses on outstanding loans. Factors considered in management’s evaluation of the adequacy of the allowance are current and anticipated economic conditions, previous loan loss experience, changes in the nature, volume and composition of the loan portfolio, industry or other concentrations of credit, review of specific problem loans, the level of classified and nonperforming loans, the results of regulatory examinations, the estimated fair value of underlying collateral and overall quality of the loan portfolio. The allowance consists of specific and general components. The specific component relates to loans that are classified as impaired. For such loans, an allowance is established when the discounted cash flows or the collateral value, less estimated selling costs, of the impaired loan is lower than the carrying value of that loan. The general component covers non-impaired loans and is based on historical loss experience with the overall level, adjusted for qualitative, economic and other factors impacting the future collectability of the loan portfolio.
Certain loans acquired in acquisitions or mergers are accounted for under ASC 310-30 “Loans and Debt Securities Acquired with Deteriorated Credit Quality,” which prohibits the carryover of an allowance for loan losses for loans acquired in which the acquirer concludes that it will not collect the contractual amount. As a result, these loans are carried at values which represent management’s estimate of the future cash flows of these loans. Increases in expected cash flows to be collected from the contractual cash flows are required to be recognized as an adjustment to the loan’s yield over its remaining life, while decreases in expected cash flows are required to be recognized as an impairment. A more detailed discussion of loans acquired with deteriorated credit quality in connection with the acquisition of NWGB is included in Note 2, “Acquisition of Northwest Georgia Bank,” in the Notes to the consolidated financial statements included in this prospectus.
Investment securities
Debt securities are classified as held to maturity and carried at amortized cost when management has the positive intent and ability to hold them to maturity. Debt securities are classified as available-for-sale when
169
Table of Contents
Index to Financial Statements
they might be sold before maturity. Equity securities with readily determinable fair values are classified as available-for-sale. Securities available-for-sale are carried at fair value, with unrealized holding gains and losses reported in other comprehensive income (loss), net of applicable taxes.
Interest income includes the amortization and accretion of purchase premium and discount. Premiums and discounts on securities are amortized on the level-yield method anticipating prepayments based upon the prior three month average monthly prepayments when available. Gains and losses on sales are recorded on the trade date and determined using the specific identification method as no ready market exists for this stock and it has no quoted market value.
We evaluate securities for other-than-temporary impairment (“OTTI”) at least on a quarterly basis, and more frequently when economic or market concerns warrant such evaluation. For securities in an unrealized loss position, consideration is given to the length of time and the extent to which the fair value has been less than cost, the financial condition and near-term prospects of the issuer, and our intent and ability to retain our investment in the issuer for a period of time sufficient to allow for any anticipated recovery in fair value. In analyzing an issuer’s financial condition, we consider whether the securities are issued by the federal government or its agencies, whether downgrades by bond rating agencies have occurred, and the results of reviews of the issuer’s financial condition.
When OTTI is determined to have occurred, the amount of the OTTI recognized in earnings depends on whether we intend to sell the security or it is more likely than not that we will be required to sell the security before recovery of its amortized cost basis, less any current-period credit loss. If we intend to sell the security or it is more likely than not that we will be required to sell the security before recovery of its amortized cost basis, less any current-period credit loss, the OTTI recognized in earnings is equal to the entire difference between its amortized cost basis and its fair value at the balance sheet date. If we do not intend to sell the security and it is not more likely than not that we will be required to sell the security before recovery of its amortized cost basis less any current-period loss, the OTTI is separated into the amount representing the credit loss and the amount related to all other factors. The amount of the total related to the credit loss is determined based on the present value of cash flows expected to be collected and is recognized as a charge to earnings. The amount of the OTTI related to other factors is recognized in other comprehensive income (loss), net of applicable taxes. The previous amortized cost basis less the OTTI recognized in earnings becomes the new amortized cost basis of the investment.
Loans held for sale
Loans originated and intended for sale in the secondary market, primarily mortgage loans, are carried at fair value as permitted under the guidance in ASC 825, “Financial Instruments.” Gains and losses are recognized as a charge to income at the time the loan is closed. These gains and losses are classified under the line item “Mortgage banking income” in our consolidated financial statements. Pass through origination costs and related loan fees are also included in “mortgage banking income”. Other expenses are classified in the appropriate noninterest expense accounts.
Foreclosed real estate
Real estate acquired through, or in lieu of, loan foreclosure is initially recorded at fair value less the estimated cost to sell at the date of foreclosure which may establish a new cost basis. After foreclosure, valuations are periodically performed by management and the asset is carried at the lower of carrying amount or fair value less costs to sell. Revenue and expenses from operations are included in other noninterest income and noninterest expenses. Losses due to the valuation of the property are included in loss on sales or write-downs of foreclosed real estate.
170
Table of Contents
Index to Financial Statements
Mortgage servicing rights
We began retaining the right to service certain mortgage loans in 2014 that we sell to secondary market investors. These mortgage servicing rights are recognized as a separate asset on the date the corresponding mortgage loan is sold.
Mortgage servicing rights are amortized in proportion to and over the period of estimated net servicing income. These servicing rights are carried at the lower of amortized cost or fair value. Fair value is determined using an income approach with various assumptions including expected cash flows, prepayment speeds, market discount rates, servicing costs, and other factors. Mortgage servicing rights are carried at amortized cost. Impairment losses on mortgage servicing rights are recognized to the extent by which the unamortized cost exceeds fair value.
Goodwill and other intangible assets
Goodwill represents the excess of the cost of an acquisition over the fair value of the net assets acquired. Goodwill impairment testing is performed annually or more frequently if events or circumstances indicate possible impairment. Goodwill is assigned to the Company’s reporting units, which are determined based on geography and may include one or more individual branches. Fair values of reporting units are determined using either discounted cash flow analyses based on internal financial forecasts or, if available, market-based valuation multiples for comparable businesses. If the estimated implied fair value of goodwill is less than the carrying amount, an impairment loss would be recognized as noninterest expense to reduce the carrying amount to the estimated implied fair value which could be material to our operating results for any particular reporting period.
Other intangible assets consist of core deposit intangible assets arising from whole bank and branch acquisitions. They are initially measured at fair value and then amortized on a straight-line method over their estimated useful lives.
Rate-lock commitments and forward loan sale contracts
We enter into commitments to originate loans whereby the interest rate on the loan is determined prior to funding (rate-lock commitments). Rate-lock commitments on mortgage loans that are intended to be sold are considered to be derivatives. Accordingly, such commitments, along with any related fees received from potential borrowers, are recorded at fair value in other assets or liabilities, with changes in fair value recorded in mortgage banking income. Fair value is based on fees currently charged to enter into similar agreements, and for fixed-rate commitments, the difference between current levels of interest rates and the committed rates is also considered.
We utilize forward loan sale contracts to mitigate the interest rate risk inherent in our mortgage loan pipeline and held-for-sale portfolio. Forward loan sale contracts are contracts for delayed delivery of mortgage loans. We agree to deliver on a specified future date, a specified instrument, at a specified price or yield. However, the contract may allow for cash settlement. The credit risk inherent to us arises from the potential inability of counterparties to meet the terms of their contracts. In the event of non-acceptance by the counterparty, we would be subject to the credit and inherent (or market) risk of the loans retained. Such contracts are accounted for as derivatives and, along with related fees paid to investor are recorded at fair value in derivative assets or liabilities, with changes in fair value recorded in mortgage banking income. Fair value is based on the estimated amounts that we would receive or pay to terminate the commitment at the reporting date.
171
Table of Contents
Index to Financial Statements
Business combinations, Accounting for Acquired Loans and related Assets
We accounted for our acquisition of NWGB under ASC 805, “Business Combinations”, which requires the use of the purchase method of accounting. All identifiable assets acquired, including loans, are recorded at fair value. No allowance for loan losses related to the acquired loans is recorded on the acquisition date because the fair value measurements incorporate assumptions regarding the credit risk. The fair value measurements of acquired loans are based on the estimates related to expected prepayments and the amount of timing of undiscounted expected principal, interest and other cash flows.
Over the life of the acquired loans, we continue to estimate cash flows expected to be collected on individual loans or on pools of loans sharing common risk characteristics. We evaluate, as of the end of each fiscal quarter, the present value of the acquired loans determined using the effective interest rates. If the cash flows expected to be collected have decreased, we recognize a provision for loan loss in our consolidated statement of income; for any increases in cash flows expected to be collected, the Company adjusts the amount of acceptable yield recognized on a prospective basis over the loans’ or the pool’s remaining life.
Recently issued accounting pronouncements
We have evaluated new accounting pronouncements that have recently been issued and have determined that there are no new accounting pronouncements that should be described in this section that will impact our operations, financial condition or liquidity in future periods. Refer to Note 1 (W), “Summary Significant Accounting Policies—Recently Issued Accounting Pronouncements,” in the notes to our consolidated financial statements for a discussion of recent accounting pronouncements that have been adopted by us or that will require enhanced disclosures in our financial statements in future periods.
Change in accountants
On April 23, 2015, our Audit Committee approved the dismissal of HORNE LLP (“Horne”) from its role as our independent registered accounting firm for the Company.
The reports of Horne on our consolidated financial statements for the years ended December 31, 2013 and 2014, which are not included herein, did not contain an adverse opinion or a disclaimer of opinion and were not qualified or modified as to uncertainty, audit scope or accounting principles.
During the years ended December 31, 2013 and 2014, and the subsequent interim period from January 1, 2015 through April 23, 2015, (i) we had no disagreements with Horne on any matter of accounting principles or practices, financial statement disclosure or auditing scope or procedure, which disagreements, if not resolved to the satisfaction of Horne, would have caused Horne to make reference to the subject matter of the disagreements in connection with its report on the consolidated financial statements for such periods, and (ii) there were no “reportable events” as defined in Item 304(a)(1)(v) of Regulation S-K.
We provided Horne with a copy of this disclosure prior to its filing and requested that Horne furnish it with a letter addressed to the Securities and Exchange Commission stating whether it agrees with the above statements and, if not, stating the respect in which it does not agree. A copy of Horne’s letter, dated , 2016 is attached as Exhibit 16.1 to this Form S-1.
On April 23, 2015, our Audit Committee approved the engagement of RSM US LLP as our new independent registered public accounting firm and to re-audit our consolidated financial statements for the years ended December 31, 2013 and 2014 in connection with this offering. We did not consult RSM US LLP regarding (i) the application of accounting principles to a specific transaction, either completed or proposed, or the type of audit opinion that might be rendered on the Company’s financial statements, or (ii) any matter that was the subject
172
Table of Contents
Index to Financial Statements
of a disagreement (as defined in Item 304(a)(1)(iv) of Regulation S-K) or any reportable event (as described in Item 304(a)(1)(v) of Regulation S-K), during the years ended December 31, 2013, 2014, and 2015.
FB Financial Corporation
We are a bank holding company and we conduct all of our material business operations through the Bank. As a result, the discussion and analysis above relates to activities primarily conducted at the Bank level.
173
Table of Contents
Index to Financial Statements
Executive officers
The following table sets forth information regarding the executive officers of FB Financial Corporation:
| Name | Age | Position | ||||
| James W. Ayers |
72 | Executive Chairman and Chairman of the Board | ||||
| Christopher T. Holmes |
52 | President, Chief Executive Officer and Director | ||||
| James R. Gordon |
50 | Chief Financial Officer | ||||
| Wilburn J. Evans |
56 | President of FirstBank Ventures | ||||
| Timothy L. Johnson |
55 | Chief Risk Officer | ||||
Certain biographical information for our executive officers is set forth below.
James W Ayers. Mr. Ayers, who serves as our Executive Chairman and the Chairman of the boards of both the Company and FirstBank, has led FirstBank since its modern inception in 1984 when he, along with an associate, acquired Farmers State Bank in Scotts Hill, Tennessee. He has served on our board since the formation of the Company in 1984 and as our Executive Chairman since April 2016. He has spent his career in business, founding and growing a number of successful ventures in both the health care and real estate markets. Mr. Ayers brings an extensive knowledge of our business and our markets gained from his long career leading the Bank and growing our franchise into what it is today. In addition, Mr. Ayers provides our board with valuable strategic insight and business management skills gained over the course of his business career owning and leading numerous successful businesses. In addition to his service on the Board and as our Executive Chairman, Mr. Ayers has, since 2010, served as the Chairman of Community Care, Inc., which develops and manages surgery centers, and The Ayers Foundation, which strives to improve the quality of life of Tennesseans by offering financial support for college scholarships, medical research and services, and continuing education for teachers. He is also the Chairman and President of Ayers Asset Management, Inc., a family-owned private investment company. Mr. Ayers’ son, Jonathan, also serves on the board of FirstBank.
Christopher T. Holmes. Mr. Holmes, President and CEO of both the Company and FirstBank, has served as a member of our board of directors since he joined FirstBank in 2010 as our Chief Banking Officer. He was named President of FirstBank in 2012 and CEO in 2013, succeeding our former CEO, Douglas Cruickshanks, Jr., who had served in that role for over a decade. As President and CEO, Mr. Holmes is responsible for leading and managing all facets of the bank’s operations, including establishing its long-term goals, strategies, and corporate vision. Mr. Holmes has spent twenty-four years in the banking industry, and prior to his time at FirstBank served as the Director of Corporate Financial Services and the Chief Retail Banking Officer for the Greenville, South Carolina based South Financial Group, a publicly traded bank holding company. Mr. Holmes’ responsibilities at South Financial Group included mortgage, insurance, the SBA division, retail strategy, retail sales and oversight at the 180-branch network. Previously, he worked for twenty years in the Memphis-area market, first with Ernst & Young and then in several management positions for National Bank of Commerce (which was acquired by SunTrust) and Trustmark National Bank. He holds his certified public accountant certification. Mr. Holmes’ leadership, together with the skills and knowledge of the banking industry and the Bank gained during his tenure with us, has been instrumental to our recent growth and success. In addition, Mr. Holmes brings to our board and company a unique blend of banking experience in both community and metropolitan markets that is extremely valuable to us as we look to grow our franchise in both markets.
174
Table of Contents
Index to Financial Statements
James R. Gordon. Mr. Gordon serves as Chief Financial Officer of both the Company and FirstBank. He assumed this position in January 2016. In this capacity, he oversees the finance division of both our holding company and the bank. Prior to joining FirstBank, Mr. Gordon was a Partner at Horne LLP, an accounting firm ranked among the top fifty accounting firms in the country, from 2011 to 2016, and served as CFO of The South Financial Group, a large publicly traded bank holding company headquartered in Greenville, SC, from 2007 to 2010. In his capacity as CFO of The South Financial Group, his primary responsibilities included overseeing all of the accounting, financial, investor relations and related functions as well as the Mortgage, SBA Lending and Information Technology divisions. Mr. Gordon is a graduate of the University of Mississippi, where he earned a Bachelor’s of Accountancy in 1987. He also received a Diploma from the Mid-South School of Banking in 1992. Mr. Gordon holds his CPA certification and is a licensed accountant in the state of Tennessee.
Wilburn J. Evans. Mr. Evans has served as President of FirstBank Ventures since 2010. He has spent the majority of his career with FirstBank, helping it grow into the third largest bank headquartered in Tennessee. Mr. Evans joined FirstBank in 1987 as Chief Financial Officer before serving as Executive Vice President of FirstBank from 1996-2002 and as Chief Operating Officer of FirstBank from 2002 to 2010. As President of FirstBank Ventures, Mr. Evans has the overall responsibility for FirstBank’s mortgage banking segment and investment functions. In addition to his extensive banking experience, Mr. Evans brings three years of public accounting experience to us.
Timothy L. Johnson. Mr. Johnson is the Chief Risk Officer for FirstBank, a position he has held since 2013, overseeing the Audit, Compliance, Credit Underwriting, Risk Management, and Credit Administration departments. He joined FirstBank in 1999 as a member of the Credit and Loan Administration department, before being promoted to Senior Vice President of Loan Administration in 2000, a position he held until being promoted to Chief Risk Officer. Mr. Johnson brings 27 years of experience in financial services to FirstBank, particularly with respect to credit, mortgage, municipal finance, retail banking, commercial lending, consulting and regulatory relations. He is a member of the Risk Management Association. Mr. Johnson provides us with significant experience in risk management and compliance.
Board of directors
The following table sets forth information regarding the directors of FB Financial Corporation:
| Name | Age | Position | ||||
| James W. Ayers |
72 | Executive Chairman and Chairman of the Board | ||||
| Christopher T. Holmes |
52 | President, Chief Executive Officer and Director | ||||
| Orrin H. Ingram |
55 | Independent Director | ||||
| Ruth E. Johnson |
66 | Independent Director | ||||
| Stuart C. McWhorter |
48 | Independent Director | ||||
Certain biographical information for our directors who do not also serve as executive officers is set forth below.
Orrin H. Ingram. Mr. Ingram has served as a director of the Company since 2006. He has served as the President and Chief Executive Officer of Ingram Industries, Inc., a diversified holding company, and as the Chairman and Chief Executive Officer of Ingram Barge Company, a leading U.S. marine transportation company, since 1999. He has also served as the Chairman of the Board of Overseers at the Vanderbilt-Ingram Cancer Center since 1999. He has substantial civic leadership in the city of Nashville area having served on the board of directors for the Nashville Area Chamber of Commerce, the Boys & Girls Clubs of Middle Tennessee, and the Nashville Public Education Foundation. Mr. Ingram brings us an extensive knowledge of the Tennessee and Nashville business
175
Table of Contents
Index to Financial Statements
communities. Furthermore, his service as CEO of Ingram Industries and as Chairman and CEO of Ingram Barge, together with various board affiliations, including serving on the board of Coca-Cola European Partners, PLC, has given him leadership experience, business acumen and financial literacy that is beneficial to our board.
Ruth E. Johnson. Ms. Johnson has served as a director of FirstBank since 2004 and of the Company since 2013. In conjunction with her duties as a director of the Company, she has served as both a member and as the chair of the Company’s Audit Committee since 2013. She is the Associate Vice-President for Advancement at Meharry Medical College in Nashville, Tennessee, a position she has held since February, 2005, and was previously an attorney in private practice. In addition to her service on the Company and FirstBank boards, Ms. Johnson also serves as a director of the Baptist Healing Trust, a non-profit organization that seeks to improve the accessibility of health care to the vulnerable populations of Middle Tennessee, and the International Athena Board, a non-profit organization that supports the development of female leaders. From 1995 to 2003, Ms. Johnson served as Commissioner of Revenue for the State of Tennessee under Governor Don Sundquist. In 2014, she ended a nine year term as a board member of the Planned Giving Council of Middle Tennessee, which assists donors with charitable gift planning. Ms. Johnson provides strong legal expertise to our board of directors, particularly in the areas of corporate governance.
Stuart C. McWhorter. Mr. McWhorter has served as a director of the Company since 2006 and as a member of the Audit Committee since 2006. As the Co-Founder and Chairman of Clayton Associates since 1996, an investment firm that makes seed, angel and venture stage investments in healthcare and technology industries in Brentwood, Tennessee, Mr. McWhorter offers over 20 years of experience in entrepreneurship and early stage investing. Mr. McWhorter also served for one year from April 2015 to April 2016 as the Chief Executive Officer of the Nashville Entrepreneur Center, a Nashville-based non-profit organization that helps entrepreneurs launch and grow businesses. In addition, until 1998, Mr. McWhorter was part of the founding management team of OrthoLink Physicians Corporation, a company that offers support services for physician practices, including human resources, legal, radiology, transcription, and workers’ compensation management services, where he served as Vice President of Managed Care and Vice President of Development. He currently serves on the board of directors for Medical Reimbursements of America, PharmMD, ProxsysRX, MedEquities Healthcare REIT, Nashville Entrepreneur Center and the Lee Company. Mr. McWhorter also has substantial civic leadership in and out of Tennessee, serving on past and present boards of Belmont University, Clemson University Foundation, Tennessee Business Roundtable, YMCA of Middle Tennessee and many others. McWhorter received his Masters in Health Administration from The University of Alabama-Birmingham and B.S. in Management from Clemson University. Mr. McWhorter brings strong leadership skills for our board and has valuable experience in growing companies gained from his career providing strategic leadership to sizeable companies.
Controlled company
Our sole shareholder, James W. Ayers, will control more than 50% of the combined voting power of our common stock after the offering. As a result, we will be considered a “controlled company” for the purposes of the listing requirements of the NYSE. As a controlled company, we may elect not to comply with certain corporate governance requirements, including the requirements:
| • | that a majority of our board of directors consists of “independent directors,” as defined under NYSE rules; |
| • | that we have a nominating and corporate governance committee that is composed entirely of independent directors; |
| • | that we have a compensation committee that is composed entirely of independent directors; and |
| • | that we conduct annual performance evaluations of the nominating and corporate governance committee and compensation committee. |
176
Table of Contents
Index to Financial Statements
We may avail ourselves of certain of these exemptions for as long as we remain a “controlled company.” Following this offering, we intend to rely on these exemptions and not have a nominating and corporate governance committee. The controlled company exemption does not modify the independence requirements for our audit committee, and our audit committee is in compliance with the independence requirements of the Sarbanes-Oxley Act and NYSE rules.
Corporate governance principles and board matters
We are committed to having sound corporate governance principles, which are essential to running our business efficiently and maintaining our integrity in the marketplace. Our board of directors has adopted corporate governance guidelines that will become effective upon the consummation of this offering, which will set forth the framework within which our board of directors, assisted by its committees, will direct the affairs of our Company. Our corporate governance guidelines will address, among other things, the composition and functions of our board of directors, director independence, compensation of directors, management succession and review, board committees and selection of new directors. Upon completion of this offering, these corporate governance guidelines will be available on our website at www.firstbankonline.com.
Board structure. Upon completion of the offering, our board of directors will consist of five members. Our board has determined that each of Mr. Ingram, Ms. Johnson and Mr. McWhorter is independent under applicable NYSE rules, although as a “controlled company,” we are not required to have a majority of independent directors on our board.
Director qualifications. We believe that our directors should have the highest professional and personal ethics and values, consistent with our longstanding values and standards. They should have broad experience at the policy-making level in business, government or civic organizations. They should be committed to enhancing shareholder value and should have sufficient time to carry out their duties and to provide insight and practical wisdom based on their own unique experience. Each director must represent the interests of all shareholders. When considering potential director candidates, our board of directors also considers the candidate’s independence, character, judgment, diversity, age, skills, including financial literacy, and experience in the context of our needs and those of our board of directors. While we have no formal policy regarding the diversity of our board of directors, our board of directors may consider a broad range of factors relating to the qualifications and background of director nominees, which may include personal characteristics. Our board of director’s priority in selecting board members is the identification of persons who will further the interests of our shareholders through his or her record of professional and personal experiences and expertise relevant to our growth strategy.
Board designation rights. Pursuant to the shareholder’s agreement that we intend to enter into with Mr. Ayers prior to or upon completion of this offering, Mr. Ayers will have the right to designate a majority of the members of our board of directors for so long as Mr. Ayers owns a majority of the outstanding shares of our common stock. See “Certain relationships and related person transactions.” Mr. Ayers’ director designation rights will decrease as his percentage ownership of our common stock decreases, with the ability to designate up to (i) 40% of the total number of directors, in the event that he beneficially owns more than 40%, but less than or equal to 50%, of the outstanding shares of our common stock, (ii) up to 30% of the total number of directors, in the event that he beneficially owns more than 30%, but less than or equal to 40%, of the outstanding shares of our common stock, (iii) up to 20% of the total number of directors, in the event that he beneficially owns more than 20%, but less than or equal to 30%, of the outstanding shares of our common stock and (iv) up to 10% of the total number of directors, in the event that he beneficially owns, directly or indirectly, at least 5% of the then outstanding shares of our common stock, in each case rounded up to the nearest whole number of directors. In addition, our chief executive officer shall have the right to serve as a
177
Table of Contents
Index to Financial Statements
board member. Mr. Ayers intends to designate himself, Mr. Ingram and Mr. McWhorter as his initial director designees. If at any time a designee of Mr. Ayers ceases to serve on our board of directors, Mr. Ayers will have the right to designate or nominate a successor to fill such vacancy or, if he loses his right to designate any such directors pursuant to the terms of the shareholder’s agreement, these positions will be filled in accordance with our charter and bylaws. All other directorships will be filled in accordance with our charter and bylaws. See “Description of our capital stock” for more information regarding our amended and restated charter and our amended and restated bylaws.
Mr. Ayers will also have the right, for so long as we qualify as a “controlled company” under applicable listing standards, to designate (i) a majority of the members of any nominating and corporate governance committee or similar committee of our board and (ii) up to two members of any compensation committee or similar committee of our board. In the event that we no longer qualify as a “controlled company” under applicable listing standards, Mr. Ayers will continue to have the right to designate at least one member of each such committee of our board for so long as permitted under applicable law and for so long as Mr. Ayers continues to have the right to designate at least one director. The designation rights under the shareholders agreement shall terminate upon the earlier of Mr. Ayer’s death or permanent disability or when Mr. Ayers holds less than 5% of our outstanding shares of common stock.
Board leadership structure. Our board of directors meets on an annual basis and the Bank’s board of directors meet quarterly. Following this offering, our board of directors will meet at least quarterly. While the role of our Chief Executive Officer and Chairman of our board are currently separated, we do not have a policy regarding the separation of these roles, as our board of directors believes that it is in the best interests of our organization to make that determination from time to time based on the position and direction of our organization and the membership of our board of directors. Our board of directors has determined that having the roles of Chief Executive Officer and Chairman separate is in the best interests of our shareholders at this time. In particular, our board of directors believes that this structure clarifies the individual roles and responsibilities of Mr. Holmes and Mr. Ayers, streamlines decision-making and enhances accountability. As Executive Chairman, Mr. Ayers remains deeply involved in key matters, such as consideration of acquisitions, strategic investments and overall strategy, and continues to advise Mr. Holmes. In this role and given his in-depth knowledge of our business, our markets and the banking industry, our board of directors believes that Mr. Ayers continues to be best positioned to chair our board of directors.
Board risk management and oversight. Our board of directors is ultimately responsible for the oversight of our overall risk management processes while the Bank’s board of directors is responsible for risk management oversight at the Bank. Our board of directors approves policies that set operational standards and risk limits at the Bank, and any changes to the Bank’s risk management program require approval by the Bank’s board of directors. Management is responsible for the implementation, integrity and maintenance of our risk management systems ensuring the directives are implemented and administered in compliance with the approved policy. Our risk management officer supervises the overall management of our risk management program, reports to management and yet also retains independent access to both our board of directors and the Bank’s board of directors.
Compensation committee interlocks and insider participation. We did not have a compensation committee during 2015, and the compensation of our executive officers for 2015 was recommended by our Chief Executive Officer and Chairman and such recommendations were approved by our board of directors.
None of our executive officers currently serves as a member of the compensation committee or as a director with compensation duties of any entity that has executive officers serving on our board of directors. None of our executive officers has served in such capacity in the past 12 months.
178
Table of Contents
Index to Financial Statements
Board committees
Our board of directors has established an audit committee and a compensation committee and has also adopted a written charter for each of these committees under which they will operate. A copy of each of these charters will be available on our website at www.firstbankonline.com after the completion of this offering.
Our board also may establish such other committees as it deems appropriate, in accordance with applicable law and regulations and our corporate governance documents.
Audit committee
The audit committee will, among other things, assist the board of directors in overseeing our accounting and financial reporting processes and the audits of our financial statements. In addition, the audit committee is directly responsible for the appointment, compensation, retention and oversight of the work of our independent registered public accounting firm. The audit committee will also oversee the performance of our internal audit function.
The audit committee consists of Mr. Ingram, Ms. Johnson, and Mr. McWhorter. The board of directors has determined that each of Ms. Johnson and Mr. McWhorter qualifies as an “audit committee financial expert,” as such term is defined in the rules of the SEC, and that each of the members of the audit committee are independent under the applicable SEC and NYSE rules and have the ability to reach and understand financial statements.
Compensation committee
The compensation committee will, among other things, assist the board of directors in reviewing compensation received by directors for service on the board of directors and its committees, reviewing and approving the compensation of our executive officers, evaluating the performance of our chief executive officer, overseeing the performance evaluation of management and administering and making recommendations to the board of directors with respect to our incentive-compensation plans, equity-based compensation plans and other benefit plans. The compensation committee will also oversee management continuity and succession planning.
The compensation committee consists of Mr. Ingram and Mr. McWhorter. The board of directors has determined that each of the members of the compensation committee is independent under applicable SEC and NYSE rules.
Code of business conduct and ethics
Our board of directors has adopted a Code of Business Conduct and Ethics that will be effective upon the consummation of this offering that is designed to ensure that our directors, executive officers and associates meet the highest standards of ethical conduct. The Code of Business Conduct and Ethics will require that our directors, executive officers and associates avoid conflicts of interest, comply with all laws and other legal requirements, conduct business in an honest and ethical manner and otherwise act with integrity and in our best interest. Upon completion of the offering, a copy of our Code of Conduct will be available free of charge on our website at www.firstbankonline.com. We expect that any amendments to such code and guidelines, or any waivers of their requirements with respect to our directors or executive officers, will be disclosed on our corporate website or by such other means as may be required by applicable NYSE rules.
179
Table of Contents
Index to Financial Statements
Executive compensation and other matters
Summary compensation table
The following table sets forth information concerning the compensation paid to our principal executive officer and our two other most highly compensated executive officers (our named executive officers, or NEOs) during our fiscal year ended December 31, 2015.
| Name and principal position | Year | Salary ($) |
Stock awards ($)(1) |
Non-equity incentive plan compensation ($) |
All other compensation ($) |
Total ($) |
||||||||||||||||||
| Christopher T. Holmes |
2015 | 365,000 | 199,058 | 462,495 | 11,536 | (2) | 1,038,089 | |||||||||||||||||
| President and Chief Executive Officer (CEO) |
||||||||||||||||||||||||
| Wilburn J. Evans |
2015 | 225,000 | 101,275 | 750,000 | (3) | 21,750 | (4) | 1,098,025 | ||||||||||||||||
| President, FirstBank Ventures |
||||||||||||||||||||||||
| Timothy L. Johnson |
2015 | 156,000 | 71,591 | 47,500 | (5) | 3,340 | (6) | 275,931 | ||||||||||||||||
| Chief Risk Officer |
||||||||||||||||||||||||
|
|
||||||||||||||||||||||||
| (1) | Represents the grant date fair value of phantom stock units, which we refer to as EBI Units, granted to the NEO during 2015 under the FirstBank 2012 Equity Based Incentive Plan, or the 2012 EBI Plan. The fair value of the EBI Units is based upon the fair market value of our common stock, as determined in accordance with the terms of the 2012 EBI Plan, as of December 31, 2013 ($1,746.12). See Note 23, “Employee Benefit Plans,” in the notes to our consolidated financial statements included in this prospectus for additional information related to the fair value of the EBI Units. The number of EBI Units granted to each of Holmes, Evans and Johnson in 2015 was 114, 58 and 41, respectively. See below for a description of the 2012 EBI Plan. |
| (2) | Reflects (i) $3,586 attributable to Mr. Holmes’ personal use of a company car, determined based upon the aggregate incremental cost to the Company, and (ii) $7,950 as a 401(k) matching contribution. |
| (3) | Reflects the annual bonus paid to Mr. Evans with respect to 2015. Mr. Evans is eligible to participate in a bonus pool established for select management providing services to FirstBank Ventures. The available bonus pool is a function of profit generated by FirstBank Ventures. If FirstBank Ventures achieves budgeted profit for a given year, then the bonus pool will be funded with 10% of such profit. The percentage of profit that funds the bonus pool will be increased or decreased in 10% increments if the Bank exceeds or falls below target performance, respectively, with a maximum of 12% of profits. Mr. Evans’ annual bonus is equal to approximately 25% to 30% of the bonus pool, depending on the number of employees eligible to participate for the applicable year. |
| (4) | Reflects a 401(k) matching contribution of $7,950 and a car allowance of $13,800. |
| (5) | Reflects the annual bonus paid to Mr. Johnson with respect to 2015, determined based on our Board’s subjective review of his performance during 2015. |
| (6) | Reflects a 401(k) matching contribution. |
Agreements with NEOs
Employment agreement with Mr. Holmes
On August 19, 2016, we entered into an employment agreement with Mr. Holmes, the material terms of which are described below.
Term and Compensation
The initial term of the agreement expires on August 19, 2019, with automatic renewals for additional one-year periods unless either party gives notice to the other of its intent not to renew the agreement. Mr. Holmes’ employment agreement provides that he is entitled to a minimum annual base salary of $400,000 (subject to annual review and increases) and is entitled to participate in all incentive, savings, retirement, and welfare benefit plans generally made available to our senior executive officers. Mr. Holmes will have an opportunity to earn an annual cash bonus and an annual equity grant under our long-term incentive plan, based upon
180
Table of Contents
Index to Financial Statements
performance criteria established from time to time by the Compensation Committee. The expectation is that the majority of Mr. Holmes’ total compensation will be performance-based. Mr. Holmes is entitled to fringe benefits generally made available to our senior executive officers. During the term, we will provide Mr. Holmes with a company car and maintenance allowance and we will reimburse him for his membership dues at a local country club, as well as pay the premiums on a term life insurance contract with a death benefit of $2,500,000.
Special One-Time Grants
Pursuant to his employment agreement and in recognition of his prior service with us, on August 19, 2016, we granted to Mr. Holmes a special one-time award under the 2012 EBI Plan, comprised of two parts as described below:
| • | 100,420 EBI units, which number was determined by dividing $2,150,000 by the fair market value (as defined under the 2012 EBI Plan) of a share of our common stock on the grant date. This award is fully-vested and will become payable in accordance with 2012 EBI Plan on the earlier of (i) December 31, 2016, (ii) a change in our control, (iii) Mr. Holmes’ separation from service by reason of his disability, or (iv) Mr. Holmes’ death. This award does not have any voting or dividend rights. |
| • | 109,762 EBI units, which number was determined by dividing $2,350,000 by the fair market value (as defined in the 2012 EBI Plan) of a share of our common stock on the grant date. These EBI units will vest and become payable in two approximately equal installments on each of February 1, 2018 and August 1, 2019, or earlier upon (i) a change in our control, (ii) Mr. Holmes’ separation from service by reason of his disability, or (iii) Mr. Holmes’ death. The vesting of the grant is conditioned, in each case, upon Mr. Holmes continued employment with us on each vesting date, and if his employment terminates for any reason (other than termination by death or disability), then he will forfeit any unvested portion of these EBI units. This special EBI grant does not have any voting or dividend rights. In addition, if, prior to December 31, 2019, (i) we terminate Mr. Holmes employment for cause, or (ii) Mr. Holmes breaches any of the restrictive covenants contained in the employment agreement, then, upon our request, Mr. Holmes will immediately repay to us any cash received upon settlement of these EBI units or, if Mr. Holmes elects stock settlement, reconvey to us any shares received upon settlement of these EBI units. |
At Mr. Holmes’ option, these EBI units may be settled in shares of our common stock based on a per unit conversion formula equal to $21.4085, the fair market value per EBI unit as determined under the 2012 EBI Plan, divided by the initial public offering price in this offering. Mr. Holmes presently intends to elect to have these EBI units settled in shares of our common stock as opposed to cash.
Severance Benefits
Mr. Holmes’ employment agreement may be terminated by us at any time with or without “cause” or by us for “poor performance” or by Mr. Holmes with or without “good reason” (as such terms are defined therein). The employment agreement also terminates automatically upon Mr. Holmes death and may be terminated by us if Mr. Holmes becomes disabled. Depending on the reason for the termination, the executive will be entitled to certain severance benefits, as described below.
| • | If Mr. Holmes dies, if we terminate his employment due to his disability or for cause or if he resigns without good reason, then he will receive only the salary that is accrued through the date of termination. |
| • | If Mr. Holmes’ employment is terminated by us without cause or if he resigns for good reason, then, in addition to his accrued salary, he will be entitled to an amount equal to two times the sum of his then current base salary plus the annual bonus received by him for the fiscal year immediately preceding the year in |
181
Table of Contents
Index to Financial Statements
| which his date of termination occurs, payable in approximately equal installments over the two year period following his termination. In addition, for 18 months following his termination of employment, we will pay to Mr. Holmes an amount in cash equal to the excess of (i) the COBRA cost of continued coverage in our group health plan over (ii) the amount that he would have had to pay for such coverage if he had remained employed during such 18-month period and paid the active employee rate for such coverage. |
| • | If Mr. Holmes’ employment is terminated by us for “poor performance”, then, in addition to accrued salary, he will be entitled to an amount equal to one times the sum of his then current base salary plus the annual bonus received by him for the fiscal year immediately preceding the year in which his date of termination occurs, payable in approximately equal installments over the one year period following his termination. In such case, the non-competition and non-solicitation covenants described below will apply for one year following termination. |
| • | If we elect not to renew the employment agreement at the end of the initial term or at the end of any renewal term and we subsequently terminate Mr. Holmes employment without cause, then we may elect, in our sole discretion, to either (i) pay to Mr. Holmes an amount equal to two times the sum of his then current base salary plus the annual bonus received by him for the fiscal year immediately preceding the year in which his date of termination occurs, payable in approximately equal installments over the two year period following his termination, in which case the restricted period for purposes of his non-competition and non-solicitation covenants will be two years, or (ii) pay to Mr. Holmes an amount equal to one times the sum of his then current base salary plus the annual bonus received by him for the fiscal year immediately preceding the year in which his date of termination occurs, payable in approximately equal installments over the one year period following his termination, in which case the restricted period for purposes of his non-competition and non-solicitation covenants will be one year. If Mr. Holmes elects not renew the employment agreement at the end of the initial term or any renewal term and subsequently resigns for any reason, then he will not receive a severance payment and will receive only the salary that is accrued through the date of termination. |
| • | The employment agreement provides that if any payments or benefits would be subject to the excise tax imposed under Section 4999 of the tax code, then there will be a comparison of the after-tax benefit to Mr. Holmes of (i) the total parachute payments after he pays the excise tax and income taxes thereon, to (ii) a cut back of parachute payments to the extent necessary to avoid the imposition of the excise tax, and Mr. Holmes will receive whichever amount yields the more favorable result to him. |
The severance benefits describe above are conditioned upon Mr. Holmes executing and not revoking a release of claims and covenant not to sue agreement, as well as his compliance with the restrictive covenants contained in his employment agreement.
Restrictive Covenants
Mr. Holmes’ employment agreement contains confidentiality, non-competition and employee and customer non-solicitation covenants that apply during his employment with us and for two years after his termination of employment, or one year in the event we elect not to continue his employment after the end of the original term or any renewal term and choose to pay only one year’s severance, as described above, or one year in the case of termination of his employment for “poor performance.”
Employment agreement with Mr. Gordon
We intend to enter into an employment agreement with Mr. Gordon following the consummation of this offering.
182
Table of Contents
Index to Financial Statements
Outstanding equity awards at 2015 fiscal year end
| Stock awards | ||||||||
| Name |
Number of shares or units of stock that have not vested (#)(7) |
Market value of shares or units of stock that have not vested ($)(6) |
||||||
| Christopher T. Holmes |
32,400 | (1) | 693,635 | |||||
| Wilburn J. Evans |
21,400 | (2) | 458,142 | |||||
| 14,500 | (3) | 182,730 | ||||||
| Timothy L. Johnson |
14,500 | (4) | 310,423 | |||||
| 5,700 | (5) | 71,832 | ||||||
| (1) | Reflects unvested EBI Units, which vest as follows: 9,500 EBI Units on January 31, 2016, 11,500 EBI Units on January 31, 2017 and 11,400 EBI Units on January 31, 2018. |
| (2) | Reflects unvested EBI Units, which vest as follows: 8,600 EBI Units on January 31, 2016, 7,000 EBI Units on January 31, 2017 and 5,800 EBI Units on January 31, 2018. |
| (3) | Reflects unvested units, which we refer to as Preferred EBI Units, granted under the FirstBank Preferred Equity Based Incentive Plan, which we refer to as the Preferred EBI Plan, which vest as follows: 7,500 Preferred EBI Units on December 31, 2016, and 7,000 Preferred EBI Units on December 31, 2017. |
| (4) | Reflects unvested EBI Units, which vest as follows: 5,200 EBI Units on January 31, 2016, 5,200 EBI Units on January 31, 2017 and 4,100 EBI Units on January 31, 2018. |
| (5) | Reflects unvested Preferred EBI Units granted under the Preferred EBI Plan, which vest as follows: 2,900 Preferred EBI Units on December 31, 2016 and 2,800 Preferred EBI Units on December 31, 2017. |
| (6) | Based upon the fair market value of the Company’s common stock, as determined in accordance with the terms of the 2012 EBI Plan and the Preferred EBI Plan, as of December 31, 2015 ($2,140.85 and $1,260.21, respectively). |
| (7) | This table reflects the 100 for 1 stock split recently enacted. |
Deferred compensation
On April 1, 2015, we entered into a Deferred Compensation Agreement with Mr. Holmes, effective as of December 31, 2014, pursuant to which he is entitled to receive a fixed lump sum cash payment equal to $3,000,000 on December 31, 2019 or the earlier occurrence of his separation from service or a change in our control or a change in control of FirstBank. The deferred cash payment was fully-vested as of December 31, 2014, and is not subject to any clawback or other recoupment provisions. On August 19, 2016, we entered into an amendment to Mr. Holmes’ deferred compensation arrangement, pursuant to which Mr. Holmes’ deferred account will be denominated in a fixed number of deferred stock units, or DSUs, following this offering with the number of DSUs to be determined by dividing $3,000,000 by the initial public offering price of our common stock. The DSUs will be convertible on a 1-for-1 basis into shares of our common stock on the original payment dates under the deferred arrangement, as described above.
Other retirement benefits
Other than Mr. Holmes’ deferred compensation agreement described above and benefits under our 401(k) plan, we have not provided our NEOs with any retirement or deferred compensation benefits.
2012 EBI Plan, 2010 EBI Plan and Preferred EBI Plan
The Company has granted EBI Units to certain employees, including our NEOs, pursuant to the 2012 EBI Plan, the 2010 EBI Plan and the Preferred EBI Plan. Pursuant to the terms of the Plans, each EBI Unit vests and becomes payable as to 100% of the units either on (i) the third anniversary of the date of grant with respect to awards granted under the 2012 EBI Plan, (ii) ratably over five years with respect to awards under the 2010 EBI Plan, or (iii) ratably over seven years following the date of grant, with respect to awards granted under the Preferred EBI Plan. Vesting also occurs in each Plan upon change of control, or death or disability and upon retirement after age 65. On or shortly following the vesting date, the holder of an EBI Unit will receive an
183
Table of Contents
Index to Financial Statements
amount in cash equal to the fair market value of a share of common stock on the December 31 immediately preceding the payment date. For purposes of the 2012 EBI Plan, fair market value is determined based upon the average of the sum of (a) 15 times “FSB After-Tax Earnings” and (b) 1.5 times the Company’s “FSB Tangible Book Value.” FSB After-Tax Earnings is defined as consolidated pre-tax earnings minus a default rate equal to the then existing corporate income tax rate imposed by the Code on a corporation’s earnings of such amount. FSB Tangible Book Value is defined as consolidated equity less Unrealized Gain (Loss) and less Intangibles. For purposes of the 2010 EBI Plan and the Preferred EBI Plan, fair market value per share is determined by dividing 7.5% of the total assets of the Company by the total shares outstanding on the date of determination.
We have an older (2006) EBI Plan, but we have discontinued its use, and there are no units outstanding under this Plan.
On August 8, 2016, the Compensation Committee approved an amendment to the 2012 EBI Plan, the Preferred EBI Plan and the 2010 EBI Plan, in each case to be effective following the consummation of this offering, to allow the Company to permit participants to elect to receive, for each EBI Unit vested to such participant, either (i) an amount in cash or (ii) a number of shares of our common stock determined pursuant to a conversion formula that will take into account the effect of this offering. If so permitted, a participant must make such election at the time and in the form provided by the Company. If a participant elects to have an EBI Unit settled in stock upon the vesting of such unit, then each of the approximately 60,700 EBI Units outstanding under the Preferred EBI Plan and the 2010 EBI Plan shall convert into shares of our common stock on a 1 for 1 basis and each of the approximately 529,297 EBI Units outstanding under the 2012 EBI Plan (including those EBI Units granted to Mr. Holmes under his employment agreement) shall convert into a number of shares of our common stock equal to $21.4085, the fair market value per EBI Unit as determined under the 2012 EBI Plan, divided by the initial public offering price in this offering. The conversion formula for EBI Units under the 2012 Plan was adjusted to prevent dilution of these EBI Units immediately as a result of the transaction contemplated by this offering. The Compensation Committee also approved an amendment to the 2012 EBI Plan allowing the Compensation Committee to grant units under the plan having terms and conditions, including vesting, that differ from those provided in the plan.
Equity and cash compensation plan
In connection with this offering, our board of directors and our sole stockholder approved the FB Financial Corporation 2016 Incentive Plan, or the Incentive Plan, the material terms of which are described below.
Permissible Awards. The Incentive Plan authorizes the granting of awards in any of the following forms:
| • | options to purchase shares of our common stock, which may be designated under the tax code as nonstatutory stock options (which may be granted to all participants) or incentive stock options (which may be granted to officers and employees but not to consultants or non-employee directors); |
| • | SARs, which give the holder the right to receive the difference (payable in cash or stock, as specified in the award agreement) between the fair market value per share of our common stock on the date of exercise over the base price of the award; |
| • | restricted stock, which is subject to restrictions on transferability and subject to forfeiture on terms set by our compensation committee; |
| • | restricted stock units, or RSUs, which represent the right to receive shares of our common stock (or an equivalent value in cash or other property, as specified in the award agreement) in the future, based upon the attainment of stated vesting criteria; |
| • | deferred stock units, or DSUs, which represent the right granted to receive shares of our common stock (or an equivalent value in cash or other property, as specified in the award agreement) at a future time as |
184
Table of Contents
Index to Financial Statements
| determined by our compensation committee, or as determined by the recipient within guidelines established by our compensation committee in the case of voluntary deferral elections; |
| • | performance awards, which are awards payable in cash or stock upon the attainment of specified performance goals (any award that may be granted under the Incentive Plan may be granted in the form of a performance award); |
| • | other stock-based awards in the discretion of our compensation committee, including unrestricted stock grants; and |
| • | cash-based awards, including annual bonuses. |
Dividend equivalent rights, which entitle the participant to payments in cash or property calculated by reference to the amount of dividends paid on the shares of stock underlying an award, may be granted with respect to awards other than options or SARs.
Authorized Shares. Subject to adjustment as provided in the Incentive Plan, the aggregate number of shares of our common stock reserved and available for issuance pursuant to awards granted under the Incentive Plan is 2,700,000. Shares subject to awards that are canceled, terminated, forfeited, settled in cash, withheld to satisfy exercise prices or tax withholding obligations will again be available for awards under the Incentive Plan. In the event of a nonreciprocal transaction between us and our stockholders that causes the per share value of our common stock to change (including, without limitation, any stock dividend, stock split, spin-off, rights offering, or large nonrecurring cash dividend), the share authorization limits under the Incentive Plan will be adjusted proportionately, and our compensation committee must make such adjustments to the Incentive Plan and awards as it deems necessary, in its sole discretion, to prevent dilution or enlargement of rights immediately resulting from such transaction.
Limit on Shares Granted to Non-Employee Directors. The maximum aggregate number of shares associated with any award granted under the Incentive Plan in any calendar year to any one non-employee director is 100,000 shares.
Limitations on Transfer. No award will be assignable or transferable by a participant other than by will or the laws of descent and distribution; provided, however, that our compensation committee may permit other transfers (other than transfers for value) where our compensation committee concludes that such transferability does not result in accelerated taxation, does not cause any option intended to be an incentive stock option to fail to qualify as such, and is otherwise appropriate and desirable, taking into account any factors deemed relevant, including without limitation, any state or federal tax or securities laws or regulations applicable to transferable awards.
Treatment of Awards upon a Participant’s Death or Disability. Unless otherwise provided in an award certificate or any special plan document governing an award, upon the termination of a participant’s service due to death or disability:
| • | each of that participant’s outstanding options and SARs that are solely subject to time-based vesting requirements will become vested and fully exercisable as of the date of termination; |
| • | each of that participant’s other outstanding awards that are solely subject to time-based vesting restrictions will become vested, and such restrictions will lapse as of the date of termination; and |
| • | each of that participant’s outstanding awards that are solely subject to performance-vesting requirements will vest based on target performance and the awards will pay out on a pro rata basis, based on the time elapsed prior to the termination of service. |
185
Table of Contents
Index to Financial Statements
Treatment of Awards upon a Change in Control. Unless otherwise provided in an award certificate or any special plan document governing an award, upon the occurrence of a change in control of our company in which awards are not assumed by the surviving entity or otherwise equitably converted or substituted in connection with the change in control in a manner approved by our compensation committee or our board of directors:
| • | all outstanding options, SARs and other awards in the nature of rights that may be exercised will become fully exercisable; |
| • | all time-based vesting restrictions on outstanding awards will lapse; and |
| • | the payout opportunities attainable under all outstanding performance-based awards will vest based on target performance and the awards will pay out on a pro rata basis, based on the time elapsed prior to the change in control. |
With respect to awards assumed by the surviving entity or otherwise equitably converted or substituted in connection with a change in control, if within two years after the effective date of the change in control, a participant’s employment is terminated without Cause or the participant resigns for Good Reason (as such terms are defined), then:
| • | all of that participant’s outstanding options, SARs and other awards in the nature of rights that may be exercised will become fully exercisable; |
| • | all time-based vesting restrictions on that participant’s outstanding awards will lapse; and |
| • | the payout opportunities attainable under all of that participant’s outstanding performance-based awards will vest based on target performance and the awards will pay out on a pro rata basis, based on the time elapsed prior to the date of termination. |
Discretionary Acceleration. Our compensation committee may, in its discretion, accelerate the vesting and/or payment of any awards for any reason. Our compensation committee may discriminate among participants or among awards in exercising such discretion.
Certain Transactions. Upon the occurrence or in anticipation of certain corporate events or extraordinary transactions, our compensation committee may also make discretionary adjustments to awards, including settling awards for cash, providing that awards will become fully vested and exercisable, providing for awards to be assumed or substituted, or modifying performance targets or periods for awards.
Termination and Amendment. The Incentive Plan will terminate on August 15, 2026, the tenth anniversary of the date our board of directors first approved the Incentive Plan, or, if our stockholders approve an amendment to the Incentive Plan that increases the number of shares subject to the Incentive Plan, the tenth anniversary of the date of such approval, unless earlier terminated by our board of directors or compensation committee. Our board of directors or compensation committee may, at any time and from time to time, terminate or amend the Incentive Plan, but if an amendment to the Incentive Plan would constitute a material amendment requiring stockholder approval under applicable listing requirements, laws, policies or regulations, then such amendment will be subject to stockholder approval. No termination or amendment of the Incentive Plan may adversely affect any award previously granted under the Incentive Plan without the written consent of the participant. Without the prior approval of our stockholders, and except as otherwise permitted by the anti-dilution provisions of the Incentive Plan, the Incentive Plan may not be amended to directly or indirectly reprice, replace or repurchase “underwater” options or SARs.
Our compensation committee may amend or terminate outstanding awards. However, such amendments may require the consent of the participant and, unless approved by our stockholders or otherwise permitted by the anti-dilution provisions of the Incentive Plan, (i) the exercise price or base price of an option or SAR may not be
186
Table of Contents
Index to Financial Statements
reduced, directly or indirectly, (ii) an option or SAR may not be cancelled in exchange for cash, other awards, or options or SARS with an exercise price or base price that is less than the exercise price or base price of the original option or SAR, or otherwise, (iii) we may not repurchase an option or SAR for value (in cash or otherwise) from a participant if the current fair market value of the shares of our common stock underlying the option or SAR is lower than the exercise price or base price per share of the option or SAR, and (iv) the original term of an option or SAR may not be extended.
Prohibition on Repricing. As indicated above under “Termination and Amendment,” outstanding stock options and SARs cannot be repriced, directly or indirectly, without the prior consent of our stockholders. The exchange of an “underwater” option or stock appreciation right (i.e., an option or stock appreciation right having an exercise price or base price in excess of the current market value of the underlying stock) for cash or for another award would be considered an indirect repricing and would, therefore, require the prior consent of our stockholders.
Certain Federal Income Tax Effects
The U.S. federal income tax discussion set forth below is intended for general information only and does not purport to be a complete analysis of all of the potential tax effects of the Incentive Plan. It is based upon laws, regulations, rulings and decisions now in effect, all of which are subject to change. State and local income tax consequences are not discussed and may vary from locality to locality.
Nonstatutory Stock Options. There will be no federal income tax consequences to the optionee or to us upon the grant of a nonstatutory stock option under the Incentive Plan. When the optionee exercises a nonstatutory option, however, he or she will recognize ordinary income in an amount equal to the excess of the fair market value of our common stock received upon exercise of the option at the time of exercise over the exercise price, and we will be allowed a corresponding federal income tax deduction. Any gain that the optionee realizes when he or she later sells or disposes of the option shares will be short-term or long-term capital gain, depending on how long the shares were held.
Incentive Stock Options. There typically will be no federal income tax consequences to the optionee or to us upon the grant or exercise of an incentive stock option. If the optionee holds the acquired option shares for the required holding period of at least two years after the date the option was granted and one year after exercise, the difference between the exercise price and the amount realized upon sale or disposition of the option shares will be long-term capital gain or loss, and we will not be entitled to a federal income tax deduction. If the optionee disposes of the option shares in a sale, exchange or other disqualifying disposition before the required holding period ends, he or she will recognize taxable ordinary income in an amount equal to the excess of the fair market value of the option shares at the time of exercise over the exercise price, and we will be allowed a federal income tax deduction equal to such amount. While the exercise of an incentive stock option does not result in current taxable income, the excess of the fair market value of the option shares at the time of exercise over the exercise price will be an item of adjustment for purposes of determining the optionee’s alternative minimum taxable income.
SARs. A participant receiving a SAR under the Incentive Plan will not recognize income, and we will not be allowed a tax deduction, at the time the award is granted. When the participant exercises a SAR, the amount of cash and the fair market value of any shares of common stock received will be ordinary income to the participant, and we will be allowed a corresponding federal income tax deduction at that time.
Restricted Stock. Unless a participant makes an election to accelerate recognition of the income to the date of grant as described below, a participant will not recognize income, and we will not be allowed a tax deduction, at the time a restricted stock award is granted, provided that the award is nontransferable and is subject to a substantial risk of forfeiture. When the restrictions lapse, the participant will recognize ordinary income equal to the fair market value of our common stock as of that date (less any amount he or she paid for the stock), and we will be allowed a corresponding federal income tax deduction at that time. If the participant files an election
187
Table of Contents
Index to Financial Statements
under Section 83(b) of the tax code within 30 days after the date of grant of the restricted stock, he or she will recognize ordinary income as of the date of grant equal to the fair market value of the stock as of that date (less any amount paid for the stock), and we will be allowed a corresponding federal income tax deduction at that time. Any future appreciation in the stock will be taxable to the participant at capital gains rates. However, if the stock is later forfeited, the participant will not be able to recover the tax previously paid pursuant to the Section 83(b) election.
Restricted or Deferred Stock Units. A participant will not recognize income, and we will not be allowed a tax deduction, at the time a stock unit award is granted. When the participant receives or has the right to receive shares of common stock (or the equivalent value in cash or other property) in settlement of a stock unit award, a participant will recognize ordinary income equal to the fair market value of our common stock or other property as of that date (less any amount he or she paid for the stock or property), and we will be allowed a corresponding federal income tax deduction at that time.
Performance Awards Payable in Cash. A participant will not recognize income, and we will not be allowed a tax deduction, at the time a performance award payable in cash is granted (for example, when the performance goals are established). Upon receipt of cash in settlement of the award, a participant will recognize ordinary income equal to the cash received, and we will be allowed a corresponding federal income tax deduction at that time.
Section 409A. The Incentive Plan permits the grant of various types of incentive awards, which may or may not be exempt from Section 409A of the tax code. If an award is subject to Section 409A, and if the requirements of Section 409A are not met, the taxable events as described above could apply earlier than described, and could result in the imposition of additional taxes and penalties. Restricted stock awards, and stock options and SARs that comply with the terms of the Incentive Plan are generally exempt from the application of Section 409A of the tax code. Stock units, other stock-based awards and cash-based awards that are granted in one year and payable in a later year generally are subject to Section 409A unless they are designed to satisfy the short-term deferral exemption from such law. If not exempt, such awards must be specially designed to meet the requirements of Section 409A in order to avoid early taxation and penalties.
Tax Withholding. Our company and any of our affiliates have the right to deduct or withhold, or require a participant to remit to us, an amount sufficient to satisfy federal, state and local taxes (including employment taxes) required by law to be withheld with respect to any exercise, lapse of restriction or other taxable event arising as a result of the Incentive Plan.
Equity Awards in Connection with this Offering
In connection with this offering, our board of directors has approved a special, one-time grant under the Incentive Plan to substantially all of our employees (including each of our executive officers other than Mr. Ayers and Mr. Holmes) having an aggregate value of $13,600,000, as summarized in the table below. The number of shares granted will be determined by dividing $13,600,000 by the initial public offering price of our common stock. Such awards will be granted on the effective date of this offering. Our board of directors approved these equity awards to recognize our employees’ prior service with our company, as well as to better align their interests with those of our stockholders. The equity awards provide an opportunity for the executive officers, in particular, to make significant progress towards increasing their ownership in the company. All such awards will be subject to such terms and conditions as determined by the board of directors. Awards having a value of $2,500 or less will be fully-vested on the grant date. Awards having a value greater than $2,500 will be granted in the form of restricted stock units, or RSUs, which will generally vest (i) 20% on each of the first five anniversaries of the grant date, or (ii) 100% on the fifth anniversary of the date of grant, in each case subject to the grantee’s continued employment with us on the vesting date. Messrs. Evans, Johnson and Gordon will receive an award of RSUs having a value of $2,375,000, $950,000 and $3,300, respectively, which RSUs will vest 100% on the fifth anniversary of the date of grant, subject to their continued employment with us on such date.
188
Table of Contents
Index to Financial Statements
Summary of One-Time IPO Equity Awards, Conversion of Deferred Compensation and Conversion of EBI Units
The following table summarizes all outstanding equity based awards granted to our employees and executive officers as of the date of this prospectus and provides (i) the total value of such awards, (ii) the compensation expenses previously recorded with respect to such awards, (iii) the total shares of our common stock that such awards are convertible into or may be settled into and (iv) the periods in which such underlying shares of our common stock may be issued based on the vesting and settlement schedule associated with such awards. The following table is based on an initial public offering price of $17.00 per share (the midpoint of the range set forth on the cover page of this prospectus) and assumes that all awards will not be forfeited prior to vesting in full.
| Estimated issuance of underlying shares(1) | ||||||||||||||||||||||||||||||||||||
| Grant description (vesting detail) | Total value of award(2) |
Previously (as of June 30, 2016) |
Upon completion of offering |
Estimated post-offering through December 31, 2016 |
2017 | 2018 | 2019 | 2020 | 2021 | |||||||||||||||||||||||||||
| EBI Plan Units under 2010 EBI and Preferred EBI Plans (units will fully vest and be settled during first quarter of 2017) |
$ | 1,031,900 | $ | 688,000 | — | — | 60,700 | — | — | — | — | |||||||||||||||||||||||||
| EBI Plan Units under the 2012 EBI Plan (units will fully vest and be settled during first quarter of 2017, 2018 and 2019 based on grant date)(3) |
$ | 6,831,452 | $ | 4,165,000 | — | — | 135,629 | 134,874 | 131,347 | — | — | |||||||||||||||||||||||||
| Conversion of existing cash-settled deferred compensation arrangement with Mr. Holmes into deferred stock units (units are fully vested subject to deferred settlement on December 31, 2019) |
$ | 3,000,000 | $ | 3,000,000 | — | — | — | — | 176,471 | — | — | |||||||||||||||||||||||||
| Grant of EBI Plan Units to Mr. Holmes effective August 19, 2016 (units are fully vested subject to deferred settlement on December 31, 2016) |
$ | 2,150,000 | — | — | 126,471 | — | — | — | — | — | ||||||||||||||||||||||||||
| Grant of EBI Plan Units granted to Mr. Holmes effective August 19, 2016 (units vest and settle 50% on February 19, 2018 and 50% on August 1, 2019) |
$ | 2,350,000 | — | — | — | — | 69,118 | 69,118 | — | — | ||||||||||||||||||||||||||
| One-time grant of shares of common stock to employees with value less than $2,500 (shares are fully vested and will be issued following the consummation of this offering) |
$ | 1,000,000 | — | 58,824 | — | — | — | — | — | — | ||||||||||||||||||||||||||
| One-time grant of RSUs to executive officers and employees with value greater than $2,500 (units cliff vest and settle on the five year anniversary of grant) |
$ | 10,349,000 | — | — | — | — | — | — | — | 608,765 | ||||||||||||||||||||||||||
| One-time grant of RSUs to executive officers and employees with value greater than $2,500 (units vest and settle 20% on each of the first five anniversaries of grant) |
$ | 1,186,000 | — | — | — | 13,953 | 13,953 | 13,953 | 13,953 | 13,953 | ||||||||||||||||||||||||||
| One-time grant of RSUs to executive officers and employees with value greater than $2,500 (units vest and settle 20% on each of the first five anniversaries of grant with acceleration upon 75th birthday of grantee) |
$ | 1,065,000 | — | — | — | 12,529 | 12,529 | 34,706 | 2,883 | — | ||||||||||||||||||||||||||
|
|
|
|||||||||||||||||||||||||||||||||||
| $ | 28,963,352 | $ | 7,853,000 | 58,824 | 126,471 | 222,811 | 230,473 | 425,595 | 16,836 | 622,718 | ||||||||||||||||||||||||||
|
|
||||||||||||||||||||||||||||||||||||
| (1) | With respect to the outstanding EBI Units, the number of underlying shares of common stock sets forth the maximum number of shares of our common stock issuable upon settlement of the outstanding EBI Units if all plan participants elect to have their units settled in shares of our common stock as opposed to cash and after giving effect to the anti-dilution adjustments to the 2012 EBI Plan, 2010 EBI Plan and the Preferred EBI Plan taken in connection with this offering and described on page 183 of this prospectus under “2012 EBI Plan, 2010 EBI Plan and Preferred EBI Plan.” |
189
Table of Contents
Index to Financial Statements
| (2) | Represents the total value of the awards based on an initial public offering price of $17.00 per share (the midpoint of the range set forth on the cover page of this prospectus). |
| (3) | Excludes the EBI units granted to Mr. Holmes effective August 1, 2016 described in this table. |
We expect to record approximately $3.66 million in additional pretax compensation expense during the third quarter of 2016 and additional ongoing compensation expense over the vesting period (up to five years in some cases) of these special, one-time awards.
Employee Stock Purchase Plan
In connection with this offering, our board of directors and our sole stockholder approved the FB Financial Corporation 2016 Employee Stock Purchase Plan. The ESPP is intended to qualify under Section 423 of the Code.
Authorized Shares. Subject to adjustment as provided in the ESPP, a total of 2,500,000 shares of our common stock will be made available for sale under the ESPP. In the event that any dividend or other distribution, recapitalization, stock split, reverse stock split, reorganization, merger, consolidation, split-up, spin-off, combination, repurchase, or exchange of our common stock or other securities of the Company, or other change in our corporate structure affecting our common stock occurs, our compensation committee, in order to prevent dilution or enlargement of the benefits or potential benefits intended to be made available under the ESPP, will, in such manner as it may deem equitable, adjust the number and class of common stock that may be delivered under the ESPP, the purchase price per share and the number of shares of common stock covered by each option under the ESPP that has not yet been exercised, as well as the number of shares authorized for issuance under the ESPP and the per-participant and per-offering share limits provided in the ESPP.
Plan Administration. Our compensation committee will administer the ESPP, and have full and exclusive authority to interpret the terms of the ESPP and determine eligibility to participate, subject to the conditions of the ESPP, as described below.
Eligibility. Generally, all of our employees are eligible to participate if they are employed by us, or any participating subsidiary, for at least 20 hours per week and more than five months in any calendar year. However, an employee may not be granted rights to purchase shares of our common stock under the ESPP if such employee (i) immediately after the grant would own capital stock possessing 5% or more of the total combined voting power or value of all classes of our capital stock; or (ii) holds rights to purchase shares of our common stock under all of our employee stock purchase plans that accrue at a rate that exceeds $25,000 worth of shares of our common stock for each calendar year.
Offering Periods. The ESPP provides for six-month offering periods. Unless and until otherwise provided by our compensation committee, the offering periods are scheduled to start on the first trading day on or after February 15 and August 15 of each year, except for the first offering period, which will commence on the first trading day on or after completion of this offering and will end on December 30, 2016.
Contributions. The ESPP permits participants to purchase shares of our common stock through payroll deductions of up to twenty percent of their eligible compensation; provided, however, that a participant may not purchase more than 725 shares of our common stock during each offering period; and provided, further, that no more than 200,000 shares of our common stock in the aggregate may be issuable during each offering period, in each case subject to adjustment as provided in the ESPP.
Purchases. Unless a participant terminates employment or withdraws from the ESPP or an offering before the last day of an offering period, amounts deducted and accumulated by the participant are used to purchase shares of our common stock at the end of each six-month offering period. The purchase price of the shares will be 85% of the lower of the fair market value of our common stock on the first trading day of each offering period or on the last trading day of each offering period (referred to as the “exercise date”). Participants may
190
Table of Contents
Index to Financial Statements
end their participation at any time during an offering period and will be paid their accrued contributions that have not yet been used to purchase shares of our common stock. Participation ends automatically upon termination of employment with us.
Holding Period. Unless otherwise determined by our compensation committee, participants in the ESPP will be required to hold the shares of our common stock acquired under the ESPP for a holding period that is the later of (i) the two-year period after the enrollment date or (ii) the one-year period after the exercise date. During such holding period, a participant may not sell or transfer shares of common stock acquired under the ESPP.
Non-Transferability. A participant may not transfer rights granted under the ESPP.
Corporate Transactions. The ESPP provides that in the event of a reorganization, merger, or consolidation of the Company with one or more corporations in which the Company is not the surviving corporation (or survives as a direct or indirect subsidiary of such other constituent corporation or its parent), or upon a sale of substantially all of the property or stock of the Company to another corporation, a successor corporation may assume or substitute each outstanding purchase right. If the successor corporation refuses to assume or substitute for the outstanding purchase right, the offering period then in progress will be shortened, and a new exercise date will be set. The administrator will notify each participant that the exercise date has been changed and that the participant’s option will be exercised automatically on the new exercise date unless prior to such date the participant has withdrawn from the offering period.
Amendment; Termination. Our compensation committee has the authority to amend, suspend or terminate the ESPP at any time and for any reason, except that, subject to certain exceptions described in the ESPP, no such action may adversely affect any outstanding rights to purchase shares of our common stock under the ESPP. The ESPP automatically will terminate in 2026, unless we terminate it sooner.
Certain Federal Income Tax Effects
Neither the grant nor the exercise of options under the ESPP will have a tax impact on the participant or on the Company. If a participant disposes of the shares acquired upon the exercise of his or her options after at least two years from the date of grant and one year from the date of exercise, then the participant must treat as ordinary income the amount by which the lesser of (i) the fair market value of the shares at the time of disposition, or (ii) the fair market value of the shares at the date of grant, exceeds the purchase price. Any gain in addition to this amount will be treated as a capital gain. If a participant holds shares at the time of his or her death, the holding period requirements are automatically deemed to have been satisfied and he or she will realize ordinary income in the amount by which the lesser of (i) the fair market value of the shares at the time of death, or (ii) the fair market value of the shares at the date of grant exceeds the purchase price. The Company will not be allowed a deduction if the holding period requirements are satisfied. If a participant disposes of shares before expiration of two years from the date of grant and one year from the date of exercise, then the participant must treat as ordinary income the excess of the fair market value of the shares on the date of exercise of the option over the purchase price. Any additional gain will be treated as long-term or short-term capital gain or loss, as the case may be. The Company will be allowed a deduction equal to the amount of ordinary income recognized by the participant.
191
Table of Contents
Index to Financial Statements
2015 Director compensation
The following table reflects the fees earned by or paid to our directors in connection with their service on the Company’s board of directors and the Bank’s board of directors during 2015.
| Name |
Fees earned or paid in cash ($) |
Total ($) | ||||||
| James W. Ayers |
$ | 200,000 | $ | 200,000 | ||||
| Orrin H. Ingram |
$ | 30,000 | $ | 30,000 | ||||
| Ruth E. Johnson |
$ | 30,000 | $ | 30,000 | ||||
| Stuart C. McWhorter |
$ | 30,000 | $ | 30,000 | ||||
In 2015, we paid each of Ingram, McWhorter and Johnson $30,000 as an annual retainer for their service on the Company’s board of directors, less what they received for their service on the Bank’s board of directors. Each of Ingram, McWhorter and Johnson were eligible to receive the following meeting fees with respect to their service on the Bank’s board of directors: $1,000 for attendance at each regularly-scheduled meeting, $350 for attendance at each Audit Committee meeting and $350 for attendance at each Special Committee meeting. Mr. Ayers receives an annual compensation of $200,000 for his services as our Chairman.
192
Table of Contents
Index to Financial Statements
The following table sets forth information about the beneficial ownership of our common stock as of August 31, 2016 and as adjusted to reflect the completion of the offering, for:
| • | each person known to us to be the beneficial owner of more than 5% of our common stock; |
| • | each of our directors and named executive officers individually; and |
| • | all of directors and executive officers as a group. |
We have determined beneficial ownership in accordance with the rules of the SEC. These rules generally provide that a person is the beneficial owner of securities if such person has or shares the power to vote or direct the voting of securities, or to dispose or direct the disposition of securities, or has the right to acquire such powers within 60 days. For purposes of calculating each person’s percentage ownership, common stock issuable pursuant to equity awards within 60 days are included as outstanding and beneficially owned for that person or group, but are not deemed outstanding for the purposes of computing the percentage ownership of any other person. Except as disclosed in the footnotes to this table and subject to applicable community property laws, we believe that each beneficial owner identified in the table possesses sole voting and investment power over all our common stock shown as beneficially owned by the beneficial owner.
The percentage of beneficial ownership is based on 23,121,176 shares of common stock to be outstanding after the completion of this offering assuming no exercise of the underwriters’ option to purchase additional shares of our common stock, and 24,003,028 shares of our common stock to be outstanding after the completion of this offering, assuming exercise of the underwriters’ option to purchase additional shares of our common stock. The following table does not reflect any shares of our common stock that our directors or officers may purchase in this offering through the directed share program described under “Underwriting.”
Unless otherwise indicated in the table or footnotes below, the address for each beneficial owner is c/o FB Financial Corporation, 211 Commerce Street, Suite 300, Nashville, Tennessee 37201.
| Prior to this offering |
After this offering | |||||||||||
| Assuming underwriters’ option to purchase additional shares is not exercised |
Assuming option to additional exercised | |||||||||||
| Number of shares beneficially owned |
Number of shares beneficially owned |
Number of beneficially | ||||||||||
| Name | Number of shares |
Percentage of shares |
Number of shares |
Percentage of shares |
Number of shares |
Percentage of shares | ||||||
| Directors and Named Executive Officers |
||||||||||||
| James W. Ayers(1) |
17,180,000 | 100.00% | 17,180,000 | 74.30% | 17,180,000 | 71.57% | ||||||
| Wilburn J. Evans |
0 | 0% |
0 | 0% | 0 | 0% | ||||||
| James R. Gordon |
0 | 0% |
0 | 0% | 0 | 0% | ||||||
| Christopher T. Holmes(2) |
0 | 0% |
176,471 | 0.76% | 176,471 | 0.73% | ||||||
| Orrin H. Ingram |
0 | 0% |
0 | 0% |
0 |
0% | ||||||
| Ruth E. Johnson |
0 | 0% |
0 | 0% |
0 |
0% | ||||||
| Timothy L. Johnson |
0 | 0% |
0 | 0% |
0 |
0% | ||||||
| Stuart C. McWhorter |
0 | 0% |
0 | 0% |
0 |
0% | ||||||
| Directors and Executive Officers as a Group (8 Persons)(3) |
17,180,000 | 100.00% | 17,356,471 | 74.50% | 17,356,471 | 71.78% | ||||||
|
| ||||||||||||
| (1) | Mr. Ayers’ shares are held directly by Mr. Ayers and Mr. Ayers has sole voting and investment power over these shares. For a discussion of certain relationships between us and Mr. Ayers, in addition to his role as our Chairman, please see “Certain relationships and related person transactions.” |
| (2) | Reflects shares underlying Mr. Holmes’ fully-vested deferred stock units (DSUs), assuming an initial public offering price of $17.00 per share (the midpoint of the range set forth on the cover page of this prospectus), which DSUs will be issued to him in connection with his existing deferred compensation arrangement. For additional information regarding Mr. Holmes DSUs, see “Executive compensation and other matters: Deferred compensation.” |
| (3) | Excludes shares of our common stock issuable upon the optional stock settlement of our outstanding EBI Units and restricted stock units being granted in connection with this offering. For a summary of the equity awards being granted to certain of our executive officers in connection with this offering and the conversion of outstanding EBI plan units (at the plan participants’ option), see “Executive compensation and other matters: Summary of one-time IPO equity awards, conversion of deferred compensation and conversion of EBI units.” |
193
Table of Contents
Index to Financial Statements
Certain relationships and related person transactions
Loans to officers, directors and affiliates
We offer loans in the ordinary course of business to our insiders, including our executive officers and directors, their related interests and immediate family members and other employees. Applicable law and our written credit policies require that loans to insiders be on substantially the same terms, including interest rates and collateral, as those prevailing at the time for comparable transactions with unrelated parties, and must not involve more than the normal risk of repayment or present other unfavorable features. Loans to non-insider employees and other non-insiders are subject to the same requirements and underwriting standards and meet our normal lending guidelines, except that non-insider employees and other non-insiders may receive preferential interest rates and fees as an employee benefit. Loans to individual employees, directors and executive officers must also comply with the Bank’s statutory lending limits and regulatory requirements regarding lending limits and collateral. All extensions of credit to the related parties must be reviewed and approved by the Bank’s board of directors, and directors with a personal interest in any loan application are excluded from the consideration of such loan application.
We have made loans to directors and executive officers. Such loans amounted to $29.9, $27.6 and $32.2 million at December 31, 2015, 2014 and 2013, respectively. The loans to such persons (i) complied with our Regulation O policies and procedures, (ii) were made in the ordinary course of business, (iii) were made on substantially the same terms, including interest rates and collateral, as those prevailing at the time for comparable loans with persons not related us and (iv) did not involve more than a normal risk of collectability or did not present other features unfavorable to the Company.
Related party transaction policy
Transactions by us with related parties are subject to a formal written policy, as well as regulatory requirements and restrictions. These requirements and restrictions include Sections 23A and 23B of the Federal Reserve Act and the Federal Reserve’s Regulation W, which governs certain transactions by us with our affiliates, and the Federal Reserve’s Regulation O, which governs certain loans by us to executive officers, directors and principal shareholders. We have adopted policies to comply with these regulatory requirements and restrictions.
In addition, prior to completion of this offering, our board of directors will adopt a written policy governing the approval of related party transactions that complies with all applicable requirements of the SEC and the NYSE concerning related party transactions. Related party transactions are transactions in which we are a participant, the amount involved exceeds $120,000 and a related party has or will have a direct or indirect material interest. Our related parties include our directors (including nominees for election as directors), executive officers, 5% shareholders and the immediate family members of these persons. Our CEO, in consultation with counsel, as appropriate, will review potential related party transactions to determine if they are subject to the policy. If so, the transaction will be referred to our Audit Committee for approval. In determining whether to approve a related party transaction, our Audit Committee will consider, among other factors, the fairness of the proposed transaction, the direct or indirect nature of the related party’s interest in the transaction, the appearance of an improper conflict of interests for any director or executive officer taking into account the size of the transaction and the financial position of the related party, whether the transaction would impair an outside director’s independence, the acceptability of the transaction to our regulators and the potential violations of other corporate policies. Upon completion of this offering, our Related Party Transactions Policy will be available on our website at www.firstbankonline.com.
194
Table of Contents
Index to Financial Statements
Related person transactions
The following is a description of transactions during the fiscal year ended December 31, 2015 and the first half of 2016 in which we have participated and in which one or more of our directors or executive officers, or their immediate family members or entities affiliated with them, had a direct or indirect material interest.
Issuance of notes
On February 12, 1996, the Company borrowed $775 thousand from our sole shareholder and director, James W. Ayers, through a term subordinated note of which $775 thousand was outstanding as of June 30, 2016. This note carries an annual interest rate equal to the Prime Rate less 100 basis points adjusting on January 10 of each year. The Company borrowed $3.3 million on August 26, 1999 from Mr. Ayers through a term subordinated note of which $3.3 million was outstanding as of June 30, 2016. This note carries a quarterly interest rate equal to the 30 day LIBOR rate plus 200 basis points. On June 30, 2006, the Company borrowed $6.0 million from Mr. Ayers through a term subordinated note of which $6.0 million was outstanding as of June 30, 2016. This note carries a quarterly interest rate equal to the 90 day LIBOR rate plus 170 basis points. For the year ended December 31, 2015 and the first half of 2016, the aggregate amount of interest payments paid by the Company to Mr. Ayers for these subordinated notes were $0.2 and $0.1 million, respectively. The maturity date of the notes is December 31, 2021.
Subject to regulatory approval, we intend to use a portion of the net proceeds to us from this offering to fund the repayment of all $10.1 million aggregate principal amount of the subordinated notes held by our sole shareholder, plus any accrued and unpaid interest thereon.
Non-taxable distribution of S Corporation earnings
In connection with this offering and the termination of our status as an S Corporation, our board of directors has declared a cash distribution to our sole shareholder in the amount of $55 million, which is intended to be non-taxable to our sole shareholder and represents a significant portion of our S Corporation earnings that have been taxed to our sole shareholder, but not distributed to him. The distribution is contingent upon, and payable to our sole shareholder immediately following, the closing of this offering. Purchasers of our common stock in this offering will not be entitled to receive any portion of this distribution. We also intend to make a distribution to our sole shareholder in an amount between $4 million and $5 million prior to the completion of this offering to fund the payment of the estimated third quarter taxes that will be “passed through” to him by virtue of our status as an S Corporation.
Other transactions
Mr. Ayers is the executive vice president and a principal shareholder of Ayers Asset Management, a business entity that manages certain of his business activities. Employees of Ayers Asset Management, including Mr. Ayers, provide consulting services to the Bank, including financial and legal advice. For these consulting services, the Bank paid approximately $306 thousand to Ayers Asset Management during the year ended December 31, 2015. The Bank terminated its consulting arrangement with Ayers Asset Management on December 31, 2015.
In addition, we have entered into an aircraft time sharing agreement, dated as of December 21, 2012, with Ayers Asset Management, pursuant to which we have the right to use, from time to time, an aircraft leased and operated by Ayers Asset Management. Ayers Asset Management bills us for our usage of the aircraft based on hours of use and operating costs. During the year ended December 31, 2015 and the first half of 2016, we paid Ayers Asset Management $57 thousand and $32 thousand, respectively, under the aviation timesharing agreement for the use of the aircraft.
195
Table of Contents
Index to Financial Statements
The Bank leases various office spaces from entities owned by Mr. Ayers. The aggregate amount paid by the Bank for the aforementioned leases was $503 thousand and $264 thousand for the year ended December 31, 2015 and the first half of 2016, respectively.
Shareholder’s agreement
Prior to or upon the completion of this offering, we intend to enter into a shareholder’s agreement with Mr. Ayers, in his capacity as our sole shareholder. Pursuant to the shareholder’s agreement, our Board of Directors will consist of between five and nine members, with Mr. Ayers having the right to designate a majority of the board members for so long as Mr. Ayers owns a majority of the outstanding shares of our common stock. Mr. Ayers’ director designation rights will decrease as his percentage ownership of our common stock decreases, with the ability to designate up to (i) 40% of the total number of directors, in the event that he beneficially owns more than 40%, but less than or equal to 50%, of the outstanding shares of our common stock, (ii) up to 30% of the total number of directors, in the event that he beneficially owns more than 30%, but less than or equal to 40%, of the outstanding shares of our common stock, (iii) up to 20% of the total number of directors, in the event that he beneficially owns more than 20%, but less than or equal to 30%, of the outstanding shares of our common stock and (iv) up to 10% of the total number of directors, in the event that he beneficially owns, directly or indirectly, at least 5% of the then outstanding shares of our common stock, in each case rounded up to the nearest whole number of directors. In addition, our chief executive officer shall have the right to serve as a board member. Mr. Ayers intends to designate himself, Mr. Ingram and Mr. McWhorter as his initial director designees. If at any time a designee of Mr. Ayers ceases to serve on our board of directors, Mr. Ayers will have the right to designate or nominate a successor to fill such vacancy or, if he loses his right to designate any such directors pursuant to the terms of the shareholder’s agreement, these positions will be filled in accordance with our charter and bylaws. All other directorships will be filled in accordance with our charter and bylaws. See “Description of Capital Stock” for more information regarding our amended and restated charter and our amended and restated bylaws.
Mr. Ayers will also have the right, for so long as we qualify as a “controlled company” under applicable listing standards, to designate (i) a majority of the members of any nominating and corporate governance committee or similar committee of our board and (ii) up to two members of any compensation committee or similar committee of our board. In the event that we no longer qualify as a “controlled company” under applicable listing standards, Mr. Ayers will continue to have the right to designate at least one member of each such committee of our board for so long as permitted under applicable law and for so long as Mr. Ayers continues to have the right to designate at least one director.
The shareholders agreement shall terminate upon the earlier of Mr. Ayers death or permanent disability or when Mr. Ayers holds less than 5% of our outstanding shares.
Registration rights agreement
Prior to or upon the completion of this offering, we intend to enter into a registration rights agreement with Mr. Ayers. The agreement will provide Mr. Ayers with certain demand and piggyback registration rights in respect of any registrable shares of our common stock held by him, subject to various conditions and limitations as set forth in the agreement.
Tax sharing agreement
We historically have been treated as an S Corporation for U.S. federal income tax purposes. Because we have been an S Corporation Mr. Ayers, our sole shareholder, as an individual has been taxed on our income. Therefore
196
Table of Contents
Index to Financial Statements
Mr. Ayers has received certain distributions (“tax distributions”) from us that were generally intended to equal the amount of tax Mr. Ayers was required to pay with respect to our income. In connection with this offering, our S Corporation status will terminate and we will thereafter be subject to federal and increased state income taxes. In the event of an adjustment to our reported taxable income for periods prior to termination of our S Corporation status, it is possible that Mr. Ayers would be liable for additional income taxes for those prior periods. Therefore, we intend to enter into a tax sharing agreement with Mr. Ayers prior to or upon consummation of this offering. Pursuant to this tax sharing agreement, upon our filing any tax return (amended or otherwise), in the event of any restatement of our taxable income or pursuant to a determination by, or a settlement with, a taxing authority, for any period during which we were an S Corporation, depending on the nature of the adjustment we may be required to make a payment to Mr. Ayers in an amount equal to Mr. Ayers’ incremental tax liability, which amount may be material. In addition, we will indemnify Mr. Ayers with respect to unpaid income tax liabilities to the extent that such unpaid income tax liabilities are attributable to an adjustment to our taxable income for any period after our S Corporation status terminates. In both cases the amount of the payment will be based on the assumption that Mr. Ayers is taxed at the highest rate applicable to individuals for the relevant periods. We will also indemnify Mr. Ayers for any interest, penalties, losses, costs or expenses arising out of any claim under the agreement. However, Mr. Ayers will indemnify us with respect to our unpaid tax liabilities (including interest and penalties) to the extent that such unpaid tax liabilities are attributable to a decrease in the shareholder’s taxable income for any for tax period and a corresponding increase in the Company’s taxable income for any period.
197
Table of Contents
Index to Financial Statements
Description of our capital stock
The following is a description of our capital stock and the material provisions of our amended and restated charter and amended and restated bylaws, as each is anticipated to be in effect upon the closing of this offering, and other agreements to which we and our shareholders are parties. The following is only a summary and is qualified by applicable law and by the provisions of the amended and restated certificate of incorporation and amended and restated bylaws and other agreements, copies of which are available as set forth under the caption entitled “Where you can find more information.”
General
Following this offering, our authorized capital stock will consist of 75,000,000 shares of common stock, par value $1.00 per share, and 7,500,000 shares of preferred stock, no par value.
Common stock
Common stock outstanding. As of August 31, 2016 there were 17,180,000 shares of common stock outstanding which were held of record by our sole shareholder, Mr. Ayers. Following this offering and the grant of 58,824 fully vested shares to certain of our employees in connection with this offering, there will be 23,121,176 shares of the Company’s common stock outstanding, assuming no exercise of the underwriters’ over-allotment option. The outstanding shares following this offering excludes the 727,257 shares of our common stock issuable upon the optional stock settlement of our outstanding EBI Units, the 917,648 shares of our restricted stock units and deferred stock units being granted in connection with this offering and the remaining 1,723,528 shares of our common stock reserved for future issuance under our 2016 Incentive Plan and the 2,500,000 shares of our common stock reserved for future issuance under our Employee Stock Purchase Plan, and in every case assumes an initial public offering price of $17.00 per share (the midpoint of the range set forth on the cover page of this prospectus). All outstanding shares of common stock are fully paid and non-assessable, and the shares of common stock to be issued upon completion of this offering will be fully paid and non-assessable.
Voting rights. The holders of common stock are entitled to one vote per share on all matters to be voted upon by the shareholders, and are not entitled to cumulative voting in the election of directors. At any meeting of the shareholders, the holders of a majority of the outstanding stock of the Company then having voting rights, present in person or by proxy, shall constitute a quorum for all purposes. If a quorum exists, action on a matter (other than the election of directors) by a voting group is approved if the votes cast within the voting group favoring the action exceeds the votes cast opposing the action, unless otherwise provided by the charter or bylaws.
Dividend rights. Subject to the rights that may be applicable to any outstanding preferred stock and all other classes of stock at the time outstanding having prior rights as to dividends, the holders of common stock are entitled to receive ratably such dividends, if any, as may be declared from time to time by the Board of Directors out of funds legally available therefor. See “Dividend policy.”
Rights upon liquidation. In the event of liquidation, dissolution or winding up of the Company, either voluntarily or involuntarily, the holders of common stock are entitled to share ratably in all assets remaining after payment of liabilities, subject to prior distribution rights of preferred stock, if any, then outstanding.
Other rights. The holders of our common stock have no preemptive or conversion rights or other subscription rights. There are no redemption or sinking fund provisions applicable to the common stock. The rights, preferences and privileges of holders of our common stock are subject to, and may be adversely affected by, the rights of holders of our preferred stock.
198
Table of Contents
Index to Financial Statements
Preferred stock
Our Board of Directors has the authority to issue preferred stock from time to time in one or more series and to establish the number of shares to be included in each such series, and to fix the designation, powers, preferences, and relative rights of the shares of each such series and the qualifications, or restrictions thereof.
The issuance of preferred stock may have the effect of delaying, deferring or preventing a change in control of the Company without further action by the shareholders and may adversely affect the voting and other rights of the holders of common stock. At present, the Company has no plans to issue any of the preferred stock. The authority of the Board of Directors with respect to each such series includes, among others:
| • | the number of shares constituting the series; |
| • | general or specific voting rights; |
| • | preferential liquidation rights; |
| • | preferential cumulative or noncumulative dividend rights; |
| • | redemption or put rights; and |
| • | conversion rights. |
We may issue shares of, or rights to purchase shares of, one or more series of our preferred stock that have been designated from time to time, the terms of which might:
| • | adversely affect the voting or other rights evidenced by, or amounts otherwise payable with respect to, the common stock or other series of preferred stock; |
| • | discourage an unsolicited proposal to acquire us; or |
| • | facilitate a particular business combination involving us. |
Election and removal of directors
Our board of directors will consist of between one and fifteen directors. Directors are elected by a plurality of the votes cast by the shares entitled to vote in the election at a meeting at which a quorum is present. The exact number of directors will be fixed from time to time by resolution of our board of directors. Our bylaws provide that shareholders may remove any director, with cause only, by the affirmative vote of the holders of a majority of the issued and outstanding stock of the Company then having voting rights at a shareholder meeting called for that purpose.
Pursuant to the shareholder’s agreement that we intend to enter into with Mr. Ayers prior to or upon completion of this offering, Mr. Ayers will have certain rights to designate directors to our board of directors. See “Certain relationships and related person transactions.”
Advance notice for shareholder proposals or making nominations at meetings
Our bylaws establish an advance notice procedure for shareholder proposals to be brought before a meeting of our shareholders and for nominations by shareholders of candidates for election as directors at an annual meeting or a special meeting at which directors are to be elected. Subject to any other applicable requirements, only such business may be conducted at a meeting of shareholders as has been brought before the meeting by, or at the direction of, our board of directors or an authorized committee thereof, the Chairman of our board of directors, our Chief Executive Officer, or by a shareholder who has given to our Secretary timely written notice in proper form, of the shareholder’s intention to bring that business before the meeting. The presiding officer at such meeting has the authority to make such determinations. Only persons who are selected and recommended
199
Table of Contents
Index to Financial Statements
by our board of directors, or the committee of our board of directors designated to make nominations, or who are nominated by a shareholder who has given timely written notice, in proper form, to the Secretary prior to a meeting at which directors are to be elected will be eligible for election as directors.
To be timely, notice of nominations or other business to be brought before any meeting must be delivered to our principal executive offices and within the following time periods:
(i) in the case of an annual meeting of shareholders, not earlier than the close of business on the 120th day and not later than the close of business on the 90th day prior to the first anniversary of the preceding year’s annual meeting; provided, however, that in the event the date of the annual meeting is more than 30 days before or more than 60 days after such anniversary date, notice by the shareholder to be timely must be so delivered not earlier than the close of business on the 120th day prior to the date of such annual meeting and not later than the close of business on the later of the 90th day prior to the date of such annual meeting or, if the first public announcement of the date of such annual meeting is less than 100 days prior to the date of such annual meeting, the 10th day following the day on which public announcement of the date of such meeting is first made by us; and
(ii) in the case of a special meeting of shareholders called for the purpose of electing directors, not earlier that the close of business on the 120th day prior to such special meeting and not later than the close of business on the later of the 90th day prior to such special meeting or the 10th day following the date on which notice of the date of the special meeting was mailed or public disclosure of the date of the special meeting was made, whichever first occurs.
In no event shall any adjournment or postponement of an annual meeting, or the announcement thereof, commence a new time period for the giving of a shareholder’s notice as described above.
The notice of any shareholder proposal or nomination for election as director must set forth various information required under the bylaws. The person submitting the notice of nomination and any person acting in concert with such person must provide, among other things, the name and address under which they appear on our books (if they so appear) and the class and number of shares of our capital stock that are beneficially owned by them.
Amendment of charter and bylaws
Under the Tennessee Business Corporation Act (“TBCA”), our charter generally may not be amended without shareholder approval. Except as provided in the charter and subject to the voting rights, any amendment to our charter submitted for shareholder approval at a shareholders’ meeting is generally approved if the number of votes cast in favor of the amendment exceeds the number of votes cast against the amendment. Our charter provides that certain provisions of our charter may only be amended upon the affirmative vote of the holders of at least eighty percent (80%) of our issued and outstanding voting stock.
Our shareholders may amend our bylaws only upon the affirmative vote of the holders of at least eighty percent (80%) of our issued and outstanding voting stock. Additionally, our Board of Directors may amend our bylaws upon the affirmative vote of a majority of the directors then in office, unless a bylaw provision approved by our shareholders expressly provides that any such bylaw may not be amended or repealed by our Board of Directors or unless the TBCA or our charter provides otherwise.
Ownership limitation
The Company is a bank holding company. A holder of common stock (or group of holders acting in concert) that (i) directly or indirectly owns, controls or has the power to vote more than 5% of the total voting power of the Company, (ii) directly or indirectly owns, controls or has the power to vote 10% or more of any class of voting
200
Table of Contents
Index to Financial Statements
securities of the Company, if certain presumptions are not rebutted, (iii) directly or indirectly owns, controls or has the power to vote 25% or more of any class of voting securities, (iv) owns a combination of voting and non-voting securities representing one-third or more of the total equity of the Company, or (vi) is otherwise deemed to “control” the Company under applicable regulatory standards may be subject to important restrictions, such as prior regulatory notice or approval requirements and applicable provisions of the FDIC Policy Statement.
Special meetings
Under our bylaws, only the Chairman of our board of directors, our Chief Executive Officer, or a majority of directors then in office may call special meetings of the shareholders. Our shareholders are not permitted to call special meetings of the shareholders.
Limitation of liability of directors and officers
The TBCA provides that a corporation may indemnify any of its directors and officers against liability incurred in connection with a proceeding if: (a) such person acted in good faith; (b) in the case of conduct in an official capacity with the corporation, he reasonably believed such conduct was in the corporation’s best interests; (c) in all other cases, he reasonably believed that his conduct was at least not opposed to the best interests of the corporation; and (d) in connection with any criminal proceeding, such person had no reasonable cause to believe his conduct was unlawful. In actions brought by or in the right of the corporation, however, the TBCA provides that no indemnification may be made if the director or officer was adjudged to be liable to the corporation. The TBCA also provides that in connection with any proceeding charging improper personal benefit to an officer or director, no indemnification may be made if such officer or director is adjudged liable on the basis that such personal benefit was improperly received. In cases where the director or officer is wholly successful, on the merits or otherwise, in the defense of any proceeding instigated because of his or her status as a director or officer of a corporation, the TBCA mandates that the corporation indemnify the director or officer against reasonable expenses incurred in the proceeding. The TBCA provides that a court of competent jurisdiction, unless the corporation’s charter provides otherwise, upon application, may order that an officer or director be indemnified for reasonable expenses if, in consideration of all relevant circumstances, the court determines that such individual is fairly and reasonably entitled to indemnification, notwithstanding the fact that (a) such officer or director was adjudged liable to the corporation in a proceeding by or in the right of the corporation; (b) such officer or director was adjudged liable on the basis that personal benefit was improperly received by him; or (c) such officer or director breached his duty of care to the corporation. Our charter provides that the Company shall, to the fullest extent permitted by the TBCA, indemnify its directors and officers, and may indemnify all other person whom it has the power to indemnify under the TBCA. The right of any director or officer of the Company to indemnification conferred in our charter shall also include the right to be paid by the Company the expenses incurred in connection with any such proceeding in advance of its final disposition to the fullest extent authorized by Tennessee law.
Anti-takeover effects of some provisions
Some provisions of our charter and bylaws could make more difficult the removal of our incumbent officers and directors. These provisions, as well as our ability to issue preferred stock, are designed to discourage coercive takeover practices and inadequate takeover bids. These provisions are also designed to encourage persons seeking to acquire control of us to first negotiate with our Board of Directors. We believe that the benefits of increased protection give us the potential ability to negotiate with the proponent of an unfriendly or unsolicited proposal to acquire or restructure us, and that the benefits of this increased protection outweigh the disadvantages of discouraging those proposals, because negotiation of those proposals could result in an improvement of their terms.
201
Table of Contents
Index to Financial Statements
Our charter provides that our Board of Directors may issue “blank check” preferred stock without shareholder approval. Some of the rights and preferences of these shares of preferred stock would be superior to the rights and preferences of shares of our common stock. Accordingly, the issuance of new shares of preferred stock may adversely affect the rights of the holders of shares of our common stock.
Anti-takeover provisions in the TBCA
In addition to certain of the provisions in our charter discussed above, the State of Tennessee has adopted statutes that can have an anti-takeover effect and may delay or prevent a tender offer or takeover attempt that a shareholder might consider in its best interest, including those attempts that might result in a premium over the market price for shares of our common stock.
The Tennessee Control Share Acquisition Act generally provides that, except as stated below, “control shares” will not have any voting rights. Control shares are shares acquired by a person under certain circumstances which, when added to their shares owned, would give such person effective control over one-fifth or more, or a majority of all voting power (to the extent such acquired shares cause such a person to exceed one-fifth or one-third of all voting power) in the election of a Tennessee corporation’s directors. However, voting rights will be restored to control shares by resolutions approved by the affirmative vote of the holders of a majority of the corporation’s voting stock, other than shares held by the owner of the control shares. If voting rights are granted to control shares which give the holder a majority of all voting power in the election of the corporation’s directors, then the corporation’s other shareholders may require the corporation to redeem their shares at fair value.
The Tennessee Control Share Acquisition Act is not applicable to us because our charter does not contain a specific provision “opting in” to the act, as is required.
The Tennessee Investor Protection Act provides that unless a Tennessee corporation’s board of directors has recommended a takeover offer to shareholders, no offeror beneficially owning 5% or more of any class of equity securities of the offeree company, any of which was purchased within the preceding year, may make a takeover offer for any class of equity security of the offeree company if after completion the offeror would be a beneficial owner of more than 10% of any class of outstanding equity securities of the company unless the offeror, before making such purchase: (1) makes a public announcement of his or her intention with respect to changing or influencing the management or control of the offeree company; (2) makes a full, fair and effective disclosure of such intention to the person from whom he or she intends to acquire such securities; and (3) files with the Tennessee Commissioner of Commerce and Insurance, or Commissioner, and the offeree company a statement signifying such intentions and containing such additional information as may be prescribed by the Commissioner.
The offeror must provide that any equity securities of an offeree company deposited or tendered pursuant to a takeover offer may be withdrawn by an offeree at any time within seven days from the date the offer has become effective following filing with the Commissioner and the offeree company and public announcement of the terms or after 60 days from the date the offer has become effective. If the takeover offer is for less than all the outstanding equity securities of any class, such an offer must also provide for acceptance of securities pro rata if the number of securities tendered is greater than the number the offeror has offered to accept and pay for. If such an offeror varies the terms of the takeover offer before its expiration date by increasing the consideration offered to offerees, the offeror must pay the increased consideration for all equity securities accepted, whether accepted before or after the variation in the terms of the offer.
The Tennessee Investor Protection Act does not apply to us, as it does not apply to bank holding companies subject to regulation by a federal agency and does not apply to any offer involving a vote by holders of equity securities of the offeree company.
202
Table of Contents
Index to Financial Statements
The Tennessee Business Combination Act, generally prohibits a “business combination” by a company or any of our subsidiaries with an “interested shareholder” within five years after the shareholder becomes an interested shareholder. The company or any of its subsidiaries can, however, enter into a business combination within that period if, before the interested shareholder became such, the company’s board of directors approved the business combination or the transaction in which the interested shareholder became an interested shareholder. After that five-year moratorium, the business combination with the interested shareholder can be consummated only if it satisfies certain fair price criteria or is approved by two-thirds (2/3) of the other shareholders.
For purposes of these provisions of the Tennessee Business Combination Act, a “business combination” includes mergers, share exchanges, sales and leases of assets, issuances of securities, and similar transactions. An “interested shareholder” is generally any person or entity that beneficially owns 10% or more of the voting power of any outstanding class or series of our stock.
The Tennessee Greenmail Act applies to a Tennessee corporation that has a class of voting stock registered or traded on a national securities exchange or registered with the SEC pursuant to Section 12(g) of the Exchange Act. Under the Tennessee Greenmail Act, a company may not purchase any of its shares at a price above the market value of such shares from any person who holds more than 3% of the class of securities to be purchased if such person has held such shares for less than two years, unless the purchase has been approved by the affirmative vote of a majority of the outstanding shares of each class of voting stock issued by the company or the company makes an offer, or at least equal value per share, to all shareholders of such class.
Listing and trading market for common stock
There is no established public trading market for our common stock. Our common stock is not actively traded nor listed for trading on any securities exchange and an active market may not develop or be sustained after this offering. We do not make a market in our securities, nor do we attempt to negotiate prices for trades of such securities. Our common stock has been approved for listing on the NYSE under the symbol “FBK,” but an active or liquid trading market may not develop for our common stock, even if it is listed on the NYSE.
Transfer agent and registrar
The transfer agent and registrar for the common stock is Computershare Trust Company, N.A.
203
Table of Contents
Index to Financial Statements
Shares eligible for future sale
Prior to this offering, there has been no market for our common stock. Future sales of substantial amounts of our common stock in the public market could adversely affect market prices prevailing from time to time. Furthermore, because only a limited number of shares will be available for sale shortly after this offering due to existing contractual and legal restrictions on resale as described below, there may be sales of substantial amounts of our common stock in the public market after the restrictions lapse. This may adversely affect the prevailing market price and our ability to raise equity capital in the future.
Upon completion of this offering, we will have 23,121,176 shares of common stock outstanding, or 24,003,528 shares if the underwriters exercise their over-allotment option in full. Of these shares, 5,941,176 shares, or 6,823,528 shares if the underwriters exercise their over-allotment option in full, will be freely transferable without restriction or registration under the Securities Act, except for any shares purchased by one of our existing “affiliates,” as that term is defined in Rule 144 under the Securities Act, in this offering and shares purchased by participants in the directed share program described below and in “Underwriting” who purchase more than $250,000 in such program. As described below, we have reserved up to 12.5%, or 735,294 shares, of the common stock being offered in this offering for sale to our directors, officers and other individuals associated with us and members of their families through the directed share program. If all of these shares were purchased by our directors, officers or “affiliates,” as that term is defined in Rule 144 under the Securities Act, then only 5,205,882 of our shares, or 6,088,234 shares if the underwriters exercise their over-allotment option in full, would be freely transferable without restriction or further registration under the Securities Act immediately following this offering. The remaining shares of our issued and outstanding common stock will be “restricted shares” as defined in Rule 144. Restricted shares may be sold in the public market only if registered or if they qualify for an exemption from registration under Rules 144 or 701 of the Securities Act.
At our request, the underwriters have reserved up to 12.5% of the common stock being offered by this prospectus for sale at the initial public offering price to our directors, officers, and other individuals associated with us and members of their families. The sales will be made by UBS Financial Services Inc., a selected dealer affiliated with UBS Securities LLC, an underwriter of this offering, through a directed share program. We do not know if these persons will choose to purchase all or any portion of these reserved shares, but any purchases they do make will reduce the number of shares available to the general public. Any reserved shares not so purchased will be offered by the underwriters to the general public on the same terms as the other shares of common stock. Participants in the directed share program who purchase more than $250,000 of shares shall be subject to a 60-day lock-up with respect to any shares sold to them pursuant to that program. This lock-up will have similar restrictions and an identical extension provision to the lock-up agreements described below. Any shares sold in the directed share program to our directors and executive officers shall be subject to the lock-up agreements described below.
Furthermore, in connection with this offering, our board of directors has approved a special, one-time grant under our Incentive Plan to substantially all of our employees (including each of our executive officers other than Mr. Holmes) having an aggregate value of $13,600,000. The number of shares granted will be determined by dividing $13,600,000 by the initial public offering price of our common stock. Such awards will be granted on the effective date of this offering, with $1,000,000 of such awards vesting immediately and the remainder subject to either ratable or cliff vesting over the five year period following the grant date. In addition, our board of directors has approved the conversion of outstanding EBI plan units (at the plan participants’ option) and Mr. Holmes’ existing deferred compensation arrangement from cash settled awards to stock settled awards in connection with this offering. See “Executive compensation and other matters: Equity Awards in Connection with this Offering” and “Executive compensation and other matters: Summary of one-time IPO equity awards, conversion of deferred compensation and conversion of EBI units” for a summary of these awards.
Lock-up agreements
All of our directors and executive officers, including our sole shareholder (accounting for 17,180,000 shares of our common stock outstanding before giving effect to this offering), have agreed, subject to limited exceptions, not to offer, pledge, sell, contract to sell, sell any option or contract to purchase, purchase any option or contract to sell, grant any option, right or warrant to purchase, or otherwise transfer or dispose of, directly or indirectly, or enter into any swap or other arrangement
204
Table of Contents
Index to Financial Statements
that transfers to another, in whole or in part, any of the economic consequences of ownership of any shares of common stock or any securities convertible into or exercisable or exchangeable for shares of common stock for a period of 180 days after the date of this prospectus, without the prior written consent of J.P. Morgan Securities LLC, UBS Securities LLC and Keefe, Bruyette & Woods, Inc.
Rule 144
In general, a person who has beneficially owned restricted shares of our common stock for at least six months would be entitled to sell such securities, provided that (i) such person is not deemed to have been one of our affiliates at the time of, or at any time during the 90 days preceding, a sale and (ii) we are subject to the Exchange Act periodic reporting requirements for at least 90 days before the sale. However, a non-affiliated person who has beneficially owned restricted shares of our common stock for at least one year would be entitled to sell those shares without regard to the availability of current public information about us or whether or not we are subject to the Exchange Act periodic reporting requirement. Persons who have beneficially owned restricted shares of our common stock for at least six months but who are our affiliates at the time of, or any time during the 90 days preceding, a sale, would be subject to additional restrictions, by which such person would be entitled to sell within any three-month period only a number of securities that does not exceed the greater of either of the following:
| • | 1% of the number of shares of our common stock then outstanding, which will equal approximately shares immediately after this offering, assuming no exercise of the underwriters’ option to purchase additional shares; or |
| • | the average weekly trading volume of our common stock on the NYSE during the four calendar weeks preceding the filing a notice on Form 144 with respect to the sale; |
provided, in each case, that we are subject to the Exchange Act periodic reporting requirements for at least 90 days before the sale. Persons who are not deemed to have been affiliates of ours at any time during the 90 days preceding a sale, and who have beneficially owned for at least one year shares of our common stock that are restricted securities, will be entitled to freely sell such shares of our common stock under Rule 144 without regard to the current public information requirements of Rule 144.
Rule 701
In general, under Rule 701, any of our employees, directors, officers, consultants or advisors who purchases shares from us in connection with a compensatory stock or option plan or other written agreement before the effective date of this offering is entitled to resell such shares 90 days after the effective date of this offering in reliance on Rule 144, without having to comply with the holding period requirements or other restrictions contained in Rule 701.
The SEC has indicated that Rule 701 will apply to typical stock options granted by an issuer before it becomes subject to the reporting requirements of the Exchange Act, along with the shares acquired upon exercise of such options, including exercises after the date of this prospectus. Securities issued in reliance on Rule 701 are restricted securities and, subject to the contractual restrictions described above, beginning 90 days after the date of this prospectus, may be sold by persons other than “affiliates,” as defined in Rule 144, subject only to the manner of sale provisions of Rule 144 and by “affiliates” under Rule 144 without compliance with its one-year minimum holding period requirement.
Registration rights agreement
As described under the heading “Certain relationships and related person transactions—registration rights agreement,” we intend to enter into a registration rights agreement for the benefit of our sole shareholder, Mr. Ayers, prior to or upon completion of this offering. Under this agreement, we agreed, among other things, to provide the Mr. Ayers with certain demand and piggyback registration rights in respect of any registrable shares of our common stock held by him, subject to various conditions and limitations set forth in the agreement.
205
Table of Contents
Index to Financial Statements
Stock awards
Upon completion of this offering, we intend to file a registration statement on Form S-8 under the Securities Act covering the 6,020,700 shares of common stock that have been reserved for issuance in connection with our 2016 Incentive Plan, our Employer Stock Purchase Plan and the optional stock settlement of our outstanding EBI units. Subject to Rule 144 volume limitations applicable to affiliates, shares registered under any registration statements will be available for sale in the open market, beginning 90 days after the date of the prospectus, except to the extent that the shares are subject to vesting restrictions with us or the contractual restrictions described below.
206
Table of Contents
Index to Financial Statements
Certain material U.S. federal income tax consequences for non-U.S. holders of common stock
The following is a summary of certain material United States federal income tax consequences relevant to non-U.S. holders, as defined below, of the purchase, ownership and disposition of our common stock issued pursuant to this offering. The following summary is based on current provisions of the Code, Treasury regulations and judicial and administrative authority, all of which are subject to change, possibly with retroactive effect. These authorities may be changed, possibly retroactively, so as to result in U.S. federal income tax consequences different from those set forth below. We have not sought any ruling from the IRS with respect to the statements made and the conclusions reached in the following summary, and there can be no assurance that the IRS will agree with such statements and conclusions.
This section does not consider state, local, estate or foreign tax consequences, nor does it address tax consequences to special classes of investors, including, but not limited to, tax-exempt organizations, insurance companies, banks or other financial institutions, partnerships or other entities classified as partnerships for United States federal income tax purposes, dealers in securities, persons liable for the alternative minimum tax, certain former citizens or long-term residents of the United States, traders in securities that elect to use a mark-to-market method of accounting for their securities holdings, persons who have acquired our common stock as compensation or otherwise in connection with the performance of services, or persons that will hold our common stock as a position in a hedging transaction, “straddle,” “conversion transaction” or other risk reduction transaction. Tax consequences may vary depending upon the particular status of an investor. The summary is limited to non-U.S. holders who will hold our common stock as “capital assets” (generally, property held for investment).
If an entity or arrangement treated as a partnership for United States federal income tax purposes holds our common stock, the tax treatment of a partner in the partnership will generally depend upon the status of the partner and the activities of the partnership. If you are treated as a partner in such an entity holding our common stock, you should consult your tax advisor as to the United States federal income tax consequences applicable to you.
YOU ARE URGED TO CONSULT YOUR TAX ADVISOR WITH RESPECT TO THE APPLICATION OF THE U.S. FEDERAL INCOME TAX LAWS TO YOUR PARTICULAR SITUATION, AS WELL AS ANY TAX CONSEQUENCES OF THE PURCHASE, OWNERSHIP AND DISPOSITION OF OUR COMMON STOCK ARISING UNDER THE U.S. FEDERAL ESTATE OR GIFT TAX RULES OR UNDER THE LAWS OF ANY STATE, LOCAL, NON-U.S. OR OTHER TAXING JURISDICTION OR UNDER ANY APPLICABLE TAX TREATY.
Non-U.S. holder defined
For purposes of this discussion, you are a “non-U.S. holder” if you are any holder of our common stock other than an entity classified as a partnership for U.S. federal income tax purposes, or:
| • | an individual citizen or resident of the United States (for tax purposes); |
| • | a corporation or other entity taxable as a corporation created or organized in the United States or under the laws of the United States or any political subdivision thereof; |
| • | an estate whose income is subject to U.S. federal income tax regardless of its source; or |
| • | a trust (x) whose administration is subject to the primary supervision of a U.S. court and which has one or more U.S. persons who have the authority to control all substantial decisions of the trust or (y) which has made a valid election to be treated as a U.S. person. |
207
Table of Contents
Index to Financial Statements
Distributions
As described under “Dividend policy,” we do not anticipate declaring or paying dividends to holders of our common stock in the foreseeable future. However, if we do make distributions with respect to our common stock, such distributions will be treated as dividends when paid to the extent of our current or accumulated earnings and profits as determined for United States federal income tax purposes. Any distribution not constituting a dividend will be treated first as reducing the adjusted basis in the non-U.S. Holder’s shares of our common stock and, to the extent it exceeds the adjusted basis in the non-U.S. Holder’s shares of our common stock, as gain from the sale or exchange of such stock. Except as described below, if you are a non-U.S. holder of our shares, dividends paid to you are subject to withholding of United States federal income tax at a 30% rate or at a lower rate if you are eligible for the benefits of an income tax treaty that provides for a lower rate. Even if you are eligible for a lower treaty rate, we and other payors will generally be required to withhold at a 30% rate (rather than the lower treaty rate) on dividends paid to you, unless you have furnished to us or another payor:
| • | A valid IRS Form W-8BEN, W-8BEN-E or other applicable Form W-8 (or successor form) upon which you certify, under penalties of perjury, your status as a non-U.S. person and your entitlement to the lower treaty rate with respect to such payments, or |
| • | In the case of payments made outside the United States to an offshore account (generally, an account maintained by you at an office or branch of a bank or other financial institution at any location outside the United States), other documentary evidence establishing your entitlement to the lower treaty rate in accordance with Treasury regulations. |
If you are eligible for a reduced rate of U.S. withholding tax under an applicable income tax treaty, you may obtain a refund of any amounts withheld in excess of that rate by timely filing a refund claim with the IRS. If the non-U.S. holder holds the stock through a financial institution or other agent acting on the non-U.S. holder’s behalf, the non-U.S. holder will be required to provide appropriate documentation to the agent, which then will be required to provide certification to us or our paying agent, either directly or through other intermediaries.
If dividends paid to you are “effectively connected” with your conduct of a trade or business within the United States, and, if required by a tax treaty, the dividends are attributable to a permanent establishment that you maintain in the United States, we and other payors generally are not required to withhold tax from the dividends, provided that you have furnished to us or another payor a valid IRS Form W-8ECI or other applicable IRS Form W-8 (or successor form) upon which you represent, under penalties of perjury, that:
| • | You are a non-U.S. person, and |
| • | The dividends are effectively connected with your conduct of a trade or business within the United States and are includible in your gross income. |
“Effectively connected” dividends are taxed at rates applicable to United States citizens, resident aliens and domestic United States corporations. If you are a corporate non-U.S. holder, “effectively connected” dividends that you receive may, under certain circumstances, be subject to an additional “branch profits tax” at a 30% rate, or at a lower rate if you are eligible for the benefits of an income tax treaty that provides for a lower rate.
Sale or other taxable disposition
Subject to the discussion below regarding backup withholding and foreign accounts, you generally will not be subject to United States federal income or withholding tax on gain realized on the sale, exchange or other taxable disposition of our common stock unless:
| • | The gain is effectively connected with your conduct of a trade or business in the United States and, if certain tax treaties apply, is attributable to your U.S. permanent establishment; |
208
Table of Contents
Index to Financial Statements
| • | If you are an individual and are present in the United States for 183 days or more in the taxable year of the sale or other disposition, and certain other conditions are met; or |
| • | Our common stock constitutes a U.S. real property interest by reason of our status as a “U.S. real property holding corporation” (USRPHC) for U.S. federal income tax purposes and, if our common stock is “regularly traded” on an established securities market, you held, directly or indirectly, at any time during the shorter of five-year period ending on the date of disposition or your holding period, more than 5% of our common stock. |
We believe that we are not currently and will not become a USRPHC and the remainder of this discussion so assumes. However, because the determination of whether we are a USRPHC depends on the fair market value of our U.S. real property relative to the fair market value of our other business assets, there can be no assurance that we will not become a USRPHC in the future.
If you are an individual and are described in the first bullet above, you will be subject to tax on the net gain derived from the sale under regular graduated U.S. federal income tax rates generally in the same manner as if you were a U.S. resident. If you are a foreign corporation and are described in the first bullet above, you will be subject to tax on your gain under regular graduated U.S. federal income tax rates generally in the same manner as if you were a U.S. person and, in addition, may be subject to the branch profits tax on your effectively connected earnings and profits at a rate of 30% or at such lower rate as may be specified by an applicable income tax treaty. If you are an individual non-U.S. holder described in the second bullet above, you will be required to pay a flat 30% tax on the gain derived from the disposition, which tax may be offset by U.S.-source capital losses for the year. You should consult any applicable income tax or other treaties that may provide for different rules.
U.S. federal estate tax
Shares of our common stock owned or treated as owned by an individual who is non-U.S. holder (as specially defined for U.S. federal estate tax purposes) at the time of death will be includible in the individual’s gross estate for U.S. federal estate tax purposes, unless an applicable estate tax treaty provides otherwise, and therefore may be subject to U.S. federal estate tax.
Recent legislation relating to foreign accounts
The Foreign Account Tax Compliance Act, or FATCA, imposes a 30% withholding tax on certain types of payments made to “foreign financial institutions” (as specifically defined under these rules) and certain other non-U.S. entities unless certain due diligence, reporting, withholding, and certification requirements are satisfied or the holder otherwise establishes an exemption.
As a general matter, FATCA imposes a 30% withholding tax on dividends on, and gross proceeds from the sale or other disposition of our common stock if paid to a foreign entity unless either (i) the foreign entity is a “foreign financial institution” that undertakes certain due diligence, reporting, withholding, and certification obligations, (ii) the foreign entity is not a “foreign financial institution” and identifies certain of its U.S. investors, or (iii) the foreign entity otherwise is excepted under FATCA.
Different rules than those described above may apply to non-U.S. holders resident in jurisdictions that have entered into inter-governmental agreements with the United States.
Pursuant to the delayed effective dates provided for in the final regulations and accompanying guidance, the required withholding currently applies to dividends on our common stock and will apply beginning on January 1, 2019, with respect to gross proceeds from a sale or other disposition of our common stock.
209
Table of Contents
Index to Financial Statements
If withholding is required under FATCA on a payment related to our common stock, investors that otherwise would not be subject to withholding (or that otherwise would be entitled to a reduced rate of withholding) generally will be required to seek a refund or credit from the IRS to obtain the benefit of such exemption or reduction (provided that such benefit is available). Prospective investors should consult their tax advisors regarding the effect of FATCA in their particular circumstances.
Non-U.S. Holders are encouraged to consult with their tax advisors regarding the possible implications of the legislation on their investment in our common stock.
Information reporting and backup withholding
Under certain circumstances, Treasury Regulations require information reporting and backup withholding on certain payments on common stock.
Payment of dividends, and the tax withheld on those payments, are subject to information reporting requirements. These information reporting requirements apply regardless of whether withholding was reduced or eliminated by an applicable income tax treaty. We must report annually to the IRS and to each non-U.S. Holder the amount of dividends paid to that holder and the U.S. federal withholding tax withheld with respect to those dividends, regardless of whether withholding is reduced or eliminated by an applicable tax treaty. Under the provisions of an applicable income tax treaty or agreement, copies of the information returns reporting such dividends and withholding may also be made available to the tax authorities in the country in which the non-U.S. holder resides.
U.S. backup withholding (currently at a rate of 28%) is imposed on certain payments to persons that fail to furnish the information required under the U.S. information reporting requirements. Payments of dividends on or of proceeds from the disposition of our common stock will generally be exempt from backup withholding, provided the non-U.S. Holder meets applicable certification requirements, including providing a correct and properly executed IRS Form W-8BEN, W-8BEN-E (or other applicable form) or otherwise establishing an exemption and the payor does not have actual knowledge or reason to know that the non-U.S. holder is a U.S. person, as defined under the Code, that is not an exempt recipient.
Backup withholding does not represent an additional tax. Any amounts withheld from a payment to a non-U.S. holder under the backup withholding rules will be allowed as a credit against the holder’s United States federal income tax liability and may entitle the holder to a refund, provided that the required information or returns are timely furnished by the holder to the IRS.
EACH PROSPECTIVE INVESTOR SHOULD CONSULT ITS OWN TAX ADVISOR REGARDING THE PARTICULAR U.S. FEDERAL, STATE AND LOCAL AND NON-U.S. TAX CONSEQUENCES OF PURCHASING, HOLDING AND DISPOSING OF OUR CLASS A COMMON STOCK, INCLUDING THE CONSEQUENCES OF ANY PROPOSED CHANGE IN APPLICABLE LAWS.
210
Table of Contents
Index to Financial Statements
We are offering the shares of common stock described in this prospectus through a number of underwriters. J.P. Morgan Securities LLC, UBS Securities LLC and Keefe, Bruyette & Woods, Inc. are acting as joint book-running managers of the offering and as representatives of the underwriters. We have entered into an underwriting agreement dated , 2016 with the underwriters. Subject to the terms and conditions of the underwriting agreement, we have agreed to sell to the underwriters, and each underwriter has severally agreed to purchase, at the public offering price less the underwriting discounts and commissions set forth on the cover page of this prospectus, the number of shares of common stock listed next to its name in the following table:
| Name | Number of shares | |||
| J.P. Morgan Securities LLC |
||||
| UBS Securities LLC |
||||
| Keefe, Bruyette & Woods, Inc. |
||||
| Raymond James & Associates, Inc. |
||||
| Sandler O’Neill & Partners, L.P. |
||||
| Stephens Inc. |
||||
|
|
|
|||
| Total |
5,882,352 | |||
|
|
||||
The underwriters are committed to purchase all the common shares offered by us if they purchase any shares. The underwriting agreement also provides that if an underwriter defaults, the purchase commitments of non-defaulting underwriters may also be increased or the offering may be terminated.
The underwriters propose to offer the common shares directly to the public at the initial public offering price set forth on the cover page of this prospectus and to certain dealers at that price less a concession not in excess of $ per share. Any such dealers may resell shares to certain other brokers or dealers at a discount of up to $ per share from the initial public offering price. After the initial offering of the shares to the public, the offering price and other selling terms may be changed by the underwriters. Sales of shares made outside of the United States may be made by affiliates of the underwriters.
The underwriters have an option to buy up to 882,352 additional shares of common stock from us to cover sales of shares by the underwriters which exceed the number of shares specified in the table above. The underwriters have 30 days from the date of this prospectus to exercise this option to purchase additional shares. If any shares are purchased with this option to purchase additional shares, the underwriters will purchase shares in approximately the same proportion as shown in the table above. If any additional shares of common stock are purchased, the underwriters will offer the additional shares on the same terms as those on which the shares are being offered.
At our request, the underwriters have reserved up to 12.5% of the common stock being offered by this prospectus for sale at the initial public offering price to our directors, officers, and other individuals associated with us and members of their families. The sales will be made by UBS Financial Services Inc., a selected dealer affiliated with UBS Securities LLC, an underwriter of this offering, through a directed share program. We do not know if these persons will choose to purchase all or any portion of these reserved shares, but any purchases they do make will reduce the number of shares available to the general public. Any reserved shares not so purchased will be offered by the underwriters to the general public on the same terms as the other shares of common stock. Participants in the directed share program who purchase more than $250,000 of shares shall be subject to a 60-day lock-up with respect to any shares sold to them pursuant to that program. This lock-up will have similar restrictions and an identical extension provision to the lock-up agreements described below. Any shares sold in the directed share program to our directors, executive officers or selling stockholders shall be subject to the lock-up agreements described below. UBS Financial Services Inc. will receive a customary selling concession with respect to shares sold through the directed share program.
211
Table of Contents
Index to Financial Statements
The underwriting fee is equal to the public offering price per share of common stock less the amount paid by the underwriters to us per share of common stock. The underwriting fee is $ per share. The following table shows the per share and total underwriting discounts and commissions to be paid to the underwriters assuming both no exercise and full exercise of the underwriters’ option to purchase additional shares.
| Without option to purchase additional shares exercise |
With full option to purchase additional shares exercise |
|||||||
| Per Share |
$ | $ | ||||||
| Total |
$ | $ | ||||||
|
|
||||||||
We estimate that the total costs and expenses of this offering, including registration, filing and listing fees, printing fees and legal and accounting fees, but excluding the underwriting discounts and commissions, will be approximately $3.9 million. We have agreed to reimburse the underwriters for certain expenses in connection with this offering, including up to an aggregate of $30,000 in connection with the clearance of this offering with the Financial Industry Regulatory Authority, as set forth in the underwriting agreement. In addition, the underwriters have agreed to reimburse certain of our expenses in connection with this offering.
A prospectus in electronic format may be made available on the web sites maintained by one or more underwriters, or selling group members, if any, participating in the offering. The underwriters may agree to allocate a number of shares to underwriters and selling group members for sale to their online brokerage account holders. Internet distributions will be allocated by the representatives to underwriters and selling group members that may make Internet distributions on the same basis as other allocations.
We have agreed that we will not (i) offer, pledge, sell, contract to sell, sell any option or contract to purchase, purchase any option or contract to sell, grant any option, right or warrant to purchase or otherwise dispose of, directly or indirectly, or file with the Securities and Exchange Commission a registration statement under the Securities Act relating to (other than a registration statement on Form S-8), any shares of our common stock or securities convertible into or exchangeable or exercisable for any shares of our common stock, or publicly disclose the intention to make any offer, sale, pledge, disposition or filing, or (ii) enter into any swap or other arrangement that transfers all or a portion of the economic consequences associated with the ownership of any shares of common stock or any such other securities (regardless of whether any of these transactions are to be settled by the delivery of shares of common stock or such other securities, in cash or otherwise), in each case without the prior written consent of J.P. Morgan Securities LLC, UBS Securities LLC and Keefe, Bruyette & Woods, Inc. for a period of 180 days after the date of this prospectus, other than the shares of our common stock to be sold hereunder, any share based awards issued under company stock plans and any shares of our common stock issued upon the exercise of options granted under company stock plans.
Our directors and executive officers, including our sole shareholder, have entered into lock-up agreements with the underwriters prior to the commencement of this offering pursuant to which each of these persons or entities, with limited exceptions, for a period of 180 days after the date of this prospectus, may not, without the prior written consent of J.P. Morgan Securities LLC, UBS Securities LLC and Keefe, Bruyette & Woods, Inc., (1) offer, pledge, sell, contract to sell, sell any option or contract to purchase, purchase any option or contract to sell, grant any option, right or warrant to purchase, or otherwise transfer or dispose of, directly or indirectly, any shares of our common stock or any securities convertible into or exercisable or exchangeable for our common stock, (including without limitation, common stock or such other securities which may be deemed to be beneficially owned by such directors, executive officers and significant shareholders in accordance with the rules and regulations of the Securities and Exchange Commission and securities which may be issued upon exercise of a stock option or warrant) or publicly disclose the intention to make any offer, sale, pledge or disposition, (2) enter into any swap or other agreement that
212
Table of Contents
Index to Financial Statements
transfers, in whole or in part, any of the economic consequences of ownership of our common stock or such other securities, whether any such transaction described in clause (1) or (2) above is to be settled by delivery of common stock or such other securities, in cash or otherwise or (3) make any demand for or exercise any right with respect to the registration of any shares of our common stock or any security convertible into or exercisable or exchangeable for our common stock, in each case other than (A) transfers of shares or our common stock as a bona fide gift or gifts, by will or intestacy, to any trust, partnership or limited liability company for the direct or indirect benefit of such director, executive officer or the immediate family of the undersigned, to a member of the undersigned’s immediate family, (B) transfers to us in connection with the exercise of stock options or warrants or securities convertible into or exchangeable for our common stock outstanding on the date hereon, (C) transfers to us in connection with the exchange or surrender of shares of our common stock in satisfaction or payment of the exercise price of stock options, or to satisfy any tax withholding obligations of the undersigned in respect of options or other share-based awards or (D) transfers pursuant to this offering; provided, however, in case of any transfer pursuant to clause (A), except for bona fide gifts to charitable organizations, it shall be a condition to the transfer that such donee or transferee shall execute and deliver to the representatives a lock-up agreement; and provided, further, that in the case of any transfer pursuant to clause (A), no filing by any party (donor, donee, transferor or transferee) under the Securities Exchange Act of 1934, as amended, or other public announcement shall be required or shall be made voluntarily in connection with such transfer or distribution (other than a filing on a Form 5 made after the expiration of the 180-day period referred to above).
We have agreed to indemnify the underwriters against certain liabilities, including liabilities under the Securities Act of 1933.
Our common stock has been approved for listing on the New York Stock Exchange under the symbol “FBK”.
In connection with this offering, the underwriters may engage in stabilizing transactions, which involves making bids for, purchasing and selling shares of common stock in the open market for the purpose of preventing or retarding a decline in the market price of the common stock while this offering is in progress. These stabilizing transactions may include making short sales of the common stock, which involves the sale by the underwriters of a greater number of shares of common stock than they are required to purchase in this offering, and purchasing shares of common stock on the open market to cover positions created by short sales. Short sales may be “covered” shorts, which are short positions in an amount not greater than the underwriters’ option to purchase additional shares referred to above, or may be “naked” shorts, which are short positions in excess of that amount. The underwriters may close out any covered short position either by exercising their option to purchase additional shares, in whole or in part, or by purchasing shares in the open market. In making this determination, the underwriters will consider, among other things, the price of shares available for purchase in the open market compared to the price at which the underwriters may purchase shares through the option to purchase additional shares. A naked short position is more likely to be created if the underwriters are concerned that there may be downward pressure on the price of the common stock in the open market that could adversely affect investors who purchase in this offering. To the extent that the underwriters create a naked short position, they will purchase shares in the open market to cover the position.
The underwriters have advised us that, pursuant to Regulation M of the Securities Act of 1933, they may also engage in other activities that stabilize, maintain or otherwise affect the price of the common stock, including the imposition of penalty bids. This means that if the representatives of the underwriters purchase common stock in the open market in stabilizing transactions or to cover short sales, the representatives can require the underwriters that sold those shares as part of this offering to repay the underwriting discount received by them.
These activities may have the effect of raising or maintaining the market price of the common stock or preventing or retarding a decline in the market price of the common stock, and, as a result, the price of the
213
Table of Contents
Index to Financial Statements
common stock may be higher than the price that otherwise might exist in the open market. If the underwriters commence these activities, they may discontinue them at any time. The underwriters may carry out these transactions on the New York Stock Exchange, in the over-the-counter market or otherwise.
Prior to this offering, there has been no public market for our common stock. The initial public offering price will be determined by negotiations between us and the representatives of the underwriters. In determining the initial public offering price, we and the representatives of the underwriters expect to consider a number of factors including:
| • | the information set forth in this prospectus and otherwise available to the representatives; |
| • | our prospects and the history and prospects for the industry in which we compete; |
| • | an assessment of our management; |
| • | our prospects for future earnings; |
| • | the general condition of the securities markets at the time of this offering; |
| • | the recent market prices of, and demand for, publicly traded common stock of generally comparable companies; and |
| • | other factors deemed relevant by the underwriters and us. |
Neither we nor the underwriters can assure investors that an active trading market will develop for our common shares, or that the shares will trade in the public market at or above the initial public offering price.
Other than in the United States, no action has been taken by us or the underwriters that would permit a public offering of the securities offered by this prospectus in any jurisdiction where action for that purpose is required. The securities offered by this prospectus may not be offered or sold, directly or indirectly, nor may this prospectus or any other offering material or advertisements in connection with the offer and sale of any such securities be distributed or published in any jurisdiction, except under circumstances that will result in compliance with the applicable rules and regulations of that jurisdiction. Persons into whose possession this prospectus comes are advised to inform themselves about and to observe any restrictions relating to the offering and the distribution of this prospectus. This prospectus does not constitute an offer to sell or a solicitation of an offer to buy any securities offered by this prospectus in any jurisdiction in which such an offer or a solicitation is unlawful.
Certain of the underwriters and their affiliates have provided in the past to us and our affiliates and may provide from time to time in the future certain commercial banking, financial advisory, investment banking and other services for us and such affiliates in the ordinary course of their business, for which they have received and may continue to receive customary fees and commissions. In addition, from time to time, certain of the underwriters and their affiliates may effect transactions for their own account or the account of customers, and hold on behalf of themselves or their customers, long or short positions in our debt or equity securities or loans, and may do so in the future.
Notice to prospective investors in Canada
The shares may be sold only to purchasers purchasing, or deemed to be purchasing, as principal that are accredited investors, as defined in National Instrument 45-106 Prospectus Exemptions or subsection 73.3(1) of the Securities Act (Ontario), and are permitted clients, as defined in National Instrument 31-103 Registration Requirements, Exemptions and Ongoing Registrant Obligations. Any resale of the shares must be made in accordance with an exemption from, or in a transaction not subject to, the prospectus requirements of applicable securities laws.
214
Table of Contents
Index to Financial Statements
Securities legislation in certain provinces or territories of Canada may provide a purchaser with remedies for rescission or damages if this prospectus (including any amendment thereto) contains a misrepresentation, provided that the remedies for rescission or damages are exercised by the purchaser within the time limit prescribed by the securities legislation of the purchaser’s province or territory. The purchaser should refer to any applicable provisions of the securities legislation of the purchaser’s province or territory for particulars of these rights or consult with a legal advisor.
Pursuant to section 3A.3 of National Instrument 33-105 Underwriting Conflicts (NI 33-105), the underwriter is not required to comply with the disclosure requirements of NI 33-105 regarding underwriter conflicts of interest in connection with this offering.
Notice to prospective investors in the European Economic Area
In relation to each Member State of the European Economic Area (each, a “Relevant Member State”), no offer of securities may be made to the public in that Relevant Member State other than:
| A. | to any legal entity which is a qualified investor as defined in the Prospectus Directive; |
| B. | to fewer than 100 or, if the Relevant Member State has implemented the relevant provision of the 2010 PD Amending Directive, 150, natural or legal persons (other than qualified investors as defined in the Prospectus Directive), as permitted under the Prospectus Directive, subject to obtaining the prior consent of the representatives; or |
| C. | in any other circumstances falling within Article 3(2) of the Prospectus Directive, provided that no such offer of securities shall require the Company or the representatives to publish a prospectus pursuant to Article 3 of the Prospectus Directive or supplement a prospectus pursuant to Article 16 of the Prospectus Directive. |
Each person in a Relevant Member State who initially acquires any securities or to whom any offer is made will be deemed to have represented, acknowledged and agreed that it is a “qualified investor” within the meaning of the law in that Relevant Member State implementing Article 2(1)(e) of the Prospectus Directive. In the case of any securities being offered to a financial intermediary as that term is used in Article 3(2) of the Prospectus Directive, each such financial intermediary will be deemed to have represented, acknowledged and agreed that the securities acquired by it in the offer have not been acquired on a non-discretionary basis on behalf of, nor have they been acquired with a view to their offer or resale to, persons in circumstances which may give rise to an offer of any securities to the public other than their offer or resale in a Relevant Member State to qualified investors as so defined or in circumstances in which the prior consent of the representatives has been obtained to each such proposed offer or resale.
The Company, the representatives and their affiliates will rely upon the truth and accuracy of the foregoing representations, acknowledgements and agreements.
This prospectus has been prepared on the basis that any offer of securities in any Relevant Member State will be made pursuant to an exemption under the Prospectus Directive from the requirement to publish a prospectus for offers of securities. Accordingly any person making or intending to make an offer in that Relevant Member State of securities which are the subject of the offering contemplated in this prospectus may only do so in circumstances in which no obligation arises for the Company or any of the underwriters to publish a prospectus pursuant to Article 3 of the Prospectus Directive in relation to such offer. Neither the Company, nor the underwriters have authorized, nor do they authorize, the making of any offer of securities in circumstances in which an obligation arises for the Company or the underwriters to publish a prospectus for such offer.
215
Table of Contents
Index to Financial Statements
For the purpose of the above provisions, the expression “an offer to the public” in relation to any securities in any Relevant Member State means the communication in any form and by any means of sufficient information on the terms of the offer and the securities to be offered so as to enable an investor to decide to purchase or subscribe the securities, as the same may be varied in the Relevant Member State by any measure implementing the Prospectus Directive in the Relevant Member State and the expression “Prospectus Directive” means Directive 2003/71/EC (including the 2010 PD Amending Directive, to the extent implemented in the Relevant Member States) and includes any relevant implementing measure in the Relevant Member State and the expression “2010 PD Amending Directive” means Directive 2010/73/EU.
Notice to prospective investors in the United Kingdom
This document is being distributed only to, and is directed only at, and any offer subsequently made may only be directed at persons who are “qualified investors” (as defined in the Prospectus Directive) (i) who have professional experience in matters relating to investments falling within Article 19 (5) of the Financial Services and Markets Act 2000 (Financial Promotion) Order 2005, as amended (the “Order”) and/or (ii) who are high net worth companies (or persons to whom it may otherwise be lawfully communicated) falling within Article 49(2)(a) to (d) of the Order (all such persons together being referred to as “relevant persons”).
Any person in the United Kingdom that is not a relevant person should not act or rely on the information included in this document or use it as basis for taking any action. In the United Kingdom, any investment or investment activity that this document relates to may be made or taken exclusively by relevant persons. Any person in the United Kingdom that is not a relevant person should not act or rely on this document or any of its contents.
Notice to prospective investors in Switzerland
The securities may not be publicly offered in Switzerland and will not be listed on the SIX Swiss Exchange (“SIX”) or on any other stock exchange or regulated trading facility in Switzerland. This document has been prepared without regard to the disclosure standards for issuance prospectuses under art. 652a or art. 1156 of the Swiss Code of Obligations or the disclosure standards for listing prospectuses under art. 27 ff. of the SIX Listing Rules or the listing rules of any other stock exchange or regulated trading facility in Switzerland. Neither this document nor any other offering or marketing material relating to the securities or the offering may be publicly distributed or otherwise made publicly available in Switzerland.
Neither this document nor any other offering or marketing material relating to the offering, the Company or the securities have been or will be filed with or approved by any Swiss regulatory authority. In particular, this document will not be filed with, and the offer of securities will not be supervised by, the Swiss Financial Market Supervisory Authority FINMA (FINMA), and the offer of securities has not been and will not be authorized under the Swiss Federal Act on Collective Investment Schemes (“CISA”). The investor protection afforded to acquirers of interests in collective investment schemes under the CISA does not extend to acquirers of securities.
Notice to prospective investors in the United Arab Emirates
This prospectus relates to an Exempt Offer in accordance with the Offered Securities Rules of the Dubai Financial Services Authority (“DFSA”). This prospectus is intended for distribution only to persons of a type specified in the Offered Securities Rules of the DFSA. It must not be delivered to, or relied on by, any other person. The DFSA has no responsibility for reviewing or verifying any documents in connection with Exempt Offers. The DFSA has not approved this prospectus nor taken steps to verify the information set forth herein and has no responsibility for the prospectus. The securities to which this prospectus relates may be illiquid and/
216
Table of Contents
Index to Financial Statements
or subject to restrictions on their resale. Prospective purchasers of the securities offered should conduct their own due diligence on the securities. If you do not understand the contents of this prospectus you should consult an authorized financial advisor.
Notice to prospective investors in Qatar
This offering of the securities does not constitute a public offer of securities in the State of Qatar under Law No. 5 of 2002 (the Commercial Companies Law). The securities are only being offered to a limited number of investors who are willing and able to conduct an independent investigation of the risks involved in an investment in the securities or have sufficient knowledge of the risks involved in an investment in the securities. No transaction will be concluded in the jurisdiction of the State of Qatar.
Notice to prospective investors in Australia
No placement document, prospectus, product disclosure statement or other disclosure document has been lodged with the Australian Securities and Investments Commission (“ASIC”), in relation to the offering. This prospectus does not constitute a prospectus, product disclosure statement or other disclosure document under the Corporations Act 2001 (the “Corporations Act”), and does not purport to include the information required for a prospectus, product disclosure statement or other disclosure document under the Corporations Act.
Any offer in Australia of the securities may only be made to persons (the “Exempt Investors”) who are “sophisticated investors” (within the meaning of section 708(8) of the Corporations Act), “professional investors” (within the meaning of section 708(11) of the Corporations Act) or otherwise pursuant to one or more exemptions contained in section 708 of the Corporations Act so that it is lawful to offer the securities without disclosure to investors under Chapter 6D of the Corporations Act.
The securities applied for by Exempt Investors in Australia must not be offered for sale in Australia in the period of 12 months after the date of allotment under the offering, except in circumstances where disclosure to investors under Chapter 6D of the Corporations Act would not be required pursuant to an exemption under section 708 of the Corporations Act or otherwise or where the offer is pursuant to a disclosure document which complies with Chapter 6D of the Corporations Act. Any person acquiring securities must observe such Australian on-sale restrictions.
This prospectus contains general information only and does not take account of the investment objectives, financial situation or particular needs of any particular person. It does not contain any securities recommendations or financial product advice. Before making an investment decision, investors need to consider whether the information in this prospectus is appropriate to their needs, objectives and circumstances, and, if necessary, seek expert advice on those matters.
Notice to prospective investors in Hong Kong
The securities have not been offered or sold and will not be offered or sold in Hong Kong, by means of any document, other than (a) to “professional investors” as defined in the Securities and Futures Ordinance (Cap. 571) of Hong Kong and any rules made under that Ordinance; or (b) in other circumstances which do not result in the document being a “prospectus” as defined in the Companies Ordinance (Cap. 32) of Hong Kong or which do not constitute an offer to the public within the meaning of that Ordinance. No advertisement, invitation or document relating to the securities has been or may be issued or has been or may be in the possession of any person for the purposes of issue, whether in Hong Kong or elsewhere, which is directed at, or the contents of which are likely to be accessed or read by, the public of Hong Kong (except if permitted to do so under the
217
Table of Contents
Index to Financial Statements
securities laws of Hong Kong) other than with respect to securities which are or are intended to be disposed of only to persons outside Hong Kong or only to “professional investors” as defined in the Securities and Futures Ordinance and any rules made under that Ordinance.
Notice to prospective investors in Japan
The securities have not been and will not be registered under the Financial Instruments and Exchange Law of Japan (Law No. 25 of 1948, as amended) and, accordingly, will not be offered or sold, directly or indirectly, in Japan, or for the benefit of any Japanese Person or to others for re-offering or resale, directly or indirectly, in Japan or to any Japanese Person, except in compliance with all applicable laws, regulations and ministerial guidelines promulgated by relevant Japanese governmental or regulatory authorities in effect at the relevant time. For the purposes of this paragraph, “Japanese Person” shall mean any person resident in Japan, including any corporation or other entity organized under the laws of Japan.
Notice to prospective investors in Singapore
This prospectus has not been registered as a prospectus with the Monetary Authority of Singapore. Accordingly, this prospectus and any other document or material in connection with the offer or sale, or invitation for subscription or purchase, of securities may not be circulated or distributed, nor may the securities be offered or sold, or be made the subject of an invitation for subscription or purchase, whether directly or indirectly, to persons in Singapore other than (i) to an institutional investor under Section 274 of the Securities and Futures Act, Chapter 289 of Singapore (the “SFA”), (ii) to a relevant person pursuant to Section 275(1), or any person pursuant to Section 275(1A), and in accordance with the conditions specified in Section 275, of the SFA, or (iii) otherwise pursuant to, and in accordance with the conditions of, any other applicable provision of the SFA.
Where the securities are subscribed or purchased under Section 275 of the SFA by a relevant person which is:
| (a) | a corporation (which is not an accredited investor (as defined in Section 4A of the SFA)) the sole business of which is to hold investments and the entire share capital of which is owned by one or more individuals, each of whom is an accredited investor; or |
| (a) | a trust (where the trustee is not an accredited investor) whose sole purpose is to hold investments and each beneficiary of the trust is an individual who is an accredited investor; |
securities (as defined in Section 239(1) of the SFA) of that corporation or the beneficiaries’ rights and interest (howsoever described) in that trust shall not be transferred within six months after that corporation or that trust has acquired the securities pursuant to an offer made under Section 275 of the SFA except:
| 1) | to an institutional investor or to a relevant person defined in Section 275(2) of the SFA, or to any person arising from an offer referred to in Section 275(1A) or Section 276(4)(i)(B) of the SFA; |
| 2) | where no consideration is or will be given for the transfer; |
| 3) | where the transfer is by operation of law; |
| 4) | as specified in Section 276(7) of the SFA; or |
| 5) | as specified in Regulation 32 of the Securities and Futures (Offers of Investments) (Shares and Debentures) Regulations 2005 of Singapore. |
218
Table of Contents
Index to Financial Statements
The validity of the shares of common stock being offered by this prospectus will be passed upon for us by Alston & Bird LLP. Latham & Watkins LLP, New York, New York is acting as counsel for the underwriters in connection with this offering.
The consolidated financial statements appearing in this Prospectus and Registration Statement for the years ended December 31, 2015, 2014 and 2013 have been audited by RSM US LLP, an independent registered public accounting firm, as stated in their report appearing elsewhere herein and are included in reliance upon such report and upon the authority of such firm as experts in accounting and auditing.
Where you can find more information
We have filed with the SEC a registration statement on Form S-1 under the Securities Act with respect to our common stock offered hereby. This prospectus, which constitutes part of the registration statement, does not contain all of the information set forth in the registration statement or the exhibits or schedules filed therewith. For further information about us and our common stock that we propose to sell in this offering, we refer you to the registration statement and the exhibits and schedules filed as a part of the registration statement. Statements contained in this prospectus as to the contents of any contract or any other document filed as an exhibit to the registration statement are not necessarily complete. If a contract or document has been filed as an exhibit to the registration statement, we refer you to the copy of the contract or document that has been filed as an exhibit to the registration statement.
Following the offering, we will become subject to the full informational requirements of the Exchange Act and will file periodic reports and other information with the SEC. We maintain an Internet site at www.firstbankonline.com. Information on, or accessible through, our website is not part of this prospectus.
You may also read and copy any document we file with the SEC at the SEC’s Public Reference Room at 100 F Street, N.E., Washington, D.C. 20549. You can also obtain copies of the documents upon the payment of a duplicating fee to the SEC. Please call the SEC at 1-800-SEC-0330 for further information on the operation of the Public Reference Room. The SEC maintains an Internet site that contains reports, proxy and information statements, and other information regarding issuers that file electronically with the SEC through the SEC’s Electronic Data Gathering, Analysis and Retrieval (EDGAR) system. This system can be accessed at www.sec.gov.
219
Table of Contents
Index to Financial Statements
Index to consolidated financial statements
| Page | ||||
| Interim condensed consolidated financial statements |
||||
| Condensed consolidated balance sheets (unaudited) as of June 30, 2016 and December 31, 2015 |
F-2 | |||
| F-3 | ||||
| F-4 | ||||
| F-5 | ||||
| F-6 | ||||
| Notes to condensed consolidated financial statements (unaudited) |
F-7 | |||
| 2015, 2014 and 2013 consolidated annual financial statements |
||||
| F-40 | ||||
| Consolidated balance sheets as of December 31, 2015, 2014 and 2013 |
F-41 | |||
| Consolidated statements of income for years ended December 31, 2015, 2014 and 2013 |
F-42 | |||
| Consolidated statements of comprehensive income for years ended December 31, 2015, 2014 and 2013 |
F-43 | |||
| F-44 | ||||
| Consolidated statements of cash flows for years ended December 31, 2015, 2014 and 2013 |
F-45 | |||
| Notes to 2015, 2014 and 2013 consolidated annual financial statements |
F-46 | |||
F-1
Table of Contents
Index to Financial Statements
FB Financial Corporation and subsidiaries
Condensed consolidated balance sheets
(Unaudited)
(Amounts are in thousands except share amounts)
| June 30, 2016 |
December 31, 2015 |
|||||||
| ASSETS |
||||||||
| Cash and due from banks |
$ | 52,122 | $ | 53,893 | ||||
| Federal funds sold |
13,415 | 21,628 | ||||||
| Interest bearing deposits in financial institutions |
23,382 | 22,202 | ||||||
|
|
|
|||||||
| Cash and cash equivalents |
88,919 | 97,723 | ||||||
| Investments: |
||||||||
| Available-for-sale securities, at fair value |
550,307 | 649,387 | ||||||
| Federal Home Loan Bank stock, at cost |
6,528 | 6,528 | ||||||
| Loans held for sale, at fair value |
322,249 | 273,196 | ||||||
| Loans |
1,750,304 | 1,701,863 | ||||||
| Less: allowance for loan losses |
23,734 | 24,460 | ||||||
|
|
|
|||||||
| Net loans |
1,726,570 | 1,677,403 | ||||||
| Premises and equipment, net |
65,686 | 65,892 | ||||||
| Foreclosed real estate, net |
9,902 | 11,641 | ||||||
| Interest receivable |
6,627 | 6,763 | ||||||
| Mortgage servicing rights, net |
40,382 | 29,711 | ||||||
| Goodwill |
46,867 | 46,904 | ||||||
| Core deposit intangible, net |
5,616 | 6,695 | ||||||
| Other assets |
48,305 | 27,577 | ||||||
|
|
|
|||||||
| Total assets |
$ | 2,917,958 | $ | 2,899,420 | ||||
|
|
|
|||||||
| LIABILITIES AND SHAREHOLDERS EQUITY |
||||||||
| Liabilities: |
||||||||
| Demand deposits |
||||||||
| Noninterest-bearing |
$ | 680,165 | $ | 626,955 | ||||
| Interest-bearing |
1,304,606 | 1,273,438 | ||||||
| Savings deposits |
129,944 | 212,522 | ||||||
| Time deposits |
399,582 | 325,559 | ||||||
|
|
|
|||||||
| Total deposits |
2,514,297 | 2,438,474 | ||||||
| Securities sold under agreements to repurchase |
29,278 | 105,133 | ||||||
| Short-term borrowings |
— | 18,000 | ||||||
| Long-term debt (see Note 12) |
55,785 | 56,616 | ||||||
| Accrued expenses and other liabilities |
52,830 | 44,523 | ||||||
|
|
|
|||||||
| Total liabilities |
2,652,190 | 2,662,746 | ||||||
| Shareholder’s equity: |
||||||||
| Common stock, $1 par value; 25,000,000 shares authorized; 17,180,000 shares issued and outstanding |
17,180 | 17,180 | ||||||
| Additional paid-in capital |
94,544 | 94,544 | ||||||
| Retained earnings |
143,567 | 122,493 | ||||||
| Accumulated other comprehensive income, net |
10,477 | 2,457 | ||||||
|
|
|
|||||||
| Total shareholder’s equity |
265,768 | 236,674 | ||||||
|
|
|
|||||||
| Total liabilities and shareholder’s equity |
$ | 2,917,958 | $ | 2,899,420 | ||||
|
|
||||||||
See accompanying notes to condensed consolidated financial statements (unaudited).
F-2
Table of Contents
Index to Financial Statements
FB Financial Corporation and subsidiaries
Condensed consolidated statements of income
(Unaudited)
(Amounts are in thousands except share amounts)
| Six Months
Ended June 30, |
||||||||
| 2016 |
2015 | |||||||
| Interest income: |
||||||||
| Interest and fees on loans |
$ | 51,190 | $ | 41,303 | ||||
| Interest on securities |
||||||||
| Taxable |
5,870 | 5,882 | ||||||
| Tax-exempt |
1,550 | 1,438 | ||||||
| Other |
312 | 223 | ||||||
|
|
|
|||||||
| Total interest income |
58,922 | 48,846 | ||||||
|
|
|
|||||||
| Interest expense: |
||||||||
| Deposits |
||||||||
| Demand and savings accounts |
2,686 | 2,218 | ||||||
| Time deposits |
803 | 889 | ||||||
| Short-term borrowings |
88 | 329 | ||||||
| Long-term debt |
1,044 | 969 | ||||||
|
|
|
|||||||
| Total interest expense |
4,621 | 4,405 | ||||||
|
|
|
|||||||
| Net interest income |
54,301 | 44,441 | ||||||
| Provision for loan losses |
(798 | ) | 222 | |||||
|
|
|
|||||||
| Net interest income after provision for loan losses |
55,099 | 44,219 | ||||||
| Noninterest income: |
||||||||
| Mortgage banking income |
54,636 | 31,287 | ||||||
| Service charges on deposit accounts |
4,259 | 3,364 | ||||||
| ATM and interchange fees |
3,942 | 2,938 | ||||||
| Investment services income |
1,651 | 1,664 | ||||||
| Gain on sale of securities |
3,991 | 1,795 | ||||||
| (Loss) gain on sales or write-downs of foreclosed assets |
(142 | ) | 62 | |||||
| Gain (loss) on other assets |
702 | (385 | ) | |||||
| Other income |
352 | 498 | ||||||
|
|
|
|||||||
| Total noninterest income |
69,391 | 41,223 | ||||||
| Noninterest expenses: |
||||||||
| Salaries, commissions and employee benefits |
50,610 | 38,960 | ||||||
| Occupancy and equipment expense |
6,396 | 5,151 | ||||||
| Legal and professional fees |
1,888 | 1,142 | ||||||
| Data processing |
1,330 | 1,009 | ||||||
| Merger and conversion |
2,146 | 287 | ||||||
| Amortization of core deposit intangibles |
1,079 | 806 | ||||||
| Amortization of mortgage servicing rights |
3,425 | 779 | ||||||
| Impairment of mortgage servicing rights |
5,687 | — | ||||||
| Regulatory fees and deposit insurance assessments |
1,016 | 915 | ||||||
| Software license and maintenance fees |
1,858 | 851 | ||||||
| Advertising |
5,851 | 3,374 | ||||||
| Other expense |
10,656 | 7,759 | ||||||
|
|
|
|||||||
| Total noninterest expense |
91,942 | 61,033 | ||||||
|
|
|
|||||||
| Net income before income taxes |
32,548 | 24,409 | ||||||
| State income tax expense |
2,174 | 1,649 | ||||||
|
|
|
|||||||
| Net income |
$ | 30,374 | $ | 22,760 | ||||
|
|
|
|||||||
| Weighted average common shares outstanding: |
||||||||
| Basic |
17,180,000 | 17,180,000 | ||||||
| Fully diluted |
17,180,000 | 17,180,000 | ||||||
| Earnings per share |
||||||||
| Basic |
$ | 1.77 | $ | 1.32 | ||||
| Fully diluted |
$ | 1.77 | $ | 1.32 | ||||
|
|
||||||||
See accompanying notes to condensed consolidated financial statements (unaudited).
F-3
Table of Contents
Index to Financial Statements
FB Financial Corporation and subsidiaries
Condensed consolidated statements of comprehensive income
(Unaudited)
(Amounts are in thousands except share amounts)
| Six Months Ended June 30, |
||||||||
| 2016 | 2015 | |||||||
| Net income |
$ | 30,374 | $ | 22,760 | ||||
| Other comprehensive income, net of tax: |
||||||||
| Net change in unrealized gain in available-for-sale securities, net of tax expense of $764 and $45 |
11,770 | 700 | ||||||
| Reclassification adjustment for gain on sale of securities included in net income, net of tax expense of $241 and $114 |
(3,750 | ) | (1,681 | ) | ||||
|
|
|
|||||||
| Comprehensive income |
$ | 38,394 | $ | 21,779 | ||||
|
|
||||||||
See accompanying notes to condensed consolidated financial statements (unaudited).
F-4
Table of Contents
Index to Financial Statements
FB Financial Corporation and subsidiaries
Condensed consolidated statements of changes in shareholder’s equity
(Unaudited)
(Amounts are in thousands except share amounts)
| Common stock |
Additional paid-in capital |
Retained earnings |
Accumulated other comprehensive income, net |
Total shareholder’s equity |
||||||||||||||||
| Balance at December 31, 2014 |
$ | 17,180 | $ | 94,544 | $ | 98,237 | $ | 5,267 | $ | 215,228 | ||||||||||
| Net income |
— | — | 22,760 | — | 22,760 | |||||||||||||||
| Other comprehensive income, net of taxes |
— | — | — | (981 | ) | (981 | ) | |||||||||||||
| Cash dividends paid ($0.60 per share) |
— | — | (10,400 | ) | — | (10,400 | ) | |||||||||||||
|
|
|
|||||||||||||||||||
| Balance at June 30, 2015 |
$ | 17,180 | $ | 94,544 | $ | 110,597 | $ | 4,286 | $ | 226,607 | ||||||||||
|
|
|
|||||||||||||||||||
| Balance December 31, 2015 |
$ | 17,180 | $ | 94,544 | $ | 122,493 | $ | 2,457 | $ | 236,674 | ||||||||||
| Net income |
— | — | 30,374 | — | 30,374 | |||||||||||||||
| Other comprehensive income, net of taxes |
— | — | — | 8,020 | 8,020 | |||||||||||||||
| Cash dividends paid ($0.54 per share) |
— | — | (9,300 | ) | — | (9,300 | ) | |||||||||||||
|
|
|
|||||||||||||||||||
| Balance June 30, 2016 |
$ | 17,180 | $ | 94,544 | $ | 143,567 | $ | 10,477 | $ | 265,768 | ||||||||||
|
|
||||||||||||||||||||
See accompanying notes to condensed consolidated financial statements (unaudited).
F-5
Table of Contents
Index to Financial Statements
FB Financial Corporation and subsidiaries
Condensed consolidated statements of cash flows
(Unaudited)
(Amounts are in thousands except share amounts)
| Six Months Ended
June 30, |
||||||||
| 2016 | 2015 | |||||||
| Cash flows from Operating activities: |
||||||||
| Net income |
$ | 30,374 | $ | 22,760 | ||||
| Adjustments to reconcile net income to net cash provided by operating activities: |
||||||||
| Depreciation expense |
2,022 | 1,562 | ||||||
| Amortization of core deposit intangibles |
1,079 | 806 | ||||||
| Capitalization of mortgage servicing rights |
(19,783 | ) | (11,108 | ) | ||||
| Amortization of mortgage servicing rights |
3,425 | 779 | ||||||
| Impairment of mortgage servicing rights |
5,687 | — | ||||||
| Provision for loan losses |
(798 | ) | 222 | |||||
| Provision for mortgage loan repurchases |
703 | 629 | ||||||
| Accretion of yield on purchased loans |
(2,381 | ) | — | |||||
| Accretion of discounts and amortization of premiums on securities, net |
761 | 722 | ||||||
| Gain on sales of securities |
(3,991 | ) | (1,795 | ) | ||||
| Origination of loans held for sale |
(1,762,143 | ) | (1,278,004 | ) | ||||
| Proceeds from sale of loans held for sale |
1,754,155 | 1,262,945 | ||||||
| Gain on sale and change in fair value of loans held for sale |
(44,594 | ) | (31,098 | ) | ||||
| Net loss (gain) on sales or write-downs of foreclosed assets |
142 | (62 | ) | |||||
| Gain on other assets |
(702 | ) | 385 | |||||
| Changes in: |
||||||||
| Other assets and interest receivable |
(21,333 | ) | (4,104 | ) | ||||
| Accrued expenses and other liabilities |
8,883 | 7,627 | ||||||
|
|
|
|||||||
| Net cash used in operating activities |
(48,494 | ) | (27,734 | ) | ||||
| Cash flows from investing activities: |
||||||||
| Activity in available-for-sale securities: |
||||||||
| Sales |
268,995 | 111,355 | ||||||
| Maturities, prepayments and calls |
44,172 | 52,081 | ||||||
| Purchases |
(202,762 | ) | (83,801 | ) | ||||
| Net increase in loans |
(43,551 | ) | (89,992 | ) | ||||
| Purchases of premises and equipment |
(2,515 | ) | (1,947 | ) | ||||
| Proceeds from the sale of foreclosed assets |
3,514 | 1,758 | ||||||
| Proceeds from the sale of premises and equipment |
— | 11 | ||||||
|
|
|
|||||||
| Net cash provided by (used in) investing activities |
67,853 | (10,535 | ) | |||||
| Cash flows from financing activities: |
||||||||
| Net increase in demand and savings deposits |
1,800 | 126,574 | ||||||
| Net increase (decrease) in time deposits |
74,023 | (23,638 | ) | |||||
| Net decrease in securities sold under agreements to repurchase |
(75,855 | ) | (9,826 | ) | ||||
| Decrease in short-term borrowings |
(18,000 | ) | (1,000 | ) | ||||
| Payments on long-term debt |
(831 | ) | (6,862 | ) | ||||
| Dividends paid |
(9,300 | ) | (10,400 | ) | ||||
|
|
|
|||||||
| Net cash (used in) provided by financing activities |
(28,163 | ) | 74,848 | |||||
|
|
|
|||||||
| Net change in cash and cash equivalents |
(8,804 | ) | 36,579 | |||||
| Cash and cash equivalents at beginning of the period |
97,723 | 49,954 | ||||||
|
|
|
|||||||
| Cash and cash equivalents at end of the period |
$ | 88,919 | $ | 86,533 | ||||
|
|
|
|||||||
| Supplemental cash flow information |
||||||||
| Interest paid |
$ | 4,680 | $ | 4,454 | ||||
| Taxes paid |
1,307 | 1,338 | ||||||
| Supplemental noncash disclosures: |
||||||||
| Transfers from loans to foreclosed real estate |
$ | 2,176 | $ | 1,227 | ||||
| Transfers from foreclosed real estate to loans |
259 | 591 | ||||||
| Transfers from loans held for sale to loans |
3,529 | 2,602 | ||||||
|
|
||||||||
See accompanying notes to condensed consolidated financial statements (unaudited).
F-6
Table of Contents
Index to Financial Statements
FB Financial Corporation and subsidiaries
Notes to condensed consolidated financial statements
(Unaudited)
Note (1)—Basis of presentation:
The condensed consolidated financial statements, including the notes thereto of FB Financial Corporation (the Company), formerly First South Bancorp, Inc. until the Company name was changed in 2016, have been prepared in accordance with generally accepted accounting principles (GAAP) interim reporting requirements, and therefore do not include all information and notes included in the annual consolidated financial statements in conformity with GAAP. These interim condensed consolidated financial statements and notes thereto should be read in conjunction with the Company’s audited consolidated financial statements and accompanying notes included elsewhere in this prospectus. The Company’s principal business activity is banking, conducted through its wholly owned subsidiary, FirstBank (the Bank).
The unaudited condensed consolidated financial statements include all adjustments, consisting of normal recurring adjustments, necessary for a fair presentation of the results for the interim periods. The results for interim periods are not necessarily indicative of results for a full year.
The accompanying consolidated financial statements have been prepared in conformity with accounting principles generally accepted in the United States of America and general banking industry. In preparing the financial statements, management is required to make estimates and assumptions that affect the reported amounts of assets and liabilities as of the date of the balance sheet and the reported results of operations for the periods then ended.
Actual results could differ significantly from those estimates. Material estimates that are particularly susceptible to significant changes in the near term relate to the determination of the allowance for loan losses, the valuation of real estate acquired in connection with foreclosures or in satisfaction of loans, and the determination of the fair value of financial instruments, including investment securities, derivatives and mortgage servicing rights. In connection with the determination of the estimated fair value of foreclosed real estate and impaired loans, management obtains independent appraisals for significant properties.
On June 28, 2016 the Company declared a 100-for-1 stock split, increasing the number of issued and authorized shares from 171,800 to 17,180,000 and 250,000 to 25,000,000, respectively. Additional shares issued as a result of the stock split were distributed immediately upon issuance to the shareholder. Share and per share amounts included in the consolidated financial statements and notes thereto reflect the effect of the split for all periods presented.
Subsequent to June 30, 2016, the Company increased the number of authorized shares from 25,000,000 to 75,000,000 effective July 29, 2016.
Certain prior period amounts have been reclassified to conform to the current period presentation without any impact on the reported amounts of net income or shareholder’s equity.
Except as set forth below, there are currently no new accounting standards that have been issued that will have a significant impact on the Company’s financial position, results of operations or cash flows upon adoption that were not disclosed in the Company’s 2015 audited financial statements.
In June 2016, the FASB issued ASU 2016-13- “Financial Instruments- Credit Losses (Topic 326): Measurement of Credit Losses on Financial Instruments.” The update amends guidance on reporting credit losses for assets held at amortized cost basis and available for sale securities. For assets held at amortized cost basis, this update
F-7
Table of Contents
Index to Financial Statements
FB Financial Corporation and subsidiaries
Notes to condensed consolidated financial statements
(Unaudited)
eliminates the probable initial recognition threshold in current GAAP and instead, requires an entity to reflect it’s current estimate of all expected credit losses. For available for sale securities, credit losses should be measured in a manner similar to current GAAP, however Topic 326 will allow credit losses to be presented as an allowance rather than as a write-down. The provisions of this update are expected to become effective for fiscal years beginning after December 15, 2019. Management is currently evaluating the potential impact of this update.
Note (2)—Acquisition of Northwest Georgia Bank
On September 18, 2015, the Bank completed its acquisition of Northwest Georgia Bank (NWGB), a bank headquartered in Ringgold, Georgia, pursuant to that certain Agreement and Plan of Merger dated April 27, 2015 by and between the Bank and NWGB. Pursuant to the Agreement and Plan of Merger, NWGB was merged with and into the Bank, with the Bank as the surviving entity. Prior to the acquisition, NWGB operated six banking locations in Georgia and Tennessee. The acquisition of NWGB allowed the Company to further its strategic initiatives by expanding its geographic footprint into certain markets of Georgia and Tennessee. The Company acquired NWGB in a $1,500 cash purchase.
The Company recorded a bargain purchase gain of $2,794 and a core deposit intangible asset of $4,931. The fair value of the core deposit intangible is being amortized on a straight-line basis over the estimated useful life, currently expected to be approximately 10 years.
For income tax purposes, the acquisition of NWGB was treated as an asset purchase. As an asset purchase for income tax purposes, the carrying value of assets and liabilities for NWGB are the same for both financial reporting and income tax purposes; therefore, no deferred taxes were recorded at the date of acquisition except for $191 deferred tax liability recorded for the bargain purchase gain. Additionally, this treatment allows for the deductibility for income tax purposes of the core deposit intangible recorded for the NWGB merger over 15 years, net of the bargain purchase gain.
In connection with the transaction, the Company incurred $2,146 and $287 in merger and conversion expenses during the six months ended June 30, 2016 and 2015, respectively.
F-8
Table of Contents
Index to Financial Statements
FB Financial Corporation and subsidiaries
Notes to condensed consolidated financial statements
(Unaudited)
The following table summarizes the final allocation of purchase price to assets and liabilities acquired in connection with the merger with NWGB based on estimated fair value on September 18, 2015.
| (Dollar amounts in thousands) | ||||||||
| Final Allocation of Purchase Price for Northwest Georgia Bank: |
||||||||
| Total cash purchase price |
$ | 1,500 | ||||||
| Net assets acquired: |
||||||||
| Stockholders’ equity at September 18, 2015 |
$ | 6,478 | ||||||
| Increase (decrease) to net assets as a result of fair value adjustments to assets acquired and liabilities assumed: |
||||||||
| Securities |
535 | |||||||
| Loans, net of the reversal of NWGB’s allowance for loan losses of $4,383 |
(8,024 | ) | ||||||
| Premises and equipment |
3,731 | |||||||
| Core deposits intangible |
4,931 | |||||||
| Foreclosed real estate |
(1,922 | ) | ||||||
| Other assets |
(264 | ) | ||||||
| Deposits |
(302 | ) | ||||||
| FHLB funds purchased |
(378 | ) | ||||||
| Other liabilities |
(491 | ) | ||||||
|
|
|
|||||||
| Total net fair value adjustments |
4,294 | |||||||
|
|
|
|||||||
| Bargain purchase gain |
$ | 2,794 | ||||||
|
|
||||||||
| (1) | The bargain purchase gain resulting from the merger has been recognized in the Community Banking operating segment during the three months ended September 30, 2015. |
The following table summarizes the estimated fair value of assets acquired and liabilities assumed at acquisition date in connection with the merger with NWGB.
| Cash and cash equivalents |
$ | 25,495 | ||
| Securities available-for-sale |
134,278 | |||
| Loans |
78,565 | |||
| Premises and equipment |
15,343 | |||
| Intangible assets |
4,931 | |||
| Foreclosed real estate |
5,002 | |||
| Other assets |
8,735 | |||
|
|
|
|||
| Total Assets |
$ | 272,349 | ||
|
|
|
|||
| Deposits |
$ | 246,216 | ||
| Borrowings |
20,378 | |||
| Other liabilities |
1,461 | |||
|
|
|
|||
| Total Liabilities |
$ | 268,055 | ||
|
|
|
|||
| Purchase price |
1,500 | |||
|
|
|
|||
| Bargain purchase gain |
$ | 2,794 | ||
|
|
||||
F-9
Table of Contents
Index to Financial Statements
FB Financial Corporation and subsidiaries
Notes to condensed consolidated financial statements
(Unaudited)
The Company finalized purchase accounting surrounding the NWGB acquisition and closed the measurement period as of December 31, 2015. The Company also elected to early adopt ASU 2015-16, “Simplifying the Accounting for Measurement Period Adjustments” as of December 31, 2015.
The following table presents the fair value of loans acquired from NWGB as of the September 18, 2015 acquisition date:
| September 18, 2015 |
||||
| Contractually-required principal and interest |
$ | 91,079 | ||
| Nonaccretable difference |
(8,578 | ) | ||
|
|
|
|||
| Cash flows expected to be collected |
82,501 | |||
| Accretable yield |
(3,936 | ) | ||
|
|
|
|||
| Fair value |
$ | 78,565 | ||
|
|
||||
The following unaudited pro forma combined condensed consolidated financial information presents the results of operations for the six months ended June 30, 2015 of the Company as though the merger with NWGB had been completed as of January 1, 2014. The unaudited estimated pro forma information combines the historical results of NWGB with the Company’s historical consolidated results and includes certain adjustments reflecting the estimated impact of certain fair value adjustments for the periods presented. The pro forma information is not indicative of what would have occurred had the acquisition taken place on January 1, 2014. The pro forma information does not include the effect of any cost-saving or revenue-enhancing strategies.
| Six Months ended June 30, 2015 |
||||
| Interest income |
$ | 53,186 | ||
| Interest expense |
4,914 | |||
|
|
|
|||
| Net interest income |
48,272 | |||
| Provision for loan losses |
222 | |||
| Noninterest income |
42,936 | |||
| Noninterest expense |
67,792 | |||
|
|
|
|||
| Income before income taxes |
23,194 | |||
| Income taxes |
1,567 | |||
|
|
|
|||
| Net income |
$ | 21,627 | ||
| Earnings per share |
||||
| Basic |
$ | 1.26 | ||
| Diluted |
$ | 1.26 | ||
|
|
||||
F-10
Table of Contents
Index to Financial Statements
FB Financial Corporation and subsidiaries
Notes to condensed consolidated financial statements
(Unaudited)
Note (3)—Investment securities:
The amortized cost of securities and their fair values at June 30, 2016 and December 31, 2015 are shown below (in thousands):
| June 30, 2016 | ||||||||||||||||
| Amortized cost |
Gross unrealized gains |
Gross unrealized losses |
Fair Value |
|||||||||||||
| Securities Available-for-Sale |
||||||||||||||||
| Debt securities |
||||||||||||||||
| U.S. government agency securities |
$ | 15,504 | $ | 6 | $ | — | $ | 15,510 | ||||||||
| Mortgage-backed securities—residential |
419,890 | 5,522 | (101 | ) | 425,311 | |||||||||||
| Municipals, tax exempt |
90,192 | 5,813 | (4 | ) | 96,001 | |||||||||||
| Treasury securities |
4,506 | 7 | — | 4,513 | ||||||||||||
|
|
|
|||||||||||||||
| Total debt securities |
530,092 | 11,348 | (105 | ) | 541,335 | |||||||||||
| Equity securities |
9,010 | 33 | (71 | ) | 8,972 | |||||||||||
|
|
|
|||||||||||||||
| Total securities available-for-sale |
$ | 539,102 | $ | 11,381 | $ | (176 | ) | $ | 550,307 | |||||||
|
|
||||||||||||||||
| December 31, 2015 | ||||||||||||||||
| Amortized cost |
Gross unrealized gains |
Gross unrealized losses |
Fair Value |
|||||||||||||
| Securities Available-for-Sale |
||||||||||||||||
| Debt securities |
||||||||||||||||
| U.S. government agency securities |
$ | 34,161 | $ | — | $ | (353 | ) | $ | 33,808 | |||||||
| Mortgage-backed securities—residential |
524,141 | 3,675 | (5,443 | ) | 522,373 | |||||||||||
| Municipals, tax exempt |
74,945 | 4,892 | — | 79,837 | ||||||||||||
| Treasury securities |
4,507 | — | (22 | ) | 4,485 | |||||||||||
|
|
|
|||||||||||||||
| Total debt securities |
637,754 | 8,567 | (5,818 | ) | 640,503 | |||||||||||
| Equity securities |
8,971 | 3 | (90 | ) | 8,884 | |||||||||||
|
|
|
|||||||||||||||
| Total securities available-for-sale |
$ | 646,725 | $ | 8,570 | $ | (5,908 | ) | $ | 649,387 | |||||||
|
|
||||||||||||||||
F-11
Table of Contents
Index to Financial Statements
FB Financial Corporation and subsidiaries
Notes to condensed consolidated financial statements
(Unaudited)
The amortized cost and fair value of debt securities by contractual maturity at June 30, 2016 and December 31, 2015 are shown below (in thousands). Maturities may differ from contractual maturities in mortgage-backed securities because the mortgage underlying the security may be called or repaid without any penalties. Therefore, mortgage-backed securities are not included in the maturity categories in the following maturity summary.
| June 30, 2016 | December 31, 2015 | |||||||||||||||
| Available-for-sale | Available-for-sale | |||||||||||||||
| Amortized cost |
Fair value |
Amortized cost |
Fair value |
|||||||||||||
| Due in one year or less |
$ | 9,010 | $ | 9,018 | $ | 6,849 | $ | 6,886 | ||||||||
| Due in one to five |
15,937 | 16,079 | 44,108 | 44,358 | ||||||||||||
| Due in five to ten years |
35,411 | 37,976 | 29,964 | 31,927 | ||||||||||||
| Due in over ten years |
49,844 | 52,951 | 32,692 | 34,959 | ||||||||||||
|
|
|
|||||||||||||||
| 110,202 | 116,024 | 113,613 | 118,130 | |||||||||||||
| Mortgage-backed securities—residential |
419,890 | 425,311 | 524,141 | 522,373 | ||||||||||||
|
|
|
|||||||||||||||
| $ | 530,092 | $ | 541,335 | $ | 637,754 | $ | 640,503 | |||||||||
|
|
||||||||||||||||
Sales of available-for-sale securities were as follows (in thousands):
| Six Months Ended June 30, |
||||||||
| 2016 | 2015 | |||||||
| Proceeds from sales |
$ | 268,995 | $ | 111,355 | ||||
| Gross realized gains |
4,339 | 1,795 | ||||||
| Gross realized losses |
348 | — | ||||||
|
|
||||||||
The following tables show gross unrealized losses at period end June 30, 2016 and December 31, 2015, aggregated by investment category and length of time that individual securities have been in a continuous unrealized loss position (in thousands):
| June 30, 2016 | ||||||||||||||||||||||||
| Less than 12 months | 12 months or more | Total | ||||||||||||||||||||||
| Fair Value |
Unrealized Loss |
Fair Value |
Unrealized Loss |
Fair Value |
Unrealized loss |
|||||||||||||||||||
| U.S. government agency securities |
$ | — | $ | — | $ | — | $ | — | $ | — | $ | — | ||||||||||||
| Mortgage-backed securities—residential |
— | — | 21,377 | 101 | 21,377 | 101 | ||||||||||||||||||
| Municipals, tax exempt |
766 | 4 | — | — | 766 | 4 | ||||||||||||||||||
| Treasury securities |
— | — | — | — | — | — | ||||||||||||||||||
|
|
|
|||||||||||||||||||||||
| Total debt securities |
766 | 4 | 21,377 | 101 | 22,143 | 105 | ||||||||||||||||||
| Equity securities |
— | — | 1,535 | 71 | 1,535 | 71 | ||||||||||||||||||
|
|
|
|||||||||||||||||||||||
| $ | 766 | $ | 4 | $ | 22,912 | $ | 172 | $ | 23,678 | $ | 176 | |||||||||||||
|
|
||||||||||||||||||||||||
F-12
Table of Contents
Index to Financial Statements
FB Financial Corporation and subsidiaries
Notes to condensed consolidated financial statements
(Unaudited)
| December 31, 2015 | ||||||||||||||||||||||||
| Less than 12 months | 12 months or more | Total | ||||||||||||||||||||||
| Fair Value |
Unrealized Loss |
Fair Value |
Unrealized Loss |
Fair Value |
Unrealized loss |
|||||||||||||||||||
| U.S. government agency securities |
$ | 15,887 | $ | 124 | $ | 17,921 | $ | 229 | $ | 33,808 | $ | 353 | ||||||||||||
| Mortgage-backed securities—residential |
219,756 | 1,778 | 121,362 | 3,665 | 341,118 | 5,443 | ||||||||||||||||||
| Municipals, tax exempt |
4,485 | 22 | — | — | 4,485 | 22 | ||||||||||||||||||
|
|
|
|||||||||||||||||||||||
| Total debt securities |
240,128 | 1,924 | 139,283 | 3,894 | 379,411 | 5,818 | ||||||||||||||||||
| Equity securities |
— | — | 1,583 | 90 | 1,583 | 90 | ||||||||||||||||||
|
|
|
|||||||||||||||||||||||
| $ | 240,128 | $ | 1,924 | $ | 140,866 | $ | 3,984 | $ | 380,994 | $ | 5,908 | |||||||||||||
|
|
||||||||||||||||||||||||
As of June 30, 2016 and December 31, 2015, the Company’s securities portfolio consisted of 283 and 274 securities, 8 and 64 of which were in an unrealized loss position, respectively.
The Company evaluates securities with unrealized losses for other-than-temporary impairment (OTTI), and the Company recorded no OTTI for the six months ended June 30, 2016 and 2015. For debt securities, the Company currently does not intend to sell those investments with unrealized losses, and it is unlikely that the Company will be required to sell the investments before recovery of their amortized cost bases, which may be maturity. For equity securities, the Company has evaluated the near-term prospects of the investment in relation to the severity and duration of the impairment and based on that evaluation has the ability and intent to hold these investments until a recovery of fair value.
Note (4)—Loans and allowance for loan losses:
Loans outstanding at June 30, 2016 and December 31, 2015, by major lending classification are as follows (in thousands):
| June 30, 2016 |
December 31, 2015 |
|||||||
| Commercial and industrial |
$ | 355,558 | $ | 317,038 | ||||
| Construction |
210,029 | 231,025 | ||||||
| Residential real estate: |
||||||||
| 1-to-4 family mortgage |
286,335 | 287,749 | ||||||
| Residential line of credit |
174,523 | 171,526 | ||||||
| Multi-family mortgage |
41,005 | 59,510 | ||||||
| Commercial real estate: |
||||||||
| Owner occupied |
345,999 | 330,207 | ||||||
| Non-owner occupied |
263,893 | 237,222 | ||||||
| Consumer and other |
72,962 | 67,586 | ||||||
|
|
|
|||||||
| Gross loans |
1,750,304 | 1,701,863 | ||||||
| Less: Allowance for loan losses |
(23,734 | ) | (24,460 | ) | ||||
|
|
|
|||||||
| Net loans |
$ | 1,726,570 | $ | 1,677,403 | ||||
|
|
||||||||
F-13
Table of Contents
Index to Financial Statements
FB Financial Corporation and subsidiaries
Notes to condensed consolidated financial statements
(Unaudited)
Nonperforming loans include loans that are no longer accruing interest (non-accrual loans) and loans past due ninety or more days and still accruing interest. Nonperforming loans and impaired loans are defined differently. Some loans may be included in both categories, whereas other loans may only be included in one category.
As of June 30, 2016 and December 31, 2015, $29,208 and $26,089, respectively, of 1-to-4 family mortgage loans were pledged to the Federal Home Loan Bank of Cincinnati securing advances against the Bank’s line. As of June 30, 2016 and December 31, 2015, $49,025 and $43,825, respectively, of multi-family mortgage loans were pledged to the Federal Home Loan Bank of Cincinnati securing advances against the Bank’s line.
The following provides the allowance for loan losses by portfolio segment and the related investment in loans net of unearned interest for the six months ended June 30, 2016 and 2015 (in thousands):
| Commercial and industrial |
Construction | 1-to-4 family residential mortgage |
Residential line of credit |
Multi- family residential mortgage |
Commercial real estate owner occupied |
Commercial real estate non-owner occupied |
Consumer and other |
Total | ||||||||||||||||||||||||||||
| Beginning balance—December 31, 2015 |
$ | 5,288 | $ | 5,030 | $ | 4,126 | $ | 2,178 | $ | 311 | $ | 4,034 | $ | 2,610 | $ | 883 | $ | 24,460 | ||||||||||||||||||
| Provision for loan losses |
489 | (867 | ) | (625 | ) | (288 | ) | 137 | (280 | ) | 137 | 499 | (798 | ) | ||||||||||||||||||||||
| Recoveries of loans previously charged-off |
472 | 105 | 107 | 107 | — | 11 | 5 | 171 | 978 | |||||||||||||||||||||||||||
| Loans charged off |
(198 | ) | (2 | ) | (53 | ) | (75 | ) | — | (93 | ) | — | (485 | ) | (906 | ) | ||||||||||||||||||||
|
|
|
|||||||||||||||||||||||||||||||||||
| Balance—June 30, 2016 |
$ | 6,051 | $ | 4,266 | $ | 3,555 | $ | 1,922 | $ | 448 | $ | 3,672 | $ | 2,752 | $ | 1,068 | $ | 23,734 | ||||||||||||||||||
|
|
|
|||||||||||||||||||||||||||||||||||
| Beginning balance—December 31, 2014 |
$ | 6,600 | $ | 3,721 | $ | 6,364 | $ | 2,790 | $ | 184 | $ | 6,075 | $ | 2,641 | $ | 655 | $ | 29,030 | ||||||||||||||||||
| Provision for loan losses |
(1,067 | ) | 420 | (1,030 | ) | 698 | 128 | 1,024 | (350 | ) | 399 | 222 | ||||||||||||||||||||||||
| Recoveries of loans previously charged-off |
32 | 110 | 35 | 104 | — | 13 | 3 | 256 | 553 | |||||||||||||||||||||||||||
| Loans charged off |
(143 | ) | — | (163 | ) | — | — | — | — | (469 | ) | (775 | ) | |||||||||||||||||||||||
|
|
|
|||||||||||||||||||||||||||||||||||
| Balance—June 30, 2015 |
$ | 5,422 | $ | 4,251 | $ | 5,206 | $ | 3,592 | $ | 312 | $ | 7,112 | $ | 2,294 | $ | 841 | $ | 29,030 | ||||||||||||||||||
|
|
||||||||||||||||||||||||||||||||||||
The following table provides the allocation of the allowance for loan losses by loan category broken out between loans individually evaluated for impairment and loans collectively evaluated for impairment as of June 30, 2016 and December 31, 2015 (in thousands):
| June 30, 2016 | ||||||||||||||||||||||||||||||||||||
| Commercial and industrial |
Construction | 1-to-4 family residential mortgage |
Residential line of credit |
Multi- family residential mortgage |
Commercial real estate owner occupied |
Commercial real estate non-owner occupied |
Consumer and other |
Total | ||||||||||||||||||||||||||||
| Amount of allowance allocated to: |
||||||||||||||||||||||||||||||||||||
| Individually evaluated for impairment |
$ | 200 | $ | — | $ | 72 | $ | 140 | $ | — | $ | 101 | $ | 881 | $ | — | $ | 1,394 | ||||||||||||||||||
| Collectively evaluated for impairment |
5,851 | 4,266 | 3,483 | 1,782 | 448 | 3,571 | 1,871 | 1,068 | 22,340 | |||||||||||||||||||||||||||
|
|
|
|||||||||||||||||||||||||||||||||||
| Ending balance—June 30, 2016 |
$ | 6,051 | $ | 4,266 | $ | 3,555 | $ | 1,922 | $ | 448 | $ | 3,672 | $ | 2,752 | $ | 1,068 | $ | 23,734 | ||||||||||||||||||
|
|
||||||||||||||||||||||||||||||||||||
F-14
Table of Contents
Index to Financial Statements
FB Financial Corporation and subsidiaries
Notes to condensed consolidated financial statements
(Unaudited)
| December 31, 2015 | ||||||||||||||||||||||||||||||||||||
| Commercial and industrial |
Construction | 1-to-4 family residential mortgage |
Residential line of credit |
Multi- family residential mortgage |
Commercial real estate owner occupied |
Commercial real estate non-owner occupied |
Consumer and other |
Total | ||||||||||||||||||||||||||||
| Year-end amount of allowance allocated to: |
||||||||||||||||||||||||||||||||||||
| Individually evaluated for impairment |
$ | 89 | $ | 5 | $ | 66 | $ | — | $ | — | $ | 38 | $ | 775 | $ | — | $ | 973 | ||||||||||||||||||
| Collectively evaluated for impairment |
5,199 | 5,025 | 4,060 | 2,178 | 311 | 3,996 | 1,835 | 883 | 23,487 | |||||||||||||||||||||||||||
|
|
|
|||||||||||||||||||||||||||||||||||
| Ending balance— December 31, 2015 |
$ | 5,288 | $ | 5,030 | $ | 4,126 | $ | 2,178 | $ | 311 | $ | 4,034 | $ | 2,610 | $ | 883 | $ | 24,460 | ||||||||||||||||||
|
|
||||||||||||||||||||||||||||||||||||
The following table provides the amount of loans by loan category broken between loans individually evaluated for impairment and loans collectively evaluated for impairment as of June 30, 2016 and December 31, 2015 (in thousands):
| June 30, 2016 | ||||||||||||||||||||||||||||||||||||
| Commercial and industrial |
Construction | 1-to-4 family residential mortgage |
Residential line of credit |
Multi- family residential mortgage |
Commercial real estate owner occupied |
Commercial real estate non-owner occupied |
Consumer and other |
Total | ||||||||||||||||||||||||||||
| Loans, net of unearned income |
||||||||||||||||||||||||||||||||||||
| Individually evaluated for impairment |
$ | 1,580 | $ | 2,793 | $ | 4,066 | $ | 320 | $ | 1,045 | $ | 2,001 | $ | 3,953 | $ | — | $ | 15,758 | ||||||||||||||||||
| Collectively evaluated for impairment |
353,392 | 202,187 | 279,867 | 174,203 | 39,928 | 340,075 | 254,346 | 72,958 | 1,716,956 | |||||||||||||||||||||||||||
| Acquired with deteriorated credit quality |
586 | 5,049 | 2,402 | — | 32 | 3,923 | 5,594 | 4 | 17,590 | |||||||||||||||||||||||||||
|
|
|
|||||||||||||||||||||||||||||||||||
| Ending balance—June 30, 2016 |
$ | 355,558 | $ | 210,029 | $ | 286,335 | $ | 174,523 | $ | 41,005 | $ | 345,999 | $ | 263,893 | $ | 72,962 | $ | 1,750,304 | ||||||||||||||||||
|
|
||||||||||||||||||||||||||||||||||||
| December 31, 2015 | ||||||||||||||||||||||||||||||||||||
| Commercial and industrial |
Construction | 1-to-4 family residential mortgage |
Residential line of credit |
Multi- family residential mortgage |
Commercial real estate owner occupied |
Commercial real estate non-owner occupied |
Consumer and other |
Total | ||||||||||||||||||||||||||||
| Loans, net of unearned income |
||||||||||||||||||||||||||||||||||||
| Individually evaluated for impairment |
$ | 1,499 | $ | 2,866 | $ | 3,686 | $ | — | $ | 1,074 | $ | 2,425 | $ | 4,026 | $ | — | $ | 15,576 | ||||||||||||||||||
| Collectively evaluated for impairment |
314,665 | 221,300 | 281,235 | 171,526 | 58,400 | 322,999 | 227,205 | 67,582 | 1,664,912 | |||||||||||||||||||||||||||
| Acquired with deteriorated credit quality |
874 | 6,859 | 2,828 | — | 36 | 4,783 | 5,991 | 4 | 21,375 | |||||||||||||||||||||||||||
|
|
|
|||||||||||||||||||||||||||||||||||
| Ending balance- December 31, 2015 |
$ | 317,038 | $ | 231,025 | $ | 287,749 | $ | 171,526 | $ | 59,510 | $ | 330,207 | $ | 237,222 | $ | 67,586 | $ | 1,701,863 | ||||||||||||||||||
|
|
||||||||||||||||||||||||||||||||||||
F-15
Table of Contents
Index to Financial Statements
FB Financial Corporation and subsidiaries
Notes to condensed consolidated financial statements
(Unaudited)
The Company categorizes loans into risk categories based on relevant information about the ability of borrowers to service their debt such as: current financial information, historical payment experience, credit documentation, public information, and current economic trends, among other factors. The Company analyzes loans individually by classifying the loans as to credit risk. The Company uses the following definitions for risk ratings:
Watch. Loans classified as special mention have a potential weakness that deserves management’s close attention. If left uncorrected, these potential weaknesses may result in deterioration of the repayment prospects for the loan or of the institution’s credit position at some future date.
Substandard. Loans classified as substandard are inadequately protected by the current net worth and paying capacity of the obligor or of the collateral pledged, if any. Loans so classified have a well-defined weakness or weaknesses that jeopardize the liquidation of the debt. They are characterized by the distinct possibility that the institution will sustain some loss if the deficiencies are not corrected.
Doubtful. Loans classified as doubtful have all the weaknesses inherent in those classified as substandard, with the added characteristic that the weaknesses make collection or liquidation in full, on the basis of currently existing facts, conditions, and values, highly questionable and improbable.
Loans not meeting the criteria above that are analyzed individually as part of the above described process are considered to be pass rated loans.
The following table shows credit quality indicators by portfolio class at June 30, 2016 and December 31, 2015 (in thousands):
| June 30, 2016 |
Pass | Watch | Substandard | Total | ||||||||||||
| Commercial and industrial |
$ | 348,605 | $ | 2,303 | $ | 4,650 | $ | 355,558 | ||||||||
| Construction |
201,942 | 2,632 | 5,455 | 210,029 | ||||||||||||
| Residential real estate: |
||||||||||||||||
| 1-to-4 family mortgage |
266,899 | 8,317 | 11,119 | 286,335 | ||||||||||||
| Residential line of credit |
168,888 | 3,479 | 2,156 | 174,523 | ||||||||||||
| Multi-family mortgage |
40,973 | — | 32 | 41,005 | ||||||||||||
| Commercial real estate: |
||||||||||||||||
| Owner occupied |
329,737 | 8,046 | 8,216 | 345,999 | ||||||||||||
| Non-owner occupied |
234,084 | 20,083 | 9,726 | 263,893 | ||||||||||||
| Consumer and other |
72,120 | 487 | 355 | 72,962 | ||||||||||||
|
|
|
|||||||||||||||
| Total |
$ | 1,663,248 | $ | 45,347 | $ | 41,709 | $ | 1,750,304 | ||||||||
|
|
||||||||||||||||
F-16
Table of Contents
Index to Financial Statements
FB Financial Corporation and subsidiaries
Notes to condensed consolidated financial statements
(Unaudited)
| December 31, 2015 | Pass | Watch | Substandard | Total | ||||||||||||
| Commercial and industrial |
$ | 310,125 | $ | 1,060 | $ | 5,853 | 317,038 | |||||||||
| Construction |
219,684 | 3,238 | 8,103 | 231,025 | ||||||||||||
| Residential real estate: |
||||||||||||||||
| 1-to-4 family mortgage |
268,046 | 9,367 | 10,336 | 287,749 | ||||||||||||
| Residential line of credit |
165,838 | 3,069 | 2,619 | 171,526 | ||||||||||||
| Multi-family mortgage |
58,234 | 166 | 1,110 | 59,510 | ||||||||||||
| Commercial real estate: |
||||||||||||||||
| Owner occupied |
310,538 | 9,852 | 9,817 | 330,207 | ||||||||||||
| Non-owner occupied |
206,645 | 20,218 | 10,359 | 237,222 | ||||||||||||
| Consumer and other |
66,794 | 460 | 332 | 67,586 | ||||||||||||
|
|
|
|||||||||||||||
| Total |
$ | 1,605,904 | $ | 47,430 | $ | 48,529 | $ | 1,701,863 | ||||||||
|
|
||||||||||||||||
Loans acquired in business combinations that exhibited at the date of acquisition evidence of deterioration of credit quality since origination such that it was probable that all contractually required payments would not be collected are considered to be purchased credit impaired and were as follows at June 30, 2016 and December 31, 2015 (in thousands):
| June 30, 2016 |
December 31, 2015 |
|||||||
| Commercial and industrial |
$ | 586 | $ | 874 | ||||
| Construction |
5,049 | 6,859 | ||||||
| Residential real estate: |
||||||||
| 1-to-4 family mortgage |
2,402 | 2,828 | ||||||
| Residential line of credit |
— | — | ||||||
| Multi-family mortgage |
32 | 36 | ||||||
| Commercial real estate: |
||||||||
| Owner occupied |
3,923 | 4,783 | ||||||
| Non-owner occupied |
5,594 | 5,991 | ||||||
| Consumer and other |
4 | 4 | ||||||
|
|
|
|||||||
| Total |
$ | 17,590 | $ | 21,375 | ||||
|
|
||||||||
The following table presents the current value of loans determined to be impaired at the time of acquisition at June 30, 2016 and December 31, 2015 (in thousands):
| June 30, 2016 |
December 31, 2015 |
|||||||
| Contractually-required principal and interest |
$ | 25,277 | $ | 31,381 | ||||
| Nonaccretable difference |
(6,439 | ) | (8,369 | ) | ||||
|
|
|
|||||||
| Cash flows expected to be collected |
18,838 | 23,012 | ||||||
| Accretable yield |
(1,248 | ) | (1,637 | ) | ||||
|
|
|
|||||||
| Current value |
$ | 17,590 | $ | 21,375 | ||||
|
|
||||||||
F-17
Table of Contents
Index to Financial Statements
FB Financial Corporation and subsidiaries
Notes to condensed consolidated financial statements
(Unaudited)
Changes in accretable yield and nonaccretable difference of purchased loans were as follows (in thousands):
| Accretable yield |
Nonaccretable Difference |
|||||||||||||||||||
| Purchased Credit Impaired |
Purchased Non- impaired |
Purchased Credit Impaired |
Purchased Non- impaired |
Total | ||||||||||||||||
| Balance at January 1, 2016 |
$ | (1,637 | ) | $ | (2,147 | ) | $ | (8,369 | ) | $ | (70 | ) | $ | (12,223 | ) | |||||
| Additions through acquisition |
— | — | — | — | — | |||||||||||||||
| Principal reductions/ pay-offs |
(1,458 | ) | — | 1,458 | — | — | ||||||||||||||
| Charge-offs |
— | — | 472 | — | 472 | |||||||||||||||
| Sale of credit card portfolio |
— | — | — | 70 | 70 | |||||||||||||||
| Accretion |
1,847 | 534 | — | — | 2,381 | |||||||||||||||
|
|
|
|||||||||||||||||||
| Balance at June 30, 2016 |
$ | (1,248 | ) | $ | (1,613 | ) | $ | (6,439 | ) | $ | — | $ | (9,300 | ) | ||||||
|
|
||||||||||||||||||||
There were no purchased credit impaired loans prior to the NWGB acquisition on September 18, 2015.
The following table provides the period-end amounts of loans that are past due thirty to eighty-nine days, past due ninety or more days and still accruing interest, loans not accruing interest and loans current on payments accruing interest by category at June 30, 2016 and December 31, 2015 (in thousands):
| June 30, 2016 |
30-89 days past due |
90 days or more and accruing |
Non-accrual loans |
Loans current on payments and
accruing |
Total | |||||||||||||||
| Commercial and industrial |
$ | 549 | $ | 170 | $ | 1,504 | $ | 352,749 | $ | 354,972 | ||||||||||
| Construction |
348 | 2 | 263 | 204,367 | 204,980 | |||||||||||||||
| Residential real estate: |
||||||||||||||||||||
| 1-to-4 family mortgage |
3,184 | 577 | 1,617 | 278,555 | 283,933 | |||||||||||||||
| Residential line of credit |
1,342 | 248 | 791 | 172,142 | 174,523 | |||||||||||||||
| Multi-family mortgage |
— | — | — | 40,973 | 40,973 | |||||||||||||||
| Commercial real estate: |
— | |||||||||||||||||||
| Owner occupied |
1,514 | 232 | 1,530 | 338,800 | 342,076 | |||||||||||||||
| Non-owner occupied |
55 | — | 4,010 | 254,234 | 258,299 | |||||||||||||||
| Consumer and other |
479 | 125 | 37 | 72,317 | 72,958 | |||||||||||||||
|
|
|
|||||||||||||||||||
| Total |
$ | 7,471 | $ | 1,354 | $ | 9,752 | $ | 1,714,137 | $ | 1,732,714 | ||||||||||
|
|
||||||||||||||||||||
F-18
Table of Contents
Index to Financial Statements
FB Financial Corporation and subsidiaries
Notes to condensed consolidated financial statements
(Unaudited)
Loans acquired with deteriorated credit quality amounting to $17,590 and have been excluded from the table above in accordance with ASC-310-10-50, Receivables- Overall- Disclosure.
| December 31, 2015 |
30-89 days past due |
90 days or more and accruing |
Non-accruing loans |
Loans current on payments and accruing |
Total | |||||||||||||||
| Commercial and industrial |
$ | 283 | $ | 103 | $ | 1,659 | $ | 314,119 | $ | 316,164 | ||||||||||
| Construction |
81 | 33 | 272 | 223,780 | 224,166 | |||||||||||||||
| Residential real estate: |
||||||||||||||||||||
| 1-to-4 family mortgage |
2,798 | 268 | 2,124 | 279,731 | 284,921 | |||||||||||||||
| Residential line of credit |
1,053 | 323 | 1,114 | 169,036 | 171,526 | |||||||||||||||
| Multi-family mortgage |
— | — | — | 59,474 | 59,474 | |||||||||||||||
| Commercial real estate: |
||||||||||||||||||||
| Owner occupied |
382 | — | 1,848 | 323,194 | 325,424 | |||||||||||||||
| Non-owner occupied |
60 | — | 3,638 | 227,533 | 231,231 | |||||||||||||||
| Consumer and other |
331 | 160 | 45 | 67,046 | 67,582 | |||||||||||||||
|
|
|
|||||||||||||||||||
| Total |
$ | 4,988 | $ | 887 | $ | 10,700 | $ | 1,663,913 | $ | 1,680,488 | ||||||||||
|
|
||||||||||||||||||||
Loans acquired with deteriorated credit quality amounting to $21,375 and have been excluded from the table above in accordance with ASC-310-10-50, Receivables- Overall- Disclosure.
F-19
Table of Contents
Index to Financial Statements
FB Financial Corporation and subsidiaries
Notes to condensed consolidated financial statements
(Unaudited)
Impaired loans recognized in conformity with ASC 310 at June 30, 2016 and December 31, 2015, segregated by class, were as follows (in thousands):
| June 30, 2016 |
Recorded investment |
Unpaid principal |
Related allowance |
Average recorded investment |
Interest income recognized (cash basis) |
|||||||||||||||
| With a related allowance recorded: |
||||||||||||||||||||
| Commercial and industrial |
$ | 969 | $ | 970 | $ | 200 | $ | 1,051 | $ | 11 | ||||||||||
| Construction |
— | — | — | 154 | — | |||||||||||||||
| Residential real estate: |
||||||||||||||||||||
| 1-to-4 family mortgage |
862 | 1,128 | 72 | 2,130 | 26 | |||||||||||||||
| Residential line of credit |
320 | 322 | 140 | 160 | 2 | |||||||||||||||
| Multi-family mortgage |
— | — | — | — | — | |||||||||||||||
| Commercial real estate: |
||||||||||||||||||||
| Owner occupied |
239 | 239 | 101 | 1,271 | 1 | |||||||||||||||
| Non-owner occupied |
2,782 | 2,784 | 881 | 2,879 | 8 | |||||||||||||||
| Consumer and other |
— | — | — | — | — | |||||||||||||||
|
|
|
|||||||||||||||||||
| Total |
$ | 5,172 | $ | 5,443 | $ | 1,394 | $ | 7,644 | $ | 48 | ||||||||||
|
|
|
|||||||||||||||||||
| With no related allowance recorded |
||||||||||||||||||||
| Commercial and industrial |
$ | 611 | $ | 1,243 | $ | — | $ | 489 | $ | 4 | ||||||||||
| Construction |
2,793 | 2,793 | — | 2,676 | 62 | |||||||||||||||
| Residential real estate: |
||||||||||||||||||||
| 1-to-4 family mortgage |
3,204 | 3,205 | — | 1,747 | 96 | |||||||||||||||
| Residential line of credit |
— | — | — | — | — | |||||||||||||||
| Multi-family mortgage |
1,045 | 1,045 | — | 1,060 | 12 | |||||||||||||||
| Commercial real estate: |
||||||||||||||||||||
| Owner occupied |
1,762 | 2,534 | — | 943 | 43 | |||||||||||||||
| Non-owner occupied |
1,171 | 1,903 | — | 1,111 | 1 | |||||||||||||||
| Consumer and other |
— | — | — | — | — | |||||||||||||||
|
|
|
|||||||||||||||||||
| Total |
$ | 10,586 | $ | 12,723 | $ | — | $ | 8,023 | $ | 218 | ||||||||||
|
|
|
|||||||||||||||||||
| Total impaired loans |
$ | 15,758 | $ | 18,166 | $ | 1,394 | $ | 15,667 | $ | 266 | ||||||||||
|
|
||||||||||||||||||||
F-20
Table of Contents
Index to Financial Statements
FB Financial Corporation and subsidiaries
Notes to condensed consolidated financial statements
(Unaudited)
| December 31, 2015 | Recorded investment |
Unpaid principal |
Related allowance |
Average recorded investment |
Interest income recognized (cash basis) |
|||||||||||||||
| With a related allowance recorded: |
||||||||||||||||||||
| Commercial and industrial |
$ | 1,133 | $ | 1,133 | $ | 89 | $ | 1,269 | $ | 22 | ||||||||||
| Construction |
308 | 308 | 5 | 517 | 3 | |||||||||||||||
| Residential real estate: |
||||||||||||||||||||
| 1-to-4 family mortgage |
3,397 | 3,398 | 66 | 2,345 | 199 | |||||||||||||||
| Residential line of credit |
— | — | — | — | — | |||||||||||||||
| Multi-family mortgage |
— | — | — | 468 | — | |||||||||||||||
| Commercial real estate: |
||||||||||||||||||||
| Owner occupied |
2,302 | 2,422 | 38 | 1,938 | 77 | |||||||||||||||
| Non-owner occupied |
2,976 | 2,976 | 775 | 3,039 | 18 | |||||||||||||||
| Consumer and other |
— | — | — | — | — | |||||||||||||||
|
|
|
|||||||||||||||||||
| Total |
$ | 10,116 | $ | 10,237 | $ | 973 | $ | 9,576 | $ | 319 | ||||||||||
|
|
|
|||||||||||||||||||
| With no related allowance recorded: |
||||||||||||||||||||
| Commercial and industrial |
$ | 366 | $ | 993 | $ | — | $ | 660 | $ | — | ||||||||||
| Construction |
2,558 | 2,558 | — | 4,337 | 127 | |||||||||||||||
| Residential real estate: |
||||||||||||||||||||
| 1-to-4 family mortgage |
289 | 289 | — | 2,815 | 7 | |||||||||||||||
| Residential line of credit |
— | — | — | — | — | |||||||||||||||
| Multi-family mortgage |
1,074 | 1,074 | — | 652 | 25 | |||||||||||||||
| Commercial real estate: |
||||||||||||||||||||
| Owner occupied |
123 | 229 | — | 788 | — | |||||||||||||||
| Non-owner occupied |
1,050 | 1,781 | — | 855 | — | |||||||||||||||
| Consumer and other |
— | — | — | — | — | |||||||||||||||
|
|
|
|||||||||||||||||||
| Total |
$ | 5,460 | $ | 6,924 | $ | — | $ | 10,107 | $ | 159 | ||||||||||
|
|
|
|||||||||||||||||||
| Total impaired loans |
$ | 15,576 | $ | 17,161 | $ | 973 | $ | 19,683 | $ | 478 | ||||||||||
|
|
||||||||||||||||||||
As of June 30, 2016 and December 31, 2015, the Company has a recorded investment in troubled debt restructurings of $14,970 and $15,289, respectively. The modifications included extensions of the maturity date and/or a stated rate of interest to one lower than the current market rate. The Company has allocated $1,254 and $946 of specific reserves for those loans at June 30, 2016 and December 31, 2015, respectively, and has committed to lend additional amounts totaling up to $0 and $69, respectively to these customers. Of these loans, $5,945 and $5,898 were classified as non-accrual loans as of June 30, 2016 and December 31, 2015.
F-21
Table of Contents
Index to Financial Statements
FB Financial Corporation and subsidiaries
Notes to condensed consolidated financial statements
(Unaudited)
The following table presents the financial effect of TDRs recorded during the periods indicated ($ amounts in thousands):
| June 30, 2016 |
Number of loans |
Pre- modification |
Post- modification |
Charge offs and specific |
||||||||||||
| Residential real estate: |
||||||||||||||||
| 1-4 family mortgage |
4 | $ | 457 | $ | 457 | $ | 39 | |||||||||
|
|
|
|||||||||||||||
| Total |
4 | $ | 457 | $ | 457 | $ | 39 | |||||||||
|
|
||||||||||||||||
| June 30, 2015 |
Number of loans |
Pre- modification |
Post- modification outstanding recorded investment |
Charge offs and specific reserves |
||||||||||||
| Commercial and industrial |
6 | $ | 2,298 | $ | 2,298 | $ | 86 | |||||||||
| Commercial real estate: |
||||||||||||||||
| Owner occupied |
1 | 35 | 35 | — | ||||||||||||
| Non-owner occupied |
1 | 144 | 144 | 1 | ||||||||||||
| Residential real estate: |
||||||||||||||||
| 1-4 family mortgage |
5 | 328 | 328 | 45 | ||||||||||||
|
|
|
|||||||||||||||
| Total |
13 | $ | 2,805 | $ | 2,805 | $ | 132 | |||||||||
|
|
||||||||||||||||
There were no loans modified as troubled debt restructurings for which there was a payment default within twelve months following the modification during the six months ended June 30, 2016. The following presents loans modified as troubled debt restructurings for which there was a payment default within twelve months following the modification during the six months ended June 30, 2015.
| Defaulted |
Charge-offs and specific reserves |
|||||||
| Residential real estate: |
||||||||
| 1-to-4 family mortgage |
$ | 145 | $ | 45 | ||||
|
|
|
|||||||
| Total |
$ | 145 | $ | 45 | ||||
|
|
||||||||
A loan is considered to be in payment default once it is 90 days contractually past due under the modified terms.
The terms of certain other loans were modified during the six months ended June 30, 2016 and 2015 that did not meet the definition of a troubled debt restructuring. The modification of these loans involved either a modification of the terms of a loan to borrowers who were not experiencing financial difficulties or a delay in a payment that was considered to be insignificant.
In order to determine whether a borrower is experiencing financial difficulty, an evaluation is performed of the probability that the borrower will be in payment default on any of its debt in the foreseeable future without the modification. This evaluation is performed under the company’s internal underwriting policy.
F-22
Table of Contents
Index to Financial Statements
FB Financial Corporation and subsidiaries
Notes to condensed consolidated financial statements
(Unaudited)
Note (5)—Foreclosed real estate:
The amount reported as real estate acquired through foreclosure proceedings is carried at the lower of the recorded investment in the loan or fair value less estimated cost to sell the property. The following table summarizes the foreclosed real estate for the six months ended June 30, 2016 and 2015 (in thousands):
|
June 30, |
June 30, |
|||||||
| Balance at beginning of period |
$ | 11,641 | $ | 7,259 | ||||
| Transfers from loans |
2,176 | 1,227 | ||||||
| Capital improvements |
— | — | ||||||
| Property sold |
(3,514 | ) | (1,758 | ) | ||||
| Gain on sale of foreclosed assets |
69 | 104 | ||||||
| Transferred to loans |
(259 | ) | (591 | ) | ||||
| Write-downs and partial liquidations |
(211 | ) | (42 | ) | ||||
|
|
|
|||||||
| Balance at end of period |
$ | 9,902 | $ | 6,199 | ||||
|
|
||||||||
Foreclosed residential real estate properties included in the table above totaled $2,265 and $2,715 as of June 30, 2016 and December 31, 2015, respectively. The recorded investment in residential mortgage loans secured by residential real estate properties for which foreclosure proceedings are in process totaled $44 and $67 at June 30, 2016 and December 31, 2015, respectively.
Note (6)—Mortgage servicing rights:
Changes in the Company’s mortgage servicing rights were as follows for the six months ended June 30, 2016 and 2015 (in thousands):
| 2016 | 2015 | |||||||
| Carrying value at January 1 |
$ | 29,711 | $ | 6,032 | ||||
| Capitalization |
19,783 | 11,108 | ||||||
| Amortization |
(3,425 | ) | (779 | ) | ||||
| Impairment |
(5,687 | ) | — | |||||
|
|
|
|||||||
| Carrying value at June 30 |
$ | 40,382 | $ | 16,361 | ||||
|
|
||||||||
F-23
Table of Contents
Index to Financial Statements
FB Financial Corporation and subsidiaries
Notes to condensed consolidated financial statements
(Unaudited)
Income and expense associated with mortgage servicing rights, which include servicing fees, late charges, guarantee fees and loan payoff interest, is recorded on a cash basis which approximates income as would be recorded on a U.S. GAAP basis. The following table summarizes servicing income and expense included in mortgage banking income and other noninterest expense within the Mortgage Segment operating results, respectively, for the six months ended June 30, 2016 and 2015 (in thousands):
| 2016 | 2015 | |||||||
| Gross servicing income |
$ | 4,651 | $ | 1,052 | ||||
|
|
|
|||||||
| Servicing expenses: |
||||||||
| Servicing asset amortization |
3,425 | 779 | ||||||
| Servicing asset impairment |
5,687 | — | ||||||
| Other servicing expenses |
946 | 200 | ||||||
|
|
|
|||||||
| Gross servicing expenses |
10,058 | 979 | ||||||
|
|
|
|||||||
| Net servicing (loss) income |
$ | (5,407 | ) | $ | 73 | |||
|
|
||||||||
Data and key economic assumptions related to the Company’s mortgage servicing rights as of June 30, 2016 and December 31, 2015 are as follows ($ amounts in thousands):
|
June 30, |
December 31, 2015 |
|||||||
| Unpaid principal balance |
$ | 4,023,151 | $ | 2,545,449 | ||||
| Weighted-average prepayment speed (CPR) |
9.76% | 7.30% | ||||||
| Estimated impact on fair value of a 10% increase |
(1,418 | ) | (371 | ) | ||||
| Estimated impact on fair value of a 20% increase |
(2,745 | ) | (726 | ) | ||||
| Discount rate |
11.13% | 10.14% | ||||||
| Estimated impact on fair value of a 100 bp increase |
(863 | ) | (1,201 | ) | ||||
| Estimated impact on fair value of a 200 bp increase |
(1,674 | ) | (2,317 | ) | ||||
| Weighted-average coupon interest rate |
3.71% | 3.79% | ||||||
| Weighted-average servicing fee (basis points) |
26 | 25 | ||||||
| Weighted-average remaining maturity (in months) |
310 | 311 | ||||||
|
|
||||||||
F-24
Table of Contents
Index to Financial Statements
FB Financial Corporation and subsidiaries
Notes to condensed consolidated financial statements
(Unaudited)
Note (7)—Commitments and contingencies:
Some financial instruments, such as loan commitments, credit lines, letters of credit, and overdraft protection, are issued to meet customer financing needs. These are agreements to provide credit or to support the credit of others, as long as conditions established in the contract are met, and usually have expiration dates.
Commitments may expire without being used. Off-balance sheet risk to credit loss exists up to the face amount of these instruments, although material losses are not anticipated. The same credit policies are used to make such commitments as are used for loans, including obtaining collateral at exercise of the commitment.
| (in thousands) |
June 30, |
December 31, 2015 |
||||||
| Commitments to extend credit, excluding interest rate lock commitment |
$ | 619,538 | $ | 554,274 | ||||
| Letters of credit |
20,695 | 20,338 | ||||||
|
|
|
|||||||
| Balance at end of period |
$ | 640,233 | $ | 574,612 | ||||
|
|
||||||||
In connection with the sale of mortgage loans to third party investors, the Bank makes usual and customary representations and warranties as to the propriety of its origination activities. Occasionally, the investors require the Bank to repurchase loans sold to them under the terms of the warranties. When this happens, the loans are recorded at fair value with a corresponding charge to a valuation reserve. The total principal amount of loans repurchased (or indemnified for) was $0 and $0 for six months ended June 30, 2016 and 2015, respectively. The Bank has established an allowance for losses associated with loan repurchases. This allowance is recorded in accrued expenses and other liabilities on the consolidated balance sheet. The following table summarizes the activity in the repurchase allowance (in thousands):
|
June 30, |
June 30, |
|||||||
| Balance at beginning of period |
$ | 2,156 | $ | 828 | ||||
| Provision for loan repurchases or indemnifications |
703 | 629 | ||||||
| Recoveries on previous losses |
— | — | ||||||
| Losses on loans repurchased or indemnified |
— | — | ||||||
|
|
|
|||||||
| Balance at end of period |
$ | 2,859 | $ | 1,457 | ||||
|
|
||||||||
Note (8)—Derivatives:
The Company utilizes derivative financial instruments as part of its ongoing efforts to manage its interest rate risk exposure as well as the exposure for its customers. Derivative financial instruments are included in the Consolidated Balance Sheets line item “Other assets” or “Other liabilities” at fair value in accordance with ASC 815, “Derivatives and Hedging.”
The Company enters into commitments to originate loans whereby the interest rate on the loan is determined prior to funding (rate-lock commitments). Under such commitments, interest rates for a mortgage loan are typically locked in for up to forty-five days with the customer. These interest rate lock commitments are recorded at fair value in the Company’s Consolidated Balance Sheets. The notional amount of commitments to
F-25
Table of Contents
Index to Financial Statements
FB Financial Corporation and subsidiaries
Notes to condensed consolidated financial statements
(Unaudited)
fund fixed-rate mortgage loans was $727,938 and $263,395 at June 30, 2016 and December 31, 2015, respectively. The Company also enters into mandatory delivery forward commitments to sell residential mortgage loans to secondary market investors. The notional amount of commitments to sell residential mortgage loans to secondary market investors was $732,500 and $445,000 at June 30, 2016 and December 31, 2015, respectively. Gains and losses arising from changes in the valuation of the commitments are recognized currently in earnings and are reflected under the line item “Mortgage banking income” on the Consolidated Statements of Income.
The Company has entered into derivative instruments that are not designated as hedging instruments to help its commercial customers manage their exposure to interest rate fluctuations. To mitigate the interest rate risk associated with these customer contracts, the Company enters into an offsetting derivative contract position. The Company manages its credit risk, or potential risk of default by its commercial customers, through credit limit approval and monitoring procedures. At June 30, 2016 and December 31, 2015, the Company had notional amounts of $1,717 and $4,409, respectively, on interest rate contracts with corporate customers and $1,717 and $4,409, respectively, in offsetting interest rate contracts with other financial institutions to mitigate the Company’s rate exposure on its corporate customers’ contracts and certain fixed-rate loans. The fair value on the swaps was $(104) and $(369) at June 30, 2016 and December 31, 2015, respectively.
Certain financial instruments, including derivatives, may be eligible for offset in the Consolidated Balance Sheet when the “right of setoff” exists or when the instruments are subject to an enforceable master netting agreement, which includes the right of the non-defaulting party or non-affected party to offset recognized amounts, including collateral posted with the counterparty, to determine a net receivable or net payable upon early termination of the agreement. Certain of the Company’s derivative instruments are subject to master netting agreements. The Company has not elected to offset such financial instruments in the Consolidated Balance Sheets.
The following table provides details on the Company’s derivative financial instruments as of the dates presented:
| Balance
Sheet Classification |
Fair Value | |||||||||||
| June 30, 2016 |
December 31, 2015 |
|||||||||||
| Derivative assets: |
||||||||||||
| Not designated as hedging: |
||||||||||||
| Interest rate swaps |
Other Assets | $ | 104 | $ | 369 | |||||||
| Forward commitments |
Other Assets | — | 61 | |||||||||
| Interest rate-lock commitments |
Other Assets | 17,558 | 5,593 | |||||||||
|
|
|
|||||||||||
| Total |
$ | 17,662 | $ | 6,023 | ||||||||
|
|
|
|||||||||||
| Derivative liabilities: |
||||||||||||
| Not designated as hedging: |
||||||||||||
| Interest rate swaps |
Other Liabilities | $ | 104 | $ | 369 | |||||||
| Forward commitments |
Other Liabilities | 7,702 | — | |||||||||
|
|
|
|||||||||||
| Total |
$ | 7,806 | $ | 369 | ||||||||
|
|
||||||||||||
F-26
Table of Contents
Index to Financial Statements
FB Financial Corporation and subsidiaries
Notes to condensed consolidated financial statements
(Unaudited)
Gains (losses) included in the Condensed Consolidated Statements of Income related to the Company’s derivative financial instruments were as follows:
| June 30, | ||||||||
| 2016 | 2015 | |||||||
| Derivatives not designated as hedging instruments: |
||||||||
| Interest rate lock commitments: |
||||||||
| Included in mortgage banking income |
$ | 11,965 | $ | 2,305 | ||||
| Forward commitments: |
||||||||
| Included in mortgage banking income |
(16,745 | ) | 3,523 | |||||
|
|
|
|||||||
| Total |
$ | (4,780 | ) | $ | 5,828 | |||
|
|
||||||||
Note (9)—Fair value of financial instruments:
ASC 820-10 establishes a framework for measuring the fair value of assets and liabilities according to a hierarchy that prioritizes the inputs to valuation techniques used to measure fair value into three broad levels. The fair value hierarchy gives the highest priority to quoted prices in active markets for identical assets and liabilities (Level 1) and the lowest priority to unobservable inputs (Level 3). The hierarchy maximizes the use of observable inputs and minimizes the use of unobservable inputs by requiring that the most observable inputs be used when available. Observable inputs are inputs that market participants would use in pricing the asset or liability based on market data obtained from sources independent of the Company. Unobservable inputs are inputs that are derived from assumptions based on management’s estimate of assumptions that market participants would use in pricing the asset or liability based on the best information available under the circumstances.
The hierarchy is broken down into the following three levels, based on the reliability of inputs:
Level 1: Unadjusted quoted prices in active markets for identical assets or liabilities that are accessible at the measurement date.
Level 2: Significant other observable inputs other than Level 1 prices, such as quoted prices for similar assets or liabilities, quoted prices in markets that are not active or other inputs that are observable or can be corroborated by observable market data.
Level 3: Significant unobservable inputs for assets or liabilities that are derived from assumptions based on management’s estimate of assumptions that market participants would use in pricing the assets or liabilities.
The Company records the fair values of financial assets and liabilities on a recurring and non-recurring basis using the following methods and assumptions:
Available-for-sale securities—Available-for-sale securities are recorded at fair value on a recurring basis. Fair values for securities are based on quoted market prices, where available. If quoted prices are not available, fair values are based on quoted market prices of similar instruments or are determined by matrix pricing, which is a
F-27
Table of Contents
Index to Financial Statements
FB Financial Corporation and subsidiaries
Notes to condensed consolidated financial statements
(Unaudited)
mathematical technique widely used in the industry to value debt securities without relying exclusively on quoted prices for the specific securities but rather by relying on the pricing relationship or correlation among other benchmark quoted securities. Available-for-sale securities valued using quoted market prices of similar instruments or that are valued using matrix pricing are classified as Level 2. When significant inputs to the valuation are unobservable, the available-for-sale securities are classified within Level 3 of the fair value hierarchy.
Where no active market exists for a security or other benchmark securities, fair value is estimated by the Company with reference to discount margins for other high risk securities.
Loans held for sale—Loans held for sale are carried at fair value. If fair value is used, it is determined using current secondary market prices for loans with similar characteristics, that is, using Level 2 inputs.
Derivatives—The fair value of the interest rate swaps are based upon fair values provided from entities that engage in interest rate swap activity and is based upon projected future cash flows and interest rates. Fair value of commitments is based on fees currently charged to enter into similar agreements, and for fixed-rate commitments, the difference between current levels of interest rates and the committed rates is also considered. These financial instruments are classified as Level 2.
Foreclosed real estate—Foreclosed real estate (“REO”) is comprised of commercial and residential real estate obtained in partial or total satisfaction of loan obligations. REO acquired in settlement of indebtedness is recorded at the lower of the carrying amount of the loan or the fair value of the real estate less costs to sell. Fair value is determined on a nonrecurring basis based on appraisals by qualified licensed appraisers and is adjusted for management’s estimates of costs to sell and holding period discounts. The valuations are classified as Level 3.
Mortgage servicing rights—Servicing rights are carried at the lower of amortized cost or fair value. Fair value is determined using an income approach with various assumptions including expected cash flows, market discount rates, prepayment speeds, servicing costs, and other factors. Mortgage servicing rights are disclosed as level 3.
Impaired loans—Loans considered impaired under FASB ASC 310, Receivables, are loans for which, based on current information and events, it is probable that the creditor will be unable to collect all amounts due according to the contractual terms of the loan agreement. Fair value adjustments for impaired loans are recorded on a non-recurring basis as either partial write downs based on observable market prices or current appraisal of the collateral. Impaired loans are classified as Level 3.
The following methods were used to estimate the fair value of the Company’s financial instruments which were not previously presented.
Cash and cash equivalents—Cash and cash equivalents consist of cash and due from banks with other financial institutions and federal funds sold. The carrying amount reported in the consolidated balance sheets approximates the fair value based upon the short-term nature of these assets. Also included are interest-bearing deposits in financial institutions. Interest bearing deposits in financial institutions consist of interest bearing accounts at the Federal Reserve Bank and Federal Home Loan Bank. The carrying value reported in the consolidated balance sheets approximates the fair value based upon the short-term nature of the assets.
F-28
Table of Contents
Index to Financial Statements
FB Financial Corporation and subsidiaries
Notes to condensed consolidated financial statements
(Unaudited)
Federal Home Loan Bank stock—The carrying value of Federal Home Loan Bank stock reported in the consolidated balance sheets approximates the fair value as the stock is redeemable at the carrying value.
Loans—For variable rate loans that re-price frequently and with no significant change in credit risk, fair values are based upon carrying values. Fixed rate loan fair values are estimated using a discounted cash flow analysis based upon interest rates currently being offered for loans with similar terms to borrowers of similar credit quality.
Deposits—The fair value disclosed for demand deposits (both interest bearing and noninterest bearing) and savings deposits are equal to the amount payable on demand as of the reporting date. The fair value of the time deposits is estimated using a discounted cash flow method based upon current rates for similar types of accounts.
Short term borrowings—The fair value of the lines of credit which represent federal funds purchased approximate the carrying value of the amounts reported on the balance sheet due to the short-term nature of these liabilities.
Securities sold under agreement to repurchase—The fair value of the securities sold under agreement to repurchase approximate the carrying value of the amounts reported on the balance sheet due to the short-term nature of these liabilities.
Long-term debt—The fair value of long-term debt is determined using discounted cash flows using current rates.
Accrued interest payable and receivable – The carrying amounts of accrued interest approximate fair value.
The estimated fair values of the Company’s financial instruments are as follows (in thousands):
| Fair Value | ||||||||||||||||||||
| June 30, 2016 | Carrying amount |
Level 1 | Level 2 | Level 3 | Total | |||||||||||||||
| Financial assets: |
||||||||||||||||||||
| Cash and cash equivalents |
$ | 88,919 | $ | 88,919 | $ | — | $ | — | $ | 88,919 | ||||||||||
| Available-for-sale securities |
550,307 | — | 545,451 | 4,856 | 550,307 | |||||||||||||||
| Federal Home Loan Bank Stock |
6,528 | — | — | 6,528 | 6,528 | |||||||||||||||
| Loans, net |
1,726,570 | — | 1,698,784 | 3,053 | 1,701,837 | |||||||||||||||
| Loans held for sale |
322,249 | — | 322,249 | — | 322,249 | |||||||||||||||
| Interest receivable |
6,627 | — | 6,627 | — | 6,627 | |||||||||||||||
| Mortgage servicing rights, net |
40,382 | — | — | 40,382 | 40,382 | |||||||||||||||
| Derivatives |
17,662 | — | 17,662 | — | 17,662 | |||||||||||||||
| Financial liabilities: |
||||||||||||||||||||
| Deposits: |
||||||||||||||||||||
| Without stated maturities |
$ | 2,114,715 | $ | 2,114,715 | $ | — | $ | — | $ | 2,114,715 | ||||||||||
| With stated maturities |
399,582 | — | 398,418 | — | 398,418 | |||||||||||||||
| Securities sold under agreement to repurchase |
29,278 | 29,278 | — | — | 29,278 | |||||||||||||||
| Interest payable |
491 | 139 | 352 | — | 491 | |||||||||||||||
| Long-term debt |
55,785 | — | 54,669 | — | 54,669 | |||||||||||||||
| Derivatives |
7,806 | — | 7,806 | — | 7,806 | |||||||||||||||
|
|
||||||||||||||||||||
F-29
Table of Contents
Index to Financial Statements
FB Financial Corporation and subsidiaries
Notes to condensed consolidated financial statements
(Unaudited)
| Fair Value | ||||||||||||||||||||
| December 31, 2015 | Carrying |
Level 1 | Level 2 | Level 3 | Total | |||||||||||||||
| Financial assets: |
||||||||||||||||||||
| Cash and cash equivalents |
$ | 97,723 | $ | 97,723 | $ | — | $ | — | $ | 97,723 | ||||||||||
| Available-for-sale securities |
649,387 | — | 644,531 | 4,856 | 649,387 | |||||||||||||||
| Federal Home Loan Bank Stock |
6,528 | — | — | 6,528 | 6,528 | |||||||||||||||
| Loans, net |
1,677,403 | — | 1,638,506 | 36,951 | 1,675,457 | |||||||||||||||
| Loans held for sale |
273,196 | — | 273,196 | — | 273,196 | |||||||||||||||
| Interest receivable |
6,763 | — | 6,763 | — | 6,763 | |||||||||||||||
| Mortgage servicing rights, net |
29,711 | — | — | 29,711 | 29,711 | |||||||||||||||
| Derivatives |
6,023 | — | 6,023 | — | 6,023 | |||||||||||||||
| Financial liabilities: |
||||||||||||||||||||
| Deposits: |
||||||||||||||||||||
| Without stated maturities |
$ | 2,112,915 | 2,112,915 | $ | — | $ | — | 2,112,915 | ||||||||||||
| With stated maturities |
325,559 | — | 323,624 | — | 323,624 | |||||||||||||||
| Securities sold under agreement to repurchase |
105,133 | 105,133 | — | — | 105,133 | |||||||||||||||
| Short term borrowings |
18,000 | 18,000 | — | — | 18,000 | |||||||||||||||
| Interest payable |
563 | 211 | 352 | — | 563 | |||||||||||||||
| Long-term debt |
56,616 | — | 55,484 | — | 55,484 | |||||||||||||||
| Derivatives |
369 | — | 369 | — | 369 | |||||||||||||||
|
|
||||||||||||||||||||
The balances and levels of the assets measured at fair value on a recurring basis at June 30, 2016 are presented in the following tables (in thousands):
| At June 30, 2016 |
Quoted prices in active markets for identical assets (liabilities) (level 1) |
Significant other observable inputs (level 2) |
Significant inputs (level 3) |
Total | ||||||||||||
| Recurring valuations: |
||||||||||||||||
| Financial assets: |
||||||||||||||||
| Available-for-sale securities: |
||||||||||||||||
| U.S. government agency securities |
$ | — | $ | 15,510 | $ | — | $ | 15,510 | ||||||||
| Mortgage-backed securities |
— | 425,311 | — | 425,311 | ||||||||||||
| Municipals, tax-exempt |
— | 96,001 | — | 96,001 | ||||||||||||
| Treasury securities |
— | 4,513 | — | 4,513 | ||||||||||||
| Equity securities |
— | 4,116 | 4,856 | 8,972 | ||||||||||||
|
|
|
|||||||||||||||
| Total |
$ | — | $ | 545,451 | $ | 4,856 | $ | 550,307 | ||||||||
|
|
|
|||||||||||||||
| Loans held for sale |
— | 322,249 | — | 322,249 | ||||||||||||
| Derivatives |
— | 17,662 | — | 17,662 | ||||||||||||
| Financial Liabilities: |
||||||||||||||||
| Derivatives |
— | 7,806 | — | 7,806 | ||||||||||||
|
|
||||||||||||||||
F-30
Table of Contents
Index to Financial Statements
FB Financial Corporation and subsidiaries
Notes to condensed consolidated financial statements
(Unaudited)
The balances and levels of the assets measured at fair value on a non-recurring basis at June 30, 2016 are presented in the following tables (in thousands):
| At June 30, 2016 |
Quoted prices in active markets for identical assets (liabilities) (level 1) |
Significant other observable inputs (level 2) |
Significant inputs (level 3) |
Total | ||||||||||||
| Non-recurring valuations: |
||||||||||||||||
| Financial assets: |
||||||||||||||||
| Foreclosed assets |
$ | — | $ | — | $ | 223 | $ | 223 | ||||||||
| Mortgage servicing rights |
$ | — | $ | — | 40,382 | 40,382 | ||||||||||
|
|
|
|||||||||||||||
| Impaired loans: |
||||||||||||||||
| Commercial and industrial |
— | — | 968 | 968 | ||||||||||||
| Commercial real estate: |
||||||||||||||||
| Owner occupied |
— | — | 239 | 239 | ||||||||||||
| Non-owner occupied |
— | — | 1,367 | 1,367 | ||||||||||||
| Residential real estate: |
||||||||||||||||
| 1-4 family mortgage |
— | — | 159 | 159 | ||||||||||||
| Residential line of credit |
— | — | 320 | 320 | ||||||||||||
|
|
|
|||||||||||||||
| Total |
$ | — | $ | — | $ | 3,053 | $ | 3,053 | ||||||||
|
|
||||||||||||||||
The balances and levels of the assets measured at fair value on a recurring basis at December 31, 2015 are presented in the following tables (in thousands):
| At December 31, 2015 |
Quoted prices in active markets for identical assets (liabilities) (level 1) |
Significant other observable inputs (level 2) |
Significant inputs (level 3) |
Total | ||||||||||||
| Recurring valuations: |
||||||||||||||||
| Financial assets: |
||||||||||||||||
| Available-for-sale securities: |
||||||||||||||||
| U.S. government agency securities |
$ | — | $ | 33,808 | $ | — | $ | 33,808 | ||||||||
| Mortgage-backed securities |
— | 522,373 | — | 522,373 | ||||||||||||
| Municipals, tax-exempt |
— | 79,837 | — | 79,837 | ||||||||||||
| Treasury securities |
— | 4,485 | — | 4,485 | ||||||||||||
| Equity securities |
— | 4,028 | 4,856 | 8,884 | ||||||||||||
|
|
|
|||||||||||||||
| Total |
$ | — | $ | 644,531 | $ | 4,856 | $ | 649,387 | ||||||||
|
|
|
|||||||||||||||
| Loans held for sale |
— | 273,196 | — | 273,196 | ||||||||||||
| Derivatives |
— | 6,023 | — | 6,023 | ||||||||||||
| Financial Liabilities: |
||||||||||||||||
| Derivatives |
$ | — | $ | 369 | $ | — | $ | 369 | ||||||||
|
|
||||||||||||||||
F-31
Table of Contents
Index to Financial Statements
FB Financial Corporation and subsidiaries
Notes to condensed consolidated financial statements
(Unaudited)
The balances and levels of the assets measured at fair value on a non-recurring basis at December 31, 2015 are presented in the following tables (in thousands):
| At December 31, 2015 |
Quoted prices in active markets for identical assets (liabilities) (level 1) |
Significant other (level 2) |
Significant inputs (level 3) |
Total | ||||||||||||
| Non-recurring valuations: |
||||||||||||||||
| Financial assets: |
||||||||||||||||
| Foreclosed assets |
$ | — | $ | — | $ | 6,275 | $ | 6,275 | ||||||||
|
|
|
|||||||||||||||
| Impaired Loans: |
||||||||||||||||
| Commercial and industrial |
— | — | 2,007 | 2,007 | ||||||||||||
| Commercial real estate: |
— | |||||||||||||||
| Owner occupied |
— | — | 6,493 | 6,493 | ||||||||||||
| Non-owner occupied |
— | — | 7,572 | 7,572 | ||||||||||||
| Construction |
— | — | 6,896 | 6,896 | ||||||||||||
| Residential real estate: |
— | |||||||||||||||
| 1-4 family mortgage |
— | — | 6,127 | 6,127 | ||||||||||||
| Multifamily |
— | — | 36 | 36 | ||||||||||||
| Consumer and other |
— | — | 4 | 4 | ||||||||||||
|
|
|
|||||||||||||||
| Total |
$ | — | $ | — | $ | 29,135 | $ | 29,135 | ||||||||
|
|
||||||||||||||||
There were no transfers between Level 1, 2 or 3 during the periods presented.
The following table provides a reconciliation for assets and liabilities measured at fair value on a recurring basis using significant unobservable inputs, or Level 3 inputs, during the six months ended June 30, 2016 and 2015 (in thousands):
| Available-for-sale securities June 30, |
||||||||
| 2016 | 2015 | |||||||
| Balance at beginning of period |
$ | 4,856 | $ | 4,688 | ||||
| Realized gains included in net income |
— | — | ||||||
| Unrealized gains included in other comprehensive income |
— | — | ||||||
| Purchases |
— | 149 | ||||||
|
|
|
|
|
|||||
| Balance at end of period |
$ | 4,856 | $ | 4,837 | ||||
|
|
||||||||
The fair value of certain of the Company’s corporate are determined from information derived from external parties that calculate discounted cash flows using swap and LIBOR curves plus spreads that adjust for loss severities, volatility, credit risk and optionality. When available, broker quotes are used to validate the model. Industry research reports as well as assumptions about specific-issuer defaults and deferrals are reviewed and incorporated into the calculations. There is no established market for the Company’s equity securities, and as such, the Company has estimated that historical costs approximates market value.
F-32
Table of Contents
Index to Financial Statements
FB Financial Corporation and subsidiaries
Notes to condensed consolidated financial statements
(Unaudited)
The following table presents information as of June 30, 2016 about significant unobservable inputs (Level 3) used in the valuation of assets measured at fair value on a nonrecurring basis:
| Financial instrument | Fair Value | Valuation technique | Significant Unobservable inputs |
Range of inputs | ||||||
| Impaired loans |
$ | 3,053 | Appraised value of collateral |
Discount for comparable sales | 0%-30% | |||||
| Foreclosed assets |
$ | 223 | Appraised value of property less costs to sell | Discount for costs to sell | 0%-10% | |||||
| Mortgage servicing rights, net |
$ | 40,382 | Discounted cash flows | See Note 6 | See Note 6 | |||||
|
| ||||||||||
The following table presents information as of December 31, 2015 about significant unobservable inputs (Level 3) used in the valuation of assets measured at fair value on a nonrecurring basis:
| Financial instrument | Fair Value | Valuation technique | Significant Unobservable inputs |
Range of inputs | ||||||
| Impaired loans |
$ | 29,135 | Appraised value of collateral | Discount for comparable sales | 0%-30% | |||||
| Foreclosed assets |
$ | 6,275 | Appraised value of property less costs to sell | Discount for costs to sell | 0%-46% | |||||
| Mortgage servicing rights, net |
$ | 29,711 | Discounted cash flows | See Note 6 | See Note 6 | |||||
|
| ||||||||||
Appraisals for both collateral-dependent impaired loans and real estate owned are performed by certified general appraisers (for commercial properties) or certified residential appraisers (for residential properties) whose qualifications and licenses have been reviewed and verified by the Company. Once received, a member of the lending administrative department reviews the assumptions and approaches utilized in the appraisal as well as the overall resulting fair value in comparison with independent data sources such as recent market data or industry wide statistics.
Fair value option
The Company elected to measure all loans originated for sale at fair value under the fair value option as permitted under ASC 825. Electing to measure these assets at fair value reduces certain timing differences and better matches the changes in fair value of the loans with changes in the fair value of derivative instruments used to economically hedge them.
Net gains of $6,795 and $1,571 resulting from fair value changes of the mortgage loans were recorded in income during the six months ended June 30, 2016 and 2015, respectively. The amount does not reflect changes in fair values of related derivative instruments used to hedge exposure to market-related risks associated with these mortgage loans. The change in fair value of both loans held for sale and the related derivative instruments are recorded in Mortgage Banking Income in the Consolidated Statements of Income.
The Company’s valuation of loans held for sale incorporates an assumption for credit risk; however, given the short-term period that the Company holds these loans, valuation adjustments attributable to instrument-specific credit risk is nominal. Interest income on loans held for sale measured at fair value is accrued as it is earned based on contractual rates and is reflected in loan interest income in the Consolidated Statements of Income.
F-33
Table of Contents
Index to Financial Statements
FB Financial Corporation and subsidiaries
Notes to condensed consolidated financial statements
(Unaudited)
The following table summarizes the differences between the fair value and the principal balance for loans held for sale measured at fair value as of June 30, 2016 and December 31, 2015:
| June 30, 2016 |
Aggregate fair value |
Aggregate Unpaid Principal Balance |
Difference | |||||||||
| Mortgage loans held for sale measured at fair value |
$ | 322,249 | $ | 307,226 | $ | 15,023 | ||||||
| Past due loans of 90 days or more |
— | — | — | |||||||||
| Nonaccrual loans |
— | — | — | |||||||||
|
|
||||||||||||
| December 31, 2015 | ||||||||||||
| Mortgage loans held for sale measured at fair value |
$ | 273,196 | $ | 264,968 | $ | 8,228 | ||||||
| Past due loans of 90 days or more |
— | — | — | |||||||||
| Nonaccrual loans |
— | — | — | |||||||||
|
|
||||||||||||
Note (10)—Segment reporting:
The Company and the Bank are engaged in the business of banking and provide a full range of financial services. The Company determines reportable segments based on the significance of the segment’s operating results to the overall Company, the products and services offered, customer characteristics, processes and service delivery of the segments and the regular financial performance review and allocation of resources by the Chief Executive Officer. The Company has identified two distinct reportable segments—Community Banking and Mortgage Banking. The Company’s primary segment is Community Banking, which provides a full range of deposit and lending products and services to corporate, commercial and consumer customers. The Company offers full-service conforming residential mortgage products, including conforming residential loans and services through the Mortgage Banking segment utilizing offices beyond the geographic footprint of the Community Banking operations as well as internet delivery channels. Additionally, the mortgage operation includes the servicing of residential mortgage loans and the packaging and securitization of loans to governmental agencies. The Company’s mortgage banking division represents a distinct reportable segment which differs from the Company’s primary business of commercial and retail banking.
The financial performance of the Mortgage Banking segment is assessed based on results of operations reflecting direct revenues and expenses and allocated expenses. This approach gives management a better indication of the operating performance of the segment. When assessing the Community Banking segment’s financial performance the Chief Executive Officer (CEO) utilize reports with indirect revenues and expenses including but not limited to the investment portfolio, electronic delivery channels and areas that primarily support the banking segment operations. Therefore these are included in the results of the Community Banking segment. Other indirect revenue and expenses related to general administrative areas are also included in the internal financial results reports of the Community Banking segment utilized by the CEO for analysis and are thus included for Community Banking segment reporting. The Mortgage Banking segment utilizes funding sources from the Community Banking segment in order to fund mortgage loans that are ultimately sold on the secondary market. The Mortgage Banking segment uses the proceeds from loan sales to repay obligations due to the Community Banking Segment. Transactions among segments are made at fair value.
F-34
Table of Contents
Index to Financial Statements
FB Financial Corporation and subsidiaries
Notes to condensed consolidated financial statements
(Unaudited)
During the three months ended March 31, 2016, the Company realigned its segment reporting structure to reclassify mortgage banking income and related expenses associated with retail mortgage originations within our Community banking geographic footprint from the Mortgage banking segment to the Community banking segment. This change was made to capture all of the product and service offerings for our Community banking customer base within our banking geographic footprint into the Community banking segment while capturing all of the mortgage banking activities outside of the banking footprint into the Mortgage banking segment to allow our chief executive officer to better determine resource allocations and operating performance for each segment. As such, the tables below have been revised to reflect the reclassification for all periods presented.
The following table provides segment financial information for the six months ended June 30, 2016 and 2015 follows:
| June 30, 2016 |
Community banking |
Mortgage | Consolidated | |||||||||
| Net interest income |
$ | 55,231 | $ | (930 | ) | 54,301 | ||||||
| Provision for loan loss |
(798 | ) | — | (798 | ) | |||||||
| Mortgage banking income |
13,359 | 41,277 | 54,636 | |||||||||
| Other noninterest income |
14,755 | — | 14,755 | |||||||||
| Depreciation |
1,802 | 220 | 2,022 | |||||||||
| Amortization of intangibles |
1,079 | — | 1,079 | |||||||||
| Amortization and impairment of mortgage servicing rights |
— | 9,112 | 9,112 | |||||||||
| Other noninterest expense |
50,870 | 28,859 | 79,729 | |||||||||
|
|
|
|||||||||||
| Income before income taxes |
30,392 | 2,156 | 32,548 | |||||||||
| State income tax expense |
2,174 | |||||||||||
|
|
|
|||||||||||
| Net income |
30,374 | |||||||||||
| Total assets |
$ | 2,508,867 | $ | 409,091 | $ | 2,917,958 | ||||||
| Goodwill |
46,767 | 100 | 46,867 | |||||||||
|
|
||||||||||||
| June 30, 2015 |
Community banking |
Mortgage | Consolidated | |||||||||
| Net interest income |
$ | 43,836 | $ | 605 | $ | 44,441 | ||||||
| Provision for loan loss |
222 | — | 222 | |||||||||
| Mortgage banking income |
8,352 | 22,935 | 31,287 | |||||||||
| Other noninterest income |
9,936 | — | 9,936 | |||||||||
| Depreciation and amortization |
1,414 | 148 | 1,562 | |||||||||
| Amortization of intangibles |
806 | — | 806 | |||||||||
| Amortization and impairment of mortgage servicing rights |
— | 779 | 779 | |||||||||
| Other noninterest expense |
39,125 | 18,761 | 57,886 | |||||||||
|
|
|
|||||||||||
| Income before income taxes |
20,557 | 3,852 | 24,409 | |||||||||
| State income tax expense |
1,649 | |||||||||||
|
|
|
|||||||||||
| Net income |
22,760 | |||||||||||
| Total assets |
$ | 2,248,240 | $ | 284,596 | $ | 2,532,836 | ||||||
| Goodwill |
46,804 | 100 | 46,904 | |||||||||
|
|
||||||||||||
F-35
Table of Contents
Index to Financial Statements
FB Financial Corporation and subsidiaries
Notes to condensed consolidated financial statements
(Unaudited)
Our Community Banking segment provides our Mortgage Banking segment with a warehouse line of credit that is used to find mortgage loans held for sale. The warehouse line of credit had a prime interest rate of 3.50% and 3.25% as of June 30, 2016 and 2015, respectively. The amount of interest paid by our Mortgage Banking segment to our Community Banking segment under this warehouse line of credit is recorded as interest income to our Community Banking segment and as interest expense to our Mortgage Banking segment, both of which are included in the calculation of net interest income for each segment. The amount of interest paid by our Mortgage Banking segment to our Community Banking segment under this warehouse line of credit was $5,083 and $4,079 for the six months ended June 30, 2016 and 2015, respectively.
Note (11)—Minimum capital requirements:
Banks and bank holding companies are subject to regulatory capital requirements administered by federal banking agencies. Capital adequacy guidelines and, additionally for banks, prompt corrective action regulations involve quantitative measures of assets, liabilities, and certain off-balance sheet items calculated under regulatory accounting practices. Capital amounts and classifications are also subject to qualitative judgments by regulators. Failure to meet capital requirements can initiate regulatory action.
For June 30, 2016 and December 31, 2015 Interim Final Basel III rules require the Bank to maintain minimum amounts and ratios of common equity Tier I capital to risk-weighted assets. Additionally under Basel III rules, the decision was made to opt-out of including accumulated other comprehensive income in regulatory capital. As of June 30, 2016 and December 31, 2015, the Bank and Company met all capital adequacy requirements to which it is subject. Also, as of June 30, 2016, the most recent notification from the FDIC, the Bank was well capitalized under the regulatory framework for prompt corrective action. There are no conditions or events since that notification that management believes have changed the Bank’s category.
F-36
Table of Contents
Index to Financial Statements
FB Financial Corporation and subsidiaries
Notes to condensed consolidated financial statements
(Unaudited)
The table below includes new regulatory capital ratio requirements that became effective on January 1, 2015. Beginning in 2016, an additional conservation buffer was added to the minimum requirements for capital adequacy purposes, subject to a three year phase-in period. The capital conservative buffer will be fully phased in January 1, 2019 at 2.5 percent.
Actual and required capital amounts and ratios are presented below at period-end (in thousands).
| Actual | For capital adequacy purposes |
Minimum Capital adequacy with capital buffer |
To be well
capitalized under prompt corrective action provisions |
|||||||||||||||||||||||||||||
| Amount | Ratio | Amount | Ratio | Amount | Ratio | Amount | Ratio | |||||||||||||||||||||||||
| June 30, 2016 |
||||||||||||||||||||||||||||||||
| Total Capital (to risk-weighted assets) |
||||||||||||||||||||||||||||||||
| FB Financial Corporation |
$ | 259,591 | 11.00% | $ | 188,793 | 8.0% | $ | 203,543 | 8.625% | N/A | N/A | |||||||||||||||||||||
| FirstBank |
256,548 | 10.92% | 187,947 | 8.0% | 202,631 | 8.625% | $ | 234,934 | 10.0% | |||||||||||||||||||||||
| Tier 1 Capital (to risk-weighted assets) |
||||||||||||||||||||||||||||||||
| FB Financial Corporation |
$ | 225,782 | 9.57% | $ | 141,556 | 6.0% | $ | 156,302 | 6.625% | N/A | N/A | |||||||||||||||||||||
| FirstBank |
226,814 | 9.65% | 141,024 | 6.0% | 155,714 | 6.625% | $ | 141,024 | 6.0% | |||||||||||||||||||||||
| Tier 1 Capital (to average assets) |
||||||||||||||||||||||||||||||||
| FB Financial Corporation |
$ | 225,782 | 7.98% | $ | 113,174 | 4.0% | N/A | N/A | N/A | N/A | ||||||||||||||||||||||
| FirstBank |
226,814 | 8.02% | 113,124 | 4.0% | N/A | N/A | $ | 141,405 | 5.0% | |||||||||||||||||||||||
| Common Equity Tier 1 Capital (to risk-weighted assets) |
||||||||||||||||||||||||||||||||
| FB Financial Corporation |
$ | 195,782 | 8.30% | $ | 106,147 | 4.5% | $ | 120,889 | 5.125% | N/A | N/A | |||||||||||||||||||||
| FirstBank |
226,814 | 9.65% | 105,768 | 4.5% | 120,458 | 5.125% | $ | 152,776 | 6.5% | |||||||||||||||||||||||
|
|
||||||||||||||||||||||||||||||||
| Actual | For capital adequacy purposes |
Minimum Capital adequacy with capital buffer |
To be well
capitalized under prompt corrective action provisions |
|||||||||||||||||||||||||||||
| Amount | Ratio | Amount | Ratio | Amount | Ratio | Amount | Ratio | |||||||||||||||||||||||||
| December 31, 2015 |
||||||||||||||||||||||||||||||||
| Total Capital (to risk-weighted assets) |
||||||||||||||||||||||||||||||||
| FB Financial Corporation |
$ | 246,168 | 11.15% | $ | 176,623 | 8.0% | N/A | N/A | N/A | N/A | ||||||||||||||||||||||
| FirstBank |
242,240 | 11.02% | 175,855 | 8.0% | N/A | N/A | $ | 219,819 | 10.0% | |||||||||||||||||||||||
| Tier 1 Capital (to risk-weighted assets) |
||||||||||||||||||||||||||||||||
| FB Financial Corporation |
$ | 211,633 | 9.58% | $ | 132,547 | 6.0% | N/A | N/A | N/A | N/A | ||||||||||||||||||||||
| FirstBank |
211,780 | 9.63% | 131,950 | 6.0% | N/A | N/A | $ | 131,950 | 6.0% | |||||||||||||||||||||||
| Tier 1 Capital (to average assets) |
||||||||||||||||||||||||||||||||
| FB Financial Corporation |
$ | 211,633 | 7.64% | $ | 110,803 | 4.0% | N/A | N/A | N/A | N/A | ||||||||||||||||||||||
| FirstBank |
211,780 | 7.65% | 110,735 | 4.0% | N/A | N/A | $ | 138,418 | 5.0% | |||||||||||||||||||||||
| Common Equity Tier 1 Capital (to risk-weighted assets) |
||||||||||||||||||||||||||||||||
| FB Financial Corporation |
$ | 181,633 | 8.23% | $ | 99,313 | 4.5% | N/A | N/A | N/A | N/A | ||||||||||||||||||||||
| FirstBank |
211,780 | 9.63% | 98,963 | 4.5% | N/A | N/A | $ | 142,946 | 6.5% | |||||||||||||||||||||||
|
|
||||||||||||||||||||||||||||||||
F-37
Table of Contents
Index to Financial Statements
FB Financial Corporation and subsidiaries
Notes to condensed consolidated financial statements
(Unaudited)
Note (12)—Related party transactions:
(A) Loans:
The Bank has made and expects to continue to make loans to the directors and executive officers of the Company and their affiliates in the ordinary course of business. In management’s opinion, these transactions with directors and executive officers were made on substantially the same terms as those prevailing at the time for comparable transactions with other unaffiliated persons and did not involve more than the normal risk.
An analysis of loans to executive officers, the shareholder of the Company, and directors of the Bank and their affiliates follows (in thousands):
| Loans outstanding at December 31, 2015 |
$ | 29,882 | ||
| New loans and advances |
2,275 | |||
| Repayments |
(8,382 | ) | ||
|
|
|
|||
| Loans outstanding at June 30, 2016 |
$ | 23,775 | ||
|
|
||||
Unfunded commitments to certain executive officers and directors and their associates totaled $4,305 and $7,212 at June 30, 2016 and December 31, 2015, respectively.
(B) Deposits:
The Bank held deposits from related parties totaling $88,445 and $68,612 as of June 30, 2016 and December 31, 2015, respectively.
(C) Leases:
The Bank leases various office spaces from entities related to the shareholder under varying terms. The Company had $169 and $180 in unamortized leasehold improvements related to these leases at June 30, 2016 and December 31, 2015, respectively. These improvements are being amortized over a term not to exceed the length of the lease. Lease expense for these properties totaled $264 and $251 for the six months ended June 30, 2016 and 2015, respectively.
(D) Consulting services:
The Bank paid $153 for the six months ended June 30, 2015 in management consulting services to an entity owned 100% by the shareholder. The agreement was terminated effective January 1, 2016.
(E) Subordinated debt:
On February 12, 1996, the Company borrowed $775 from the shareholder through a term subordinated note. On August 26, 1999, the Company borrowed $3,300 from the shareholder through a term subordinated note. On June 30, 2006, the Company borrowed $6,000 from the shareholder through a term subordinated note. The Company paid interest payments related to these subordinated debentures to the shareholder amounting to approximately $124 and $83 for the six months ended June 30, 2016 and 2015, respectively.
F-38
Table of Contents
Index to Financial Statements
FB Financial Corporation and subsidiaries
Notes to condensed consolidated financial statements
(Unaudited)
(F) Investment securities transactions:
The Company holds an investment in a fund that was issued by an entity owned by one of its directors. The balance in the investment was $1,472 and $1,472 as of June 30, 2016 and December 31, 2015, respectively. The Company did not receive any capital distributions during the six months ended June 30, 2016 and 2015.
F-39
Table of Contents
Index to Financial Statements
REPORT OF INDEPENDENT REGISTERED PUBLIC ACCOUNTING FIRM
To the Board of Directors
FB Financial Corporation
We have audited the accompanying consolidated balance sheets of FB Financial Corporation and subsidiaries as of December 31, 2015, 2014, and 2013 and the related consolidated statements of income, comprehensive income, changes in shareholder’s equity, and cash flows for the years then ended. These financial statements are the responsibility of the Company’s management. Our responsibility is to express an opinion on these financial statements based on our audits.
We conducted our audits in accordance with the standards of the Public Company Accounting Oversight Board (United States). Those standards require that we plan and perform the audit to obtain reasonable assurance about whether the financial statements are free of material misstatement. The Company is not required to have, nor were we engaged to perform, an audit of its internal control over financial reporting. Our audits included consideration of internal control over financial reporting as a basis for designing audit procedures that are appropriate in the circumstances, but not for the purpose of expressing an opinion on the effectiveness of the Company’s internal control over financial reporting. Accordingly, we express no such opinion. An audit also includes examining, on a test basis, evidence supporting the amounts and disclosures in the financial statements, assessing the accounting principles used and significant estimates made by management, as well as evaluating the overall financial statement presentation. We believe that our audits provide a reasonable basis for our opinion.
In our opinion, the consolidated financial statements referred to above present fairly, in all material respects, the financial position of FB Financial Corporation and subsidiaries as of December 31, 2015, 2014, and 2013 and the results of their operations and their cash flows for the years then ended in conformity with U.S. generally accepted accounting principles.
/s/ RSM US LLP
Jacksonville, Florida
March 30, 2016, except for Note 21 for which the date is June 24, 2016 and Note 25 for which the date is August 19, 2016
F-40
Table of Contents
Index to Financial Statements
FB Financial Corporation and subsidiaries
Consolidated balance sheets
December 31, 2015, 2014 and 2013
(Amounts are in thousands, except share information)
| December 31, | ||||||||||||
| 2015 | 2014 | 2013 | ||||||||||
| ASSETS |
||||||||||||
| Cash and due from banks |
$ | 53,893 | $ | 40,093 | $ | 41,943 | ||||||
| Federal funds sold |
21,628 | 8,964 | 5,969 | |||||||||
| Interest earning deposits in financial institutions |
22,202 | 897 | 19,685 | |||||||||
|
|
|
|||||||||||
| Cash and cash equivalents |
97,723 | 49,954 | 67,597 | |||||||||
| Available-for-sale securities, at fair value |
649,387 | 652,601 | 685,547 | |||||||||
| Federal Home Loan Bank stock, at cost |
6,528 | 6,528 | 6,528 | |||||||||
| Loans held for sale, at fair value |
273,196 | 194,745 | 61,062 | |||||||||
| Loans |
1,701,863 | 1,415,896 | 1,341,347 | |||||||||
| Less: Allowance for loan losses |
24,460 | 29,030 | 32,353 | |||||||||
|
|
|
|||||||||||
| Net loans |
1,677,403 | 1,386,866 | 1,308,994 | |||||||||
| Premises and equipment, net |
65,892 | 47,944 | 46,263 | |||||||||
| Foreclosed real estate |
11,641 | 7,259 | 8,796 | |||||||||
| Interest receivable |
6,763 | 6,616 | 6,662 | |||||||||
| Mortgage servicing rights, net |
29,711 | 6,032 | — | |||||||||
| Goodwill |
46,904 | 46,904 | 46,904 | |||||||||
| Core deposit intangible, net |
6,695 | 3,495 | 5,108 | |||||||||
| Other assets |
27,577 | 19,245 | 14,926 | |||||||||
|
|
|
|||||||||||
| Total assets |
$ | 2,899,420 | $ | 2,428,189 | $ | 2,258,387 | ||||||
|
|
|
|||||||||||
| LIABILITIES AND SHAREHOLDER’S EQUITY |
||||||||||||
| Liabilities |
||||||||||||
| Demand deposits: |
||||||||||||
| Noninterest-bearing |
$ | 626,955 | $ | 438,360 | $ | 356,844 | ||||||
| Interest-bearing |
1,273,438 | 1,010,079 | 933,705 | |||||||||
| Savings deposits |
212,522 | 165,017 | 157,788 | |||||||||
| Time deposits |
325,559 | 310,113 | 355,230 | |||||||||
|
|
|
|||||||||||
| Total deposits |
2,438,474 | 1,923,569 | 1,803,567 | |||||||||
| Securities sold under agreements to repurchase |
105,133 | 113,494 | 107,058 | |||||||||
| Short-term borrowings |
18,000 | 79,000 | 70,000 | |||||||||
| Long-term debt (see Note 24) |
56,616 | 64,850 | 67,861 | |||||||||
| Accrued expenses and other liabilities |
44,523 | 32,048 | 20,214 | |||||||||
|
|
|
|||||||||||
| Total liabilities |
2,662,746 | 2,212,961 | 2,068,700 | |||||||||
| Shareholder’s equity: |
||||||||||||
| Common stock, $1 par value; 25,000,000 shares authorized; 17,180,000 shares issued and outstanding |
17,180 | 17,180 | 17,180 | |||||||||
| Additional paid-in capital |
94,544 | 94,544 | 94,544 | |||||||||
| Retained earnings |
122,493 | 98,237 | 82,375 | |||||||||
| Accumulated other comprehensive income (loss), net |
2,457 | 5,267 | (4,412 | ) | ||||||||
|
|
|
|||||||||||
| Total shareholder’s equity |
236,674 | 215,228 | 189,687 | |||||||||
|
|
|
|||||||||||
| Total liabilities and shareholder’s equity |
$ | 2,899,420 | $ | 2,428,189 | $ | 2,258,387 | ||||||
|
|
||||||||||||
See accompanying notes to consolidated financial statements.
F-41
Table of Contents
Index to Financial Statements
FB Financial Corporation and subsidiaries
Consolidated statements of income
For years ended December 31, 2015, 2014 and 2013
(Amounts are in thousands except share and per share information)
| Years Ended December 31, | ||||||||||||
| 2015 | 2014 | 2013 | ||||||||||
| Interest income |
||||||||||||
| Interest and fees on loans |
$ | 87,723 | $ | 75,138 | $ | 70,243 | ||||||
| Interest on securities |
||||||||||||
| Taxable |
11,783 | 14,375 | 13,563 | |||||||||
| Tax-exempt |
2,808 | 2,932 | 2,844 | |||||||||
| Other |
468 | 444 | 432 | |||||||||
|
|
|
|||||||||||
| Total interest income |
102,782 | 92,889 | 87,082 | |||||||||
|
|
|
|||||||||||
| Interest expense: |
||||||||||||
| Deposits |
||||||||||||
| Demand and savings accounts |
4,733 | 4,241 | 4,337 | |||||||||
| Time deposits |
1,559 | 2,483 | 4,217 | |||||||||
| Short-term borrowings |
712 | 642 | 674 | |||||||||
| Long-term debt |
1,906 | 2,147 | 2,378 | |||||||||
|
|
|
|||||||||||
| Total interest expense |
8,910 | 9,513 | 11,606 | |||||||||
|
|
|
|||||||||||
| Net interest income |
93,872 | 83,376 | 75,476 | |||||||||
| Loan loss provision |
(3,064 | ) | (2,716 | ) | (1,519 | ) | ||||||
|
|
|
|||||||||||
| Net interest income after loan loss provision |
96,936 | 86,092 | 76,995 | |||||||||
| Noninterest income: |
||||||||||||
| Mortgage banking income |
70,190 | 31,135 | 23,968 | |||||||||
| Service charges on deposit accounts |
7,389 | 7,333 | 6,924 | |||||||||
| ATM and interchange fees |
6,536 | 5,633 | 5,234 | |||||||||
| Investment services income |
3,260 | 3,520 | 3,411 | |||||||||
| Bargain purchase gain |
2,794 | — | — | |||||||||
| Gain on sale of securities (see Note 24) |
1,844 | 2,000 | 34 | |||||||||
| Net (loss) gain on sales or write-downs of foreclosed assets |
(317 | ) | 132 | 225 | ||||||||
| Other |
684 | 1,049 | 1,590 | |||||||||
|
|
|
|||||||||||
| Total noninterest income |
92,380 | 50,802 | 41,386 | |||||||||
| Noninterest expenses: |
||||||||||||
| Salaries, commissions and employee benefits |
84,214 | 63,863 | 54,401 | |||||||||
| Occupancy and fixed asset expense |
10,777 | 9,421 | 8,832 | |||||||||
| Legal and professional fees |
3,355 | 3,175 | 2,435 | |||||||||
| Merger and conversion expenses |
3,543 | — | — | |||||||||
| Data processing expense |
2,053 | 2,430 | 2,826 | |||||||||
| Amortization of core deposit intangibles |
1,731 | 1,613 | 1,726 | |||||||||
| Amortization of mortgage servicing rights |
2,795 | 397 | — | |||||||||
| Regulatory fees and deposit insurance assessments |
2,190 | 1,938 | 2,150 | |||||||||
| Foreclosed assets expense |
643 | 1,121 | 1,946 | |||||||||
| Software license and maintenance fees |
1,986 | 1,416 | 1,808 | |||||||||
| Advertising |
7,866 | 2,873 | 1,390 | |||||||||
| Other |
17,339 | 13,916 | 12,070 | |||||||||
|
|
|
|||||||||||
| Total noninterest expense |
138,492 | 102,163 | 89,584 | |||||||||
|
|
|
|||||||||||
| Net income before income taxes |
50,824 | 34,731 | 28,797 | |||||||||
| State income tax expense |
2,968 | 2,269 | 1,894 | |||||||||
|
|
|
|||||||||||
| Net income |
$ | 47,856 | $ | 32,462 | $ | 26,903 | ||||||
|
|
|
|||||||||||
| Weighted average number of shares outstanding: |
||||||||||||
| Basic |
17,180,000 | 17,180,000 | 17,180,000 | |||||||||
| Fully diluted |
17,180,000 | 17,180,000 | 17,180,000 | |||||||||
| Earnings per share |
||||||||||||
| Basic |
$ | 2.79 | $ | 1.89 | $ | 1.57 | ||||||
| Fully diluted |
$ | 2.79 | $ | 1.89 | $ | 1.57 | ||||||
|
|
||||||||||||
See accompanying notes to consolidated financial statements.
F-42
Table of Contents
Index to Financial Statements
FB Financial Corporation and subsidiaries
Consolidated statements of comprehensive income
For years ended December 31, 2015, 2014 and 2013
(Amounts are in thousands)
| Years Ended December 31, | ||||||||||||
| 2015 | 2014 | 2013 | ||||||||||
| Net income |
$ | 47,856 | $ | 32,462 | $ | 26,903 | ||||||
| Other comprehensive income (loss), net of tax: |
||||||||||||
| Net change in unrealized (loss) gain in available-for-sale securities, net of tax of $(71), $802 and ($1,620) |
(1,057 | ) | 11,549 | (23,296 | ) | |||||||
| Reclassification adjustment for gain on sale of securities included in net income, net of tax expense of $91, $130 and $2 |
(1,753 | ) | (1,870 | ) | (32 | ) | ||||||
|
|
|
|||||||||||
| Comprehensive income |
$ | 45,046 | $ | 42,141 | $ | 3,575 | ||||||
|
|
||||||||||||
See accompanying notes to consolidated financial statements.
F-43
Table of Contents
Index to Financial Statements
FB Financial Corporation and subsidiaries
Consolidated statements of changes in shareholder’s equity
For years ended December 31, 2015, 2014 and 2013
(Amounts are in thousands except per share information)
| Common stock |
Additional paid-in capital |
Retained earnings |
Accumulated other comprehensive income (loss) |
Total shareholder’s equity |
||||||||||||||||
| Balance January 1, 2013 |
$ | 17,180 | $ | 94,544 | $ | 66,732 | $ | 18,916 | $ | 197,372 | ||||||||||
| Net income |
— | — | 26,903 | — | 26,903 | |||||||||||||||
| Other comprehensive loss net of taxes |
— | — | — | (23,328 | ) | (23,328 | ) | |||||||||||||
| Dividends declared ($0.66 per share) |
— | — | (11,260 | ) | — | (11,260 | ) | |||||||||||||
|
|
|
|||||||||||||||||||
| Balance December 31, 2013 |
17,180 | 94,544 | 82,375 | (4,412 | ) | 189,687 | ||||||||||||||
| Net income |
— | — | 32,462 | — | 32,462 | |||||||||||||||
| Other comprehensive income, net of taxes |
— | — | — | 9,679 | 9,679 | |||||||||||||||
| Dividends declared ($0.97 per share) |
— | — | (16,600 | ) | — | (16,600 | ) | |||||||||||||
|
|
|
|||||||||||||||||||
| Balance December 31, 2014 |
17,180 | 94,544 | 98,237 | 5,267 | 215,228 | |||||||||||||||
| Net income |
— | — | 47,856 | — | 47,856 | |||||||||||||||
| Other comprehensive loss, net of taxes |
— | — | — | (2,810 | ) | (2,810 | ) | |||||||||||||
| Dividends declared ($1.37 per share) |
— | — | (23,600 | ) | — | (23,600 | ) | |||||||||||||
|
|
|
|||||||||||||||||||
| Balance December 31, 2015 |
$ | 17,180 | $ | 94,544 | $ | 122,493 | $ | 2,457 | $ | 236,674 | ||||||||||
|
|
||||||||||||||||||||
See accompanying notes to consolidated financial statements.
F-44
Table of Contents
Index to Financial Statements
FB Financial Corporation and subsidiaries
Consolidated statements of cash flows
December 31, 2015, 2014 and 2013
(Amounts are in thousands)
| Years Ended December 31, | ||||||||||||
| 2015 | 2014 | 2013 | ||||||||||
| Cash flows from operating activities: |
||||||||||||
| Net income |
$ | 47,856 | $ | 32,462 | $ | 26,903 | ||||||
| Adjustments to reconcile net income to net cash (used in) provided by operating activities: |
||||||||||||
| Depreciation expense |
3,283 | 3,099 | 2,936 | |||||||||
| Amortization of core deposit intangibles |
1,731 | 1,613 | 1,726 | |||||||||
| Amortization of mortgage servicing rights |
2,601 | 397 | — | |||||||||
| Impairment of mortgage servicing rights |
194 | — | — | |||||||||
| Loan loss provision |
(3,064 | ) | (2,716 | ) | (1,519 | ) | ||||||
| Provision for mortgage loan repurchases |
1,375 | 161 | 327 | |||||||||
| Accretion of discounts and amortization of premiums on securities, net |
1,474 | 1,387 | 3,012 | |||||||||
| Gain on sales of securities (see Note 24) |
(1,844 | ) | (2,000 | ) | (34 | ) | ||||||
| Origination of loans held for sale |
(2,757,463 | ) | (1,156,187 | ) | (829,911 | ) | ||||||
| Origination of mortgage servicing rights |
(26,474 | ) | (6,429 | ) | — | |||||||
| Proceeds from sale of loans held for sale |
2,739,914 | 1,047,907 | 876,834 | |||||||||
| Gain on sale and change in fair value of loans held for sale |
(65,947 | ) | (30,617 | ) | (22,035 | ) | ||||||
| Bargain purchase gain |
(2,794 | ) | — | — | ||||||||
| Net loss (gain) on sales or write-downs of foreclosed assets |
317 | (132 | ) | (225 | ) | |||||||
| Loss on sales of premises and equipment |
13 | 19 | 67 | |||||||||
| Provision for deferred income tax |
1,647 | 842 | 351 | |||||||||
| Changes in: |
||||||||||||
| Other assets and interest receivable |
(1,301 | ) | (5,498 | ) | 4,178 | |||||||
| Accrued expenses and other liabilities |
13,200 | 10,085 | (1,649 | ) | ||||||||
|
|
|
|||||||||||
| Net cash (used in) provided by operating activities |
(45,282 | ) | (105,607 | ) | 60,961 | |||||||
| Cash flows from investing activities: |
||||||||||||
| Activity in available-for-sale securities: |
||||||||||||
| Sales |
194,611 | 68,900 | 108 | |||||||||
| Maturities, prepayments and calls |
103,233 | 84,386 | 157,521 | |||||||||
| Purchases |
(164,864 | ) | (109,709 | ) | (125,032 | ) | ||||||
| Net increase in loans |
(207,163 | ) | (73,111 | ) | (105,341 | ) | ||||||
| Purchases of premises and equipment |
(5,918 | ) | (5,424 | ) | (5,910 | ) | ||||||
| Purchase of FHLB stock |
— | — | (629 | ) | ||||||||
| Proceeds from the sale of foreclosed assets |
3,774 | 4,738 | 5,049 | |||||||||
| Proceeds from the sale of premises and equipment |
17 | 607 | 32 | |||||||||
| Net cash received in business combination (See Note 2) |
23,995 | — | — | |||||||||
|
|
|
|||||||||||
| Net cash used in investing activities |
(52,315 | ) | (29,613 | ) | (74,202 | ) | ||||||
| Cash flows from financing activities: |
||||||||||||
| Net increase in demand and savings deposits |
306,360 | 165,119 | 69,893 | |||||||||
| Net decrease in time deposits |
(37,671 | ) | (45,117 | ) | (87,071 | ) | ||||||
| Net (decrease) increase in short-term borrowings |
(89,739 | ) | 15,436 | 54,946 | ||||||||
| Payments on long-term debt |
(8,234 | ) | (3,011 | ) | (4,490 | ) | ||||||
| Dividends paid |
(25,350 | ) | (14,850 | ) | (11,260 | ) | ||||||
|
|
|
|||||||||||
| Net cash provided by financing activities |
145,366 | 117,577 | 22,018 | |||||||||
|
|
|
|||||||||||
| Net change in cash and cash equivalents |
47,769 | (17,643 | ) | 8,777 | ||||||||
| Cash and cash equivalents at beginning of the year |
49,954 | 67,597 | 58,820 | |||||||||
|
|
|
|||||||||||
| Cash and cash equivalents at end of the year |
$ | 97,723 | $ | 49,954 | $ | 67,597 | ||||||
|
|
|
|||||||||||
| Supplemental cash flow information: |
||||||||||||
| Interest paid |
$ | 8,985 | $ | 9,725 | $ | 12,161 | ||||||
| Taxes paid |
1,754 | 1,513 | 1,177 | |||||||||
| Supplemental noncash disclosures: |
||||||||||||
| Transfers from loans to foreclosed assets |
$ | 4,085 | $ | 4,308 | $ | 3,891 | ||||||
| Dividends declared not paid |
— | 1,750 | — | |||||||||
| Transfers from foreclosed assets to loans |
785 | 1,239 | 1,043 | |||||||||
| Transfers from loans held for sale to loans |
5,045 | 5,053 | 3,849 | |||||||||
|
|
||||||||||||
See accompanying notes to consolidated financial statements.
F-45
Table of Contents
Index to Financial Statements
FB Financial Corporation and subsidiaries
Notes to consolidated financial statements
December 31, 2015, 2014 and 2013
(Dollar Amounts in thousands)
Note (1)—Summary of significant accounting policies:
(A) Organization:
Effective March 8, 2016, the company formerly known as First South Bancorp, Inc. legally changed its name to FB Financial Corporation.
FB Financial Corporation (the “Company”), a bank holding company, and its wholly owned subsidiary, FirstBank (the “Bank”), are engaged in the business of banking and provide a full range of financial services to individual, corporate and public customers principally in Brentwood, Camden, Chattanooga, Crossville, Dayton, Dickson, Fairview, Fayetteville, Franklin, Goodlettsville, Hollow Rock, Huntingdon, Jackson, Knoxville, Lexington, Linden, Memphis, Mount Juliet, Murfreesboro, Nashville, Paris, Parsons, Scotts Hill, Shelbyville, Smithville, Smyrna, Waverly, and Woodbury, Tennessee, and the unincorporated areas of Bedford, Benton, Cannon, Carroll, Cumberland, Davidson, DeKalb, Decatur, Dickson, Hamilton, Henderson, Henry, Humphreys, Knox, Lincoln, Madison, Rhea, Rutherford, Shelby, Williamson and Wilson counties of Tennessee. The Bank also has a full service branch in Huntsville, Alabama to service customers in Huntsville and Madison County, Alabama and a loan origination office in Florence, Alabama to serve customers in Florence and Lauderdale County.
On September 18, 2015, the Company completed its acquisition of Northwest Georgia Bank (“NWGB”). This added locations in Ringgold, Georgia and Catoosa County, Georgia and additional locations in Chattanooga, Tennessee. The financial condition and results of operation for NWGB are included in the Company’s consolidated financial statements since the date of acquisition. See Note 2, “Acquisition of Northwest Georgia Bank” in the notes to the consolidated financial statements for further details regarding the terms and conditions of the Company’s acquisition of NWGB.
The Bank operates mortgage loan production offices for originations that are primarily sold in the secondary market. The Bank has loan origination specialists in various locations in Alabama, Arizona, California, Colorado, Connecticut, Delaware, Florida, Georgia, Illinois, Indiana, Kansas, Kentucky, Louisiana, Maryland, Massachusetts, Michigan, Missouri, Nevada, New Jersey, New York, North Carolina, Ohio, Pennsylvania, South Carolina, Tennessee, Texas, Virginia, Washington and Wisconsin. Additionally, the Bank operates a wholesale mortgage operation based in South Carolina and an online mortgage origination platform through offices in Charlotte, North Carolina servicing customers throughout the United States.
The Bank is subject to competition from other financial services companies and financial institutions. The Company and the Bank are also subject to the regulations of certain federal and state agencies and undergo periodic examinations by those regulatory authorities.
(B) Basis of presentation:
The accompanying consolidated financial statements have been prepared in conformity with accounting principles generally accepted in the United States of America and general banking industry. In preparing the financial statements, management is required to make estimates and assumptions that affect the reported amounts of assets and liabilities as of the date of the balance sheet and the reported results of operations for the year then ended.
F-46
Table of Contents
Index to Financial Statements
FB Financial Corporation and subsidiaries
Notes to consolidated financial statements
Actual results could differ significantly from those estimates. Material estimates that are particularly susceptible to significant changes in the near term relate to the determination of the allowance for loan losses, the valuation of real estate acquired in connection with foreclosures or in satisfaction of loans, and the determination of the fair value of financial instruments and mortgage servicing rights. In connection with the determination of the estimated fair value of foreclosed real estate and impaired loans, management obtains independent appraisals for significant properties.
The consolidated financial statements include the accounts of the Company, the Bank, and its’ wholly owned subsidiaries, FirstBank Insurance, Inc., First Holdings, Inc., RE Holdings, Inc., and Investors Title Company. All significant intercompany accounts and transactions have been eliminated in consolidation. Certain prior period amounts have been reclassified to conform to the current period presentation without any impact on the reported amounts of net income or shareholder’s equity.
(C) Cash flows:
For purposes of reporting consolidated cash flows, cash and cash equivalents include cash on hand, amounts due from banks, federal funds sold and interest earning deposits in other financial institutions with maturities of less than 90 days at the date of purchase. These amounts are reported in the consolidated balance sheets caption “Cash and cash equivalents.” Net cash flows are reported for loan, deposit, repurchase agreements, and federal funds sold, and short-term borrowings.
(D) Cash and cash equivalents:
The Company considers all highly liquid investments with a maturity of three months or less when purchased to be cash and cash equivalents.
(E) Investment securities:
Debt securities are classified as held to maturity and carried at amortized cost when management has the positive intent and ability to hold them to maturity. Debt securities are classified as available-for-sale when they might be sold before maturity. Equity securities with readily determinable fair values are classified as available-for-sale. Securities available-for-sale are carried at fair value, with unrealized holding gains and losses reported in other comprehensive income (loss), net of applicable taxes.
Interest income includes the amortization and accretion of purchase premium and discount. Premiums and discounts on securities are amortized on the level-yield method anticipating prepayments based upon the prior three month average monthly prepayments when available. Gains and losses on sales are recorded on the trade date and determined using the specific identification method.
The Company evaluates securities for other-than-temporary impairment (OTTI) at least on a quarterly basis, and more frequently when economic or market concerns warrant such evaluation. For securities in an unrealized loss position, consideration is given to the length of time and the extent to which the fair value has been less than cost, the financial condition and near-term prospects of the issuer, and the intent and ability of the Company to retain its investment in the issuer for a period of time sufficient to allow for any anticipated recovery in fair value. In analyzing an issuer’s financial condition, the Company considers whether the securities are issued by the federal government or its agencies, whether downgrades by bond rating agencies have occurred, and the results of reviews of the issuer’s financial condition.
F-47
Table of Contents
Index to Financial Statements
FB Financial Corporation and subsidiaries
Notes to consolidated financial statements
When OTTI is determined to have occurred, the amount of the OTTI recognized in earnings depends on whether we intend to sell the security or it is more likely than not that we will be required to sell the security before recovery of its amortized cost basis. If we intend to sell the security or it is more likely than not that we will be required to sell the security before recovery of its amortized cost basis, the OTTI recognized in earnings is equal to the entire difference between its amortized cost basis and its fair value at the date it was determined to be OTTI. If we do not intend to sell the security and it is not more likely than not that we will be required to sell the security before recovery of its amortized cost basis, the OTTI is separated into the amount representing the credit loss and the amount related to all other factors. The amount of the total related to the credit loss is determined based on the present value of cash flows expected to be collected and is recognized as a charge to earnings. The amount of the OTTI related to other factors is recognized in other comprehensive income (loss), net of applicable taxes. The previous amortized cost basis less the OTTI recognized in earnings becomes the new amortized cost basis of the investment.
The Company recorded no OTTI for the years ended December 31, 2015, 2014 and 2013.
(F) Loans held for sale:
Loans originated and intended for sale in the secondary market, primarily mortgage loans, are carried at fair value as permitted under the guidance in ASC 825, “Financial Instruments” (“ASC 825”). Net gains of $2,257, $5,095 and $1,593 resulting from fair value changes of these mortgage loans were recorded in income during 2015, 2014 and 2013, respectively. The amount does not reflect changes in fair values of related derivative instruments used to hedge exposure to market-related risks associated with these mortgage loans. The change in fair value of both mortgage loans held for sale and the related derivative instruments are recorded in “Mortgage banking income” in the Consolidated Statements of Income. Gains and losses are recognized as a charge to income at the time the loan is closed. These gains and losses are classified under the line item “Mortgage banking income” on the Consolidated Statements of Income. Pass through origination costs and related loan fees are also included in “Mortgage banking income”. Periodically, the Bank will transfer mortgage loans originated for sale in the secondary markets into the loan portfolio based on the overall secondary marketability of the loan based on current market conditions and the status of the loan. During 2015, 2014 and 2013, the Bank transferred approximately $5.0 million, $5.1 million and $3.8 million, respectively, of residential mortgage loans into its portfolio. The loans are transferred into the portfolio at fair value at the date of transfer.
(G) Loans:
Loans that management has the intent and ability to hold for the foreseeable future or until maturity or pay-off are stated at the principal amount outstanding. Interest on loans is recognized as income by using the simple interest method on daily balances of the principal amount outstanding.
Loans on which the accrual of interest has been discontinued are designated as nonaccrual loans. Accrual of interest is discontinued on loans past due 90 days or more unless the credit is well secured and in the process of collection. Also, a loan may be placed on nonaccrual status prior to becoming past due 90 days if management believes, after considering economic and business conditions and collection efforts, that the borrower’s financial condition is such that collection of principal or interest is doubtful. The decision to place a loan on nonaccrual status prior to becoming past due 90 days is based on an evaluation of the borrower’s financial condition, collateral liquidation value, economic and business conditions and other factors that affect
F-48
Table of Contents
Index to Financial Statements
FB Financial Corporation and subsidiaries
Notes to consolidated financial statements
the borrower’s ability to pay. When a loan is placed on nonaccrual status, the accrued but unpaid interest is charged against current period operations. Thereafter, interest on nonaccrual loans is recognized only as received if future collection of principal is probable. If the collectability of outstanding principal is doubtful, interest received is applied as a reduction of principal. A loan may be restored to accrual status when principal and interest are no longer past due or it otherwise becomes both well secured and collectability is reasonably assured.
(H) Allowance for loan losses:
The allowance for loan losses is a valuation allowance for probable incurred credit losses. Loan losses are charged against the allowance when management believes the uncollectibility of a loan balance is confirmed. Subsequent recoveries, if any, are credited to the allowance. Management estimates the allowance balance required using past loan loss experience, the nature and volume of the portfolio, information about specific borrower situations and estimated collateral values, economic conditions, and other factors. Allocations of the allowance may be made for specific loans, but the entire allowance is available for any loan that, in management’s judgment, should be charged off.
Factors considered by management in determining impairment include payment status, collateral value, and the probability of collecting scheduled principal and interest payments when due. Loans that experience insignificant payment delays and payment shortfalls generally are not classified as impaired. Management determines the significance of payment delays and payment shortfalls on case-by-case basis, taking into consideration all of the circumstances surrounding the loan and the borrower, including the length of the delay, the reasons for the delay, the borrower’s prior payment record, and the amount of the shortfall in relation to the principal and interest owed.
Commercial and commercial real estate loans over $250 are individually evaluated for impairment. If a loan is impaired, a portion of the allowance is allocated so that the loan is reported, net, at the present value of estimated future cash flows using the loan’s existing rate or at the fair value of collateral if repayment is expected solely from the collateral. Large groups of smaller balance homogeneous loans, such as consumer, residential real estate loans, commercial and commercial real estate loans less than $250 are collectively evaluated for impairment, and accordingly, they are not separately identified for impairment disclosures.
Loans for which the terms have been modified resulting in a concession, and for which the borrower is experiencing financial difficulties, are considered troubled debt restructurings (TDRs) and classified as impaired. TDRs are separately identified for impairment disclosures and are measured at the present value of estimated future cash flows using the loan’s effective rate at inception. If a TDR is considered to be a collateral dependent loan, the loan is reported, net, at the fair value of the collateral.
The general component covers non-impaired loans and is based on historical loss experience adjusted for current factors. The historical loss experience is determined by portfolio segment and is based on the actual loss history experienced by the Company over the most recent 5 years. This actual loss experience is supplemented with other economic factors based on the risks present for each portfolio segment. These economic factors include consideration of the following: levels of and trends in delinquencies and impaired loans; levels of and trends in charge-offs and recoveries; trends in volume and terms of loans; effects of any changes in risk selection and underwriting standards; other changes in lending policies, procedures, and practices; experience, ability, and depth of lending management and other relevant staff; national and local economic trends and conditions; industry conditions; and effects of changes in credit concentrations.
F-49
Table of Contents
Index to Financial Statements
FB Financial Corporation and subsidiaries
Notes to consolidated financial statements
The following portfolio segments have been identified:
Commercial and industrial loans. The Company provides a mix of variable and fixed rate commercial and industrial loans. Commercial and industrial loans are typically made to small- and medium-sized manufacturing, wholesale, retail and service businesses for working capital and operating needs and business expansions, including the purchase of capital equipment. Commercial and industrial loans generally include lines of credit and loans with maturities of five years or less. The loans are generally made with operating cash flows as the primary source of repayment, but may also include collateralization by inventory, accounts receivable, equipment and/or personal guarantees. The ability of the borrower to collect accounts receivable, and to turn inventory into sales are risk factors in the repayment of the loan.
Construction and land development loans. Construction and land development loans can carry risk of repayment when projects incur cost overruns, have an increase in the price of building materials, encounter zoning and environmental issues, or encounter other factors that may affect the completion of a project on time and on budget. Additionally, repayment risk may be negatively impacted when the market experiences a deterioration in the value of real estate.
Residential real estate 1-4 family mortgage loans. The Company’s residential real estate mortgage loans are primarily made with respect to and secured by single family homes, which are both owner-occupied and investor owned. First lien residential 1-4 family mortgages may be affected by unemployment or underemployment and deteriorating market values of real estate.
Residential line of credit loans. The Company’s residential line of credit loans are primarily revolving, open-end lines of credit secured by 1-4 residential properties. Second lien residential 1-4 family mortgages may be affected by unemployment or underemployment and deteriorating market values of real estate.
Multi-family residential loans. The Company’s multi-family residential loans are primarily secured by multi-family properties, such as apartments and condominium buildings. These loans may be affected by unemployment or underemployment and deteriorating market values of real estate.
Commercial real estate loans. The Company’s commercial real estate owner-occupied loans include loans to finance commercial real estate owner occupied properties for various purposes including use as offices, warehouses, production facilities, health care facilities, hotels, mixed-use residential/commercial, retail centers, multifamily properties, restaurants, churches, assisted living facilities and agricultural based facilities. Commercial real estate owner-occupied loans are typically repaid through the ongoing business operations of the borrower, and hence are dependent on the success of the underlying business for repayment and are more exposed to general economic conditions.
Commercial real estate non-owner occupied loans. The Company’s commercial real estate non-owner occupied loans include loans to finance commercial real estate non-owner occupied investment properties for various purposes including use as offices, warehouses, production facilities, health care facilities, hotels, mixed-use residential/commercial, retail centers, multifamily properties, restaurants, assisted living facilities and agricultural based facilities. Commercial real estate non-owner occupied loans are typically repaid with the funds received from the sale of the completed property or rental proceeds from such property, and are therefore more sensitive to adverse conditions in the real estate market, which can also affected by general economic conditions.
F-50
Table of Contents
Index to Financial Statements
FB Financial Corporation and subsidiaries
Notes to consolidated financial statements
Consumer and other loans. The Company’s consumer and other loans include loans to individuals for household, family and other personal expenditures that are not secured by real estate. Consumer loans are generally secured by vehicles and other household goods. The collateral securing consumer loans may depreciate over time. The company seeks to minimize these risks through its underwriting standards. Other loans also include loans to states and political subdivisions in the U.S. These loans are generally subject to the risk that the borrowing municipality or political subdivision may lose a significant portion of its tax base or that the project for which the loan was made may produce inadequate revenue.
(I) Business combinations, accounting for acquired loans and related assets:
Business combinations are accounted for by applying the acquisition method in accordance with ASC 805, “Business Combinations” (“ASC 805”). Under the acquisition method, identifiable assets acquired and liabilities assumed and any non-controlling interest in the acquiree at the acquisition date are measured at their fair values as of that date. Any excess of the purchase price over fair value of net assets acquired is recorded as goodwill. To the extent the fair value of net assets acquired, including any other identifiable intangible assets, exceed the purchase price, a bargain purchase gain is recognized. Results of operations of the acquired entities are included in the Consolidated Statements of Income from the date of acquisition.
Loans acquired in business combinations with evidence of credit deterioration since origination and for which it is probable that all contractually required payments will not be collected are considered to be credit-impaired. Acquired credit-impaired loans are accounted for under the accounting guidance for loans and debt securities acquired with deteriorated credit quality, in accordance with ASC 310-30, “Loans and Debt Securities Acquired with Deteriorated Credit Quality” (“ASC 310-30”), and initially measured at fair value, which includes estimated future credit losses expected to be incurred over the life of the loans. Increases in expected cash flows to be collected on these loans are recognized as an adjustment of the loan’s yield over its remaining life, while decreases in expected cash flows are recognized as an impairment. As a result, related discounts are recognized subsequently through accretion based on the expected cash flow of the acquired loans.
(J) Premises and equipment:
Land is carried at cost. Premises and equipment are stated at cost less accumulated depreciation. Provisions for depreciation are computed principally on the straight-line method and are charged to occupancy expense over the estimated useful lives of the assets. Maintenance agreements are amortized to expense over the period of time covered by the agreement. Costs of major additions, replacements or improvements are capitalized while expenditures for maintenance and repairs are charged to expense as incurred.
For financial statement purposes, the estimated useful life for premises is forty years, for furniture and fixtures the estimated useful life is seven to ten years, for leasehold improvements the estimated useful life is the lesser of twenty years or the term of the lease and for equipment the estimated useful life is three to seven years.
(K) Foreclosed real estate:
Real estate acquired through, or in lieu of, loan foreclosure is initially recorded at fair value less the estimated cost to sell at the date of foreclosure which may establish a new cost basis. After foreclosure, valuations are periodically performed by management and the asset is carried at the lower of carrying amount or fair value less costs to sell. Revenue and expenses from operations are included in other noninterest income and noninterest expenses. Losses due to the valuation of the property are included in loss on sales or write-downs of foreclosed assets.
F-51
Table of Contents
Index to Financial Statements
FB Financial Corporation and subsidiaries
Notes to consolidated financial statements
(L) Mortgage servicing rights:
The Company began retaining the right to service certain mortgage loans in 2014 that it sells to secondary market investors. The retained mortgage servicing right is initially recorded at the fair value of future net cash flows expected to be realized for performing servicing activities. These mortgage servicing rights are recognized as a separate asset on the date the corresponding mortgage loan is sold.
Mortgage servicing rights are amortized in proportion to and over the period of estimated net servicing income. These servicing rights are carried at the lower of amortized cost or fair value. Fair value is determined using an income approach with various assumptions including expected cash flows, prepayment speeds, market discount rates, servicing costs, and other factors. Mortgage servicing rights were carried at amortized cost less the reserve for impairment at December 31, 2015 and 2014. Impairment losses on mortgage servicing rights are recognized to the extent by which the unamortized cost exceeds fair value. Impairment losses on mortgage servicing rights of $194 and $-0- were recognized in earnings during the years ended December 31, 2015 and 2014, respectively.
(M) Transfers of financial assets:
Transfers of financial assets are accounted for as sales, when control over the assets has been relinquished. Control over transferred assets is deemed to be surrendered when the assets have been isolated from the Company, the transferee obtains the right (free of conditions that constrain it from taking advantage of that right) to pledge or exchange the transferred assets, and the Company does not maintain effective control over the transferred assets through an agreement to repurchase them before their maturity.
(N) Goodwill and other intangibles:
Goodwill represents the excess of the cost of an acquisition over the fair value of the net assets acquired. Goodwill impairment testing is performed annually or more frequently if events or circumstances indicate possible impairment. Goodwill is assigned to the Company’s reporting units, which are determined based on geography and may include one or more individual branches. Fair values of reporting units are determined using either discounted cash flow analyses based on internal financial forecasts or, if available, market-based valuation multiples for comparable businesses. If the estimated implied fair value of goodwill is less than the carrying amount, an impairment loss would be recognized as noninterest expense to reduce the carrying amount to the estimated implied fair value which could be material to our operating results for any particular reporting period. Through the annual assessment for impairment, performed as of December 31, no impairment was identified as a result of the testing performed during 2015, 2014 and 2013.
Other intangible assets consist of core deposit intangible assets arising from whole bank and branch acquisitions. They are initially measured at fair value and then amortized on a straight-line method over their estimated useful lives.
(O) Income taxes:
The Company has elected to be taxed under the provisions of subchapter S of the Internal Revenue Code. Under these provisions, the Company does not pay corporate federal income taxes on its taxable income. Instead, the shareholder is liable for individual income taxes on the Company’s taxable income. The Company is liable for
F-52
Table of Contents
Index to Financial Statements
FB Financial Corporation and subsidiaries
Notes to consolidated financial statements
Tennessee corporate income taxes. The Company and the Bank file consolidated federal and state income tax returns. Income tax expense is the total of the current year income tax due and the change in deferred tax assets and liabilities. Deferred tax assets and liabilities are the expected future tax amounts for the temporary differences between carrying amounts and tax bases of assets and liabilities, computed using enacted tax rates. A valuation allowance, if needed, reduces deferred tax assets to the amount expected to be realized. As changes in tax laws or rates are enacted, deferred tax assets and liabilities are adjusted through the provision for income taxes.
A tax position is recognized as a benefit only if it is “more likely than not” that the tax position would be sustained in a tax examination, with a tax examination being presumed to occur. The amount recognized is the largest amount of tax benefit that is greater than 50% likely of being realized on examination. For tax positions not meeting the “more likely than not” test, no tax benefit is recorded.
The Company’s policy is to recognize interest and penalties on uncertain tax positions in “Provision for income taxes” in the Consolidated Statements of Income. There were no amounts related to interest and penalties recognized for the years ended December 31, 2015, 2014 and 2013.
(P) Long-lived assets:
Premises and equipment, core deposit intangible assets, and other long-lived assets are reviewed for impairment when events indicate their carrying amount may not be recoverable from future undiscounted cash flows. If impaired, the assets are recorded at fair value. No long-lived assets were deemed to be impaired at December 31, 2015, 2014 and 2013.
(Q) Off-balance sheet financial instruments:
Financial instruments include off-balance sheet credit instruments, such as commitments to make loans and commercial letters of credit, issued to meet customer financing needs. The face amount for these items represents the exposure to loss, before considering customer collateral or ability to repay. Such financial instruments are recorded when they are funded, unless considered derivatives.
(R) Derivative financial instruments:
All derivative financial instruments are recorded at their fair values in other assets or other liabilities in the consolidated balance sheets. If derivative financial instruments are designated as hedges of fair values, both the change in the fair value of the hedge and the hedged item are included in current earnings. If derivative financial instruments are not designated as hedges, only the change in the fair value of the derivative instrument is included in current earnings.
(S) Rate-lock commitments and forward loan sale contracts:
The Company enters into commitments to originate loans whereby the interest rate on the loan is determined prior to funding (rate-lock commitments). Rate-lock commitments on mortgage loans that are intended to be sold are considered to be derivatives. Accordingly, such commitments, along with any related fees received from potential borrowers, are recorded at fair value in other assets or liabilities, with changes in fair value recorded in the line item “Mortgage banking income” on the Consolidated Statements of Income. Fair value is based on fees currently charged to enter into similar agreements, and for fixed-rate commitments, the difference between current levels of interest rates and the committed rates is also considered.
F-53
Table of Contents
Index to Financial Statements
FB Financial Corporation and subsidiaries
Notes to consolidated financial statements
The Company utilizes forward loan sale contracts and forward sales of residential mortgage-backed securities to mitigate the interest rate risk inherent in the Company’s mortgage loan pipeline and held-for-sale portfolio. Forward sale contracts are contracts for delayed delivery of mortgage loans or a group of loans pooled as mortgage-backed securities. The Company agrees to deliver on a specified future date, a specified instrument, at a specified price or yield. However, the contract may allow for cash settlement. The credit risk inherent to the Company arises from the potential inability of counterparties to meet the terms of their contracts. In the event of non-acceptance by the counterparty, the Company would be subject to the credit and inherent (or market) risk of the loans retained. Such contracts are accounted for as derivatives and, along with related fees paid to investor are recorded at fair value in derivative assets or liabilities, with changes in fair value recorded in the line item “Mortgage banking income” on the Consolidated Statements of Income. Fair value is based on the estimated amounts that the Company would receive or pay to terminate the commitment at the reporting date.
The Company utilizes two methods to deliver mortgage loans sold to an investor. Under a “best efforts” sales agreement, the Company enters into a sales agreement with an investor in the secondary market to sell the loan when an interest rate-lock commitment is entered into with a customer, as described above. Under a “best efforts” sales agreement, the Company is obligated to sell the mortgage loan to the investor only if the loan is closed and funded. Thus, the Company will not incur any liability to an investor if the mortgage loan commitment in the pipeline fails to close. The Company also utilizes “mandatory delivery” sales agreements. Under a mandatory delivery sales agreement, the Company commits to deliver a certain principal amount of mortgage loans to an investor at a specified price and delivery date. Penalties are paid to the investor should the Company fail to satisfy the contract. Mandatory commitments are recorded at fair value in the Company’s Consolidated Balance Sheets. Gains and losses arising from changes in the valuation of these commitments are recognized currently in earnings and are reflected under the line item “Other noninterest income” on the Consolidated Statements of Income.
(T) Comprehensive income (loss):
Comprehensive income (loss) consists of net income (loss) and other comprehensive income (loss). Other comprehensive income (loss) includes unrealized gains and losses on available-for-sale securities, net of taxes.
(U) Loss contingencies:
Loss contingencies, including claims and legal actions arising in the ordinary course of business, are recorded as liabilities when the likelihood of loss is probable and an amount or range of loss can be reasonably estimated. Management does not believe there are such matters that will have a material effect on the financial statements.
(V) Securities sold under agreements to repurchase:
The Company routinely sells securities to certain customers and then repurchases the securities the next business day. Securities sold under agreements to repurchase are reflected in the consolidated balance sheets at the amount of cash received in connection with each transaction. These are secured liabilities and are not covered by the Federal Deposit Insurance Corporation.
(W) Advertising expense:
Advertising costs, including costs related to internet mortgage marketing and related costs, are expensed as incurred. For the years ended December 31, 2015, 2014 and 2013, advertising costs were $7,866, $2,873 and $1,390, respectively.
F-54
Table of Contents
Index to Financial Statements
FB Financial Corporation and subsidiaries
Notes to consolidated financial statements
(X) Earnings per common share:
Basic net income per common share is calculated by dividing net income by the weighted-average number of common shares outstanding for the period. There were no dilutive instruments outstanding during the years of 2015, 2014 and 2013; therefore, diluted net income per common share is the same as basic net income per share.
(Y) Segment reporting:
The Company’s Mortgage Banking division represents a distinct reportable segment which differs from the Company’s primary business of Community Banking. Accordingly, a reconciliation of reportable segment revenues, expenses and profit to the Company’s consolidated total has been presented in Note 21.
(Z) Recent Accounting Pronouncements
In January 2014, the FASB issued ASU 2014-04, “Receivables—Troubled Debt Restructurings by Creditors (Subtopic 310-40): Reclassification of Residential Real Estate Collateralized Consumer Mortgage Loans upon Foreclosure (a consensus of the FASB Emerging Issues Task Force).” The ASU clarifies that a creditor is considered to have received physical possession, resulting from an in substance repossession or foreclosure, of residential real estate property collateralizing a consumer mortgage loan upon the occurrence of either (1) the creditor obtaining legal title to the residential real estate property upon completion of a foreclosure or (2) the borrower conveying all interest in the residential real estate property to the creditor to satisfy that loan through completion of a deed in lieu of foreclosure or through a similar legal agreement. The ASU became effective for fiscal years and interim periods beginning after December 15, 2014. The adoption of this ASU did not have a significant impact on the Company’s financial position, results of operations, or EPS.
In May 2014, the FASB issued an update to ASU No. 2014-09, “Revenue from Contracts with Customers” (FASB Topic 606). The guidance in this update affects any entity that either enters into contracts with customers to transfer goods or services or enters into contracts for the transfer of nonfinancial assets unless those contracts are within the scope of other standards (for example, insurance contracts or lease contracts). The core principle of the guidance is that an entity should recognize revenue to depict the transfer of promised goods or services to customers in an amount that reflects the consideration to which the entity expects to be entitled in exchange for those goods or services. The guidance provides steps to follow to achieve the core principle. An entity should disclose sufficient information to enable users of financial statements to understand the nature, amount, timing and uncertainty of revenue and cash flows arising from contracts with customers. Qualitative and quantitative information is required about contracts with customers, significant judgments and changes in judgments, and assets recognized from the costs to obtain or fulfill a contract. The amendments in this update are effective for interim and annual reporting periods beginning after December 15, 2017. Adoption of this ASU will not have a significant impact on the Company’s financial position, results of operation, or EPS.
In June 2014, the FASB issued ASU 2014-11, “Transfers and Servicing (Topic 860): Repurchase-to-Maturity Transactions, Repurchase Financings, and Disclosures.” The ASU changes the accounting for repurchase-to-maturity transactions from sale to secured borrowing accounting. Also, for repurchase financing arrangements, the amendments require separate accounting for a transfer of a financial asset executed contemporaneously with a repurchase agreement with the same counterparty, which will result in secured borrowing accounting for the repurchase agreement. Additional disclosures are required for all types of repurchase agreements. The ASU
F-55
Table of Contents
Index to Financial Statements
FB Financial Corporation and subsidiaries
Notes to consolidated financial statements
became effective for fiscal years and interim periods beginning after December 15, 2014. Adoption of the ASU did not have a significant impact on the Company’s financial position, results of operations, or EPS.
In August 2014, the FASB issued ASU 2014-14, “Receivables—Troubled Debt Restructurings by Creditors (Subtopic 310-40): Classification of Certain Government-Guaranteed Mortgage Loans upon Foreclosure (a consensus of the FASB Emerging Issues Task Force).” The ASU requires that a guaranteed mortgage loan be derecognized and that a separate other receivable be recognized upon foreclosure if certain conditions are met. Upon foreclosure, the separate other receivable should be measured based on the guaranteed amount of the loan balance (principal and interest) expected to be recovered from the guarantor. The ASU became effective for fiscal years and interim periods beginning after December 15, 2014. Adoption of the ASU did not have a significant impact on the Company’s financial position, results of operations, or EPS.
In September 2015, the FASB issued ASU 2015-16, “Simplifying the Accounting for Measurement-Period Adjustments.” The update requires acquirers to adjust provisional amounts identified during the measurement period in the reporting period in which the adjustments are determined, rather than retrospectively adjusting previously reported information. Additional disclosure of the impact of measurement period adjustments on current year earnings will also be required. For public business entities, the amendments of this update are effective for interim and annual periods beginning after December 15, 2015. The Company has elected to early adopt this ASU for the year ended December 31, 2015. The adoption of this ASU did not have a material impact on the Company’s financial position, results of operation, or EPS.
In January 2016, the FASB released ASU 2016-01, “Recognition and Measurement of Financial Assets and Liabilities.” The main provisions of the update are to eliminate the available for sale classification of accounting for equity securities and adjust the fair value disclosures for financial instruments carried at amortized costs such that the disclosed fair values represent an exit price as opposed to an entry price. The provisions of this update will require that equity securities be carried at fair market value on the balance sheet and any periodic changes in value will be adjustments to the income statement. A practical expedient is provided for equity securities without a readily determinable fair value such that these securities can be carried at cost less any impairment. The provisions of this update become effective for interim and annual periods beginning after December 15, 2017. Management does not expect the requirements of this update to have a significant impact on the Company’s financial position, results of operation, or EPS.
In February 2016, the FASB issued Accounting Standards Update (ASU) 2016-02, “Leases (Topic 842).” The update will requires lessees to recognize right-of-use assets and lease liabilities for all leases not considered short term leases. The provisions of the update also include (a) defining direct costs to only include those incremental costs that would not have been incurred if the lease had not been entered into, (b) circumstances under which the transfer contract in a sale-leaseback transaction should be accounted for as the sale of an asset by the seller-lessee and the purchase of an asset by the buyer-lessor, and (c) additional disclosure requirements. The provisions of this update are expected to become effective in 2019. Management is currently evaluating the potential impact of this update, but does not expect the requirements to have a significant impact on the Company’s financial position, results of operation, or EPS.
Note (2)—Acquisition of Northwest Georgia Bank
On September 18, 2015, the Company completed its acquisition of Northwest Georgia Bank (NWGB), a bank headquartered in Ringgold, Georgia, pursuant to that certain Agreement and Plan of Merger dated April 27, 2015 by and between the Bank and NWGB. Pursuant to the Agreement and Plan of Merger, NWGB was merged
F-56
Table of Contents
Index to Financial Statements
FB Financial Corporation and subsidiaries
Notes to consolidated financial statements
with and into the Bank, with the Bank as the surviving entity. Prior to the acquisition, NWGB operated six banking locations in Georgia and Tennessee. The acquisition of NWGB allowed the Company to further its strategic initiatives by expanding its geographic footprint into certain markets of Georgia and Tennessee. The Company acquired NWGB in a $1,500 cash purchase.
The Company recorded a bargain purchase gain of $2,793 and a core deposit intangible asset of $4,931. The fair value of the core deposit intangible is being amortized on a straight-line basis over the estimated useful life, currently expected to be approximately 10 years.
For income tax purposes, the acquisition of NWGB was treated as an asset purchase. As an asset purchase for income tax purposes, the carrying value of assets and liabilities for NWGB are the same for both financial reporting and income tax purposes; therefore, no deferred taxes were recorded at the date of acquisition except for $191 deferred tax liability recorded for the bargain purchase gain. Additionally, this treatment allows for the deductibility for income tax purposes for the core deposit intangible recorded for the NWGB merger over 15 years, net of the bargain purchase gain.
In connection with the transaction, the Company incurred $3,543 in merger and conversion costs. The Company’s planned conversion of its core operating system to Jack Henry Silverlake platform resulted in a termination fee to be paid to its current provider of approximately $2.2 million, which is included in merger and conversion expense for the year ended December 31, 2015 and paid subsequent to year end.
The following table summarizes the final allocation of purchase price to assets and liabilities acquired in connection with the merger with NWGB based on estimated fair value on September 18, 2015.
| (Dollar amounts in thousands) | ||||||||
| Final Allocation of Purchase Price for Northwest Georgia Bank: |
||||||||
| Total cash purchase price |
$ | 1,500 | ||||||
| Net assets acquired: |
||||||||
| Stockholders’ equity at September 18, 2015 |
$ | 6,478 | ||||||
| Increase (decrease) to net assets as a result of fair value adjustments to assets acquired and liabilities assumed: |
||||||||
| Securities |
535 | |||||||
| Loans, net of the reversal of NWGB’s allowance for loan losses of $4,383 |
(8,024 | ) | ||||||
| Premises and equipment |
3,731 | |||||||
| Core deposits intangible |
4,931 | |||||||
| Foreclosed real estate |
(1,922 | ) | ||||||
| Other assets |
(264 | ) | ||||||
| Deposits |
(302 | ) | ||||||
| FHLB funds purchased |
(378 | ) | ||||||
| Other liabilities |
(491 | ) | ||||||
|
|
|
|||||||
| Total net fair value adjustments |
4,294 | |||||||
| Bargain purchase gain(1) |
$ | 2,794 | ||||||
|
|
||||||||
| (1) | The bargain purchase gain resulting from the merger has been recognized in the Community Banking operating segment. |
F-57
Table of Contents
Index to Financial Statements
FB Financial Corporation and subsidiaries
Notes to consolidated financial statements
The following table summarizes the estimated fair value of assets acquired and liabilities assumed at acquisition date in connection with the merger with NWGB.
| Cash and cash equivalents |
$ | 25,495 | ||
| Securities available-for-sale |
134,278 | |||
| Loans |
78,565 | |||
| Premises and equipment |
15,343 | |||
| Intangible assets |
4,931 | |||
| Foreclosed real estate |
5,002 | |||
| Other assets |
8,735 | |||
|
|
|
|||
| Total assets |
$ | 272,349 | ||
|
|
|
|||
| Deposits |
$ | 246,216 | ||
| Borrowings |
20,378 | |||
| Other liabilities |
1,461 | |||
|
|
|
|||
| Total liabilities |
$ | 268,055 | ||
|
|
|
|||
| Purchase price |
1,500 | |||
|
|
|
|||
| Bargain purchase gain |
$ | 2,794 | ||
|
|
||||
The following table presents the fair value of loans acquired from NWGB as of the September 18, 2015 acquisition date:
| At acquisition date: | September 18, 2015 | |||
| Contractually-required principal and interest |
$ | 91,079 | ||
| Nonaccretable difference |
(8,578 | ) | ||
|
|
|
|||
| Cash flows expected to be collected |
82,501 | |||
| Accretable yield |
(3,936 | ) | ||
|
|
|
|||
| Fair value |
$ | 78,565 | ||
|
|
||||
F-58
Table of Contents
Index to Financial Statements
FB Financial Corporation and subsidiaries
Notes to consolidated financial statements
The following unaudited pro forma combined condensed consolidated financial information presents the results of operations for the year ended December 31, 2015 and 2014 of the Company as though the merger with NWGB had been completed as of January 1, 2014. The unaudited estimated pro forma information combines the historical results of NWGB with the Company’s historical consolidated results and includes certain adjustments reflecting the estimated impact of certain fair value adjustments for the periods presented. The pro forma information is not indicative of what would have occurred had the acquisition taken place on January 1, 2014. The pro forma information does not include the effect of any cost-saving or revenue-enhancing strategies. The bargain purchase gain and merger expenses are reflected in the period in which they were incurred.
| Years Ended December 31, | ||||||||
| 2015 | 2014 | |||||||
| Interest income |
$ | 108,857 | $ | 104,055 | ||||
| Interest expense |
9,631 | 10,663 | ||||||
|
|
|
|||||||
| Net interest income |
99,226 | 93,392 | ||||||
| Provision for loan losses |
(3,064 | ) | (2,404 | ) | ||||
| Noninterest income |
91,776 | 54,131 | ||||||
| Noninterest expense |
145,060 | 117,473 | ||||||
|
|
|
|||||||
| Income before income taxes |
49,006 | 32,454 | ||||||
| Income taxes |
2,964 | 2,296 | ||||||
|
|
|
|||||||
| Net income |
$ | 46,042 | $ | 30,158 | ||||
| Earnings per share |
||||||||
| Basic |
$ | 2.68 | $ | 1.76 | ||||
| Diluted |
$ | 2.68 | $ | 1.76 | ||||
|
|
||||||||
As noted in Note 1, the Company elected to early adopt ASU 2015-16, “Simplifying the Accounting for Measurement Period Adjustments” as of December 31, 2015. As such, the measurement period is closed.
Note (3)—Cash and cash equivalents concentrations:
As of December 31, 2015, 2014 and 2013, the Bank and its subsidiaries had concentrations of credit risk with financial institutions in the form of correspondent bank accounts which are included in cash and cash equivalents and interest bearing deposits. Correspondent bank balances are maintained for check clearing and other services.
F-59
Table of Contents
Index to Financial Statements
FB Financial Corporation and subsidiaries
Notes to consolidated financial statements
The Bank had amounts due from their correspondent institutions at December 31, 2015, 2014 and 2013, as follows (in thousands):
| Years Ended December 31, | ||||||||||||
| 2015 | 2014 | 2013 | ||||||||||
| First Tennessee Bank, N.A. |
$ | 32,497 | $ | 26,968 | $ | 26,126 | ||||||
| Federal Reserve Bank |
20,460 | 778 | 17,799 | |||||||||
| Federal Home Loan Bank of Cincinnati |
3,368 | 1,743 | 3,511 | |||||||||
| JP Morgan Chase |
4,596 | 1,799 | 1,709 | |||||||||
| Fifth Third Bank |
879 | — | — | |||||||||
| Compass Bank |
684 | 261 | 1,002 | |||||||||
| Zions Bank |
500 | 300 | 300 | |||||||||
| Columbus Bank and Trust |
444 | — | — | |||||||||
| SunTrust Bank |
232 | 252 | 254 | |||||||||
| PNC Bank |
219 | 221 | 224 | |||||||||
| Servis FirstBank |
250 | 250 | — | |||||||||
| First National Bankers’ Bank |
200 | 200 | 200 | |||||||||
|
|
|
|||||||||||
| Total |
$ | 64,329 | $ | 32,772 | $ | 51,125 | ||||||
|
|
||||||||||||
Interest is earned on balances at the Federal Reserve Bank and at the Federal Home Loan Bank.
Note (4)—Investment securities:
The amortized cost of securities and their fair values at December 31, 2015, 2014 and 2013, are as follows (in thousands):
| December 31, 2015 | Amortized cost |
Gross unrealized gains |
Gross unrealized losses |
Fair value |
||||||||||||
| Securities Available-for-Sale |
||||||||||||||||
| Debt Securities |
||||||||||||||||
| U.S. Government agency securities |
$ | 34,161 | $ | — | $ | (353 | ) | $ | 33,808 | |||||||
| Mortgage-backed securities – residential |
524,141 | 3,675 | (5,443 | ) | 522,373 | |||||||||||
| Municipals, tax exempt |
74,945 | 4,892 | — | 79,837 | ||||||||||||
| Treasury securities |
4,507 | — | (22 | ) | 4,485 | |||||||||||
|
|
|
|||||||||||||||
| Total debt securities |
637,754 | 8,567 | (5,818 | ) | 640,503 | |||||||||||
| Equity securities |
8,971 | 3 | (90 | ) | 8,884 | |||||||||||
|
|
|
|||||||||||||||
| Total securities available-for-sale |
$ | 646,725 | $ | 8,570 | $ | (5,908 | ) | $ | 649,387 | |||||||
|
|
||||||||||||||||
| December 31, 2014 | ||||||||||||||||
| Securities Available-for Sale |
||||||||||||||||
| Debt Securities |
||||||||||||||||
| U.S. Government agency securities |
$ | 29,149 | $ | — | $ | (632 | ) | $ | 28,517 | |||||||
| Mortgage-backed securities – residential |
529,546 | 5,629 | (4,975 | ) | 530,200 | |||||||||||
| Municipals, tax exempt |
79,547 | 5,688 | (28 | ) | 85,207 | |||||||||||
|
|
|
|||||||||||||||
| Total debt securities |
638,242 | 11,317 | (5,635 | ) | 643,924 | |||||||||||
| Equity securities |
8,725 | 13 | (61 | ) | 8,677 | |||||||||||
|
|
|
|||||||||||||||
| Total securities available-for-sale |
$ | 646,967 | $ | 11,330 | $ | (5,696 | ) | $ | 652,601 | |||||||
|
|
||||||||||||||||
F-60
Table of Contents
Index to Financial Statements
FB Financial Corporation and subsidiaries
Notes to consolidated financial statements
| December 31, 2013 | Amortized cost |
Gross unrealized gains |
Gross unrealized losses |
Fair value |
||||||||||||
| Securities Available-for Sale |
||||||||||||||||
| Debt Securities |
||||||||||||||||
| U.S. Government agency securities |
$ | 29,148 | $ | — | $ | (1,393 | ) | $ | 27,755 | |||||||
| Mortgage-backed securities – residential |
579,112 | 4,486 | (11,304 | ) | 572,294 | |||||||||||
| Municipals, tax exempt |
73,507 | 3,403 | (269 | ) | 76,641 | |||||||||||
| Corporate securities |
165 | 468 | — | 633 | ||||||||||||
|
|
|
|||||||||||||||
| Total debt securities |
681,932 | 8,357 | (12,966 | ) | 677,323 | |||||||||||
| Equity securities |
8,334 | 4 | (114 | ) | 8,224 | |||||||||||
|
|
|
|||||||||||||||
| Total securities available-for-sale |
$ | 690,266 | $ | 8,361 | $ | (13,080 | ) | $ | 685,547 | |||||||
|
|
||||||||||||||||
Securities pledged at December 31, 2015, 2014 and 2013 had a carrying amount of $525,253, $588,528 and $512,058, respectively, and were pledged to secure Federal Home Loan Bank advances, a Federal Reserve Bank line of credit, public deposits and repurchase agreements.
The amortized cost and fair value of debt securities by contractual maturity at December 31, 2015, 2014 and 2013, as shown below (in thousands). Maturities may differ from contractual maturities in mortgage-backed securities because the mortgage underlying the security may be called or repaid without any penalties. Therefore, mortgage-backed securities are not included in the maturity categories in the following maturity summary.
| 2015 | 2014 | 2013 | ||||||||||||||||||||||
| Amortized cost |
Fair value |
Amortized cost |
Fair value |
Amortized cost |
Fair value |
|||||||||||||||||||
| Due in one year or less |
$ | 6,849 | $ | 6,886 | $ | 1,746 | $ | 1,771 | $ | 2,225 | $ | 2,248 | ||||||||||||
| Due in one to five years |
44,108 | 44,358 | 29,516 | 29,141 | 6,577 | 7,037 | ||||||||||||||||||
| Due in five to ten years |
29,964 | 31,927 | 32,509 | 33,994 | 50,845 | 49,948 | ||||||||||||||||||
| Due in over ten years |
32,692 | 34,959 | 44,925 | 48,818 | 43,173 | 45,796 | ||||||||||||||||||
|
|
|
|||||||||||||||||||||||
| 113,613 | 118,130 | 108,696 | 113,724 | 102,820 | 105,029 | |||||||||||||||||||
| Mortgage-backed securities – residential |
524,141 | 522,373 | 529,546 | 530,200 | 579,112 | 572,294 | ||||||||||||||||||
|
|
|
|||||||||||||||||||||||
| $ | 637,754 | $ | 640,503 | $ | 638,242 | $ | 643,924 | $ | 681,932 | $ | 677,323 | |||||||||||||
|
|
||||||||||||||||||||||||
Sales of available-for-sale securities were as follows (in thousands):
| 2015 | 2014 | 2013 | ||||||||||
| Proceeds from sales |
$ | 194,611 | $ | 68,900 | $ | 108 | ||||||
| Gross realized gains |
1,844 | 2,000 | 34 | |||||||||
|
|
||||||||||||
F-61
Table of Contents
Index to Financial Statements
FB Financial Corporation and subsidiaries
Notes to consolidated financial statements
The following tables show gross unrealized losses at year end 2015, 2014 and 2013, aggregated by investment category and length of time that individual securities have been in a continuous unrealized loss position (in thousands):
| Less than 12 months | 12 months or more | Total | ||||||||||||||||||||||
| December 31, 2015 | Fair value |
Unrealized loss |
Fair value |
Unrealized loss |
Fair value |
Unrealized loss |
||||||||||||||||||
| U.S. Government agencies |
$ | 15,887 | $ | 124 | $ | 17,921 | $ | 229 | $ | 33,808 | $ | 353 | ||||||||||||
| Mortgage-Backed Securities – residential |
219,756 | 1,778 | 121,362 | 3,665 | 341,118 | 5,443 | ||||||||||||||||||
| Treasury securities |
4,485 | 22 | — | — | 4,485 | 22 | ||||||||||||||||||
|
|
|
|||||||||||||||||||||||
| Total Debt |
240,128 | 1,924 | 139,283 | 3,894 | 379,411 | 5,818 | ||||||||||||||||||
| Equity securities |
— | — | 1,583 | 90 | 1,583 | 90 | ||||||||||||||||||
| $ | 240,128 | $ | 1,924 | $ | 140,866 | $ | 3,984 | $ | 380,994 | $ | 5,908 | |||||||||||||
|
|
||||||||||||||||||||||||
| Less than 12 months | 12 months or more | Total | ||||||||||||||||||||||
| December 31, 2014 | Fair value |
Unrealized loss |
Fair value |
Unrealized loss |
Fair value |
Unrealized loss |
||||||||||||||||||
| U.S. Government agencies |
$ | — | $ | — | $ | 28,517 | $ | 632 | $ | 28,517 | $ | 632 | ||||||||||||
| Mortgage-Backed Securities – residential |
25,900 | 30 | 188,664 | 4,945 | 214,564 | 4,975 | ||||||||||||||||||
| Municipals tax-exempt |
321 | 5 | 1,708 | 23 | 2,029 | 28 | ||||||||||||||||||
|
|
|
|||||||||||||||||||||||
| Total Debt |
26,221 | 35 | 218,889 | 5,600 | 245,110 | 5,635 | ||||||||||||||||||
| Equity securities |
1,536 | 61 | — | — | 1,536 | 61 | ||||||||||||||||||
|
|
|
|||||||||||||||||||||||
| $ | 27,757 | $ | 96 | $ | 218,889 | $ | 5,600 | $ | 246,646 | $ | 5,696 | |||||||||||||
|
|
||||||||||||||||||||||||
| December 31, 2013 | ||||||||||||||||||||||||
| U.S. Government agencies |
$ | 24,849 | $ | 1,150 | $ | 2,906 | $ | 243 | $ | 27,755 | $ | 1,393 | ||||||||||||
| Mortgage-Backed Securities – residential |
374,796 | 11,304 | — | — | 374,796 | 11,304 | ||||||||||||||||||
| Municipals tax-exempt |
5,548 | 269 | — | — | 5,548 | 269 | ||||||||||||||||||
|
|
|
|||||||||||||||||||||||
| Total Debt |
405,193 | 12,723 | 2,906 | 243 | 408,099 | 12,966 | ||||||||||||||||||
| Equity securities |
8,224 | 114 | — | — | 8,224 | 114 | ||||||||||||||||||
|
|
|
|||||||||||||||||||||||
| $ | 413,417 | $ | 12,837 | $ | 2,906 | $ | 243 | $ | 416,323 | $ | 13,080 | |||||||||||||
|
|
||||||||||||||||||||||||
As of December 31, 2015, 2014 and 2013, the Company’s security portfolio consisted of 274, 260 and 256 securities 64, 32 and 54, of which were in an unrealized loss position, respectively.
As described in Note 1, in analyzing an issuer’s financial condition, the Company considers whether the securities are issued by the federal government or its agencies, whether downgrades by bond rating agencies have occurred, and the results of reviews of the issuer’s financial condition. The Company recorded no OTTI for the years ended December 31, 2015, 2014 and 2013. For debt securities, the Company currently does not intend to sell those investments with unrealized losses, and it is unlikely that the Company will be required to sell the investments before recovery of their amortized cost bases, which may be maturity. For equity securities, the
F-62
Table of Contents
Index to Financial Statements
FB Financial Corporation and subsidiaries
Notes to consolidated financial statements
Company has evaluated the near-term prospects of the investment in relation to the severity and duration of the impairment and based on that evaluation has the ability and intent to hold these investments until a recovery of fair value.
On June 26, 2014 the Company sold its pooled trust-preferred securities at par to the shareholder (see Note 24). The Company had previously charged $449 to earnings as OTTI. At the time of the sale, the securities had a carrying value of $110. The Company received $1,149 from the sale. Of this amount, $457 was recorded as interest income as the securities had been treated as non-accrual and any payments received had been used to reduce principal. The Company also recognized a gain of $582.
The table below presents a rollforward for the years ended December 31, 2015, 2014 and 2013 of the credit losses recognized in earnings for securities held at period end:
| 2015 | 2014 | 2013 | ||||||||||
| Beginning balance, January 1 |
$ | — | $ | 449 | $ | 449 | ||||||
| Reductions for previous credit losses realized on securities sold during the year |
— | (449 | ) | — | ||||||||
|
|
|
|||||||||||
| Ending balance, December 31 |
$ | — | $ | — | $ | 449 | ||||||
|
|
||||||||||||
Subsequent to December 31, 2015, the Company sold $101,393 of securities available for sale as part of asset liability management and recognized a gain of $1,398.
Note (5)—Loans and allowance for loan losses:
Loans outstanding at December 31, 2015, 2014 and 2013, by major lending classification are as follows (in thousands):
| December 31, | ||||||||||||
| 2015 | 2014 | 2013 | ||||||||||
| Commercial and industrial |
$ | 317,038 | $ | 262,682 | $ | 251,557 | ||||||
| Construction |
231,025 | 161,828 | 112,060 | |||||||||
| Residential real estate: |
||||||||||||
| 1-to-4 family mortgage |
287,749 | 263,899 | 251,271 | |||||||||
| Residential line of credit |
171,526 | 159,868 | 158,111 | |||||||||
| Multi-family mortgage |
59,510 | 52,238 | 45,497 | |||||||||
| Commercial real estate: |
||||||||||||
| Owner occupied |
330,207 | 280,972 | 262,190 | |||||||||
| Non-owner occupied |
237,222 | 180,929 | 200,349 | |||||||||
| Consumer and other |
67,586 | 53,480 | 60,312 | |||||||||
|
|
|
|||||||||||
| Gross loans |
1,701,863 | 1,415,896 | 1,341,347 | |||||||||
| Less: Allowance for loan losses |
(24,460 | ) | (29,030 | ) | (32,353 | ) | ||||||
|
|
|
|||||||||||
| Net loans |
$ | 1,677,403 | $ | 1,386,866 | $ | 1,308,994 | ||||||
|
|
||||||||||||
Nonperforming loans include loans that are no longer accruing interest (non-accrual loans) and loans past due ninety or more days and still accruing interest. Nonperforming loans and impaired loans are defined differently. Some loans may be included in both categories, whereas other loans may only be included in one category.
F-63
Table of Contents
Index to Financial Statements
FB Financial Corporation and subsidiaries
Notes to consolidated financial statements
As of December 31, 2015, 2014 and 2013, $26,089, $27,799 and $31,355, respectively, of one to four family mortgage loans were pledged to the Federal Home Loan Bank of Cincinnati securing advances against the Bank’s line. As of December 31, 2015, 2014 and 2013, $43,825, $26,458 and $38,804, respectively of multi-family mortgage loans were pledged to the Federal Home Loan Bank of Cincinnati securing advances against the Bank’s line (see Note 13).
As of December 31, 2015, 2014 and 2013, $0, $932,710 and $879,761, respectively, of commercial and industrial, construction, residential real estate, commercial real estate, consumer and other loans were pledged to the Federal Reserve Bank through the Borrower-in-Custody program securing a line of credit of $-0-, $661,726 and $663,195, respectively (see Note 13).
The following provides the allowance for loan losses by portfolio segment and the related investment in loans net of unearned interest for the years ended December 31 (in thousands):
| 2015 | Commercial and industrial |
Construction | Residential 1-to-4 family mortgage |
Residential line of credit |
Multi- family residential |
Commercial real estate- owner |
Commercial real estate – non- owner occupied |
Consumer and other |
Total | |||||||||||||||||||||||||||
| Beginning balance—December 31, 2014 |
$ | 6,600 | $ | 3,721 | $ | 6,364 | $ | 2,790 | $ | 184 | $ | 6,075 | $ | 2,641 | $ | 655 | $ | 29,030 | ||||||||||||||||||
| Loan loss provision |
(447 | ) | 36 | (1,571 | ) | (668 | ) | 127 | (1,014 | ) | (319 | ) | 792 | (3,064 | ) | |||||||||||||||||||||
| Recoveries of loans previously charged-off |
116 | 1,354 | 161 | 286 | — | 35 | 342 | 544 | 2,838 | |||||||||||||||||||||||||||
| Loans charged off |
(981 | ) | (81 | ) | (828 | ) | (230 | ) | — | (1,062 | ) | (54 | ) | (1,108 | ) | (4,344 | ) | |||||||||||||||||||
|
|
|
|||||||||||||||||||||||||||||||||||
| Ending balance—December 31, 2015 |
$ | 5,288 | $ | 5,030 | $ | 4,126 | $ | 2,178 | $ | 311 | $ | 4,034 | $ | 2,610 | $ | 883 | $ | 24,460 | ||||||||||||||||||
|
|
||||||||||||||||||||||||||||||||||||
| 2014 | ||||||||||||||||||||||||||||||||||||
| Beginning balance—December 31, 2013 |
$ | 7,009 | $ | 5,047 | $ | 7,300 | $ | 2,766 | $ | 336 | $ | 5,558 | $ | 3,563 | $ | 774 | $ | 32,353 | ||||||||||||||||||
| Loan loss provision |
495 | (1,573 | ) | 328 | 320 | (3,217 | ) | 1,043 | (482 | ) | 370 | (2,716 | ) | |||||||||||||||||||||||
| Recoveries of loans previously charged-off |
610 | 539 | 222 | 166 | 3,065 | 162 | 568 | 422 | 5,754 | |||||||||||||||||||||||||||
| Loans charged off |
(1,514 | ) | (292 | ) | (1,486 | ) | (462 | ) | — | (688 | ) | (1,008 | ) | (911 | ) | (6,361 | ) | |||||||||||||||||||
|
|
|
|||||||||||||||||||||||||||||||||||
| Ending balance—December 31, 2014 |
$ | 6,600 | $ | 3,721 | $ | 6,364 | $ | 2,790 | $ | 184 | $ | 6,075 | $ | 2,641 | $ | 655 | $ | 29,030 | ||||||||||||||||||
|
|
||||||||||||||||||||||||||||||||||||
| 2013 | Commercial and industrial |
Construction | Residential 1-to-4 family mortgage |
Residential line of credit |
Multi- family residential |
Commercial real estate- owner |
Commercial real estate – non- owner occupied |
Consumer and other |
Total | |||||||||||||||||||||||||||
| Beginning balance—January 1, 2013 |
$ | 7,009 | $ | 4,647 | $ | 7,738 | $ | 2,213 | $ | 2,546 | $ | 6,258 | $ | 7,432 | $ | 695 | $ | 38,538 | ||||||||||||||||||
| Loan loss provision |
871 | (1,110 | ) | (135 | ) | 887 | 2,026 | (887 | ) | (3,880 | ) | 709 | (1,519 | ) | ||||||||||||||||||||||
| Recoveries of loans previously charged-off |
252 | 2,092 | 80 | 166 | — | 223 | 25 | 132 | 2,970 | |||||||||||||||||||||||||||
| Loans charged off |
(1,123 | ) | (582 | ) | (383 | ) | (500 | ) | (4,236 | ) | (36 | ) | (14 | ) | (762 | ) | (7,636 | ) | ||||||||||||||||||
|
|
|
|||||||||||||||||||||||||||||||||||
| Ending balance—December 31, 2013 |
$ | 7,009 | $ | 5,047 | $ | 7,300 | $ | 2,766 | $ | 336 | $ | 5,558 | $ | 3,563 | $ | 774 | $ | 32,353 | ||||||||||||||||||
|
|
||||||||||||||||||||||||||||||||||||
F-64
Table of Contents
Index to Financial Statements
FB Financial Corporation and subsidiaries
Notes to consolidated financial statements
The following table provides the year-end allocation of the allowance for loan losses by loan category broken between loans individually evaluated for impairment and loans collectively evaluated for impairment for the years ended December 31 (in thousands):
| 2015 | Commercial and industrial |
Construction | Residential 1-to-4 family mortgage |
Residential line of credit |
Multi- family residential |
Commercial real estate - owner |
Commercial real estate – non- owner occupied |
Consumer and other |
Total | |||||||||||||||||||||||||||
| Year-end amount of allowance allocated to: |
||||||||||||||||||||||||||||||||||||
| Individually evaluated for impairment |
$ | 89 | $ | 5 | $ | 66 | $ | — | $ | — | $ | 38 | $ | 775 | $ | — | $ | 973 | ||||||||||||||||||
| Collectively evaluated for impairment |
5,199 | 5,025 | 4,060 | 2,178 | 311 | 3,996 | 1,835 | 883 | 23,487 | |||||||||||||||||||||||||||
|
|
|
|||||||||||||||||||||||||||||||||||
| Ending balance—December 31, 2015 |
$ | 5,288 | $ | 5,030 | $ | 4,126 | $ | 2,178 | $ | 311 | $ | 4,034 | $ | 2,610 | $ | 883 | $ | 24,460 | ||||||||||||||||||
|
|
||||||||||||||||||||||||||||||||||||
| 2014 | ||||||||||||||||||||||||||||||||||||
| Year-end amount of allowance allocated to: |
||||||||||||||||||||||||||||||||||||
| Individually evaluated for impairment |
$ | 892 | $ | 122 | $ | 458 | $ | — | $ | 80 | $ | 373 | $ | 900 | $ | — | $ | 2,825 | ||||||||||||||||||
| Collectively evaluated for impairment |
5,708 | 3,599 | 5,906 | 2,790 | 104 | 5,702 | 1,741 | 655 | 26,205 | |||||||||||||||||||||||||||
|
|
|
|||||||||||||||||||||||||||||||||||
| Ending balance—December 31, 2014 |
$ | 6,600 | $ | 3,721 | $ | 6,364 | $ | 2,790 | $ | 184 | $ | 6,075 | $ | 2,641 | $ | 655 | $ | 29,030 | ||||||||||||||||||
|
|
||||||||||||||||||||||||||||||||||||
| 2013 | ||||||||||||||||||||||||||||||||||||
| Year-end amount of allowance allocated to: |
||||||||||||||||||||||||||||||||||||
| Individually evaluated for impairment |
$ | 1,258 | $ | 1,117 | $ | 1,042 | $ | — | $ | 197 | $ | 1,977 | $ | 928 | $ | — | $ | 6,519 | ||||||||||||||||||
| Collectively evaluated for impairment |
5,751 | 3,930 | 6,258 | 2,766 | 139 | 3,581 | 2,635 | 774 | 25,834 | |||||||||||||||||||||||||||
|
|
|
|||||||||||||||||||||||||||||||||||
| Ending balance—December 31, 2013 |
$ | 7,009 | $ | 5,047 | $ | 7,300 | $ | 2,766 | $ | 336 | $ | 5,558 | $ | 3,563 | $ | 774 | $ | 32,353 | ||||||||||||||||||
|
|
||||||||||||||||||||||||||||||||||||
The following table provides the year-end amount of loans by loan category broken between loans individually evaluated for impairment and loans collectively evaluated for impairment at December 31 (in thousands):
| 2015 | Commercial and industrial |
Construction | Residential 1-to-4 family mortgage |
Residential line of credit |
Multi- family residential |
Commercial real estate - owner |
Commercial real estate – non- owner occupied |
Consumer and other |
Total | |||||||||||||||||||||||||||
| Loans, net of unearned income |
||||||||||||||||||||||||||||||||||||
| Individually evaluated for impairment |
$ | 1,499 | $ | 2,866 | $ | 3,686 | $ | — | $ | 1,074 | $ | 2,425 | $ | 4,026 | $ | — | $ | 15,576 | ||||||||||||||||||
| Collectively evaluated for impairment |
314,665 | 221,300 | 281,235 | 171,526 | 58,400 | 322,999 | 227,205 | 67,582 | 1,664,912 | |||||||||||||||||||||||||||
| Acquired with deteriorated credit quality |
874 | 6,859 | 2,828 | — | 36 | 4,783 | 5,991 | 4 | 21,375 | |||||||||||||||||||||||||||
|
|
|
|||||||||||||||||||||||||||||||||||
| Ending balance December 31, 2015 |
$ | 317,038 | $ | 231,025 | $ | 287,749 | $ | 171,526 | $ | 59,510 | $ | 330,207 | $ | 237,222 | $ | 67,586 | $ | 1,701,863 | ||||||||||||||||||
|
|
||||||||||||||||||||||||||||||||||||
F-65
Table of Contents
Index to Financial Statements
FB Financial Corporation and subsidiaries
Notes to consolidated financial statements
| 2014 | Commercial and industrial |
Construction | Residential 1-to-4 family mortgage |
Residential line of credit |
Multi- family residential |
Commercial real estate- owner |
Commercial real estate – non- owner occupied |
Consumer and other |
Total | |||||||||||||||||||||||||||
| Loans, net of unearned income |
||||||||||||||||||||||||||||||||||||
| Individually evaluated for impairment |
$ | 2,357 | $ | 6,841 | $ | 6,632 | $ | — | $ | 1,165 | $ | 3,026 | $ | 3,761 | $ | — | $ | 23,782 | ||||||||||||||||||
| Collectively evaluated for impairment |
260,325 | 154,987 | 257,267 | 159,868 | 51,073 | 277,946 | 177,168 | 53,480 | 1,392,114 | |||||||||||||||||||||||||||
|
|
|
|||||||||||||||||||||||||||||||||||
| Ending balance—December 31, 2014 |
$ | 262,682 | $ | 161,828 | $ | 263,899 | $ | 159,868 | $ | 52,238 | $ | 280,972 | $ | 180,929 | $ | 53,480 | $ | 1,415,896 | ||||||||||||||||||
|
|
||||||||||||||||||||||||||||||||||||
| 2013 | ||||||||||||||||||||||||||||||||||||
| Loans, net of unearned income |
||||||||||||||||||||||||||||||||||||
| Individually evaluated for impairment |
$ | 1,863 | $ | 7,625 | $ | 10,087 | $ | — | $ | 4,202 | $ | 7,053 | $ | 16,120 | $ | — | $ | 46,950 | ||||||||||||||||||
| Collectively evaluated for impairment |
249,694 | 104,435 | 241,184 | 158,111 | 41,295 | 255,137 | 184,229 | 60,312 | 1,294,397 | |||||||||||||||||||||||||||
|
|
|
|||||||||||||||||||||||||||||||||||
| Ending balance—December 31, 2013 |
$ | 251,557 | $ | 112,060 | $ | 251,271 | $ | 158,111 | $ | 45,497 | $ | 262,190 | $ | 200,349 | $ | 60,312 | $ | 1,341,347 | ||||||||||||||||||
|
|
||||||||||||||||||||||||||||||||||||
The Company categorizes loans into risk categories based on relevant information about the ability of borrowers to service their debt such as: current financial information, historical payment experience, credit documentation, public information, and current economic trends, among other factors. The Company analyzes loans individually by classifying the loans as to credit risk. The Company uses the following definitions for risk ratings:
Watch. Loans classified as special mention have a potential weakness that deserves management’s close attention. If left uncorrected, these potential weaknesses may result in deterioration of the repayment prospects for the loan or of the institution’s credit position at some future date.
Substandard. Loans classified as substandard are inadequately protected by the current net worth and paying capacity of the obligor or of the collateral pledged, if any. Loans so classified have a well-defined weakness or weaknesses that jeopardize the liquidation of the debt. They are characterized by the distinct possibility that the institution will sustain some loss if the deficiencies are not corrected.
Doubtful. Loans classified as doubtful have all the weaknesses inherent in those classified as substandard, with the added characteristic that the weaknesses make collection or liquidation in full, on the basis of currently existing facts, conditions, and values, highly questionable and improbable.
Loans not meeting the criteria above that are analyzed individually as part of the above described process are considered to be pass rated loans.
F-66
Table of Contents
Index to Financial Statements
FB Financial Corporation and subsidiaries
Notes to consolidated financial statements
The following table shows credit quality indicators by portfolio segment at December 31, 2015, 2014 and 2013 (in thousands):
| December 31, 2015 | Pass | Watch | Substandard | Total | ||||||||||||
| Commercial and industrial |
$ | 310,125 | $ | 1,060 | $ | 5,853 | $ | 317,038 | ||||||||
| Construction |
219,684 | 3,238 | 8,103 | 231,025 | ||||||||||||
| Residential real estate: |
||||||||||||||||
| 1-to-4 family mortgage |
268,046 | 9,367 | 10,336 | 287,749 | ||||||||||||
| Residential line of credit |
165,838 | 3,069 | 2,619 | 171,526 | ||||||||||||
| Multi-family mortgage |
58,234 | 166 | 1,110 | 59,510 | ||||||||||||
| Commercial real estate: |
||||||||||||||||
| Owner occupied |
310,538 | 9,852 | 9,817 | 330,207 | ||||||||||||
| Non-owner occupied |
206,645 | 20,218 | 10,359 | 237,222 | ||||||||||||
| Consumer and other |
66,794 | 460 | 332 | 67,586 | ||||||||||||
|
|
|
|||||||||||||||
| Total |
$ | 1,605,904 | $ | 47,430 | $ | 48,529 | $ | 1,701,863 | ||||||||
|
|
||||||||||||||||
Loans acquired with deteriorated debt quality of $21,375 are included as substandard in the table above.
| December 31, 2014 | Pass | Watch | Substandard | Total | ||||||||||||
| Commercial and industrial |
$ | 247,483 | $ | 11,766 | $ | 3,433 | $ | 262,682 | ||||||||
| Construction |
153,408 | 551 | 7,869 | 161,828 | ||||||||||||
| Residential real estate: |
||||||||||||||||
| 1-to-4 family mortgage |
244,107 | 6,401 | 13,391 | 263,899 | ||||||||||||
| Residential line of credit |
153,794 | 3,791 | 2,283 | 159,868 | ||||||||||||
| Multi-family mortgage |
48,072 | 3,001 | 1,165 | 52,238 | ||||||||||||
| Commercial real estate: |
||||||||||||||||
| Owner occupied |
256,015 | 11,441 | 13,516 | 280,972 | ||||||||||||
| Non-owner occupied |
156,658 | 20,518 | 3,753 | 180,929 | ||||||||||||
| Consumer and other |
52,217 | 703 | 560 | 53,480 | ||||||||||||
|
|
|
|||||||||||||||
| Total |
$ | 1,311,754 | $ | 58,172 | $ | 45,970 | $ | 1,415,896 | ||||||||
|
|
||||||||||||||||
| December 31, 2013 | Pass | Watch | Substandard | Total | ||||||||||||
| Commercial and industrial |
$ | 244,334 | $ | 4,576 | $ | 2,647 | $ | 251,557 | ||||||||
| Construction |
98,910 | 3,097 | 10,053 | 112,060 | ||||||||||||
| Residential real estate: |
||||||||||||||||
| 1-to-4 family mortgage |
222,275 | 11,263 | 17,733 | 251,271 | ||||||||||||
| Residential line of credit |
148,651 | 6,190 | 3,270 | 158,111 | ||||||||||||
| Multi-family mortgage |
32,460 | 11,775 | 1,262 | 45,497 | ||||||||||||
| Commercial real estate: |
||||||||||||||||
| Owner occupied |
230,748 | 21,746 | 9,696 | 262,190 | ||||||||||||
| Non-owner occupied |
178,812 | 2,340 | 19,197 | 200,349 | ||||||||||||
| Consumer and other |
58,673 | 898 | 741 | 60,312 | ||||||||||||
|
|
|
|||||||||||||||
| Total |
$ | 1,214,863 | $ | 61,885 | $ | 64,599 | $ | 1,341,347 | ||||||||
|
|
||||||||||||||||
The recorded investment in residential mortgage loans secured by residential real estate properties for which foreclosure proceedings are in process totaled $67, $527 and $265 at December 31, 2015, 2014 and 2013, respectively.
F-67
Table of Contents
Index to Financial Statements
FB Financial Corporation and subsidiaries
Notes to consolidated financial statements
Loans acquired in business combinations that exhibited at the date of acquisition evidence of deterioration of credit quality since origination such that it was probable that all contractually required payments would not be collected are considered to be purchased credit impaired and were as follows:
| December 31, 2015 | Purchased Credit Impaired Loans |
|||
| Commercial and industrial |
$ | 874 | ||
| Construction |
6,859 | |||
| Residential real estate: |
||||
| 1-to-4 family mortgage |
2,828 | |||
| Residential line of credit |
— | |||
| Multi-family mortgage |
36 | |||
| Commercial real estate: |
||||
| Owner occupied |
4,783 | |||
| Non-owner occupied |
5,991 | |||
| Consumer and other |
4 | |||
|
|
|
|||
| Total |
$ | 21,375 | ||
|
|
||||
The following table presents the current value of loans determined to be impaired at the time of acquisition:
| December 31, 2015 | Purchased Credit Impaired Loans |
|||
| Contractually-required principal and interest |
$ | 31,381 | ||
| Nonaccretable difference |
(8,369 | ) | ||
|
|
|
|||
| Cash flows expected to be collected |
23,012 | |||
| Accretable yield |
(1,637 | ) | ||
|
|
|
|||
| Current value |
$ | 21,375 | ||
|
|
||||
Changes in accretable yield of loans acquired with deteriorated credit quality were as follows:
| Balance at January 1, 2015 |
$ | — | ||
| Additions through acquisition |
(1,991 | ) | ||
| Reclasses to nonaccretable difference |
100 | |||
| Accretion |
254 | |||
|
|
|
|||
| Balance at December 31, 2015 |
$ | (1,637 | ) | |
|
|
||||
F-68
Table of Contents
Index to Financial Statements
FB Financial Corporation and subsidiaries
Notes to consolidated financial statements
The following tables provide the year-end amount of loans that are past due thirty to eighty-nine days, past due ninety or more days and still accruing interest, loans not accruing interest and loans current on payments accruing interest by category at December 31, 2015, 2014 and 2013 (in thousands):
| Loans, net of unearned income |
30-89 days past due |
90 days or more and accruing interest |
Non-accrual loans |
Loans current on payments and accruing interest |
Total | |||||||||||||||
| Commercial and industrial |
$ | 283 | $ | 103 | $ | 1,659 | $ | 314,119 | $ | 316,164 | ||||||||||
| Construction |
81 | 33 | 272 | 223,780 | 224,166 | |||||||||||||||
| Residential real estate: |
||||||||||||||||||||
| 1-to-4 family mortgage |
2,798 | 268 | 2,124 | 279,731 | 284,921 | |||||||||||||||
| Residential line of credit |
1,053 | 323 | 1,114 | 169,036 | 171,526 | |||||||||||||||
| Multi-family mortgage |
— | — | — | 59,474 | 59,474 | |||||||||||||||
| Commercial real estate |
||||||||||||||||||||
| Owner occupied |
382 | — | 1,848 | 323,194 | 325,424 | |||||||||||||||
| Non-owner occupied |
60 | — | 3,638 | 227,533 | 231,231 | |||||||||||||||
| Consumer and other |
331 | 160 | 45 | 67,046 | 67,582 | |||||||||||||||
|
|
|
|||||||||||||||||||
| Balance—December 31, 2015 |
$ | 4,988 | $ | 887 | $ | 10,700 | $ | 1,663,913 | $ | 1,680,488 | ||||||||||
|
|
||||||||||||||||||||
Loans acquired with deteriorated credit quality amounting to $21,375 have been excluded from the table above in accordance with ASC-310-10-50, Receivables-Overall-Disclosure.
| Loans, net of unearned income |
30-89 days past due |
90 days or more and accruing interest |
Non-accrual loans |
Loans current on payments and accruing interest |
Total | |||||||||||||||
| Commercial and industrial |
$ | 158 | $ | 119 | $ | 2,095 | $ | 260,310 | $ | 262,682 | ||||||||||
| Construction |
953 | 222 | 2,920 | 157,733 | 161,828 | |||||||||||||||
| Residential real estate: |
||||||||||||||||||||
| 1-to-4 family mortgage |
2,718 | 1,107 | 2,915 | 257,159 | 263,899 | |||||||||||||||
| Residential line of credit |
718 | 276 | 887 | 157,987 | 159,868 | |||||||||||||||
| Multi-family mortgage |
— | — | 1,165 | 51,073 | 52,238 | |||||||||||||||
| Commercial real estate: |
||||||||||||||||||||
| Owner occupied |
1,113 | 9 | 2,519 | 277,331 | 280,972 | |||||||||||||||
| Non-owner occupied |
— | 62 | 2,765 | 178,102 | 180,929 | |||||||||||||||
| Consumer and other |
348 | 68 | 74 | 52,990 | 53,480 | |||||||||||||||
|
|
|
|||||||||||||||||||
| Balance—December 31, 2014 |
$ | 6,008 | $ | 1,863 | $ | 15,340 | $ | 1,392,685 | $ | 1,415,896 | ||||||||||
|
|
||||||||||||||||||||
F-69
Table of Contents
Index to Financial Statements
FB Financial Corporation and subsidiaries
Notes to consolidated financial statements
| Loans, net of unearned income |
30-89 days past due |
90 days or more and accruing interest |
Non-accrual loans |
Loans current on payments and accruing interest |
Total | |||||||||||||||
| Commercial and industrial |
$ | 594 | $ | 94 | $ | 1,488 | $ | 249,381 | $ | 251,557 | ||||||||||
| Construction |
1,172 | 59 | 6,171 | 104,658 | 112,060 | |||||||||||||||
| Residential real estate: |
||||||||||||||||||||
| 1-to-4 family mortgage |
4,532 | 1,647 | 4,353 | 240,739 | 251,271 | |||||||||||||||
| Residential line of credit |
1,186 | 291 | 1,098 | 155,536 | 158,111 | |||||||||||||||
| Multi-family mortgage |
— | — | 1,262 | 44,235 | 45,497 | |||||||||||||||
| Commercial real estate: |
||||||||||||||||||||
| Owner occupied |
2,174 | 484 | 4,728 | 254,804 | 262,190 | |||||||||||||||
| Non-owner occupied |
748 | 32 | 6,575 | 192,994 | 200,349 | |||||||||||||||
| Consumer and other |
338 | 124 | 16 | 59,834 | 60,312 | |||||||||||||||
|
|
|
|||||||||||||||||||
| Balance—December 31, 2013 |
$ | 10,744 | $ | 2,731 | $ | 25,691 | $ | 1,302,181 | $ | 1,341,347 | ||||||||||
|
|
||||||||||||||||||||
Impaired loans recognized in conformity with ASC 310 at December 31, 2015, 2014 and 2013, segregated by class, were as follows (in thousands):
| 2015 | Recorded investment |
Unpaid principal |
Related allowance |
Average recorded investment |
Interest income recognized (cash basis) |
|||||||||||||||
| With a related allowance recorded: |
||||||||||||||||||||
| Commercial and industrial |
$ | 1,133 | $ | 1,133 | $ | 89 | $ | 1,269 | $ | 22 | ||||||||||
| Construction |
308 | 308 | 5 | 517 | 3 | |||||||||||||||
| Residential real estate: |
||||||||||||||||||||
| 1-to-4 family mortgage |
3,397 | 3,398 | 66 | 2,345 | 199 | |||||||||||||||
| Residential line of credit |
— | — | — | — | — | |||||||||||||||
| Multi-family mortgage |
— | — | — | 468 | — | |||||||||||||||
| Commercial real estate: |
||||||||||||||||||||
| Owner occupied |
2,302 | 2,422 | 38 | 1,938 | 77 | |||||||||||||||
| Non-owner occupied |
2,976 | 2,976 | 775 | 3,039 | 18 | |||||||||||||||
| Consumer and other |
— | — | — | — | — | |||||||||||||||
|
|
|
|||||||||||||||||||
| Total |
$ | 10,116 | $ | 10,237 | $ | 973 | $ | 9,576 | $ | 319 | ||||||||||
|
|
|
|||||||||||||||||||
| With no related allowance recorded: |
||||||||||||||||||||
| Commercial and industrial |
$ | 366 | $ | 993 | $ | — | $ | 660 | $ | — | ||||||||||
| Construction |
2,558 | 2,558 | — | 4,337 | 127 | |||||||||||||||
| Residential real estate: |
||||||||||||||||||||
| 1-to-4 family mortgage |
289 | 289 | — | 2,815 | 7 | |||||||||||||||
| Residential line of credit |
— | — | — | — | — | |||||||||||||||
| Multi-family mortgage |
1,074 | 1,074 | — | 652 | 25 | |||||||||||||||
| Commercial real estate: |
||||||||||||||||||||
| Owner occupied |
123 | 229 | — | 788 | — | |||||||||||||||
| Non-owner occupied |
1,050 | 1,781 | — | 855 | — | |||||||||||||||
| Consumer and other |
— | — | — | — | — | |||||||||||||||
|
|
|
|||||||||||||||||||
| Total |
$ | 5,460 | $ | 6,924 | $ | — | $ | 10,107 | $ | 159 | ||||||||||
|
|
|
|||||||||||||||||||
| Total impaired loans |
$ | 15,576 | $ | 17,161 | $ | 973 | $ | 19,683 | $ | 478 | ||||||||||
|
|
||||||||||||||||||||
F-70
Table of Contents
Index to Financial Statements
FB Financial Corporation and subsidiaries
Notes to consolidated financial statements
| 2014 | Recorded investment |
Unpaid principal |
Related allowance |
Average recorded investment |
Interest income recognized (cash basis) |
|||||||||||||||
| With a related allowance recorded: |
||||||||||||||||||||
| Commercial and industrial |
$ | 1,404 | $ | 1,748 | $ | 892 | $ | 1,551 | $ | 35 | ||||||||||
| Construction |
725 | 725 | 122 | 3,175 | — | |||||||||||||||
| Residential real estate: |
||||||||||||||||||||
| 1-to-4 family mortgage |
1,291 | 1,291 | 458 | 3,971 | 29 | |||||||||||||||
| Residential line of credit |
— | — | — | — | — | |||||||||||||||
| Multi-family mortgage |
935 | 935 | 80 | 974 | — | |||||||||||||||
| Commercial real estate: |
||||||||||||||||||||
| Owner occupied |
1,574 | 1,694 | 373 | 3,716 | 22 | |||||||||||||||
| Non-owner occupied |
3,102 | 3,102 | 900 | 4,483 | — | |||||||||||||||
| Consumer and other |
— | — | — | — | — | |||||||||||||||
|
|
|
|||||||||||||||||||
| Total |
$ | 9,031 | $ | 9,495 | $ | 2,825 | $ | 17,870 | $ | 86 | ||||||||||
|
|
|
|||||||||||||||||||
| With no related allowance recorded: |
||||||||||||||||||||
| Commercial and industrial |
$ | 953 | $ | 1,236 | $ | — | $ | 559 | $ | 23 | ||||||||||
| Construction |
6,116 | 6,258 | — | 4,058 | 129 | |||||||||||||||
| Residential real estate: |
||||||||||||||||||||
| 1-to-4 family mortgage |
5,341 | 5,341 | — | 4,389 | 170 | |||||||||||||||
| Residential line of credit |
— | — | — | — | — | |||||||||||||||
| Multi-family mortgage |
230 | 230 | — | 1,710 | — | |||||||||||||||
| Commercial real estate: |
||||||||||||||||||||
| Owner occupied |
1,452 | 2,004 | — | 1,325 | 66 | |||||||||||||||
| Non-owner occupied |
659 | 801 | — | 5,458 | 175 | |||||||||||||||
| Consumer and other |
— | — | — | — | — | |||||||||||||||
| Total |
$ | 14,751 | $ | 15,870 | $ | — | $ | 17,499 | $ | 563 | ||||||||||
|
|
|
|||||||||||||||||||
| Total impaired loans |
$ | 23,782 | $ | 25,365 | $ | 2,825 | $ | 35,369 | $ | 649 | ||||||||||
|
|
||||||||||||||||||||
F-71
Table of Contents
Index to Financial Statements
FB Financial Corporation and subsidiaries
Notes to consolidated financial statements
| 2013 | Recorded investment |
Unpaid principal |
Related allowance |
Average recorded investment |
Interest income recognized (cash basis) |
|||||||||||||||
| With a related allowance recorded: |
||||||||||||||||||||
| Commercial and industrial |
$ | 1,698 | $ | 1,698 | $ | 1,258 | $ | 1,652 | $ | 36 | ||||||||||
| Construction |
5,624 | 5,624 | 1,117 | 7,065 | — | |||||||||||||||
| Residential real estate: |
||||||||||||||||||||
| 1-to-4 family mortgage |
6,650 | 6,650 | 1,042 | 5,280 | 196 | |||||||||||||||
| Residential line of credit |
— | — | — | — | — | |||||||||||||||
| Multi-family mortgage |
1,012 | 1,012 | 197 | 4,158 | — | |||||||||||||||
| Commercial real estate: |
||||||||||||||||||||
| Owner occupied |
5,858 | 6,030 | 1,977 | 4,972 | 127 | |||||||||||||||
| Non-owner occupied |
5,864 | 5,864 | 928 | 16,613 | — | |||||||||||||||
| Consumer and other |
— | — | — | — | 1 | |||||||||||||||
|
|
|
|||||||||||||||||||
| Total |
$ | 26,706 | $ | 26,878 | $ | 6,519 | $ | 39,740 | $ | 360 | ||||||||||
|
|
|
|||||||||||||||||||
| With no related allowance recorded: |
||||||||||||||||||||
| Commercial and industrial |
$ | 165 | $ | 165 | $ | — | $ | 192 | $ | — | ||||||||||
| Construction |
2,001 | 2,001 | — | 2,616 | 47 | |||||||||||||||
| Residential real estate: |
||||||||||||||||||||
| 1-to-4 family mortgage |
3,437 | 3,437 | — | 3,487 | 171 | |||||||||||||||
| Residential line of credit |
— | — | — | 138 | — | |||||||||||||||
| Multi-family mortgage |
3,190 | 3,190 | — | 1,595 | 89 | |||||||||||||||
| Commercial real estate: |
||||||||||||||||||||
| Owner occupied |
1,195 | 1,195 | — | 2,526 | 34 | |||||||||||||||
| Non-owner occupied |
10,256 | 10,309 | — | 11,283 | 526 | |||||||||||||||
| Consumer and other |
— | — | — | — | — | |||||||||||||||
|
|
|
|||||||||||||||||||
| Total |
$ | 20,244 | $ | 20,297 | $ | — | $ | 21,837 | $ | 867 | ||||||||||
|
|
|
|||||||||||||||||||
| Total impaired loans |
$ | 46,950 | $ | 47,175 | $ | 6,519 | $ | 61,577 | $ | 1,227 | ||||||||||
|
|
||||||||||||||||||||
As of December 31, 2015, 2014 and 2013, the Company has a recorded investment in troubled debt restructurings of $15,289, $18,823 and $36,855, respectively. The Company has allocated $946, $1,189 and $3,378 of specific reserves for those loans at December 31, 2015, 2014 and 2013, respectively, and has committed to lend additional amounts totaling up to $69, $8 and $17 to these customers. Of these loans, $5,898, $7,765 and $15,020 were classified as non-accrual loans as of December 31, 2015, 2014 and 2013.
The modifications included extensions of the maturity date and/or a modification of the stated rate of interest to one lower than the current market rate.
F-72
Table of Contents
Index to Financial Statements
FB Financial Corporation and subsidiaries
Notes to consolidated financial statements
The following table presents loans by class modified as troubled debt restructurings that occurred during the year ended December 31:
| 2015 |
Number of loans |
Pre- modification outstanding recorded investment |
Post- modification outstanding recorded investment |
Charge-offs and specific reserves |
||||||||||||
| Commercial and industrial |
6 | $ | 2,301 | $ | 2,301 | $ | 86 | |||||||||
| Residential real estate: |
||||||||||||||||
| 1-to-4 family mortgage |
5 | 326 | 326 | 45 | ||||||||||||
| Commercial real estate: |
||||||||||||||||
| Owner occupied |
4 | 786 | 786 | — | ||||||||||||
| Non-owner occupied |
1 | 133 | 133 | 1 | ||||||||||||
|
|
|
|||||||||||||||
| Total |
16 | $ | 3,546 | $ | 3,546 | $ | 132 | |||||||||
|
|
||||||||||||||||
| 2014 | ||||||||||||||||
| Construction |
2 | $ | 3,931 | $ | 3,931 | $ | — | |||||||||
| Commercial real estate: |
||||||||||||||||
| Non-owner occupied |
1 | 1,063 | 1,063 | — | ||||||||||||
|
|
|
|||||||||||||||
| Total |
3 | $ | 4,994 | $ | 4,994 | $ | — | |||||||||
|
|
||||||||||||||||
| 2013 | ||||||||||||||||
| Construction |
2 | $ | 108 | $ | 108 | $ | 34 | |||||||||
| Residential mortgage: |
||||||||||||||||
| 1-to-4 family mortgage |
8 | 3,289 | 3,289 | 24 | ||||||||||||
| Multi-family mortgage |
4 | 4,276 | 4,276 | 197 | ||||||||||||
| Commercial real estate: |
||||||||||||||||
| Owner occupied |
2 | 1,067 | 1,067 | — | ||||||||||||
| Non-owner occupied |
3 | 667 | 667 | — | ||||||||||||
|
|
|
|||||||||||||||
| Total |
19 | $ | 9,407 | $ | 9,407 | $ | 255 | |||||||||
|
|
||||||||||||||||
A loan is considered to be in payment default once it is 90 days contractually past due under the modified terms. The following tables present loans modified as troubled debt restructurings for which there was a payment default within twelve months following the modification during the year ended December 31:
| 2015 | Defaulted |
Charge-offs and specific reserves |
||||||
| Residential real estate: |
||||||||
| 1-to-4 family mortgage |
$ | 96 | $ | 45 | ||||
|
|
|
|||||||
| Total |
$ | 96 | $ | 45 | ||||
|
|
||||||||
| 2013 | ||||||||
| Construction |
$ | 38 | $ | — | ||||
| Commercial real estate: |
||||||||
| Owner occupied |
1,663 | 252 | ||||||
|
|
|
|||||||
| Total |
$ | 1,701 | $ | 252 | ||||
|
|
||||||||
F-73
Table of Contents
Index to Financial Statements
FB Financial Corporation and subsidiaries
Notes to consolidated financial statements
There were no loans modified as troubled debt restructurings for which there was a payment default within twelve months following the modification during the year ended December 31, 2014.
The terms of certain other loans were modified during the years ending December 31, 2015, 2014 and 2013 that did not meet the definition of a troubled debt restructuring. The modification of these loans involved either a modification of the terms of a loan to borrowers who were not experiencing financial difficulties or a delay in a payment that was considered to be insignificant.
In order to determine whether a borrower is experiencing financial difficulty, an evaluation is performed of the probability that the borrower will be in payment default on any of its debt in the foreseeable future without the modification. This evaluation is performed under the company’s internal underwriting policy.
Note (6)—Premises and equipment:
Premises and equipment and related accumulated depreciation as of December 31, 2015, 2014 and 2013, are as follows (in thousands):
| 2015 | 2014 | 2013 | ||||||||||
| Land |
$ | 19,253 | $ | 12,845 | $ | 13,348 | ||||||
| Premises |
43,419 | 33,971 | 33,957 | |||||||||
| Furniture and fixtures |
20,421 | 19,355 | 17,893 | |||||||||
| Leasehold improvements |
8,276 | 8,178 | 4,982 | |||||||||
| Equipment |
9,851 | 8,752 | 8,100 | |||||||||
| Construction in process |
3,120 | 134 | 533 | |||||||||
|
|
|
|||||||||||
| 104,340 | 83,235 | 78,813 | ||||||||||
| Less: accumulated depreciation |
(38,448 | ) | (35,291 | ) | (32,550 | ) | ||||||
|
|
|
|||||||||||
| Total Premises and Equipment |
$ | 65,892 | $ | 47,944 | $ | 46,263 | ||||||
|
|
||||||||||||
Depreciation expense was $3,283, $3,099 and $2,936 for the years ended December 31, 2015, 2014 and 2013, respectively.
Additionally, as of December 31, 2015, the Company accrued $586 related to a contractual obligation for construction costs. Subsequent to December 31, 2015, the Company paid $556 of this amount.
Note (7)—Foreclosed real estate:
The following table summarizes the foreclosed real estate for the years ended December 31, 2015, 2014 and 2013 (in thousands):
| 2015 | 2014 | 2013 | ||||||||||
| Balance at beginning of period |
$ | 7,259 | $ | 8,796 | $ | 10,772 | ||||||
| Acquired through merger with NWGA |
5,002 | — | — | |||||||||
| Transfers from loans |
4,085 | 4,308 | 3,891 | |||||||||
| Capital improvements |
171 | — | — | |||||||||
| Proceeds from property sold |
(3,774 | ) | (4,738 | ) | (5,049 | ) | ||||||
| Gain on sale of foreclosed assets |
187 | 464 | 996 | |||||||||
| Transfers to loans |
(785 | ) | (1,239 | ) | (1,043 | ) | ||||||
| Writedowns and partial liquidations |
(504 | ) | (332 | ) | (771 | ) | ||||||
|
|
|
|||||||||||
| Balance at end of period |
$ | 11,641 | $ | 7,259 | $ | 8,796 | ||||||
|
|
||||||||||||
F-74
Table of Contents
Index to Financial Statements
FB Financial Corporation and subsidiaries
Notes to consolidated financial statements
Note (8)—Goodwill and intangible assets:
The balance in goodwill at December 31, 2015, 2014 and 2013 was $46,904.
The change in balance for core deposit intangibles during the year is as follows (in thousands):
| 2015 | 2014 | 2013 | ||||||||||
| Beginning balance |
$ | 3,495 | $ | 5,108 | $ | 6,834 | ||||||
| Addition from merger with NWGB |
4,931 | — | — | |||||||||
| Less: amortization expense |
(1,731 | ) | (1,613 | ) | (1,726 | ) | ||||||
|
|
|
|||||||||||
| Ending balance |
$ | 6,695 | $ | 3,495 | $ | 5,108 | ||||||
|
|
||||||||||||
The estimated aggregate amortization expense of core deposit intangibles for each of the next five years and thereafter is as follows:
Estimated aggregate amortization for year ended (in thousands):
| December 31, 2016 |
$ | 2,132 | ||
| December 31, 2017 |
762 | |||
| December 31, 2018 |
493 | |||
| December 31, 2019 |
493 | |||
| December 31, 2020 |
493 | |||
| Thereafter |
2,322 | |||
|
|
|
|||
| Total |
$ | 6,695 | ||
|
|
||||
Note (9)—Mortgage servicing rights:
Changes in the Company’s mortgage servicing rights were as follows ($ amounts in thousands):
| 2015 | 2014 | |||||||
| Carrying value at January 1 |
$ | 6,032 | $ | — | ||||
| Capitalization |
26,474 | 6,429 | ||||||
| Amortization |
(2,601 | ) | (397 | ) | ||||
| Impairment |
(194 | ) | — | |||||
|
|
|
|||||||
| Carrying value at December 31 |
$ | 29,711 | $ | 6,032 | ||||
|
|
||||||||
Data and key economic assumptions related to the Company’s mortgage servicing rights as of December 31, 2015 and 2014 are as follows:
| 2015 | 2014 | |||||||
| Unpaid principal balance |
$ | 2,545,449 | $ | 522,194 | ||||
| Weighted-average prepayment speed (CPR) |
7.30% | 8.70% | ||||||
| Estimated impact on fair value of a 10% increase |
$ | (371 | ) | $ | (226 | ) | ||
| Estimated impact on fair value of a 20% increase |
(726 | ) | (436 | ) | ||||
| Discount rate |
10.14% | 9.00% | ||||||
| Estimated impact on fair value of a 100bp increase |
$ | (1,201 | ) | $ | (256 | ) | ||
| Estimated impact on fair value of a 200bp increase |
(2,317 | ) | (493 | ) | ||||
| Weighted-average coupon interest rate |
3.79% | 4.10% | ||||||
| Weighted-average servicing fee (basis points) |
25 | 25 | ||||||
| Weighted-average remaining maturity (in months) |
311 | 323 | ||||||
|
|
||||||||
F-75
Table of Contents
Index to Financial Statements
FB Financial Corporation and subsidiaries
Notes to consolidated financial statements
Estimated future amortization expense for the next five years and thereafter are as follows:
| December 31, 2016 |
$ | 3,772 | ||
| December 31, 2017 |
3,772 | |||
| December 31, 2018 |
3,772 | |||
| December 31, 2019 |
3,769 | |||
| December 31, 2020 |
3,734 | |||
| Thereafter |
10,892 | |||
|
|
|
|||
| Total |
$ | 29,711 | ||
|
|
||||
Note (10)—Other assets and other liabilities:
Included in Other Assets are:
| As of December 31, | ||||||||||||
| 2015 | 2014 | 2013 | ||||||||||
| Receivable related to mortgage lending |
$ | 118 | $ | 7,125 | $ | 1,521 | ||||||
| Cash surrender value on bank owned life insurance |
10,331 | 3,125 | 3,033 | |||||||||
| Prepaid expenses |
2,311 | 2,075 | 1,955 | |||||||||
| Deferred tax asset |
— | 965 | 2,480 | |||||||||
| Derivatives |
6,023 | 4,172 | 2,359 | |||||||||
| Other assets |
8,794 | 1,783 | 3,578 | |||||||||
|
|
|
|||||||||||
| Total Other Assets |
$ | 27,577 | $ | 19,245 | $ | 14,926 | ||||||
|
|
||||||||||||
Included in Other Liabilities are:
| As of December 31, | ||||||||||||
| 2015 | 2014 | 2013 | ||||||||||
| Deferred compensation |
$ | 12,343 | $ | 11,728 | $ | 6,358 | ||||||
| Accrued payroll |
6,343 | 4,657 | 3,779 | |||||||||
| Loan proceeds payable |
5,730 | 1,732 | 3,516 | |||||||||
| Accrued contract termination fee |
2,278 | — | — | |||||||||
| Mortgage servicing escrows |
2,297 | 677 | 177 | |||||||||
| Mortgage buyback reserve |
2,156 | 828 | 656 | |||||||||
| Dividend payable |
— | 1,750 | — | |||||||||
| Accrued interest |
581 | 602 | 836 | |||||||||
| Deferred tax liability |
713 | — | — | |||||||||
| Derivatives |
369 | 2,434 | 849 | |||||||||
| Other liabilities |
11,713 | 7,640 | 4,043 | |||||||||
|
|
|
|||||||||||
| Total Other Liabilities |
$ | 44,523 | $ | 32,048 | $ | 20,214 | ||||||
|
|
||||||||||||
Note (11)—Deposits:
The aggregate amount of time deposits with a minimum denomination of $250 was $52,320, $57,825 and $57,034 at December 31, 2015, 2014 and 2013, respectively.
F-76
Table of Contents
Index to Financial Statements
FB Financial Corporation and subsidiaries
Notes to consolidated financial statements
At December 31, 2015, the scheduled maturities of time deposits are as follows (in thousands):
| Due on or before: |
||||
| December 31, 2016 |
$ | 233,768 | ||
| December 31, 2017 |
50,200 | |||
| December 31, 2018 |
24,018 | |||
| December 31, 2019 |
8,428 | |||
| December 31, 2020 |
9,145 | |||
|
|
|
|||
| Total |
$ | 325,559 | ||
|
|
||||
Note (12)—Securities sold under agreements to repurchase:
Securities sold under agreements to repurchase are secured by mortgage-backed securities with a carrying amount of $105,133, $113,494 and $107,058 at December 31, 2015, 2014 and 2013, respectively.
Securities sold under agreements to repurchase are financing arrangements that mature daily. Information concerning securities sold under agreements to repurchase is summarized as follows (in thousands):
| 2015 | 2014 | 2013 | ||||||||||
| Balance at year end |
$ | 105,133 | $ | 113,494 | $ | 107,058 | ||||||
| Average daily balance during the year |
$ | 114,781 | $ | 94,675 | $ | 63,432 | ||||||
| Average interest rate during the year |
0.12% | 0.12% | 0.13% | |||||||||
| Maximum month-end balance during the year |
$ | 126,608 | $ | 113,494 | $ | 107,058 | ||||||
| Weighted average interest rate at year-end |
0.12% | 0.12% | 0.11% | |||||||||
|
|
||||||||||||
Note (13)—Short-term borrowings:
The Bank currently has available from correspondent banks borrowings capacity in the form of federal fund purchases. The line with First Tennessee Bank, N.A. is for $30,000 as of December 31, 2015 and $15,000 for the years ended December 31, 2014 and 2013 and the line with BBVA Compass Bank is for $10,000 for the years ended December 31, 2015, 2014 and 2013. Each of these lines may be drawn for fourteen consecutive days. As of December 31, 2015, 2014 and 2013, there were no borrowings against these lines.
The line with SunTrust Bank is for $15,000 and may be drawn for seven consecutive days before collateral is required. Borrowings that exceed seven days must be secured by a marketable security with a current value of at least 125% of the outstanding balance. As of December 31, 2015, 2014 and 2013, there were no borrowings against this line.
The line with First National Banker’s Bank is for $10,000 and may be drawn for ninety days before collateral is required. The line with Zions Bank is for $25,000. The line with PNC Bank is for $20,000. The line with Servis FirstBank is for $15,000 for the year ended December 31, 2015 and for the years ended December 31, 2014 and 2013, the line was $10,000. As of December 31, 2015, 2014 and 2013, there were no borrowings against these lines.
The line with Federal Home Loan Bank is for $150,000 and is secured by qualifying one to four family and multi-family mortgages in the Bank’s loan portfolio as well as U.S. government agency securities. At December 31,
F-77
Table of Contents
Index to Financial Statements
FB Financial Corporation and subsidiaries
Notes to consolidated financial statements
2015, 2014 and 2013, the Company had pledged investments securities of $85,587, $155,241 and $143,195 and loans of $69,915, $54,257 and $70,158, securing borrowings against this line of $18,000, $79,000 and $70,000 as of December 31, 2015, 2014 and 2013, respectively.
The Company maintained a line with the Federal Reserve Bank through the Borrower-in-Custody program in 2014 and 2013. The line matured during 2015 and was not renewed. As of December 31, 2014 and 2013, $932,710 and $879,761, respectively of commercial, consumer, construction, commercial real estate, home equity lines of credit and agricultural loans were pledged to the Federal Reserve Bank through the Borrower-in-Custody program securing a line of credit of $661,726 and $663,195, respectively. In addition at December 31, 2014 and 2013, the Company had pledged investments securities of $34,127 and $36,979 securing a line of credit of $32,694 and $34,125, respectively.
Note (14)—Long-term debt:
The Company has three subordinated notes payable with the shareholder of the Company. The first note for $775 carries an annual rate equal to the Prime Rate less 100 basis points adjusting on January 10 of each year. The effective rate on the first note is 2.25% as of December 31, 2015, 2014 and 2013. The second note for $3,300 carries a quarterly rate equal to the 30 day LIBOR rate plus 200 basis points. The rate in effect at December 31, 2015, 2014 and 2013 is 2.24%, 2.15% and 2.18%, respectively, for the second note. The third note for $6,000 carries a quarterly rate equal to the 90 day LIBOR rate plus 170 basis points. The effective rate on the third note is 2.12%, 1.98% and 1.98% as of December 31, 2015, 2014 and 2013, respectively. These three notes were amended on December 31, 2006 to specify a maturity date of December 31, 2012. Unless the Company is notified, the maturity date advances one year on each anniversary. At December 31, 2015 the maturity date of these notes advanced to December 31, 2021.
The Bank had a total borrowing capacity of $125,476, $171,693 and $175,765 at the Federal Home Loan Bank of Cincinnati at December 31, 2015, 2014 and 2013, respectively. The terms of the borrowings were subject to market rates at the time of the advances and contain maturities of one to twenty years. Any advances from this line would be secured by qualifying one to four family and multi-family mortgages in the Bank’s loan portfolio as well as U.S. government agency securities. Current principals of one to four family mortgages totaling 136%, 136% and 146% of the advances at December 31, 2015, 2014 and 2013, respectively were required to secure the advances. In addition, current principals of multi-family mortgages totaling 145%, 145% and 160% of the advances at December 31, 2015, 2014 and 2013, respectively were required to secure the advances. The Bank also had investment securities of $85,587, $155,241 and $143,195 pledged to the Federal Home Loan Bank at December 31, 2015, 2014 and 2013, respectively.
The Bank had $15,611 of fixed rate borrowings at a weighted average rate of 3.29% outstanding at December 31, 2015. At December 31, 2014 the Bank had $23,845 of fixed rate borrowings at a weighted average rate of 3.30% outstanding. At December 31, 2013 the Bank had $26,856 of fixed rate borrowings at a weighted average rate of 3.56% outstanding. In addition, the Federal Home Loan Bank has guaranteed a letter of credit for $-0-, $50 and $110 at December 31, 2015, 2014 and 2013, respectively.
In 2003, two separate trusts formed by the Company issued $9,000 of floating rate trust preferred securities (“Trust I”) and $21,000 of floating rate trust preferred securities (“Trust II”), respectively, as part of a pooled offering of such securities. The Company issued junior subordinated debentures of $9,280, which included proceeds of common securities purchased by the Company of $280, and junior subordinated debentures of
F-78
Table of Contents
Index to Financial Statements
FB Financial Corporation and subsidiaries
Notes to consolidated financial statements
$21,650, which included proceeds of common securities of $650. Both issuances were to the trusts in exchange for the proceeds of the securities offerings, which represent the sole asset of the trusts. Trust I pays interest quarterly based upon the 3-month LIBOR plus 3.25%. Trust II pays interest quarterly based upon the 3-month LIBOR plus 3.15%. Rates for the two issues at December 31, 2015, were 3.67% and 3.57%, respectively. Rates for the two issues at December 31, 2014, were 3.48% and 3.39%, respectively. The Company may redeem the first junior subordinated debenture listed, in whole or in part, on any distribution payment date within 120 days of the occurrence of a special event, at the redemption price. The Company may redeem the second junior subordinated debentures listed, in whole or in part, any time after June 26, 2008, on any distribution payment date, at the redemption price. The junior subordinated debentures must be redeemed no later than 2033.
Maturities of long-term debt are as follows (in thousands):
| FHLB | Junior subordinated debt |
Related party subordinated debt |
Total | |||||||||||||
| Due on or before: |
||||||||||||||||
| December 31, 2016 |
$ | 293 | $ | — | $ | — | $ | 293 | ||||||||
| December 31, 2017 |
741 | — | — | 741 | ||||||||||||
| December 31, 2018 |
10,282 | — | — | 10,282 | ||||||||||||
| December 31, 2019 |
553 | — | — | 553 | ||||||||||||
| December 31, 2020 |
279 | — | 10,075 | 10,354 | ||||||||||||
| December 31, 2021 |
684 | — | — | 684 | ||||||||||||
| Due thereafter |
2,779 | 30,930 | — | 33,709 | ||||||||||||
|
|
|
|||||||||||||||
| Total |
$ | 15,611 | $ | 30,930 | $ | 10,075 | $ | 56,616 | ||||||||
|
|
||||||||||||||||
Note (15)—Income taxes:
Effective January 1, 2001, the Company and subsidiaries elected “S” corporation status. Accordingly, the Company does not incur federal income tax obligations as the federal income taxes on earnings and losses are reported on the tax returns of its shareholder; however, such election is disregarded for Tennessee franchise and excise tax purposes.
Allocation of state income taxes between current and deferred portions is as follows (in thousands):
| Current | Deferred | Total | ||||||||||
| Year ended December 31, 2015 |
$ | 1,321 | $ | 1,647 | $ | 2,968 | ||||||
| Year ended December 31, 2014 |
$ | 1,427 | $ | 842 | $ | 2,269 | ||||||
| Year ended December 31, 2013 |
$ | 1,543 | $ | 351 | $ | 1,894 | ||||||
|
|
||||||||||||
State income tax expense of 6.16%, 6.53% and 6.58% for the years ended December 31, 2015, 2014 and 2013, respectively, differs from the statutory state income rate of 6.50% due to the following (in thousands):
| 2015 | 2014 | 2013 | ||||||||||
| Tax at statutory rate |
$ | 2,956 | $ | 2,258 | $ | 1,872 | ||||||
| Other |
12 | 11 | 22 | |||||||||
|
|
|
|||||||||||
| Total |
$ | 2,968 | $ | 2,269 | $ | 1,894 | ||||||
|
|
||||||||||||
F-79
Table of Contents
Index to Financial Statements
FB Financial Corporation and subsidiaries
Notes to consolidated financial statements
The components of the net deferred tax asset included in other assets at December 31, 2015, 2014 and 2013 are as follows (in thousands):
| 2015 | 2014 | 2013 | ||||||||||
| Deferred tax assets: |
||||||||||||
| Allowance for loan losses |
$ | 1,565 | $ | 1,780 | $ | 2,103 | ||||||
| Amortization of core deposit intangible |
107 | 254 | 281 | |||||||||
| Deferred compensation |
1,120 | 871 | 307 | |||||||||
| Unrealized loss on securities |
— | — | 307 | |||||||||
| Other |
39 | — | 359 | |||||||||
|
|
|
|||||||||||
| Subtotal |
2,831 | 2,905 | 3,357 | |||||||||
| Deferred tax liabilities: |
||||||||||||
| FHLB stock dividends |
(135 | ) | (129 | ) | (141 | ) | ||||||
| Depreciation |
(661 | ) | (520 | ) | (736 | ) | ||||||
| Unrealized gain on securities |
(205 | ) | (366 | ) | — | |||||||
| Mortgage servicing rights |
(1,902 | ) | (386 | ) | — | |||||||
| Other |
(641 | ) | (539 | ) | — | |||||||
|
|
|
|||||||||||
| Subtotal |
(3,544 | ) | (1,940 | ) | (877 | ) | ||||||
|
|
|
|||||||||||
| Net deferred tax (liability) asset |
$ | (713 | ) | $ | 965 | $ | 2,480 | |||||
|
|
||||||||||||
A valuation allowance is established for deferred tax assets when, in the opinion of management, it is “more likely than not” that the asset will not be realized. At December 31, 2015, 2014 and 2013, the Company had no valuation allowance with respect to deferred tax assets.
Tax periods for all fiscal years after 2010 remain open to examination by the federal and state taxing jurisdictions to which the Company is subject.
Note (16)—Dividend restrictions:
Due to regulations of the Tennessee Department of Financial Institutions (“TDFI”), the Bank may not declare dividends in any calendar year that exceeds the total of its net income of that year combined with its retained net income of the preceding two years without the prior approval of the TDFI Commissioner. Based upon this regulation, $54,537, $10,592 and $-0- was available for payment of dividends without such prior approval at December 31, 2015, 2014 and 2013, respectively. In addition, dividends paid by the Bank to the Company would be prohibited if the effect thereof would cause the Bank’s capital to be reduced below applicable minimum capital requirements.
The Bank received permission from the state Commissioner to pay dividends of approximately $15,855 and $12,770 in 2014 and 2013, respectively, to the Company for the shareholder’s tax liability and operating expenses.
Subsequent to December 31, 2015, the Bank declared and paid dividends to the Company in the amount of $5,000, which was then paid to the Company’s shareholder.
F-80
Table of Contents
Index to Financial Statements
FB Financial Corporation and subsidiaries
Notes to consolidated financial statements
Note (17)—Commitments and contingencies:
Some financial instruments, such as loan commitments, credit lines, letters of credit, and overdraft protection, are issued to meet customer financing needs. These are agreements to provide credit or to support the credit of others, as long as conditions established in the contract are met, and usually have expiration dates. Commitments may expire without being used. Off-balance sheet risk to credit loss exists up to the face amount of these instruments, although material losses are not anticipated. The same credit policies are used to make such commitments as are used for loans, including obtaining collateral at exercise of the commitment.
| December 31 (in thousands) |
||||||||||||
| 2015 | 2014 | 2013 | ||||||||||
| Commitments to extend credit, excluding interest rate lock commitment |
$ | 554,274 | $ | 397,941 | $ | 323,161 | ||||||
| Letters of credit |
20,338 | 12,918 | 6,787 | |||||||||
|
|
|
|||||||||||
| Balance at end of period |
$ | 574,612 | $ | 410,859 | $ | 329,948 | ||||||
|
|
||||||||||||
Commitments under non-cancelable operating leases were as follows, before considering renewal options that generally are present (in thousands):
| 2016 |
$ | 2,753 | ||
| 2017 |
2,440 | |||
| 2018 |
2,131 | |||
| 2019 |
1,884 | |||
| 2020 |
1,651 | |||
| Thereafter |
8,169 | |||
|
|
|
|||
| Total |
$ | 19,028 | ||
|
|
||||
Rent expense for the years ended December 31, 2015, 2014 and 2013, was $3,750, $3,085 and $2,937, respectively.
In connection with the sale of mortgage loans to third party investors, the Bank makes usual and customary representations and warranties as to the propriety of its origination activities. Occasionally, the investors require the Bank to repurchase loans sold to them under the terms of the warranties. When this happens, the loans are recorded at fair value with a corresponding charge to a valuation reserve. The total principal amount of loans repurchased (or indemnified for) was $47, $40 and $211 during 2015, 2014 and 2013, respectively. The Bank has established an allowance for losses associated with loan repurchases. This allowance is recorded in accrued expenses and other liabilities on the consolidated balance sheet. The following table summarizes the activity in the repurchase allowance (in thousands):
| 2015 | 2014 | 2013 | ||||||||||
| Balance at beginning of period |
$ | 828 | $ | 656 | $ | 540 | ||||||
| Provision for loan repurchases or indemnifications |
1,375 | 161 | 327 | |||||||||
| Recoveries on previous losses |
— | 51 | — | |||||||||
| Losses on loans repurchased or indemnified |
(47 | ) | (40 | ) | (211 | ) | ||||||
|
|
|
|||||||||||
| Balance at end of period |
$ | 2,156 | $ | 828 | $ | 656 | ||||||
|
|
||||||||||||
F-81
Table of Contents
Index to Financial Statements
FB Financial Corporation and subsidiaries
Notes to consolidated financial statements
Note (18)—Derivatives:
The Company utilizes derivative financial instruments as part of its ongoing efforts to manage its interest rate risk exposure as well as the exposure for its customers. Derivative financial instruments are included in the Consolidated Balance Sheets line item “Other assets” or “Other liabilities” at fair value in accordance with ASC 815, “Derivatives and Hedging.”
The Company enters into commitments to originate loans whereby the interest rate on the loan is determined prior to funding (rate-lock commitments). Under such commitments, interest rates for a mortgage loan are typically locked in for up to forty-five days with the customer. These interest rate lock commitments are recorded at fair value in the Company’s Consolidated Balance Sheets. The notional amount of commitments to fund fixed-rate mortgage loans was $263,395, $184,895 and $51,138 at December 31, 2015, 2014 and 2013, respectively. The Company also enters into mandatory delivery forward commitments to sell residential mortgage loans to secondary market investors. The notional amount of commitments to sell residential mortgage loans to secondary market investors was $445,000, $232,464 and $68,938 at December 31, 2015, 2014 and 2013, respectively. Gains and losses arising from changes in the valuation of the commitments are recognized currently in earnings and are reflected under the line item “Mortgage banking income” on the Consolidated Statements of Income.
The Company has entered into derivative instruments that are not designated as hedging instruments to help its commercial customers manage their exposure to interest rate fluctuations. To mitigate the interest rate risk associated with these customer contracts, the Company enters into an offsetting derivative contract position. The Company manages its credit risk, or potential risk of default by its commercial customers, through credit limit approval and monitoring procedures. At December 31, 2015, 2014 and 2013, the Company had notional amounts of $4,409, $5,777 and $5,983, respectively, on interest rate contracts with corporate customers and $4,409, $5,777 and $5,983, respectively, in offsetting interest rate contracts with other financial institutions to mitigate the Company’s rate exposure on its corporate customers’ contracts and certain fixed-rate loans. The fair value on the swaps was $(369), $(651) and $(849) at December 31, 2015, 2014 and 2013, respectively.
Certain financial instruments, including derivatives, may be eligible for offset in the Consolidated Balance Sheet when the “right of setoff” exists or when the instruments are subject to an enforceable master netting agreement, which includes the right of the non-defaulting party or non-affected party to offset recognized amounts, including collateral posted with the counterparty, to determine a net receivable or net payable upon early termination of the agreement. Certain of the Company’s derivative instruments are subject to master netting agreements. The Company has not elected to offset such financial instruments in the Consolidated Balance Sheets.
F-82
Table of Contents
Index to Financial Statements
FB Financial Corporation and subsidiaries
Notes to consolidated financial statements
The following table provides details on the Company’s derivative financial instruments as of the dates presented:
| Balance
sheet classification |
Fair Value | |||||||||||||||
| December 31, | ||||||||||||||||
| 2015 | 2014 | 2013 | ||||||||||||||
| Derivative assets: |
||||||||||||||||
| Not designated as hedging: |
||||||||||||||||
| Interest rate swaps |
Other Assets | $ | 369 | $ | 651 | $ | 849 | |||||||||
| Forward commitments |
Other Assets | 61 | — | 524 | ||||||||||||
| Interest rate-lock commitments |
Other Assets | 5,593 | 3,521 | 986 | ||||||||||||
|
|
|
|||||||||||||||
| Total |
$ | 6,023 | $ | 4,172 | $ | 2,359 | ||||||||||
|
|
|
|||||||||||||||
| Derivative liabilities: |
||||||||||||||||
| Not designated as hedging: |
||||||||||||||||
| Interest rate swaps |
Other Liabilities | $ | 369 | $ | 651 | $ | 849 | |||||||||
| Forward commitments |
Other Liabilities | — | 1,783 | — | ||||||||||||
|
|
|
|||||||||||||||
| Total |
$ | 369 | $ | 2,434 | $ | 849 | ||||||||||
|
|
||||||||||||||||
Gains (losses) included in the Consolidated Statements of Income related to the Company’s derivative financial instruments were as follows:
| December 31 | ||||||||||||
| 2015 | 2014 | 2013 | ||||||||||
| Derivatives not designated as hedging instruments: |
||||||||||||
| Interest rate lock commitments: |
||||||||||||
| Included in other noninterest income |
$ | 2,073 | $ | 2,535 | $ | 947 | ||||||
| Forward commitments: |
||||||||||||
| Included in other noninterest income |
(3,600 | ) | (9,029 | ) | 1,280 | |||||||
|
|
|
|||||||||||
| Total |
$ | (1,527 | ) | $ | (6,494 | ) | $ | 2,227 | ||||
|
|
||||||||||||
Note (19)—Fair value of financial instruments:
ASC 820-10 establishes a framework for measuring the fair value of assets and liabilities according to a hierarchy that prioritizes the inputs to valuation techniques used to measure fair value into three broad levels. The fair value hierarchy gives the highest priority to quoted prices in active markets for identical assets and liabilities (Level 1) and the lowest priority to unobservable inputs (Level 3). The hierarchy maximizes the use of observable inputs and minimizes the use of unobservable inputs by requiring that the most observable inputs be used when available. Observable inputs are inputs that market participants would use in pricing the asset or liability based on market data obtained from sources independent of the Company. Unobservable inputs are inputs that are derived from assumptions based on management’s estimate of assumptions that market participants would use in pricing the asset or liability based on the best information available under the circumstances.
F-83
Table of Contents
Index to Financial Statements
FB Financial Corporation and subsidiaries
Notes to consolidated financial statements
The hierarchy is broken down into the following three levels, based on the reliability of inputs:
Level 1: Unadjusted quoted prices in active markets for identical assets or liabilities that are accessible at the measurement date.
Level 2: Significant other observable inputs other than Level 1 prices, such as quoted prices for similar assets or liabilities, quoted prices in markets that are not active or other inputs that are observable or can be corroborated by observable market data.
Level 3: Significant unobservable inputs for assets or liabilities that are derived from assumptions based on management’s estimate of assumptions that market participants would use in pricing the assets or liabilities.
The Company records the fair values of financial assets and liabilities on a recurring and non-recurring basis using the following methods and assumptions:
Available-for-sale securities: Available-for-sale securities are recorded at fair value on a recurring basis. Fair values for securities are based on quoted market prices, where available. If quoted prices are not available, fair values are based on quoted market prices of similar instruments or are determined by matrix pricing, which is a mathematical technique widely used in the industry to value debt securities without relying exclusively on quoted prices for the specific securities but rather by relying on the pricing relationship or correlation among other benchmark quoted securities. Available-for-sale securities valued using quoted market prices of similar instruments or that are valued using matrix pricing are classified as Level 2. When significant inputs to the valuation are unobservable, the available-for-sale securities are classified within Level 3 of the fair value hierarchy.
Where no active market exists for a security or other benchmark securities, fair value is estimated by the Company with reference to discount margins for other high risk securities.
Loans held for sale—Loans held for sale are carried at fair value. Fair value is determined using current secondary market prices for loans with similar characteristics, that is, using Level 2 inputs.
Derivatives—The fair value of the interest rate swaps are based upon fair values provided from entities that engage in interest rate swap activity and is based upon projected future cash flows and interest rates. Fair value of commitments is based on fees currently charged to enter into similar agreements, and for fixed-rate commitments, the difference between current levels of interest rates and the committed rates is also considered. These financial instruments are classified as Level 2.
Foreclosed assets: Foreclosed assets (“REO”) is comprised of commercial and residential real estate obtained in partial or total satisfaction of loan obligations. REO acquired in settlement of indebtedness is recorded at the lower of the carrying amount of the loan or the fair value of the real estate less costs to sell. Fair value is determined on a nonrecurring basis based on appraisals by qualified licensed appraisers and is adjusted for management’s estimates of costs to sell and holding period discounts. The valuations are classified as Level 3.
Impaired loans: Loans considered impaired under FASB ASC 310, Receivables, are loans for which, based on current information and events, it is probable that the creditor will be unable to collect all amounts due according to the contractual terms of the loan agreement. Fair value adjustments for impaired loans are recorded on a non-recurring basis as either partial write downs based on observable market prices or current appraisal of the collateral. Impaired loans measured at fair value are classified as Level 3.
F-84
Table of Contents
Index to Financial Statements
FB Financial Corporation and subsidiaries
Notes to consolidated financial statements
The following methods were used to estimate the fair value of the Company’s financial instruments which were not previously presented.
Cash and cash equivalents—Cash and cash equivalents consist of cash and due from banks with other financial institutions and federal funds sold. The carrying amount reported in the consolidated balance sheets approximates the fair value based upon the short-term nature of these assets. Also included are interest-bearing deposits in financial institutions. Interest bearing deposits in financial institutions consist of interest bearing accounts at the Federal Reserve Bank and Federal Home Loan Bank. The carrying value reported in the consolidated balance sheets approximates the fair value based upon the short-term nature of the assets.
Federal Home Loan Bank stock—The carrying value of Federal Home Loan Bank stock reported in the consolidated balance sheets approximates the fair value as the stock is redeemable at the carrying value.
Loans—For variable rate loans that re-price frequently and with no significant change in credit risk, fair values are based upon carrying values. Fixed rate loan fair values are estimated using a discounted cash flow analysis based upon interest rates currently being offered for loans with similar terms to borrowers of similar credit quality.
Mortgage servicing rights—Servicing rights are carried at the lower of amortized cost or fair value. Fair value is determined using an income approach with various assumptions including expected cash flows, market discount rates, prepayment speeds, servicing costs, and other factors.
Deposits—The fair value disclosed for demand deposits (both interest bearing and noninterest bearing) and savings deposits are equal to the amount payable on demand as of the reporting date. The fair value of the time deposits is estimated using a discounted cash flow method based upon current rates for similar types of accounts.
Short term borrowings—The fair value of the lines of credit which represent federal funds purchased approximate the carrying value of the amounts reported on the balance sheet due to the short-term nature of these liabilities.
Securities sold under agreement to repurchase—The fair value of the securities sold under agreement to repurchase approximate the carrying value of the amounts reported on the balance sheet due to the short-term nature of these liabilities.
Long-Term debt—The fair value of long-term debt is determined using discounted cash flows using current rates.
Accrued interest payable and receivable—The carrying amounts of accrued interest approximate fair value.
F-85
Table of Contents
Index to Financial Statements
FB Financial Corporation and subsidiaries
Notes to consolidated financial statements
The estimated fair values of the Company’s financial instruments are as follows (in thousands):
| Fair value | ||||||||||||||||||||
| December 31, 2015 | Carrying amount |
Level 1 | Level 2 | Level 3 | Total | |||||||||||||||
| Financial assets: |
||||||||||||||||||||
| Cash and cash equivalents |
$ | 97,723 | $ | 97,723 | $ | — | $ | — | $ | 97,723 | ||||||||||
| Available-for-sale securities |
649,387 | — | 644,531 | 4,856 | 649,387 | |||||||||||||||
| Federal Home Loan Bank Stock |
6,528 | — | — | 6,528 | 6,528 | |||||||||||||||
| Loans, net |
1,677,403 | — | 1,638,506 | 36,951 | 1,675,457 | |||||||||||||||
| Loans held for sale |
273,196 | — | 273,196 | — | 273,196 | |||||||||||||||
| Accrued interest receivable |
6,763 | — | 6,763 | — | 6,763 | |||||||||||||||
| Mortgage servicing rights, net |
29,711 | — | — | 29,711 | 29,711 | |||||||||||||||
| Derivatives |
6,023 | — | 6,023 | — | 6,023 | |||||||||||||||
| Financial liabilities: |
||||||||||||||||||||
| Deposits: |
||||||||||||||||||||
| Without stated maturities |
$ | 2,112,915 | $ | 2,112,915 | $ | — | $ | — | $ | 2,112,915 | ||||||||||
| With stated maturities |
325,559 | — | 323,624 | — | 323,624 | |||||||||||||||
| Securities sold under agreement to repurchase |
105,133 | 105,133 | — | — | 105,133 | |||||||||||||||
| Lines of credit |
18,000 | 18,000 | — | — | 18,000 | |||||||||||||||
| Accrued interest payable |
550 | 244 | 306 | — | 550 | |||||||||||||||
| Long-term debt |
56,616 | — | 55,484 | — | 55,484 | |||||||||||||||
| Derivatives |
369 | — | 369 | — | 369 | |||||||||||||||
|
|
||||||||||||||||||||
| Fair value | ||||||||||||||||||||
| December 31, 2014 | Carrying amount |
Level 1 | Level 2 | Level 3 | Total | |||||||||||||||
| Financial assets: |
||||||||||||||||||||
| Cash and cash equivalents |
$ | 49,954 | $ | 49,954 | $ | — | $ | — | $ | 49,954 | ||||||||||
| Available-for-sale securities |
652,601 | — | 647,913 | 4,688 | 652,601 | |||||||||||||||
| Federal Home Loan Bank Stock |
6,528 | — | — | 6,528 | 6,528 | |||||||||||||||
| Loans, net |
1,386,866 | — | 1,375,641 | 7,774 | 1,383,415 | |||||||||||||||
| Loans held for sale |
194,745 | — | 194,745 | — | 194,745 | |||||||||||||||
| Accrued interest receivable |
6,616 | — | 6,616 | — | 6,616 | |||||||||||||||
| Mortgage servicing rights, net |
6,032 | — | — | 6,210 | 6,210 | |||||||||||||||
| Derivatives |
4,172 | — | 4,172 | — | 4,172 | |||||||||||||||
| Financial liabilities: |
||||||||||||||||||||
| Deposits: |
||||||||||||||||||||
| Without stated maturities |
$ | 1,613,456 | $ | 1,613,456 | $ | — | $ | — | $ | 1,613,456 | ||||||||||
| With stated maturities |
310,113 | — | 309,719 | — | 309,719 | |||||||||||||||
| Securities sold under agreement to repurchase |
113,494 | 113,494 | — | — | 113,494 | |||||||||||||||
| Lines of credit |
79,000 | 79,000 | — | — | 79,000 | |||||||||||||||
| Accrued interest payable |
625 | 111 | 514 | — | 625 | |||||||||||||||
| Long-term debt |
64,850 | — | 63,566 | — | 63,566 | |||||||||||||||
| Derivatives |
2,434 | — | 2,434 | — | 2,434 | |||||||||||||||
|
|
||||||||||||||||||||
F-86
Table of Contents
Index to Financial Statements
FB Financial Corporation and subsidiaries
Notes to consolidated financial statements
| Fair value | ||||||||||||||||||||
| December 31, 2013 | Carrying amount |
Level 1 | Level 2 | Level 3 | Total | |||||||||||||||
| Financial assets: |
||||||||||||||||||||
| Cash and cash equivalents |
$ | 67,597 | $ | 67,597 | $ | — | $ | — | $ | 67,957 | ||||||||||
| Available-for-sale securities |
685,547 | — | 680,537 | 5,010 | 685,547 | |||||||||||||||
| Federal Home Loan Bank Stock |
6,528 | — | — | 6,528 | 6,528 | |||||||||||||||
| Loans, net |
1,308,994 | — | 1,293,016 | 20,358 | 1,313,374 | |||||||||||||||
| Loans held for sale |
61,062 | — | 61,062 | — | 61,062 | |||||||||||||||
| Accrued interest receivable |
6,662 | — | 6,662 | — | 6,662 | |||||||||||||||
| Derivatives |
2,359 | — | 2,359 | — | 2,359 | |||||||||||||||
| Financial liabilities: |
||||||||||||||||||||
| Deposits: |
||||||||||||||||||||
| Without stated maturities |
$ | 1,448,337 | $ | 1,448,337 | $ | — | $ | — | $ | 1,448,337 | ||||||||||
| With stated maturities |
355,230 | — | 356,020 | — | 356,020 | |||||||||||||||
| Securities sold under agreement to repurchase |
107,058 | 107,058 | — | — | 107,058 | |||||||||||||||
| Lines of credit |
70,000 | 70,000 | — | — | 70,000 | |||||||||||||||
| Accrued interest payable |
838 | 94 | 744 | — | 838 | |||||||||||||||
| Long-term debt |
67,861 | — | 66,576 | — | 66,576 | |||||||||||||||
| Derivatives |
849 | — | 849 | — | 849 | |||||||||||||||
|
|
||||||||||||||||||||
The balances and levels of the assets measured at fair value on a recurring basis at December 31, 2015 are presented in the following tables (in thousands):
| At December 31, 2015 |
Quoted prices in active markets for identical assets (liabilities) (level 1) |
Significant other observable inputs (level 2) |
Significant unobservable inputs (level 3) |
Total | ||||||||||||
| Recurring valuations: |
||||||||||||||||
| Financial Assets: |
||||||||||||||||
| Available-for-sale securities: |
||||||||||||||||
| U.S. Government agency securities |
$ | — | $ | 33,808 | $ | — | $ | 33,808 | ||||||||
| Mortgage-backed securities |
— | 522,373 | — | 522,373 | ||||||||||||
| Municipals, tax-exempt |
— | 79,837 | — | 79,837 | ||||||||||||
| Treasury securities |
— | 4,485 | — | 4,485 | ||||||||||||
| Equity securities |
— | 4,028 | 4,856 | 8,884 | ||||||||||||
|
|
|
|||||||||||||||
| Total |
$ | — | $ | 644,531 | $ | 4,856 | $ | 649,387 | ||||||||
|
|
|
|||||||||||||||
| Loans held for sale |
$ | — | $ | 273,196 | $ | — | $ | 273,196 | ||||||||
| Derivatives |
$ | — | $ | 6,023 | $ | — | $ | 6,023 | ||||||||
| Financial Liabilities: |
||||||||||||||||
| Derivatives |
$ | — | $ | 369 | $ | — | $ | 369 | ||||||||
|
|
||||||||||||||||
F-87
Table of Contents
Index to Financial Statements
FB Financial Corporation and subsidiaries
Notes to consolidated financial statements
The balances and levels of the assets measured at fair value on a non-recurring basis at December 31, 2015 are presented in the following tables (in thousands):
| At December 31, 2015 |
Quoted prices in active markets for identical assets (liabilities) (level 1) |
Significant other observable inputs (level 2) |
Significant unobservable inputs (level 3) |
Total | ||||||||||||
| Non-recurring valuations: |
||||||||||||||||
| Financial Assets: |
||||||||||||||||
| Foreclosed Assets |
$ | — | $ | — | $ | 6,275 | $ | 6,275 | ||||||||
| Mortgage servicing rights |
— | — | 29,711 | 29,711 | ||||||||||||
| Impaired Loans: |
||||||||||||||||
| Commercial and industrial |
— | — | 2,007 | 2,007 | ||||||||||||
| Commercial real estate: |
||||||||||||||||
| Owner occupied |
— | — | 6,493 | 6,493 | ||||||||||||
| Non-owner occupied |
— | — | 7,572 | 7,572 | ||||||||||||
| Construction |
— | — | 6,896 | 6,896 | ||||||||||||
| Residential real estate |
||||||||||||||||
| 1-4 family |
— | — | 6,127 | 6,127 | ||||||||||||
| Multifamily |
— | — | 36 | 36 | ||||||||||||
| Consumer and other |
— | — | 4 | 4 | ||||||||||||
|
|
|
|||||||||||||||
| Total |
$ | — | $ | — | $ | 29,135 | $ | 29,135 | ||||||||
|
|
||||||||||||||||
The balances and levels of the assets measured at fair value on a recurring basis at December 31, 2014 are presented in the following tables (in thousands):
| At December 31, 2014 |
Quoted prices in active markets for identical assets (liabilities) (level 1) |
Significant other observable inputs (level 2) |
Significant unobservable inputs (level 3) |
Total | ||||||||||||
| Recurring valuations: |
||||||||||||||||
| Financial Assets: |
||||||||||||||||
| Available-for-sale securities: |
||||||||||||||||
| U.S. Government agency securities |
$ | — | $ | 28,517 | $ | — | $ | 28,517 | ||||||||
| Mortgage-backed securities |
— | 530,200 | — | 530,200 | ||||||||||||
| Municipals, tax-exempt |
— | 85,207 | — | 85,207 | ||||||||||||
| Equity securities |
— | 3,989 | 4,688 | 8,677 | ||||||||||||
|
|
|
|||||||||||||||
| Total |
$ | — | $ | 647,913 | $ | 4,688 | $ | 652,601 | ||||||||
|
|
|
|||||||||||||||
| Loans held for sale |
$ | — | $ | 194,745 | $ | — | $ | 194,745 | ||||||||
| Derivatives |
$ | — | $ | 4,172 | $ | — | $ | 4,172 | ||||||||
| Financial Liabilities: |
||||||||||||||||
| Derivatives |
$ | — | $ | 2,434 | $ | — | $ | 2,434 | ||||||||
|
|
||||||||||||||||
F-88
Table of Contents
Index to Financial Statements
FB Financial Corporation and subsidiaries
Notes to consolidated financial statements
The balances and levels of the assets measured at fair value on a non-recurring basis at December 31, 2014 are presented in the following tables (in thousands):
| At December 31, 2014 |
Quoted prices in active markets for identical assets (liabilities) (level 1) |
Significant other observable inputs (level 2) |
Significant unobservable inputs (level 3) |
Total | ||||||||||||
| Non-recurring valuations: |
||||||||||||||||
| Financial Assets: |
||||||||||||||||
| Foreclosed Assets |
$ | — | $ | — | $ | 6,349 | $ | 6,349 | ||||||||
| Impaired Loans: |
||||||||||||||||
| Commercial and industrial |
— | — | 664 | 664 | ||||||||||||
| Commercial real estate: |
||||||||||||||||
| Owner occupied |
— | — | 1,297 | 1,297 | ||||||||||||
| Non-owner occupied |
— | — | 2,532 | 2,532 | ||||||||||||
| Construction |
— | — | 1,586 | 1,586 | ||||||||||||
| Residential real estate |
||||||||||||||||
| 1-4 family |
— | — | 833 | 833 | ||||||||||||
| Multifamily |
— | — | 855 | 855 | ||||||||||||
| Consumer and other |
— | — | 7 | 7 | ||||||||||||
|
|
|
|||||||||||||||
| Total |
$ | — | $ | — | $ | 7,774 | $ | 7,774 | ||||||||
|
|
||||||||||||||||
The balances and levels of the assets measured at fair value on a recurring basis at December 31, 2013 are presented in the following tables (in thousands):
| At December 31, 2013 |
Quoted prices in active markets for identical assets (liabilities) (level 1) |
Significant other observable inputs (level 2) |
Significant unobservable inputs (level 3) |
Total | ||||||||||||
| Recurring valuations: |
||||||||||||||||
| Financial Assets: |
||||||||||||||||
| Available-for-sale securities: |
||||||||||||||||
| U.S. Government agency securities |
$ | — | $ | 27,755 | $ | — | $ | 27,755 | ||||||||
| Mortgage-backed securities |
— | 572,294 | — | 572,294 | ||||||||||||
| Municipals, tax-exempt |
— | 76,641 | — | 76,641 | ||||||||||||
| Corporate securities |
— | — | 633 | 633 | ||||||||||||
| Equity securities |
— | 3,847 | 4,377 | 8,224 | ||||||||||||
|
|
|
|||||||||||||||
| Total |
$ | — | $ | 680,537 | $ | 5,010 | $ | 685,547 | ||||||||
|
|
|
|||||||||||||||
| Loans held for sale |
$ | — | $ | 61,062 | $ | — | $ | 61,062 | ||||||||
| Derivatives |
$ | — | $ | 2,359 | $ | — | $ | 2,359 | ||||||||
| Financial Liabilities: |
||||||||||||||||
| Derivatives |
$ | — | $ | 849 | $ | — | $ | 849 | ||||||||
|
|
||||||||||||||||
F-89
Table of Contents
Index to Financial Statements
FB Financial Corporation and subsidiaries
Notes to consolidated financial statements
The balances and levels of the assets measured at fair value on a non-recurring basis at December 31, 2013 are presented in the following tables (in thousands):
| At December 31, 2013 |
Quoted prices in active markets for identical assets (liabilities) (level 1) |
Significant other observable inputs (level 2) |
Significant unobservable inputs (level 3) |
Total | ||||||||||||
| Non-recurring valuations: |
||||||||||||||||
| Financial Assets: |
||||||||||||||||
| Foreclosed Assets |
$ | — | $ | — | $ | 7,368 | $ | 7,368 | ||||||||
| Impaired Loans: |
||||||||||||||||
| Commercial and industrial |
— | — | 425 | 425 | ||||||||||||
| Commercial real estate: |
||||||||||||||||
| Owner occupied |
— | — | 4,053 | 4,053 | ||||||||||||
| Non-owner occupied |
— | — | 4,936 | 4,936 | ||||||||||||
| Construction |
— | — | 4,507 | 4,507 | ||||||||||||
| Residential real estate |
||||||||||||||||
| 1-4 family |
— | — | 5,608 | 5,608 | ||||||||||||
| Multifamily |
— | — | 815 | 815 | ||||||||||||
| Consumer and other |
— | — | 14 | 14 | ||||||||||||
|
|
|
|||||||||||||||
| Total |
$ | — | $ | — | $ | 20,358 | $ | 20,358 | ||||||||
|
|
||||||||||||||||
There were no transfers between Level 1, 2, or 3 in the periods presented.
The following table provides a reconciliation for assets and liabilities measured at fair value on a recurring basis using significant unobservable inputs, or Level 3 inputs, during the years ended December 31, 2015, 2014 and 2013 (in thousands):
| Available-for-sale securities |
||||||||||||
| 2015 | 2014 | 2013 | ||||||||||
| Balance at beginning of period |
$ | 4,688 | $ | 5,010 | $ | 4,464 | ||||||
| Realized gains included in net income |
— | 582 | 34 | |||||||||
| Unrealized gains included in other comprehensive income |
— | — | 261 | |||||||||
| Purchases |
168 | 357 | 359 | |||||||||
| Sales |
— | (1,261 | ) | (108 | ) | |||||||
|
|
|
|||||||||||
| Balance at end of period |
$ | 4,856 | $ | 4,688 | $ | 5,010 | ||||||
|
|
||||||||||||
The fair value of certain of the Company’s corporate are determined from information derived from external parties that calculate discounted cash flows using swap and LIBOR curves plus spreads that adjust for loss severities, volatility, credit risk and optionality. When available, broker quotes are used to validate the model. Industry research reports as well as assumptions about specific-issuer defaults and deferrals are reviewed and incorporated into the calculations.
F-90
Table of Contents
Index to Financial Statements
FB Financial Corporation and subsidiaries
Notes to consolidated financial statements
The following table presents information as of December 31, 2015 about significant unobservable inputs (Level 3) used in the valuation of assets measured at fair value on a nonrecurring basis:
| Financial instrument | Fair Value | Valuation Technique | Significant Unobservable Inputs |
Range of Inputs | ||||||
| Impaired loans |
$ | 29,135 | Appraised value of collateral | Discount for comparable sales | 0%—30% | |||||
| Foreclosed assets |
$ | 6,275 | Appraised value of property less estimated costs to sell |
Discount for costs to sell | 0%—46% | |||||
| Mortgage servicing rights |
$ | 29,711 | Discounted cash flows | See Note 9 | See Note 9 | |||||
|
| ||||||||||
The following table presents information as of December 31, 2014 about significant unobservable inputs (Level 3) used in the valuation of assets measured at fair value on a nonrecurring basis:
| Financial instrument | Fair Value | Valuation Technique | Significant Unobservable Inputs |
Range of Inputs | ||||||
| Impaired loans |
$ | 7,774 | Appraised value of collateral | Discount for comparable sales | 0%—30% | |||||
| Foreclosed assets |
$ | 6,349 | Appraised value of property less estimated costs to sell |
Discount for costs to sell | 0%—10% | |||||
|
| ||||||||||
The following table presents information as of December 31, 2013 about significant unobservable inputs (Level 3) used in the valuation of assets measured at fair value on a nonrecurring basis:
| Financial instrument | Fair Value | Valuation Technique | Significant Unobservable Inputs |
Range of Inputs | ||||||
| Impaired loans |
$ | 20,358 | Appraised value of collateral | Discount for comparable sales | 0%—30% | |||||
| Foreclosed assets |
$ | 7,368 | Appraised value of property less estimated costs to sell |
Discount for costs to sell | 0%—10% | |||||
|
| ||||||||||
Appraisals for both collateral-dependent impaired loans and real estate owned are performed by certified general appraisers (for commercial properties) or certified residential appraisers (for residential properties) whose qualifications and licenses have been reviewed and verified by the Company. Once received, a member of the lending administrative department reviews the assumptions and approaches utilized in the appraisal as well as the overall resulting fair value in comparison with independent data sources such as recent market data or industry wide statistics.
Fair Value Option
The Company elected to measure all loans originated for sale at fair value under the fair value option as permitted under ASC 825. Electing to measure these assets at fair value reduces certain timing differences and better matches the changes in fair value of the loans with changes in the fair value of derivative instruments used to economically hedge them.
Net gains of $3,103 resulting from fair value changes of the mortgage loans were recorded in income during 2015. The amount does not reflect changes in fair values of related derivative instruments used to hedge exposure to market-related risks associated with these mortgage loans. The change in fair value of both loans held for sale and the related derivative instruments are recorded in Mortgage Banking Income in the Consolidated Statements of Income.
F-91
Table of Contents
Index to Financial Statements
FB Financial Corporation and subsidiaries
Notes to consolidated financial statements
The Company’s valuation of loans held for sale incorporates an assumption for credit risk; however, given the short-term period that the Company holds these loans, valuation adjustments attributable to instrument-specific credit risk is nominal. Interest income on loans held for sale measured at fair value is accrued as it is earned based on contractual rates and is reflected in loan interest income in the Consolidated Statements of Income.
The following table summarizes the differences between the fair value and the principal balance for loans held for sale measured at fair value as of December 31:
| 2015 | Aggregate Fair Value |
Aggregate Unpaid Principal Balance |
Difference | |||||||||
| Mortgage loans held for sale measured at fair value |
$ | 273,196 | $ | 264,968 | $ | 8,228 | ||||||
| Past due loans of 90 days or more |
— | — | — | |||||||||
| Nonaccrual loans |
— | — | — | |||||||||
|
|
||||||||||||
| 2014 | ||||||||||||
| Mortgage loans held for sale measured at fair value |
$ | 194,745 | $ | 188,774 | $ | 5,971 | ||||||
| Past due loans of 90 days or more |
— | — | — | |||||||||
| Nonaccrual loans |
— | — | — | |||||||||
|
|
||||||||||||
| 2013 | ||||||||||||
| Mortgage loans held for sale measured at fair value |
$ | 61,062 | $ | 59,470 | $ | 1,592 | ||||||
| Past due loans of 90 days or more |
— | — | — | |||||||||
| Nonaccrual loans |
— | — | — | |||||||||
|
|
||||||||||||
Note (20)—Parent company only financial statements:
| As of December, 31 | ||||||||||||
| 2015 | 2014 | 2013 | ||||||||||
| Balance Sheet |
||||||||||||
| Assets |
||||||||||||
| Cash and Cash Equivalents(1) |
$ | 1,253 | $ | 551 | $ | 870 | ||||||
| Investments |
2,381 | 3,142 | 2,118 | |||||||||
| Investment in Bank Subsidiary(1) |
265,632 | 244,562 | 219,453 | |||||||||
| Note Receivable—Bank Subsidiary(1) |
6,000 | 6,000 | 6,000 | |||||||||
| Interest Receivable(1) |
31 | 30 | 30 | |||||||||
| Other Assets |
2,545 | 3,838 | 2,389 | |||||||||
| Goodwill |
29 | 29 | 29 | |||||||||
|
|
|
|||||||||||
| Total Assets |
$ | 277,871 | $ | 258,152 | $ | 230,889 | ||||||
|
|
|
|||||||||||
| Liabilities and Shareholder’s Equity |
||||||||||||
| Liabilities |
||||||||||||
| Long Term Debt |
$ | 35,005 | $ | 35,005 | $ | 35,005 | ||||||
| Subordinated Debt(1) |
6,000 | 6,000 | 6,000 | |||||||||
| Accrued Expenses and other Liabilities |
192 | 1,919 | 197 | |||||||||
|
|
|
|||||||||||
| Total Liabilities |
$ | 41,197 | $ | 42,924 | $ | 41,202 | ||||||
|
|
|
|||||||||||
| Shareholder’s Equity |
||||||||||||
| Common Stock |
$ | 172 | $ | 172 | $ | 172 | ||||||
| Additional Paid in Capital |
111,552 | 111,552 | 111,552 | |||||||||
| Retained Earnings |
122,493 | 98,237 | 82,375 | |||||||||
| Accumulated Other Comprehensive Income (Loss) |
2,457 | 5,267 | (4,412 | ) | ||||||||
|
|
|
|||||||||||
| Total Shareholder’s Equity |
236,674 | 215,228 | 189,687 | |||||||||
|
|
|
|||||||||||
| Total Liabilities and Shareholder’s Equity |
$ | 277,871 | $ | 258,152 | $ | 230,889 | ||||||
|
|
||||||||||||
| (1) | Eliminates in Consolidation |
F-92
Table of Contents
Index to Financial Statements
FB Financial Corporation and subsidiaries
Notes to consolidated financial statements
| For the years ending December 31, | ||||||||||||
| 2015 | 2014 | 2013 | ||||||||||
| Income Statements |
||||||||||||
| Income |
||||||||||||
| Other Interest Income |
$ | 33 | $ | 32 | $ | 33 | ||||||
| Interest Income from Bank Subsidiary(1) |
121 | 118 | 119 | |||||||||
| Gain on sale of investments |
— | — | 34 | |||||||||
| Dividend Income from Bank Subsidiary(1) |
25,105 | 18,155 | 12,770 | |||||||||
| Earnings from Bank Subsidiary(1) |
23,879 | 15,429 | 15,235 | |||||||||
|
|
|
|||||||||||
| Total Income |
$ | 49,138 | $ | 33,734 | $ | 28,191 | ||||||
| Expenses |
||||||||||||
| Interest Expenses |
$ | 1,298 | $ | 1,278 | $ | 1,294 | ||||||
| Legal and Professional Fees |
3 | 3 | 3 | |||||||||
| Other Noninterest Expense |
59 | 69 | 68 | |||||||||
| State Income Benefit |
(78 | ) | (78 | ) | (77 | ) | ||||||
|
|
|
|||||||||||
| Total Expenses |
$ | 1,282 | $ | 1,272 | $ | 1,288 | ||||||
|
|
|
|||||||||||
| Net Income |
$ | 47,856 | $ | 32,462 | $ | 26,903 | ||||||
|
|
||||||||||||
| (1) | Eliminates in Consolidation |
| For the years ending December 31, | ||||||||||||
| 2015 | 2014 | 2013 | ||||||||||
| Statement of Cash Flows |
||||||||||||
| Operating Activities |
||||||||||||
| Net Income |
$ | 47,856 | $ | 32,462 | $ | 26,903 | ||||||
| Adjustments to reconcile net income to net cash provided by operating activities: |
||||||||||||
| Equity in undistributed income of subsidiary bank |
(23,879 | ) | (15,429 | ) | (15,235 | ) | ||||||
| Gain on sale of investments |
— | — | (34 | ) | ||||||||
| Increase in other assets |
1,292 | (1,449 | ) | (78 | ) | |||||||
| Increase (decrease) in other liabilities |
23 | 1,722 | (16 | ) | ||||||||
| Other, net |
(1 | ) | (1,751 | ) | 38 | |||||||
|
|
|
|||||||||||
| Net cash provided by operating activities |
25,291 | 15,555 | 11,578 | |||||||||
| Investing Activities |
||||||||||||
| Other investments |
761 | (1,024 | ) | (276 | ) | |||||||
|
|
|
|||||||||||
| Net cash provided by (used in) investing activities |
761 | (1,024 | ) | (276 | ) | |||||||
| Financing Activities |
||||||||||||
| Payment of dividends |
(25,350 | ) | (14,850 | ) | (11,260 | ) | ||||||
|
|
|
|||||||||||
| Net cash used in financing activities |
(25,350 | ) | (14,850 | ) | (11,260 | ) | ||||||
|
|
|
|||||||||||
| Net increase (decrease) in cash and cash equivalents |
702 | (319 | ) | 42 | ||||||||
| Cash and Cash Equivalents at beginning of year |
551 | 870 | 828 | |||||||||
|
|
|
|||||||||||
| Cash and Cash Equivalents at end of year |
$ | 1,253 | $ | 551 | $ | 870 | ||||||
|
|
|
|||||||||||
| Supplemental noncash disclosures: |
||||||||||||
| Dividends declared not paid |
$ | — | 1,750 | — | ||||||||
|
|
||||||||||||
F-93
Table of Contents
Index to Financial Statements
FB Financial Corporation and subsidiaries
Notes to consolidated financial statements
Note (21)—Segment reporting:
The Company and the Bank are engaged in the business of banking and provide a full range of financial services. The Company determines reportable segments based on the significance of the segment’s operating results to the overall Company, the products and services offered, customer characteristics, processes and service delivery of the segments and the regular financial performance review and allocation of resources by the Chief Executive Officer (CEO). The Company has identified two distinct reportable segments—Community Banking and Mortgage Banking. The Company’s primary segment is Community Banking, which provides a full range of deposit and lending products, including conforming residential loans, and services to corporate, commercial and consumer customers. The Company offers full-service conforming residential mortgage products and services through the Mortgage Banking segment utilizing offices beyond the geographical footprint of Community Banking operations as well as internet delivery channels. Additionally, the Mortgage Banking segment includes the servicing of residential mortgage loans and the packaging and securitization of loans to governmental agencies. The Company’s mortgage banking division represents a distinct reportable segment which differs from the Company’s primary business of commercial and retail banking.
The financial performance of the Mortgage Banking segment is assessed based on results of operations reflecting direct revenues and expenses and allocated expenses. This approach gives management a better indication of the operating performance of the segment. When assessing the Community Banking segment’s financial performance, the CEO utilizes reports with indirect revenues and expenses including but not limited to the investment portfolio, electronic delivery channels and areas that primarily support the banking segment operations. Therefore these are included in the results of the Community Banking segment. Other indirect revenue and expenses related to general administrative areas are also included in the internal financial results reports of the Community Banking segment utilized by the CEO for analysis and are thus included for Community Banking segment reporting. The Mortgage Banking segment utilizes funding sources from the Community Banking segment in order to fund mortgage loans that are ultimately sold on the secondary market. The Mortgage Banking segment used the proceeds from loan sales to repay obligations due to the Community Banking segment. Transactions among segments are made at fair value.
F-94
Table of Contents
Index to Financial Statements
FB Financial Corporation and subsidiaries
Notes to consolidated financial statements
During the three months ended March 31, 2016, the Company realigned its segment reporting structure to reclassify mortgage banking income and related expenses associated with retail mortgage originations within our Community banking geographic footprint from the Mortgage banking segment to the Community banking segment. This change was made to capture all of the product and service offerings for our Community banking customer base within our banking geographic footprint into the Community banking segment while capturing all of the mortgage banking activities outside of the banking footprint into the Mortgage banking segment to allow our chief executive officer to better determine resource allocations and operating performance for each segment. As such, the tables below have been revised to reflect the reclassification for all periods presented.
The following table provides segment financial information as of and for each of the years in the three-year period ending in December 31, 2015 follows:
| December 31, 2015 | Community bank |
Mortgage | Consolidated | |||||||||
| Net interest income |
$ | 92,366 | $ | 1,506 | $ | 93,872 | ||||||
| Reversal of loan loss provision |
(3,070 | ) | 6 | (3,064 | ) | |||||||
| Mortgage banking income |
18,718 | 51,472 | 70,190 | |||||||||
| Bargain purchase gain |
2,794 | — | 2,794 | |||||||||
| Other noninterest income |
19,396 | — | 19,396 | |||||||||
| Depreciation |
2,934 | 350 | 3,284 | |||||||||
| Amortization of intangibles |
1,731 | — | 1,731 | |||||||||
| Merger and conversion expenses |
3,543 | — | 3,543 | |||||||||
| Other noninterest expense |
84,190 | 45,744 | 129,934 | |||||||||
|
|
|
|||||||||||
| Income before income taxes |
43,946 | 6,878 | 50,824 | |||||||||
| State income tax expense |
2,968 | |||||||||||
|
|
|
|||||||||||
| Net income |
47,856 | |||||||||||
| Total assets |
$ | 2,570,071 | $ | 329,349 | $ | 2,899,420 | ||||||
| Goodwill |
46,804 | 100 | 46,904 | |||||||||
|
|
||||||||||||
| December 31, 2014 | ||||||||||||
| Net interest income |
$ | 83,192 | $ | 184 | $ | 83,376 | ||||||
| Loan loss provision |
(2,716 | ) | — | (2,716 | ) | |||||||
| Mortgage banking income |
8,958 | 22,177 | 31,135 | |||||||||
| Other noninterest income |
19,667 | — | 19,667 | |||||||||
| Depreciation |
2,784 | 315 | 3,099 | |||||||||
| Amortization of intangibles |
1,613 | — | 1,613 | |||||||||
| Other noninterest expense |
76,036 | 21,415 | 97,451 | |||||||||
|
|
|
|||||||||||
| Income before income taxes |
34,100 | 631 | 34,731 | |||||||||
| State income tax expense |
2,269 | |||||||||||
|
|
|
|||||||||||
| Net income |
32,462 | |||||||||||
| Total assets |
$ | 2,202,978 | $ | 225,211 | $ | 2,428,189 | ||||||
| Goodwill |
46,804 | 100 | 46,904 | |||||||||
|
|
||||||||||||
F-95
Table of Contents
Index to Financial Statements
FB Financial Corporation and subsidiaries
Notes to consolidated financial statements
| December 31, 2013 | Community bank |
Mortgage | Consolidated | |||||||||
| Net interest income |
$ | 75,055 | $ | 421 | $ | 75,476 | ||||||
| Loan loss provision |
(1,519 | ) | — | (1,519 | ) | |||||||
| Mortgage banking income |
5,270 | 18,698 | 23,968 | |||||||||
| Other noninterest income |
17,418 | — | 17,418 | |||||||||
| Depreciation |
2,665 | 271 | 2,936 | |||||||||
| Amortization of intangibles |
1,726 | — | 1,726 | |||||||||
| Other noninterest expense |
66,867 | 18,055 | 84,922 | |||||||||
|
|
|
|||||||||||
| Income before income taxes |
28,004 | 793 | 28,797 | |||||||||
| State income tax expense |
1,894 | |||||||||||
|
|
|
|||||||||||
| Net income |
26,903 | |||||||||||
| Total assets |
$ | 2,183,125 | $ | 75,262 | $ | 2,258,387 | ||||||
| Goodwill |
46,804 | 100 | 46,904 | |||||||||
|
|
||||||||||||
Our Community Banking segment provides our Mortgage Banking segment with a warehouse line of credit that is used to fund mortgage loans held for sale. The warehouse line of credit had a prime interest rate of 3.25% for 2015, 2014 and 2013. The amount of interest paid by our Mortgage Banking segment to our Community Banking segment under this warehouse line of credit is recorded as interest income to our Community Banking segment and as interest expense to our Mortgage Banking segment, both of which are included in the calculation of net interest income for each segment. The amount of interest paid by our Mortgage Banking segment to our Community Banking segment under this warehouse line of credit was $8,688 in 2015, $3,647 in 2014 and $2,322 in 2013. The increase in interest payments from 2013 to 2015 resulted from increased mortgage loan originations.
Note (22)—Minimum capital requirements:
Banks and bank holding companies are subject to regulatory capital requirements administered by federal banking agencies. Capital adequacy guidelines and, additionally for banks, prompt corrective action regulations involve quantitative measures of assets, liabilities, and certain off-balance sheet items calculated under regulatory accounting practices. Capital amounts and classifications are also subject to qualitative judgments by regulators. Failure to meet capital requirements can initiate regulatory action.
In July 2013, the Federal Reserve Board and the Federal Deposit Insurance Corporation (FDIC) approved final rules that substantially amend the regulatory risk-based capital rules applicable to the Company and Bank. The final rules implement the Basel III regulatory capital reforms and changes required by the Dodd-Frank Act.
Under these recently adopted rules, the leverage and risk-based capital ratios of bank holding companies may not be lower than the leverage and risk-based capital ratios for insured depository institutions. The final rules implementing the Basel III regulatory capital reforms became effective as to the Company and Bank on January 1, 2015 with certain transitional provisions through 2019 and include new minimum risk-based capital and leverage ratios. Moreover, these rules refine the definition of what constitutes “capital” for purposes of calculating those ratios.
The new minimum capital level requirements applicable to bank holding companies and banks subject to the rules are: (i) a new common equity Tier 1 capital ratio of 4.5%; (ii) a Tier 1 risk-based capital ratio of 6% (increased from 4%); (iii) a total risk-based capital ratio of 8% (unchanged from current rules); and (iv) a Tier 1 leverage ratio of 4% for all institutions.
F-96
Table of Contents
Index to Financial Statements
FB Financial Corporation and subsidiaries
Notes to consolidated financial statements
The rules also establish a “capital conservation buffer” of 2.5% (to be phased in over three years) above the new regulatory minimum capital ratios, and result in the following minimum ratios once the capital conservation buffer is fully phased in: (i) a common equity Tier 1 risk-based capital ratio of 7.0%, (ii) a Tier 1 risk-based capital ratio of 8.5%, and (iii) a total risk-based capital ratio of 10.5%. The capital conservation buffer requirement is to be phased in beginning in January 2016 at 0.625% of risk-weighted assets and would increase each year until fully implemented in January 2019. An institution will be subject to limitations on paying dividends, engaging in share repurchases and paying discretionary bonuses if its capital levels fall below the buffer amounts. These limitations establish a maximum percentage of eligible retained income that could be utilized for such actions.
As of December 31, 2015, the Bank and Company met all capital adequacy requirements to which it is subject. Also, as of June 30, 2015, the most recent notification from the FDIC, the Bank was well capitalized under the regulatory framework for prompt corrective action. There are no conditions or events since that notification that management believes have changed the Bank’s category.
Actual and required capital amounts and ratios are presented below at year-end (in thousands).
| Actual | For capital adequacy purposes |
To be well capitalized under prompt corrective action provisions |
||||||||||||||||||||||||||||||
| Amount | Ratio | Amount | Ratio | Amount | Ratio | |||||||||||||||||||||||||||
| December 31, 2015: |
||||||||||||||||||||||||||||||||
| Total Capital (to risk-weighted assets) |
||||||||||||||||||||||||||||||||
| FB Financial Corporation |
$ | 246,168 | 11.15% | > | $ | 176,623 | > | 8.0% | N/A | N/A | ||||||||||||||||||||||
| FirstBank |
242,240 | 11.02% | > | 175,855 | > | 8.0% | > | $ | 219,819 | > | 10.0% | |||||||||||||||||||||
| Tier 1 Capital (to risk-weighted assets) |
||||||||||||||||||||||||||||||||
| FB Financial Corporation |
$ | 211,633 | 9.58% | > | $ | 132,547 | > | 6.0% | N/A | N/A | ||||||||||||||||||||||
| FirstBank |
211,780 | 9.63% | > | 131,950 | > | 6.0% | > | $ | 131,950 | > | 6.0% | |||||||||||||||||||||
| Tier 1 Capital (to average assets) |
||||||||||||||||||||||||||||||||
| FB Financial Corporation |
$ | 211,633 | 7.64% | > | $ | 110,803 | > | 4.0% | N/A | N/A | ||||||||||||||||||||||
| FirstBank |
211,780 | 7.65% | > | 110,735 | > | 4.0% | > | $ | 138,418 | > | 5.0% | |||||||||||||||||||||
| Common Equity Tier 1 Capital – (to risk-weighted assets)l |
||||||||||||||||||||||||||||||||
| FB Financial Corporation |
$ | 181,633 | 8.23% | > | $ | 99,313 | > | 4.5% | N/A | N/A | ||||||||||||||||||||||
| FirstBank |
211,780 | 9.63% | > | 98,963 | > | 4.5% | > | $ | 142,946 | > | 6.5% | |||||||||||||||||||||
|
|
||||||||||||||||||||||||||||||||
F-97
Table of Contents
Index to Financial Statements
FB Financial Corporation and subsidiaries
Notes to consolidated financial statements
| Actual | For capital adequacy purposes |
To be well capitalized under prompt corrective action provisions |
||||||||||||||||||||||||||||||
| Amount | Ratio | Amount | Ratio | Amount | Ratio | |||||||||||||||||||||||||||
| December 31, 2014: |
||||||||||||||||||||||||||||||||
| Total Capital to (risk-weighted assets) |
||||||||||||||||||||||||||||||||
| FB Financial Corporation |
$ | 219,419 | 13.18% | > | $ | 133,192 | > | 8.0% | N/A | N/A | ||||||||||||||||||||||
| FirstBank |
215,303 | 12.96% | > | 132,887 | > | 8.0% | > | $ | 166,109 | > | 10.0% | |||||||||||||||||||||
| Tier 1 Capital (to risk-weighted assets) |
||||||||||||||||||||||||||||||||
| FB Financial Corporation |
$ | 188,478 | 11.32% | > | $ | 66,596 | > | 4.0% | N/A | N/A | ||||||||||||||||||||||
| FirstBank |
188,437 | 11.34% | > | 66,443 | > | 4.0% | > | $ | 99,665 | > | 6.0% | |||||||||||||||||||||
| Tier 1 Capital (to average assets) |
||||||||||||||||||||||||||||||||
| FB Financial Corporation |
$ | 188,478 | 8.10% | > | $ | 93,028 | > | 4.0% | N/A | N/A | ||||||||||||||||||||||
| FirstBank |
188,437 | 8.10% | > | 93,012 | > | 4.0% | > | $ | 116,264 | > | 5.0% | |||||||||||||||||||||
|
|
||||||||||||||||||||||||||||||||
| Actual | For capital adequacy purposes |
To be
well capitalized under prompt corrective action provisions |
||||||||||||||||||||||
| Amount | Ratio | Amount | Ratio | Amount | Ratio | |||||||||||||||||||
| December 31, 2013: |
||||||||||||||||||||||||
| Total Capital to (risk-weighted assets) |
||||||||||||||||||||||||
| FB Financial Corporation |
$ | 200,211 | 13.41% | ³ | $ 119,484 | ³ | 8.00% | N/A | N/A | |||||||||||||||
| FirstBank |
196,562 | 13.20% | ³ | 119,121 | ³ | 8.00% | ³ | $ 148,901 | ³ | 10.0% | ||||||||||||||
| Tier 1 Capital (to risk-weighted assets) |
||||||||||||||||||||||||
| FB Financial Corporation |
$ | 171,354 | 11.47% | ³ | $59,742 | ³ | 4.00% | N/A | N/A | |||||||||||||||
| FirstBank |
171,780 | 11.54% | ³ | 59,560 | ³ | 4.00% | ³ | $89,340 | ³ | 6.0% | ||||||||||||||
| Tier 1 Capital (to average assets) |
||||||||||||||||||||||||
| FB Financial Corporation |
$ | 171,354 | 7.97% | ³ | $86,053 | ³ | 4.00% | N/A | N/A | |||||||||||||||
| FirstBank |
171,780 | 7.98% | ³ | 86,054 | ³ | 4.00% | ³ | $107,568 | ³ | 5.0% | ||||||||||||||
|
|
||||||||||||||||||||||||
Note (23)—Employee benefit plans:
(A)—401(k) plan:
The Bank has a 401(k) Plan (the “Plan”) whereby substantially all employees participate in the Plan. Employees may contribute the maximum amount of their eligible compensation subject to certain limits based on the federal tax laws. The Bank makes discretionary matching contributions not to exceed 6% of an employee’s total compensation contributed to the Plan. The Bank may also make discretionary Profit Sharing contributions. Matching and profit sharing contributions are vested equally over five years. For the years ended December 31, 2015, 2014 and 2013, the matching portions provided by the Bank to this Plan were $1,290, $922 and $419, respectively. An additional discretionary contribution of 25% match was contributed in 2015 and 2014.
F-98
Table of Contents
Index to Financial Statements
FB Financial Corporation and subsidiaries
Notes to consolidated financial statements
(B)—Acquired supplemental retirement plans:
In prior years, the Company assumed certain nonqualified supplemental retirement plans for certain former employees of acquired entities. At December 31, 2015, 2014 and 2013, other liabilities on the consolidated balance sheet include post-retirement benefits payable of $1,914, $1,802 and $1,693, respectively, related to these plans. For the years ended December 31, 2015, 2014 and 2013, the Company recorded expense of $313, $314 and $233 respectively, related to these plans and payments to the participants were $202, $205 and $172 in 2015, 2014 and 2013, respectively. The Company also acquired single premium life insurance policies on these individuals. At December 31, 2015, 2014 and 2013, other assets on the consolidated balance sheet include $10,331, $3,125 and $3,033 and reported cash value income (net of related insurance premium expense) of $136, $92 and $94 in 2015, 2014 and 2013, respectively.
(C)—Deferred compensation plans and agreements:
The Company and Bank have established certain long-term deferred compensation plans and entered into agreements to reward and retain certain executives and employees of the Bank. Each plan or agreement is an unfunded general obligation of the Bank. The plans and agreements have varying vesting periods and other terms as follows:
2006 and 2010 FirstBank Equity Based Incentive Plan—The Board of Directors may grant equity-based incentive unit awards. Each unit is valued by dividing 7.5% of the total assets of the Bank by the total number of outstanding common stock shares of the Company. The awards vest at 20% a year, are fully vested at the end of five years and are payable in cash upon 100% vesting of the balance.
2006 FirstBank Preferred Equity Based Incentive Plan—The provisions are the same as above with the exception of a seven year vesting period with cash payout in the eighth year after the award is granted. The grants under this plan were determined in advance and were awarded over a five-year period.
FirstBank 2012 Equity Based Incentive Plan—The Board of Directors may grant equity-based incentive awards; the awards vest 100% at the end of three years of continued service and are paid in cash upon full vesting. The awards are valued by dividing the fair market value of the Company by the number of outstanding shares of common stock. The fair market value of the Company is determined by the average of the sum of (a) 15 times the Company’s after-tax earnings, based on a default tax rate imposed by the Code, and (b) 1.5 times the Company’s tangible book value, defined as the consolidated equity of the Company less unrealized gains (losses) and less goodwill and intangible assets.
Other Agreements—The Bank may at its discretion authorize and approve similar deferred compensation arrangements with executives from time to time. Effective December 31, 2014, the Bank issued an agreement for a key executive to reward service prior to that time in a fixed amount payable in cash upon the earliest occurrence of the following: separation of service, change in control of the Company or December 31, 2019.
Summary—At December 31, 2015, 2014 and 2013, other liabilities in the accompanying consolidated balance sheet include liabilities for these awards totaling $9,452, $9,144 and $4,362, respectively. For the years ended December 31, 2015, 2014 and 2013, the Company incurred expenses related to these plans and agreements totaling $2,921, $5,465 and $2,067, respectively, which is included in salaries and wages in the accompanying statement of income. Additionally, payments under the plans totaled $2,614, $683 and $1,604, respectively, for 2015, 2014 and 2013.
F-99
Table of Contents
Index to Financial Statements
FB Financial Corporation and subsidiaries
Notes to consolidated financial statements
Note (24)—Related party transactions:
(A) Loans:
The Bank has made and expects to continue to make loans to the directors and executive officers of the Company and their affiliates in the ordinary course of business. In management’s opinion, these transactions with directors and executive officers were made on substantially the same terms as those prevailing at the time for comparable transactions with other unaffiliated persons and did not involve more than the normal risk.
An analysis of loans to executive officers, the shareholder of the Company, and directors of the Bank and their affiliates follows (in thousands):
| 2015 | 2014 | 2013 | ||||||||||
| Loans outstanding at January 1 |
$ | 27,581 | $ | 32,228 | $ | 25,275 | ||||||
| New loans and advances |
4,554 | 2,114 | 8,233 | |||||||||
| Repayments |
(2,253 | ) | (6,761 | ) | (1,280 | ) | ||||||
|
|
|
|||||||||||
| Loans outstanding at December 31 |
$ | 29,882 | $ | 27,581 | $ | 32,228 | ||||||
|
|
||||||||||||
Unfunded commitments to certain executive officers and directors and their associates totaled $4,128, $2,997 and $6,777 at December 31, 2015, 2014 and 2013, respectively.
At December 31, 2015, the Bank held a residential mortgage loan to a related party which was included in loans held for sale totaling $999. Subsequent to December 31, 2015, the mortgage loan was sold on the secondary market.
(B) Deposits:
The Bank held deposits from related parties totaling $68,612, $60,133 and $48,078 as of December 31, 2015, 2014 and 2013, respectively.
(C) Leases:
The Bank leases various office spaces from entities related to the shareholder under varying terms. The Company had $180, $194 and $194 in unamortized leasehold improvements related to these leases at December 31, 2015, 2014 and 2013, respectively. These improvements are being amortized over a term not to exceed the length of the lease. Lease expense for these properties totaled $503, $502, and $504 for the years ended December 31, 2015, 2014 and 2013, respectively. Additionally, the Company has recognized rental income of $58, $57 and $57 from an entity related to the shareholder in the years ended December 31, 2015, 2014 and 2013, respectively.
(D) Data processing:
An entity wholly owned by the shareholder provides data processing, courier and computer services to the Bank. The expense for the services provided by this related party is $-0-, $1,291 and $2,862 for the years ended December 31, 2015, 2014 and 2013, respectively.
F-100
Table of Contents
Index to Financial Statements
FB Financial Corporation and subsidiaries
Notes to consolidated financial statements
(E) Consulting services:
The Bank paid $306 in 2015, 2014 and 2013, respectively; in management consulting services to an entity owned 100% by the shareholder. Additionally, the Company made various other payments to the entity related to travel and miscellaneous items of $61, $117, and $51 during the years ended December 31, 2015, 2014 and 2013, respectively.
(F) Subordinated debt:
On February 12, 1996 the Company borrowed $775 from the shareholder through a term subordinated note. The Company borrowed $3,300 on August 26, 1999 from the shareholder through a term subordinated note. On June 30, 2006, the Company borrowed $6,000 from the shareholder through a term subordinated note. The Company paid interest payments related to these subordinated debentures to the shareholder amounting to approximately $211, $237, and $211 during 2015, 2014 and 2013. The details for these notes are discussed in Note (14)—Long-Term Debt.
(G) Additional paid-in capital:
The shareholder made no capital investment in the Company in 2015, 2014 and in 2013.
(H) Investment securities transactions:
The Company holds an investment in a fund that was issued by an entity owned by one of its directors. The balance in the investment was $1,472, $1,472 and $1,516 as of the years ended December 31, 2015, 2014 and 2013, respectively. The Company received capital distributions of $0, $44 and $74 during the years ended December 31, 2015, 2014 and 2013, respectively.
On June 25, 2014 the Bank sold the Trust Preferred Securities (PreTSL) Series I—Mezzanine Level (CUSIP 740408AC3.) These were sold at par ($1,117) to an entity related to the shareholder plus accrued interest ($32) The transaction settled on June 30, 2014.
The Bank recorded a gain of $582 on the sale and recovered interest of $457. Total proceeds from the sale were $1,149. The Bank recorded OTTI of $449 in prior years and the value was recorded at $110. The Bank requested bids for the investment security from six entities plus the related entity to establish a fair value. Management believes that the bids received by independent parties represent market activity, and as such, represent a fair market value for the security.
Note (25)—Subsequent event:
Effective June 28, 2016 the Company declared a 100-for-1 stock split, increasing the number of issued and authorized shares of common stock from 171,800 to 17,180,000 and 250,000 to 25,000,000, respectively. Additional shares issued as a result of the stock split were distributed immediately upon issuance to the shareholder. Share and per share amounts included in the consolidated financial statements and notes thereto have been retroactively adjusted to reflect the effect of the split for all periods presented, including the reclassification impact of an amount equal to the addition in par value of common stock from additional paid-in capital to common stock.
Effective July 29, 2016 the Company increased the number of authorized shares from 25,000,000 to 75,000,000.
F-101
Table of Contents
Index to Financial Statements
Until , 2016 (the 25th day after the date of this prospectus), all dealers effecting transactions in our common stock, whether or not participating in this offering, may be required to deliver a prospectus. This delivery requirement is in addition to the obligation of dealers to deliver a prospectus when acting as underwriters and with respect to their unsold allotments or subscriptions.
5,882,352 Shares

Common Stock
PROSPECTUS
| J.P. Morgan | UBS Investment Bank | Keefe, Bruyette & Woods A Stifel Company |
| Raymond James | Sandler O’Neill + Partners, L.P. | Stephens Inc. |
, 2016
Neither we nor any of the underwriters have authorized anyone to provide information different from that contained in this prospectus. When you make a decision about whether to invest in our common stock, you should not rely upon any information other than the information in this prospectus. Neither the delivery of this prospectus nor the sale of our common stock means that information contained in this prospectus is correct after the date of this prospectus. This prospectus is not an offer to sell or solicitation of an offer to buy these shares of common stock in any circumstances under which the offer or solicitation is unlawful.
Table of Contents
Index to Financial Statements
Part II
Information not required in prospectus
Item 13. Other expenses and issuance and distribution.
The following table sets forth the costs and expenses, other than underwriting discounts and commissions, in connection with the sale of shares of our common stock being registered, all of which will be paid by us. All amounts shown are estimates, except for the SEC registration fee, the FINRA filing fee and the NYSE listing fee.
| Expense category | Amount | |||
| SEC registration fee |
$ | 12,261.70 | ||
| FINRA filing fee |
17,750.00 | |||
| NYSE listing fee |
146,000.00 | |||
| Legal fees and expenses |
1,707,993.00 | |||
| Accounting fees and expenses |
1,547,384.00 | |||
| Printing fees and expenses |
500,000.00 | |||
| Transfer agent and registrar fees and expenses |
5,000.00 | |||
|
|
|
|||
| Total |
$ | 3,936,388.70 | ||
Item 14. Indemnification of directors and officers.
The TBCA provides that a corporation may indemnify any of its directors and officers against liability incurred in connection with a proceeding if (i) the director or officer acted in good faith, (ii) in the case of conduct in his or her official capacity with the corporation, the director or officer reasonably believed such conduct was in the corporation’s best interest, (iii) in all other cases, the director or officer reasonably believed that his or her conduct was not opposed to the best interest of the corporation and (iv) in connection with any criminal proceeding, the director or officer had no reasonable cause to believe that his or her conduct was unlawful. In actions brought by or in the right of the corporation, however, the TBCA provides that no indemnification may be made if the director or officer was adjudged to be liable to the corporation. In cases where the director or officer is wholly successful, on the merits or otherwise, in the defense of any proceeding instigated because of his or her status as an officer or director of a corporation, the TBCA mandates that the corporation indemnify the director or officer against reasonable expenses incurred in the proceeding. The TBCA also provides that in connection with any proceeding charging improper personal benefit to an officer or director, no indemnification may be made if such officer or director is adjudged liable on the basis that personal benefit was improperly received. Notwithstanding the foregoing, the TBCA provides that a court of competent jurisdiction, upon application, may order that an officer or director be indemnified for reasonable expenses if, in consideration of all relevant circumstances, the court determines that such individual is fairly and reasonably entitled to indemnification, notwithstanding the fact that (i) such officer or director was adjudged liable to the corporation in a proceeding by or in right of the corporation, (ii) such officer or director was adjudged liable on the basis that personal benefit was improperly received by him, or (iii) such officer or director breached his duty of care to the corporation.
Our amended and restated charter and amended and restated bylaws require us to indemnify our directors and officers to the fullest extent permitted by law with respect to all liability and loss suffered and expenses reasonably incurred by such person in any action, suit or proceeding in which such person was or is made, or threatened to be made, a party, or is otherwise involved by reason of the fact that such person is or was a
II-1
Table of Contents
Index to Financial Statements
director or officer of the Company. In addition, we have a directors’ and officers’ liability insurance policy which provides coverage sufficiently broad to permit indemnification under certain circumstances for liabilities (including reimbursement for expenses incurred) arising under the Securities Act.
In addition, our amended and restated charter provides that our directors shall not be personally liable to us or our shareholders for monetary damages for breach of any fiduciary duty as a director of the Company, except to the extent such exemption from liability or limitation thereof is not permitted under the TBCA. Under the TBCA, this provision does not relieve our directors from personal liability to us or our shareholders for monetary damages for breach of fiduciary duty as a director, to the extent such liability arises from a judgment or other final adjudication establishing: (a) any breach of the director’s duty of loyalty; (b) acts or omissions not in good faith or which involve intentional misconduct or a knowing violation of law; or (c) any unlawful distributions. Nor does this provision eliminate the duty of care and, in appropriate circumstances, equitable remedies such as injunctive or other forms of non-monetary relief will remain available under Tennessee law. Finally, this provision does not affect a director’s responsibilities under any other law, such as the federal securities laws or state or federal environmental laws.
The proposed form of underwriting agreement filed as Exhibit 1 to this registration statement provides for indemnification of our directors and officers by the underwriters against certain liabilities.
Insofar as indemnification for liabilities arising under the Securities Act may be permitted to directors, officers or persons controlling us under any of the foregoing provisions, in the opinion of the Securities and Exchange Commission, that indemnification is against public policy as expressed in the Securities Act and is therefore unenforceable. Finally, our ability to provide indemnification to our directors and officers is limited by federal banking laws and regulations, including, but not limited to, 12 U.S.C. §1828(k).
Item 15. Recent sales of unregistered securities.
None.
II-2
Table of Contents
Index to Financial Statements
Item 16. Exhibits and financial statement schedules.
| (a) | Exhibits |
| Exhibit number |
Description | |||
| 1.1 | Form of Underwriting Agreement* | |||
| 3.1 | Amended and Restated Certificate of Incorporation of FB Financial Corporation | |||
| 3.2 | Form of Amended and Restated Bylaws of FB Financial Corporation† | |||
| 4.1 | Form of Registration rights agreement† | |||
| 5.1 | Opinion of Alston & Bird, LLP | |||
| 10.1 | Form of Tax Sharing Agreement† | |||
| 10.2 | Form of Shareholder’s Agreement† | |||
| 10.3 | Deferred Compensation Agreement between FB Financial Corporation and Chris Holmes | |||
| 10.4 | Amendment to Deferred Compensation Agreement between FB Financial Corporation and Chris Holmes | |||
| 10.5 | Employment Agreement between FB Financial Corporation and Chris Holmes | |||
| 10.6 | FB Financial Corporation 2016 Long-Term Incentive Plan | |||
| 10.7 | Form of Nonstatutory Stock Option Award Certificate pursuant to the FB Financial Corporation 2016 Long-Term Incentive Plan | |||
| 10.8 | Form of Restricted Stock Unit Award Certificate pursuant to the FB Financial Corporation 2016 Long-Term Incentive Plan | |||
| 10.9 | Form of Restricted Stock Award Certificate pursuant to the FB Financial Corporation 2016 Long -Term Incentive Plan | |||
| 10.10 | FirstBank Preferred Equity Based Incentive Plan, as amended† | |||
| 10.11 | FirstBank 2012 Equity Based Incentive Plan, as amended† | |||
| 10.12 | EBI Unit Award Agreement between FB Financial Corporation and Chris Holmes (Fully-Vested) | |||
| 10.13 | EBI Unit Award Agreement between FB Financial Corporation and Chris Holmes (Ratable Vesting) | |||
| 10.14 | FB Financial Corporation 2016 Employee Stock Purchase Plan | |||
| 10.15 | FirstBank 2010 Equity Based Incentive Plan | |||
| 10.16 | Amendment to FirstBank 2012 Equity Based Incentive Plan | |||
| 10.17 | Amendment to FirstBank Preferred Equity Based Incentive Plan | |||
| 10.18 | Amendment to FirstBank 2010 Equity Based Incentive Plan | |||
| 16.1 | Letter from HORNE LLP, dated August 19, 2016, regarding change in accountant† | |||
| 21.1 | Subsidiaries of FB Financial Corporation† | |||
| 23.1 | Consent of RSM US LLP | |||
| 23.3 | Form of Consent for Alston & Bird, LLP (included as part of Exhibit 5.1) | |||
| 24.1 | Power of Attorney† | |||
|
|
| |||
| * | To be filed by amendment. |
| † | Previously filed. |
II-3
Table of Contents
Index to Financial Statements
Item 17. Undertakings.
The undersigned registrant hereby undertakes to provide to the underwriters at the closing specified in the underwriting agreement certificates in such denominations and registered in such names as required by the underwriters to permit prompt delivery to each purchaser.
Insofar as indemnification for liabilities arising under the Securities Act may be permitted to directors, officers and controlling persons of the registrant pursuant to the indemnification provisions described herein, or otherwise, the registrant has been advised that in the opinion of the SEC such indemnification is against public policy as expressed in the Securities Act and is, therefore, unenforceable. In the event that a claim for indemnification against such liabilities (other than the payment by the registrant of expenses incurred or paid by a director, officer or controlling person of the registrant in the successful defense of any action, suit or proceeding) is asserted by such director, officer or controlling person in connection with the securities being registered, the registrant will, unless in the opinion of its counsel the matter has been settled by controlling precedent, submit to a court of appropriate jurisdiction the question whether such indemnification by it is against public policy as expressed in the Securities Act and will be governed by the final adjudication of such issue.
The undersigned registrant hereby undertakes that:
(1) For purposes of determining any liability under the Securities Act, the information omitted from the form of prospectus as filed as part of this registration statement in reliance upon Rule 430A and contained in a form of prospectus filed by the registrant pursuant to Rule 424(b)(1) or (4) or 497(h) under the Securities Act shall be deemed to be part of this registration statement as of the time it was declared effective.
(2) For the purpose of determining any liability under the Securities Act, each post-effective amendment that contains a form of prospectus shall be deemed to be a new registration statement relating to the securities offered therein, and the offering of such securities at that time shall be deemed to be the initial bona fide offering thereof.
II-4
Table of Contents
Index to Financial Statements
Signatures
Pursuant to the requirements of the Securities Act of 1933, the registrant has duly caused this registration statement to be signed on its behalf by the undersigned, thereunto duly authorized, in the City of Nashville, State of Tennessee, on the 6th day of September, 2016.
| FB Financial Corporation | ||
| By: | /s/ Christopher T. Holmes | |
| Name: Christopher T. Holmes | ||
| Title: President and Chief Executive officer | ||
Pursuant to the requirements of the Securities Act of 1933, this registration statement has been signed by the following persons in the capacities and on the dates indicated.
| Signature | Title | Date | ||
| /s/ Christopher T. Holmes | September 6, 2016 | |||
| Christopher T. Holmes | President, Chief Executive Officer and Director (Principal Executive Officer) |
|||
| /s/ James R. Gordon | September 6, 2016 | |||
| James R. Gordon | Chief Financial Officer (Principal Financial Officer and Principal Accounting Officer ) |
|||
| * |
September 6, 2016 | |||
| James W. Ayers | Executive Chairman and Director | |||
| * |
September 6, 2016 | |||
| Orrin H. Ingram | Director | |||
| * |
September 6, 2016 | |||
| Ruth E. Johnson | Director | |||
| * |
September 6, 2016 | |||
| Stuart C. McWhorter | Director | |||
|
| ||||
| * | Pursuant to the power of attorney previously included in the registrant’s registration statement on Form S-1 filed on August 19, 2016. |
| By | /s/ Christopher T. Holmes | |
| Christopher T. Holmes | ||
II-5
Table of Contents
Index to Financial Statements
Exhibit index
| Exhibit number |
Description | |||
| 1.1 | Form of Underwriting Agreement* | |||
| 3.1 | Amended and Restated Certificate of Incorporation of FB Financial Corporation | |||
| 3.2 | Form of Amended and Restated Bylaws of FB Financial Corporation† | |||
| 4.1 | Form of Registration rights agreement† | |||
| 5.1 | Opinion of Alston & Bird, LLC | |||
| 10.1 | Form of Tax Sharing Agreement† | |||
| 10.2 | Form of Shareholder’s Agreement† | |||
| 10.3 | Deferred Compensation Agreement between FB Financial Corporation and Chris Holmes | |||
| 10.4 | Amendment to Deferred Compensation Agreement between FB Financial Corporation and Chris Holmes | |||
| 10.5 | Employment Agreement between FB Financial Corporation and Chris Holmes | |||
| 10.6 | FB Financial Corporation 2016 Long-Term Incentive Plan | |||
| 10.7 | Form of Nonstatutory Stock Option Award Certificate pursuant to the FB Financial Corporation 2016 Long-Term Incentive Plan | |||
| 10.8 | Form of Restricted Stock Unit Award Certificate pursuant to the FB Financial Corporation 2016 Long-Term Incentive Plan | |||
| 10.9 | Form of Restricted Stock Award Certificate pursuant to the FB Financial Corporation 2016 Long-Term Incentive Plan | |||
| 10.10 | FirstBank Preferred Equity Based Incentive Plan, as amended† | |||
| 10.11 | FirstBank 2012 Equity Based Incentive Plan, as amended† | |||
| 10.12 | EBI Unit Award Agreement between FB Financial Corporation and Chris Holmes (Fully-Vested) | |||
| 10.13 | EBI Unit Award Agreement between FB Financial Corporation and Chris Holmes (Ratable Vesting) | |||
| 10.14 | FB Financial Corporation 2016 Employee Stock Purchase Plan | |||
| 10.15 | FirstBank 2010 Equity Based Incentive Plan | |||
| 10.16 | Amendment to FirstBank 2012 Equity Based Incentive Plan | |||
| 10.17 | Amendment to FirstBank Preferred Equity Based Incentive Plan | |||
| 10.18 | Amendment to FirstBank 2010 Equity Based Incentive Plan | |||
| 16.1 | Letter from HORNE LLP, dated August 19, 2016, regarding change in accountant† | |||
| 21.1 | Subsidiaries of FB Financial Corporation† | |||
| 23.1 | Consent of RSM US LLP | |||
| 23.3 | Form of Consent for Alston & Bird, LLC (included as part of Exhibit 5.1) | |||
| 24.1 | Power of Attorney† | |||
|
|
| |||
| * | To be filed by amendment. |
| † | Previously filed. |
II-6