Attached files
| file | filename |
|---|---|
| 8-K - FORM 8-K - CINCINNATI FINANCIAL CORP | v448337_8k.htm |
Exhibit 99.1
CINCINNATI FINANCIAL CORPORATION INVESTOR HANDOUT September 2016
NASDAQ : CINF This presentation contains forward - looking statements that involve risks and uncertainties. Please refer to our various filings with the U.S. Securities and Exchange Commission for factors that could cause results to materially differ from those discussed. The forward - looking information in this presentation has been publicly disclosed, most recently on July 27, 2016, and should be considered to be effective only as of that date. Its inclusion in this document is not intended to be an update or reaffirmation of the forward - looking information as of any later date. Reconciliations of non - GAAP measures are in our most recent quarterly earnings news release, which is available at cinfin.com/investors.
STRATEGY OVERVIEW • Competitive advantages: • Relationships leading to agents’ best accounts • Financial strength for stability and confidence • Local decision making and claims excellence • Other distinguishing factors: • 55 years of shareholder dividend increases • Common stocks are approximately 30 % of investments • 27 years of favorable reserve development
PERFORMANCE TARGETS & TRENDS • 10.5% value creation ratio for YTD 06 - 30 - 16 on pace for target: 10 % to 13% annual average for 2013 through 2017 – 3.8% contribution from operating earnings YTD 06 - 30 - 16 – 10.1% five - year VCR average as of 12 - 31 - 15 • Related performance drivers were on track for YTD 06 - 30 - 16: – 6% premium growth, exceeding estimated industry average – 95.4% combined ratio, within 95% to 100% long - term target – 12 consecutive quarters of investment income growth • Ranked #1 or #2 in ~75% of agencies appointed 5 + years • Improving through strategic profitability & growth initiatives
HIGH NET WORTH EXPANSION • $145 million of “legacy” 2015 HNW premiums – 13% of total 2015 personal lines segment – More profitable than middle market • New business written premium growth on track – $14 million of $25 million 2016 target produced in 1H16 • Appointing new agencies
HIGH NET WORTH EXPERTISE • HNW clients of agencies have unique requirements – I nspection of property risks is more in - depth – Insured coverage valuation is a critical component – Claims service is specialized and enhanced • Cincinnati Insurance has gained expertise – Hired leaders averaging more than 20 years of experience – S taff trained by those leaders are prepared to deliver
CINCINNATI FINANCIAL AT A GLANCE • Top 25 U.S. P/C insurer • A.M. Best rating: A+ Superior • $4.5 billion 2015 premiums: 67% C ommercial 24% Personal 5 % L ife 4% Excess & surplus • Agency - centered business model is time - tested – A gency relationships strengthened by in - person approach over time – L ocal decision - making operating structure is difficult to replicate • 55 consecutive years of shareholder dividend increases – Only eight U.S. public companies can match this record – 31% increase in 2015 dividends paid (26% from special dividend) – Yield is attractive , 2.5% in late - August 2016
SECOND - QUARTER 2016 HIGHLIGHTS • EPS of 74 cents per share vs . $1.06 in 2Q15 – Operating earnings decreased $43 million, driven by a $56 million increase in after - tax catastrophe losses • Investment income rose 6% – Dividend income was up 17%, interest income was up 4% • Property casualty net written premiums grew 5 % – Higher average renewal pricing: personal lines up mid - single - digit percentage rate; commercial lines up low - single - digit rate • Combined ratio of 99.3%, up 6.9 points – 0.4 point improvement before natural catastrophe loss effects
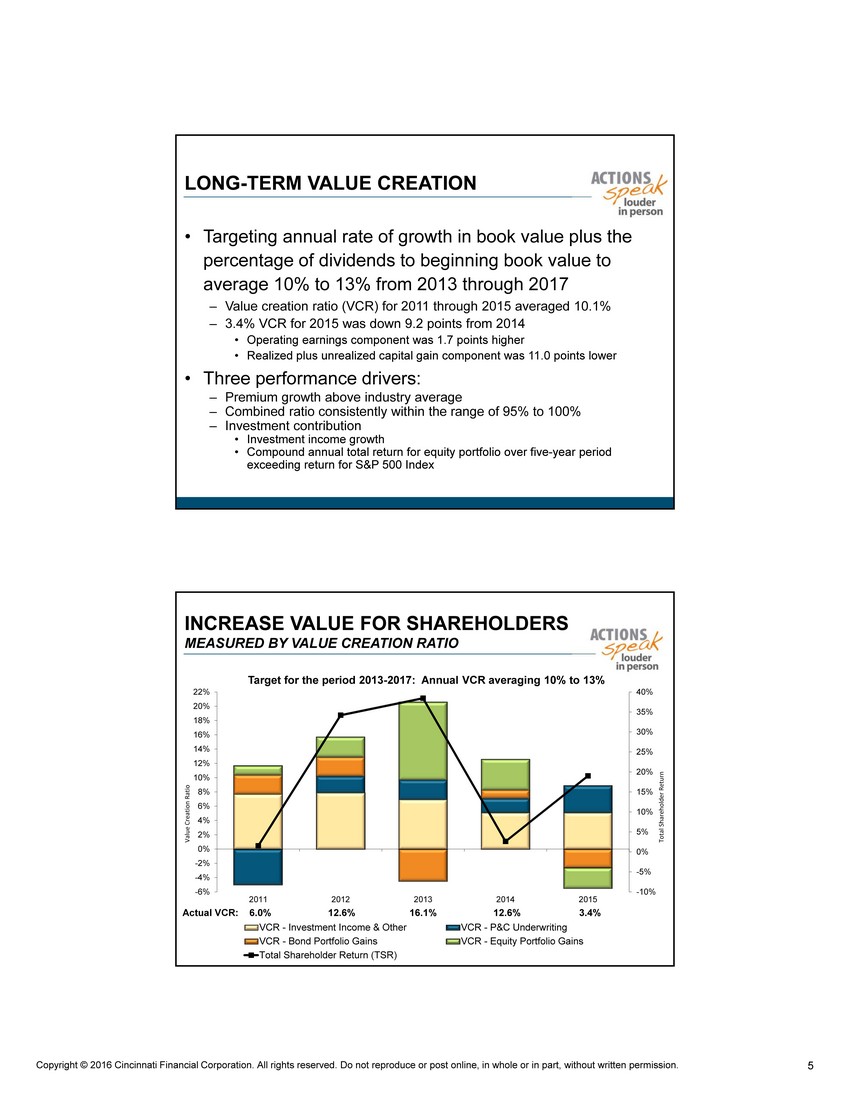
LONG - TERM VALUE CREATION • Targeting annual rate of growth in book value plus the percentage of dividends to beginning book value to average 10% to 13% from 2013 through 2017 – Value creation ratio (VCR) for 2011 through 2015 averaged 10.1% – 3.4% VCR for 2015 was down 9.2 points from 2014 • Operating earnings component was 1.7 points higher • Realized plus unrealized capital gain component was 11.0 points lower • Three performance drivers: – Premium growth above industry average – Combined ratio consistently within the range of 95% to 100% – Investment contribution • Investment income growth • Compound annual total return for equity portfolio over five - year period exceeding return for S&P 500 Index
Target for the period 2013 - 2017: Annual VCR averaging 10% to 13 % -10% -5% 0% 5% 10% 15% 20% 25% 30% 35% 40% -6% -4% -2% 0% 2% 4% 6% 8% 10% 12% 14% 16% 18% 20% 22% 2011 2012 2013 2014 2015 VCR - Investment Income & Other VCR - P&C Underwriting VCR - Bond Portfolio Gains VCR - Equity Portfolio Gains Total Shareholder Return (TSR) Actual VCR: 6.0% 12.6% 16.1% 12.6% 3.4% Value Creation Ratio Total Shareholder Return INCREASE VALUE FOR SHAREHOLDERS MEASURED BY VALUE CREATION RATIO
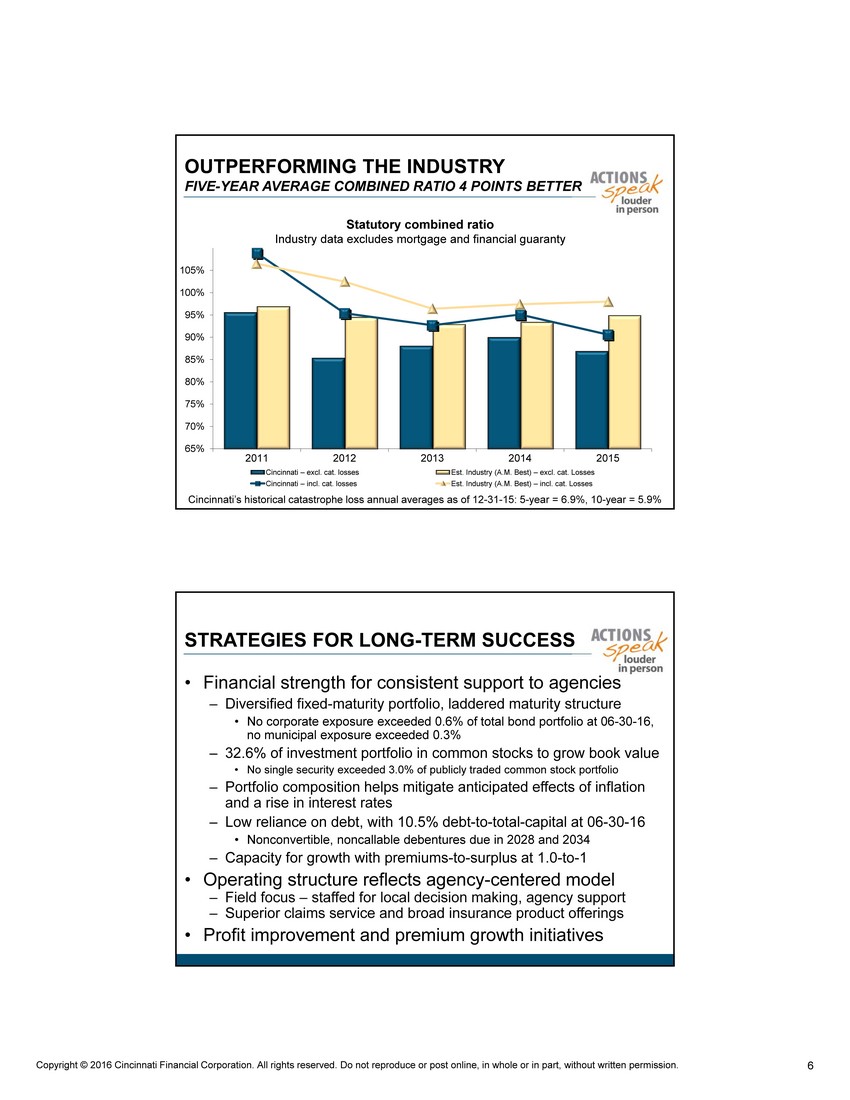
OUTPERFORMING THE INDUSTRY FIVE - YEAR AVERAGE COMBINED RATIO 4 POINTS BETTER 65% 70% 75% 80% 85% 90% 95% 100% 105% 2011 2012 2013 2014 2015 Cincinnati – excl. cat. losses Est. Industry (A.M. Best) – excl. cat. Losses Cincinnati – incl. cat. losses Est. Industry (A.M. Best) – incl. cat. Losses Statutory combined ratio Industry data excludes mortgage and financial guaranty Cincinnati’s historical catastrophe loss annual averages as of 12 - 31 - 15: 5 - year = 6.9%, 10 - year = 5.9%
STRATEGIES FOR LONG - TERM SUCCESS • Financial strength for consistent support to agencies – Diversified fixed - maturity portfolio, laddered maturity structure • No corporate exposure exceeded 0.6% of total bond portfolio at 06 - 30 - 16, no municipal exposure exceeded 0.3 % – 32.6% of investment portfolio in common stocks to grow book value • No single security exceeded 3.0% of publicly traded common stock portfolio – Portfolio composition helps mitigate anticipated effects of inflation and a rise in interest rates – Low reliance on debt, with 10.5% debt - to - total - capital at 06 - 30 - 16 • Nonconvertible, noncallable debentures due in 2028 and 2034 – Capacity for growth with premiums - to - surplus at 1.0 - to - 1 • Operating structure reflects agency - centered model – Field focus – staffed for local decision making , agency support – Superior claims service and broad insurance product offerings • Profit improvement and premium growth initiatives
MANAGE INSURANCE PROFITABILITY • Ongoing underwriting expertise enhancement – Predictive modeling tools and analytics to improve property casualty pricing precision and segmentation on an individual policy basis – Data management for better underwriting and more granular pricing decisions – S taff specialization and augmentation aimed at lowering loss ratios • I mproving efficiencies and ease of use with technology – Streamlining processing for agencies and the company – Helps optimize personalized service • Focus where needed, investments for the future – Addressing auto profitability with rate adequacy and risk selection initiatives – Strategic investments with modest short - term effects on expense ratios • Headquarters staff additions include high n et w orth and reinsurance assumed initiatives • 15% increase in field staff since the end of 2011, supporting healthy premium growth
DRIVE PREMIUM GROWTH • New agency appointments bring potential for growth over time – 114 appointed in 2015, $4.2B aggregate premiums from all carriers – 44 appointed in 1H16 marketing most or all lines, 64 for personal lines only • Expanding marketing and service capabilities – Enhanced marketing, products and services for high net worth clients of our agencies; contributed 20% of full - year 2015 personal lines new business – Expanded use of reinsurance assumed to further deploy capital, diversify risk – Ongoing development of target market programs and cross - selling – Expansion of Cincinnati Customer C are C enter for small commercial policies • 6 % growth in 1H16 P&C net written premiums – Commercial lines up 3 %, personal lines up 7%, E&S up 9% – Higher average renewal pricing: personal lines up mid - single digit percentage rate; commercial lines up low - single - digit rate – Term life insurance earned premiums up 9 %
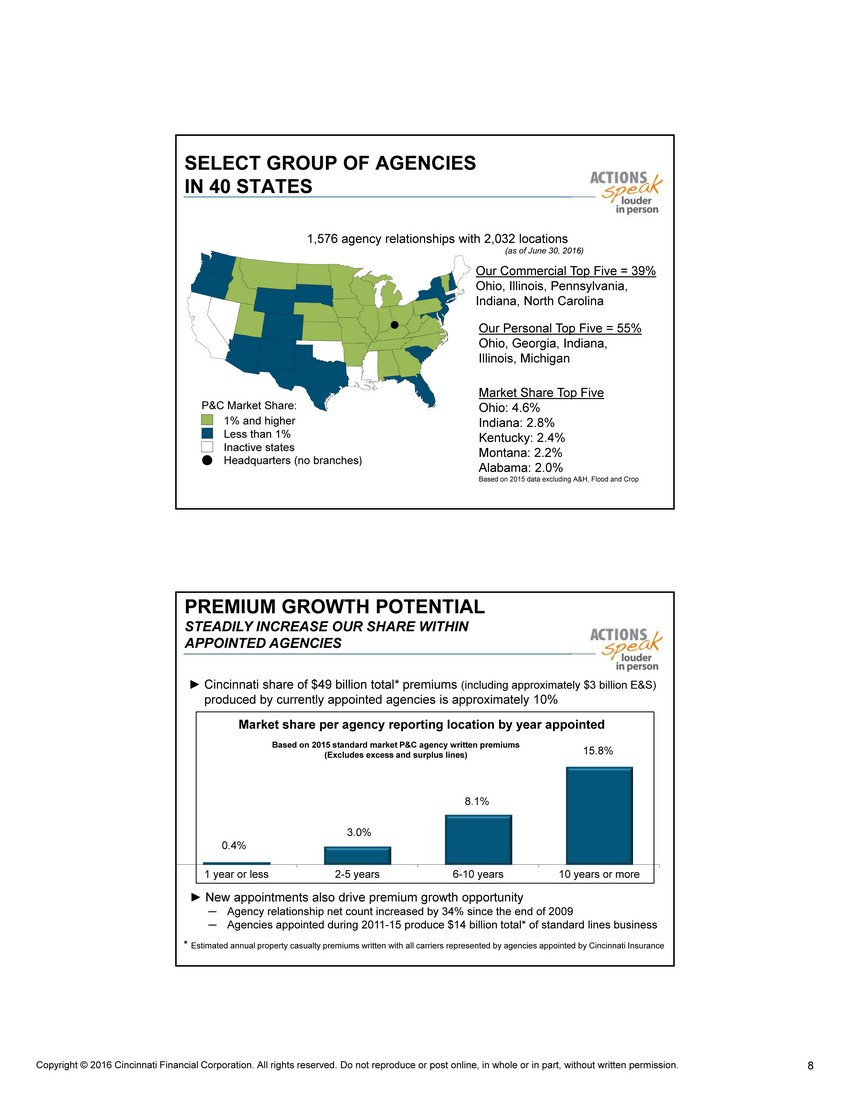
SELECT GROUP OF AGENCIES IN 40 STATES P&C Market Share: 1,576 agency relationships with 2,032 locations Our Commercial Top Five = 39% Ohio, Illinois, Pennsylvania, Indiana, North Carolina Our Personal Top Five = 55% Ohio, Georgia, Indiana, Illinois , Michigan 1% and higher Less than 1% Inactive states Headquarters (no branches ) (as of June 30, 2016) Market Share Top Five Ohio: 4.6% Indiana: 2.8% Kentucky : 2 .4% Montana: 2.2% Alabama : 2.0% Based on 2015 data excluding A&H, Flood and Crop
PREMIUM GROWTH POTENTIAL STEADILY INCREASE OUR SHARE WITHIN APPOINTED AGENCIES 0.4% 3.0% 8.1% 15.8% 1 year or less 2-5 years 6-10 years 10 years or more ► Cincinnati share of $49 billion total* premiums (including approximately $3 billion E&S) produced by currently appointed agencies is approximately 10% Market share per agency reporting location by year appointed Based on 2015 standard market P&C agency written premiums (Excludes excess and surplus lines) ► New appointments also drive premium growth opportunity ─ Agency relationship net count increased by 34 % since the end of 2009 ─ Agencies appointed during 2011 - 15 produce $14 billion total* of standard lines business * Estimated annual property casualty premiums written with all carriers represented by agencies appointed by Cincinnati Insurance
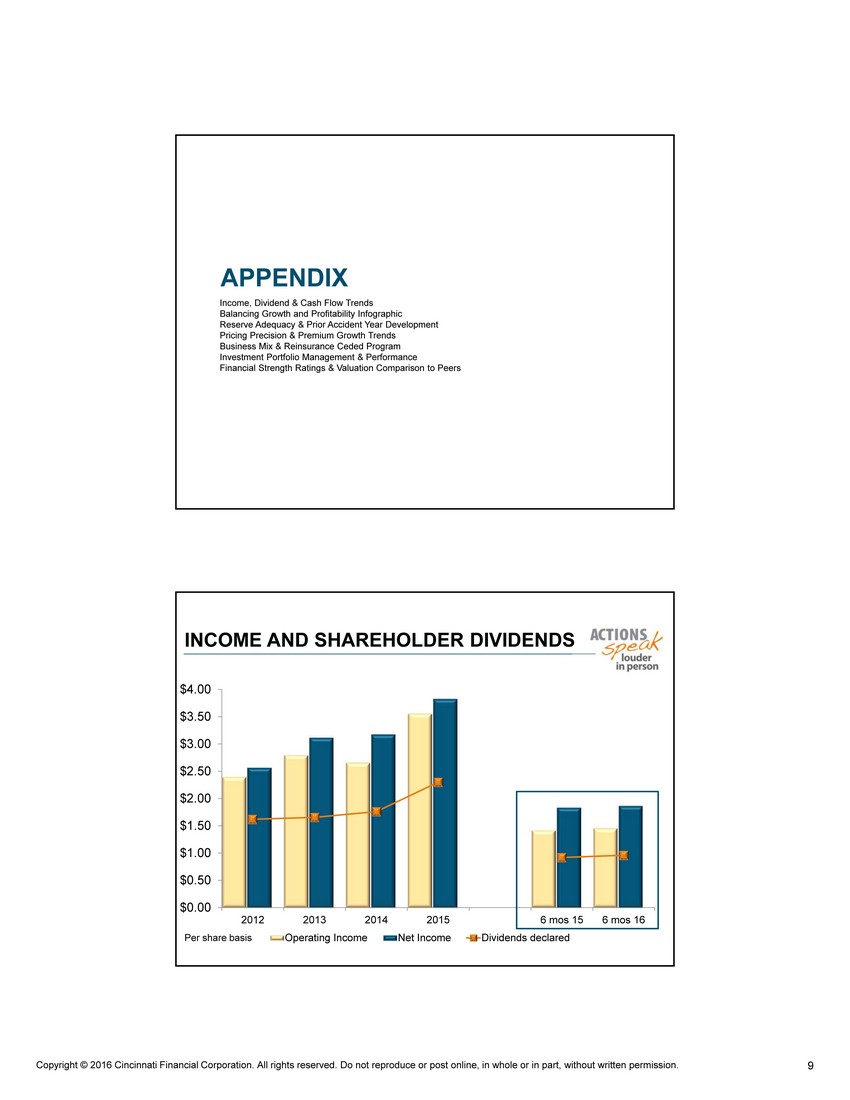
APPENDIX Income, Dividend & Cash Flow Trends Balancing Growth and Profitability Infographic Reserve Adequacy & Prior Accident Year Development Pricing Precision & Premium Growth Trends Business Mix & Reinsurance Ceded Program Investment Portfolio Management & Performance Financial Strength Ratings & Valuation Comparison to Peers
INCOME AND SHAREHOLDER DIVIDENDS $0.00 $0.50 $1.00 $1.50 $2.00 $2.50 $3.00 $3.50 $4.00 2012 2013 2014 2015 6 mos 15 6 mos 16 Operating Income Net Income Dividends declared Per share basis
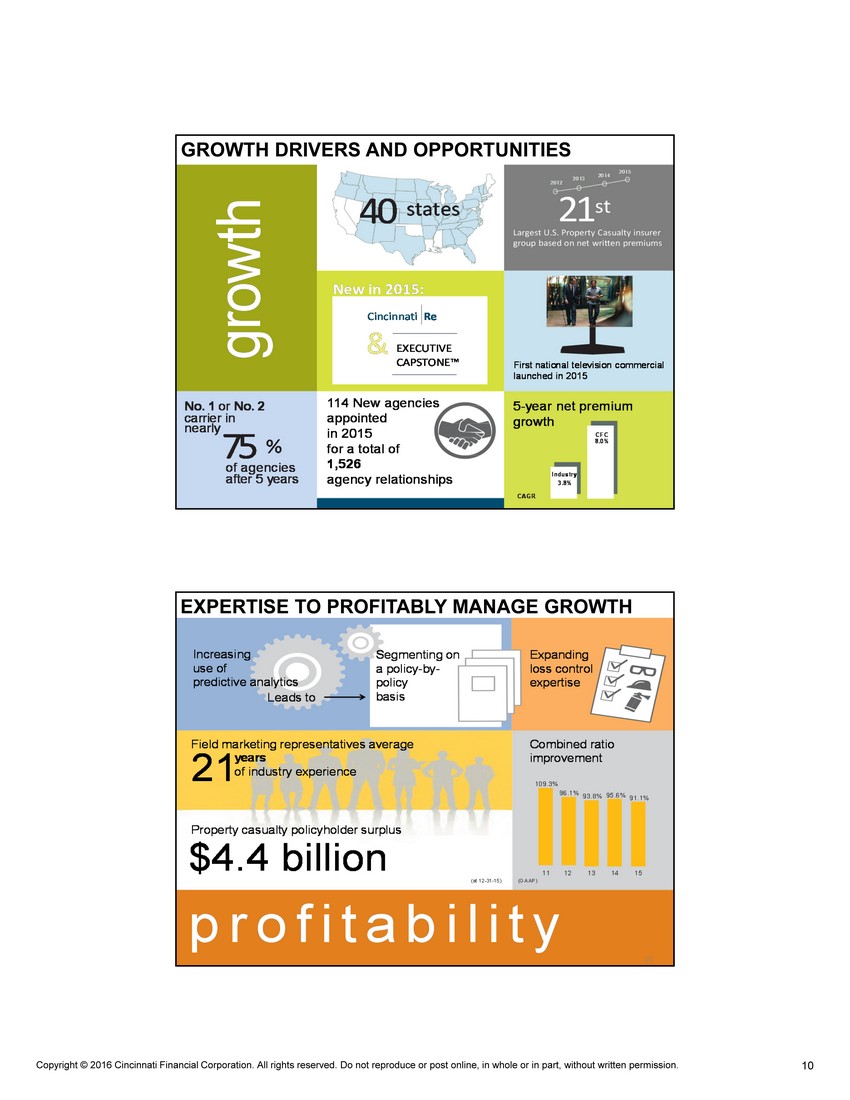
GROWTH DRIVERS AND OPPORTUNITIES 75 % g r o w th 2 1 st New in 2015: First national television commercial launched in 2015 Largest U.S. Property Casualty insurer group based on net written premiums 2012 2013 2014 2015 I ndust r y 3. 8 % CFC 8.0 % 40 states No. 1 or No. 2 carrier in nearly & Cincinnati Re EXECUTIVE CAPSTONE™ 5 - year net premium growth of agencies after 5 years 114 New agencies appointed in 2015 for a total of 1,526 agency relationships CAGR
EXPERTISE TO PROFITABLY MANAGE GROWTH 2016 Annual Shareholders Meeting 22 profitability ( a t 1 2 - 3 1 - 1 5 ) ( G A A P) Combined ratio improvement 109.3% 96.1% 93.8% 95.6% 91.1% $4.4 billion Property casualty policyholder surplus 21 Field marketing representatives average years of industry experience Increasing use of predictive analytics Segmenting on a policy - by - policy basis Expanding loss control expertise Leads to 22 11 12 13 14 15
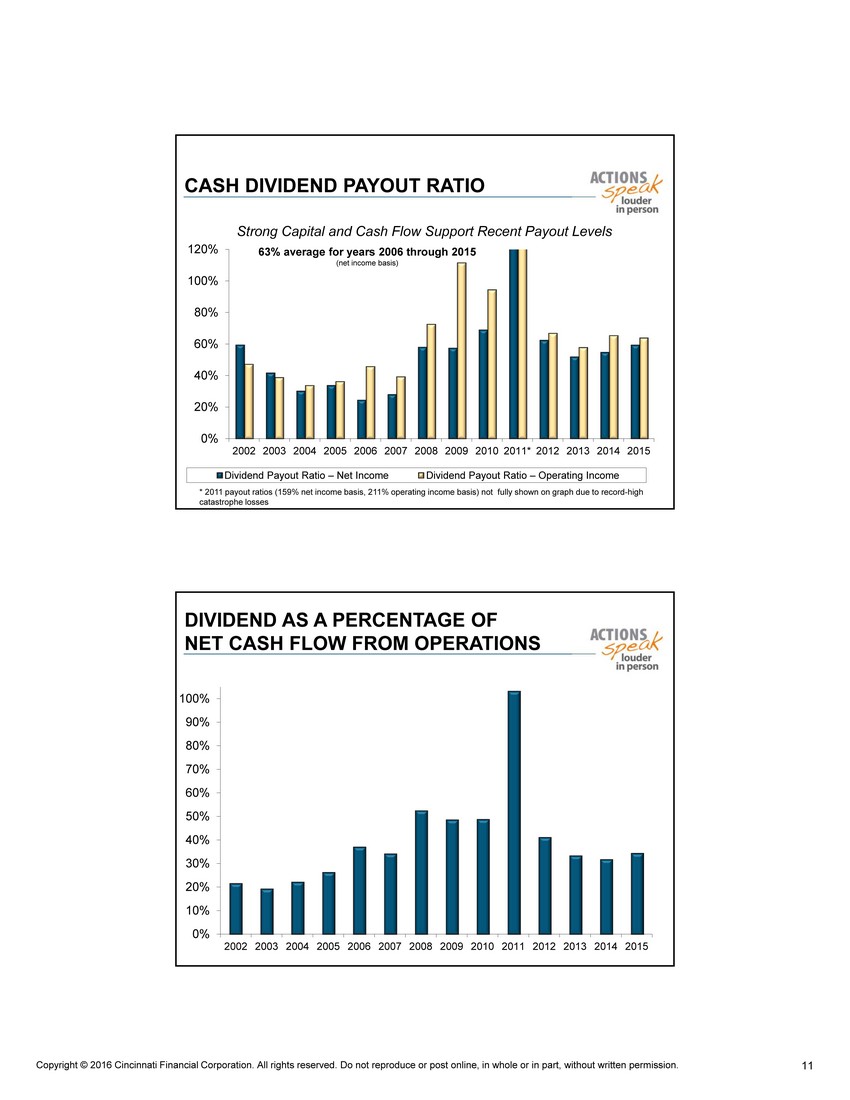
CASH DIVIDEND PAYOUT RATIO 0% 20% 40% 60% 80% 100% 120% 2002 2003 2004 2005 2006 2007 2008 2009 2010 2011* 2012 2013 2014 2015 Dividend Payout Ratio – Net Income Dividend Payout Ratio – Operating Income 63% average for years 2006 through 2015 (net income basis) Strong Capital and Cash Flow Support Recent Payout Levels * 2011 payout ratios (159% net income basis, 211% operating income basis) not fully shown on graph due to record - high catastrophe losses
DIVIDEND AS A PERCENTAGE OF NET CASH FLOW FROM OPERATIONS 0% 10% 20% 30% 40% 50% 60% 70% 80% 90% 100% 2002 2003 2004 2005 2006 2007 2008 2009 2010 2011 2012 2013 2014 2015
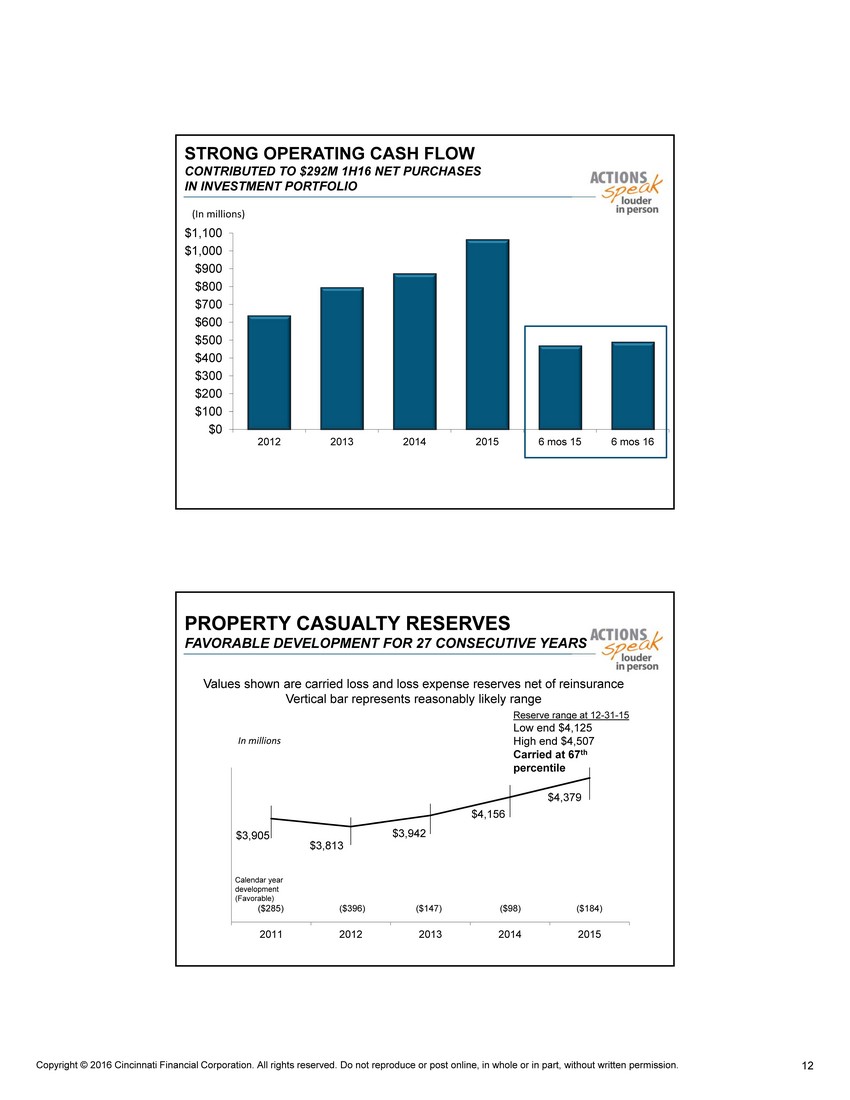
STRONG OPERATING CASH FLOW CONTRIBUTED TO $292M 1H16 NET P URCHASES IN INVESTMENT P ORTFOLIO $0 $100 $200 $300 $400 $500 $600 $700 $800 $900 $1,000 $1,100 2012 2013 2014 2015 6 mos 15 6 mos 16 (In millions)
$3,905 $3,813 $3,942 $4,156 $4,379 2011 2012 2013 2014 2015 Reserve range at 12 - 31 - 15 Low end $4,125 High end $4,507 Carried at 67 th percentile Values shown are carried loss and loss expense reserves net of reinsurance Vertical bar represents reasonably likely range Calendar year development (Favorable) ($ 285) ($ 396) ($ 147) ($ 98) ($ 184) In millions PROPERTY CASUALTY RESERVES FAVORABLE DEVELOPMENT FOR 27 CONSECUTIVE YEARS
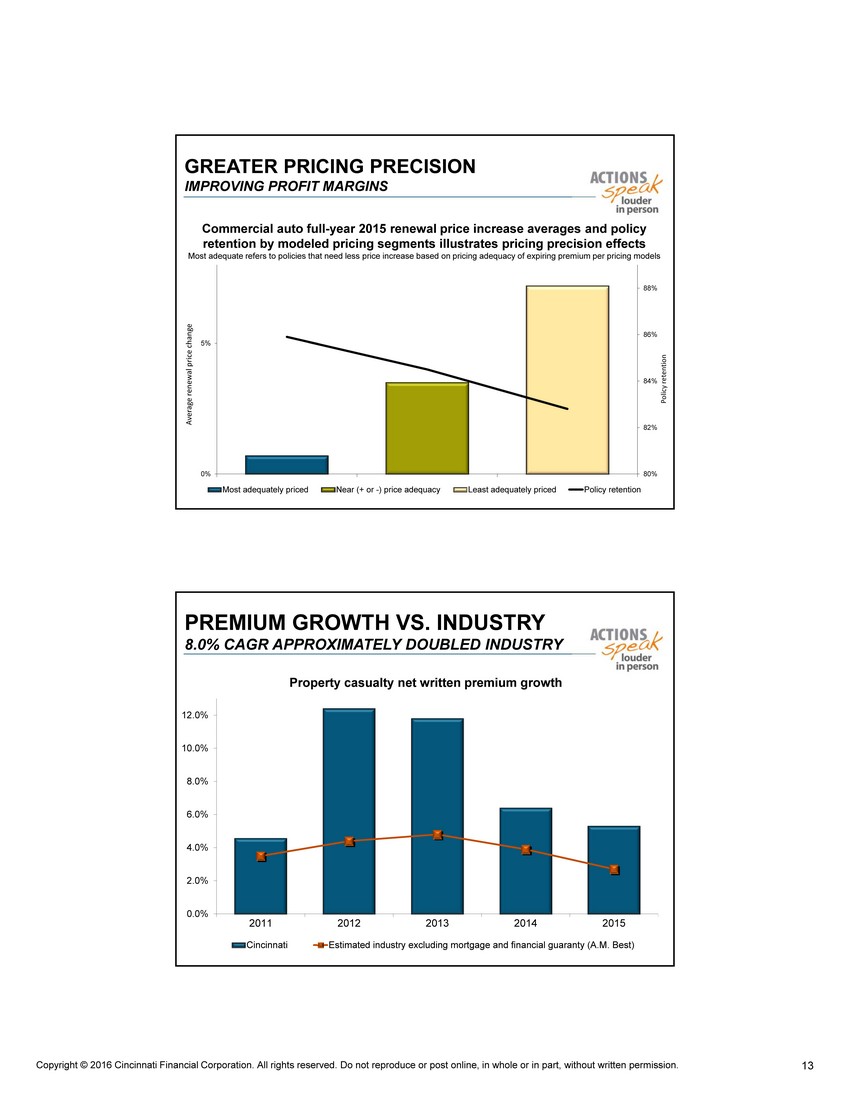
Commercial auto full - year 2015 renewal price increase averages and policy retention by modeled pricing segments illustrates pricing precision effects Most adequate refers to policies that need less price increase based on pricing adequacy of expiring premium per pricing mode ls 80% 82% 84% 86% 88% 0% 5% Most adequately priced Near (+ or -) price adequacy Least adequately priced Policy retention Average renewal price change Policy retention GREATER PRICING PRECISION IMPROVING PROFIT MARGINS
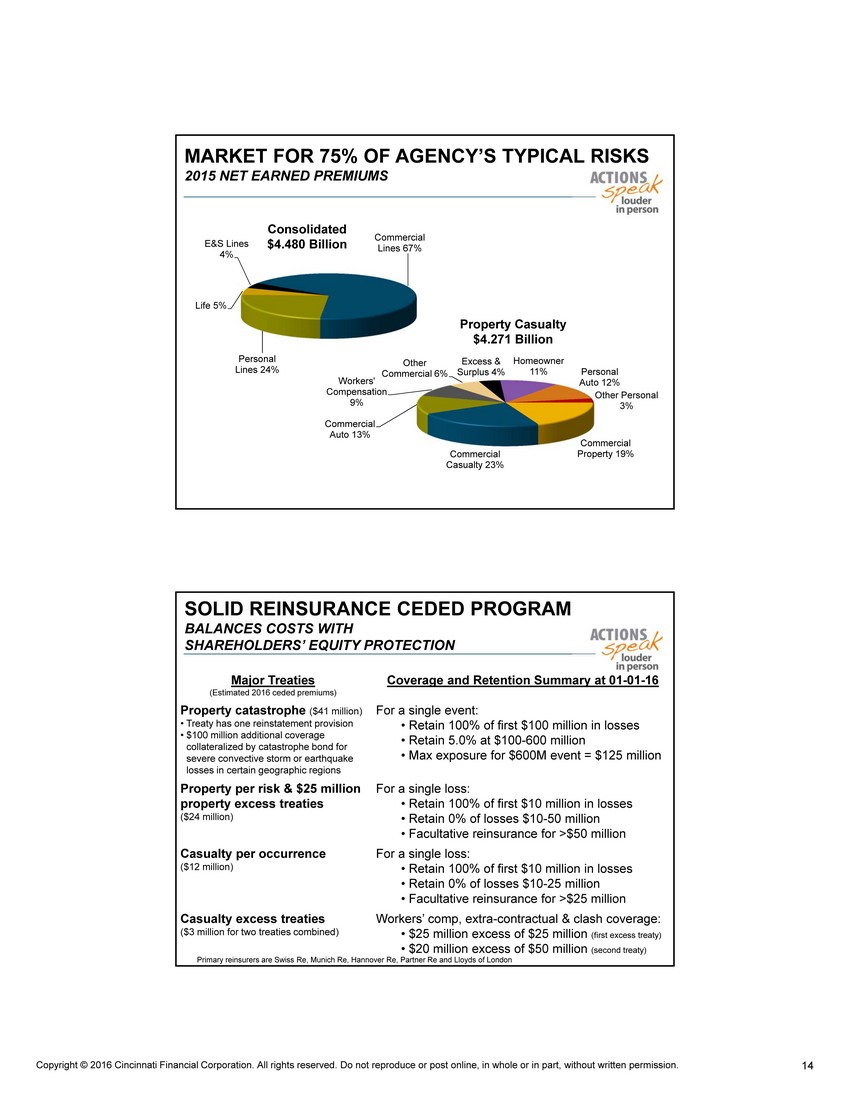
PREMIUM GROWTH VS. INDUSTRY 8.0% CAGR APPROXIMATELY DOUBLED INDUSTRY 0.0% 2.0% 4.0% 6.0% 8.0% 10.0% 12.0% 2011 2012 2013 2014 2015 Cincinnati Estimated industry excluding mortgage and financial guaranty (A.M. Best) Property casualty net written premium growth
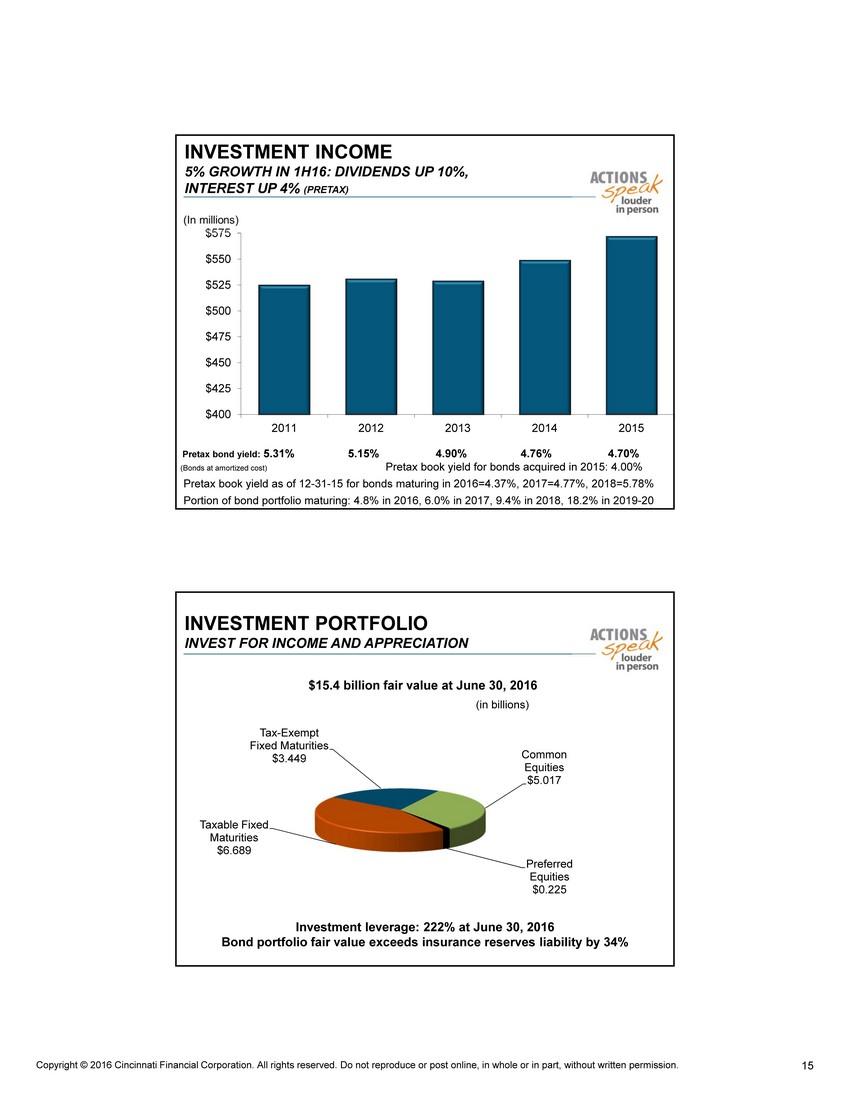
MARKET FOR 75% OF AGENCY’S TYPICAL RISKS 2015 NET EARNED PREMIUMS Commercial Property 19% Commercial Casualty 23% Commercial Auto 13% Workers' Compensation 9% Other Commercial 6% Excess & Surplus 4% Homeowner 11% Personal Auto 12% Other Personal 3% E&S Lines 4% Commercial Lines 67% Personal Lines 24% Life 5% Consolidated $4.480 Billion Property Casualty $4.271 Billion
SOLID REINSURANCE CEDED PROGRAM BALANCES COSTS WITH SHAREHOLDERS ’ EQUITY PROTECTION Major Treaties (Estimated 2016 ceded premiums) Coverage and Retention Summary at 01 - 01 - 16 Property catastrophe ($41 million) • Treaty has one reinstatement provision • $100 million additional coverage collateralized by catastrophe bond for severe convective storm or earthquake losses in certain geographic regions For a single event: • Retain 100% of first $100 million in losses • Retain 5.0% at $100 - 600 million • Max exposure for $600M event = $125 million Property per risk & $25 million property excess treaties ($24 million) For a single loss: • Retain 100% of first $10 million in losses • Retain 0% of losses $10 - 50 million • Facultative reinsurance for >$50 million Casualty per occurrence ($12 million) For a single loss: • Retain 100% of first $10 million in losses • Retain 0% of losses $10 - 25 million • Facultative reinsurance for >$25 million Casualty excess treaties ($3 million for two treaties combined) Workers’ comp, extra - contractual & clash coverage: • $25 million excess of $25 million (first excess treaty) • $20 million excess of $50 million (second treaty) Primary reinsurers are Swiss Re, Munich Re, Hannover Re, Partner Re and Lloyds of London
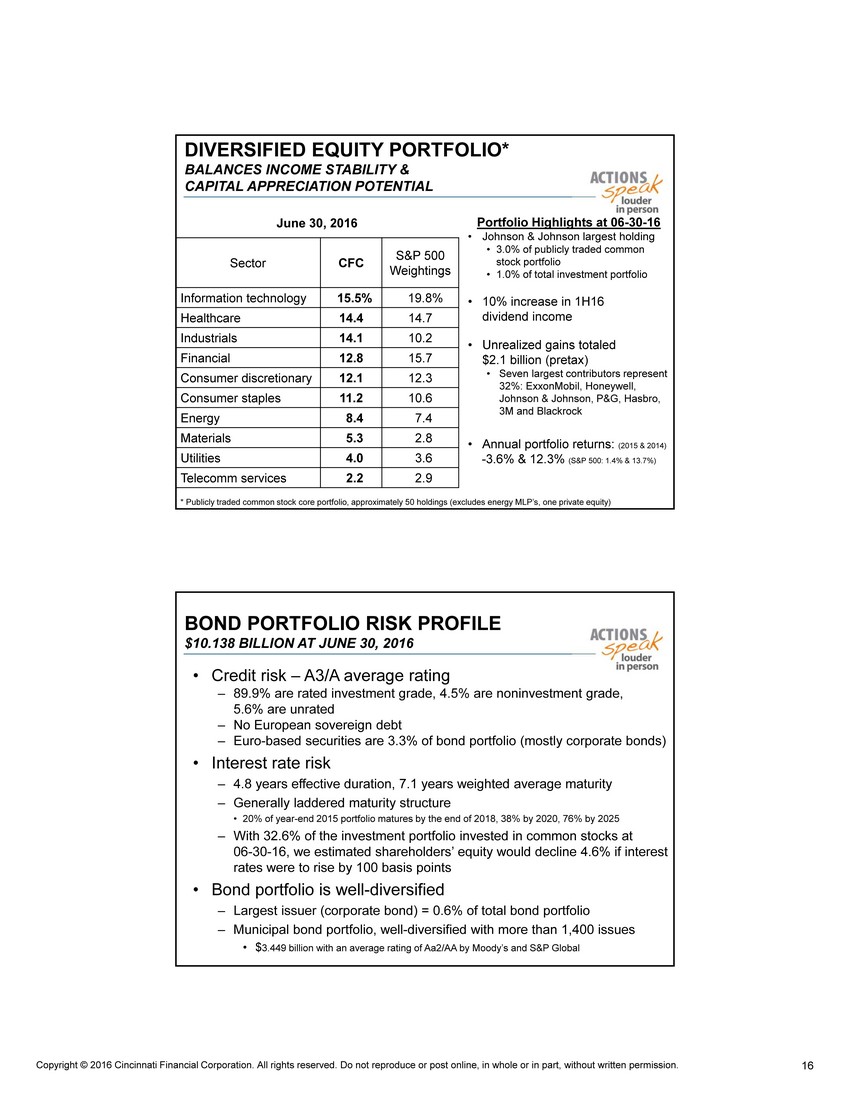
INVESTMENT INCOME 5 % GROWTH IN 1H16: DIVIDENDS UP 10%, INTEREST UP 4% (PRETAX) $400 $425 $450 $475 $500 $525 $550 $575 2011 2012 2013 2014 2015 Pretax bond yield: 5.31% 5.15% 4.90% 4.76% 4.70% (Bonds at amortized cost) Pretax book yield for bonds acquired in 2015: 4.00% Pretax book yield as of 12 - 31 - 15 for bonds maturing in 2016=4.37%, 2017=4.77%, 2018=5.78% Portion of bond portfolio maturing: 4.8% in 2016, 6.0% in 2017, 9.4% in 2018, 18.2% in 2019 - 20
INVESTMENT PORTFOLIO INVEST FOR INCOME AND APPRECIATION Taxable Fixed Maturities $6.689 Tax - Exempt Fixed Maturities $3.449 Common Equities $5.017 Preferred Equities $0.225 $ 15.4 billion fair value at June 30, 2016 Investment leverage: 222% at June 30, 2016 Bond portfolio fair value exceeds insurance reserves liability by 34% (in billions)
DIVERSIFIED EQUITY PORTFOLIO * BALANCES INCOME STABILITY & CAPITAL APPRECIATION POTENTIAL June 30, 2016 Sector CFC S&P 500 Weightings Information technology 15.5% 19.8% Healthcare 14.4 14.7 Industrials 14.1 10.2 Financial 12.8 15.7 Consumer discretionary 12.1 12.3 Consumer staples 11.2 10.6 Energy 8.4 7.4 Materials 5.3 2.8 Utilities 4.0 3.6 Telecomm services 2.2 2.9 * Publicly traded common stock core portfolio, approximately 50 holdings (excludes energy MLP’s, one private equity) Portfolio Highlights at 06 - 30 - 16 • Johnson & Johnson largest holding • 3.0% of publicly traded common stock portfolio • 1.0% of total investment portfolio • 10% increase in 1H16 dividend income • Unrealized gains totaled $2.1 billion (pretax) • Seven largest contributors represent 32%: ExxonMobil , Honeywell, Johnson & Johnson, P&G, Hasbro, 3M and Blackrock • Annual portfolio returns: (2015 & 2014) - 3.6% & 12.3% ( S&P 500: 1.4% & 13.7%)
BOND PORTFOLIO RISK PROFILE $10.138 BILLION AT JUNE 30, 2016 • Credit risk – A3/A average rating – 89.9% are rated investment grade, 4.5% are noninvestment grade, 5.6% are unrated – No European sovereign debt – Euro - based securities are 3.3% of bond portfolio (mostly corporate bonds) • Interest rate risk – 4.8 years effective duration, 7.1 years weighted average maturity – Generally laddered maturity structure • 20% of year - end 2015 portfolio matures by the end of 2018, 38% by 2020, 76% by 2025 – With 32.6% of the investment portfolio invested in common stocks at 06 - 30 - 16, we estimated shareholders’ equity would decline 4.6% if interest rates were to rise by 100 basis points • Bond portfolio is well - diversified – Largest issuer (corporate bond) = 0.6% of total bond portfolio – Municipal bond portfolio, well - diversified with more than 1,400 issues • $ 3.449 billion with an average rating of Aa2/AA by Moody’s and S&P Global
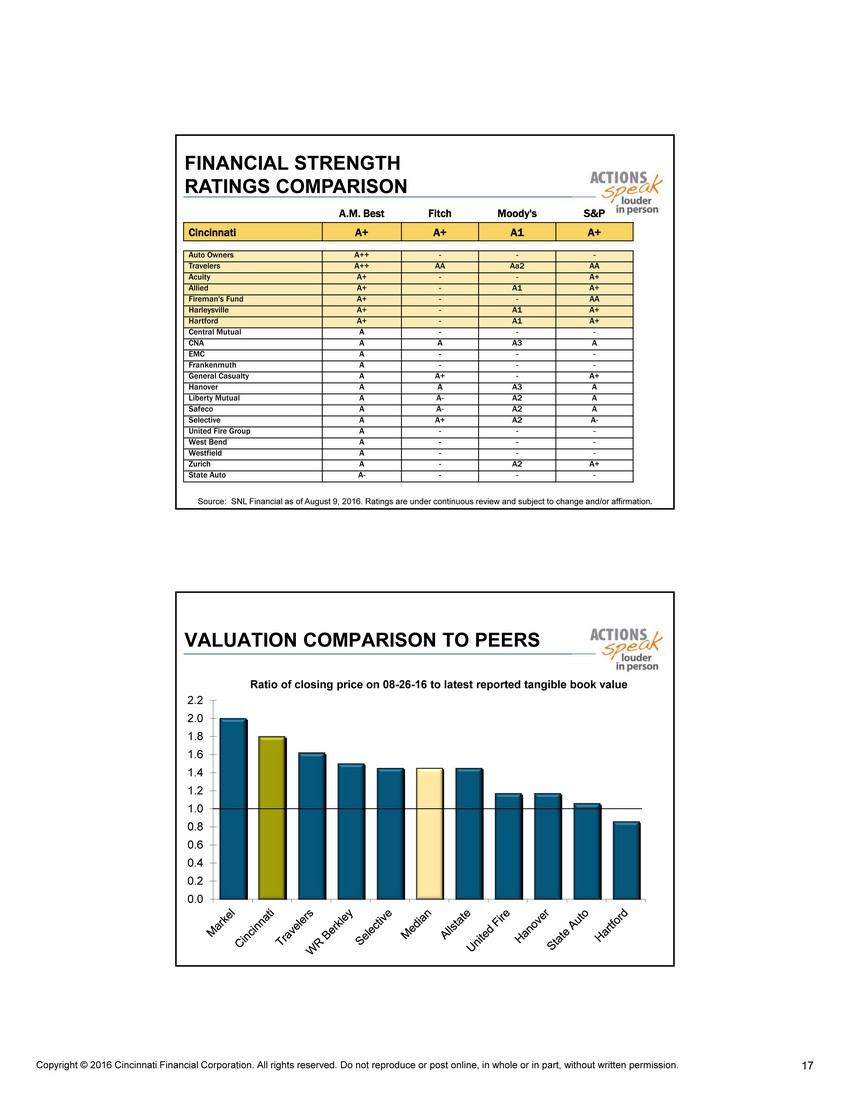
Source: SNL Financial as of August 9, 2016. Ratings are under continuous review and subject to change and/or affirmation . A.M. Best Fitch Moody's S&P Cincinnati A+ A+ A1 A+ Auto Owners A++ - - - Travelers A++ AA Aa2 AA Acuity A+ - - A+ Allied A+ - A1 A+ Fireman's Fund A+ - - AA Harleysville A+ - A1 A+ Hartford A+ - A1 A+ Central Mutual A - - - CNA A A A3 A EMC A - - - Frankenmuth A - - - General Casualty A A+ - A+ Hanover A A A3 A Liberty Mutual A A - A2 A Safeco A A - A2 A Selective A A+ A2 A - United Fire Group A - - - West Bend A - - - Westfield A - - - Zurich A - A2 A+ State Auto A - - - - FINANCIAL STRENGTH RATINGS COMPARISON
VALUATION COMPARISON TO PEERS 0.0 0.2 0.4 0.6 0.8 1.0 1.2 1.4 1.6 1.8 2.0 2.2 Ratio of closing price on 08 - 26 - 16 to latest reported tangible book value