Attached files
| file | filename |
|---|---|
| 8-K - 8-K - AECOM | a16-17987_18k.htm |
Exhibit 99.1
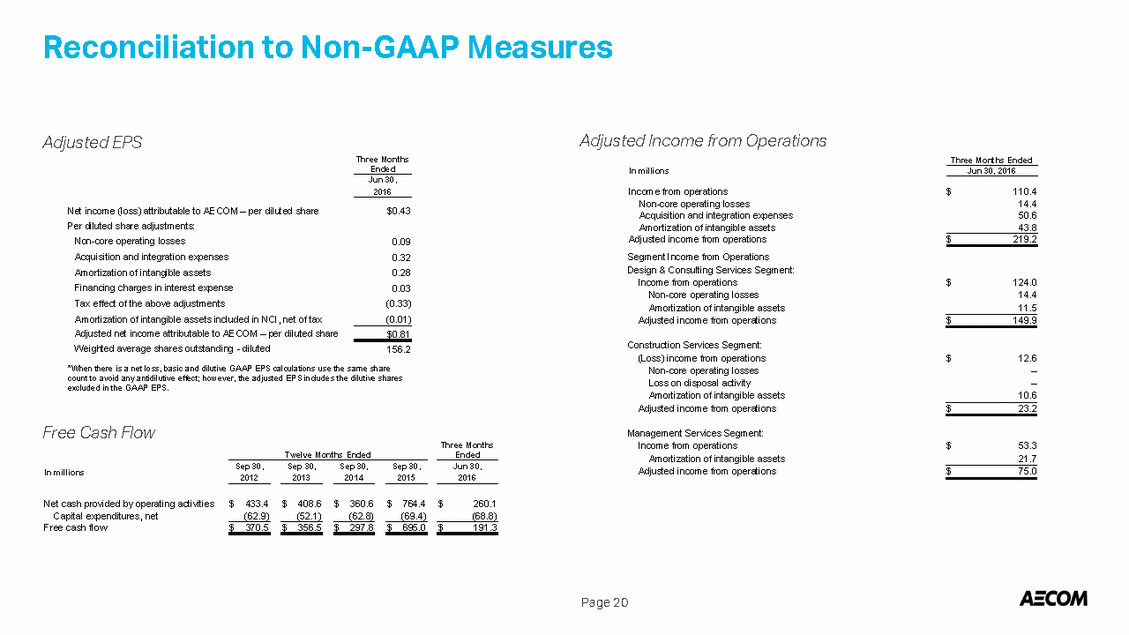
AECOM September 2016 DALLAS / FORT WORTH INTERNATIONAL AIRPORT United States One of the most frequently visited super-hub airports in the world, serving more than 64 million passengers annually.
Disclosures Safe Harbor Except for historical information contained herein, this presentation contains “forward-looking statements.” All statements other than statements of historical fact are “forward-looking statements” for purposes of federal and state securities laws, including any projections of earnings, revenue, backlog, cash flows, synergy costs or other financial items; any statements of the plans, strategies and objectives for future operations; any statements regarding future economic conditions or performance; any statements of belief; and any statements of assumptions underlying any of the foregoing. Forward-looking statements may include the words “may,” “will,” “estimate,” “intend,” “continue,” “believe,” “expect” or “anticipate” and other similar words. Although we believe that the expectations reflected in any of our forward-looking statements are reasonable, actual results could differ materially from those projected or assumed in any of our forward-looking statements. Our future financial condition and results of operations, as well as any forward-looking statements, are subject to change and to inherent risks and uncertainties, such as those disclosed in this presentation. Important factors that could cause our actual results, performance and achievements, or industry results to differ materially from estimates or projections contained in forward-looking statements include, among others, the following: • • • • • • • • • • • • • • • demand for our services is cyclical; uncertainties related to government contract appropriations; governmental agencies may modify, curtail or terminate our contracts; government contracts are subject to audits and adjustments of contractual terms; losses under fixed-price contracts; limited control over operations run through our joint venture entities; misconduct by our employees or consultants or our failure to comply with laws or regulations applicable to our business; our leveraged position and ability to service our debt; exposure to legal, political and economic risks in different countries as well as currency exchange rate fluctuations; the failure to retain and recruit key technical and management personnel; our insurance policies may not provide adequate coverage; unexpected adjustments and cancellations related to our backlog; dependence on third party contractors who fail to satisfy their obligations; systems and information technology interruption; and changing client preferences/demands, fiscal positions and payment patterns. – Additional factors that could cause actual results to differ materially from our forward-looking statements are set forth in our Quarterly Report on Form 10-Q for the period ended June 30, 2016, and our other filings with the Securities and Exchange Commission. We do not intend, and undertake no obligation, to update any forward-looking statement. Non-GAAP Measures This presentation contains financial information calculated other than in accordance with U.S. generally accepted accounting principles (“GAAP”). In particular, the company believes that non-GAAP financial measures such as adjusted EPS, adjusted operating income, and free cash flow provide a meaningful perspective on its business results as the company utilizes this information to evaluate and manage the business. We are also providing additional non-GAAP financial measures to reflect the impact of recent acquisitions, including acquisition and integration expenses. Our non-GAAP disclosure has limitations as an analytical tool, should not be viewed as a substitute for financial information determined in accordance with GAAP, and should not be considered in isolation or as a substitute for analysis of our results as reported under GAAP, nor is it necessarily comparable to non-GAAP performance measures that may be presented by other companies. A reconciliation of these non-GAAP measures to the most directly comparable GAAP financial measures is found in the attached appendix and in our most recent earnings release on the Investors section of our Web site at: http://investors.aecom.com. Page 1
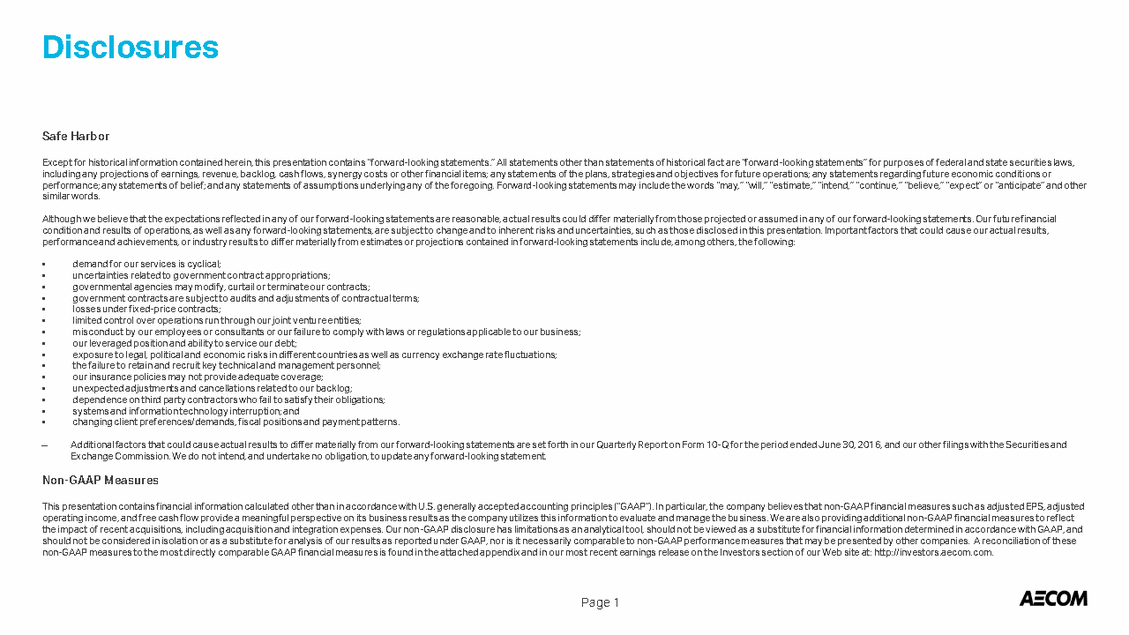
Design. Build. Finance. Operate. 7 continents $18b revenue (TTM) • Leading fully integrated infrastructure services firm • Consistently ranked #1 in key categories, including U.S. and global design 92k employees $38b backlog 150+ countries $5b market cap • Executing the world’s most complex and iconic projects #156 Fortune 500 NYSE:ACM ticker Project images (from top left): Rio Olympic & Paralympic Games, Brazil; Istanbul New Airport, Turkey; Olmsted Dam, PA, U.S.; Unmanned Aerial Systems Operation Center Support; Halley VI, Antarctica; Barclays Center, NY, U.S.; Taizhou Bridge, China; Spaceport America, NM, U.S.
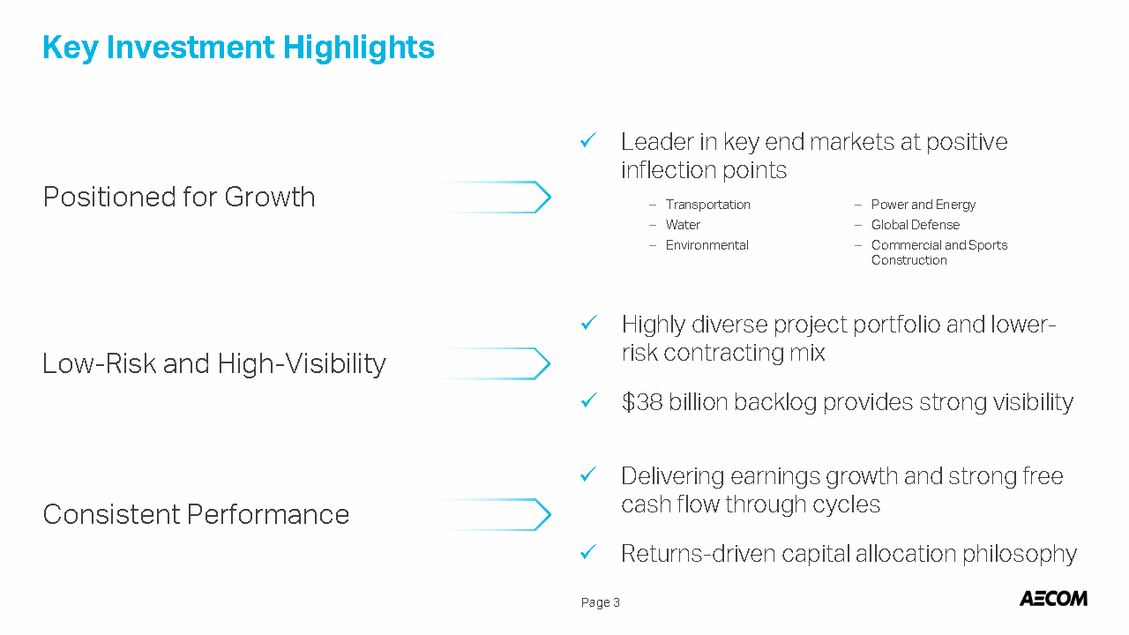
Key Investment Highlights Leader in key end markets at positive inflection points Positioned for Growth – – – Transportation Water Environmental – – – Power and Energy Global Defense Commercial and Sports Construction Highly diverse project portfolio and lower-risk contracting mix Low-Risk and High-Visibility $38 billion backlog provides strong visibility Delivering earnings growth and strong free cash flow through cycles Consistent Performance Returns-driven capital allocation philosophy Page 3
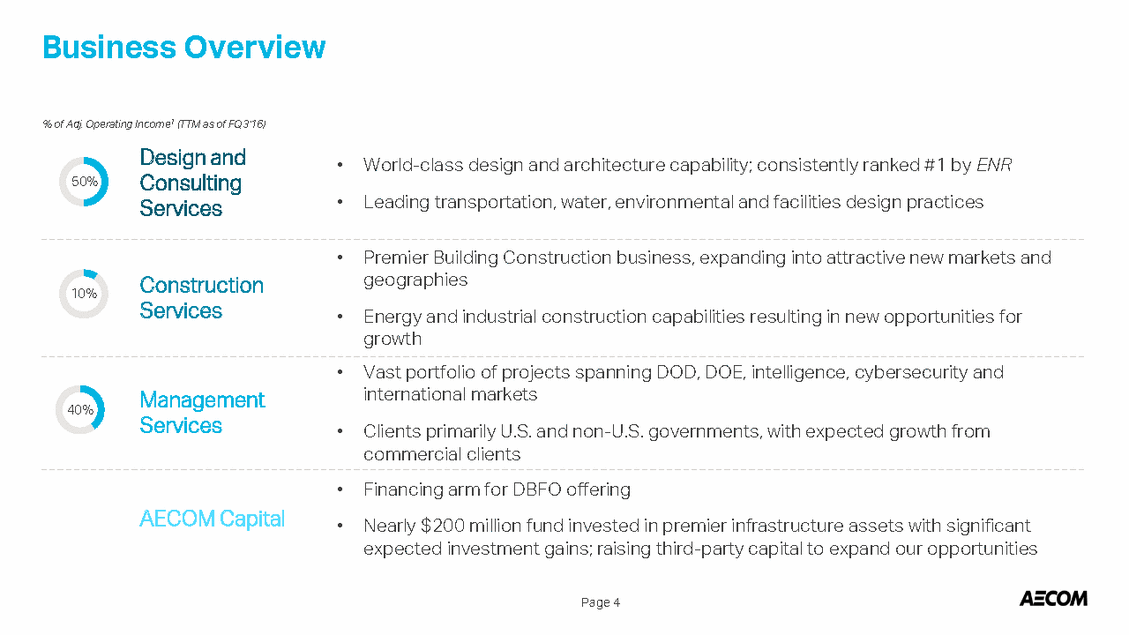
Business Overview % of Adj. Operating Income1 (TTM as of FQ3’16) Design and Consulting Services • • World-class design and architecture capability; consistently ranked #1 by ENR Leading transportation, water, environmental and facilities design practices 50% • Premier Building Construction business, expanding into attractive new markets and geographies Energy and industrial construction capabilities resulting in new opportunities for growth Construction Services 10% • • Vast portfolio of projects spanning DOD, DOE, intelligence, cybersecurity and international markets Clients primarily U.S. and non-U.S. governments, with expected growth from commercial clients Management Services 40% • • • Financing arm for DBFO offering Nearly $200 million fund invested in premier infrastructure assets with significant expected investment gains; raising third-party capital to expand our opportunities AECOM Capital Page 4
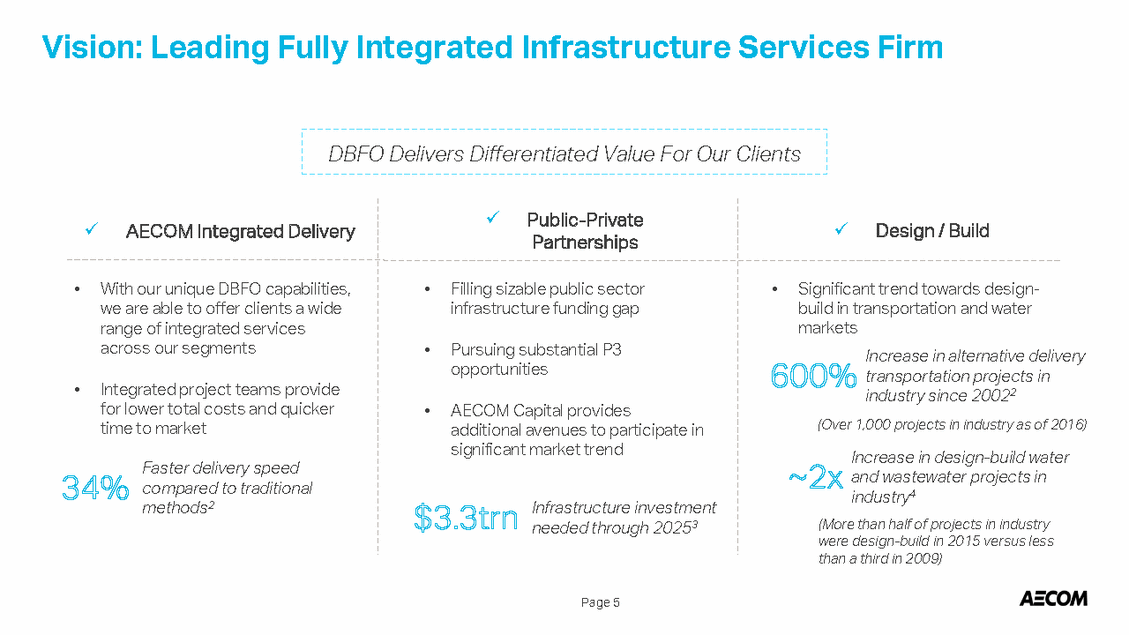
Vision: Leading Fully Integrated Infrastructure Services Firm ery transportation projects in 2016) r and wastewater projects in were design-build in 2015 versus less than a third in 2009) Page 5 AECOM Integrated Delivery Public-Private Partnerships Design / Build •With our unique DBFO capabilities, we are able to offer clients a wide range of integrated services across our segments •Integrated project teams provide for lower total costs and quicker time to market Faster delivery speed compared to traditional methods2 •Filling sizable public sector infrastructure funding gap •Pursuing substantial P3 opportunities •AECOM Capital provides additional avenues to participate in significant market trend Infrastructure investment needed through 20253 •Significant trend towards design-build in transportation and water markets Increase in alternative deliv industry since 20022 (Over 1,000 projects in industry as of Increase in design-build wate industry4 (More than half of projects in industry DBFO Delivers Differentiated Value For Our Clients
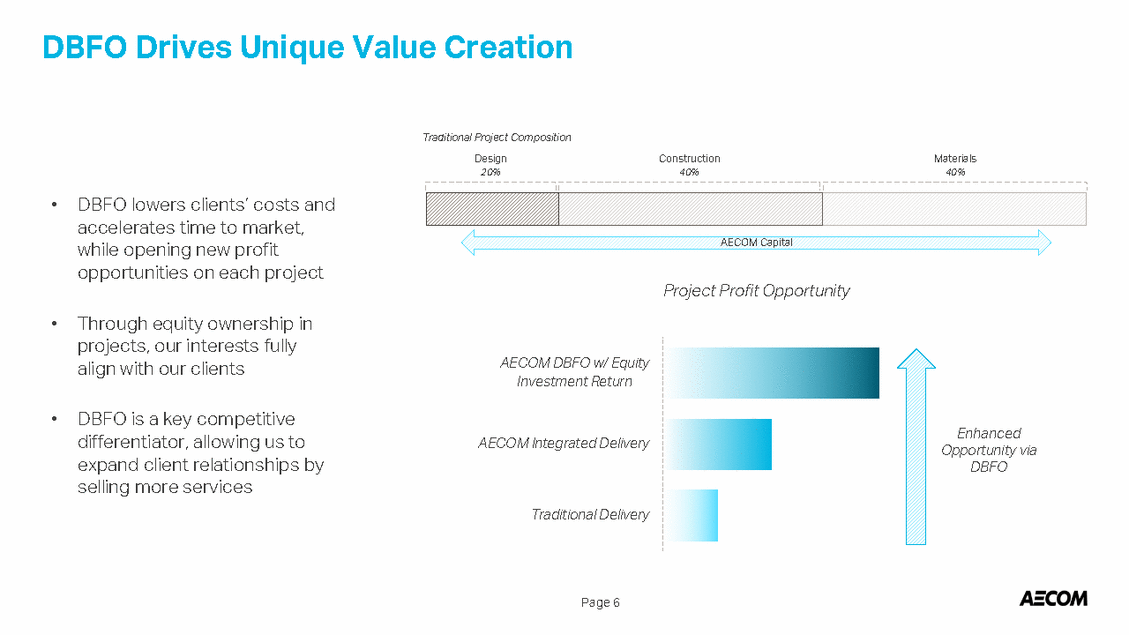
DBFO Drives Unique Value Creation Traditional Project Composition Design 20% Construction 40% Materials 40% • DBFO lowers clients’ costs and accelerates time to market, while opening new profit opportunities on each project AECOM Capital Project Profit Opportunity • Through equity ownership in projects, our interests fully align with our clients AECOM DBFO w/ Equity Investment Return • DBFO is a key competitive differentiator, allowing us to expand client relationships by selling more services Enhanced Opportunity via DBFO AECOM Integrated Delivery Traditional Delivery Page 6
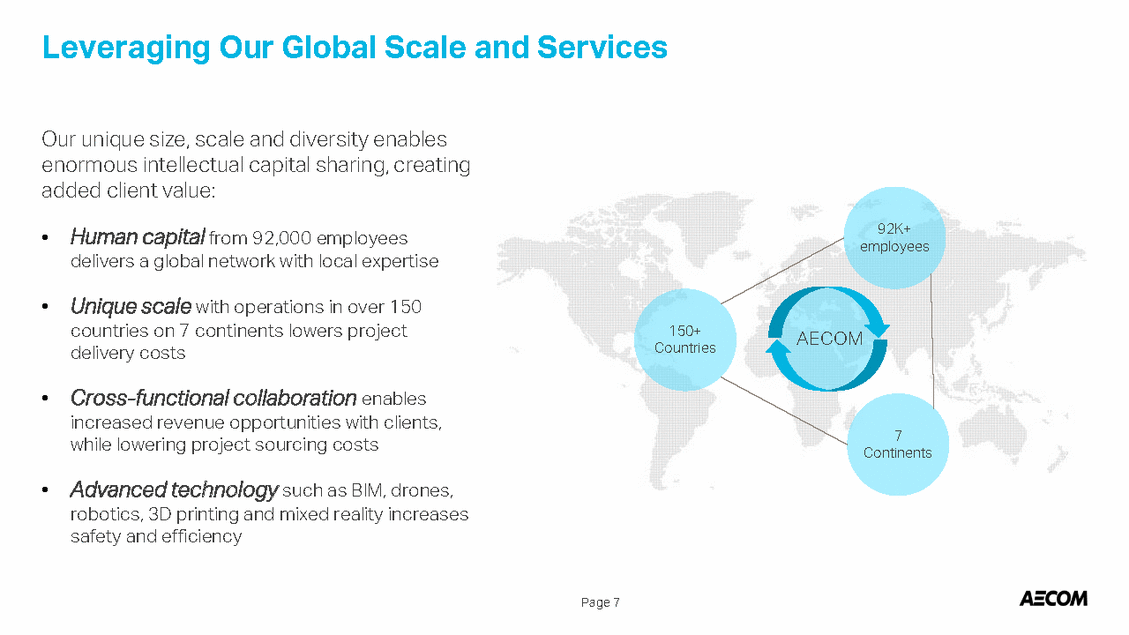
Leveraging Our Global Scale and Services Our unique size, scale and diversity enables enormous intellectual capital sharing, creating added client value: 92K+ employees • Human capital from 92,000 employees delivers a global network with local expertise • Unique scale with operations in over 150 countries on 7 continents lowers project delivery costs 150+ Countries AECOM • Cross-functional collaboration enables increased revenue opportunities with clients, while lowering project sourcing costs 7 Continents • Advanced technology such as BIM, drones, robotics, 3D printing and mixed reality increases safety and efficiency Page 7
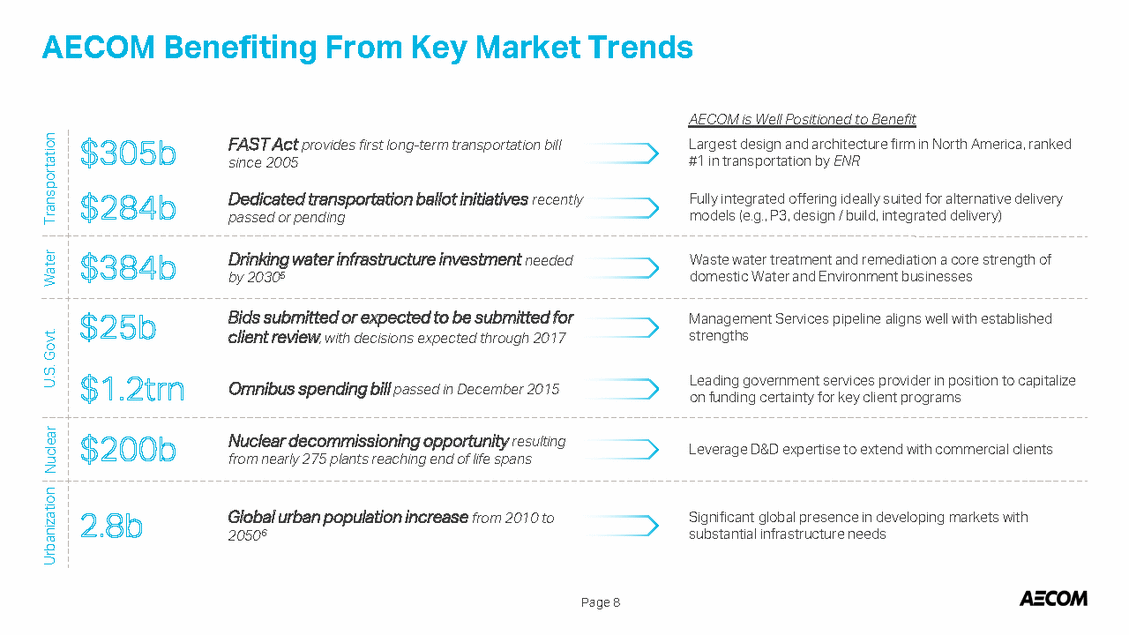
AECOM Benefiting From Key Market Trends AECOM is Well Positioned to Benefit on funding certainty for key client programs from nearly 275 plants reaching end of life spans Page 8 Transportation FAST Act provides first long-term transportation billLargest design and architecture firm in North America, ranked since 2005 #1 in transportation by ENR Dedicated transportation ballot initiatives recently Fully integrated offering ideally suited for alternative delivery passed or pending models (e.g., P3, design / build, integrated delivery) Water Drinking water infrastructure investment needed Waste water treatment and remediation a core strength of by 20305 domestic Water and Environment businesses U.S. Govt. Bids submitted or expected to be submitted for Management Services pipeline aligns well with established client review, with decisions expected through 2017 strengths Omnibus spending bill passed in December 2015 Leading government services provider in position to capitalize Nuclear Nuclear decommissioning opportunity resulting Leverage D&D expertise to extend with commercial clients Urbanization Global urban population increase from 2010 to Significant global presence in developing markets with 20506 substantial infrastructure needs
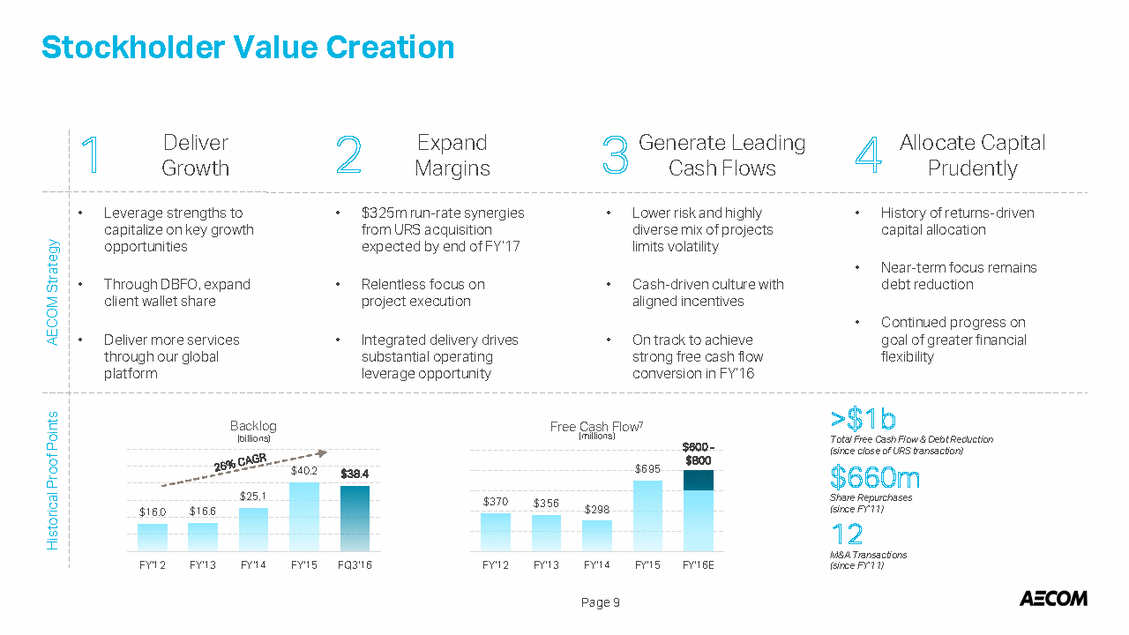
Stockholder Value Creation (millions) (billions) Total Free Cash Flow & Debt Reduction $695 $40.2 $38.4 $370 $356 $298 (since FY’11) $16.0 $16.6 Page 9 DeliverExpandGenerate LeadingAllocate Capital GrowthMarginsCash FlowsPrudently AECOM Strategy •Leverage strengths to •$325m run-rate synergies •Lower risk and highly•History of returns-driven capitalize on key growth from URS acquisition diverse mix of projects capital allocation opportunities expected by end of FY’17limits volatility •Near-term focus remains •Through DBFO, expand•Relentless focus on •Cash-driven culture with debt reduction client wallet shareproject execution aligned incentives •Continued progress on •Deliver more services •Integrated delivery drives•On track to achievegoal of greater financial through our global substantial operating strong free cash flow flexibility platform leverage opportunity conversion in FY’16 Historical Proof Points Backlog Free Cash Flow7 $600 - (since close of URS transaction) $800 $25.1 Share Repurchases M&A Transactions FY'12FY'13FY'14FY'15FQ3'16FY'12FY'13FY'14FY'15FY'16E(since FY’11)
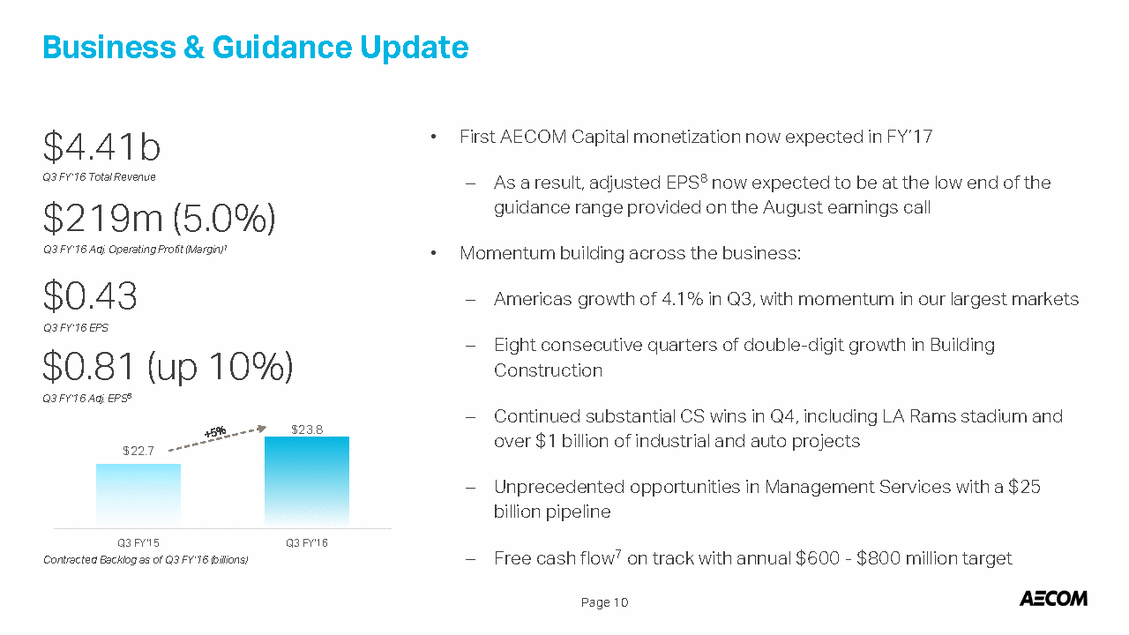
Business & Guidance Update • First AECOM Capital monetization now expected in FY’17 $4.41b Q3 FY’16 Total Revenue – As a result, adjusted EPS8 now expected to be at the low end of the guidance range provided on the August earnings call $219m (5.0%) Q3 FY’16 Adj. Operating Profit (Margin)1 • Momentum building across the business: $0.43 Q3 FY’16 EPS – Americas growth of 4.1% in Q3, with momentum in our largest markets – Eight consecutive quarters of double-digit growth in Building Construction $0.81 (up 10%) Q3 FY’16 Adj. EPS8 – Continued substantial CS wins in Q4, including LA Rams stadium and over $1 billion of industrial and auto projects $23.8 $22.7 – Unprecedented opportunities in Management Services with a $25 billion pipeline Q3 FY'15 Contracted Backlog as of Q3 FY’16 (billions) Q3 FY'16 Free cash flow7 on track with annual $600 - $800 million target – Page 10
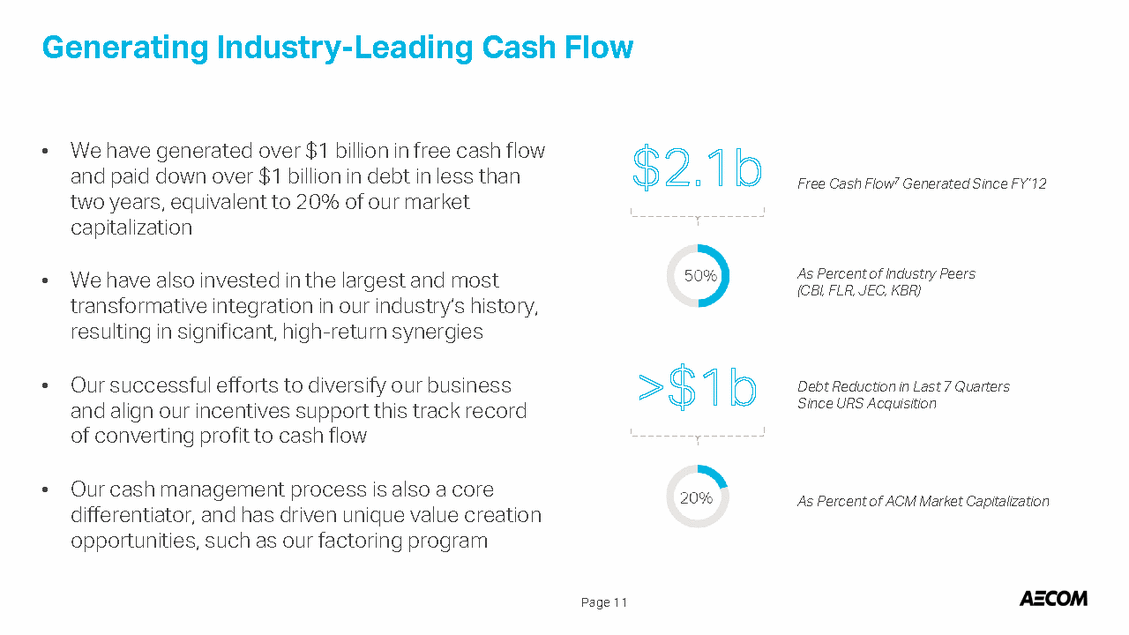
Generating Industry-Leading Cash Flow • We have generated over $1 billion in free cash flow and paid down over $1 billion in debt in less than two years, equivalent to 20% of our market capitalization Free Cash Flow7 Generated Since FY’12 As Percent of Industry Peers (CBI, FLR, JEC, KBR) • We have also invested in the largest and most transformative integration in our industry’s history, resulting in significant, high-return synergies • Our successful efforts to diversify our business and align our incentives support this track record of converting profit to cash flow Debt Reduction in Last 7 Quarters Since URS Acquisition • Our cash management process is also a core differentiator, and has driven unique value creation opportunities, such as our factoring program As Percent of ACM Market Capitalization Page 11
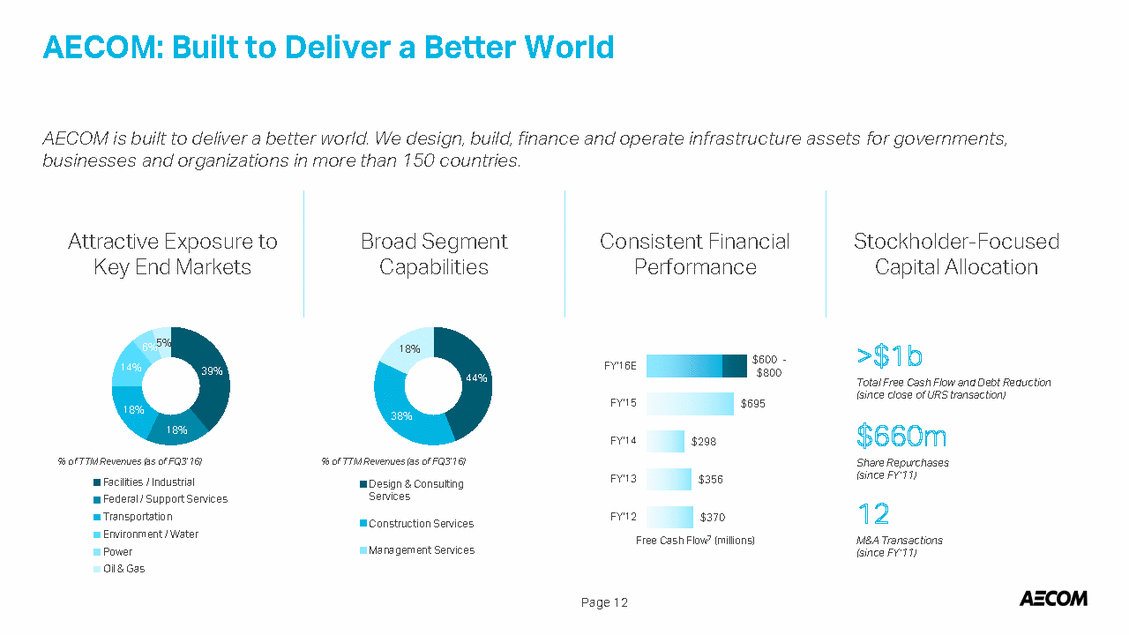
AECOM: Built to Deliver a Better World AECOM is built to deliver a better world. We design, build, finance and operate infrastructure assets for governments, businesses and organizations in more than 150 countries. Attractive Exposure to Key End Markets Broad Segment Capabilities Consistent Financial Performance Stockholder-Focused Capital Allocation 5% 6 18% $600 - $800 FY'16E 14% 39% 44% Total Free Cash Flow and Debt Reduction (since close of URS transaction) FY'15 $695 18% 38% 18% FY'14 $298 % of TTM Revenues (as of FQ3’16) % of TTM Revenues (as of FQ3’16) Share Repurchases (since FY’11) FY'13 $356 Facilities / Industrial Federal / Support Services Transportation Environment / Water Power Oil & Gas Design & Consulting Services FY'12 $370 Construction Services Free Cash Flow7 (millions) M&A Transactions (since FY’11) Management Services Page 12
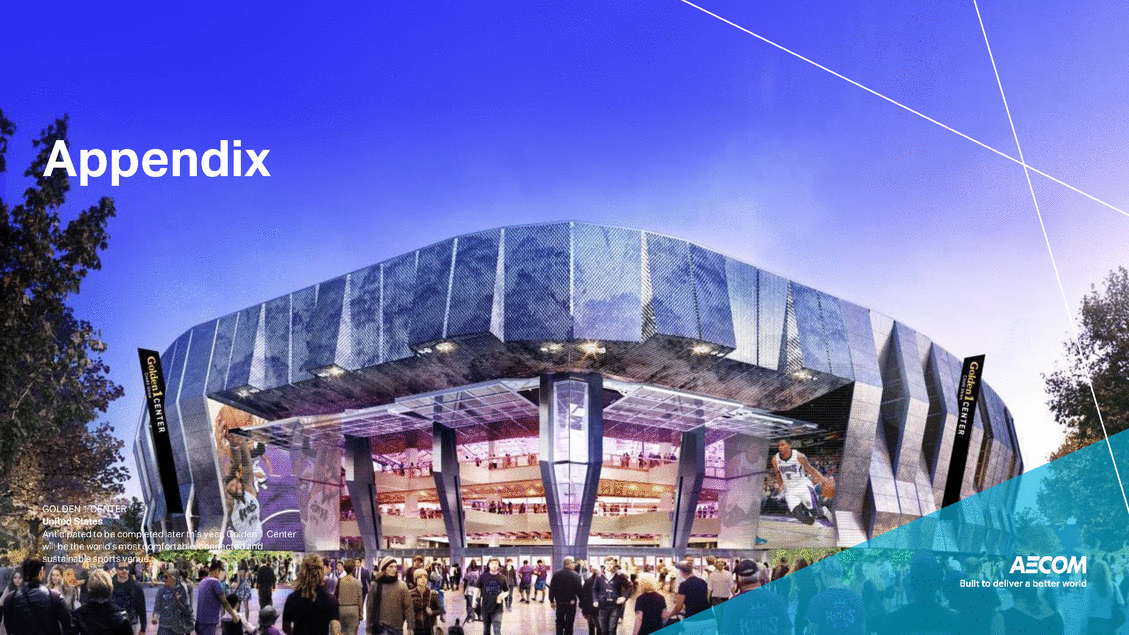
Appendix GOLDEN 1 CENTER United States Anticipated to be completed later this year, Golden 1 Center will be the world’s most comfortable, connected and sustainable sports venue.
Footnotes 1 Excludes acquisition and integration related expenses, financing charges in interest expense, the amortization of intangible assets, and financial impacts associated with expected and actual dispositions of non-core businesses and assets. See Reconciliation to Non-GAAP Measures. 2 Source: Design-Build Institute of America, 2014 & 2016. 3 Source: American Society of Civil Engineers, 2016. 4 Source: Water Design-Build Council, 2015. 5 Source: U.S. Environmental Protection Agency, 2013. 6 Source: United Nations Department of Economic and Social Affairs, Population Division, 2014. 7 Free cash flow is defined as cash flow from operations less capital expenditures net of proceeds from disposals, and is a non-GAAP measure. See Reconciliation to Non-GAAP Measures. 8 Defined as attributable to AECOM, excluding acquisition and integration related expenses, financing charges in interest expense, the amortization of intangible assets, and financial impacts associated with expected and actual dispositions of non-core businesses and assets. See Reconciliation to Non-GAAP Measures. Page 14
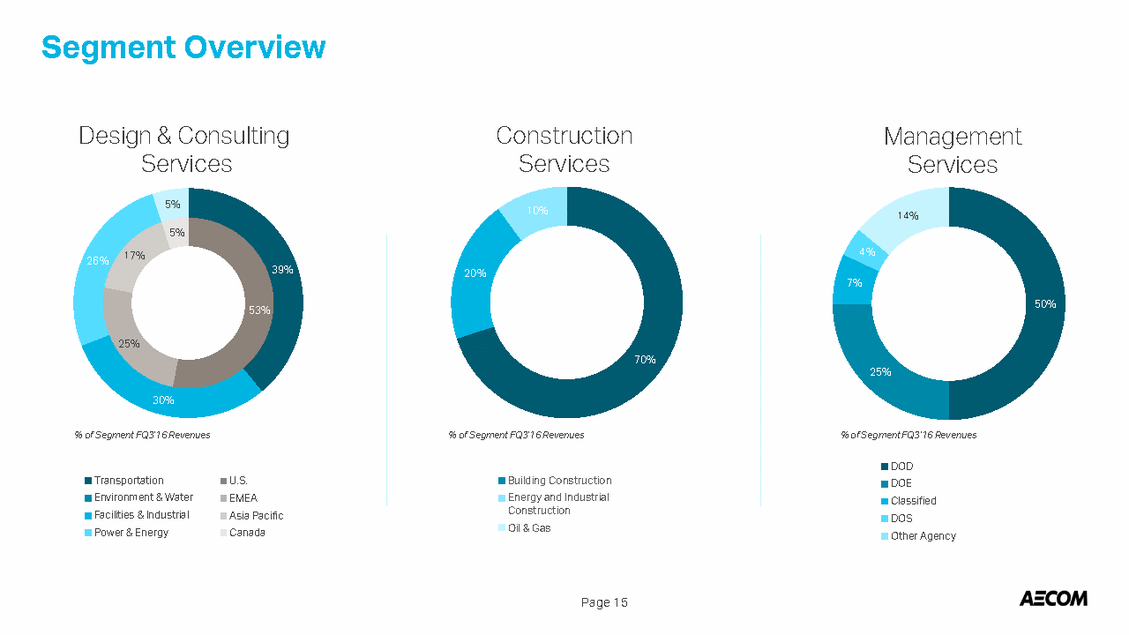
Segment Overview Design & Consulting Services 5% Construction Services Management Services 10% 14% 5% 17% 26% 39% 20% 7% 50% 53% 25% 70% 25% 30% % of Segment FQ3’16 Revenues % of Segment FQ3’16 Revenues % of Segment FQ3’16 Revenues DOD DOE Classified DOS Other Agency Transportation Environment & Water Facilities & Industrial Power & Energy U.S. EMEA Asia Pacific Canada Building Construction Energy and Industrial Construction Oil & Gas Page 15
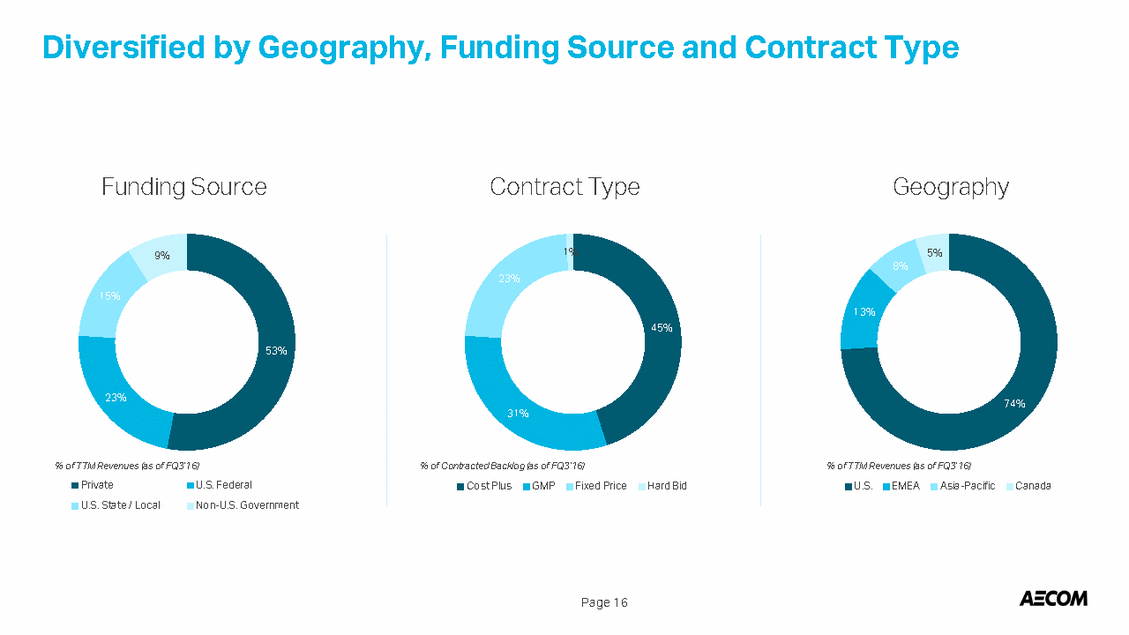
Diversified by Geography, Funding Source and Contract Type Funding Source Contract Type Geography 1% 5% 9% 8% 23% 15% 13% 45% 53% 23% 74% 31% % of TTM Revenues (as of FQ3’16) % of Contracted Backlog (as of FQ3’16) % of TTM Revenues (as of FQ3’16) Private U.S. State / Local U.S. Federal Non-U.S. Government Cost Plus GMP Fixed Price Hard Bid U.S. EMEA Asia-Pacific Canada Page 16
Board of Directors Michael S. Burke Director, Chairman and CEO Appointed as CEO on March 6, 2014. Previously, he held the position of President since October 2011 and CFO from December 2006. He has been with the company in many senior positions since October 2005. From 1990 to 2005, Mr. Burke was with the accounting firm KPMG LLP. David W. Joos Director Named to our Board of Directors in February 2012. Mr. Joos currently serves as chairman of the Board of CMS Energy Corporation, a public electric and natural gas utility. Previously, he served from 2004 to 2010 as president and chief executive officer of CMS Energy Joos brings 27 years of experience, including his extensive knowledge and practical experience. Douglas W. Stotlar Director Named to our Board of Directors in October 2014. Previously, he served as a director of URS Corporation from March 2007 to October 2014. Mr. Stotlar has served as President, Chief Executive Officer, and director of Con-way Inc. since 2005. Prior to that he held other senior roles since joining the firm in 1997. James H. Fordyce Director Named to our Board of Directors in February 2006, where he serves as lead director and Chairman of the Compensation Committee. Mr. Fordyce is a founder and Co-CEO of Stone Canyon Industries. Prior to Stone Canyon, Mr. Fordyce was a Managing Director of J.H. Whitney Capital Partners, LLC, from 1996 to 2014. He began his career at Chemical Bank & Heller Financial Inc. Senator William H. Frist, M.D. Director Named to our Board of Directors in October 2014. Previously, he served as a director of URS Corporation from November 2009 to October 2014. His distinguished career has included partner at Cressey & Company LP, Distinguished University Professor at Vanderbilt University, US Senator for Tennessee and was Senate Majority Leader. Linda Griego Director Named to our Board of Directors in May 2005. Ms. Griego has served as President and Chief Executive Officer of Griego Enterprises, Inc. since 1985. She also served as Interim President and Chief Executive Officer of the Los Angeles Community Development Bank and was Deputy Mayor of Los Angeles. Daniel R. Tishman Director, Vice Chairman Named to our Board of Directors in July 2010. He is also an AECOM Vice Chairman as well as Chairman and CEO of Tishman Construction Corp. joined AECOM in July of 2010. Mr. Tishman is Vice Chairman and a member of the Board of Tishman Hotel & Realty LP, which develops, owns and manages a private portfolio of hospitality properties. In 2006, he was appointed by Mayor Michael Bloomberg to New York City’s Sustainability Advisory Board. Gen. Janet C. Wolfenbarger, USAF Ret. Director Named to our Board of Directors in August 2015. A 35-year veteran of the Air Force and the branch’s first four-star female general, Wolfenbarger commanded the Air Force Materiel Command (AFMC) at Wright-Patterson Air Force Base in Ohio from 2012 until her retirement on July 1, 2015. As part of a decorated military career, Wolfenbarger served as the military deputy to the Assistant Secretary of the Air Force for Acquisition and as the services director of the Acquisition Center of Excellence at the Pentagon. Rob J. Routs Director Named to our Board of Directors during December 2010. From 1971 until his retirement in 2008, Routs served in several leadership roles at Royal Dutch Shell plc. Routs’ final leadership role with Royal Dutch Shell was Executive Director, Downstream operations, where he was based in Europe from 2004 to 2008. Clarence T. Schmitz Director Named to our Board of Directors in June 2014. Mr. Schmitz served as Chairman, Co-founder and Chief Executive Officer of Outsource Partners International, Inc., a company that grew to become one of the largest firms dedicated to outsourcing finance, accounting and tax services. Previously, he was Executive VP and CFO of Jefferies Group, Inc., and spent 25 years at KPMG LLP. Page 17
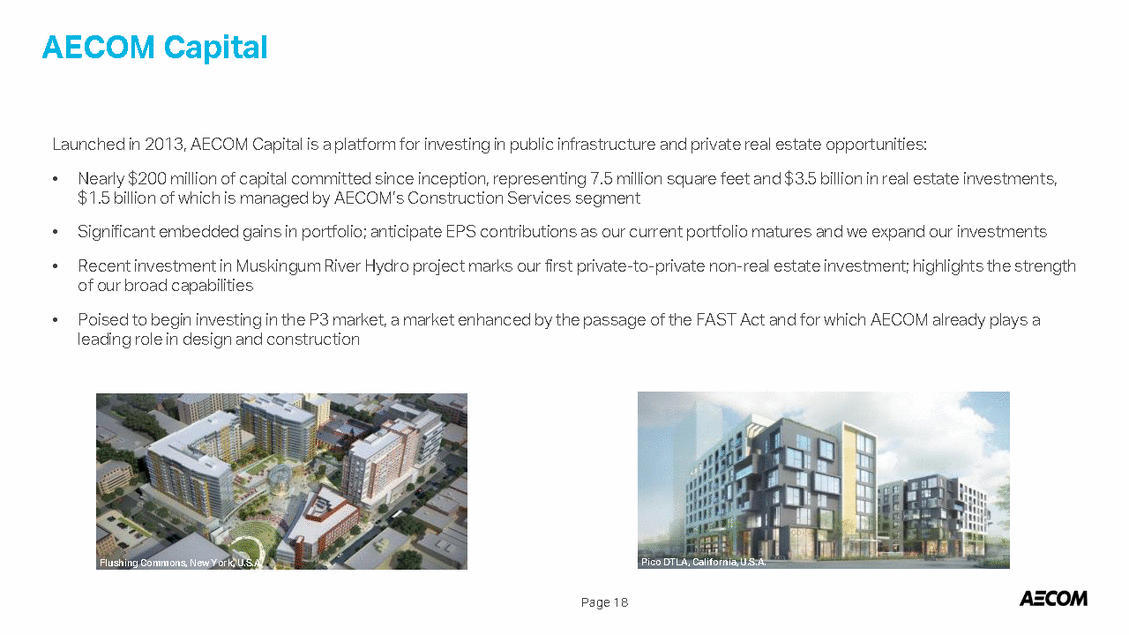
AECOM Capital Launched in 2013, AECOM Capital is a platform for investing in public infrastructure and private real estate opportunities: • Nearly $200 million of capital committed since inception, representing 7.5 million square feet and $3.5 billion in real estate investments, $1.5 billion of which is managed by AECOM’s Construction Services segment • • Significant embedded gains in portfolio; anticipate EPS contributions as our current portfolio matures and we expand our investments Recent investment in Muskingum River Hydro project marks our first private-to-private non-real estate investment; highlights the strength of our broad capabilities • Poised to begin investing in the P3 market, a market enhanced by the passage of the FAST Act and for which AECOM already plays a leading role in design and construction Pico DTLA, California, U.S.A. Flushing Commons, New York, U.S.A. Page 18
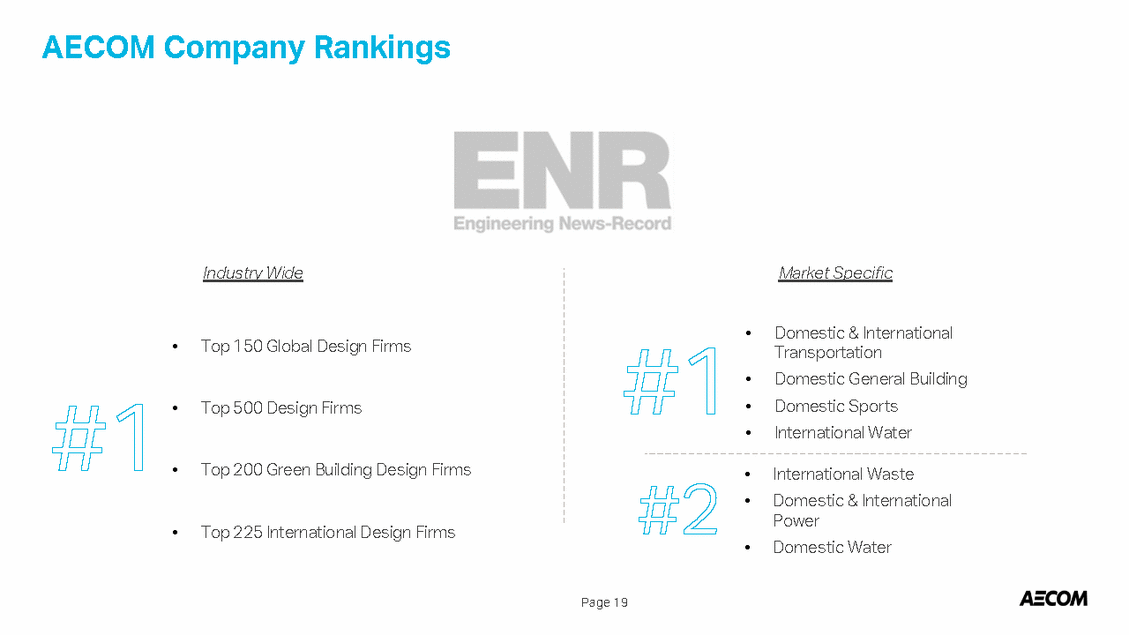
AECOM Company Rankings Industry Wide Market Specific • Domestic & International Transportation Domestic General Building Domestic Sports International Water • Top 150 Global Design Firms • • • • Top 500 Design Firms • Top 200 Green Building Design Firms • • International Waste Domestic & International Power Domestic Water • Top 225 International Design Firms • Page 19
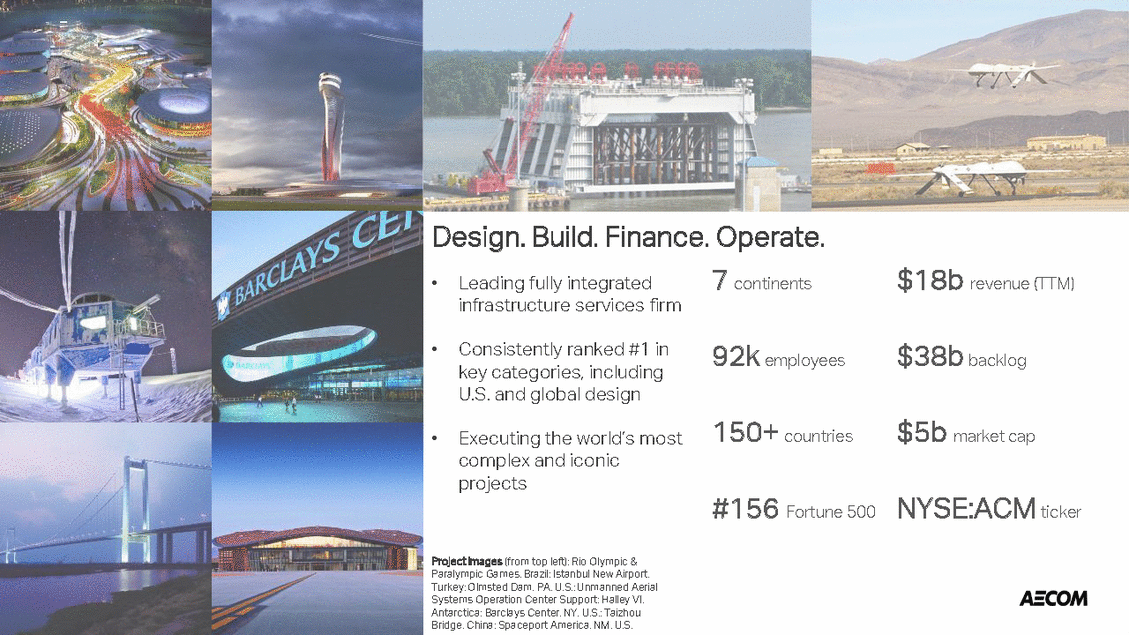
Reconciliation to Non-GAAP Measures Adjusted Income from Operations Adjusted EPS Three Months Ended Three Months Ended In millions Jun 30, 2016 Jun 30, 2016 Income from operations Non-core operating losses Acquisition and integration expenses Amortization of intangible assets Adjusted income from operations Segment Income from Operations Design & Consulting Services Segment: Income from operations Non-core operating losses Amortization of intangible assets Adjusted income from operations $ 110.4 14.4 50.6 43.8 $0.43 Net income (loss) attributable to AECOM – per diluted share Per diluted share adjustments: Non-core operating losses Acquisition and integration expenses Amortization of intangible assets Financing charges in interest expense Tax effect of the above adjustments Amortization of intangible assets included in NCI, net of tax Adjusted net income attributable to AECOM – per diluted share Weighted average shares outstanding - diluted $ 219.2 0.09 0.32 0.28 0.03 (0.33) (0.01) $ 124.0 14.4 11.5 $ 149.9 $0.81 Construction Services Segment: (Loss) income from operations Non-core operating losses Loss on disposal activity Amortization of intangible assets Adjusted income from operations 156.2 $ 12.6 – – 10.6 *When there is a net loss, basic and dilutive GAAP EPS calculations use the same share count to avoid any antidilutive effect; however, the adjusted EPS includes the dilutive shares excluded in the GAAP EPS. $ 23.2 Free Cash Flow Management Services Segment: Income from operations Amortization of intangible assets Adjusted income from operations Three Months Ended $ 53.3 21.7 Twelve Months Ended Sep 30, 2012 Sep 30, 2013 Sep 30, 2014 Sep 30, 2015 Jun 30, 2016 $ 75.0 In millions Net cash provided by operating activities Capital expenditures, net Free cash flow $ 433.4 (62.9) $ 408.6 (52.1) $ 360.6 (62.8) $ 764.4 (69.4) $ 260.1 (68.8) $ 370.5 $ 356.5 $ 297.8 $ 695.0 $ 191.3 Page 20
