Attached files
| file | filename |
|---|---|
| EX-32.2 - EXHIBIT 32.2 - G&K SERVICES INC | gk201672ex322.htm |
| EX-32.1 - EXHIBIT 32.1 - G&K SERVICES INC | gk201672ex321.htm |
| EX-31.2 - EXHIBIT 31.2 - G&K SERVICES INC | gk201672ex312.htm |
| EX-31.1 - EXHIBIT 31.1 - G&K SERVICES INC | gk201672ex311.htm |
| EX-24 - EXHIBIT 24 - G&K SERVICES INC | gk201672-ex24.htm |
| EX-23.1 - EXHIBIT 23.1 - G&K SERVICES INC | gk201672-ex231.htm |
| EX-21 - EXHIBIT 21 - G&K SERVICES INC | gk201672-ex21.htm |
| EX-3.(B) - EXHIBIT 3.(B) - G&K SERVICES INC | gk201672-ex3b.htm |

UNITED STATES
SECURITIES AND EXCHANGE COMMISSION
Washington, D.C. 20549
____________________________________________________________
FORM 10-K
____________________________________________________________
Annual Report Pursuant to Section 13 or 15(d) of the Securities Exchange Act of 1934
For the Fiscal Year Ended July 2, 2016
Commission file number 0-4063
____________________________________________________________
G&K SERVICES, INC.
(Exact name of registrant as specified in its charter)
MINNESOTA | 41-0449530 | |
(State of incorporation) | (I.R.S. Employer Identification No.) | |
5995 OPUS PARKWAY
MINNETONKA, MINNESOTA 55343
(Address of principal executive offices)
Registrant’s telephone number, including area code (952) 912-5500
Securities registered pursuant to Section 12(b) of the Act:
Title of Each Class | Name of Each Exchange on which Registered | |
Class A Common Stock (par value $0.50 per share) | The NASDAQ Stock Market LLC | |
Securities registered pursuant to Section 12(g) of the Act:
None
____________________________________________________________
Indicate by check mark whether the registrant is a well-known seasoned issuer, as defined in Rule 405 of the Securities Act. Yes x No o
Indicate by check mark if the registrant is not required to file reports pursuant to Section 13 or Section 15(d) of the Act. Yes o No x
Indicate by check mark whether the registrant (1) has filed all reports required to be filed by Section 13 or 15(d) of the Securities Exchange Act of 1934 during the preceding 12 months (or for such shorter period that the registrant was required to file such reports), and (2) has been subject to such filing requirements for the past 90 days. Yes x No o
Indicate by check mark whether the registrant has submitted electronically and posted on its corporate Web site, if any, every Interactive Data File required to be submitted and posted pursuant to Rule 405 of Regulation S-T (§232.405 of this chapter) during the preceding 12 months (or for such shorter period that the registrant was required to submit and post such files). Yes x No o
Indicate by check mark if disclosure of delinquent filers pursuant to Item 405 of Regulation S-K is not contained herein, and will not be contained, to the best of registrant’s knowledge, in definitive proxy or information statements incorporated by reference in Part III of this Form 10-K or any amendment to this Form 10-K. o
Indicate by check mark whether the registrant is a large accelerated filer, an accelerated filer, a non-accelerated filer, or a smaller reporting company. See the definitions of "large accelerated filer," "accelerated filer" and "smaller reporting company" in Rule 12b-2 of the Exchange Act. (Check one):
Large accelerated filer | x | Accelerated filer | o |
Non-accelerated filer | o (do not check if a smaller reporting company) | Smaller reporting company | o |
Indicate by check mark whether the registrant is a shell company (as defined in Rule 12b-2 of the Exchange Act). Yes o No x
As of December 24, 2015 (the last business day of the registrant’s most recently completed second fiscal quarter), the aggregate market value of the registrant’s voting common equity held by non-affiliates was approximately $1,264,374,953.
On August 23, 2016, 19,683,483 shares of the registrant's Class A Common Stock were outstanding.
____________________________________________________________
DOCUMENTS INCORPORATED BY REFERENCE
The information required by Part III of this report, to the extent not set forth herein, will be provided in accordance with Instruction G(3) to Form 10-K within 120 days after the end of the fiscal year to which this report relates.
G&K Services, Inc.
Form 10-K
For the fiscal year ended July 2, 2016
Table of Contents
PAGE | |
2
PART I
ITEM 1. | BUSINESS |
G&K Services, Inc., founded in 1902 and headquartered in Minnetonka, Minnesota, is a service-focused provider of branded uniform and facility services programs. We deliver value to our customers by enhancing their image and brand, and by promoting workplace safety, security and cleanliness. We accomplish this by providing a wide range of workwear and protective safety apparel through rental and direct purchase programs. We also supply a variety of facility products and services, including floor mats, towels, mops, restroom hygiene products, and first aid supplies. We have a team of 8,000 employees who operate from approximately 160 locations. These locations serve customers in 96 of the top 100 metropolitan markets across the United States and Canada.
Customers, Products and Services
We serve a diverse base of customer locations in virtually all industries, including automotive, warehousing, distribution, transportation, energy, manufacturing, food processing, retail, restaurants, construction and trades, hospitality, government, healthcare and others. We provide service to customers of almost every size, from Fortune 100 companies to small and midsize firms. Our largest customer represents approximately 2% of our total revenue. Over one million people within our customer base wear G&K work apparel every work day.
Our customer-focused relationships involve customers renting or directly purchasing uniforms and providing facility products and services to meet a variety of critical needs in the workplace, including:
• | Image – work apparel helps companies project a professional image through their employees and frame the perception of credibility, knowledge, trust and quality to their customers. Employees in uniform are perceived as well trained, competent and dependable. Branded work apparel promotes a company's brand identity and allows employees in uniform to convey a company's image. |
• | Safety and security – protective work apparel helps protect employees from difficult environments, such as heavy soils, heat, flame or chemicals. Additionally, uniforms help improve workplace security by identifying employees working for a particular company or department. Facility services products, such as floor mats and first aid supplies, also help improve workplace safety. |
• | Workplace cleanliness and hygiene – facility services products, such as floor mats, towels, mops, and restroom supplies, help ensure a clean, well-maintained facility, which is safer for employees and more attractive to customers. |
• | Employee retention – work apparel enhances worker morale and helps build teamwork in addition to providing a tangible employee benefit. |
• | Product protection – work apparel and facility services help protect products against sources of contamination in various industries, including the food, pharmaceutical and healthcare industries. |
With a comprehensive understanding of our customers' requirements, we enhance our customers' image and safety by consistently providing superior service and high quality work apparel and facility products and services. Through proprietary tracking systems, a rigorous inspection program, broad product inventories and an accurate measuring system, we promise our customers that deliveries are complete, on time and in good repair. By utilizing advanced technology and offering simple service agreements, we strive to make certain that billing is simple, accurate and predictable. In addition, we employ communication systems and perform closed-loop customer satisfaction practices to ensure our customers' needs are met promptly.
We utilize a collaborative approach to advise and assist our customers in choosing a work apparel program that best meets their unique brand, image, identity and safety needs. Our comprehensive range of work apparel and uniform rental programs offers flexibility in styles, colors and quantities, and sets service and distribution expectations to customer requirements. We can quickly source and access garments to provide rapid response as customer needs change due to increases, decreases or turnover in their work force. Professional cleaning, finishing, repair, embellishment and replacement of uniforms in use is a normal part of the rental service. Our handling of the details of a work apparel program allows our customers to focus on running their core business and not be concerned with the management time, operating costs and environmental exposures involved in running their own work apparel program or on-premise laundry.
We also offer complete facility services programs that provide a wide range of dust control, maintenance, hand care and hygiene products and services. These programs include floor mat offerings (traction control, logo, message, scraper, anti-fatigue), towel products (shop, kitchen, bar, bath, dish, continuous roll, microfiber), mop offerings (dust, microfiber, wet), fender covers, selected linen items, restroom hygiene products and first aid supplies. Our regularly scheduled weekly service of these products and services helps our customers maintain a clean, safe and attractive environment within their facilities for their employees and customers.
3
Our customers also need a wide selection of branded apparel across a variety of jobs. Our comprehensive direct sale catalog business features a broad product selection, high quality embellishment, efficient distribution and various ordering and payment capabilities. We have developed a vast and comprehensive product offering of some of the leading brands in our industry tailored to the needs of our various market segments through our catalog offering. This branded apparel program can be used for uniform programs, employee rewards and recognition, trade shows and vendor appreciation programs.
For most of our customers, we provide weekly service, with our highly talented service professionals visiting customers' locations. This regular customer contact helps ensure we are meeting our customers' needs, while promoting strong relationships that lead to high customer retention and additional sales opportunities.
Recent Development
On August 15, 2016, we entered into an Agreement and Plan of Merger (the “Merger Agreement”) with Cintas Corporation (“Cintas”) and Bravo Merger Sub, Inc., a wholly owned subsidiary of Cintas (“Merger Sub”), pursuant to which we will be acquired by Cintas by Merger Sub merging with and into us such that we will become a wholly owned subsidiary of Cintas (the “Merger”). At the effective time of the merger, each outstanding share of Class A common stock will be converted into the right to receive $97.50 per share in cash. For additional discussion of the Merger see “Proposed Merger with Cintas Corporation” in Item 7. Management’s Discussion and Analysis of Financial Condition and Results of Operations” in this Annual report on Form 10-K.
Acquisitions
Our industry continues to consolidate as many family-owned, local operators and regional companies have been acquired by larger providers. We have historically participated in this consolidation with an acquisition strategy focused on expanding our geographic presence and/or expanding our local market share in order to further leverage our existing production facilities. We remain active in evaluating quality acquisitions that would strengthen our business. We completed one small acquisition in fiscal year 2016 that was not material to our consolidated financial results.
Competition
We believe many customers in our industry choose providers based on the consistency of superior customer service received, hence our focus on service excellence. The customer-supplier relationship, unique business needs, brand awareness, quality image and improving safety are also key attributes in selecting a uniform provider. In addition, product quality, fit, comfort, price and breadth of products offered are factors in the decision process. We rank among North America's largest work apparel providers and encounter competition from many companies in the geographic areas we serve. We compete effectively in our core work apparel and facility services business because of our focus on Delivering Uniform Service Excellence®.
Manufacturing and Suppliers
We manufactured approximately 48% of the work apparel that we placed into service in fiscal year 2016. These garments are primarily manufactured in the Dominican Republic. Various outside vendors are used to supplement our additional product needs, including garments, floor mats, towels, mops, linens and related products. Although we occasionally experience product shortages, we are not currently aware of any circumstances that would materially limit our ability to obtain raw materials to support the manufacturing process or to obtain garments or other items to meet our customers' needs.
Environmental Matters
Our operations, like those of our competitors, are subject to various federal, state and/or local laws, rules and regulations respecting the environment, including potential discharges into water and air and the generation, safe handling, storage, transportation and disposal of waste and hazardous substances. We generate certain amounts of waste in connection with our laundry operations, including wastewater, wastewater sludge, waste oil and other residues. In a limited number of instances, certain of these wastes are classified as hazardous under applicable laws, rules and regulations. We continue to make significant investments in properly handling and disposing of these wastes to help ensure safety and compliance with applicable regulations and operating our business, emphasizing our environmental stewardship obligations and responsibilities.
Additionally, we are involved in various property remediation projects. Currently, we have three such projects nearing completion, which we expect will be completed within previously established reserves. We also have four other projects on which we are currently working.
As part of our continued efforts on the four projects mentioned above, in the fourth quarter of fiscal year 2015, we determined it was likely that the parties that were contractually obligated to remediate contamination resulting from prior use of perchloroethylene, or PCE, other dry cleaning solvents and other contaminants at three of these previously purchased locations would not be able to continue to meet these obligations because of their respective financial condition. These projects relate to acquisitions which date as far back as the 1970s; the most recent one was in 2007. As a result of the foregoing, we recorded a
4
charge of $3.9 million to increase our remediation-related reserves for these projects to $4.7 million as of June 27, 2015. As of July 2, 2016 our remediation-related reserves were approximately $3.6 million as discussed in Note 12, "Commitments and Contingencies" of Notes to Consolidated Financial Statements.
In order to determine whether any additional exposure for remediation exists, commencing in fiscal year 2016, we assessed six additional sites which we acquired and that had historical dry cleaning operations. The environmental assessment of four of these sites is complete, with no further action required. We continue to assess the remaining two sites. With respect to these remaining two sites, while we believe additional costs may be probable, they are not yet reasonably estimable. Therefore, beyond amounts to cover our ongoing assessment of these two sites, we have not recorded any additional reserves for these properties. While such charges may be material, including with respect to reported operating results in a particular period, we believe the likelihood that any charges will have a material adverse effect on our results of ongoing operations or financial position is remote.
We discuss certain legal matters in this Annual Report on Form 10-K under Part I, Item 1A. Risk Factors - Compliance with environmental laws and regulations could result in significant costs that adversely affect our operating results, Item 3. Legal Proceedings, Item 7. Management’s Discussion and Analysis of Financial Condition and Results of Operations, Item 8. Financial Statements and Supplementary Data in Note 12, "Commitments and Contingencies" of Notes to Consolidated Financial Statements. While it is impossible to ascertain the ultimate legal and financial liability with respect to contingent liabilities, including lawsuits, legal matters, claims and environmental contingencies, we expect to incur additional charges to remediate PCE and other contamination at certain sites we have acquired. Based on information currently available, it is also possible that we may incur additional losses in excess of established reserves for other environmental matters. While such charges may be significant we believe the likelihood that any charges will have a material adverse effect on our results of ongoing operations or financial position is remote, although the impact on reported operating results in any particular period may be material.
Employees
Our U.S. operations had approximately 6,700 employees as of July 2, 2016, of which approximately 10% are represented by various labor unions. Approximately 5% of our U.S. employees that are represented by the various labor unions participate in collective bargaining agreements that expire in the next 12 months. We believe our U.S. employee relations are good.
Our Canadian operations had approximately 1,300 employees as of July 2, 2016, of which approximately 65% are represented by various labor unions. Approximately 50% of our Canadian employees that are represented by the various labor unions participate in collective bargaining agreements that expire in the next 12 months. We believe our Canadian employee relations are likewise good.
Foreign and Domestic Operations
Financial information relating to foreign and domestic operations is set forth in Note 13, "Segment Information" of Notes to Consolidated Financial Statements included in Item 8 of this Form 10-K.
Intellectual Property
We own a portfolio of registered trademarks, trade names and licenses, and certain U.S. and foreign process and manufacturing patents relating to our business. These proprietary properties, in the aggregate, constitute a valuable asset. We do not believe, however, that our business is dependent upon any single proprietary property or any particular group of proprietary properties.
Seasonality and Working Capital
We do not consider our business to be seasonal to any significant extent or subject to any unusual working capital requirements.
Available Information
Our Annual Reports on Form 10-K, Quarterly Reports on Form 10-Q, Current Reports on Form 8-K and any amendments to those reports are available free of charge, as soon as reasonably practicable, after we electronically file such material with, or furnish it to, the United States Securities and Exchange Commission ("SEC"). These reports are available on our website at http://www.gkservices.com and on the SEC's website at http://www.sec.gov. Information included on our website is not deemed to be incorporated into this Annual Report on Form 10-K.
ITEM 1A. | RISK FACTORS |
The statements in this section, as well as statements described elsewhere in this Annual Report on Form 10-K, or in other filings made with the SEC, describe risks that could materially and adversely affect our business, financial condition and results of operations and the trading price of our securities. These risks are not the only risks that we face. Our business, financial condition and results of operations could also be materially affected by additional factors that are not presently known to us or that we currently consider to be immaterial to our operations.
5
In addition, this section sets forth statements which constitute our cautionary statements under the Private Securities Litigation Reform Act of 1995.
FORWARD-LOOKING STATEMENTS
The Private Securities Litigation Reform Act of 1995 provides a safe harbor from civil litigation for forward-looking statements. Forward-looking statements may be identified by words such as "estimates," "anticipates," "projects," "plans," "expects," "intends," "believes," "seeks," "could," "should," "may" and "will" or the negative versions thereof and similar expressions and by the context in which they are used. Such statements are based upon our current expectations and speak only as of the date made. These statements are subject to various risks, uncertainties and other factors that could cause actual results to differ from those set forth in or implied by this Annual Report on Form 10-K. Factors that might cause such a difference include, but are not limited to, the possibility of greater than anticipated operating costs, lower sales volumes, the performance and costs of integration of acquisitions or assumption of unknown liabilities in connection with acquisitions, fluctuations in costs of materials and labor, costs and possible effects of union organizing or other union activities, strikes, loss of key management, uncertainties regarding any existing or newly-discovered expenses and liabilities related to environmental compliance and remediation, failure to achieve and maintain effective internal controls for financial reporting required by the Sarbanes-Oxley Act of 2002, the initiation or outcome of arbitrations, litigation or governmental investigations, higher than assumed sourcing or distribution costs of products, the disruption of operations from catastrophic events or from the proposed Merger, disruptions in capital markets, the liquidity of counterparties in financial transactions, changes in federal and state tax laws, failure to complete the proposed Merger in a timely manner, or at all, economic uncertainties and the reactions of competitors in terms of price and service. We undertake no obligation to update any forward-looking statements to reflect events or circumstances arising after the date on which they are made, except as required by law.
Also note that we provide the following cautionary discussion of risks, uncertainties and assumptions relevant to our business. Actual results may differ from certain assumptions we have made causing actual events to vary from expected results. These are factors that, individually or in the aggregate, could cause our actual results to differ materially from expected and historical results. We note these factors for investors as permitted by the Private Securities Litigation Reform Act of 1995. You should understand that it is not possible to predict or identify all such factors. Consequently, you should not consider the following to be a complete discussion of all potential risks or uncertainties.
RISKS RELATED TO BUSINESS OPERATIONS
General economic factors may adversely affect our financial performance.
General economic conditions may adversely affect our financial performance. Increases in labor costs, including healthcare, minimum wages, insurance costs, higher material costs for items, such as linens, other textiles and various raw materials, higher fuel and other energy costs, higher interest rates, inflation, higher tax rates and other changes in tax laws and other economic factors could increase our costs and could adversely affect our results of operations.
Fluctuations in Canadian currency could have an adverse effect on our results of operations and financial condition.
Certain of our foreign revenue and operating expenses are transacted in local currencies. Therefore, our results of operations and certain receivables and payables are subject to foreign exchange rate fluctuations.
Increased competition could adversely affect our financial performance.
We operate in a highly competitive industry and compete with national, regional and local providers. Service, product quality, design, fit, comfort, price, breadth of products offered and convenience to the customer are the primary competitive elements in these industries. If existing or future competitors seek to gain or retain market share by reducing prices, we may be required to lower prices, which could be detrimental to our operating results. Our competitors also generally compete with us for possible acquisitions, which can increase the price for acquisitions. In addition, our customers and prospects may decide to perform certain services in-house instead of outsourcing such services. These competitive pressures could adversely affect our sales and operating results.
Failure to comply with various state and federal regulations could adversely affect our results of operations.
Numerous complex federal and provincial regulations apply to our business, as do various regulations promulgated by state and local agencies. These regulations govern a wide variety of employment practices and include requirements surrounding minimum wages, overtime, working conditions and citizenship. We are also subject to numerous transportation and safety laws and regulations. Without limiting the generality of the foregoing, our business is subject to regulations promulgated by the U.S. Department of Transportation and under the Occupational Safety and Health Act of 1970, as amended. Likewise, as a contractor to the United States government, various regulations promulgated by the Office of Federal Contract Compliance Programs apply to our business. We have incurred, and will continue to incur, additional costs in the ordinary course of our business in complying with these various regulations. Additionally, changes in these laws or regulations could substantially increase our operating costs or otherwise affect how we operate our business. Failure to comply with these regulations could
6
result in fines by government authorities and payment of damages to private litigants, affect our ability to service our customers, result in debarment of us as a contractor to the United States government and adversely affect our financial condition, results of operations and prospects.
Compliance with environmental laws and regulations could result in significant costs that adversely affect our operating results.
Our operating facilities are subject to stringent environmental laws, rules and regulations relating to the protection of the environment and health and safety matters, including those governing the potential discharges of pollutants to the air and water, the management and disposal of hazardous substances and wastes and the clean-up of contaminated sites. The operation of our business entails risks under environmental laws and regulations. We could incur significant costs, including, without limitation, clean-up costs, fines, sanctions and claims by regulators or third parties for property damage and personal injury, as a result of violations or liabilities under these laws and regulations, which among other things, could require us to reduce or cease use of certain equipment and/or limit or stop production at certain facilities. These consequences could have a material adverse effect on our results of operations and financial condition and disrupt customer relationships.
We are currently involved in a limited number of legal matters at various locations related to environmental laws and regulations. As part of our ongoing operations, we also are involved in various property remediation efforts. Historically, we have borne our property remediation costs as part of our ongoing operations. In particular, we have three projects nearing completion, which we expect will be completed within previously established reserves. We are also working on four other projects. As part of our continued efforts on these four projects, in the fourth quarter of 2015, we determined it was likely that the parties that were contractually obligated to remediate contamination resulting from prior use of PCE and other contaminants at three of these previously purchased locations would not be able to continue to meet these obligations because of their respective financial condition. These projects relate to acquisitions which date as far back as the 1970s; the most recent one was in 2007. As a result of the foregoing, we recorded a charge of $3.9 million to increase our remediation-related reserves for these projects to $4.7 million as of June 27, 2015. As of July 2, 2016 our remediation-related reserves were approximately $3.6 million as discussed in Note 12, "Commitments and Contingencies" of Notes to Consolidated Financial Statements.
In order to determine whether any additional exposure for remediation exists, commencing in fiscal year 2016, we assessed six additional sites which we previously acquired and that had historical dry cleaning operations. The environmental assessment of four of these sites is complete, with no further action required. We continue to assess the remaining two sites. With respect to these remaining two sites, while we believe additional costs may be probable, they are not yet reasonably estimable. Therefore, beyond amounts to cover our ongoing assessments of these two sites, we have not recorded any additional reserves for these properties.
Our ongoing assessments will inform our next set of actions and could reveal other environmental contamination that needs to be remediated. We may incur additional charges to remediate at these sites. Further, based on information currently available, it is possible that we may incur additional losses in excess of established reserves for other environmental matters. While such charges may be significant, we believe the likelihood that any charges will have a material adverse effect on our results of ongoing operations or financial position is remote, although the charges in any particular period could be materially affected by changes in our assumptions or strategies related to these contingencies, the imposition of clean-up obligations and the discovery of alleged contamination or changes out of our control. However, these amounts are not estimable at this time. In addition, potentially significant expenditures could be required to comply with environmental laws and regulations, including requirements that may be adopted or imposed in the future.
Under environmental laws, an owner or operator of real estate may be required to pay the costs of removing or remediating hazardous materials located on or emanating from property, regardless of whether the owner or operator knew of or was responsible for the presence of such hazardous materials. While we regularly engage in environmental due diligence in connection with acquisitions, we can give no assurance that locations that have been acquired or leased have been operated in compliance with environmental laws and regulations during prior periods, nor can we give any assurance that existing remediation projects or future uses or conditions will not make us liable under these laws or expose us to regulatory or third-party actions, including third party suits.
Additionally, we must maintain compliance with various permits and licenses issued to us in connection with our operations, or we must apply for and obtain such permits and licenses. Any failure on our part to maintain such compliance or to apply for and receive such permits and licenses could have a material adverse effect on our ability to continue operations at a particular location.
We may be subject to information technology system failures, network disruptions and breaches in data security.
We rely upon sophisticated information technology systems and infrastructure, as well as strong security procedures and tools, to operate our business and ensure the secure storage and transmission of information. The size and complexity of our computer systems make them potentially vulnerable to breakdown, malicious intrusion and random attack. Likewise, computer networks
7
and the internet are, by nature, vulnerable to unauthorized access. An accidental or willful security breach could result in unauthorized access to and/or use of sensitive data. Our security measures could be breached by third-party action, computer viruses, accidents, or error or misconduct by an employee or contractor. Because techniques used to obtain unauthorized access, disable or degrade service, or to sabotage computer systems, change frequently, it may be difficult to detect the use of such techniques immediately and we may be unable to implement adequate preventive measures. Unauthorized parties may also attempt to gain access to our systems or facilities through various means, including hacking into our systems or facilities, fraud, trickery or other means of deceiving employees, contractors and temporary staff, or using stolen credit cards to purchase goods. We have encountered threats of this type from time to time, none of which have materially impacted our operations or financial results.
Although we maintain a system of information security and controls, a party that is able to circumvent our security measures could cause interruption in our operations, damage our computers or those of our users, or otherwise damage our reputation. Depending on the severity, any of these events could adversely affect our operations and financial results. In addition, if we were to experience an information security breach, we may be required to expend significant amounts to remedy, protect against, or mitigate the effect of the breach, and we may not be able to remedy the situation in a timely manner, or at all. While we have invested in protection of data and information technology, there can be no assurance that our efforts will prevent breakdowns or breaches in our systems that could adversely affect our business.
Risks associated with the suppliers from whom our products are sourced, and the cost of those products, could adversely affect our operating results.
The products we sell are sourced from a variety of domestic and international suppliers. Global sourcing of many of these products is an important factor in our financial performance. We endeavor that all of our suppliers comply with applicable laws, including, without limitation, labor and environmental laws. Our ability to secure and maintain qualified suppliers who meet our standards and to access products in a timely and efficient manner can be a significant challenge, especially with respect to suppliers located and goods sourced outside the United States. Political and economic stability in the countries in which foreign suppliers are located, the financial stability of suppliers, failure to meet our supplier standards, labor problems experienced by our suppliers, the availability and cost of raw materials to suppliers, currency exchange rates, transport availability and cost, inflation and other factors relating to the suppliers and the countries in which they are located are beyond our control. In addition, United States and Canadian foreign trade policies, tariffs and other impositions on imported goods, trade sanctions imposed on certain countries, the limitation on the importation of certain types of goods or of goods containing certain materials from other countries and other factors relating to foreign trade are beyond our control. Our continued compliance with the disclosure requirements relating to the sourcing of so-called conflict minerals from the Democratic Republic of Congo and certain other adjoining countries as required by the Dodd-Frank Act is predicated upon the timely receipt of accurate information from suppliers, who may be unwilling or unable to provide us with the relevant information. As a result, these requirements could adversely affect our costs, the availability of materials used in our products and our relationships with customers and suppliers. These and other factors affecting our suppliers and our access to products could adversely affect our operating results.
Fluctuations in demand for our products and services may adversely impact our financial results.
Continued uncertainty in global economic conditions may pose a risk to the overall economy as consumers and businesses may defer purchases in response to tighter credit and negative financial news. This could negatively impact our customers and consequently have a negative impact on our financial performance. If demand for our products and services fluctuates as a result of economic conditions or otherwise, our revenue and operating margin could be negatively impacted. Important factors that could cause demand for our products and services to fluctuate include:
• | changes in business and economic conditions, including downturns in specific industry segments and/or the overall economy; |
• | changes in consumer confidence caused by changes in market conditions, including changes in the credit market, expectations for inflation and energy prices; |
• | competitive pressures, including pricing pressures, from companies that have competing products and services; |
• | changes in customer needs; |
• | changes in our customers' employment levels, which impact the number of users of our products and services; |
• | strategic actions taken by our competitors; and |
• | market acceptance of our products and services. |
If our customers' demand for our products and services decreases, our plant and manufacturing capacity could be underutilized, and we may be required to record an impairment of our long-lived assets, including facilities and equipment, as well as
8
intangible assets, which would increase our expenses. A change in demand for our products and services, and changes in our customers' needs, could have a variety of negative effects on our competitive position and our financial results, and, in certain cases, may reduce our revenue, increase our costs and lower our gross margin percentage.
Legal proceedings may adversely affect our financial condition and operating results.
From time to time we are party to various legal claims and proceedings, including those relating to employment and regulatory matters. Certain of these claims or proceedings or potential future proceedings, if decided adversely against us or settled by us, may result in a liability that is material to our financial condition and operating results. We discuss current lawsuits and other litigation to which we are party in greater detail under Item 3. Legal Proceedings and Item 8. Financial Statements and Supplementary Data in Note 12, "Commitments and Contingencies" of Notes to Consolidated Financial Statements.
Risks associated with our acquisition strategy could adversely affect our operating results.
Historically, a portion of our growth has come from acquisitions. We continue to evaluate opportunities for acquiring businesses that may supplement our internal growth. However, there can be no assurance that we will be able to identify and purchase suitable operations. In addition, the success of any acquisition depends in part on our ability to integrate the acquired business. The process of integrating acquired businesses may involve unforeseen difficulties and may require a disproportionate amount of our management's attention and our financial and other resources. Although we conduct due diligence investigations prior to each acquisition, there can be no assurance that we will discover all operational deficiencies or material liabilities of an acquired business for which we may be responsible as a successor owner or operator. The failure to successfully integrate these acquired businesses or to discover such liabilities could adversely affect our operating results.
Increases in fuel, energy and commodity costs could adversely affect our results of operations and financial condition.
Motor fuel, natural gas, electricity, cotton, polyester and other commodities represent a significant cost within our business. The price of these commodities, which are required to run our vehicles and equipment and manufacture our garments, can be unpredictable and can fluctuate based on events beyond our control, including geopolitical developments, supply and demand for oil and gas, actions by oil and gas producers, war, terrorism and unrest in oil producing countries, regional production patterns, limits on refining capacities, natural disasters and environmental concerns. Increases in the cost of these commodities could adversely affect our results of operations and financial condition.
Failure to preserve positive labor relationships could adversely impact our operations and financial results.
Significant portions of our Canadian labor force are unionized, and a lesser portion of United States employees are unionized. While we believe that our Canadian and U.S. employee relations are good, we continue to face pressure from labor unions, and could experience increased pressure. If we do encounter pressure from labor unions, any resulting labor unrest could disrupt our business by impairing our ability to produce and deliver our products and services. In addition, significant union representation would require us to negotiate with many of our employees collectively and could adversely affect our results by restricting our ability to maximize the efficiency of our operations.
Inability to attract and retain employees could adversely impact our operations.
Our ability to attract and retain employees is important to our operations. Our ability to expand our operations is in part impacted by our ability to increase our labor force. In the event of a labor shortage, or in the event of a change in prevailing labor and/or immigration laws, we could experience difficulty in delivering our services in a high-quality or timely manner and we could be forced to increase wages in order to attract and retain employees, which would result in higher operating costs.
Loss of our key management or other personnel could adversely impact our business.
Our success is dependent on the skills, experience and efforts of our senior management and other key personnel. If, for any reason, one or more senior executives or key personnel were not to remain active in our company, or if we are unable to attract and retain key personnel, our results of operations could be adversely affected.
Unexpected events could disrupt our operations and adversely affect our operating results.
Unexpected events, including, without limitation, fires at facilities, security breaches, cyber attacks, natural disasters, such as hurricanes and tornados, public health emergencies, war or terrorist activities, unplanned utility outages, supply disruptions, failure of equipment or systems or changes in laws and/or regulations impacting our business, could adversely affect our operating results. These events could result in disruption of customer service, physical damage or temporary closure of one or more key operating facilities, or the temporary disruption of information systems.
Failure to achieve and maintain effective internal controls could adversely affect our business and stock price.
Effective internal controls are necessary for us to provide reliable financial reports. All internal control systems, no matter how well designed, have inherent limitations. Therefore, even those systems determined to be effective can provide only reasonable assurance with respect to financial statement preparation and presentation. While we continue to evaluate our internal controls,
9
we cannot be certain that these measures will ensure that we implement and maintain adequate controls over our financial processes and reporting in the future. If we fail to maintain the adequacy of our internal controls or if we or our independent registered public accounting firm were to discover material weaknesses in our internal controls, we will not be able to conclude that we have effective internal control over financial reporting in accordance with Section 404 of the Sarbanes-Oxley Act of 2002. Failure to achieve and maintain an effective internal control environment could cause us to be unable to produce reliable financial reports or prevent or detect fraud. This may cause investors to lose confidence in our reported financial information, which could have a material adverse effect on our stock price.
Failure to execute our business plan could adversely affect our business and stock price.
Successful execution of our business plan is not assured as there are several obstacles to success, including the economic environment, a competitive industry and entries by us into new markets. In addition, there can be no assurance that our efforts, if properly executed, will result in our desired outcome of improved financial performance.
RISKS RELATED TO MERGER
Our proposed merger may not be completed on a timely basis, or at all, and the failure to complete or delays in completing the merger could adversely affect our business, financial results and stock price.
On August 16, 2016, we announced that we entered into a merger agreement (the “Merger Agreement”) with Cintas Corporation and Bravo Merger Sub, Inc., a wholly-owned subsidiary of Cintas (“Merger Sub”), which provides that Cintas will acquire all of our outstanding shares of Class A common stock at a price of $97.50 per share in cash. Subject to the terms and conditions of the Merger Agreement, Merger Sub will be merged with and into the company (the “Merger”) with the company surviving the Merger as a wholly-owned subsidiary of Cintas. The Merger is subject to a number of customary conditions set forth in the Merger Agreement, including the approval of our shareholders and receipt of regulatory approvals, which are not within our control. We can provide no assurance as to when, or if, the conditions to the closing of the Merger will be satisfied or waived, that other events will not intervene to delay or result in the termination of the Merger, or that the Merger will be consummated or consummated in the timeframe or manner currently anticipated.
Any delay in closing or a failure to close could have a negative impact on our business, financial results and stock price as well as our relationships with our customers, suppliers or employees, and a negative impact on our ability to pursue alternative strategic transactions and/or our ability to implement alternative business plans.
The Merger Agreement contains provisions that restrict our ability to pursue alternatives to the Merger and, in specified circumstances, could require us to pay Cintas Corporation a termination fee.
Under the Merger Agreement, we are restricted, subject to certain exceptions, from initiating, soliciting, or knowingly facilitating or encouraging any inquiries or making of proposals or offers with regard to any inquiry, proposal or offer for a competing acquisition proposal or participating in any negotiations, discussions or furnishing any non-public information in connection therewith. If we receive a competing acquisition proposal and our board (after consultation with its outside counsel and financial advisors) determines that such proposal is more favorable to our shareholders than the Merger and the board recommends such proposal to our shareholders, Cintas may be entitled to terminate the Merger Agreement. Under such circumstances, we may be required to pay Cintas a termination fee equal to $60 million. These provisions could discourage a third party that may have interest in acquiring all or a significant part of the company from considering or proposal that acquisition, even if such third party were prepared to enter into a transaction that would be more favorable to us and our shareholders than the Merger.
Our business and financial results could be adversely impacted during the pendency of the Merger.
The announcement of the proposed Merger, whether or not consummated, may cause disruptions to our business or business relationships and create uncertainty surrounding our ongoing business operations, which could have an adverse impact on our financial condition, results of operations, cash flows and share price, including as a result of the following (all of which could be exacerbated by a delay in completion of the Merger):
• | the attention of our management may be directed to transaction-related considerations and may be diverted from the day-to-day operations of our business; |
• | our employees may experience uncertainty about their future roles with us, which might adversely affect our ability to hire, retain and motivate key personnel and other employees; |
• | our relationships with employees, customers, suppliers, regulators and other third parties with which we maintain business relationships may experience uncertainty prior to the closing of the Merger and seek alternative relationships with third parties or seek to terminate or re-negotiate their relationships with us; and |
• | the Merger Agreement restricts us from engaging in certain actions without the consent of Cintas, which may affect our ability to execute on our business strategies and attain our financial and other goals, including continuing efforts to |
10
transform our business in accordance with strategic goals established by our management and could prevent us from pursuing opportunities that may arise prior to the consummation of the Merger.
In addition, we have incurred, and will continue to incur, significant costs, expenses, and fees for professional services and other transaction costs in connection with the Merger, and many of these fees and costs are payable by us regardless of whether or not the Merger is consummated.
Legal proceedings may be filed against the Board in connection with the Merger, the outcomes of which are uncertain and could delay or prevent the completion of the Merger.
Legal proceedings may be filed by our shareholders against us or our board that challenge the proposed Merger. Among other remedies, these shareholders could seek to enjoin the merger. The outcome of any such litigation is uncertain. Such potential lawsuits could prevent or delay the consummation of the Merger from becoming effective within the anticipated timeframe and may result in substantial costs to us.
We have incurred and will incur direct and indirect costs as a result of the Merger.
We will incur substantial expenses in connection with completing the Merger. A portion of the transaction costs related to the Merger will be incurred regardless of whether the Merger is completed. Many of the expenses that will be incurred, by their nature, are difficult to estimate accurately. These costs could adversely affect our financial condition and results of operation prior to the Merger.
ITEM 1B. | UNRESOLVED STAFF COMMENTS |
None.
ITEM 2. | PROPERTIES |
We occupy approximately 160 facilities located primarily in the United States and Canada. These facilities include our processing, branch, garment manufacturing, distribution and administrative support locations. We clean and supply rental items from approximately 50 facilities located in 40 cities in the United States and 10 cities in Canada. We own approximately 96% of our processing facilities, which average approximately 45,000 square feet in size.
ITEM 3. | LEGAL PROCEEDINGS |
We are involved in a variety of legal actions relating to personal injury, employment, environmental and other legal matters arising in the normal course of business, including, without limitation, those described below.
As part of its general enforcement efforts, over the past four years, the U.S. Department of Labor, Office of Federal Contract Compliance Programs (OFCCP) initiated compliance evaluations at a number of our locations to review and assess our current affirmative action activities and employment practices. To close all outstanding compliance evaluations, we entered into a Conciliation Agreement with the OFCCP agreeing to take proactive efforts to address any remaining issues or concerns that were raised by the agency, none of which we expect will have a material impact on our ongoing operations. All amounts that we agreed to pay under this agreement were within previously established reserves.
We may incur additional charges for environmental remediation for PCE and other contamination at facilities we own that have historically conducted dry cleaning operations. We discuss current environmental reserves in greater detail in Item 1A. Risk Factors and within our critical accounting policies in Item 7. Management's Discussion and Analysis of Financial Condition and Results of Operations and Supplementary Data in Note 12, "Commitments and Contingencies" of Notes to Consolidated Financial Statements.
We cannot predict the ultimate outcome of these or other similar matters with certainty and it is possible that we may incur additional losses in excess of established reserves. However, we believe the possibility of a material adverse effect on our results of ongoing operations or financial condition is remote, although the impact on reported operating results in any particular period may be material.
11
PART II
ITEM 5. | MARKET FOR REGISTRANT'S COMMON STOCK, RELATED STOCKHOLDER MATTERS AND ISSUER PURCHASES OF EQUITY SECURITIES |
Our Class A Common Stock, referred to herein as our "common stock," is quoted on the Global Select Market of The NASDAQ Stock Market LLC under the symbol "GK." The following table sets forth the high and low reported sale prices for the common stock as quoted on the Global Select Market of The NASDAQ Stock Market LLC, for the periods indicated.
High | Low | ||||||
Fiscal 2016 | |||||||
1st Quarter | $ | 72.89 | $ | 64.15 | |||
2nd Quarter | 72.10 | 61.17 | |||||
3rd Quarter | 73.34 | 51.94 | |||||
4th Quarter | 77.66 | 69.76 | |||||
Fiscal 2015 | |||||||
1st Quarter | $ | 57.85 | $ | 47.40 | |||
2nd Quarter | 72.54 | 53.62 | |||||
3rd Quarter | 74.11 | 65.69 | |||||
4th Quarter | 73.81 | 68.57 | |||||
As of August 23, 2016, we had 645 registered holders of record of our common stock.
We paid quarterly dividends aggregating to $30.4 million and $24.5 million in fiscal years 2016 and 2015, respectively. Dividends per share were $1.48 and $1.24 in fiscal years 2016 and 2015, respectively. We anticipate regular dividends in fiscal year 2017 will total $1.56 per share, or approximately $31.0 million. Our debt agreements contain restrictive covenants, which could limit the amount of cash dividends. See Note 5, "Long-Term Debt" of Notes to Consolidated Financial Statements for further information on our restrictive covenants.
ISSUER PURCHASE OF EQUITY SECURITIES
The table below sets forth information regarding repurchases we made of our common stock during the periods indicated.
Period | Total Number of Shares Purchased | Average Price Paid Per Share | Total Number of Shares Purchased as Part of Publicly Announced Plan | Maximum Dollar Value of Shares that May Yet Be Purchased Under the Plan | ||||||||||
March 27, 2016 - April 30, 2016 | 48,172 | $ | 72.91 | 48,172 | $ | 99,666,774 | ||||||||
May 1, 2016 - May 28, 2016 | 38,761 | $ | 72.58 | 38,761 | $ | 96,853,471 | ||||||||
May 29, 2016 - July 2, 2016 | 37,182 | $ | 75.59 | 37,182 | $ | 94,043,059 | ||||||||
Total | 124,115 | $ | 73.61 | 124,115 | $ | 94,043,059 | ||||||||
In August 2015, our Board of Directors authorized a $100.0 million increase in our share repurchase program, bringing the total amount authorized to $275.0 million as of July 2, 2016. Under this repurchase program, we repurchased 510,841 shares totaling $34.5 million in fiscal year 2016, 266,426 shares totaling $17.6 million in fiscal year 2015 and 204,819 shares totaling $11.7 million in fiscal year 2014. All of these repurchases were in open market transactions. As of July 2, 2016 we had approximately $94.0 million remaining under this authorization.
12
EQUITY COMPENSATION PLAN INFORMATION
The following table sets forth certain information as of July 2, 2016 with respect to equity compensation plans under which securities are authorized for issuance:
Plan Category | Number of Securities to be Issued Upon Exercise of Outstanding Options, Warrants and Rights (A) | Weighted-Average Exercise Price of Outstanding Options, Warrants and Rights (B) | Number of Securities Remaining Available for Future Issuance Under Equity Compensation Plans (Excluding Securities Reflected in Column (A)) | ||||||
Equity compensation plans approved by security holders (1): | |||||||||
Restated Equity Incentive Plan (2013) (2) | 716,188 | $ | 42.94 | 1,206,048 | |||||
Employee Plans (3) | 1,221 | 21.11 | — | ||||||
Total: | 717,409 | $ | 42.90 | 1,206,048 | |||||
Equity compensation plans not approved by security holders: | |||||||||
None | — | — | — | ||||||
Total | 717,409 | $ | 42.90 | 1,206,048 | |||||
(1) | See Note 10, "Stockholders' Equity" of Notes to Consolidated Financial Statements. |
(2) | Our Restated Equity Incentive Plan (2013) was approved at our November 6, 2013 annual meeting of shareholders. The outstanding shares listed for this plan include the initial shares authorized under our 2006 and 2010 Equity Incentive Plans, as well as the additional shares authorized when the restated plan was approved. |
(3) | Includes our 1998 Stock Option and Compensation Plan. |
13
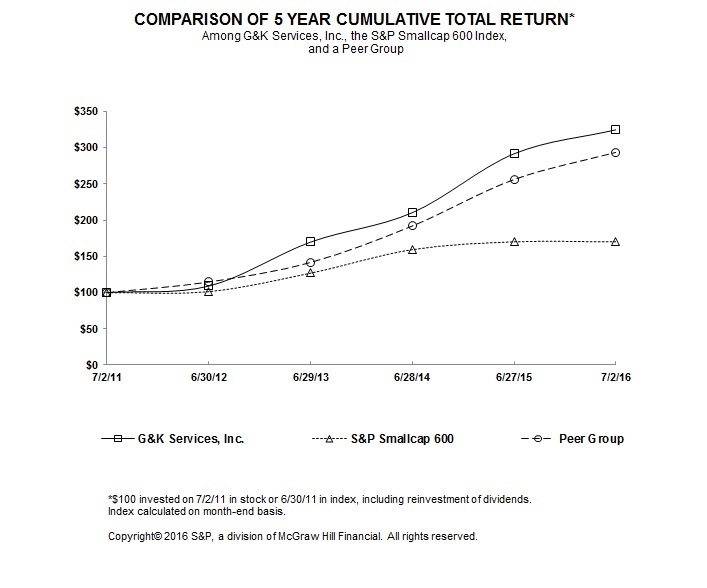
STOCKHOLDER RETURN PERFORMANCE GRAPH
The following graph shows a five-year comparison of the cumulative total return on $100 invested in our common stock, the Standard and Poor’s ("S&P") SmallCap 600 Index and a Peer Group in the uniform services industry, consisting of Cintas Corporation and UniFirst Corporation.
The graph illustrates the cumulative values at the end of each succeeding fiscal year resulting from the change in the stock price, assuming a reinvestment of dividends. Over the five year period, G&K stock grew to $324.70, compared to $170.05 for the S&P SmallCap 600 and $293.56 for the Peer Group.
14
ITEM 6. | SELECTED FINANCIAL DATA |
The following table sets forth certain selected financial data. All amounts are in thousands, except per share data.
2016 | 2015 | 2014 | 2013 | 2012 | |||||||||||||||
(53 weeks) | (52 weeks) | (52 weeks) | (52 weeks) | (52 weeks) | |||||||||||||||
(1) | (2) | (3) | (4) | (5) | |||||||||||||||
Rental and direct sale revenue | $ | 978,041 | $ | 937,642 | $ | 900,869 | $ | 866,018 | $ | 828,953 | |||||||||
Net Income from Continuing Operations | 72,439 | 59,870 | 56,065 | 50,506 | 24,487 | ||||||||||||||
Per Share Data: | |||||||||||||||||||
Basic earnings per share from continuing operations | 3.65 | 3.01 | 2.83 | 2.62 | 1.32 | ||||||||||||||
Diluted earnings per share from continuing operations | 3.61 | 2.95 | 2.78 | 2.58 | 1.31 | ||||||||||||||
Dividends per share: | |||||||||||||||||||
Regular | 1.480 | 1.240 | 1.080 | 0.780 | 0.585 | ||||||||||||||
Special | — | — | 6.00 | — | 6.00 | ||||||||||||||
Total Assets | 921,537 | 928,197 | 923,519 | 897,286 | 873,731 | ||||||||||||||
Long-Term Debt | 231,148 | 243,600 | 266,230 | 175,000 | 218,018 | ||||||||||||||
Stockholders' Equity | 389,540 | 394,350 | 374,044 | 467,008 | 403,059 | ||||||||||||||
We utilize a 52 or 53 week fiscal year ending on the Saturday nearest June 30.
(1) | Fiscal year 2016 was a 53 week year, all other fiscal years presented above were 52 weeks. |
(2) | Fiscal year 2015 includes a pretax charge of $6.5 million associated with the withdrawal from several multi-employer pension plans and a pretax charge of $3.9 million associated with the environmental reserves established. Total assets reflects the retrospective adoption of a new accounting pronouncement which, among other things, requires deferred tax assets and liabilities to be combined and presented as noncurrent in our Consolidated Balance Sheets. See Note 1, "Summary of Significant Accounting Policies" of Notes to Consolidated Financial Statements for further information about prior year reclassifications. |
(3) | Fiscal year 2014 includes a pretax charge of $9.9 million associated with the withdrawal from several multi-employer pension plans and a pretax loss of $12.8 million on the divestiture of our Direct Sale Program Business and our Ireland Business, offset by the benefit of the change in estimated merchandise in-service amortization lives of $6.1 million. |
(4) | Fiscal year 2013 includes net pretax charges of $8.2 million related to restructuring and impairment charges and an increase in our estimated liability associated with the exit of a multi-employer pension plan, offset by the benefit of the change in estimated merchandise in-service amortization lives. |
(5) | Fiscal year 2012 includes a pretax charge of $24.0 million associated with withdrawing from a multi-employer pension plan. |
ITEM 7. | MANAGEMENT’S DISCUSSION AND ANALYSIS OF FINANCIAL CONDITION AND RESULTS OF OPERATIONS |
The following discussion and analysis should be read in conjunction with the Consolidated Financial Statements and related notes thereto which are included herein. We utilize a 52 or 53 week fiscal year ending on the Saturday nearest June 30. Fiscal year 2016 was a 53 week year. Fiscal years 2015 and 2014 were 52 week years.
Overview
G&K Services, Inc., founded in 1902 and headquartered in Minnetonka, Minnesota, is a service-focused provider of branded uniform and facility services programs. We deliver value to our customers by enhancing their image and brand, and by promoting workplace safety, security and cleanliness. We accomplish this by providing a wide range of workwear and protective safety apparel through rental and direct purchase programs. We also supply a variety of facility products and services, including floor mats, towels, mops, restroom hygiene products, and first aid supplies.
We operate our business by executing a business strategy called our Game Plan, which is focused on delivering superior customer service and a commitment to operational excellence. Our Game Plan has four elements:
1. Keep our customer promise
2. Accelerate focused growth
3. Drive operational excellence, and
15
4. Strengthen our high performing team
Executing this strategy has led to significant improvement in our business performance and financial results, including solid organic revenue growth, expanded operating margins, and strong cash flows.
We use several financial metrics to measure the progress of our strategy. Our primary focus is on improving profitability, which we measure using operating income margin, and return on invested capital ("ROIC"), which we define as annualized adjusted income from operations after tax, divided by the sum of total debt less cash, plus stockholders’ equity. We are also focused on driving revenue growth, measured primarily using the organic growth rate, which is calculated using revenue, adjusted for foreign currency exchange rate differences, acquisitions, and divestitures. Finally, we strive to maximize cash flow provided by operating activities. In August 2015, we introduced a new set of financial goals for the company, called our 15/5 Goals. These goals call for the company to achieve 15% operating margin and 15% ROIC, along with 5% or greater average revenue growth by the end of fiscal year 2019.
Our industry continues to consolidate as many family-owned, local operators and regional companies have been acquired by larger providers. We have participated in this consolidation with an acquisition strategy focused on expanding our geographic presence and/or expanding our local market share in order to further leverage our existing production facilities. We remain active in evaluating select acquisitions that would strengthen our business.
Our operating results are affected by the volatility in key input costs, especially cotton, polyester, crude oil and foreign currency exchange rates, which may contribute to significant changes in merchandise, labor and energy costs.
We periodically adjust our operations to serve our customers in the most efficient and cost effective manner. As part of these adjustments, we may realign our workforce, close production or branch facilities or divest operations. We are continuously assessing our business and making necessary adjustments.
In the second quarter of fiscal year 2014, we divested our Ireland Business and in the third quarter of fiscal year 2014, we sold our Direct Sale Program Business. These divestitures have been reflected as Discontinued Operations in our Consolidated Statements of Operations. See Note 14, "Discontinued Operations" of Notes to Consolidated Financial Statements for additional information.
Critical Accounting Policies
The discussion of the financial condition and results of operations are based upon the Consolidated Financial Statements, which have been prepared in conformity with United States Generally Accepted Accounting Principles ("GAAP"). As such, management is required to make certain estimates, judgments and assumptions that are believed to be reasonable based on the information available. These estimates and assumptions affect the reported amount of assets and liabilities, revenues and expenses, and disclosure of contingent assets and liabilities at the date of the financial statements. Actual results may differ from these estimates under different assumptions or conditions.
Critical accounting policies are defined as the most important and pervasive accounting policies used, areas most sensitive to material changes from external factors and those that are reflective of significant judgments and uncertainties. See Note 1, "Summary of Significant Accounting Policies" of Notes to Consolidated Financial Statements for additional discussion of the application of these and other accounting policies.
Revenue Recognition and Allowance for Doubtful Accounts
Our rental operations business is largely based on written service agreements whereby we agree to pick up soiled merchandise, launder and then deliver clean uniforms and other products. The service agreements generally provide for weekly billing upon completion of the laundering process and delivery to the customer. Accordingly, we recognize revenue from rental operations in the period in which the services are provided. Revenue from rental operations also includes billings to customers for lost or damaged merchandise. Direct sale revenue is recognized in the period in which the product is shipped. Total revenues do not include sales tax as we consider ourselves a pass-through conduit for collecting and remitting sales tax.
Estimates are used in determining the collectability of accounts receivable. Management analyzes specific accounts receivable and historical bad debt experience, customer credit worthiness, current economic trends and the age of outstanding balances when evaluating the adequacy of the allowance for doubtful accounts. Significant management judgments and estimates are used in connection with establishing the allowance in any accounting period. We generally write-off uncollectible accounts receivable after all internal avenues of collection have been exhausted.
Inventory and Merchandise in Service
Inventories are stated at the lower of first-in, first-out cost or market. Merchandise placed in service to support our rental operations is amortized into cost of rental operations over the estimated useful lives of the underlying items, on a straight-line basis, which results in a matching of the cost of the merchandise with the weekly rental revenue generated by the merchandise.
16
Estimated lives of rental merchandise in service range from six months to four years. In establishing estimated lives for merchandise in service, management considers historical experience and the intended use of the merchandise.
We review the estimated useful lives of our in-service inventory assets on a periodic basis or when trends in our business indicate that the useful lives for certain products might have changed. The selection of estimated useful lives is a sensitive estimate in which a change in lives could have a material impact on our results of operations.
We estimate losses related to inventory obsolescence by examining our inventory to determine if there are indicators that carrying values exceed the net realizable value. Significant factors that could indicate the need for inventory write-downs include the age of the inventory, anticipated demand for our products, historical inventory usage, revenue trends and current economic conditions. We believe that adequate adjustments have been made in the Consolidated Financial Statements; however, in the future, product lines and customer requirements may change, which could result in an increase in obsolete inventory reserves or additional inventory impairments.
Environmental Costs
We accrue various environmental related costs, which consist primarily of estimated clean-up costs, fines and penalties, when it is probable that we have incurred a liability and the amount can be reasonably estimated. When a single amount cannot be reasonably estimated but the cost can be estimated within a range, we accrue the minimum estimated amount. This accrued amount reflects our assumptions regarding the nature of the remedy and the outcome of discussions with regulatory agencies. Changes in the estimates on which the accruals are based, including unanticipated government enforcement actions or changes in environmental regulations, could result in higher or lower costs. Accordingly, as investigations and other actions proceed, it is likely that adjustments in our accruals will be necessary to reflect new information. While we cannot predict the ultimate outcome of any of these matters with certainty, we believe the possibility of a material adverse effect on our results of ongoing operations or financial position is remote, although the impact on reported operating results in any particular period may be material.
Accruals for environmental liabilities are included in the "Accrued expenses - Other" and "Other Noncurrent Liabilities" line items in the Consolidated Balance Sheets. The cost of operating and maintaining environmental control equipment is charged to expense in the period incurred.
For additional information see Note 12, "Commitments and Contingencies" of Notes to Consolidated Financial Statements.
Historically, we have borne our property remediation costs as part of our ongoing operations. We evaluate potential environmental liabilities on a regular basis, and are involved in various property remediation efforts. In particular, we have three projects nearing completion, which we expect will be completed within previously established reserves. We also have four other projects on which we are currently working.
As part of our continued efforts on the four projects mentioned above, in the fourth quarter of 2015, we determined it was likely that the parties that were contractually obligated to remediate contamination at three of our previously purchased locations would not be able to continue to meet these obligations because of their respective financial condition. These projects relate to acquisitions which date as far back as the 1970s; the most recent one was in 2007. As a result of the foregoing, we recorded a charge of $3.9 million to increase our remediation-related reserves for these projects to $4.7 million as of June 27, 2015. As of July 2, 2016 our remediation-related reserves is $3.6 million as discussed in Note 12, "Commitments and Contingencies" of Notes to Consolidated Financial Statements.
In order to determine whether any additional exposure for contamination remediation exists, we have conducted environmental assessments on an additional six sites which we acquired that had historical dry cleaning operations. The environmental assessment of four of these sites is complete, with no further action required. Two remain under investigation. With respect to two these sites, while we believe additional costs are probable, they are not yet reasonably estimable. Therefore beyond amounts to cover our ongoing assessments, we have not recorded any reserve for these properties. While such charges may be material, we believe the likelihood that any charges will have a material adverse effect on our results of ongoing operations or financial position is remote, although the impact on reported operating results in any particular period may be material.
Goodwill, Intangible Assets and Other Long-Lived Assets
The fair value of the purchase price of acquisitions in excess of the fair value of the underlying net assets is recorded as goodwill. Non-competition agreements that limit the seller from competing with us for a fixed period of time and acquired customer contracts are stated at fair value upon acquisition and are amortized over the terms of the respective agreements or estimated average life of an account, which ranges from five to 20 years.
We test goodwill for impairment in the fourth quarter of each fiscal year or upon the occurrence of events or changes in circumstances that indicate that the asset might be impaired. We have determined that the reporting units for our goodwill impairment review are our operating segments. Based on this analysis, we have identified two reporting units as of the fiscal year 2016 testing date. Our reporting units are U.S. Rental operations and Canadian Rental operations, with respective goodwill
17
balances of $270.0 million and $54.5 million at July 2, 2016. During fiscal year 2014, we divested our Direct Sales reporting unit. Other than this divestiture, there have been no other changes to our reporting units or in the allocation of goodwill to each respective reporting unit in fiscal years 2016, 2015 or 2014.
In fiscal years 2016, 2015 and 2014, we performed a qualitative assessment to test our reporting units' goodwill for impairment. Based on our qualitative assessment, we determined that it is more likely than not (i.e., a likelihood of more than 50%) that the fair value of all reporting units is greater than their carrying amount and therefore no impairment of goodwill was identified. All goodwill associated with our Direct Sales reporting unit had been previously impaired and written off prior to divestiture. During the second quarter of fiscal year 2014, we recorded an impairment loss related to the divestiture of our Ireland Business of $0.3 million.
Long-lived assets, including definite-lived intangible assets, are reviewed for impairment whenever events or changes in circumstances indicate that the carrying amount of such assets may not be recoverable. Recoverability is measured by comparison of the carrying amount of the asset to the future undiscounted cash flows the asset is expected to generate. If the carrying value is not projected to be recovered by future undiscounted cash flows, the amount of any impairment is measured as the difference between the carrying value and the fair value of the impaired asset. There were no impairment charges for intangible assets in fiscal years 2016, 2015 or 2014.
Future events could cause us to conclude that impairment indicators exist and that goodwill, other intangibles and other long-lived assets associated with acquired businesses are impaired. Any resulting impairment loss could have a material impact on our financial condition and results of operations.
Income Taxes
Provisions for federal, state, and foreign income taxes are calculated based on reported pretax earnings and current tax law. Significant judgment is required in determining income tax provisions and evaluating tax positions. We periodically assess our liabilities and contingencies for all periods that are currently open to examination or have not been effectively settled based on the most current available information. If it is more likely than not that our tax position will be denied, we record our best estimate of the resulting tax liability and any applicable interest and penalties in the Consolidated Financial Statements.
Deferred tax assets and liabilities are recorded for temporary differences between the tax basis of assets and liabilities and their reported amounts in the financial statements, using statutory rates in effect for the year in which the differences are expected to reverse. We present the tax effects of these deferred tax assets and liabilities separately for each major tax jurisdiction. The effect on deferred tax assets and liabilities of a change in tax rates is recognized in the results of operations in the period that the changes are enacted. We record valuation allowances to reduce deferred tax assets when it is more likely than not that some portion of the asset may not be realized. We evaluate our deferred tax assets and liabilities on a periodic basis. We believe that we have adequately provided for our future income tax obligations based upon current facts, circumstances and tax law.
18
Results of Operations
The percentage relationships to revenues of certain income and expense items for the three fiscal years ended July 2, 2016, June 27, 2015 and June 28, 2014, and the percentage changes in these income and expense items between years are presented in the following table:
Percentage of Revenues | Percentage Change | |||||||||||||
Years Ended | Between Years | |||||||||||||
Fiscal 2016 | Fiscal 2015 | Fiscal 2014 | F16 vs. F15 | F15 vs. F14 | ||||||||||
Rental and direct sale revenue | 100.0 | % | 100.0 | % | 100.0 | % | 4.3 | % | 4.1 | % | ||||
Cost of rental and direct sale revenue | 65.8 | 66.2 | 66.0 | 3.5 | 4.4 | |||||||||
Gross margin | 34.2 | 33.8 | 34.0 | 5.8 | 3.5 | |||||||||
Pension withdrawal and associated expenses | — | 0.7 | 1.1 | (100.0 | ) | (34.0 | ) | |||||||
Selling and administrative | 21.7 | 22.3 | 22.2 | 1.7 | 4.4 | |||||||||
Income from continuing operations | 12.5 | 10.8 | 10.7 | 21.2 | 5.3 | |||||||||
Interest expense | 0.7 | 0.8 | 0.7 | (4.2 | ) | 12.9 | ||||||||
Income from continuing operations before income taxes | 11.8 | 10.0 | 10.0 | 23.1 | 4.8 | |||||||||
Provision for income taxes | 4.4 | 3.6 | 3.7 | 26.8 | 1.4 | |||||||||
Net income from continuing operations | 7.4 | 6.4 | 6.2 | 21.0 | 6.8 | |||||||||
Net income (loss) from discontinued operations | — | — | (0.9 | ) | ||||||||||
Net income | 7.4 | % | 6.4 | % | 5.3 | % | 21.0 | % | 25.6 | % | ||||
Fiscal Year 2016 Compared to Fiscal Year 2015
Rental and Direct Sale Revenue. Total revenues in fiscal year 2016 increased 4.3% to $978.0 million from $937.6 million in fiscal year 2015. Our organic growth rate was 4.0% and was driven by new account sales during the year and higher pricing, offset by the negative impact of lost uniform wearers at existing customers, primarily in the oil and gas and related industries, an increase in lost customers and slower growth in merchandise recovery billings. The fourth quarter of fiscal year 2016 was the sixth consecutive quarter where we have experienced wearer losses, including significant wearer losses in the oil and gas and related industries. We cannot predict whether wearer losses will continue in the oil and gas and related industries or as a result of general changes in economic factors. A continuation of this trend would negatively affect our revenue and results of operations. In addition to our organic growth, fiscal year 2016 included an extra week (53rd week) of results due to the timing of our fiscal year end, which contributed an additional 2.0% to our revenue growth rate for the year. A small acquisition also added approximately 0.2%. These increases were offset by the negative impact of foreign currency translation rates, which reduced our revenue growth by approximately 1.9%. Our organic rental growth rate is calculated using rental and direct sale revenue, adjusted to exclude the impact of foreign currency exchange rate changes, the 53rd week, divestitures and acquisitions. We believe that the organic revenue reflects the growth of our existing business and is, therefore, useful in analyzing our financial condition and results of operations. A reconciliation of our organic growth rate to total revenue growth is provided in the table below.
Organic growth rate | 4.0 | % |
Impact of 53rd week | 2.0 | % |
Impact of foreign currency exchange rate changes | (1.9 | )% |
Acquisitions and other | 0.2 | % |
Total revenue growth | 4.3 | % |
Cost of Rental and Direct Sale Revenue. Cost of rental and direct sale revenue, which includes merchandise, production, delivery and cost of direct sale expenses, increased 3.5% to $643.1 million in fiscal year 2016 from $621.1 million in fiscal year 2015. As a percentage of revenue, our gross margin improved 40 basis points to 34.2% in fiscal year 2016 from 33.8% in the prior fiscal year. This improvement was primarily due to lower energy and workers' compensation costs and improved direct sales margins, partially offset by higher merchandise expense.
Pension Withdrawal and Associated Expenses. As discussed in Note 8, "Employee Benefit Plans" of Notes to Consolidated Financial Statements, we recorded total charges of $6.5 million in fiscal year 2015 related to the withdrawal from certain United States multi-employer pension plans ("MEPPs"). There were no similar charges in fiscal year 2016.
19
Selling and Administrative. Selling and administrative expenses increased 1.7% to $212.3 million in fiscal year 2016 from $208.8 million in fiscal year 2015. Fiscal year 2015 included a $3.9 million increase to our environmental remediation liability as discussed in Note 12, "Commitments and Contingencies" of Notes to Consolidated Financial Statements. Excluding this item, as a percentage of revenue, our selling and administrative expenses decreased from 22.3% in fiscal year 2015 to 21.7% in fiscal year 2016. The decrease as a percentage of revenue was primarily due to effective cost control as we leveraged our fixed costs over a higher revenue base, partially offset by higher selling, bad debt and depreciation expense.
Income from Continuing Operations. The following is a summary of each operating segment's income from operations (in thousands):
For the Fiscal Years | |||||||||||
2016 | 2015 | Change | |||||||||
United States | $ | 106,013 | $ | 85,207 | $ | 20,806 | |||||
Canada | 16,627 | 16,007 | 620 | ||||||||
Total | $ | 122,640 | $ | 101,214 | $ | 21,426 | |||||
United States. Income from operations increased $20.8 million to $106.0 million in fiscal year 2016 from $85.2 million in fiscal year 2015. The prior year operating income included a $6.5 million charge to increase our previously recorded MEPP withdrawal liability and a $3.9 million charge related to an increase in our environmental remediation liability. Excluding these items, income from operations increased $10.4 million. The increase was primarily driven by additional income from increased revenue, including the 53rd week, the favorable impact of fixed costs absorbed over a higher revenue base and lower energy, workers' compensation and vehicle leasing costs. These improvements were partially offset by higher merchandise, bad debt and selling expenses.
Canada. Income from operations increased approximately $0.6 million to $16.6 million in fiscal year 2016 from $16.0 million in fiscal year 2015. The increase was primarily driven by additional income from increased revenue, including the 53rd week, and lower delivery labor, energy and selling expenses. These favorable items were partially offset by a decline in the Canadian foreign exchange rate and higher merchandise expense and corporate allocations.
Interest Expense. Interest expense was $6.8 million in fiscal year 2016 compared to $7.1 million in fiscal year 2015. The decreased interest expense was due to both lower average debt balances and lower average effective interest rates.
Provision for Income Taxes. Our effective tax rate for fiscal year 2016 increased to 37.4% from 36.4% in fiscal year 2015. The current period tax rate is higher than the prior year period due to resolution of the fiscal years 2005 to 2007 transfer pricing audit and expiration of certain tax statutes of limitations in fiscal year 2015, which allowed us to reduce our uncertain tax position accruals.
Fiscal Year 2015 Compared to Fiscal Year 2014
Rental and Direct Sale Revenue. Total revenues in fiscal year 2015 increased 4.1% to $937.6 million from $900.9 million in fiscal year 2014. Our organic growth rate was 5.6% compared to 4.5% in the prior fiscal year. The improvement in the rental organic growth rate from fiscal year 2014 was primarily due to record new account sales in fiscal year 2015, pricing and an increase in direct sales revenue. These increases were offset by the negative impact of foreign currency translation rates. Our organic rental growth rate is calculated using rental revenue, adjusted to exclude the impact of foreign currency exchange rate changes, divestitures and acquisitions. We believe that the organic rental revenue reflects the growth of our existing rental business and is, therefore, useful in analyzing our financial condition and results of operations. A reconciliation of our organic growth rate to total revenue growth is provided in the table below.
Organic growth rate | 5.6 | % |
Impact of foreign currency exchange rate changes | (1.4 | )% |
Other changes | (0.1 | )% |
Total revenue growth | 4.1 | % |
Cost of Rental and Direct Sale Revenue. Cost of rental and direct sale revenue, which includes merchandise, production, delivery and cost of direct sale expenses, increased 4.4% to $621.1 million in fiscal year 2015 from $595.0 million in fiscal year 2014. As a percentage of rental revenue, our gross margin declined to 33.8% in fiscal year 2015 from 34.0% in the prior fiscal year. Cost of rental and direct sale revenue in fiscal year 2014 was favorably impacted by $6.1 million, or 0.7% of revenue due to the change in the estimated useful lives for certain in-service merchandise assets, as discussed in Note 1, "Summary of Significant Accounting Policies - Inventory and Merchandise in Service" of Notes to Consolidated Financial Statements. Excluding this item, gross margin was 33.3% in fiscal year 2014 and fiscal year 2015 represented an improvement
20
of 0.5%. This improvement was primarily due to the favorable impact of fixed costs absorbed over a higher revenue base, improved productivity in our laundry operations, lower energy costs and improved direct sales margins. These favorable items were partially offset by higher merchandise and employee health insurance costs.
Pension Withdrawal and Associated Expenses. As discussed in Note 8, "Employee Benefit Plans" of Notes to Consolidated Financial Statements, we recorded total charges to increase our previously recorded MEPP withdrawal liability of $6.5 million and $9.9 million in fiscal year 2015 and fiscal year 2014, respectively, related to the withdrawal from certain United States MEPPs.
Selling and Administrative. Selling and administrative expenses increased to $208.8 million in fiscal year 2015 from $199.9 million in fiscal year 2014. As a percentage of total revenues, selling and administrative expenses increased to 22.3% in fiscal year 2015 from 22.2% in fiscal year 2014. Fiscal year 2015 included a $3.9 million increase to our environmental remediation liability as discussed in Note 12, "Commitments and Contingencies" of Notes to Consolidated Financial Statements. Excluding this item, our selling and administrative expenses decreased 0.3% to 21.9%. The decrease was primarily driven by improvements resulting from effective cost control as we leveraged our fixed costs over a higher revenue base.
Income from Continuing Operations. The following is a summary of each operating segment's income from operations (in thousands):
For the Fiscal Years | |||||||||||
2015 | 2014 | Change | |||||||||
United States | $ | 85,207 | $ | 79,290 | $ | 5,917 | |||||
Canada | 16,007 | 16,825 | (818 | ) | |||||||
Total | $ | 101,214 | $ | 96,115 | $ | 5,099 | |||||
United States. Income from operations increased $5.9 million to $85.2 million in fiscal year 2015 from $79.3 million in fiscal year 2014. The operating income in fiscal year 2015 included the impact of a $6.5 million charge to increase our previously recorded MEPP withdrawal liability and $3.9 million charge related to an increase in our environmental remediation liability and the prior year included a $5.3 million benefit from the change in merchandise lives previously reported and additional expense of $9.9 million associated with our MEPP withdrawal liability. Excluding these items, income from operations increased $11.7 million. The increase was primarily driven by additional income from increased revenue, lower energy costs, productivity improvements in our laundry and delivery operations and improved direct sales margins. These improvements were partially offset by higher workers' compensation and employee health insurance expenses.
Canada. Income from operations decreased approximately $0.8 million to $16.0 million in fiscal year 2015 from $16.8 million in fiscal year 2014. The prior year operating income included a $0.8 million benefit from the change in merchandise lives previously reported. Excluding this item, income from operations was flat. Additional income from increased revenue, improved productivity in our laundry operations, lower vehicle maintenance costs and lower energy costs were offset by a significant decline in the Canadian foreign exchange rate, increased selling costs and corporate allocations.
Interest Expense. Interest expense was $7.1 million in fiscal year 2015 compared to $6.3 million in fiscal year 2014. The increased interest expense was due to higher average debt balances resulting from the payment of the special dividend in the fourth quarter of fiscal year 2014, partially offset by lower average interest rates.
Provision for Income Taxes. Our effective tax rate for fiscal year 2015 decreased to 36.4% from 37.6% in fiscal year 2014. The fiscal year 2015 tax rate was lower than the fiscal year 2014 rate due to resolution of the fiscal year 2005 to 2007 transfer pricing audit and expiration of certain tax statutes of limitations.
Discontinued Operations. In the second quarter of fiscal year 2014, we divested our Ireland Business and in the third quarter of fiscal year 2014, we sold our Direct Sale Program Business. These businesses have been reflected as discontinued operations in our Consolidated Statements of Operations. The pretax loss recognized in fiscal year 2014 includes the loss on sale of $12.8 million and a loss from the discontinued operations of $0.3 million and has been reclassified from continuing operations to discontinued operations. See Note 14, "Discontinued Operations" of Notes to Consolidated Financial Statements for additional information.
Liquidity, Capital Resources and Financial Condition
Financial Condition. Our financial condition is strong. In assessing our financial condition, we primarily consider working capital, cash flows provided by operations, capital expenditures, and debt service obligations. We continue to fund our operations through a combination of cash flow provided by operations and debt financing. We believe we have sufficient access to capital markets to fund our operations.
21
Our primary sources of cash are net cash flows from operations and borrowings under our debt arrangements. Primary uses of cash are working capital needs, capital expenditures, acquisitions, dividends, share repurchases, payments on indebtedness and general corporate purposes.
Adjusted Working Capital
For the Fiscal Years Ended | |||||||||||
July 2, 2016 | June 27, 2015 | Change | |||||||||
Accounts receivable, net | $ | 102,657 | $ | 100,402 | $ | 2,255 | |||||
Inventory | 34,077 | 36,258 | (2,181 | ) | |||||||
Merchandise in service, net | 131,801 | 133,942 | (2,141 | ) | |||||||
Accounts payable | (44,792 | ) | (51,616 | ) | 6,824 | ||||||
Adjusted Working Capital | $ | 223,743 | $ | 218,986 | $ | 4,757 | |||||
Adjusted working capital at July 2, 2016 was $223.7 million, a $4.8 million increase from $219.0 million at June 27, 2015. The increase in adjusted working capital was primarily due to a decrease in accounts payable, partially resulting from the timing of our fiscal year end. This increase was partially offset by a decrease in inventory resulting from increased inventory turns and a decrease in merchandise in service to support our rental operations.
Operating Activities. Net cash provided by operating activities was $134.2 million, $94.2 million and $74.6 million in fiscal years 2016, 2015 and 2014, respectively. Cash provided by operations in fiscal year 2016 increased primarily due to higher net income, improved utilization of merchandise in service, lower income tax payments and lower multi-employer pension plan withdrawal payments. Cash provided by operations in fiscal year 2015 increased primarily due to a decrease in working capital requirements to support our revenue growth and lower income tax payments, partially offset by lower MEPP settlement payments.
Investing Activities. Net cash used for investing activities was $48.3 million, $55.8 million and $26.1 million in fiscal years 2016, 2015 and 2014, respectively. The decrease in fiscal year 2016 compared to fiscal year 2015 was primarily due to a decrease in capital expenditures related to information systems and capacity expansion, offset by a small acquisition completed in fiscal year 2016. The increase in fiscal year 2015 compared to fiscal year 2014 was primarily due to an increase in capital expenditures in fiscal year 2015 related to information systems and capacity expansion initiatives and the business divestitures in fiscal year 2014.
Financing Activities. Net cash used for financing activities was $77.6 million, $55.9 million and $49.7 million in fiscal years 2016, 2015 and 2014, respectively. Cash used for financing activities in fiscal year 2016 was primarily due to repayment of our variable rate notes, payments of dividends and share repurchases. This was offset by borrowings under our revolving credit facility. Cash used for financing activities in fiscal year 2015 was primarily for the repayment of borrowings under our revolving credit facility, payment of dividends and share repurchases. Cash used for financing activities in fiscal year 2014 was primarily for payments of dividends, including our special dividend of $6.00 per share, and share repurchases. This was offset by borrowings under our revolving credit facility and proceeds from the issuance of common stock under stock option plans. The borrowings under our revolving credit facility were primarily used to fund the $6.00 per share special dividend. We paid dividends of $30.4 million, $24.5 million and $140.9 million in fiscal years 2016, 2015 and 2014, respectively. Dividends per share were $1.48, $1.24 and $7.08 in fiscal years 2016, 2015 and 2014, respectively. In fiscal year 2017, we anticipate regular cash dividends of $1.56 per share, totaling approximately $31.0 million.
Capital Structure. Total debt was $231.1 million at July 2, 2016, a decrease of $12.6 million from the prior year balance of $243.8 million. The decrease in debt was primarily driven by strong cash flows from operating activities. The ratio of debt to capitalization (total debt divided by the sum of the stockholders' equity plus total debt) decreased to 37.2% at July 2, 2016, from 38.2% at June 27, 2015.
We believe we will be able to fund future cash requirements for fiscal year 2017, including scheduled debt repayments, new investments in the business, dividend payments and possible business acquisitions, from operating cash flow and our revolving credit facility.
The credit facilities, loan agreements, fixed rate notes and variable rate notes contain various restrictive covenants that, among other matters, require us to maintain a minimum interest coverage ratio and a maximum leverage ratio. These debt arrangements also contain customary representations, warranties, covenants and indemnifications. At July 2, 2016, we were in compliance with all debt covenants and we believe only a material adverse change in our financial performance and condition could result in a potential event of default under the covenants associated with this facility. In the unlikely situation that an event of default would be imminent, we believe that we would be able to successfully negotiate amended covenants or obtain
22
waivers; however, certain financial concessions might be required. Our results of operations and financial condition could be adversely affected if amended covenants or waivers on acceptable terms could not be successfully negotiated.
Customary interim operating covenants in the Merger Agreement (as defined above) restrict us from incurring certain forms of indebtedness during the pendency of the Merger, subject to certain exceptions. Refer to Exhibit 2.1 to our Current Report on Form 8-K filed with the Securities and Exchange Commission on August 16, 2016 for more information.
See Note 5, "Long-Term Debt" of Notes to Consolidated Financial Statements for details of our long-term debt.
See Note 6, "Derivative Financial Instruments," of Notes to Consolidated Financial Statements for details of our interest rate swap and hedging activities related to our outstanding debt.
Cash Obligations. Under various agreements, we are obligated to make future cash payments in fixed amounts. These include payments under the revolving credit facility, capital lease obligations and payments required under operating leases with initial or remaining terms in excess of one year.
The following table summarizes our cash payment obligations as of July 2, 2016 for the next five fiscal years and thereafter (in thousands):
Less than one year | One to three years | Three to five years | After five years | Total | |||||||||||||||
Borrowings under Unsecured Revolver | $ | — | $ | — | $ | 107,600 | $ | — | $ | 107,600 | |||||||||
Borrowings under A/R Line | 23,548 | — | — | — | 23,548 | ||||||||||||||
Borrowings under Fixed Rate Notes | — | — | — | 100,000 | 100,000 | ||||||||||||||
Operating leases | 24,179 | 33,221 | 18,760 | 10,460 | 86,620 | ||||||||||||||
Multi-employer pension plan payments | 803 | — | — | — | 803 | ||||||||||||||
Purchase commitments | 2,133 | 295 | — | — | 2,428 | ||||||||||||||
Estimated interest payments related to long-term debt and interest rate swap | 7,009 | 13,882 | 11,765 | 24,575 | 57,231 | ||||||||||||||
Total contractual cash obligations | $ | 57,672 | $ | 47,398 | $ | 138,125 | $ | 135,035 | $ | 378,230 | |||||||||
We have a $50.0 million accounts receivable securitization facility, which expires on September 27, 2016 with $23.5 million outstanding as of July 2, 2016. We intend to refinance these borrowings on or before the expiration date or pay the outstanding balance using our Unsecured Revolver. See Note 5, "Long-Term Debt" of Notes to Consolidated Financial Statements for further discussion.
Retirement benefit payments include the lump sum pension payments of $17.2 million expected to be paid in the first quarter of fiscal year 2017. See Note 15, "Subsequent Events" of the Notes to Consolidated Financial Statements for further discussion.
We calculated the estimated interest payments related to long-term debt and interest rate swap by using the total debt balance outstanding as of July 2, 2016, and applying the interest rates in effect at that time to future periods.
As of July 2, 2016, we had certain interest rate swap agreements outstanding whereby we have limited our exposure to future interest rate increases. See Note 6, "Derivative Financial Instruments," of Notes to Consolidated Financial Statements for further discussion.
As of July 2, 2016, we had approximately $242.4 million of available capacity under our Unsecured Revolver. We anticipate that our cash provided by operations and available capacity under our credit facilities will be sufficient to satisfy our cash commitments and capital requirements for fiscal year 2017. We may utilize borrowings under the revolving credit facility to supplement our cash requirements from time to time.
Investments in our business, including capital expenditures, are our top priority for capital deployment. Accordingly, in fiscal year 2016 we invested $45.0 million in capital expenditures and expect to invest approximately $45.0 million during fiscal year 2017. Capital expenditures have been made in three primary categories: (1) maintenance capital to sustain our facilities and equipment and improve workplace safety; (2) capacity expansion investments to enable revenue growth; and (3) technology investments to enhance our ability to serve customers and improve productivity across our business.
Income Tax Obligations
Gross uncertain tax positions as of July 2, 2016 of $8.0 million are not included in the other long-term obligations table presented above because the timing of the settlement of unrecognized tax benefits cannot be reasonably determined. For further discussion, refer to Note 9, "Income Taxes" of our Notes to Consolidated Financial Statements.
23
Off Balance Sheet Arrangements
At July 2, 2016, we had $26.4 million of stand-by letters of credit that were issued and outstanding, primarily in connection with our property and casualty insurance programs. No amounts have been drawn upon these letters of credit. In addition, we have outstanding operating leases with contractual obligations totaling $86.6 million related to facility, equipment and vehicle leases. We do not utilize special purpose entities to facilitate off-balance sheet financing arrangements.
Pension Obligations
Effective December 31, 2006, we froze our defined benefit pension plan and related supplemental executive retirement plan. Future growth in benefits will not occur beyond this date. We anticipate making cash contributions of approximately $0.9 million in fiscal year 2017.
The calculation of pension expense and the corresponding liability requires the use of a number of critical assumptions, including the expected long-term rate of return on plan assets and the assumed discount rate. Changes in these assumptions can result in different expense and liability amounts, and future actual experience can differ from these assumptions. Pension expense increases as the expected rate of return on pension plan assets decreases. We estimated that the pension plan assets will generate a long-term rate of return of 5.40% in fiscal year 2017. This rate was developed by evaluating input from our outside actuary and reference to historical performance, long-term inflation assumptions and current mix of investments. The expected long-term rate of return on plan assets at July 2, 2016 is based on an allocation of equity and fixed income securities. As part of our assessment of the expected return on plan assets, we considered historical asset performance, the change in our target asset allocation and increases in investments expenses, and concluded that a reduction to our long term rate to from 5.90% to 5.40% was appropriate. Decreasing the expected long-term rate of return by 0.50% (from 5.40% to 4.90%) would increase our estimated fiscal year 2017 pension expense by approximately $0.4 million. Pension liability and future pension expense increase as the discount rate is reduced. We discounted future pension obligations using a rate of 3.95% at July 2, 2016. We determine the discount rate with assistance from our outside actuary by creating a yield curve based on high quality bonds. Decreasing the discount rate by 0.50% (from 3.95% to 3.45%) increases our accumulated benefit obligation at July 2, 2016 by approximately $9.6 million and increases the estimated fiscal year 2017 pension expense by approximately $0.8 million.
Future changes in the expected return on plan asset, assumed discount rates and various other factors related to the participants in our pension plan will impact our future pension expense and liabilities. We cannot predict with certainty what the impact of these factors will be in the future.
In the fourth quarter of fiscal year 2016, in an effort to continue to reduce the risk in the company's Pension Plan, we announced a voluntary, limited-time opportunity to former employees who are vested participants in the Pension Plan to request early payment of their entire Pension Plan benefit in the form of a single lump sum payment. Eligible participants who wished to receive the lump sum payment were required to make an election between May 16, 2016 and July 15, 2016, and payments are scheduled to be made on or before August 31, 2016. All payments will be made from the Pension Plan trust assets. The target population has a total liability of $34.2 million. Based upon the participation rate of eligible participants, the amount of total payments is expected to be approximately $17.2 million. Because of the expected level of payments, settlement accounting rules will apply in the period in which the payments are made. This will result in a plan remeasurement and the recognition of an approximate $6.0 million settlement loss, approximately $0.20 per share, related to the pro-rata portion of the unamortized net actuarial loss which will be recognized in the first quarter of fiscal year 2017.
Multi-Employer Pension Plans
Historically, we participated in a number of collectively bargained, union sponsored multi-employer pension plans ("MEPPs"). Consistent with the accounting for defined contribution plans, we previously recorded the required cash contributions to the MEPPs as an expense in the period incurred and recognized a liability for any contributions due and unpaid. In addition, we were responsible for our proportional share of any unfunded vested benefits related to the MEPPs. An employer's accounting for MEPPs provides that a withdrawal liability should be recorded if circumstances that give rise to an obligation become probable and estimable.
As of July 2, 2016, we have withdrawn from, and no longer participate in any MEPPs in the United States. During fiscal years 2015 and 2014 we recorded total pretax charges related to the exit from all MEPPs of $6.5 million and $9.9 million, there were no charges recorded in 2016. In addition, during fiscal years 2016, 2015 and 2014, we made total payments related to our MEPP liabilities of $8.9 million, $28.9 million and $3.8 million, respectively, including settlement payments of $7.9 million in fiscal year 2016 and $24.8 million in fiscal year 2015. Total remaining reserves for one MEPP as of July 2, 2016 are $0.8 million.
Central States Southeast and Southwest Areas Pension Fund (“Central States Fund”)
Beginning in fiscal year 2012, we commenced negotiations to discontinue our participation in the Central States Fund. We were ultimately successful and withdrew our participation in the Central States Fund in stages as various union contracts expired.
24
On June 11, 2015, we entered into a settlement agreement (the “Settlement Agreement”) with the Central States Fund to resolve matters related to the withdrawal liability and the related arbitration. Pursuant to the Settlement Agreement, we made a lump sum payment to the pension fund in the amount of $24.8 million and agreed to dismiss the arbitration. In addition, the Central States Fund released all claims for collection of the withdrawal liability and related assessments, subject to our representations and warranties regarding contributions to the Central States Fund, related contribution base units and trades or businesses under common control of the company. We funded the payment under the Settlement Agreement through use of existing resources, including our revolving credit facility.
Other United States MEPPs
On December 28, 2015, we entered into a settlement agreement with the National Retirement Fund to resolve matters related to our previous withdrawal. Pursuant to this agreement, we made a lump sum payment to the fund in the amount of $5.4 million. One June 15, 2016, we entered into an agreement with the New England Teamsters and made a lump sum payment of $2.5 million to pay the remaining balance of our withdrawal liability and resolve all remaining outstanding claims to the fund. As part of these settlement agreements, the funds released all claims for collection of the withdrawal liability and related assessments, subject to our representations and warranties regarding contributions to the funds, related contribution base units and trades or businesses under common control of the company. We funded the payments under the settlement agreements through use of existing resources, including available cash and our revolving credit facility. The amount of the settlements were within previously established reserves.
Canadian MEPPs
Our Canadian subsidiaries participate in three multi-employer retirement funds, collectively referred to as the Canadian MEPPs. These plans provide monthly retirement payments on the basis of the credits earned by the participating employees. For two of the plans, in the event that the plans are underfunded, the monthly participant benefit amount can be reduced by the trustees of the plan and we are not responsible for the underfunded status of the plan. For the third plan, employers can be held liable for unfunded liabilities and solvency deficiencies and accrued benefits cannot be reduced if there is a deficit unless the employer is insolvent. With respect to our exposure to the third plan, the most recent actuarial valuation as of December 31, 2014 indicates a surplus of approximately 18%.
Impact of Inflation
In general, we believe that our results of operations are not significantly affected by moderate changes in the inflation rate. Historically, we have been able to manage the impacts of more significant changes in inflation rates through our customer relationships and a continued focus on operational productivity improvements. Our customer agreements generally provide for annual price increases.
Significant changes in energy costs, specifically natural gas and motor fuels, and other commodities, can materially affect our results of operations and financial condition. In fiscal year 2016, energy costs, which primarily consist of natural gas and electricity to power our production operations and motor fuel used in our fleet and is approximately 2.9% of our total revenue.
Proposed Merger with Cintas Corporation
On August 15, 2016, we entered into an Agreement and Plan of Merger (the “Merger Agreement”) with Cintas Corporation (“Cintas”) and Bravo Merger Sub, Inc., a wholly owned subsidiary of Cintas (“Merger Sub”). The Merger Agreement was unanimously (by those present) approved by the Board of each company and is currently expected to close within 4-6 months, subject to customary closing conditions, including regulatory approvals and approval by our shareholders.
The Merger Agreement provides that, among other things and subject to the terms and conditions of the Merger Agreement, Merger Sub will be merged with and into the company (the “Merger”), with the company surviving and continuing as the surviving corporation in the Merger as a wholly owned subsidiary of Cintas, and, at the effective time of the Merger, each outstanding share of Class A common stock of the company will be converted into the right to receive the Merger Consideration. The “Merger Consideration” means $97.50 per share in cash. The value of the transaction is approximately $2.2 billion, including net debt. The Merger Agreement contains customary representations and warranties and covenants that we must observe, including certain interim operating covenants that may restrict our operations during the pendency of the Merger, subject to certain exceptions. If the Merger proceeds, certain change of control and severance provisions of our compensation arrangements will be triggered at the time of the Merger. In addition, the Merger Agreement also contains certain termination rights that may require us to pay Cintas a $60 million termination fee. For additional details of the Merger and the terms thereof, refer to the Merger Agreement, a copy of which is included as Exhibit 2.1 to our Current Report on Form 8-K filed with the Securities and Exchange Commission on August 16, 2016 and is incorporated by reference herein.
We did not incur any material expenses in connection with the Merger during our fiscal year ended July 2, 2016.
25
ITEM 7A. | QUANTITATIVE AND QUALITATIVE DISCLOSURES ABOUT MARKET RISK |
We are exposed to market risks. Market risk is the potential loss arising from adverse changes in interest rates, energy prices and foreign currency exchange rates. We do not enter into derivative or other financial instruments for speculative purposes.
Interest Rate Risk
We are subject to market risk exposure related to changes in interest rates. We use financial instruments, such as interest rate swap agreements, to manage interest rate risk on our variable rate debt. Under these arrangements, we agree to exchange, at specified intervals, the difference between fixed and floating interest amounts, calculated by reference to an agreed upon notional principal amount. Interest rate swap agreements are entered into for periods consistent with related underlying exposures and do not constitute positions independent of those exposures. The estimated exposure considers the mitigating effects of interest rate swap agreements outstanding at July 2, 2016 on the change in the cost of variable rate debt. The current fair market value of all outstanding contracts at July 2, 2016 was an unrealized loss of $8.2 million.
A sensitivity analysis was performed, using two scenarios, to measure our interest rate risk over a one-year period to changes in market interest rates for forecasted variable rate debt that was not modified by interest rate swaps. As of July 2, 2016, this debt amount was $56.1 million. In one scenario we measured the sensitivity to interest expense with an immediate 50 basis point change in market interest rates and in the other scenario the impact of a 50 basis point change distributed evenly throughout the year. Based on the forecasted average variable rate debt level, the forecasted annual expense for our variable rate debt is $2.0 million. The scenario with an immediate 50 basis point change would increase or decrease forecasted interest by $0.3 million or 13.9%. The scenario that distributes the 50 basis point change would increase or decrease interest expense by $0.2 million or 8.8%.
For additional information regarding our debt see Note 5, "Long-Term Debt" of Notes to Consolidated Financial Statements as well as the Liquidity, Capital Resources and Financial Condition section of Item 7. Management's Discussion and Analysis of Financial Condition and Results of Operations.
Energy Cost Risk
We are subject to market risk exposure related to changes in energy costs. To manage this risk, from time to time we have utilized derivative financial instruments to mitigate the impact of motor fuel cost volatility on our future financial results. As of July 2, 2016, we have no outstanding derivative financial instruments related to motor fuels.
We performed an analysis to measure the sensitivity of our energy costs to changes in the prices of motor fuels. The analysis used motor fuel prices at July 2, 2016 and forecasted purchases over the next 12 months. For each one percentage point increase or decrease in motor fuel prices under these assumptions, our motor fuel costs would change by approximately $0.1 million.
Production costs at our plants are also subject to fluctuations in natural gas costs. To reduce our exposure to changes in natural gas prices, we utilize natural gas supply contracts in the normal course of business. These contracts meet the definition of "normal purchase" and, therefore, are not considered derivative instruments for accounting purposes.
Foreign Currency Exchange Risk
Our only material foreign subsidiaries are located in Canada. The assets and liabilities of these subsidiaries are denominated in the Canadian dollar and, as such, are translated into U.S. dollars at the exchange rate in effect at the balance sheet date. Results of operations are translated using the average exchange rates throughout the period. The effect of exchange rate fluctuations on translation of assets and liabilities are recorded as a component of stockholders' equity and are included in the "Accumulated other comprehensive income" line item of the Consolidated Balance Sheets. Gains and losses from foreign currency transactions are included in results of operations.
26
ITEM 8. | FINANCIAL STATEMENTS AND SUPPLEMENTARY DATA |
Following is a summary of the results of operations for each of the quarters within the fiscal years ended July 2, 2016 and June 27, 2015. All amounts are in thousands, except per share data.
QUARTERLY FINANCIAL DATA
G&K Services, Inc. and Subsidiaries
(Unaudited) | First | Second | Third | Fourth | |||||||||||
2016 | |||||||||||||||
Revenues | $ | 237,171 | $ | 243,060 | $ | 239,307 | $ | 258,503 | |||||||
Gross Profit | 81,083 | 83,030 | 81,721 | 89,140 | |||||||||||
Income from Continuing Operations | 27,878 | 31,484 | 30,360 | 32,918 | |||||||||||
Net Income | 16,263 | 18,493 | 17,854 | 19,829 | |||||||||||
Basic Earnings per Share | 0.81 | 0.93 | 0.90 | 1.01 | |||||||||||
Diluted Earnings per Share | 0.80 | 0.92 | 0.89 | 1.00 | |||||||||||
Dividends per Share | 0.37 | 0.37 | 0.37 | 0.37 | |||||||||||
2015 | |||||||||||||||
Revenues | $ | 230,242 | $ | 237,309 | $ | 233,514 | $ | 236,577 | |||||||
Gross Profit | 78,790 | 80,316 | 78,941 | 78,460 | |||||||||||
Income from Continuing Operations | 26,850 | 28,624 | 21,601 | 24,139 | |||||||||||
Net Income | 16,368 | 16,953 | 12,429 | 14,120 | |||||||||||
Basic Earnings per Share | 0.82 | 0.85 | 0.62 | 0.72 | |||||||||||
Diluted Earnings per Share | 0.81 | 0.83 | 0.61 | 0.71 | |||||||||||
Dividends per Share | 0.31 | 0.31 | 0.31 | 0.31 | |||||||||||
We utilize a 52-53 week fiscal year ending on the Saturday nearest June 30. Fiscal year 2016 was a 53 week year with the extra week reported in the fourth quarter, and fiscal year 2015 was a 52 week year. The extra week in the fourth quarter contributed an additional $18.5 million of revenue with a corresponding increase in the earnings per share.
The third quarter of fiscal year 2015 includes a pretax charge of $6.5 million associated with withdrawing from a multi-employer pension plan (see Note 8, "Employee Benefit Plans" of Notes to Consolidated Financial Statements for further information). The fourth quarter of fiscal year 2015 includes a pretax charge of $3.9 million to increase our environmental remediation liability (see Note 12, "Commitments and Contingencies" of Notes to Consolidated Financial Statements for further information).
27
Management's Report on Internal Control Over Financial Reporting
Our management is responsible for establishing and maintaining adequate internal control over financial reporting for G&K Services, Inc. ("the Company") as defined in Rule 13a-15(f) under the Securities Exchange Act of 1934. Our internal control over financial reporting was designed under the supervision of the Company's principal executive officer, principal financial officer and other members of management, and effected by the Company's Board of Directors, to provide reasonable assurance regarding the reliability of financial reporting and the preparation and presentation of financial statements for external purposes in accordance with generally accepted accounting principles in the United States.
Our management completed an assessment of the Company's internal control over financial reporting. This assessment was based on the criteria set forth by the Committee of Sponsoring Organizations of the Treadway Commission ("COSO") in Internal Control-Integrated Framework (2013). Based on this assessment, management has concluded that our internal control over financial reporting was effective as of July 2, 2016.
KPMG LLP, the Company's independent registered public accounting firm that audited the fiscal year 2016 consolidated financial statements and schedule and the effectiveness of the Company's internal control over financial reporting as of July 2, 2016, has issued an unqualified attestation report on the Company's effectiveness of internal control over financial reporting, as stated in its report which is included herein.
Any internal control system over financial reporting, no matter how well conceived and operated, has inherent limitations. As a result, even those systems determined to be effective can provide only reasonable, not absolute, assurance that the control objectives over the reliability of financial reporting and preparation and presentation of financial statements for external purposes in accordance with generally accepted accounting principles in the United States are met.
/s/ Douglas A. Milroy |
Douglas A. Milroy |
Chairman and Chief Executive Officer |
(Principal Executive Officer) |
/s/ Tracy C. Jokinen |
Tracy C. Jokinen |
Chief Financial Officer |
(Principal Financial Officer) |
August 26, 2016
28
Report of Independent Registered Public Accounting Firm
The Board of Directors and Stockholders
G&K Services, Inc.:
We have audited G&K Services, Inc.’s internal control over financial reporting as of July 2, 2016, based on criteria established in Internal Control - Integrated Framework (2013) issued by the Committee of Sponsoring Organizations of the Treadway Commission (COSO). G&K Services, Inc.’s management is responsible for maintaining effective internal control over financial reporting and for its assessment of the effectiveness of internal control over financial reporting, included in the accompanying Management’s Report on Internal Control Over Financial Reporting appearing under Item 8 of this Form 10-K. Our responsibility is to express an opinion on the Company’s internal control over financial reporting based on our audit.
We conducted our audit in accordance with the standards of the Public Company Accounting Oversight Board (United States). Those standards require that we plan and perform the audit to obtain reasonable assurance about whether effective internal control over financial reporting was maintained in all material respects. Our audit included obtaining an understanding of internal control over financial reporting, assessing the risk that a material weakness exists, and testing and evaluating the design and operating effectiveness of internal control based on the assessed risk. Our audit also included performing such other procedures as we considered necessary in the circumstances. We believe that our audit provides a reasonable basis for our opinion.
A company’s internal control over financial reporting is a process designed to provide reasonable assurance regarding the reliability of financial reporting and the preparation of financial statements for external purposes in accordance with generally accepted accounting principles. A company’s internal control over financial reporting includes those policies and procedures that (1) pertain to the maintenance of records that, in reasonable detail, accurately and fairly reflect the transactions and dispositions of the assets of the company; (2) provide reasonable assurance that transactions are recorded as necessary to permit preparation of financial statements in accordance with generally accepted accounting principles, and that receipts and expenditures of the company are being made only in accordance with authorizations of management and directors of the company; and (3) provide reasonable assurance regarding prevention or timely detection of unauthorized acquisition, use, or disposition of the company’s assets that could have a material effect on the financial statements.
Because of its inherent limitations, internal control over financial reporting may not prevent or detect misstatements. Also, projections of any evaluation of effectiveness to future periods are subject to the risk that controls may become inadequate because of changes in conditions, or that the degree of compliance with the policies or procedures may deteriorate.
In our opinion, G&K Services, Inc. maintained, in all material respects, effective internal control over financial reporting as of July 2, 2016, based on criteria established in Internal Control - Integrated Framework (2013) issued by the Committee of Sponsoring Organizations of the Treadway Commission (COSO).
We also have audited, in accordance with the standards of the Public Company Accounting Oversight Board (United States), the consolidated balance sheets of G&K Services, Inc. and subsidiaries as of July 2, 2016 and June 27, 2015, and the related consolidated statements of operations, comprehensive income, stockholders’ equity, and cash flows for each of the fiscal years in the three-year period ended July 2, 2016, and the related financial statement schedule and our report dated August 26, 2016 expressed an unqualified opinion on those consolidated financial statements and financial statement schedule.
/s/ KPMG LLP |
KPMG LLP |
Minneapolis, Minnesota
August 26, 2016
29
Report of Independent Registered Public Accounting Firm
The Board of Directors and Stockholders
G&K Services, Inc.:
We have audited the accompanying consolidated balance sheets of G&K Services, Inc. and subsidiaries as of July 2, 2016 and June 27, 2015, and the related consolidated statements of operations, comprehensive income, stockholders’ equity, and cash flows for each of the fiscal years in the three‑year period ended July 2, 2016. In connection with our audits of the consolidated financial statements, we also have audited financial statement Schedule II - Valuation and Qualifying Accounts and Reserves for each of the fiscal years in the three-year period ended July 2, 2016. These consolidated financial statements and financial statement schedule are the responsibility of the Company’s management. Our responsibility is to express an opinion on these consolidated financial statements and financial statement schedule based on our audits.
We conducted our audits in accordance with the standards of the Public Company Accounting Oversight Board (United States). Those standards require that we plan and perform the audit to obtain reasonable assurance about whether the financial statements are free of material misstatement. An audit includes examining, on a test basis, evidence supporting the amounts and disclosures in the financial statements. An audit also includes assessing the accounting principles used and significant estimates made by management, as well as evaluating the overall financial statement presentation. We believe that our audits provide a reasonable basis for our opinion.
In our opinion, the consolidated financial statements referred to above present fairly, in all material respects, the financial position of G&K Services, Inc. and subsidiaries as of July 2, 2016 and June 27, 2015, and the results of their operations and their cash flows for each of the fiscal years in the three‑year period ended July 2, 2016, in conformity with U.S. generally accepted accounting principles. Also in our opinion, the related financial statement schedule, when considered in relation to the basic consolidated financial statements taken as a whole, presents fairly, in all material respects, the information set forth therein.
We also have audited, in accordance with the standards of the Public Company Accounting Oversight Board (United States), G&K Services, Inc.’s internal control over financial reporting as of July 2, 2016, based on criteria established in Internal Control - Integrated Framework (2013) issued by the Committee of Sponsoring Organizations of the Treadway Commission (COSO), and our report dated August 26, 2016 expressed an unqualified opinion on the effectiveness of the Company’s internal control over financial reporting.
/s/ KPMG LLP |
KPMG LLP |
Minneapolis, Minnesota
August 26, 2016
30
CONSOLIDATED STATEMENTS OF OPERATIONS
G&K Services, Inc. and Subsidiaries
For the Fiscal Years Ended | |||||||||||
July 2, 2016 | June 27, 2015 | June 28, 2014 | |||||||||
(In thousands, except per share data) | (53 weeks) | (52 weeks) | (52 weeks) | ||||||||
Rental and direct sale revenue | $ | 978,041 | $ | 937,642 | $ | 900,869 | |||||
Cost of rental and direct sale revenue | 643,067 | 621,135 | 594,954 | ||||||||
Gross Margin | 334,974 | 316,507 | 305,915 | ||||||||
Pension withdrawal and associated expenses | — | 6,500 | 9,854 | ||||||||
Selling and administrative | 212,334 | 208,793 | 199,946 | ||||||||
Income from Continuing Operations | 122,640 | 101,214 | 96,115 | ||||||||
Interest expense | 6,835 | 7,138 | 6,320 | ||||||||
Income from Continuing Operations before Income Taxes | 115,805 | 94,076 | 89,795 | ||||||||
Provision for income taxes | 43,366 | 34,206 | 33,730 | ||||||||
Net Income from Continuing Operations | 72,439 | 59,870 | 56,065 | ||||||||
Net loss from discontinued operations, net of tax | — | — | (8,393 | ) | |||||||
Net Income | $ | 72,439 | $ | 59,870 | $ | 47,672 | |||||
Basic Earnings (Loss) per Common Share: | |||||||||||
From continuing operations | $ | 3.65 | $ | 3.01 | $ | 2.83 | |||||
From discontinued operations | $ | — | $ | — | $ | (0.43 | ) | ||||
Basic earnings per share | $ | 3.65 | $ | 3.01 | $ | 2.41 | |||||
Diluted Earnings (Loss) per Common Share: | |||||||||||
From continuing operations | $ | 3.61 | $ | 2.95 | $ | 2.78 | |||||
From discontinued operations | $ | — | $ | — | $ | (0.42 | ) | ||||
Diluted earnings per share | $ | 3.61 | $ | 2.95 | $ | 2.36 | |||||
Weighted average number of shares outstanding, basic | 19,586 | 19,676 | 19,568 | ||||||||
Weighted average number of shares outstanding, diluted | 19,808 | 20,047 | 19,941 | ||||||||
Dividends Declared per Share | $ | 1.48 | $ | 1.24 | $ | 7.08 | |||||
The accompanying notes are an integral part of these Consolidated Financial Statements.
31
CONSOLIDATED STATEMENTS OF COMPREHENSIVE INCOME
G&K Services, Inc. and Subsidiaries
For the Fiscal Years Ended | |||||||||||
July 2, 2016 | June 27, 2015 | June 28, 2014 | |||||||||
(In thousands) | (53 weeks) | (52 weeks) | (52 weeks) | ||||||||
Net income | $ | 72,439 | $ | 59,870 | $ | 47,672 | |||||
Other comprehensive income (loss) | |||||||||||
Foreign currency translation adjustments | (5,188 | ) | (18,629 | ) | (1,797 | ) | |||||
Change in pension benefit liabilities | (12,249 | ) | (2,415 | ) | (6,572 | ) | |||||
Derivative financial instruments unrecognized (loss) gain | (13,046 | ) | 4,831 | (362 | ) | ||||||
Derivative financial instruments (loss) gain reclassified | (223 | ) | 532 | 533 | |||||||
Total other comprehensive loss before income taxes | (30,706 | ) | (15,681 | ) | (8,198 | ) | |||||
Income tax benefit | 10,783 | 2,750 | 2,796 | ||||||||
Other comprehensive loss, net of taxes | (19,923 | ) | (12,931 | ) | (5,402 | ) | |||||
Comprehensive income | $ | 52,516 | $ | 46,939 | $ | 42,270 | |||||
The accompanying notes are an integral part of these Consolidated Financial Statements.
32
CONSOLIDATED BALANCE SHEETS
G&K Services, Inc. and Subsidiaries
July 2, 2016 | June 27, 2015 | ||||||
(In thousands, except per share data) | |||||||
ASSETS | |||||||
Current Assets | |||||||
Cash and cash equivalents | $ | 24,279 | $ | 16,235 | |||
Accounts receivable, less allowance for doubtful accounts of $3,578 and $3,469 | 102,657 | 100,402 | |||||
Inventory | 34,077 | 36,258 | |||||
Merchandise in service, net | 131,801 | 133,942 | |||||
Other current assets | 20,539 | 30,383 | |||||
Total current assets | 313,353 | 317,220 | |||||
Property, Plant and Equipment | |||||||
Land | 32,999 | 32,567 | |||||
Buildings and improvements | 178,177 | 170,056 | |||||
Machinery and equipment | 406,747 | 394,244 | |||||
Automobiles and trucks | 7,928 | 7,486 | |||||
Less accumulated depreciation | (397,209 | ) | (382,297 | ) | |||
Total property, plant and equipment, net | 228,642 | 222,056 | |||||
Other Assets | |||||||
Goodwill | 324,520 | 325,183 | |||||
Other noncurrent assets | 55,022 | 63,738 | |||||
Total other assets | 379,542 | 388,921 | |||||
Total assets | $ | 921,537 | $ | 928,197 | |||
LIABILITIES AND STOCKHOLDERS' EQUITY | |||||||
Current Liabilities | |||||||
Accounts payable | $ | 44,792 | $ | 51,616 | |||
Accrued expenses | |||||||
Compensation and employee benefits | 47,085 | 46,442 | |||||
Other | 25,651 | 25,297 | |||||
Current maturities of long-term debt | — | 169 | |||||
Total current liabilities | 117,528 | 123,524 | |||||
Long-term debt, net of current maturities | 231,148 | 243,600 | |||||
Deferred income taxes | 68,895 | 59,280 | |||||
Other noncurrent liabilities | 114,426 | 107,443 | |||||
Total liabilities | 531,997 | 533,847 | |||||
Commitments and Contingencies (Note 12) | |||||||
Stockholders' Equity | |||||||
Common stock, $0.50 par value, non-convertible Class A, 400,000 shares authorized, 19,661 and 19,953 shares issued and outstanding | 9,828 | 9,976 | |||||
Additional paid-in capital | 84,804 | 78,342 | |||||
Retained earnings | 323,775 | 314,976 | |||||
Accumulated other comprehensive (loss) income | (28,867 | ) | (8,944 | ) | |||
Total stockholders' equity | 389,540 | 394,350 | |||||
Total liabilities and stockholders' equity | $ | 921,537 | $ | 928,197 | |||
The accompanying notes are an integral part of these Consolidated Financial Statements.
33
CONSOLIDATED STATEMENTS OF STOCKHOLDERS' EQUITY
G&K Services, Inc. and Subsidiaries
(In thousands, except per share data) | Shares | Class A Common Stock | Additional Paid-In Capital | Retained Earnings | Accumulated Other Comprehensive Income/(Loss) | Stockholders' Equity | ||||||||||||||||
Balance June 29, 2013 | 19,683 | $ | 9,842 | $ | 44,872 | $ | 402,905 | $ | 9,389 | $ | 467,008 | |||||||||||
Comprehensive income | — | — | — | 47,672 | (5,402 | ) | 42,270 | |||||||||||||||
Proceeds from issuance of common stock under stock option plans | 460 | 230 | 8,518 | — | — | 8,748 | ||||||||||||||||
Share-based compensation | — | — | 6,318 | — | — | 6,318 | ||||||||||||||||
Shares withheld for taxes under our equity compensation plans | (26 | ) | (13 | ) | (1,422 | ) | — | — | (1,435 | ) | ||||||||||||
Repurchase of common stock | (205 | ) | (103 | ) | — | (11,569 | ) | — | (11,672 | ) | ||||||||||||
Excess tax benefit from share-based compensation | — | — | 4,578 | — | — | 4,578 | ||||||||||||||||
Cash dividends ($7.08 per share) | — | — | — | (141,771 | ) | — | (141,771 | ) | ||||||||||||||
Balance June 28, 2014 | 19,912 | 9,956 | 62,864 | 297,237 | 3,987 | 374,044 | ||||||||||||||||
Comprehensive income | — | — | — | 59,870 | (12,931 | ) | 46,939 | |||||||||||||||
Proceeds from issuance of common stock under stock option plans | 341 | 171 | 6,112 | — | — | 6,283 | ||||||||||||||||
Share-based compensation | — | — | 6,219 | — | — | 6,219 | ||||||||||||||||
Shares withheld for taxes under our equity compensation plans | (35 | ) | (18 | ) | (2,058 | ) | — | — | (2,076 | ) | ||||||||||||
Repurchase of common stock | (265 | ) | (133 | ) | — | (17,464 | ) | — | (17,597 | ) | ||||||||||||
Excess tax benefit from share-based compensation | — | — | 5,205 | — | — | 5,205 | ||||||||||||||||
Cash dividends ($1.24 per share) | — | — | — | (24,667 | ) | — | (24,667 | ) | ||||||||||||||
Balance June 27, 2015 | 19,953 | 9,976 | 78,342 | 314,976 | (8,944 | ) | 394,350 | |||||||||||||||
Comprehensive income | — | — | — | 72,439 | (19,923 | ) | 52,516 | |||||||||||||||
Proceeds from issuance of common stock under stock option plans | 279 | 140 | 2,020 | — | — | 2,160 | ||||||||||||||||
Share-based compensation | — | — | 6,631 | — | — | 6,631 | ||||||||||||||||
Shares withheld for taxes under our equity compensation plans | (66 | ) | (33 | ) | (4,717 | ) | — | — | (4,750 | ) | ||||||||||||
Repurchase of common stock | (505 | ) | (255 | ) | — | (34,269 | ) | — | (34,524 | ) | ||||||||||||
Excess tax benefit from share-based compensation | — | — | 2,528 | — | 2,528 | |||||||||||||||||
Cash dividends declared ($1.48 per share) | — | — | — | (29,371 | ) | — | (29,371 | ) | ||||||||||||||
Balance July 2, 2016 | 19,661 | $ | 9,828 | $ | 84,804 | $ | 323,775 | $ | (28,867 | ) | $ | 389,540 | ||||||||||
The accompanying notes are an integral part of these Consolidated Financial Statements.
34
CONSOLIDATED STATEMENTS OF CASH FLOWS
G&K Services, Inc. and Subsidiaries
For the Fiscal Years Ended | |||||||||||
July 2, 2016 | June 27, 2015 | June 28, 2014 | |||||||||
(In thousands) | (53 weeks) | (52 weeks) | (52 weeks) | ||||||||
Operating Activities: | |||||||||||
Net income | $ | 72,439 | $ | 59,870 | $ | 47,672 | |||||
Adjustments to reconcile net income to net cash provided by operating activities - | |||||||||||
Depreciation and amortization | 36,504 | 32,298 | 30,877 | ||||||||
Loss on sale of business | — | — | 12,837 | ||||||||
Pension withdrawal and associated expenses | — | 6,500 | 9,854 | ||||||||
Deferred income taxes | 19,606 | 18,638 | 21,972 | ||||||||
Share-based compensation | 6,749 | 6,219 | 6,318 | ||||||||
Changes in operating items, exclusive of acquisitions and divestitures - | |||||||||||
Accounts receivable | (3,048 | ) | (2,908 | ) | (14,538 | ) | |||||
Inventory and merchandise in service | 4,590 | (9,429 | ) | (12,157 | ) | ||||||
Accounts payable | (3,662 | ) | 7,201 | 935 | |||||||
Other current assets and liabilities | 18,789 | (3,352 | ) | (25,273 | ) | ||||||
Multi-employer pension plan settlement payment | (7,903 | ) | (24,799 | ) | — | ||||||
Other | (9,888 | ) | 3,997 | (3,861 | ) | ||||||
Net cash provided by operating activities | 134,176 | 94,235 | 74,636 | ||||||||
Investing Activities: | |||||||||||
Capital expenditures | (45,349 | ) | (55,838 | ) | (32,776 | ) | |||||
Divestiture of business | — | — | 6,641 | ||||||||
Acquisition of business | (2,982 | ) | — | — | |||||||
Net cash used for investing activities | (48,331 | ) | (55,838 | ) | (26,135 | ) | |||||
Financing Activities: | |||||||||||
Repayments of long-term debt | (75,168 | ) | (843 | ) | (18 | ) | |||||
Proceeds from (repayments of) revolving credit facilities, net | 62,548 | (22,362 | ) | 91,000 | |||||||
Cash dividends paid | (30,418 | ) | (24,544 | ) | (140,886 | ) | |||||
Proceeds from issuance of common stock under stock option plans | 2,160 | 6,283 | 8,748 | ||||||||
Repurchase of common stock | (34,524 | ) | (17,597 | ) | (11,672 | ) | |||||
Shares withheld for taxes under equity compensation plans | (4,750 | ) | (2,076 | ) | (1,435 | ) | |||||
Excess tax benefit from share-based compensation | 2,528 | 5,205 | 4,578 | ||||||||
Net cash used for financing activities | (77,624 | ) | (55,934 | ) | (49,685 | ) | |||||
Effect of Exchange Rates on Cash | (177 | ) | (3,346 | ) | (288 | ) | |||||
Increase (Decrease) in Cash and Cash Equivalents | 8,044 | (20,883 | ) | (1,472 | ) | ||||||
Cash and Cash Equivalents: | |||||||||||
Beginning of year | 16,235 | 37,118 | 38,590 | ||||||||
End of year | $ | 24,279 | $ | 16,235 | $ | 37,118 | |||||
Supplemental Cash Flow Information: | |||||||||||
Cash paid for - | |||||||||||
Interest | $ | 6,658 | $ | 6,647 | $ | 5,645 | |||||
Income taxes | $ | 11,290 | $ | 11,539 | $ | 20,945 | |||||
Supplemental Non-cash Investing Information: | |||||||||||
Capital expenditures not yet paid and included in accounts payable | $ | 1,792 | $ | 3,662 | $ | 3,378 | |||||
The accompanying notes are an integral part of these Consolidated Financial Statements.
35
NOTES TO CONSOLIDATED FINANCIAL STATEMENTS
(Dollars in thousands, except per share data)
1. Summary of Significant Accounting Policies
Nature of Business
G&K Services, Inc., founded in 1902 and headquartered in Minnetonka, Minnesota, is a service-focused provider of branded uniform and facility services programs. We deliver value to our customers by enhancing their image and brand, and by promoting workplace safety, security and cleanliness. We accomplish this by providing a wide range of workwear and protective safety apparel through rental and direct purchase programs. We also supply a variety of facility products and services, including floor mats, towels, mops, restroom hygiene products, and first aid supplies. We also manufacture certain work apparel garments that are used to support our garment rental and direct purchase programs. We have two operating segments, United States (includes the Dominican Republic) and Canada, which have been identified as components of our organization that are reviewed by our Chairman and Chief Executive Officer to determine resource allocation and evaluate performance.
Basis of Presentation
Our Consolidated Financial Statements include the accounts of G&K Services, Inc. and all subsidiaries in which we have a controlling financial interest. Intercompany transactions and accounts are eliminated in consolidation.
Our fiscal year ends on the Saturday nearest June 30. All references herein to "2016," "2015" and "2014" refer to the fiscal years ended July 2, 2016, June 27, 2015 and June 28, 2014, respectively. Fiscal year 2016 consisted of 53 weeks. Fiscal years 2015 and 2014 consisted of 52 weeks.
Reclassifications
In fiscal year 2016 we adopted a new accounting pronouncement which, among other things, requires deferred tax assets and liabilities to be combined and presented as noncurrent in our Consolidated Balance Sheets. We chose to adopt this new guidance on a retrospective basis, and, as a result, an adjustment has been made to reclassify the previously reported fiscal year 2015 Consolidated Balance Sheet. This reclassification combined noncurrent deferred tax assets of $668 and current deferred income tax liabilities of $31,097 with noncurrent deferred tax liabilities of $28,851 and presented the combined amount totaling $59,280 as "Deferred Income Taxes" on the Consolidated Balance Sheet as of June 27, 2015.
Use of Estimates
The preparation of Consolidated Financial Statements in conformity with accounting principles generally accepted in the United States requires management to make estimates and assumptions that affect amounts and disclosures reported therein. Due to the inherent uncertainty involved in making estimates, actual results could differ from our estimates.
Cash and Cash Equivalents
We consider all investments purchased with an original maturity of three months or less to be cash equivalents.
Accounts Receivable
Accounts receivable are recorded net of an allowance for expected losses. The allowance, recognized as an amount equal to anticipated future write-offs, is based on the age of outstanding balances, analysis of specific accounts, historical bad debt experience and current economic trends. We generally write-off uncollectible accounts receivable after all internal avenues of collection have been exhausted.
Inventory and Merchandise in Service
Inventories consist of new goods and rental merchandise in service. New goods are stated at the lower of first-in, first-out cost or market. Merchandise placed in service to support our rental operations is amortized into cost of rental operations over the estimated useful lives of the underlying inventory items, on a straight-line basis, which results in a matching of the cost of the merchandise with the weekly rental revenue generated by the merchandise. Estimated lives of rental merchandise in service range from six months to four years. In establishing estimated lives for merchandise in service, management considers historical experience and the intended use of the merchandise.
We review the estimated useful lives of our in-service inventory assets on a periodic basis or when trends in our business indicate that the useful lives for certain products might have changed. The selection of estimated useful lives is a sensitive estimate in which a change in lives can have a material impact on our results of operations. For example, during the fourth quarter of fiscal year 2013, we completed an analysis of certain in-service inventory assets which resulted in the estimated useful lives for these assets being extended to better reflect the estimated periods in which the assets will remain in service. The
36
effect of the change in estimate increased income from operations by $6,136, net income by $3,867 and basic and diluted earnings per common share by $0.19 in fiscal year 2014.
We estimate our losses related to inventory obsolescence by examining our inventory to determine if there are indicators that carrying values exceed the net realizable value. Significant factors that could indicate the need for inventory write-downs include the age of the inventory, anticipated demand for our products, historical inventory usage, revenue trends and current economic conditions. We believe that adequate adjustments have been made in the Consolidated Financial Statements; however, in the future, product lines and customer requirements may change, which could result in an increase in obsolete inventory reserves or additional inventory impairments.
The components of inventories as of July 2, 2016 and June 27, 2015 are as follows:
July 2, 2016 | June 27, 2015 | ||||||
Raw Materials | $ | 6,424 | $ | 6,368 | |||
Work in Process | 1,431 | 975 | |||||
Finished Goods | 26,222 | 28,915 | |||||
Inventory | 34,077 | 36,258 | |||||
Merchandise in service, net | 131,801 | 133,942 | |||||
Property, Plant and Equipment
Property, plant and equipment are carried at cost. Depreciation is generally computed using the straight-line method over the following estimated useful lives:
Life (Years) | |
Automobiles and trucks | 3 to 8 |
Machinery and equipment | 3 to 10 |
Buildings | 20 to 33 |
Building improvements | 1 to 10 |
Costs of significant additions, renewals and betterments are capitalized. When an asset is sold or otherwise disposed of, the related cost and accumulated depreciation are removed from the respective accounts and the gain or loss on disposition is reflected in earnings. Repair and maintenance costs are charged to operating expense when incurred. Depreciation expense, which includes amortization of assets recorded under capital leases, was $35,078, $30,358 and $28,220, in fiscal years 2016, 2015 and 2014, respectively.
Environmental Costs
We accrue various environmental related costs, which consist primarily of estimated clean-up costs, fines and penalties, when it is probable that we have incurred a liability and the amount can be reasonably estimated. When a single amount cannot be reasonably estimated but the cost can be estimated within a range, we accrue the minimum estimated amount. This accrued amount reflects our assumptions regarding the nature of the remedy and the outcome of discussions with regulatory agencies. Changes in the estimates on which the accruals are based, including unanticipated government enforcement actions, or changes in environmental regulations, could result in higher or lower costs. Accordingly, as investigations and other actions proceed, it is likely that adjustments to our accruals will be necessary to reflect new information. While we cannot predict the ultimate outcome of any of these matters with certainty, we believe the possibility of a material adverse effect on our results of ongoing operations or financial position is remote, although the impact on reported operating results in any particular period may be material.
Accruals for environmental liabilities are included in the "Accrued expenses - Other" and "Other Noncurrent Liabilities" line items in the Consolidated Balance Sheets. Environmental costs are capitalized if they extend the life of the related property, increase its capacity and/or mitigate or prevent future contamination. The cost of operating and maintaining environmental control equipment is charged to expense in the period incurred.
For additional information see Note 12, "Commitments and Contingencies" of Notes to Consolidated Financial Statements.
Goodwill, Intangible Assets and Other Long-Lived Assets
The fair value of the purchase price of acquisitions in excess of the fair value of the underlying net assets is recorded as goodwill. Non-competition agreements that limit the seller from competing with us for a fixed period of time and acquired
37
customer contracts are stated at fair value upon acquisition and are amortized over the terms of the respective agreements or estimated average life of an account, which ranges from five to 20 years.
We test goodwill for impairment in the fourth quarter of each fiscal year or upon the occurrence of events or changes in circumstances that indicate that the asset might be impaired. Reporting units for goodwill impairment review are operating segments, or components of an operating segment, that constitute a business for which discrete financial information is available, and for which segment management regularly reviews the operating results. Based on this analysis, we have identified two reporting units as of the fiscal year 2016 testing date. Our reporting units are U.S. Rental operations and Canadian Rental operations, with respective goodwill balances of $270,045 and $54,475, at July 2, 2016. During fiscal year 2014, we divested our Direct Sales reporting unit. There have been no other changes to our reporting units or in the allocation of goodwill to each respective reporting unit in fiscal years 2016, 2015 or 2014.
In fiscal years 2016, 2015 and 2014, we performed a qualitative assessment to test our reporting units' goodwill for impairment. Based on our qualitative assessment, we determined that it is more likely than not (i.e., a likelihood of more than 50%) that the fair value of all reporting units is greater than their carrying amount and therefore no impairment of goodwill was identified.
All goodwill associated with our Direct Sales reporting unit had been previously impaired and written off prior to its divestiture. During the second quarter of fiscal year 2014, we recorded an impairment loss related to the divestiture of our Ireland Business of $261. There were no other impairment losses recorded in fiscal year 2016 or fiscal year 2015.
Goodwill by segment is as follows:
United States | Canada | Total | |||||||||
Balance as of June 28, 2014 | $ | 270,045 | $ | 63,169 | $ | 333,214 | |||||
Foreign currency translation and other | — | (8,031 | ) | (8,031 | ) | ||||||
Balance as of June 27, 2015 | $ | 270,045 | $ | 55,138 | $ | 325,183 | |||||
Goodwill acquired during the period | — | 1,880 | 1,880 | ||||||||
Foreign currency translation and other | — | (2,543 | ) | (2,543 | ) | ||||||
Balance as of July 2, 2016 | $ | 270,045 | $ | 54,475 | $ | 324,520 | |||||
Long-lived assets, including definite-lived intangible assets, are reviewed for impairment whenever events or changes in circumstances indicate that the carrying amount of such assets may not be recoverable. Recoverability is measured by comparison of the carrying amount of the asset to the future undiscounted cash flows the asset is expected to generate. If the carrying value is not projected to be recovered by future undiscounted cash flows, the amount of any impairment is measured as the difference between the carrying value and the fair value of the impaired asset. There were no impairment charges for intangible assets in fiscal years 2016, 2015 or 2014.
Foreign Currency
For all significant foreign operations, the functional currency is the local currency. Assets and liabilities of these operations are translated at the period-end exchange rates. Income statement accounts are translated using the average exchange rates prevailing during the year. Translation adjustments are reflected within "Accumulated other comprehensive income" in stockholders' equity of the Consolidated Balance Sheets. Gains and losses from foreign currency transactions are included in net earnings for the period and were not material in fiscal years 2016, 2015 or 2014.
Revenue Recognition
Our rental operations business is largely based on written service agreements whereby we agree to pick up soiled merchandise, launder and then deliver clean uniforms and other products. The service agreements generally provide for weekly billing upon completion of the laundering process and delivery to the customer. Accordingly, we recognize revenue from rental operations in the period in which the services are provided. Revenue from rental operations also includes billings to customers for lost or damaged merchandise. Direct sale revenue is recognized in the period in which the product is shipped. Total revenues do not include sales tax as we consider ourselves a pass-through conduit for collecting and remitting sales tax.
Income Taxes
Provisions for federal, state, and foreign income taxes are calculated based on reported pretax earnings and current tax law. Significant judgment is required in determining income tax provisions and evaluating tax positions. We periodically assess our liabilities and uncertain tax positions for all periods that are currently open to examination or have not been effectively settled based on the most current available information. If it is not more likely than not that our tax position will be sustained, we record our best estimate of the resulting tax liability and any applicable interest and penalties in the Consolidated Financial Statements.
38
Deferred tax assets and liabilities are recorded for temporary differences between the tax basis of assets and liabilities and their reported amounts in the financial statements using statutory rates in effect for the year in which the differences are expected to reverse. We present the tax effects of these deferred tax assets and liabilities separately for each major tax jurisdiction. The effect on deferred tax assets and liabilities of a change in tax rates is recognized in the results of operations in the period that the changes are enacted. We record valuation allowances to reduce deferred tax assets when it is more likely than not that some portion of the asset may not be realized. We evaluate our deferred tax assets and liabilities on a periodic basis. We believe that we have adequately provided for our future income tax obligations based upon current facts, circumstances and tax law.
Derivative Financial Instruments
In the ordinary course of business, we are exposed to various market risks. We utilize derivative financial instruments to manage interest rate risk and manage the total debt that is subject to variable and fixed interest rates. These interest rate swap contracts modify our exposure to interest rate risk by converting variable rate debt to a fixed rate or by locking in the benchmark interest rate on forecasted issuances of fixed rate swap contracts as cash flow hedges of the interest related to variable and fixed rate debt.
All derivative financial instruments are recognized at fair value and are recorded in the "Other noncurrent assets" or "Accrued expenses - Other" line items in the Consolidated Balance Sheets.
For derivative financial instruments that are designated and qualify as cash flow hedges, the effective portion of the change in fair value on the derivative financial instrument is reported as a component of "Accumulated other comprehensive income" and reclassified into the "Interest expense" line item in the Consolidated Statements of Operations in the same period as the expenses from the cash flows of the hedged items are recognized. Cash payments or receipts are included in "Net cash provided by operating activities" in the Consolidated Statements of Cash Flows in the same period as the cash is settled. We perform an assessment at the inception of the hedge and on a quarterly basis thereafter, to determine whether our derivatives are highly effective in offsetting changes in the value of the hedged items. Changes in the fair value resulting from hedge ineffectiveness are immediately recognized as income or expense. See Note 6, "Derivative Financial Instruments," of Notes to Consolidated Financial Statements for further details.
We do not engage in speculative transactions or fair value hedging nor do we hold or issue derivative financial instruments for trading purposes.
Share-based Payments
We grant share-based awards, including restricted stock and options to purchase our common stock. Stock options are granted to employees and directors for a fixed number of shares with an exercise price equal to the fair value on the shares at the date of grant. Share-based compensation is recognized in the Consolidated Statements of Operations on a straight-line basis over the requisite service period for each separate vesting portion of the award. The amortization of share-based compensation reflects estimated forfeitures adjusted for actual forfeiture experience. As share-based compensation expense is recognized, a deferred tax asset is recorded that represents an estimate of the future tax deduction from the exercise of stock options or release of restrictions on the restricted stock. At the time share-based awards are exercised, canceled, expire or restrictions lapse, we recognize adjustments to additional paid-in capital or income tax expense. See Note 10, "Stockholders' Equity" of Notes to Consolidated Financial Statements for further details.
2. New Accounting Pronouncements
In May 2014, the Financial Accounting Standards Board ("FASB") issued updated guidance to clarify revenue recognition principles, which is intended to improve disclosure requirements and enhance the comparability of revenue recognition practices. Improved disclosures under the amended guidance relate to the nature, amount, timing and uncertainty of revenue that is recognized from contracts with customers. This guidance will be effective for us beginning in the first quarter of fiscal year 2019. We are currently evaluating the impact this new guidance will have on our Consolidated Financial Statements.
In April 2015, the FASB issued updated guidance which changes the presentation of debt issuance costs in financial statements to present such costs in the balance sheet as a direct deduction from the related debt liability rather than as an asset. Amortization of the costs is reported as interest expense. This guidance will be effective for us beginning in the first quarter of fiscal year 2017 and is required to be applied on a retrospective basis. We anticipate the implementation of this guidance will not have a material impact on the presentation of our financial position and no impact on our results of operations or cash flows.
In July 2015, the FASB issued updated guidance to simplify the measurement of inventory at the lower of cost or net realizable value. This guidance will be effective for us beginning in the first quarter of fiscal year 2018. We anticipate the implementation of this guidance will not have a material impact on our financial position, results of operations or cash flows.
39
In November 2015, the FASB issued updated guidance which will require deferred tax assets and liabilities to be presented as noncurrent on our balance sheet. We adopted this guidance retrospectively as of the fourth quarter of fiscal year 2016 and it is reflected in our fiscal year 2016 and 2015 balance sheets and income tax related disclosures.
In January 2016, the FASB issued updated guidance intended to improve the recognition and measurement of financial instruments. This guidance will be effective for us beginning in the first quarter of fiscal year 2019. We are currently evaluating the impact this new guidance will have on our Consolidated Financial Statements.
In February 2016, the FASB issued updated guidance, which is intended to increase transparency and comparability by recognizing lease assets and lease liabilities on the balance sheet and disclosing key information about leasing arrangements. This guidance will be effective for us beginning in the first quarter of fiscal year 2020 although early adoption is permitted. We are currently evaluating the impact this new guidance will have on our Consolidated Financial Statements.
In March 2016, the FASB issued updated guidance, which is intended to simplify several aspects of the accounting for employee share-based payment transactions, including the accounting for income taxes, forfeitures, statutory tax withholding requirements, and classification in the statement of cash flows. This guidance will be effective for us beginning in the first quarter of fiscal year 2018 although early adoption is permitted. We expect to early adopt this guidance in the first quarter of fiscal year 2017. The adoption of this guidance is expected to increase the volatility of our effective tax rate as the excess tax benefit related to stock options exercised and vested restricted stock are recorded as income tax expense and no longer in equity. Based on our current stock price and outstanding share based awards, we expect the adoption in fiscal year 2017 will have a favorable impact on our effective tax rate.
3. Earnings Per Share
Accounting guidance for participating securities and the two-class method, addresses whether awards granted in unvested share-based payment transactions that contain non-forfeitable rights to dividends or dividend equivalents (whether paid or unpaid) are participating securities and therefore are included in computing earnings per share under the two-class method. Participating securities are securities that may participate in dividends with common stock and the two-class method is an earnings allocation formula that treats a participating security as having rights to earnings that would otherwise have been available to common shareholders. Under the two-class method, earnings for the period are allocated between common shareholders and other shareholders, based on their respective rights to receive dividends. Certain restricted stock awards granted under our equity plans are considered participating securities as these awards receive non-forfeitable dividends at the same rate as common stock.
For the Fiscal Years | |||||||||||
2016 | 2015 | 2014 | |||||||||
Net income from continuing operations | $ | 72,439 | $ | 59,870 | $ | 56,065 | |||||
Less: Income allocable to participating securities | (1,025 | ) | (713 | ) | (610 | ) | |||||
Net income from continuing operations available to common stockholders | 71,414 | 59,157 | 55,455 | ||||||||
Net loss from discontinued operations | — | — | (8,393 | ) | |||||||
Net income available to common stockholders | $ | 71,414 | $ | 59,157 | $ | 47,062 | |||||
Basic earnings per share (shares in thousands): | |||||||||||
Weighted average shares outstanding, basic | 19,586 | 19,676 | 19,568 | ||||||||
Basic earnings (loss) per common share: | |||||||||||
From continuing operations | $ | 3.65 | $ | 3.01 | $ | 2.83 | |||||
From discontinued operations | $ | — | $ | — | $ | (0.43 | ) | ||||
Basic earnings per share | $ | 3.65 | $ | 3.01 | $ | 2.41 | |||||
Diluted earnings per share (shares in thousands): | |||||||||||
Weighted average shares outstanding, basic | 19,586 | 19,676 | 19,568 | ||||||||
Weighted average effect of non-vested restricted stock grants and assumed exercise of stock options | 222 | 371 | 373 | ||||||||
Weighted average shares outstanding, diluted | 19,808 | 20,047 | 19,941 | ||||||||
Diluted earnings (loss) per common share: | |||||||||||
From continuing operations | $ | 3.61 | $ | 2.95 | $ | 2.78 | |||||
From discontinued operations | $ | — | $ | — | $ | (0.42 | ) | ||||
Diluted earnings per share | $ | 3.61 | $ | 2.95 | $ | 2.36 | |||||
40
We excluded potential common shares related to our outstanding equity compensation grants of 73,000, 74,000 and 88,000 from the computation of diluted earnings per share for fiscal years 2016, 2015 and 2014, respectively. Inclusion of these shares would have been anti-dilutive.
4. Other Assets and Other Noncurrent Liabilities
Other assets as of July 2, 2016 and June 27, 2015 included the following:
July 2, 2016 | June 27, 2015 | ||||||
Executive deferred compensation assets | $ | 33,080 | $ | 34,414 | |||
Cash surrender value of life insurance policies | 14,860 | 14,659 | |||||
Derivative financial instruments | — | 4,857 | |||||
Customer contracts and non-competition agreements, net | 3,464 | 4,544 | |||||
Other assets | 6,658 | 7,186 | |||||
Less: Portion classified as other current assets | (3,040 | ) | (1,922 | ) | |||
Total other noncurrent assets | $ | 55,022 | $ | 63,738 | |||
The customer contracts include the combined value of the written service agreements and the related customer relationship. Customer contracts and non-competition agreements are amortized over a weighted average life of approximately ten years and are as follows:
July 2, 2016 | June 27, 2015 | ||||||
Customer contracts and non-competition agreements | $ | 14,576 | $ | 20,244 | |||
Accumulated amortization | (11,112 | ) | (15,700 | ) | |||
Net | $ | 3,464 | $ | 4,544 | |||
Amortization expense was $1,427, $1,940 and $2,657 for fiscal years 2016, 2015 and 2014, respectively. Estimated amortization expense for each of the next five fiscal years based on the intangible assets as of July 2, 2016 is as follows:
2017 | $ | 1,242 | |
2018 | 436 | ||
2019 | 217 | ||
2020 | 205 | ||
2021 | 193 | ||
Thereafter | 1,170 | ||
Other noncurrent liabilities as of July 2, 2016 and June 27, 2015 included the following:
July 2, 2016 | June 27, 2015 | ||||||
Multi-employer pension withdrawal liability | $ | 803 | $ | 9,329 | |||
Pension plan liability | 32,446 | 20,188 | |||||
Executive deferred compensation plan liability | 33,080 | 34,529 | |||||
Supplemental executive retirement plan liability | 18,523 | 16,686 | |||||
Accrued income taxes | 7,363 | 8,294 | |||||
Workers' compensation liability | 18,036 | 18,577 | |||||
Derivative financial instruments | 8,189 | — | |||||
Other liabilities | 5,725 | 7,659 | |||||
Less: Portion classified as current liabilities | (9,739 | ) | (7,819 | ) | |||
Total other noncurrent liabilities | $ | 114,426 | $ | 107,443 | |||
41
5. Long-Term Debt
Debt as of July 2, 2016 and June 27, 2015 includes the following:
July 2, 2016 | June 27, 2015 | ||||||
Borrowings under Unsecured Revolver | $ | 107,600 | $ | 40,500 | |||
Borrowings under Variable Rate Notes | — | 75,000 | |||||
Borrowings under A/R Line | 23,548 | 28,100 | |||||
Borrowings under Fixed Rate Notes | 100,000 | 100,000 | |||||
Capital leases and other | — | 169 | |||||
231,148 | 243,769 | ||||||
Less current maturities | — | (169 | ) | ||||
Total long-term debt | $ | 231,148 | $ | 243,600 | |||
We have a $350,000 unsecured revolver with a syndicate of banks, which expires on April 15, 2020. Domestic U.S. Dollar borrowings under this revolver generally bear interest at the adjusted London Interbank Offered Rate ("LIBOR") for specified periods plus a margin, which can range from 1.00% to 1.75%, depending on our consolidated leverage ratio and can be expanded by $200,000 to a total of $550,000.
As of July 2, 2016, there was $107,600 outstanding under this revolver. The unused portion of the revolver may be used for general corporate purposes, acquisitions, share repurchases, dividends, working capital needs and to provide up to $45,000 in letters of credit. As of July 2, 2016, we had no letters of credit outstanding under this revolver. As of July 2, 2016 there is a fee of 0.15% of the unused daily balance of this revolver.
Availability of credit under this revolver requires that we maintain compliance with certain covenants, which are the most restrictive when compared to our other credit facilities. The following table illustrates compliance with regard to the material financial covenants required by the terms of this revolver as of July 2, 2016:
Required | Actual | ||||
Maximum Leverage Ratio (Debt/EBITDA) | 3.50 | 1.55 | |||
Minimum Interest Coverage Ratio (EBITDA/Interest Expense) | 3.00 | 24.27 | |||
Our maximum leverage ratio and minimum interest coverage ratio covenants are calculated by adding back certain non-cash charges, as defined in this revolver.
Borrowings outstanding as of July 2, 2016 under this revolver bear interest at a weighted average effective rate of 1.61%.
As of June 27, 2015 we had $75,000 of variable rate unsecured private placement notes bearing interest at 0.60% over LIBOR that matured on June 30, 2015. The notes did not require principal payments until maturity. As of June 27, 2015, the outstanding balance of the notes was $75,000 at an effective interest rate of 0.873%. The notes required that we maintained a minimum net worth of $379,953 as of June 27, 2015. We subsequently paid these notes using our revolver. Therefore, as of June 27, 2015 we classified the $75,000 as long-term debt in the Consolidated Balance Sheets.
We have a $50,000 accounts receivable securitization facility, which expires on September 27, 2016. We intend to refinance these borrowings on or before the expiration date or pay the outstanding balance using our Unsecured Revolver. Under the terms of the facility, we pay interest at a rate per annum equal to LIBOR plus a margin of 0.75%. The facility is subject to customary fees, including a rate per annum equal to 0.80%, for the issuance of letters of credit and 0.26% for any unused portion of the facility. As is customary with transactions of this nature, our eligible accounts receivable are sold to a consolidated subsidiary. As of July 2, 2016 there was $23,548 outstanding under this securitization facility and there were $26,452 of letters of credit outstanding, primarily related to our property and casualty insurance programs. Borrowings outstanding as of July 2, 2016 under this facility bear interest at an average effective rate of 1.22%.
We have $100,000 of fixed rate unsecured senior notes with $50,000 of the notes bearing interest at a fixed interest rate of 3.73% per annum maturing April 15, 2023 and $50,000 of the notes bearing interest at a fixed interest rate of 3.88% per annum maturing on April 15, 2025. Interest on the notes is payable semiannually. As of July 2, 2016, the outstanding balance of the notes was $100,000 at an effective rate of 3.81%.
See Note 6, "Derivative Financial Instruments," of Notes to Consolidated Financial Statements for details of our interest rate swap and hedging activities related to our outstanding debt.
42
The credit facilities, loan agreements and fixed rate notes contain various restrictive covenants that, among other things`, require us to maintain a maximum leverage ratio. These debt arrangements also contain customary representations, warranties, covenants and indemnifications. At July 2, 2016, we were in compliance with all debt covenants.
The following table summarizes payments due on long-term debt, including capital leases, as of July 2, 2016 for the next five fiscal years and thereafter:
2017 | $ | 23,548 | |
2018 | — | ||
2019 | — | ||
2020 | 107,600 | ||
2021 and thereafter | 100,000 | ||
6. Derivative Financial Instruments
In the ordinary course of business, we are exposed to various market risks. We utilize derivative financial instruments to manage interest rate risk and manage the total debt that is subject to variable and fixed interest rates. These interest rate swap contracts modify our exposure to interest rate risk by converting variable rate debt to a fixed rate or by locking in the benchmark interest rate on forecasted issuances of fixed rate debt. Approximately 57% of our outstanding variable rate debt had its interest payments modified using interest rate swap contract at July 2, 2016. This interest rate swap contract matures on July 1, 2031.
We do not have any derivative financial instruments that have been designated as either a fair value hedge, a hedge of net investment in a foreign operation, or that are held for trading or speculative purposes. Cash flows associated with derivative financial instruments are classified in the same category as the cash flows hedged in the Consolidated Statements of Cash Flows.
As of July 2, 2016, we held a $75,000 interest rate swap contract which will limit our exposure to interest rate risk and pursuant to which we will pay fixed rates of interest and receive variable rates of interest based on the one-month LIBOR. The 15 year swap contract has an effective interest rate of 2.35% with a start date of July 1, 2016 and an end date of July 1, 2031 and is a highly effective cash flow hedge. Gains or losses on any ineffectiveness are not expected to be material to any period.
The following table summarizes our derivative financial instrument assets and liabilities and the classification on our Consolidated Balance Sheets as of July 2, 2016 and June 27, 2015:
July 2, 2016 | June 27, 2015 | ||||||
Derivative financial instruments, assets: | |||||||
Other noncurrent assets | $ | — | $ | 4,857 | |||
Total derivative financial instruments, assets | $ | — | $ | 4,857 | |||
Derivative financial instruments, liabilities: | |||||||
Accrued expense - other | $ | 1,387 | $ | 188 | |||
Other noncurrent liabilities | 6,802 | — | |||||
Total derivative financial instruments, liabilities | $ | 8,189 | $ | 188 | |||
A net loss of $3,901 is deferred in accumulated other comprehensive income as of July 2, 2016, of which a $723 loss is expected to be reclassified to interest expense in the next 12 months.
As of July 2, 2016 and June 27, 2015, all derivative financial instruments were designated as hedging instruments.
7. Fair Value Measurements
Generally accepted accounting principles ("GAAP") defines fair value, establishes a framework for measuring fair value and establishes disclosure requirements about fair value measurements. Fair value is defined as the price that would be received to sell an asset or paid to transfer a liability (an exit price) in the principal or most advantageous market for the asset or liability in an orderly transaction between market participants on the measurement date. We considered non-performance risk when determining fair value of our derivative financial instruments. The fair value hierarchy prescribed under GAAP contains the following three levels:
Level 1 — unadjusted quoted prices that are available in active markets for the identical assets or liabilities at the measurement date.
43
Level 2 — other observable inputs available at the measurement date, other than quoted prices included in Level 1, either directly or indirectly, including:
-quoted prices for similar assets or liabilities in active markets;
-quoted prices for identical or similar assets in non-active markets;
-inputs other than quoted prices that are observable for the asset or liability; and
-inputs that are derived principally from or corroborated by other observable market data.
Level 3 — unobservable inputs that cannot be corroborated by observable market data and reflect the use of significant management judgment. These values are generally determined using pricing models for which the assumptions utilize management’s estimates of market participant assumptions.
We do not have any Level 3 assets or liabilities and we have not transferred any items between fair value levels during fiscal year 2016. See Note 8, "Employee Benefit Plans" of Notes to Consolidated Financial Statements for additional information regarding our pension plan assets.
The following tables summarize the assets and liabilities measured at fair value on a recurring basis as of July 2, 2016 and June 27, 2015:
As of July 2, 2016 | |||||||||||
Fair Value Measurements Using Inputs Considered as | |||||||||||
Level 1 | Level 2 | Total | |||||||||
Other assets: | |||||||||||
Money market mutual funds | $ | 5,681 | $ | — | $ | 5,681 | |||||
Equity and fixed income mutual funds | 27,306 | — | 27,306 | ||||||||
Cash surrender value of life insurance policies | — | 14,860 | 14,860 | ||||||||
Total assets | $ | 32,987 | $ | 14,860 | $ | 47,847 | |||||
Accrued expenses: | |||||||||||
Derivative financial instruments | $ | — | $ | 8,189 | $ | 8,189 | |||||
Total liabilities | $ | — | $ | 8,189 | $ | 8,189 | |||||
As of June 27, 2015 | |||||||||||
Fair Value Measurements Using Inputs Considered as | |||||||||||
Level 1 | Level 2 | Total | |||||||||
Other assets: | |||||||||||
Money market mutual funds | $ | 4,637 | $ | — | $ | 4,637 | |||||
Equity and fixed income mutual funds | 29,777 | — | 29,777 | ||||||||
Cash surrender value of life insurance policies | — | 14,659 | 14,659 | ||||||||
Derivative financial instruments | — | 4,857 | 4,857 | ||||||||
Total assets | $ | 34,414 | $ | 19,516 | $ | 53,930 | |||||
Accrued expenses: | |||||||||||
Derivative financial instruments | $ | — | $ | 188 | $ | 188 | |||||
Total liabilities | $ | — | $ | 188 | $ | 188 | |||||
The cash surrender value of life insurance policies are primarily investments established to fund the obligations of the Company's non-qualified, non-contributory supplemental executive retirement plan (SERP).
The money market, equity and fixed income mutual funds are investments established to fund the Company's non-qualified deferred compensation plan. The Company classifies these investments as trading securities, and as a result, unrealized gains and losses are included in earnings. Changes in the deferred compensation liability as a result of the changes in the fair value of investments are also included in earnings resulting in no impact to net income.
44
The following tables summarize the fair value of assets and liabilities that are recorded at historical cost as of July 2, 2016 and June 27, 2015:
As of July 2, 2016 | |||||||||||
Fair Value Measurements Using Inputs Considered as | |||||||||||
Level 1 | Level 2 | Total | |||||||||
Cash and cash equivalents | $ | 24,279 | $ | — | $ | 24,279 | |||||
Total assets | $ | 24,279 | $ | — | $ | 24,279 | |||||
Long-term debt, net of current maturities | — | 236,568 | 236,568 | ||||||||
Total liabilities | $ | — | $ | 236,568 | $ | 236,568 | |||||
As of June 27, 2015 | |||||||||||
Fair Value Measurements Using Inputs Considered as | |||||||||||
Level 1 | Level 2 | Total | |||||||||
Cash and cash equivalents | $ | 16,235 | $ | — | $ | 16,235 | |||||
Total assets | $ | 16,235 | $ | — | $ | 16,235 | |||||
Current maturities of long-term debt | $ | — | $ | 169 | $ | 169 | |||||
Long-term debt, net of current maturities | — | 241,589 | 241,589 | ||||||||
Total liabilities | $ | — | $ | 241,758 | $ | 241,758 | |||||
8. Employee Benefit Plans
Pension Plan and Supplemental Executive Retirement Plan
We have a noncontributory defined benefit pension plan (the "Pension Plan") covering substantially all employees who were employed as of July 1, 2005, except certain employees who are covered by union-administered plans. Benefits are based on the number of years of service and each employee’s compensation near retirement. We make annual contributions to the Pension Plan consistent with federal funding requirements.
Annual benefits under the Supplemental Executive Retirement Plan ("SERP") are based on years of service and individual compensation near retirement. We have purchased life insurance contracts and other investments that could be used to fund the retirement benefits under this plan. The value of these insurance contracts and investments as of July 2, 2016 and June 27, 2015 were $11,890 and $11,819, respectively, and are included in the "Other noncurrent assets" line item in the Consolidated Balance Sheets.
We froze our Pension Plan and SERP effective December 31, 2006. Future growth in benefits will not occur beyond this date.
Applicable accounting standards require that the Consolidated Balance Sheet reflect the funded status of the pension and postretirement plans. The funded status of the plan is measured as the difference between the plan assets at fair value and the projected benefit obligation. Expected contributions to the plans over the next 12 months that exceed the fair value of plan assets are reflected in accrued liabilities and were $877 and $775 as of July 2, 2016 and June 27, 2015, respectively. All other liabilities have been included in the "Other noncurrent liabilities" line item in the Consolidated Balance Sheets.
Unrecognized differences between actual amounts and estimates based on actuarial assumptions are included in "Accumulated other comprehensive income" in our Consolidated Balance Sheets. The difference between actual amounts and estimates based on actuarial assumptions are recognized in other comprehensive income in the period in which they occur.
The estimated amortization from accumulated other comprehensive income into net periodic benefit cost during fiscal year 2017 is $3,963 and is primarily related to net actuarial losses.
45
Obligations and Funded Status at July 2, 2016 and June 27, 2015
Pension Plan | SERP | ||||||||||||||
2016 | 2015 | 2016 | 2015 | ||||||||||||
Change in benefit obligation: | |||||||||||||||
Projected benefit obligation, beginning of year | $ | 93,898 | $ | 91,251 | $ | 16,686 | $ | 17,610 | |||||||
Interest cost | 3,774 | 4,049 | 590 | 739 | |||||||||||
Actuarial loss/(gain) | 12,761 | 1,215 | 2,055 | (870 | ) | ||||||||||
Benefits paid | (2,586 | ) | (2,617 | ) | (808 | ) | (793 | ) | |||||||
Projected benefit obligation, end of year | $ | 107,847 | $ | 93,898 | $ | 18,523 | $ | 16,686 | |||||||
Change in plan assets: | |||||||||||||||
Fair value of plan assets, beginning of year | $ | 73,847 | $ | 75,985 | $ | — | $ | — | |||||||
Actual return on plan assets | 4,417 | 479 | — | — | |||||||||||
Employer contributions | — | — | 808 | 793 | |||||||||||
Benefits paid | (2,586 | ) | (2,617 | ) | (808 | ) | (793 | ) | |||||||
Fair value of plan assets, end of year | $ | 75,678 | $ | 73,847 | $ | — | $ | — | |||||||
Funded status-net amount recognized | $ | (32,169 | ) | $ | (20,051 | ) | $ | (18,523 | ) | $ | (16,686 | ) | |||
Amounts recognized in the Consolidated Balance Sheets consist of:
Pension Plan | SERP | ||||||||||||||
2016 | 2015 | 2016 | 2015 | ||||||||||||
Accrued benefit liability | $ | (32,169 | ) | $ | (20,051 | ) | $ | (18,523 | ) | $ | (16,686 | ) | |||
Net amount recognized | $ | (32,169 | ) | $ | (20,051 | ) | $ | (18,523 | ) | $ | (16,686 | ) | |||
Pension Plan | SERP | ||||||||||||||
2016 | 2015 | 2016 | 2015 | ||||||||||||
Accumulated other comprehensive loss/(gain) related to: | |||||||||||||||
Unrecognized net actuarial losses/(gains) | $ | 10,183 | $ | 3,625 | $ | 1,813 | $ | (1,261 | ) | ||||||
The projected benefit obligation, accumulated benefit obligation and fair value of plan assets for the pension plans with an accumulated benefit obligation in excess of plan assets were $107,847, $107,847 and $75,678, respectively, as of July 2, 2016 and $93,898, $93,898 and $73,847, respectively, as of June 27, 2015. No pension plans had plan assets in excess of accumulated benefit obligations at July 2, 2016 or June 27, 2015.
Components of Net Periodic Benefit Cost
Pension Plan | SERP | ||||||||||||||||||||||
2016 | 2015 | 2014 | 2016 | 2015 | 2014 | ||||||||||||||||||
Interest cost | $ | 3,774 | $ | 4,049 | $ | 3,968 | $ | 590 | $ | 739 | $ | 758 | |||||||||||
Expected return on assets | (4,272 | ) | (4,904 | ) | (4,638 | ) | — | — | — | ||||||||||||||
Amortization of net loss | 2,433 | 2,015 | 1,636 | 242 | 391 | 143 | |||||||||||||||||
Net periodic benefit cost | $ | 1,935 | $ | 1,160 | $ | 966 | $ | 832 | $ | 1,130 | $ | 901 | |||||||||||
Assumptions
The following weighted average assumptions were used to determine benefit obligations for the plans at July 2, 2016 and June 27, 2015:
Pension Plan | SERP | ||||||||||
2016 | 2015 | 2016 | 2015 | ||||||||
Discount rate | 3.95 | % | 4.70 | % | 3.73 | % | 4.45 | % | |||
Rate of compensation increase | N/A | N/A | N/A | N/A | |||||||
46
The following weighted average assumptions were used to determine net periodic benefit cost for the plans for the fiscal years ended July 2, 2016 and June 27, 2015:
Pension Plan | SERP | ||||||||||
2016 | 2015 | 2016 | 2015 | ||||||||
Discount rate | 4.70 | % | 4.50 | % | 4.45 | % | 4.30 | % | |||
Expected return on plan assets | 5.90 | 6.50 | N/A | N/A | |||||||
Rate of compensation increase | N/A | N/A | N/A | N/A | |||||||
Plan Assets
The asset allocations in the pension plan at July 2, 2016 and June 27, 2015 are as follows:
Target Asset Allocations | Actual Asset Allocations | |||||||
2016 | 2016 | 2015 | ||||||
International equity | 8.0 | % | 6.5 | % | 6.8 | % | ||
Large cap equity | 26.0 | 25.7 | 27.2 | |||||
Small cap equity | 5.0 | 5.0 | 5.2 | |||||
Absolute return strategy funds | 16.0 | 13.8 | 14.1 | |||||
Fixed income | 45.0 | 48.8 | 46.7 | |||||
Long/short equity fund | — | 0.2 | — | |||||
Total | 100 | % | 100 | % | 100 | % | ||
Our retirement committee, assisted by outside consultants, evaluates the objectives and investment policies concerning our long-term investment goals and asset allocation strategies. Plan assets are invested in various asset classes that are expected to produce a sufficient level of diversification and investment return over the long term. To develop the expected long-term rate of return on asset assumptions, we consider the historical returns and future expectations of returns for each asset class, as well as the target asset allocation, changes in investments expenses and investment goals of the pension portfolio. This resulted in the selection of 5.40% expected return on plan assets for fiscal year 2017 and 5.90% expected return on plan assets for fiscal year 2016. The investment goals are (1) to meet or exceed the assumed actuarial rate of return over the long term within reasonable and prudent levels of risk, and (2) to preserve the real purchasing power of assets to meet future obligations. The nature and duration of benefit obligations, along with assumptions concerning asset class returns and return correlations, are considered when determining an appropriate asset allocation to achieve the investment objectives. Pension plan assets for our qualified pension plans are held in a trust for the benefit of the plan participants and are invested in a diversified portfolio of equity investments, fixed income investments and cash. Risk targets are established and monitored against acceptable ranges. All investment policies and procedures are designed to ensure that the plans' investments are in compliance with the Employee Retirement Income Security Act. Guidelines are established defining permitted investments within each asset class.
During fiscal year 2012, we conducted a study to assess an asset-liability strategy. The results of this study emphasized the importance of managing the volatility of pension assets relative to pension liabilities while still achieving a competitive investment return, achieving diversification between and within various asset classes, and managing other risks. In order to reduce the volatility between the value of pension assets and liabilities, we have established a "glide path approach" whereby we will increase the allocation to fixed income investments as our funded status increases. We regularly review our actual asset allocation and periodically rebalance the investments to the targeted allocation when considered appropriate. Target allocation ranges are guidelines, not limitations, and occasionally due to market conditions and other factors actual asset allocation may vary above or below a target.
The implementation of the investment strategy discussed above is executed through a variety of investment structures, such as direct share, common/collective trusts, or registered investment companies. Valuation methodologies differ for each of these structures. The valuation methodologies used for these investment structures are as follows:
U.S. Government Securities, Corporate Debt and Registered Investment Companies: Investments are valued at the closing price reported on the active market on which the individual securities are traded.
Common/Collective Trusts (CCT): Investments in a collective investment vehicle are valued at their daily or monthly net asset value (NAV) per share or the equivalent. NAV per share or the equivalent is used for fair value purposes as a practical expedient. NAVs are calculated with the assistance of our investment manager or sponsor of the fund. Certain of the CCTs represent investments in hedge funds or funds of hedge funds as well as other commingled equity funds. The classification
47
level of these CCTs within the fair value hierarchy is determined by our ability to redeem the investment at NAV in the near term of the measurement date. Investments in the underlying CCTs are not valued using quoted prices in active markets. Therefore no investments are classified as Level 1. All investments in CCTs that are redeemable at the NAV reported by the investment managers within 90 days of the fiscal year end are classified as Level 2. All investments in the underlying CCTs that are not redeemable at the NAV reported by the investment managers of the CCTs within 90 days of the fiscal year end because of a lock-up period or gate, but may be redeemed at a future date, are classified as Level 3.
The methods described above may produce a fair value calculation that may not be indicative of net realizable value or reflective of future fair values. Furthermore, while we believe our valuation methods are appropriate and consistent with other market participants, the use of different methodologies or assumptions to determine the fair value of certain financial instruments could result in a different fair value measurement at the reporting date.
The following table presents the pension plan investments using the fair value hierarchy discussed in Note 7, "Fair Value Measurements" of Notes to Consolidated Financial Statements, as of July 2, 2016:
Quoted Prices in Active Markets for Identical Assets (Level 1) | Significant Other Observable Inputs (Level 2) | Total | |||||||||
Cash equivalents | $ | 420 | $ | — | $ | 420 | |||||
Receivable | 691 | — | 691 | ||||||||
Payable | (172 | ) | — | (172 | ) | ||||||
U.S. government securities | 5,405 | 1,898 | 7,303 | ||||||||
Corporate debt | — | 28,894 | 28,894 | ||||||||
Registered investment companies | 38,542 | — | 38,542 | ||||||||
Total | $ | 44,886 | $ | 30,792 | $ | 75,678 | |||||
The following table presents the pension plan investments using the fair value hierarchy discussed in Note 7, "Fair Value Measurements" of Notes to Consolidated Financial Statements, as of June 27, 2015:
Quoted Prices in Active Markets for Identical Assets (Level 1) | Significant Other Observable Inputs (Level 2) | Total | |||||||||
Interest-bearing cash | $ | 997 | $ | — | $ | 997 | |||||
Payable | (59 | ) | — | (59 | ) | ||||||
Common/collective trusts | — | 3,834 | 3,834 | ||||||||
U.S. government securities | 6,866 | — | 6,866 | ||||||||
Corporate debt | — | 26,663 | 26,663 | ||||||||
Registered investment companies | 35,546 | — | 35,546 | ||||||||
Total | $ | 43,350 | $ | 30,497 | $ | 73,847 | |||||
The following table presents a reconciliation of Level 3 assets held during the year ended June 27, 2015. During the year ended July 2, 2016 there were no Level 3 asset held.
For the Fiscal Year | |||
2015 | |||
Balance at beginning of the year | $ | 167 | |
Realized gains | 15 | ||
Net unrealized gains | (9 | ) | |
Net purchases, issuances and settlements | (173 | ) | |
Balance at end of the year | $ | — | |
48
We expect no contributions to our pension plan and $877 to the SERP in fiscal year 2017.
Future changes in plan asset returns, assumed discount rates and various other factors related to our pension plan will impact our future pension expense and liabilities. We cannot predict the impact of these changes in the future and any changes may have a material impact on our results of operations and financial position.
Estimated Future Benefit Payments
The following benefit payments are expected to be paid:
Pension Plan | SERP | ||||||
2017 | $ | 2,875 | $ | 877 | |||
2018 | 3,073 | 929 | |||||
2019 | 3,293 | 978 | |||||
2020 | 3,592 | 998 | |||||
2021 | 3,902 | 1,021 | |||||
2022 to 2024 | 22,905 | 5,306 | |||||
The estimated future benefit payments related to fiscal year 2017 exclude the expected lump sum payments discussed in Note 15, "Subsequent Events" of Notes to Consolidated Financial Statements.
Multi-Employer Pension Plans
Historically, we participated in a number of collectively bargained, union sponsored multi-employer pension plans ("MEPPs"). Consistent with the accounting for defined contribution plans, we previously recorded the required cash contributions to the MEPPs as an expense in the period incurred and recognized a liability for any contributions due and unpaid. In addition, we are responsible for our proportional share of any unfunded vested benefits related to the MEPPs. An employer's accounting for MEPPs provides that a withdrawal liability should be recorded if circumstances that give rise to an obligation become probable and estimable.
As of June 27, 2015, we have withdrawn from, and no longer participate in any MEPPs in the United States.
During fiscal years 2015 and 2014 we recorded total pretax charges related to the exit from all MEPPs of $6,500 and $9,854, respectively. There were no similar charges recorded in fiscal year 2016. In addition, during fiscal years 2016, 2015 and 2014, we made total payments related to our MEPP liabilities of $8,856, $28,875 and $3,847, respectively, including settlement payments of $7,903 in fiscal year 2016 and $24,799 in fiscal year 2015. Total remaining reserves for all MEPPs as of July 2, 2016 are $803.
Central States Southeast and Southwest Areas Pension Fund (“Central States Fund”)
Beginning in fiscal year 2012, we commenced negotiations to discontinue our participation in the Central States Fund. We were ultimately successful and withdrew our participation in the Central States Fund in stages as various union contracts expired. On June 11, 2015, we entered into a settlement agreement (the “Settlement Agreement”) with the Central States Fund to resolve matters related to the withdrawal liability and the related arbitration. Pursuant to the Settlement Agreement, we made a lump sum payment to the pension fund in the amount of $24,799 and agreed to dismiss the arbitration. In addition, the Central States Fund released all claims for collection of the withdrawal liability and related assessments, subject to our representations and warranties regarding contributions to the Central States Fund, related contribution base units and trades or businesses under common control of the company. We funded the payment under the Settlement Agreement through use of existing resources, including our revolving credit facility.
Other United States MEPPs
On December 28, 2015 we entered into a settlement agreement with the National Retirement Fund to resolve matters related to our previous withdrawal. Pursuant to this agreement, we made a lump sum payment to the fund in the amount of $5,425. On June 15, 2016, we entered into an agreement with the New England Teamsters and made a lump sum payment of $2,478 to pay the remaining balance of our withdrawal liability and resolve all remaining outstanding claims to the fund. As assessments, subject to our representations and warranties regarding contributions to the funds, related contribution base units and trades or businesses under common control of the company. We funded the payments under the settlement agreements through the use of existing resources, including available cash and our revolving credit facility. The amount of the settlements were within previously established reserves.
Canadian MEPPs
Our Canadian subsidiaries participate in three multi-employer retirement funds, collectively referred to as the Canadian
49
MEPPs. These plans provide monthly retirement payments on the basis of the credits earned by the participating employees. For two of the plans, in the event that the plans are underfunded, the monthly participant benefit amount can be reduced by the trustees of the plan and we are not responsible for the underfunded status of the plan. For the third plan, employers can be held liable for unfunded liabilities and solvency deficiencies and accrued benefits cannot be reduced if there is a deficit unless the employer is insolvent. With respect to our exposure to the third plan, the most recent actuarial valuation as of December 31, 2014 indicates a surplus of approximately 18.0%.
401(k) Plan
All full-time non-union and certain union U.S. employees are eligible to participate in a 401(k) plan. Employee contributions are invested, at the employees' direction, among a variety of investment alternatives. Participants may transfer amounts into and out of the investment alternatives at any time. Participants receive a matching contribution of 100% of the first 3% of the participant's contributed pay plus 50% of the next 2% of the participant’s contributed pay. The matching contributions under the 401(k) plan vest immediately. We incurred matching contribution expense of $5,861, $5,578 and $5,310 in fiscal years 2016, 2015 and 2014, respectively.
Executive Deferred Compensation Plan
Under the Executive Deferred Compensation Plan ("DEFCO Plan"), we match a portion of designated employees' contributions. Employee contributions, along with our match, are invested at the employees' direction, among a variety of investment alternatives. Participants may transfer amounts into and out of the investment alternatives at any time. Eligible participants receive a matching contribution of 50% of the first 10% of the participant's contributed pay plus an additional 2.5% of the participant's eligible pay. Our expense associated with the DEFCO Plan was $1,175, $1,001 and $1,167 in fiscal years 2016, 2015 and 2014, respectively. The accumulated benefit obligation of $33,080 and $34,414 as of July 2, 2016 and June 27, 2015, respectively has been split between "Other noncurrent liabilities" and "Compensation and employee benefits" in the accompanying Consolidated Balance Sheets. We have purchased investments, including stable income and stock index managed funds, based on investment elections made by the employees, which may be used to fund the retirement benefits. The investments are recorded at estimated fair value based on quoted market prices and are split between "Other current assets" and "Other noncurrent assets" in the accompanying Consolidated Balance Sheets. Offsetting unrealized gains and losses are included in income on a current basis. At July 2, 2016 and June 27, 2015, the estimated fair value of the investments was $33,080 and $34,414, respectively.
9. Income Taxes
The components of the provision for income taxes from continuing operations are as follows:
Fiscal Years | 2016 | 2015 | 2014 | ||||||||
Current: | |||||||||||
Federal | $ | 17,140 | $ | 9,912 | $ | 10,723 | |||||
State and local | 2,296 | 1,905 | 844 | ||||||||
Foreign | 4,324 | 3,751 | 5,283 | ||||||||
23,760 | 15,568 | 16,850 | |||||||||
Deferred | 19,606 | 18,638 | 16,880 | ||||||||
Provision for income taxes from continuing operations | $ | 43,366 | $ | 34,206 | $ | 33,730 | |||||
The following table reconciles the United States statutory income tax rate with our effective income tax rate from continuing operations:
Fiscal Years | 2016 | 2015 | 2014 | |||||
United States statutory rate | 35.0 | % | 35.0 | % | 35.0 | % | ||
State taxes, net of federal tax benefit | 2.4 | 2.8 | 3.0 | |||||
Foreign earnings taxed at different rates | — | (0.3 | ) | — | ||||
Change in uncertain tax position reserve | — | (1.0 | ) | — | ||||
Permanent differences and other, net | — | (0.1 | ) | (0.4 | ) | |||
Effective income tax rate from continuing operations | 37.4 | % | 36.4 | % | 37.6 | % | ||
The change in the uncertain tax position reserve in fiscal year 2015 was the result of the expiration of certain statutes and the resolution of a Canadian transfer pricing audit related to fiscal years 2005 to 2007, offset by reserve additions during the year.
50
The tax effects of temporary differences that give rise to deferred tax assets and liabilities are as follows:
Fiscal Years | 2016 | 2015 | |||||
Deferred tax liabilities: | |||||||
Inventory | $ | (49,196 | ) | $ | (47,888 | ) | |
Depreciation | (24,519 | ) | (12,899 | ) | |||
Intangibles | (60,866 | ) | (57,146 | ) | |||
Derivative financial instruments | — | (2,630 | ) | ||||
Other | (54 | ) | (904 | ) | |||
Total deferred tax liabilities | (134,635 | ) | (121,467 | ) | |||
Deferred tax assets: | |||||||
Compensation and employees benefits | 45,088 | 44,833 | |||||
Accruals and reserves | 11,486 | 10,859 | |||||
Share-based payments | 4,437 | 4,025 | |||||
Derivative financial instruments | 2,320 | — | |||||
Net operating loss carry-forwards | 1,674 | 1,693 | |||||
Other | 1,938 | 1,986 | |||||
Gross deferred tax assets | 66,943 | 63,396 | |||||
Less valuation allowance | (1,203 | ) | (1,209 | ) | |||
Total deferred tax assets | 65,740 | 62,187 | |||||
Net deferred tax liabilities | $ | (68,895 | ) | $ | (59,280 | ) | |
The deferred tax assets include $1,674 and $1,693 at July 2, 2016 and June 27, 2015, respectively, related to state net operating loss carry-forwards which expire between fiscal year 2018 and fiscal year 2035.
We recognize a valuation allowance if it is more likely than not that at least some portion, or all, of a deferred tax asset will not be realized. The valuation allowance of $1,203 at July 2, 2016 and $1,209 at June 27, 2015, relates to capital loss carry-forwards.
We have no foreign tax credit carry-forwards as of July 2, 2016.
We have not provided U.S. income taxes and foreign withholding taxes on undistributed earnings from our foreign subsidiaries of approximately $46,296 and $48,729 as of July 2, 2016 and June 27, 2015, respectively. These earnings are considered to be indefinitely reinvested in the operations of such subsidiaries. It is not practicable to estimate the amount of tax that may be payable upon distribution.
We recognize interest and penalties related to uncertain tax positions as a component of income tax expense. We recognized a net benefit from tax-related interest and penalties of $64 and $795 in fiscal years 2016 and 2015, respectively; and net expense from interest and penalties in fiscal year 2014 of $351. As of July 2, 2016 and June 27, 2015, we had $760 and $930, respectively, of accrued interest and penalties related to uncertain tax positions, of which $193 and $729 would favorably affect our effective tax rate in any future periods, if the positions are effectively settled in our favor.
We file income tax returns in the United States, Canada and numerous state and local jurisdictions. We have substantially concluded all U.S. Federal income tax examinations through fiscal year 2012 and all Canadian income tax examinations through fiscal year 2009. With few exceptions, we are no longer subject to state and local income tax examinations prior to fiscal year 2011.
51
A reconciliation of the beginning and ending amount of unrecognized tax benefits are as follows:
Fiscal Years | 2016 | 2015 | |||||
Beginning balance | $ | 8,839 | $ | 10,826 | |||
Tax positions related to current year: | |||||||
Gross increase | 1,364 | 1,487 | |||||
Tax positions related to prior years: | |||||||
Gross increase | 577 | 208 | |||||
Gross decrease | (867 | ) | (547 | ) | |||
Settlements | (50 | ) | (1,670 | ) | |||
Lapses in statutes of limitations | (1,903 | ) | (1,465 | ) | |||
Ending balance | $ | 7,960 | $ | 8,839 | |||
As of July 2, 2016 and June 27, 2015, the total amount of unrecognized tax benefits that would favorably affect the effective tax rate, if recognized was $1,439 and $821, respectively. We are not aware of any tax positions for which it is reasonably possible that the total amounts of unrecognized tax benefits will significantly change in the next 12 months.
10. Stockholders' Equity
We issue Class A shares of our common stock, and each share is entitled to one vote and is freely transferable.
In August 2015, our Board of Directors authorized a $100,000 increase in our share repurchase program, bringing the total amount authorized to $275,000 as of July 2, 2016. Under this repurchase program, we repurchased 510,841 shares totaling $34,524 in fiscal year 2016, 266,426 shares totaling $17,597 in fiscal year 2015 and 204,819 totaling $11,672 in fiscal year 2014. All of these repurchases were in open market transactions. As of July 2, 2016, we had approximately $94,043 remaining under this authorization.
Share-Based Payment Plans
On November 6, 2013, our shareholders approved the G&K Services, Inc. Restated Equity Incentive Plan (2013) ("Restated Plan"). The total number of authorized shares under the Restated Plan is 4,000,000, of which 1,600,000 of the awards granted under the Restated Plan can be stock appreciation rights, restricted stock, restricted stock units, deferred stock units or stock. As of July 2, 2016, 1,206,048 equity awards were available for grant.
The Restated Plan allows us to grant share-based awards, including restricted stock and options to purchase our common stock, to our key employees and non-employee directors. Stock options are granted for a fixed number of shares with an exercise price equal to the fair market value of the shares at the date of grant. Exercise periods for the stock options are generally limited to a maximum of 10 years and a minimum of one year and generally vest over three years. Restricted stock grants to employees generally vest over five years. We issue new shares upon the grant of restricted stock or exercise of stock options.
Compensation cost for share-based compensation plans is recognized on a straight-line basis over the requisite service period of the award. The share-based compensation reflects estimated forfeitures adjusted for actual forfeiture experience. The amount of compensation cost that has been recognized in the Consolidated Statements of Operations was $6,749, $6,219 and $6,318 for fiscal years 2016, 2015 and 2014, respectively. As share-based compensation expense is recognized, a deferred tax asset is recorded that represents an estimate of the future tax deduction from the exercise of stock options or release of restrictions on the restricted stock. At the time share-based awards are exercised, cancelled, expire or restrictions lapse, we recognize adjustments to additional paid-in capital or income tax expense. The total net income tax benefit recognized in the Consolidated Statements of Operations for share-based compensation arrangements was $2,423, $2,333 and $2,243 for fiscal years 2016, 2015 and 2014, respectively. No amount of share-based compensation expense was capitalized during the periods presented.
On August 23, 2012, our Chairman and Chief Executive Officer was granted a performance based restricted stock award (the "Performance Award"). The Performance Award has both a financial performance component and a service component. In fiscal year 2016 126,000 restricted shares were issued under the Performance Award.
The fair value of each stock option grant is estimated on the date of grant using the Black-Scholes or similar option pricing model using the assumptions noted in the following table. Expected volatility is based on the historical volatility of our stock, as we believe that is the best estimate of volatility over the term of the options. We use historical data to estimate option exercises and employee terminations within the valuation model. The expected term of the options granted is derived from historical data and represents the period of time that options granted are expected to be outstanding. The risk free interest rate for each option is the interpolated market yield on a U.S. Treasury bill with a term comparable to the expected term of the granted stock option.
52
For the Fiscal Years | |||||
2016 | 2015 | 2014 | |||
Expected share price volatility | 24.6% - 25.3% | 27.6% - 28.7% | 27.4% - 27.7% | ||
Weighted average volatility | 25.3% | 28.2% | 27.5% | ||
Expected dividend yield | 1.7% - 2.1% | 1.8% - 2.4% | 2.0% | ||
Expected term (in years) | 5 | 5 | 5 - 6 | ||
Risk free rate | 1.2% - 1.5% | 1.3% - 1.7% | 1.6% - 2.0% | ||
A summary of stock option activity under our plans as of July 2, 2016, and changes during the year then ended is presented below:
Shares | Weighted Average Exercise Prices | Weighted Average Remaining Contractual Term (in years) | Aggregate Intrinsic Value | |||||||||
Outstanding at June 27, 2015 | 632,287 | $ | 32.31 | |||||||||
Granted | 185,442 | 71.17 | ||||||||||
Exercised | (89,135 | ) | 24.23 | |||||||||
Forfeited or expired | (11,185 | ) | 61.53 | |||||||||
Outstanding at July 2, 2016 | 717,409 | $ | 42.90 | 6.75 | $ | 24,255 | ||||||
Exercisable at July 2, 2016 | 415,503 | $ | 27.79 | 5.41 | $ | 20,324 | ||||||
The weighted-average fair value of stock options on the date of grant during fiscal years 2016, 2015 and 2014 was $14.19, $11.74 and $12.16, respectively. The total intrinsic value of stock options exercised was $4,016, $14,874 and $12,093 for fiscal years 2016, 2015 and 2014, respectively.
We received proceeds from the exercise of stock options of $2,160, $6,283 and $8,748 in fiscal years 2016, 2015 and 2014, respectively.
A summary of the status of our non-vested shares of restricted stock as of July 2, 2016 and changes during the fiscal year ended July 2, 2016, is presented below:
Shares | Weighted-Average Grant-Date Fair Value | |||||
Non-vested at June 27, 2015 | 224,121 | $ | 47.45 | |||
Granted | 201,032 | 70.26 | ||||
Vested | (165,822 | ) | 56.80 | |||
Forfeited | (11,556 | ) | 49.25 | |||
Non-vested at July 2, 2016 | 247,775 | $ | 59.61 | |||
As of July 2, 2016, there was $11,125 of total unrecognized compensation expense related to non-vested share-based compensation arrangements. That expense is expected to be recognized over a weighted-average period of 2.0 years. The total fair value of restricted shares vested during the fiscal years ended 2016, 2015 and 2014 was $9,419, $3,691 and $2,757, respectively.
11. Accumulated Other Comprehensive Income (Loss)
The components of accumulated other comprehensive income, net of tax, are as follows:
For the Fiscal Years | |||||||||||
2016 | 2015 | 2014 | |||||||||
Foreign currency translation | $ | 3,963 | $ | 7,914 | $ | 22,682 | |||||
Pension benefit liabilities | (28,929 | ) | (21,272 | ) | (19,748 | ) | |||||
Derivative financial instruments | (3,901 | ) | 4,414 | 1,053 | |||||||
Accumulated other comprehensive (loss) income | $ | (28,867 | ) | $ | (8,944 | ) | $ | 3,987 | |||
53
Changes in accumulated other comprehensive (loss) income are as follows:
For the Fiscal Year Ended July 2, 2016 | |||||||||||||||
Foreign currency translation adjustment | Pension benefit liabilities | Derivative financial instruments | Total | ||||||||||||
Accumulated other comprehensive income (loss) as of June 27, 2015 | $ | 7,914 | $ | (21,272 | ) | $ | 4,414 | $ | (8,944 | ) | |||||
Other comprehensive loss before reclassifications | (3,951 | ) | (9,348 | ) | (8,175 | ) | (21,474 | ) | |||||||
Reclassifications from net accumulated other comprehensive income | — | 1,691 | (140 | ) | 1,551 | ||||||||||
Net current period other comprehensive loss | (3,951 | ) | (7,657 | ) | (8,315 | ) | (19,923 | ) | |||||||
Accumulated other comprehensive income (loss) at July 2, 2016 | $ | 3,963 | $ | (28,929 | ) | $ | (3,901 | ) | $ | (28,867 | ) | ||||
For the Fiscal Year Ended June 27, 2015 | |||||||||||||||
Foreign currency translation adjustment | Pension benefit liabilities | Derivative financial instruments | Total | ||||||||||||
Accumulated other comprehensive income (loss) as of June 28, 2014 | $ | 22,682 | $ | (19,748 | ) | $ | 1,053 | $ | 3,987 | ||||||
Other comprehensive income (loss) before reclassifications | (14,768 | ) | (2,983 | ) | 3,027 | $ | (14,724 | ) | |||||||
Reclassifications from net accumulated other comprehensive income | — | 1,459 | 334 | $ | 1,793 | ||||||||||
Net current period other comprehensive income (loss) | (14,768 | ) | (1,524 | ) | 3,361 | (12,931 | ) | ||||||||
Accumulated other comprehensive income (loss) at June 27, 2015 | $ | 7,914 | $ | (21,272 | ) | $ | 4,414 | $ | (8,944 | ) | |||||
Amounts reclassified from accumulated other comprehensive income are as follows:
For the Fiscal Years | |||||||||||
2016 | 2015 | 2014 | |||||||||
(Loss) gain on derivative financial instruments: | |||||||||||
Interest rate swap contracts (a) | $ | (223 | ) | $ | 532 | $ | 533 | ||||
Tax benefit (expense) | 83 | (198 | ) | (202 | ) | ||||||
Total, net of tax | (140 | ) | 334 | 331 | |||||||
Pension benefit liabilities: | |||||||||||
Amortization of net loss (b) | 2,706 | 2,373 | 1,813 | ||||||||
Tax expense | (1,015 | ) | (914 | ) | (681 | ) | |||||
Total, net of tax | 1,691 | 1,459 | 1,132 | ||||||||
Total amounts reclassified, net of tax | $ | 1,551 | $ | 1,793 | $ | 1,463 | |||||
(a) Included in interest expense. | |||||||||||
(b) Included in the computation of net periodic pension cost, which is included in cost of rental and direct sale revenue and selling and administrative. | |||||||||||
Income tax (expense) benefit for each component of other comprehensive income are as follows:
For the Fiscal Years | |||||||||||
2016 | 2015 | 2014 | |||||||||
Foreign currency translation adjustments | 1,237 | 3,861 | 386 | ||||||||
Change in pension benefit liabilities recognized | 4,592 | 891 | 2,474 | ||||||||
Derivative financial instruments unrecognized | 4,871 | (1,804 | ) | 138 | |||||||
Derivative financial instruments reclassified | 83 | (198 | ) | (202 | ) | ||||||
Income tax benefit | $ | 10,783 | $ | 2,750 | $ | 2,796 | |||||
54
12. Commitments and Contingencies
We are involved in a variety of legal actions relating to personal injury, employment, environmental and other legal matters arising in the normal course of business, including, without limitation, those described below.
Environmental Matters
From time-to-time, we are involved in environmental-related proceedings by certain governmental agencies, which relate primarily to allegedly operating certain facilities in noncompliance with required permits. In addition to these proceedings, in the normal course of our business, we are subject to, among other things, periodic inspections by regulatory agencies, and we are involved in the remediation of various properties.
In particular, we have three projects nearing completion, which we expect will be completed within previously established reserves. We also have four other projects on which we are currently working. Historically, we have borne our property remediation costs as part of our ongoing operations. As part of the second set of projects mentioned above, in the fourth quarter of fiscal year 2015, we determined it was likely that the parties that are contractually obligated to remediate contamination resulting from prior use of perchloroethylene, or PCE and other contaminants at three of our previously purchased locations would not be able to continue to meet these obligations because of their respective financial condition. These acquisitions date as far back as the 1970s; the most recent one was in 2007. As a result of the foregoing, as of July 2, 2016 and June 27, 2015, we had remediation-related reserves of approximately $3,607 and $4,711 respectively, related to these matters. The expense for these matters was not material in fiscal year 2016 and $4,405 in fiscal year 2015.
In order to determine whether any additional exposure for remediation exists, we assessed six additional sites which we acquired that had historical dry cleaning operations. Our assessment of four of these sites is complete, with no further action required. We continue to assess the remaining two sites. With respect to these remaining two sites, while we believe costs may be probable, they are not yet reasonably estimable. Therefore, beyond amounts to cover our ongoing assessments, we have not recorded any reserves for these properties. While such charges may be material, including with respect to reported operating results in a particular period, we believe the likelihood that any charges will have a material adverse effect on our results of ongoing operations or financial position is remote.
Legal Matters
As part of its general enforcement efforts, over the past four years, the U.S. Department of Labor, Office of Federal Contract Compliance Programs (OFCCP) initiated compliance evaluations at a number of our locations to review and assess our current affirmative action activities and employment practices. To close all outstanding compliance evaluations, we entered into a Conciliation Agreement with the OFCCP agreeing to take proactive efforts to address any remaining issues or concerns that were raised by the agency, none of which we expect will have a material impact on our ongoing operations. All amounts that we agreed to pay under this agreement were within previously established reserves.
Leases
We lease certain facilities, vehicles and equipment for varying periods. Most facility leases contain renewal options from one to five years. Management expects that in the normal course of business, leases will be renewed or replaced by other leases.
The following is a schedule as of July 2, 2016 of future minimum base rental payments for operating leases that had initial or remaining lease terms in excess of one year:
Operating Leases | |||
2017 | $ | 19,532 | |
2018 | 14,752 | ||
2019 | 11,923 | ||
2020 | 8,657 | ||
2021 | 6,059 | ||
2022 and thereafter | 8,407 | ||
Total minimum lease payments | $ | 69,330 | |
Total rent expense for operating leases, including those with terms of less than one year, was $29,103 in fiscal year 2016, $31,964 in fiscal year 2015 and $31,677 in fiscal year 2014.
13. Segment Information
We have two operating segments, United States (includes our Dominican Republic operations) and Canada, which have been identified as components of our organization that are reviewed by our Chairman and Chief Executive Officer to determine
55
resource allocation and evaluate performance. Each operating segment derives revenues from the branded uniform and facility services programs. Our largest customer represents approximately 2% of our total revenues. Substantially all of our customers are in the United States and Canada.
The accounting policies of the segments are the same as those described in the summary of significant accounting policies (see Note 1, "Summary of Significant Accounting Policies" of Notes to Consolidated Financial Statements). Corporate expenses are allocated to the segments based on benefit received. We evaluate performance based on income from continuing operations.
Financial information by segment is as follows:
United States | Canada | Elimination | Total | ||||||||||||
2016 | |||||||||||||||
Revenues | $ | 842,350 | $ | 135,691 | $ | — | $ | 978,041 | |||||||
Income from continuing operations | 106,013 | 16,627 | — | 122,640 | |||||||||||
Interest expense | 6,833 | 2 | — | 6,835 | |||||||||||
Total assets | 884,033 | 136,690 | (99,186 | ) | 921,537 | ||||||||||
Capital expenditures | 41,393 | 3,956 | — | 45,349 | |||||||||||
Depreciation and amortization expense | 32,930 | 3,574 | — | 36,504 | |||||||||||
Provision for income taxes | 38,983 | 4,383 | — | 43,366 | |||||||||||
2015 | |||||||||||||||
Revenues | $ | 796,855 | $ | 140,787 | $ | — | $ | 937,642 | |||||||
Income from continuing operations | 85,207 | 16,007 | — | 101,214 | |||||||||||
Interest expense | 7,059 | 79 | — | 7,138 | |||||||||||
Total assets | 885,295 | 133,563 | (90,661 | ) | 928,197 | ||||||||||
Capital expenditures | 51,032 | 4,806 | — | 55,838 | |||||||||||
Depreciation and amortization expense | 28,644 | 3,654 | — | 32,298 | |||||||||||
Provision for income taxes | 31,443 | 2,763 | — | 34,206 | |||||||||||
2014 | |||||||||||||||
Revenues | $ | 752,802 | $ | 148,067 | $ | — | $ | 900,869 | |||||||
Income from continuing operations | 79,290 | 16,825 | — | 96,115 | |||||||||||
Interest expense | 6,320 | — | — | 6,320 | |||||||||||
Total assets | 859,474 | 170,775 | (106,730 | ) | 923,519 | ||||||||||
Capital expenditures | 29,053 | 3,723 | — | 32,776 | |||||||||||
Depreciation and amortization expense | 26,743 | 4,134 | — | 30,877 | |||||||||||
Provision for income taxes | 28,684 | 5,046 | — | 33,730 | |||||||||||
56
14. Discontinued Operations
In fiscal year 2014, we sold our Direct Sale Program business ("Program Business") and Ireland business ("Ireland Business"), which met the requirements to be presented as discontinued operations and accordingly, the results of these operations have been reclassified to discontinued operations for fiscal year 2014 in the Consolidated Statements of Operations. Both of these businesses were previously included in our United States operating segment. There were no discontinued operations for fiscal year 2016 or 2015.
As a result of this agreement, we reduced the carrying value of the Program Business net assets and recorded a corresponding pretax loss on the sale of $12,319, which is included in "Loss on sale and other adjustments, net of tax" in the table below. Separately, we completed the sale of our Ireland Business during the second quarter of fiscal year 2014 and recognized a pretax loss on the sale of $603, which has also been included in "Loss on sale and other adjustments, net of tax" in the table below. Total aggregate gross proceeds from the sales were $6,641.
Summarized financial information for discontinued operations is shown below:
For the Fiscal Year | ||||
2014 | ||||
Rental and direct sale revenue from discontinued operations | $ | 17,844 | ||
Loss before income taxes | (279 | ) | ||
Loss, net of tax | (141 | ) | ||
Loss on sale and other adjustments, net of tax | (8,252 | ) | ||
Net loss from discontinued operations, net of tax | $ | (8,393 | ) | |
For the Fiscal Year | ||||
2014 | ||||
Loss in excess of carrying value of Program Business | $ | (11,559 | ) | |
Transaction and related costs | (675 | ) | ||
Loss on sale of Program Business | (12,234 | ) | ||
Loss on sale of Ireland Business | (603 | ) | ||
Pretax loss on sale of businesses | (12,837 | ) | ||
Income tax benefit | 4,585 | |||
Loss on sale and other adjustments, net of tax | $ | (8,252 | ) | |
15. Subsequent Events (Unaudited)
Pension Plan
In the fourth quarter of fiscal year 2016, in an effort to continue to reduce the risk in the company's Pension Plan, we announced a voluntary, limited-time opportunity to former employees who are vested participants in the Pension Plan to request early payment of their entire Pension Plan benefit in the form of a single lump sum payment. Eligible participants who wished to receive the lump sum payment were required to make an election between May 16, 2016 and July 15, 2016, and payments are scheduled to be made on or before August 31, 2016. All payments will be made from the Pension Plan trust assets. The target population has a total liability of $34,200. Based upon the participation rate of eligible participants, the amount of total payments is expected to be approximately $17,200. Because of the expected level of payments, settlement accounting rules will apply in the period in which the payments are made. This will result in a plan remeasurement and the recognition of an approximate $6,000 settlement loss, approximately $0.20 per share, related to the pro-rata portion of the unamortized net actuarial loss which will be recognized in the first quarter of fiscal year 2017.
Proposed Merger with Cintas Corporation
On August 15, 2016, we entered into an Agreement and Plan of Merger (the “Merger Agreement”) with Cintas Corporation (“Cintas”) and Bravo Merger Sub, Inc., a wholly owned subsidiary of Cintas (“Merger Sub”). The Merger Agreement is currently expected to close within 4-6 months, subject to customary closing conditions, including regulatory approvals and approval by our shareholders.
57
The Merger Agreement provides that, among other things and subject to the terms and conditions of the Merger Agreement, Merger Sub will be merged with and into the company (the “Merger”), with the company surviving and continuing as the surviving corporation in the Merger as a wholly owned subsidiary of Cintas, and, at the effective time of the Merger, each outstanding share of Class A common stock of the company will be converted into the right to receive the Merger Consideration. The “Merger Consideration” means $97.50 per share in cash. The Merger Agreement contains customary representations and warranties and covenants that we must observe, including certain interim operating covenants that may restrict our operations during the pendency of the Merger, subject to certain exceptions. If the Merger proceeds, certain change of control and severance provisions of our compensation arrangements will be triggered at the time of the Merger. In addition, the Merger Agreement also contains certain termination rights that may require us to pay Cintas a $60,000 termination fee. For additional details of the Merger and the terms thereof, refer to the Merger Agreement, a copy of which is included as Exhibit 2.1 to our Current Report on Form 8-K filed with the Securities and Exchange Commission on August 16, 2016.
We did not incur any material expenses in connection with the Merger during our fiscal year ended July 2, 2016.
G&K Services, Inc.
Schedule II – Valuation and Qualifying Accounts and Reserves
(In thousands)
Additions | |||||||||||||||||||
Description | Balance at Beginning of Year | Charged to Costs and Expenses | Charged to Other Accounts | Deductions | Balance at End of Year | ||||||||||||||
Allowance for Doubtful Accounts | |||||||||||||||||||
July 2, 2016 | $ | 3,469 | $ | 2,962 | $ | — | $ | 2,853 | 3,578 | ||||||||||
June 27, 2015 | $ | 3,697 | $ | 1,711 | $ | — | $ | 1,939 | 3,469 | ||||||||||
June 28, 2014 | $ | 3,135 | $ | 1,980 | $ | — | $ | 1,418 | $ | 3,697 | |||||||||
ITEM 9. | CHANGES IN AND DISAGREEMENTS WITH ACCOUNTANTS ON ACCOUNTING AND FINANCIAL DISCLOSURE |
None.
ITEM 9A. | CONTROLS AND PROCEDURES |
Disclosure controls and procedures (as defined in Exchange Act Rules 13a-15(e) and 15d-15(e)) are our controls and other procedures that are designed to ensure that information required to be disclosed by us in the reports that we file or submit under the Exchange Act is recorded, processed, summarized and reported within the time periods specified in the Securities and Exchange Commission’s rules and forms. Disclosure controls and procedures include, without limitation, controls and procedures designed to ensure that information required to be disclosed by us in the reports that we file or submit under the Exchange Act is accumulated and communicated to our management, including our Chairman and Chief Executive Officer and Chief Financial Officer, as appropriate to allow timely decisions regarding required disclosure.
Evaluation of Disclosure Controls and Procedures
We have evaluated the effectiveness of the design and operation of our disclosure controls and procedures as of July 2, 2016. Based on that evaluation, the Chairman and Chief Executive Officer and the Chief Financial Officer concluded that our disclosure controls and procedures are effective in recording, processing, summarizing and timely reporting information required to be disclosed in the reports that we file or submit under the Exchange Act as of July 2, 2016.
Management’s Annual Report on Internal Control Over Financial Reporting
The report of management required under this Item 9A is contained in Item 8 of this Annual Report on Form 10-K under the caption "Management’s Report on Internal Control Over Financial Reporting."
Attestation Report of Registered Public Accounting Firm
The attestation report required under this Item 9A is contained in Item 8 of this Annual Report on Form 10-K under the caption "Report of Independent Registered Public Accounting Firm."
Changes in Internal Controls
There were no changes in our internal control over financial reporting during the fourth quarter of fiscal year 2016 that have materially affected, or are reasonably likely to materially affect, our internal control over financial reporting.
58
ITEM 9B. | OTHER INFORMATION |
None.
59
PART III
ITEM 10. | DIRECTORS, EXECUTIVE OFFICERS AND CORPORATE GOVERNANCE |
The information required by this Item will be provided in accordance with Instruction G(3) to Form 10-K not later than 120 days after the end of the fiscal year covered by this Form 10-K.
ITEM 11. | EXECUTIVE COMPENSATION |
The information required by this Item will be provided in accordance with instruction G(3) to Form 10-K not later than 120 days after the end of the fiscal year covered by this Form 10-K.
ITEM 12. | SECURITY OWNERSHIP OF CERTAIN BENEFICIAL OWNERS AND MANAGEMENT AND RELATED STOCKHOLDER MATTERS |
The information required by this Item will be provided in accordance with instruction G(3) to Form 10-K not later than 120 days after the end of the fiscal year covered by this Form 10-K.
ITEM 13. | CERTAIN RELATIONSHIPS AND RELATED TRANSACTIONS AND DIRECTOR INDEPENDENCE |
The information required by this Item will be provided in accordance with instruction G(3) to Form 10-K not later than 120 days after the end of the fiscal year covered by this Form 10-K.
ITEM 14. | PRINCIPAL ACCOUNTANT FEES AND SERVICES |
The information required by this Item will be provided in accordance with instruction G(3) to Form 10-K not later than 120 days after the end of the fiscal year covered by this Form 10-K.
60
PART IV, ITEM 15
ITEM 15. | EXHIBITS AND FINANCIAL STATEMENT SCHEDULES |
(a) | The following documents are filed as a part of this report: |
(1) | Financial Statements |
The Consolidated Financial Statements of the Registrant are set forth in Item 8 of Part II of this report.
(2) | Financial Statement Schedules |
All schedules for which provision is made in the applicable accounting regulations of the SEC have been omitted as not required or not applicable, or the information has been included elsewhere by reference in the financial statements and related notes.
(3) | Exhibits |
The following exhibits, as required by Item 601 of Regulation S-K are filed as a part of this report:
2(a) Terms of Agreement and Plan of Merger between G&K Services, Inc., Cintas Corporation and Bravo Merger Sub, Inc. dated August 15, 2016 (incorporated by reference to Registrant's Form 8-K filed August 16, 2016)
3(a) Articles of Amendment and Restatement of the Registrant, as filed with the Secretary of State of Minnesota (incorporated herein by reference to the Registrant’s Form 10-Q filed November 13, 2001).
3(b) Articles of Amendment to the Amended and Restated Articles of Incorporation of the Registrant *
3(c) Amended and Restated Bylaws of the Registrant (incorporated by reference to Registrant's Form 8-K filed August 16, 2016)
10(a) 1998 Stock Option and Compensation Plan, as amended November 7, 2002 (incorporated by reference to the Registrant’s definitive proxy statement on Schedule 14A, exhibit A, filed on September 26, 2002). +
10(b) First Amendment to 1998 Stock Option and Compensation Plan (incorporated by reference to Registrant’s Form 8-K filed April 4, 2012). +
10(c) Form of Executive Employment Agreement between Registrant and Douglas Milroy, dated March 1, 2007 (incorporated herein by reference to the Registrant’s Form 8-K filed March 19, 2007). +
10(d) Restated Equity Incentive Plan (2013) (incorporated by reference to Registrant's Form S-8 filed December 5, 2013). +
10(e) Second Amended and Restated Loan Agreement, dated September 29, 2010 among G&K Services, Inc., G&K Receivables Corp., Three Pillars Funding LLC, SunTrust Robinson Humphrey, Inc. and SunTrust Bank (incorporated herein by reference to Registrant’s Form 8-K filed on December 4, 2010).
10(f) Amendment No. 1, to the Second Amended and Restated Loan Agreement dated September 28, 2011 among G&K Services, Inc., as initial servicer, G&K Receivables Corp., as borrower, Three Pillars Funding LLC, as lender, SunTrust Robinson Humphrey, Inc., as administrator, and SunTrust Bank, as LC Issuer (incorporated herein by reference to Registrant’s Form 8-K filed on September 30, 2011).
10(g) Amendment No. 2 to the Second Amended and Restated Loan Agreement, dated May 22, 2012 among G&K Services, Inc., G&K Receivables Corp., Three Pillars Funding LLC, SunTrust Robinson Humphrey, Inc. and SunTrust Bank (incorporated herein by reference to Registrant’s Form 8-K filed on May 24, 2012).
10(h) Amendment No. 3 to the Second Amended and Restated Loan Agreement dated September 27, 2013 among G&K Services, Inc., as initial servicer, G&K Receivables Corp., as borrower, SunTrust Bank, as lender and LC issuer, and SunTrust Robinson Humphrey, Inc., as administrator (incorporated herein by reference to Registrant's Form 8-K filed on September 30, 2013).
10(i) Form of Amended Executive Employment Agreement between Registrant and Douglas A. Milroy, dated May 7, 2009 (incorporated herein by reference to the Registrant’s Form 8-K filed May 13, 2009). +
10(j) Amendment to G&K Services Executive Employment Agreement, effective August 23, 2012, between G&K Services, Inc. and Douglas A. Milroy (incorporated herein by reference to Exhibit 10.2 of Registrant's Form 10-Q filed on November 2, 2012). +
61
10(k) Credit Agreement dated as of April 15, 2015 among G&K Services, Inc., G&K Services Canada Inc., the Lenders from time to time party thereto, Wells Fargo Bank, National Association as administrative agent, Bank of America, N.A and JPMorgan Chase Bank, N.A., as co-syndication agents and SunTrust Bank and PNC Bank, National Association, as co-documentation agents (incorporated by reference to Registrant’s Form 8-K filed April 20, 2015).
10(l) Terms of Non-Qualified Employee Stock Option for CEO (incorporated herein by reference to the Registrant’s Form 10-K filed on August 26, 2010). +
10(m) Form of Terms of Employee Restricted Stock Grant (5-year lapse of restrictions) (incorporated herein by reference to Registrant’s Form S-8 filed on December 8, 2010). +
10(n) Form of Terms of Employee Restricted Stock Grant Revised August 2012 (incorporated herein by reference to Registrant's Form 10-Q filed on February 1, 2013). +
10(o) Form of Terms of Non-Qualified Employee Stock Option (3-year vest) (incorporated herein by reference to Registrant’s Form S-8 filed on December 8, 2010). +
10(p) Form of Terms of Non-Qualified Employee Stock Options Revised August 2012 (incorporated herein by reference to Registrant's Form 10-Q filed on February 1, 2013). +
10(q) Form of Terms of Non-Qualified Non-employee Director Stock Option (3-year vest) (incorporated herein by reference to Registrant’s Form S-8 filed on December 8, 2010). +
10(r) Form of Terms of Non-employee Director Non-Qualified Stock Option Grant for use on or after January 1, 2015 (3-year vest) (incorporated by reference to Registrant's Form 10-K filed on August 21, 2014). +
10(s) Form of Terms of Non-Qualified Non-employee Director Stock Option (1-year vest) (incorporated herein by reference to Registrant’s Form S-8 filed on December 8, 2010). +
10(t) Form of Terms of Non-employee Director Restricted Stock Grant (3-year lapse of restrictions) (incorporated herein by reference to Registrant’s Form S-8 filed on December 8, 2010). +
10(u) Form of Terms of Non-employee Director Restricted Stock Grant for use on or after January 1, 2015 (3-year lapse of restrictions) (incorporated by reference to Registrant's Form 10-K filed on August 21, 2014).+
10(v) Supplemental Executive Retirement Plan, amended and restated generally as of January 1, 2008 (incorporated herein by reference to the Registrant’s Form 10-K filed on August 26, 2010). +
10(w) Executive Deferred Compensation Plan, amended and restated generally as of January 1, 2008 (incorporated herein by reference to the Registrant’s Form 10-K filed on August 26, 2010). +
10(x) Loan agreement dated April 15, 2013 among G&K Services, Inc. and various institutional investors (incorporated herein by reference to Registrant's Form 8-K filed on April 16, 2013).
10(y) Terms of CEO Performance Vested Employee Restricted Stock Award (incorporated herein by reference to Registrant's Form 10-Q filed on November 2, 2012). +
10(z) Terms of CEO Dividend Equivalent Performance Unit Retention Grant (incorporated herein by reference to Registrant's Form 8-K filed on August 27, 2013). +
10(aa) Terms of CFO Restricted Stock Award (incorporated by reference to Registrant’s Form 10-K filed August 21, 2014). +
10(bb) Settlement Agreement dated June 11, 2015 between G&K Services, Inc. and Central States, Southeast and Southwest Areas Pension Fund (incorporated by reference to Registrant’s Form 8-K filed June 16, 2015)
10(cc) Terms of Non-Qualified Employee Stock Option (incorporated by reference to Registrant's Form 10-K filed August 20, 2015) +
10(dd) Term of Employee Restricted Stock Unit Grant (Canada) (incorporated by reference to Registrant's Form 10-K filed August 20, 2015) +
21 Subsidiaries of G&K Services, Inc. *
23.1 Consent of Independent Registered Public Accounting Firm, KPMG LLP. *
24 Power of Attorney dated as of August 26, 2016. *
62
31.1 Certification of Chief Executive Officer pursuant to Securities Exchange Act Rule 13a-15(e)/15d-15(e) as adopted pursuant to Section 302 of the Sarbanes-Oxley Act of 2002.*
31.2 Certification of Chief Financial Officer pursuant to Securities Exchange Act Rule 13a-15(e)/15d-15(e) as adopted pursuant to Section 302 of the Sarbanes-Oxley Act of 2002.*
32.1 Certification of Chief Executive Officer pursuant to 18 U.S.C. Section 1350, as adopted pursuant to Section 906 of the Sarbanes-Oxley Act of 2002.*
32.2 Certification of Chief Financial Officer pursuant to 18 U.S.C. Section 1350, as adopted pursuant to Section 906 of the Sarbanes-Oxley Act of 2002.*
101 Financial statements from the annual report on Form 10-K of G&K Services, Inc. for the year ended July 2, 2016, formatted in Extensible Business Reporting Language (XBRL): (i) the Consolidated Statements of Operations, (ii) the Consolidated Statements of Comprehensive Income, (iii) the Consolidated Balance Sheets (iv) the Consolidated Statements of Stockholders' Equity, (v) the Consolidated Statements of Cash Flows and (vi) the Notes to Consolidated Financial Statements.*
Footnotes:
* | Filed herewith |
+ | Compensatory plan or arrangement |
(b) | Exhibits |
See exhibits listed under Item 15(a)(3).
(c) | Financial Statement Schedules |
See the financial statement schedules listed under Item 15(a)(2).
63
SIGNATURES
Pursuant to the requirements of Section 13 or 15(d) of the Securities Exchange Act of 1934, the registrant has duly caused this report to be signed on its behalf by the undersigned thereunto duly authorized.
Date: August 26, 2016 | G&K SERVICES, INC. | ||
(Registrant) | |||
By: | /s/ Douglas A. Milroy | ||
Douglas A. Milroy, Chairman and Chief Executive Officer | |||
(Principal Executive Officer) | |||
64
SIGNATURES
Pursuant to the requirements of the Securities Exchange Act of 1934, this report on Form 10-K has been signed below on the 26th day of August, 2016, by the following persons on behalf of the registrant and in the capacities indicated:
/s/ Douglas A. Milroy | Chairman and Chief Executive Officer (Principal Executive Officer) | |
Douglas A. Milroy | ||
/s/ John S. Bronson | Director | |
John S. Bronson | ||
/s/ Lynn Crump-Caine | Director | |
Lynn Crump-Caine | ||
/s/ Wayne M. Fortun | Director | |
Wayne M. Fortun | ||
/s/ Thomas R. Greco | Director | |
Thomas R. Greco | ||
/s/ Ernest J. Mrozek | Director | |
Ernest J. Mrozek | ||
/s/ M. Lenny Pippin | Lead Director | |
M. Lenny Pippin | ||
/s/ Alice M. Richter | Director | |
Alice M. Richter | ||
/s/ Lee J. Schram | Director | |
Lee J. Schram | ||
/s/ Tracy C. Jokinen | Chief Financial Officer | |
Tracy C. Jokinen | ||
/s/ Thomas J. Dietz | Vice President and Controller | |
Thomas J. Dietz | ||
* By: | /s/ Douglas A. Milroy | |
Douglas A. Milroy | ||
Attorney-in-fact | ||
65