Attached files
| file | filename |
|---|---|
| 8-K - FORM 8-K - Premier, Inc. | d244733d8k.htm |
| EX-99.2 - EX-99.2 - Premier, Inc. | d244733dex992.htm |
| EX-99.1 - EX-99.1 - Premier, Inc. | d244733dex991.htm |
Exhibit 99.3
|
|

Exhibit 99.3
Fourth-Quarter and Fiscal Year 2016 Financial Results and Update August 22, 2016
|
|
Forward-looking statements and Non-GAAP financial measures
Forward-looking statements — Certain statements included in this presentation, including, but not limited to, those related to our financial and business outlook, strategy and growth drivers, member retention and renewal rates and revenue visibility, cross and upsell opportunities, acquisition activities and pipeline (including completion of the proposed acquisition of Acro Pharmaceutical Services, LLC and its expected financial contribution), revenue available under contract, 2017 financial guidance and related assumptions, and target growth rate are “forward-looking statements” within the meaning of the federal securities laws. Forward-looking statements may involve known and unknown risks, uncertainties and other factors that may cause the actual results of Premier to be materially different from historical results or from any future results or projections expressed or implied by such forward-looking statements. Accordingly, readers should not place undue reliance on any forward looking statements. Readers are urged to consider statements in the conditional or future tenses or that include terms such as “believes,” “belief,” “expects,” “estimates,” “intends,” “anticipates” or “plans” to be uncertain and forward-looking. Forward-looking statements may include comments as to Premier’s beliefs and expectations as to future events and trends affecting its business and are necessarily subject to uncertainties, many of which are outside Premier’s control. You should carefully read Premier’s current and future filings with the SEC for more information on potential risks and other factors that could affect Premier’s financial results. Forward-looking statements speak only as of the date they are made. Premier undertakes no obligation to publicly update or revise any forward-looking statements.
Non-GAAP financial measures — This presentation includes certain “non-GAAP financial measures” as defined in Regulation G under the Securities Exchange Act of 1934. Schedules are attached that reconcile the non-GAAP financial measures included in this presentation to the most directly comparable financial measures calculated and presented in accordance with Generally Accepted Accounting Principles in the United States. You should carefully read Premier’s current and future filings with the SEC for definitions and further explanation and disclosure regarding our use of non-GAAP financial measures and such filings should be read in conjunction with this presentation.
2
|
|

Overview and Business UpdateSusan DeVorePresident & CEO
|
|
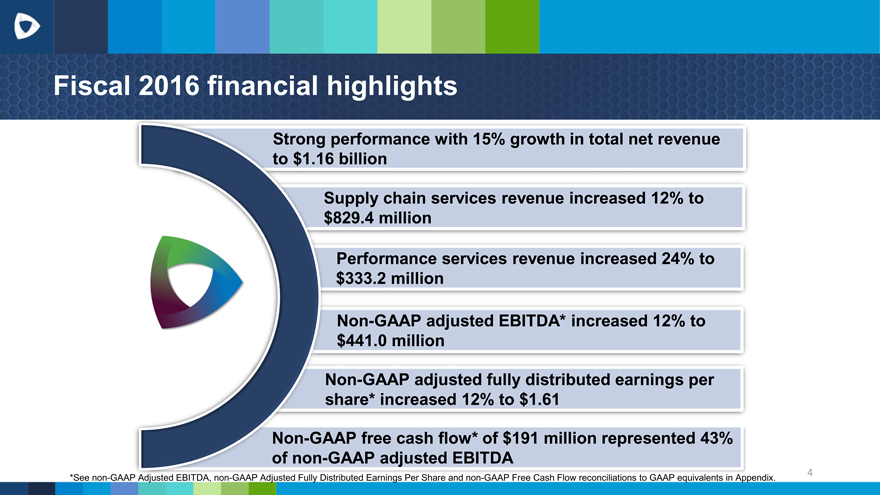
Fiscal 2016 financial highlights
Strong performance with 15% growth in total net revenue to $1.16 billion
Supply chain services revenue increased 12% to $829.4 million
Performance services revenue increased 24% to $333.2 million
Non-GAAP adjusted EBITDA* increased 12% to $441.0 million
Non-GAAP adjusted fully distributed earnings per share* increased 12% to $1.61
Non-GAAP free cash flow* of $191 million represented 43% of non-GAAP adjusted EBITDA
*See non-GAAP Adjusted EBITDA, non-GAAP Adjusted Fully Distributed Earnings Per Share and non-GAAP Free Cash Flow reconciliations to GAAP equivalents in Appendix.
4
|
|
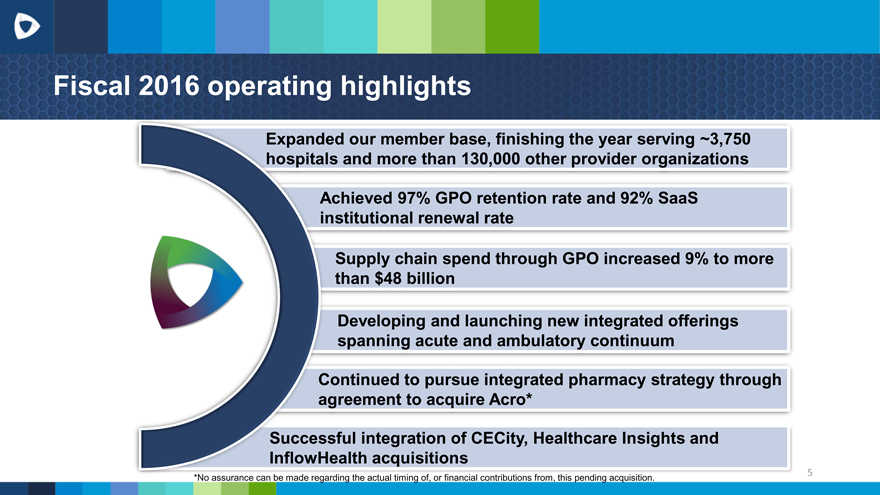
Fiscal 2016 operating highlights
Expanded our member base, finishing the year serving ~3,750 hospitals and more than 130,000 other provider organizations
Achieved 97% GPO retention rate and 92% SaaS institutional renewal rate
Supply chain spend through GPO increased 9% to more than $48 billion
Developing and launching new integrated offerings spanning acute and ambulatory continuum
Continued to pursue integrated pharmacy strategy through agreement to acquire Acro*
Successful integration of CECity, Healthcare Insights and InflowHealth acquisitions
*No assurance can be made regarding the actual timing of, or financial contributions from, this pending acquisition.
5
|
|
Continuing our momentum into fiscal 2017
Targeting year-over-year double-digit revenue, non-GAAP adjusted EBITDA and non-GAAP adjusted fully distributed earnings per share increases
Provider-centric model focused on serving our members
Developing solutions in close collaboration with members
Positioned to deliver long-term value to stockholders
Provider-centric and co-innovative alignment drives demand for and accelerated roll-out of our solutions
6
|
|

What does the future of healthcare look like?
7
|
|

Operations UpdateMichael AlkireChief Operating Officer
|
|
FY 2016 fourth-quarter new and expanded relationships
Bon Secours partnership with Premier delivers $58 million in savings over 3-year period, also reducing mortality and generating additional advisory services opportunity.
Banner Health expands partnership to include an extension of the group purchasing agreement to 2020, population health advisory services, and the addition of our new PremierConnect Supply Chain analytics and PremierConnect Quality offerings.
Jefferson Health Enterprise chooses Premier to provide primary group purchasing services after a merger of three health systems and a comprehensive review of service providers.
Partnership with a major pharmaceutical company to work alongside providers to develop and assess allergic-reaction solutions that promote appropriate, high quality care to improve outcomes for specific populations of at-risk patients across the continuum.
9
|
|
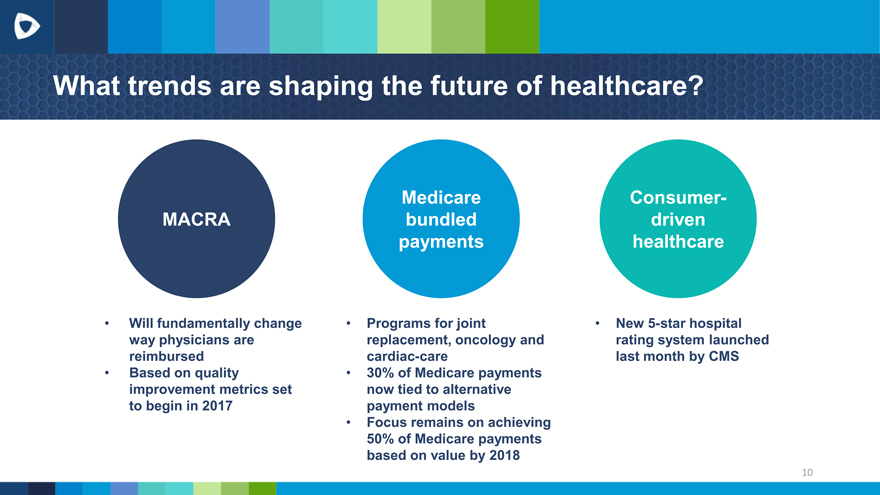
What trends are shaping the future of healthcare?
MACRA
Will fundamentally change way physicians are reimbursed
Based on quality improvement metrics set to begin in 2017
Medicare bundled payments
Programs for joint replacement, oncology and cardiac-care
30% of Medicare payments now tied to alternative payment models
Focus remains on achieving 50% of Medicare payments based on value by 2018
Consumer-driven healthcare
New 5-star hospital rating system launched last month by CMS
10
|
|

Financial ReviewCraig McKassonChief Financial Officer
|
|
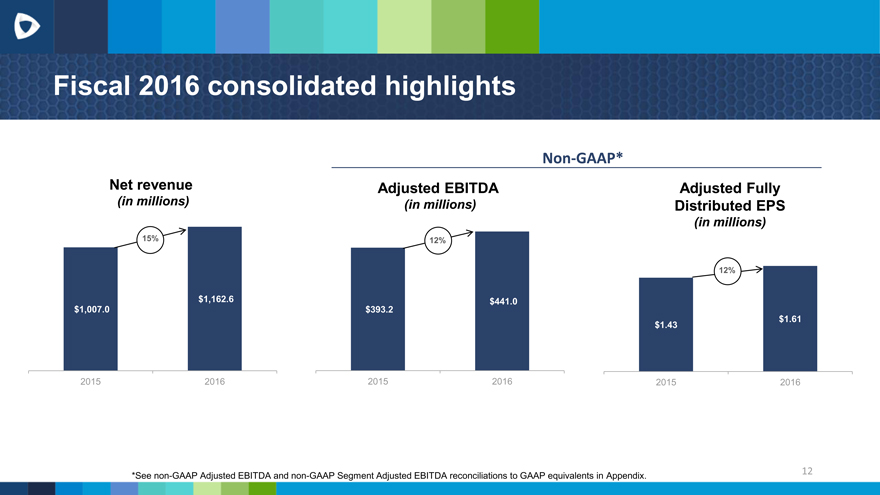
Fiscal 2016 consolidated highlights
Net revenue
(in millions)
Adjusted EBITDA
(in millions)
Non-GAAP*
15%
12%
12%
$1,162.6 $441.0 $1,007.0 $393.2
$1.61
$1.43
2015 2016 2015 2016 2015 2016
*See non-GAAP Adjusted EBITDA and non-GAAP Segment Adjusted EBITDA reconciliations to GAAP equivalents in Appendix.
12
|
|
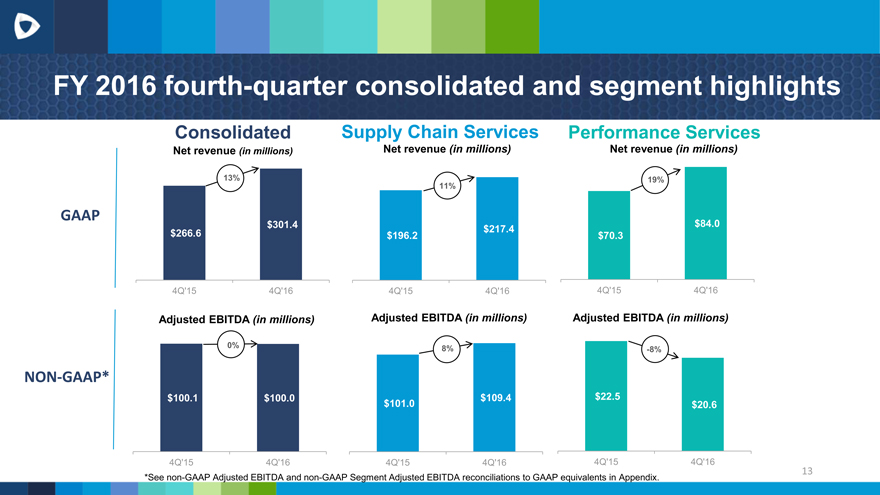
FY 2016 fourth-quarter consolidated and segment highlights
Consolidated Supply Chain Services Performance Services
Net revenue (in millions) Net revenue (in millions) Net revenue (in millions)
13% 19% 11%
GAAP
$301.4 $84.0 $266.6 $217.4 $196.2 $70.3
4Q’15 4Q’16 4Q’15 4Q’16 4Q’15 4Q’16
Adjusted EBITDA (in millions) Adjusted EBITDA (in millions) Adjusted EBITDA (in millions)
0% 8%
-8%
NON-GAAP*
$100.1 $100.0 $109.4 $22.5 $101.0 $20.6
4Q’15 4Q’16 4Q’15 4Q’16 4Q’15 4Q’16 *See non-GAAP Adjusted EBITDA and non-GAAP Segment Adjusted EBITDA reconciliations to GAAP equivalents in Appendix.
13
|
|
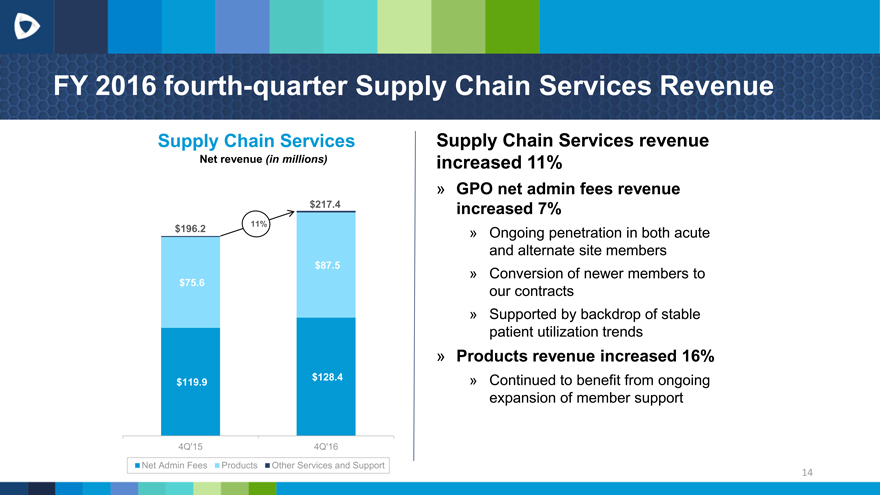
FY 2016 fourth-quarter Supply Chain Services Revenue
Supply Chain Services
Net revenue (in millions)
$217.4
11%
$196.2
$87.5
$75.6
$128.4 $119.9
4Q’15 4Q’16
Net Admin Fees Products Other Services and Support
Supply Chain Services revenue increased 11%
» GPO net admin fees revenue increased 7%
» Ongoing penetration in both acute and alternate site members
» Conversion of newer members to our contracts
» Supported by backdrop of stable patient utilization trends
» Products revenue increased 16%
» Continued to benefit from ongoing expansion of member support
14
|
|
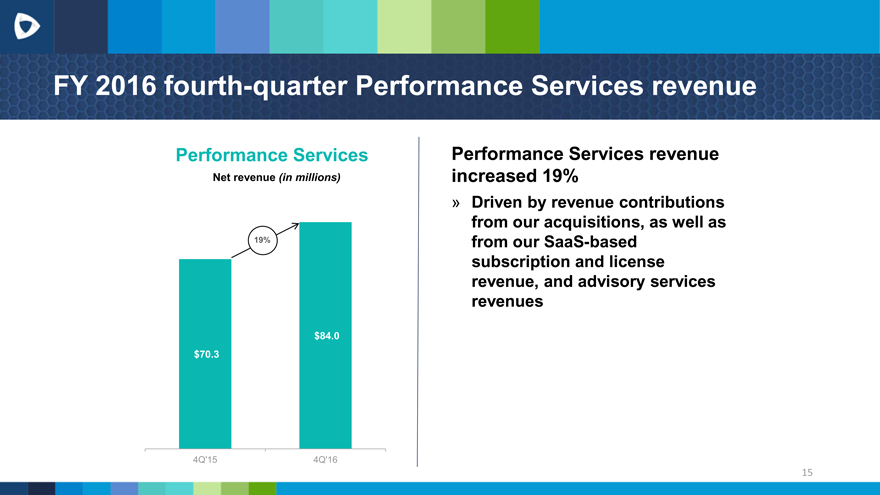
FY 2016 fourth-quarter Performance Services revenue
Performance Services
Net revenue (in millions)
19%
$84.0
$70.3
4Q’15 4Q’16
Performance Services revenue increased 19%
» Driven by revenue contributions from our acquisitions, as well as from our SaaS-based subscription and license revenue, and advisory services revenues
15
|
|
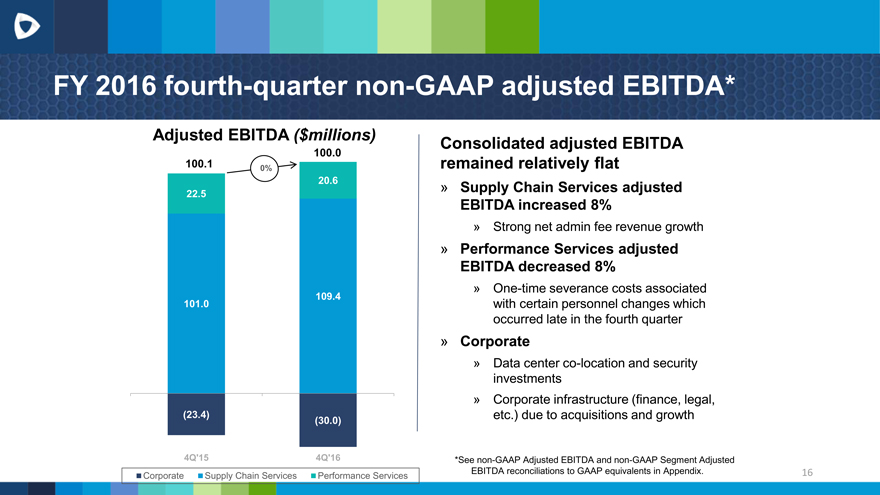
FY 2016 fourth-quarter non-GAAP adjusted EBITDA*
Adjusted EBITDA ($millions)
100.0 100.1 0%
20.6 22.5
109.4 101.0
(23.4)
(30.0)
4Q’15 4Q’16
Corporate Supply Chain Services Performance Services
Consolidated adjusted EBITDA remained relatively flat
» Supply Chain Services adjusted EBITDA increased 8%
» Strong net admin fee revenue growth
» Performance Services adjusted EBITDA decreased 8%
» One-time severance costs associated with certain personnel changes which occurred late in the fourth quarter
» Corporate
» Data center co-location and security investments
» Corporate infrastructure (finance, legal, etc.) due to acquisitions and growth
*See non-GAAP Adjusted EBITDA and non-GAAP Segment Adjusted EBITDA reconciliations to GAAP equivalents in Appendix.
16
|
|
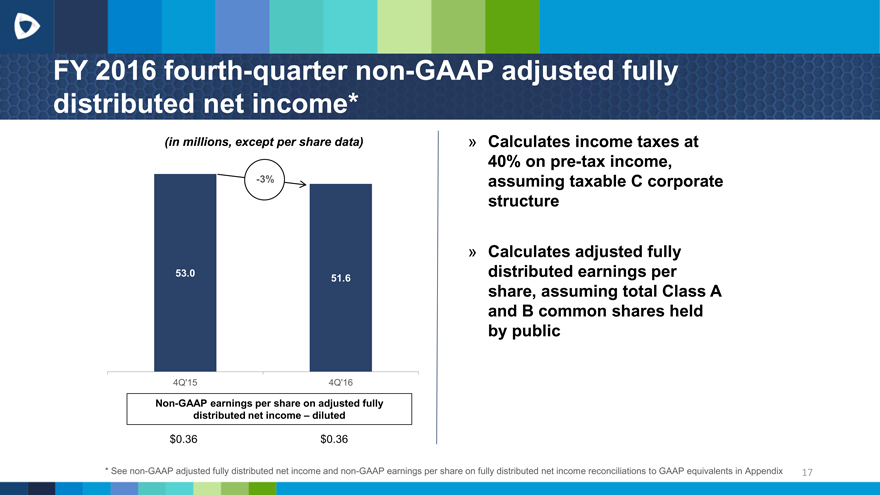
FY 2016 fourth-quarter non-GAAP adjusted fully distributed net income*
(in millions, except per share data)
-3%
53.0
51.6
4Q’15 4Q’16
Non-GAAP earnings per share on adjusted fully distributed net income – diluted
$0.36 $0.36
» Calculates income taxes at 40% on pre-tax income, assuming taxable C corporate structure
» Calculates adjusted fully distributed earnings per share, assuming total Class A and B common shares held by public
* See non-GAAP adjusted fully distributed net income and non-GAAP earnings per share on fully distributed net income reconciliations to GAAP equivalents in Appendix 17
17
|
|
Cash flow and capital flexibility at June 30, 2016
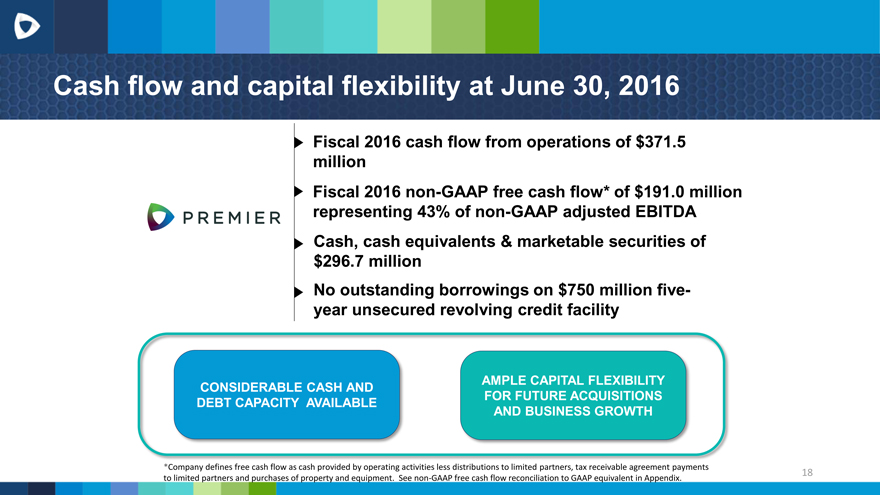
Fiscal 2016 cash flow from operations of $371.5 million
Fiscal 2016 non-GAAP free cash flow* of $191.0 million representing 43% of non-GAAP adjusted EBITDA
Cash, cash equivalents & marketable securities of $296.7 million No outstanding borrowings on $750 million five-year unsecured revolving credit facility
CONSIDERABLE CASH AND DEBT CAPACITY AVAILABLE
AMPLE CAPITAL FLEXIBILITY FOR FUTURE ACQUISITIONS AND BUSINESS GROWTH
*Company defines free cash flow as cash provided by operating activities less distributions to limited partners, tax receivable agreement payments to limited partners and purchases of property and equipment. See non-GAAP free cash flow reconciliation to GAAP equivalent in Appendix.
18
|
|
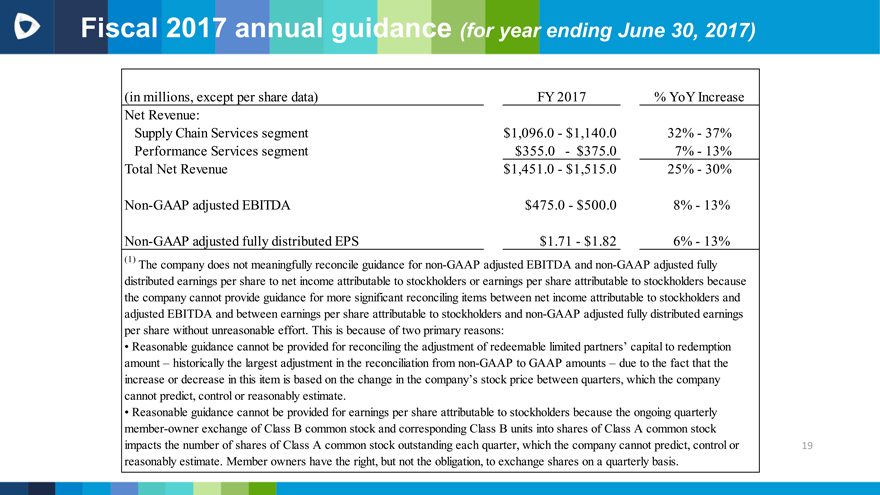
Fiscal 2017 annual guidance (for year ending June 30, 2017)
(in millions, except per share data) FY 2017 % YoY Increase
Net Revenue:
Supply Chain Services segment $1,096.0 -$1,140.032%-37%
Performance Services segment $355.0 - $375.07%-13%
Total Net Revenue $1,451.0 -$1,515.025%-30%
Non-GAAP adjusted EBITDA $475.0—$500.0 8%-13%
Non-GAAP adjusted fully distributed EPS $1.71—$1.82 6%-13%
(1) The company does not meaningfully reconcile guidance for non-GAAP adjusted EBITDA and non-GAAP adjusted fully distributed earnings per share to net income attributable to stockholders or earnings per share attributable to stockholders because the company cannot provide guidance for more significant reconciling items between net income attributable to stockholders and adjusted EBITDA and between earnings per share attributable to stockholders and non-GAAP adjusted fully distributed earnings per share without unreasonable effort. This is because of two primary reasons:
• Reasonable guidance cannot be provided for reconciling the adjustment of redeemable limited partners’ capital to redemption amount – historically the largest adjustment in the reconciliation from non-GAAP to GAAP amounts – due to the fact that the increase or decrease in this item is based on the change in the company’s stock price between quarters, which the company cannot predict, control or reasonably estimate.
• Reasonable guidance cannot be provided for earnings per share attributable to stockholders because the ongoing quarterly member-owner exchange of Class B common stock and corresponding Class B units into shares of Class A common stock impacts the number of shares of Class A common stock outstanding each quarter, which the company cannot predict, control or reasonably estimate. Member owners have the right, but not the obligation, to exchange shares on a quarterly basis.
19
|
|
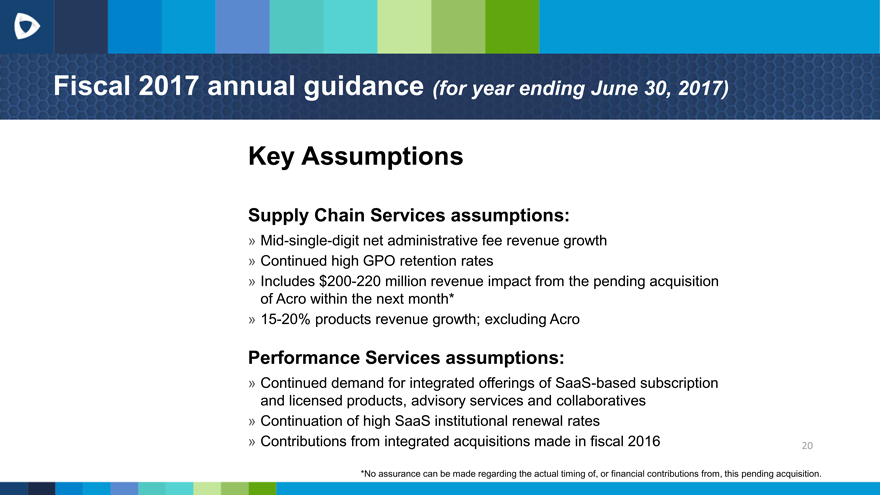
Fiscal 2017 annual guidance (for year ending June 30, 2017)
Key Assumptions
Supply Chain Services assumptions:
» Mid-single-digit net administrative fee revenue growth
» Continued high GPO retention rates
» Includes $200-220 million revenue impact from the pending acquisition of Acro within the next month*
» 15-20% products revenue growth; excluding Acro
Performance Services assumptions:
» Continued demand for integrated offerings of SaaS-based subscription and licensed products, advisory services and collaboratives
» Continuation of high SaaS institutional renewal rates
» Contributions from integrated acquisitions made in fiscal 2016
*No assurance can be made regarding the actual timing of, or financial contributions from, this pending acquisition.
20
|
|
Additional fiscal 2017 guidance assumptions
Capital expenditures of ~$70 million for the year
2017 adjusted EBITDA margin from existing business of 37-38% will become approximately 32-33% of net revenue, including Acro Pharmaceutical Services*
Effective tax rate of 40%
*No assurance can be made regarding the actual timing of, or financial contributions from, this pending acquisition. 21
|
|
Exchange update
On July 31, 2016, approximately 1.3 million Class B units were exchanged for Class A common shares on 1-for-1 basis; equal number of Class B common shares retired
The upcoming October 31, 2016 exchange process is underway
» Maximum of 5.1 million shares indicated for exchange
» Indicated shares remain subject to retraction and purchase by other member owners under right-of-first-refusal process
22
|
|

Questions
|
|

Appendix
|
|
Fiscal 2016 and fiscal 2015 non-GAAP reconciliations
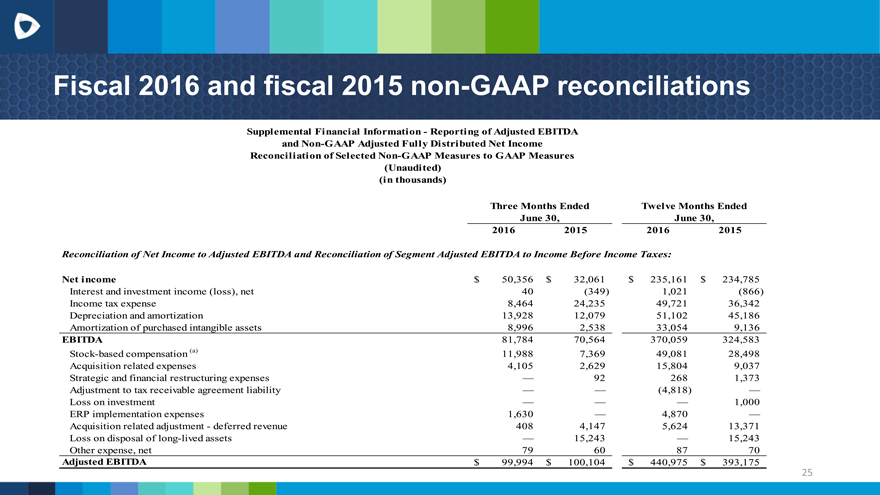
Supplemental Financial Information—Reporting of Adjusted EBITDA and Non-GAAP Adjusted Fully Distributed Net Income Reconciliation of Selected Non-GAAP Measures to GAAP Measures (Unaudited) (in thousands)
Three Months Ended Twelve Months Ended
June 30, June 30,
2016 201520162015
Reconciliation of Net Income to Adjusted EBITDA and Reconciliation of Segment Adjusted EBITDA to Income Before Income Taxes:
Net income $ 50,356 $32,061$235,161$234,785
Interest and investment income (loss), net 40 (349)1,021(866)
Income tax expense 8,464 24,23549,72136,342
Depreciation and amortization 13,928 12,07951,10245,186
Amortization of purchased intangible assets 8,996 2,53833,0549,136
EBITDA 81,784 70,564370,059324,583
Stock-based compensation (a) 11,988 7,36949,08128,498
Acquisition related expenses 4,105 2,62915,8049,037
Strategic and financial restructuring expenses — 922681,373
Adjustment to tax receivable agreement liability — —(4,818)—
Loss on investment — ——1,000
ERP implementation expenses 1,630 —4,870—
Acquisition related adjustment—deferred revenue 408 4,1475,62413,371
Loss on disposal of long-lived assets — 15,243—15,243
Other expense, net 79 608770
Adjusted EBITDA $ 99,994 $100,104$440,975$393,175
25
|
|
Fiscal 2016 and fiscal 2015 non-GAAP reconciliations
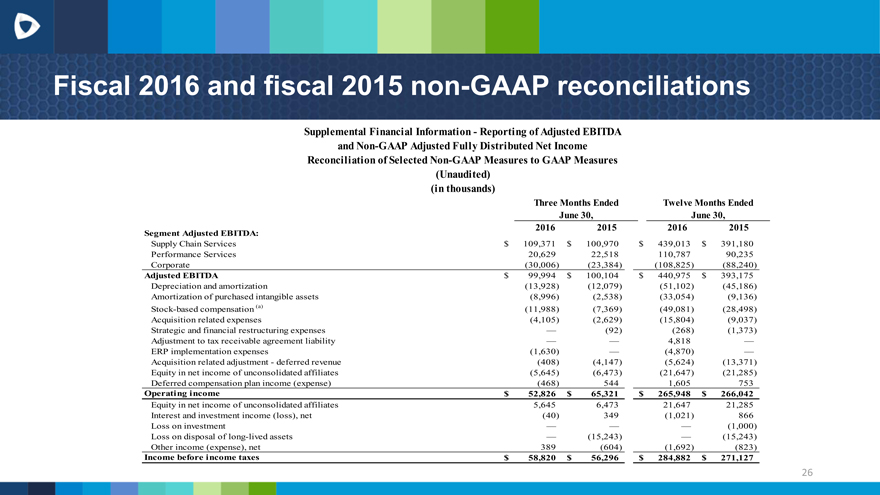
Supplemental Financial Information—Reporting of Adjusted EBITDA and Non-GAAP Adjusted Fully Distributed Net Income Reconciliation of Selected Non-GAAP Measures to GAAP Measures (Unaudited) (in thousands)
Three Months Ended Twelve Months Ended
June 30,June 30,
2016 201520162015
Segment Adjusted EBITDA:
Supply Chain Services $ 109,371 $100,970$ 439,013$391,180
Performance Services 20,629 22,518110,78790,235
Corporate (30,006) (23,384)(108,825)(88,240)
Adjusted EBITDA $ 99,994 $100,104$ 440,975$393,175
Depreciation and amortization (13,928) (12,079)(51,102)(45,186)
Amortization of purchased intangible assets (8,996) (2,538)(33,054)(9,136)
Stock-based compensation (a) (11,988) (7,369)(49,081)(28,498)
Acquisition related expenses (4,105) (2,629)(15,804)(9,037)
Strategic and financial restructuring expenses — (92)(268)(1,373)
Adjustment to tax receivable agreement liability — —4,818—
ERP implementation expenses (1,630) —(4,870)—
Acquisition related adjustment—deferred revenue (408) (4,147)(5,624)(13,371)
Equity in net income of unconsolidated affiliates (5,645) (6,473)(21,647)(21,285)
Deferred compensation plan income (expense) (468) 5441,605753
Operating income $ 52,826 $65,321$ 265,948$266,042
Equity in net income of unconsolidated affiliates 5,645 6,47321,64721,285
Interest and investment income (loss), net (40) 349(1,021)866
Loss on investment — ——(1,000)
Loss on disposal of long-lived assets — (15,243)—(15,243)
Other income (expense), net 389 (604)(1,692)(823)
Income before income taxes $ 58,820 $56,296$ 284,882$271,127
26
|
|
Fiscal 2016 and fiscal 2015 non-GAAP reconciliations
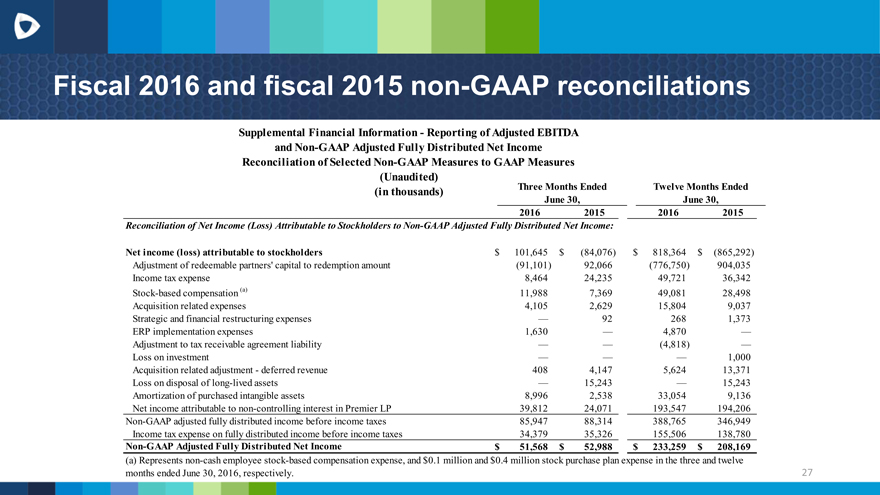
Reconciliation of Net Income (Loss) Attributable to Stockholders to Non-GAAP Adjusted Fully Distributed Net Income:
Net income (loss) attributable to stockholders $101,645$(84,076)$ 818,364$(865,292)
Adjustment of redeemable partners’ capital to redemption amount (91,101)92,066(776,750)904,035
Income tax expense 8,46424,23549,72136,342
Stock-based compensation (a) 11,9887,36949,08128,498
Acquisition related expenses 4,1052,62915,8049,037
Strategic and financial restructuring expenses —922681,373
ERP implementation expenses 1,630—4,870—
Adjustment to tax receivable agreement liability ——(4,818)—
Loss on investment ———1,000
Acquisition related adjustment—deferred revenue 4084,1475,62413,371
Loss on disposal of long-lived assets —15,243—15,243
Amortization of purchased intangible assets 8,9962,53833,0549,136
Net income attributable to non-controlling interest in Premier LP 39,81224,071193,547194,206
Non-GAAP adjusted fully distributed income before income taxes 85,94788,314388,765346,949
Income tax expense on fully distributed income before income taxes 34,37935,326155,506138,780
Non-GAAP Adjusted Fully Distributed Net Income $51,568$52,988$ 233,259$208,169
(a) Represents non-cash employee stock-based compensation expense, and $0.1 million and $0.4 million stock purchase plan expense in the three and twelve
(a) Represents non-cash employee stock-based compensation expense, and $0.1 million and $0.4 million stock purchase plan expense in the three and twelve
27
|
|
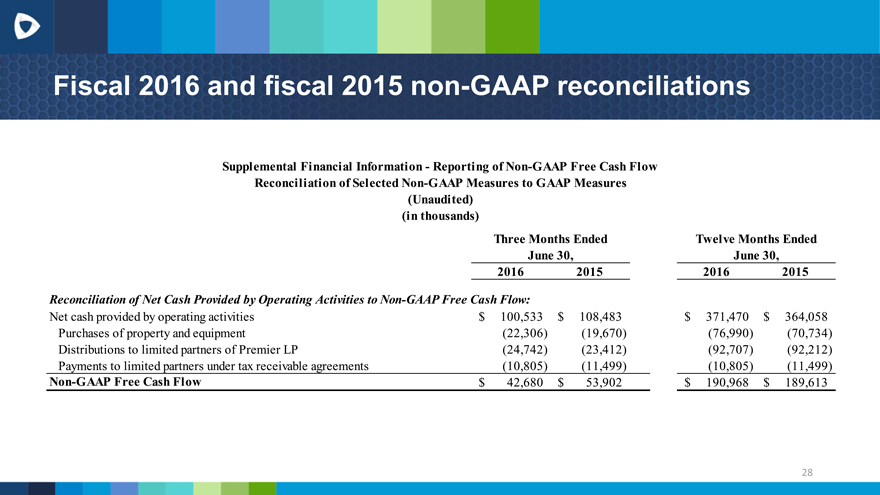
Fiscal 2016 and fiscal 2015 non-GAAP reconciliations
Supplemental Financial Information—Reporting of Non-GAAP Free Cash Flow Reconciliation of Selected Non-GAAP Measures to GAAP Measures (Unaudited) (in thousands)
Three Months Ended Twelve Months Ended
June 30,June 30,
2016201520162015
Reconciliation of Net Cash Provided by Operating Activities to Non-GAAP Free Cash Flow:
Net cash provided by operating activities $100,533$108,483$ 371,470$364,058
Purchases of property and equipment (22,306)(19,670)(76,990)(70,734)
Distributions to limited partners of Premier LP (24,742)(23,412)(92,707)(92,212)
Payments to limited partners under tax receivable agreements (10,805)(11,499)(10,805)(11,499)
Non-GAAP Free Cash Flow $42,680$53,902$ 190,968$189,613
28
|
|
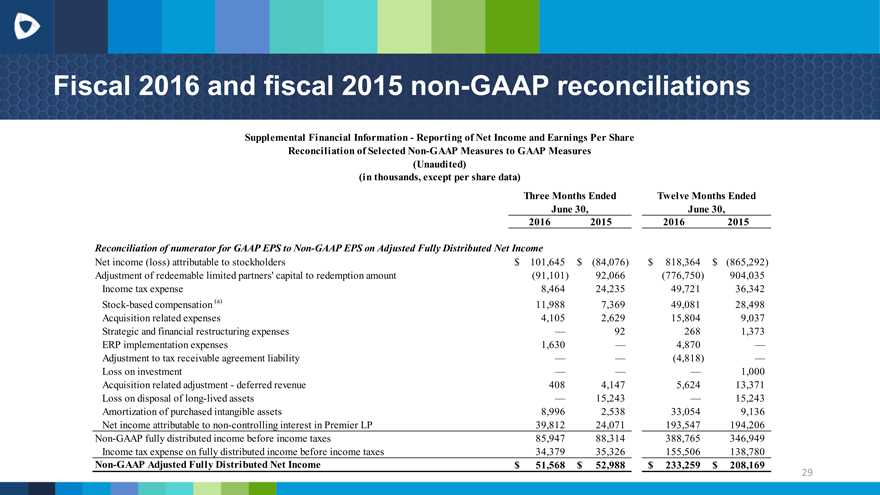
Fiscal 2016 and fiscal 2015 non-GAAP reconciliations
Supplemental Financial Information—Reporting of Net Income and Earnings Per Share Reconciliation of Selected Non-GAAP Measures to GAAP Measures (Unaudited) (in thousands, except per share data)
Three Months Ended Twelve Months Ended
June 30, June 30,
2016 201520162015
Reconciliation of numerator for GAAP EPS to Non-GAAP EPS on Adjusted Fully Distributed Net Income
Net income (loss) attributable to stockholders $ 101,645 $(84,076)$ 818,364$(865,292)
Adjustment of redeemable limited partners’ capital to redemption amount (91,101) 92,066(776,750)904,035
Income tax expense 8,464 24,23549,72136,342
Stock-based compensation (a) 11,988 7,36949,08128,498
Acquisition related expenses 4,105 2,62915,8049,037
Strategic and financial restructuring expenses — 922681,373
ERP implementation expenses 1,630 —4,870—
Adjustment to tax receivable agreement liability — —(4,818)—
Loss on investment — ——1,000
Acquisition related adjustment—deferred revenue 408 4,1475,62413,371
Loss on disposal of long-lived assets — 15,243—15,243
Amortization of purchased intangible assets 8,996 2,53833,0549,136
Net income attributable to non-controlling interest in Premier LP 39,812 24,071193,547194,206
Non-GAAP fully distributed income before income taxes 85,947 88,314388,765346,949
Income tax expense on fully distributed income before income taxes 34,379 35,326155,506138,780
Non-GAAP Adjusted Fully Distributed Net Income $ 51,568 $52,988$ 233,259$208,169
29
|
|
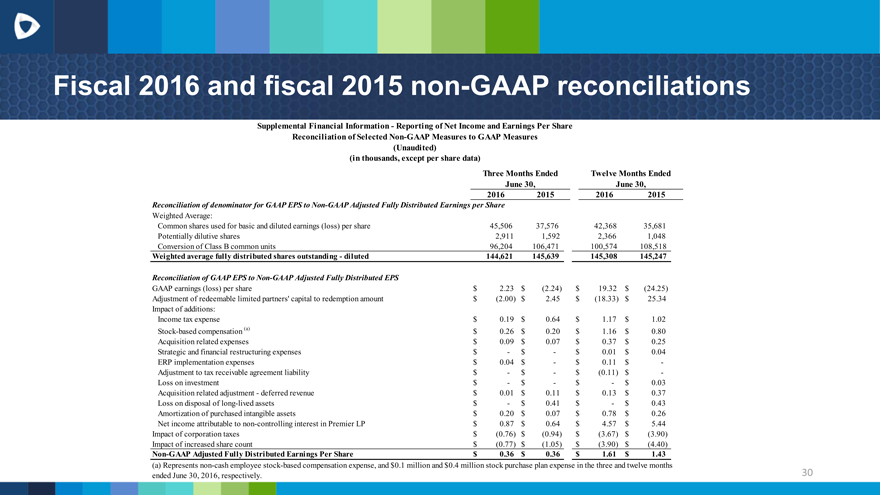
Fiscal 2016 and fiscal 2015 non-GAAP reconciliations
Supplemental Financial Information—Reporting of Net Income and Earnings Per Share Reconciliation of Selected Non-GAAP Measures to GAAP Measures (Unaudited) (in thousands, except per share data)
Three Months Ended Twelve Months Ended
June 30,June 30,
2016201520162015
Reconciliation of denominator for GAAP EPS to Non-GAAP Adjusted Fully Distributed Earnings per Share
Weighted Average:
Common shares used for basic and diluted earnings (loss) per share 45,50637,57642,36835,681
Potentially dilutive shares 2,9111,5922,3661,048
Conversion of Class B common units 96,204106,471100,574108,518
Weighted average fully distributed shares outstanding—diluted 144,621145,639145,308145,247
Reconciliation of GAAP EPS to Non-GAAP Adjusted Fully Distributed EPS
GAAP earnings (loss) per share $2.23$(2.24)$19.32$(24.25)
Adjustment of redeemable limited partners’ capital to redemption amount $(2.00)$2.45$(18.33)$25.34
Impact of additions:
Income tax expense $0.19$0.64$1.17$1.02
Stock-based compensation (a) $0.26$0.20$1.16$0.80
Acquisition related expenses $0.09$0.07$0.37$0.25
Strategic and financial restructuring expenses $-$-$0.01$0.04
ERP implementation expenses $0.04$-$0.11$-
Adjustment to tax receivable agreement liability $-$-$(0.11)$-
Loss on investment $-$-$-$0.03
Acquisition related adjustment—deferred revenue $0.01$0.11$0.13$0.37
Loss on disposal of long-lived assets $-$0.41$-$0.43
Amortization of purchased intangible assets $0.20$0.07$0.78$0.26
Net income attributable to non-controlling interest in Premier LP $0.87$0.64$4.57$5.44
Impact of corporation taxes $(0.76)$(0.94)$(3.67)$(3.90)
Impact of increased share count $(0.77)$(1.05)$(3.90)$(4.40)
Non-GAAP Adjusted Fully Distributed Earnings Per Share $0.36$0.36$1.61$1.43
(a) Represents non-cash employee stock-based compensation expense, and $0.1 million and $0.4 million stock purchase plan expense in the three and twelve months
ended June 30, 2016, respectively.
30