Attached files
| file | filename |
|---|---|
| EX-99.4 - EX-99.4 - KEY ENERGY SERVICES INC | d234388dex994.htm |
| EX-99.2 - EX-99.2 - KEY ENERGY SERVICES INC | d234388dex992.htm |
| EX-99.1 - EX-99.1 - KEY ENERGY SERVICES INC | d234388dex991.htm |
| EX-10.2 - EX-10.2 - KEY ENERGY SERVICES INC | d234388dex102.htm |
| EX-10.1 - EX-10.1 - KEY ENERGY SERVICES INC | d234388dex101.htm |
| EX-3.1 - EX-3.1 - KEY ENERGY SERVICES INC | d234388dex31.htm |
| 8-K - 8-K - KEY ENERGY SERVICES INC | d234388d8k.htm |

Project Cipher Discussion Materials August 16, 2016 Exhibit 99.3

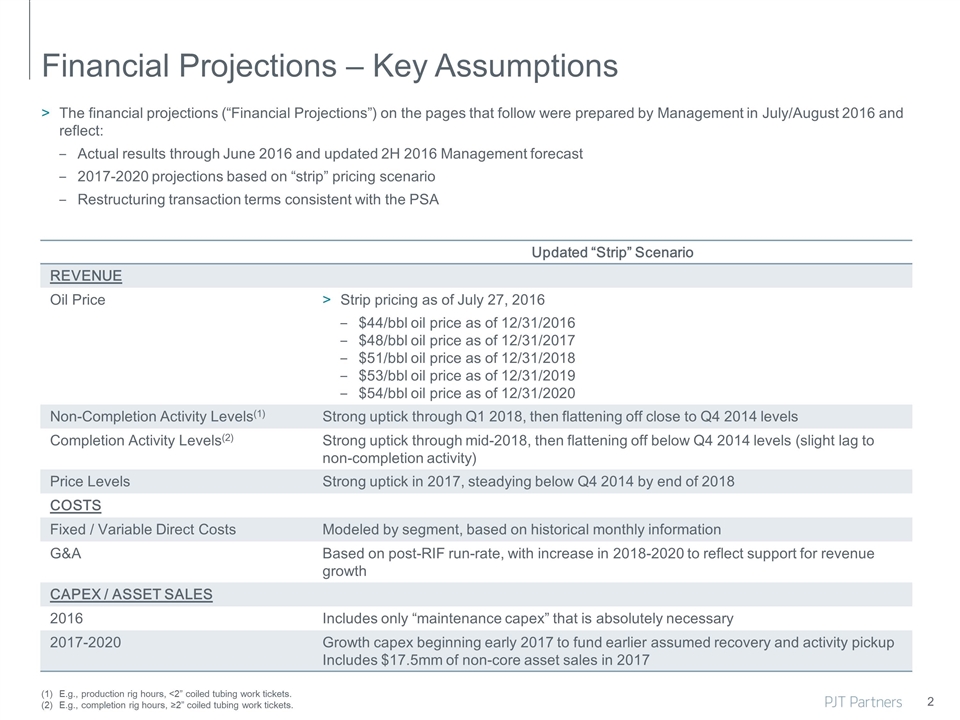
2 Financial Projections – Key Assumptions The financial projections (“Financial Projections”) on the pages that follow were prepared by Management in July/August 2016 and reflect: Actual results through June 2016 and updated 2H 2016 Management forecast 2017-2020 projections based on “strip” pricing scenario Restructuring transaction terms consistent with the PSA E.g., production rig hours, <2” coiled tubing work tickets. E.g., completion rig hours, ≥2” coiled tubing work tickets. Updated “Strip” Scenario REVENUE Oil Price Strip pricing as of July 27, 2016 $44/bbl oil price as of 12/31/2016 $48/bbl oil price as of 12/31/2017 $51/bbl oil price as of 12/31/2018 $53/bbl oil price as of 12/31/2019 $54/bbl oil price as of 12/31/2020 Non-Completion Activity Levels(1) Strong uptick through Q1 2018, then flattening off close to Q4 2014 levels Completion Activity Levels(2) Strong uptick through mid-2018, then flattening off below Q4 2014 levels (slight lag to non-completion activity) Price Levels Strong uptick in 2017, steadying below Q4 2014 by end of 2018 COSTS Fixed / Variable Direct Costs Modeled by segment, based on historical monthly information G&A Based on post-RIF run-rate, with increase in 2018-2020 to reflect support for revenue growth CAPEX / ASSET SALES 2016 Includes only “maintenance capex” that is absolutely necessary 2017-2020 Growth capex beginning early 2017 to fund earlier assumed recovery and activity pickup Includes $17.5mm of non-core asset sales in 2017

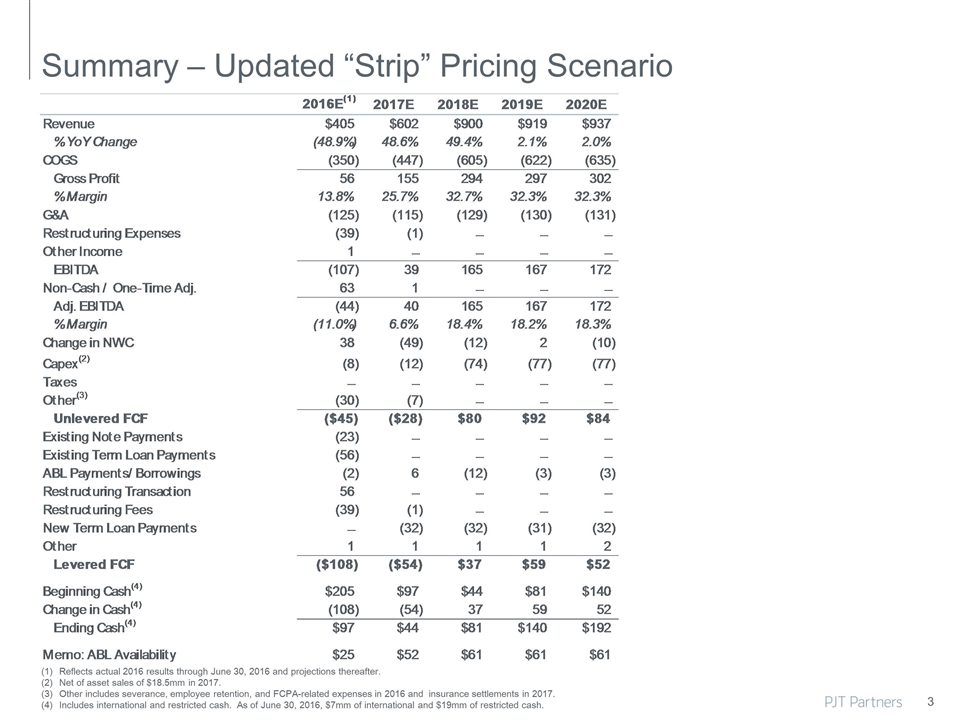
Summary – Updated “Strip” Pricing Scenario Reflects actual 2016 results through June 30, 2016 and projections thereafter. Net of asset sales of $18.5mm in 2017. Other includes severance, employee retention, and FCPA-related expenses in 2016 and insurance settlements in 2017. Includes international and restricted cash. As of June 30, 2016, $7mm of international and $19mm of restricted cash. 3
