Attached files
| file | filename |
|---|---|
| 8-K - 8-K - MVB FINANCIAL CORP | mvbf-20160819x8k.htm |
|
|
DISCLAIMERS 2 Forward Looking Statements This presentation contains forward-looking statements within the meaning of the federal securities laws, which statements involve substantial risks and uncertainties. Forward-looking statements generally relate to future events, future financial condition, future results of operations, plans, objectives, future performance and future business of MVB Financial Corp. (the “Company”) and its subsidiaries. Forward-looking statements, which may be based upon beliefs, expectations and assumptions of the Company’s management and on information available to management at the time the statements are made, are generally identifiable by the use of words such as “believe,” “expect,” “anticipate,” “bode,” “predict,” “suggest,” “project,” “appear,” “plan,” “intend,” “estimate,” “may,” “will,” “would,” “could,” “should,” “likely,” or other similar expressions. These forward-looking statements are necessarily based upon estimates and assumptions that, while considered reasonable by the Company and its management, are inherently uncertain. Factors that may cause actual results to differ materially from current expectations include, but are not limited to, those factors identified in the Company’s filings with the Securities and Exchange Commission. Nothing in this presentation should be regarded as a representation by any person that the forward-looking statements set forth herein will be achieved or that any of the contemplated results of such forward-looking statements will be achieved. You should not place undue reliance on forward-looking statements, which speak only as of the date they are made. Except as required by law, the Company undertakes no obligation to update any statement in light of new information or future events. Non-GAAP Financial Measures The Company uses certain non-GAAP financial measures, such as tangible common equity to tangible assets, to provide information useful to investors in understanding the Company’s operating performance and trends, and facilitate comparisons with the performance of the Company’s peers. The non-GAAP financial measures used may differ from the non-GAAP financial measures other financial institutions use to measure their results of operations. Non-GAAP financial measures should be viewed in addition to, and not as an alternative for, the Company’s reported results prepared in accordance with U.S. GAAP. Reconciliations of these non-GAAP financial measures to the most directly comparable U.S. GAAP financial measures are provided in the Appendix to this presentation. |
|
|
MVBF Overview |
|
|
Experienced Management Team 30 years of banking sector management – including service in a Big 8 accounting firm Named CEO of MVB Financial Corp. in 2009 Served as Retail Banking Manager for BB&T’s WV North Region (which included $2 billion in assets) President of Empire National Bank at 29 Delivers public company corporate governance experience 18 years of banking, financial institution and Big 8 accounting experience Named Chief Operating Officer of MVB Financial Corp. in 2012, CFO in 2016 Served as Market President and Commercial Regional head with HBAN Served as EVP and Chief Accounting Officer of Linn Energy (NASDAQ:LINE) Significant M&A experience CEO – MVB Mortgage 24 years of mortgage experience Co-founded Potomac Mortgage Group, Inc. (PMG) in 2009 4 Don Robinson, Chief Financial Officer Larry Mazza, Chief Executive Officer Ed Dean David Jones John Schirripa Grew George Mason Mortgage from $1 billion to $4 billion prior to acquisition by UBSI Started career with Empire National Bank Regional President 30 years of experience Co-Chairs Management Loan Committee Served as Senior Vice President/Community President of Huntington National Bank Served as Vice President and Relationship Manager with Chase Chief Credit Officer 27 years of experience Background in bank auditing from Big 8 firm Emphasizes credit analysis & quality performance of loans Has held management positions with Huntington National Bank and BB&T |
|
|
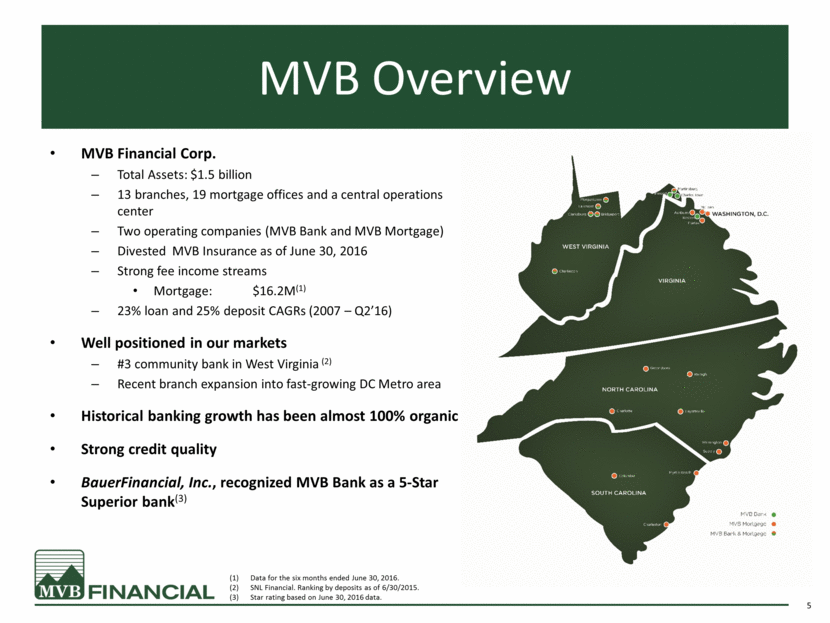
MVB Overview MVB Financial Corp. Total Assets: $1.5 billion 13 branches, 19 mortgage offices and a central operations center Two operating companies (MVB Bank and MVB Mortgage) Divested MVB Insurance as of June 30, 2016 Strong fee income streams Mortgage: $16.2M(1) 23% loan and 25% deposit CAGRs (2007 – Q2’16) Well positioned in our markets #3 community bank in West Virginia (2) Recent branch expansion into fast-growing DC Metro area Historical banking growth has been almost 100% organic Strong credit quality BauerFinancial, Inc., recognized MVB Bank as a 5-Star Superior bank(3) 5 Data for the six months ended June 30, 2016. SNL Financial. Ranking by deposits as of 6/30/2015. Star rating based on June 30, 2016 data. |
|
|
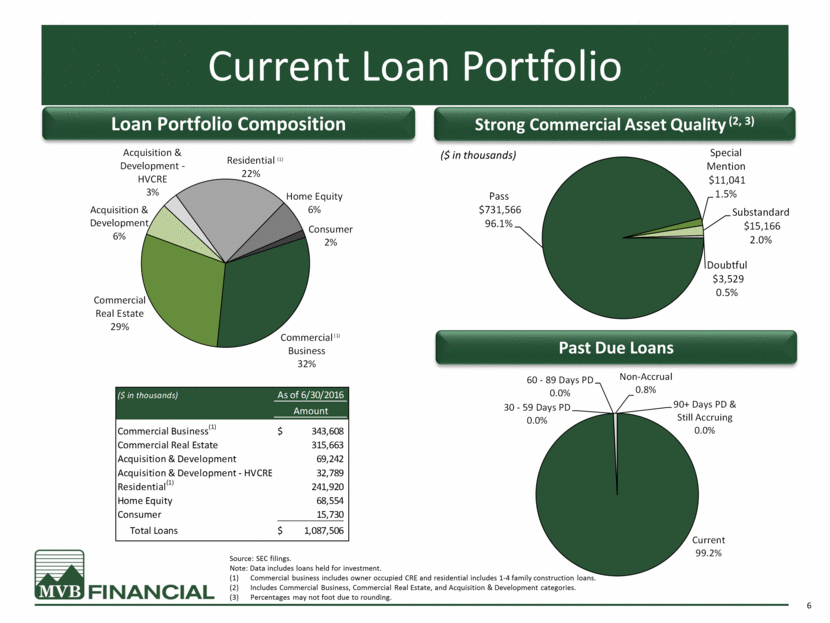
Current Loan Portfolio Source: SEC filings. Note: Data includes loans held for investment. Commercial business includes owner occupied CRE and residential includes 1-4 family construction loans. Includes Commercial Business, Commercial Real Estate, and Acquisition & Development categories. Percentages may not foot due to rounding. ($ in thousands) 6 Strong Commercial Asset Quality (2, 3) Loan Portfolio Composition Past Due Loans ($ in thousands) As of 6/30/2016 Amount Commercial Business (1) 343,608 $ Commercial Real Estate 315,663 Acquisition & Development 69,242 Acquisition & Development - HVCRE 32,789 Residential (1) 241,920 Home Equity 68,554 Consumer 15,730 Total Loans 1,087,506 $ Commercial Business 32% Commercial Real Estate 29% Acquisition & Development 6% Acquisition & Development - HVCRE 3% Residential 22% Home Equity 6% Consumer 2% (1) (1) Current 99.2% 30 - 59 Days PD 0.0% 60 - 89 Days PD 0.0% Non - Accrual 0.8% 90+ Days PD & Still Accruing 0.0% Pass $731,566 96.1% Special Mention $11,041 1.5% Substandard $15,166 2.0% Doubtful $3,529 0.5% |
|
|
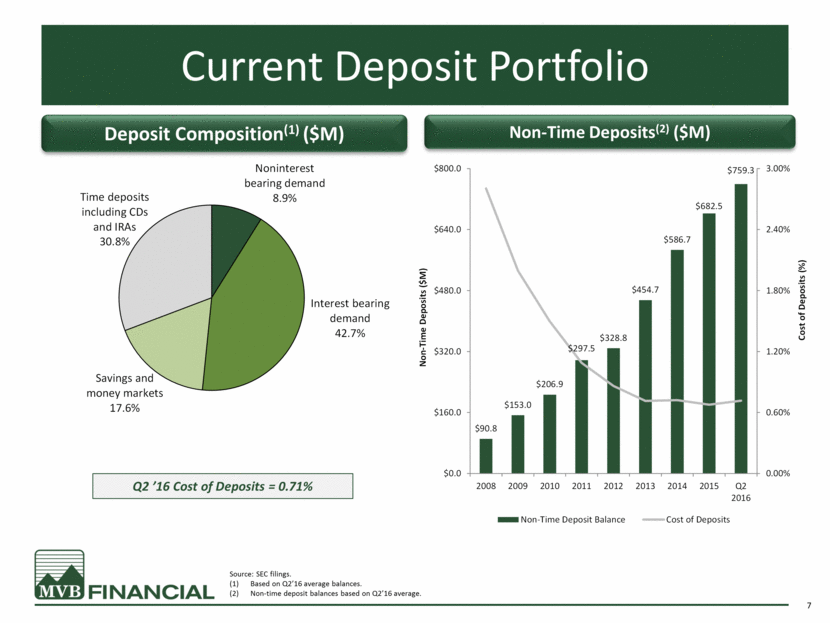
Current Deposit Portfolio Source: SEC filings. Based on Q2’16 average balances. Non-time deposit balances based on Q2’16 average. Q2 ’16 Cost of Deposits = 0.71% 7 Non-Time Deposits(2) ($M) Deposit Composition(1) ($M) Noninterest bearing demand 8.9% Interest bearing demand 42.7% Savings and money markets 17.6% Time deposits including CDs and IRAs 30.8% $90.8 $153.0 $206.9 $297.5 $328.8 $454.7 $586.7 $682.5 $759.3 0.00% 0.60% 1.20% 1.80% 2.40% 3.00% $0.0 $160.0 $320.0 $480.0 $640.0 $800.0 2008 2009 2010 2011 2012 2013 2014 2015 Q2 2016 Cost of Deposits (%) Non - Time Deposits ($M) Non-Time Deposit Balance Cost of Deposits |
|
|
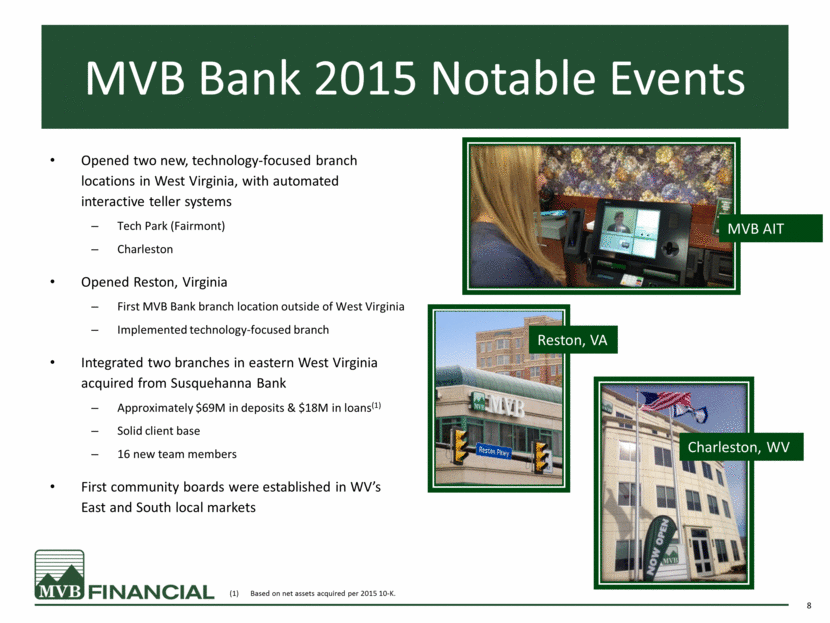
MVB Bank 2015 Notable Events Opened two new, technology-focused branch locations in West Virginia, with automated interactive teller systems Tech Park (Fairmont) Charleston Opened Reston, Virginia First MVB Bank branch location outside of West Virginia Implemented technology-focused branch Integrated two branches in eastern West Virginia acquired from Susquehanna Bank Approximately $69M in deposits & $18M in loans(1) Solid client base 16 new team members First community boards were established in WV’s East and South local markets 8 Reston, VA MVB AIT Charleston, WV Based on net assets acquired per 2015 10-K. |
|
|
Corporate Strategy and Financial Highlights |
|
|
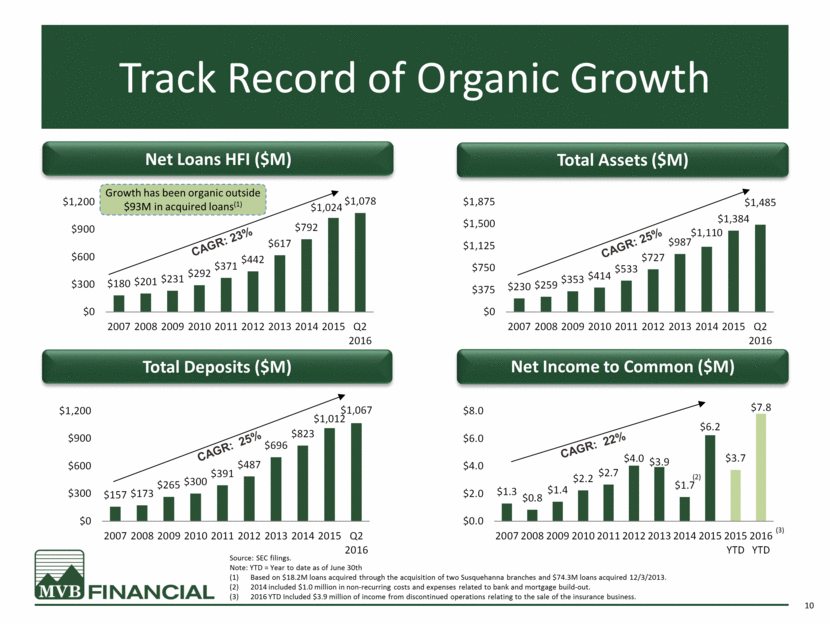
Track Record of Organic Growth Total Assets ($M) Total Deposits ($M) Net Loans HFI ($M) CAGR: 23% CAGR: 25% CAGR: 25% Net Income to Common ($M) CAGR: 22% 10 Source: SEC filings. Note: YTD = Year to date as of June 30th Based on $18.2M loans acquired through the acquisition of two Susquehanna branches and $74.3M loans acquired 12/3/2013. 2014 included $1.0 million in non-recurring costs and expenses related to bank and mortgage build-out. 2016 YTD Included $3.9 million of income from discontinued operations relating to the sale of the insurance business. Growth has been organic outside $93M in acquired loans(1) (2) (3) $1.3 $0.8 $1.4 $2.2 $2.7 $4.0 $3.9 $1.7 $6.2 $3.7 $7.8 $0.0 $2.0 $4.0 $6.0 $8.0 2007 2008 2009 2010 2011 2012 2013 2014 2015 2015 YTD 2016 YTD $230 $259 $353 $414 $533 $727 $987 $1,110 $1,384 $1,485 $0 $375 $750 $1,125 $1,500 $1,875 2007 2008 2009 2010 2011 2012 2013 2014 2015 Q2 2016 $157 $173 $265 $300 $391 $487 $696 $823 $1,012 $1,067 $0 $300 $600 $900 $1,200 2007 2008 2009 2010 2011 2012 2013 2014 2015 Q2 2016 $180 $201 $231 $292 $371 $442 $617 $792 $1,024 $1,078 $0 $300 $600 $900 $1,200 2007 2008 2009 2010 2011 2012 2013 2014 2015 Q2 2016 |
|
|
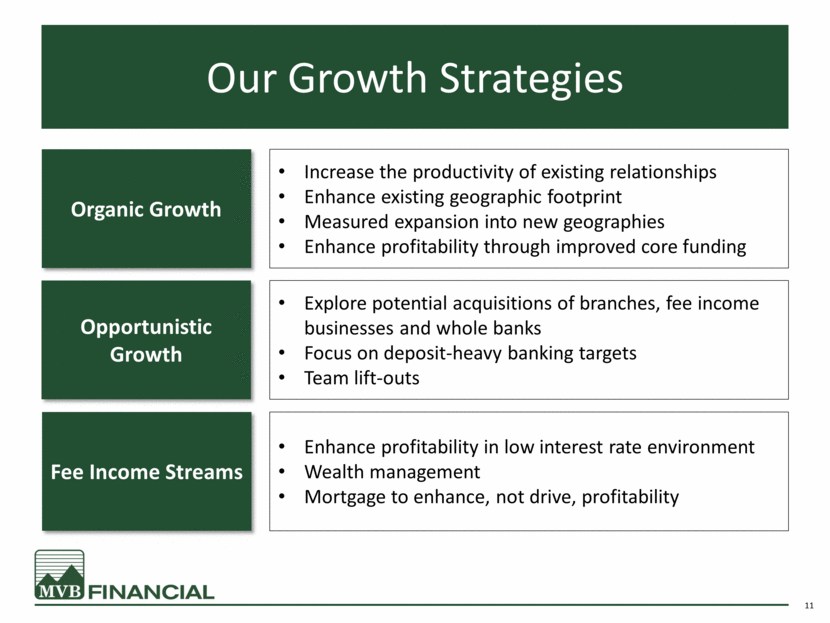
Our Growth Strategies Organic Growth Increase the productivity of existing relationships Enhance existing geographic footprint Measured expansion into new geographies Enhance profitability through improved core funding Opportunistic Growth Explore potential acquisitions of branches, fee income businesses and whole banks Focus on deposit-heavy banking targets Team lift-outs Fee Income Streams Enhance profitability in low interest rate environment Wealth management Mortgage to enhance, not drive, profitability 11 |
|
|
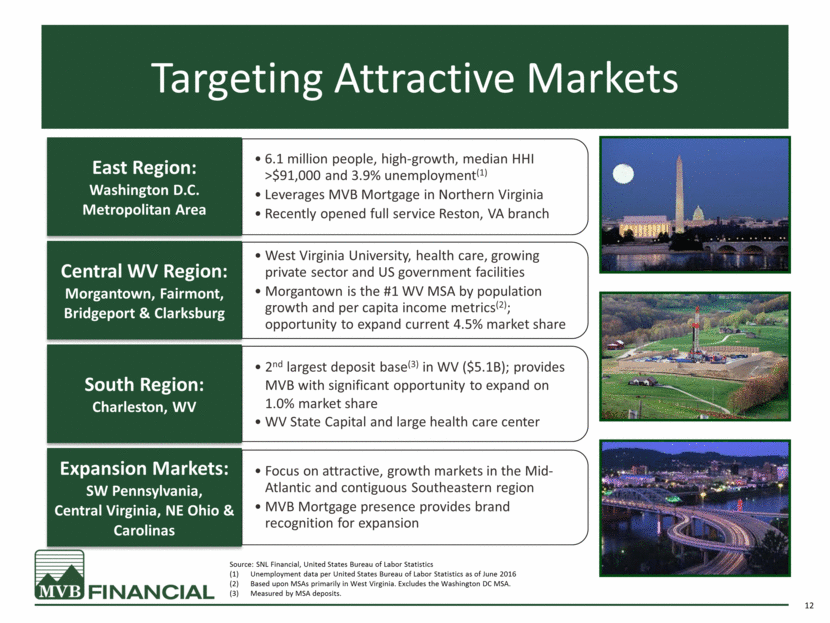
Targeting Attractive Markets 12 Source: SNL Financial, United States Bureau of Labor Statistics Unemployment data per United States Bureau of Labor Statistics as of June 2016 Based upon MSAs primarily in West Virginia. Excludes the Washington DC MSA. Measured by MSA deposits. 6.1 million people, high-growth, median HHI >$91,000 and 3.9% unemployment(1) Leverages MVB Mortgage in Northern Virginia Recently opened full service Reston, VA branch East Region: Washington D.C. Metropolitan Area West Virginia University, health care, growing private sector and US government facilities Morgantown is the #1 WV MSA by population growth and per capita income metrics(2); opportunity to expand current 4.5% market share Central WV Region: Morgantown, Fairmont, Bridgeport & Clarksburg 2nd largest deposit base(3) in WV ($5.1B); provides MVB with significant opportunity to expand on 1.0% market share WV State Capital and large health care center South Region: Charleston, WV Focus on attractive, growth markets in the Mid-Atlantic and contiguous Southeastern region MVB Mortgage presence provides brand recognition for expansion Expansion Markets: SW Pennsylvania, Central Virginia, NE Ohio & Carolinas |
|
|
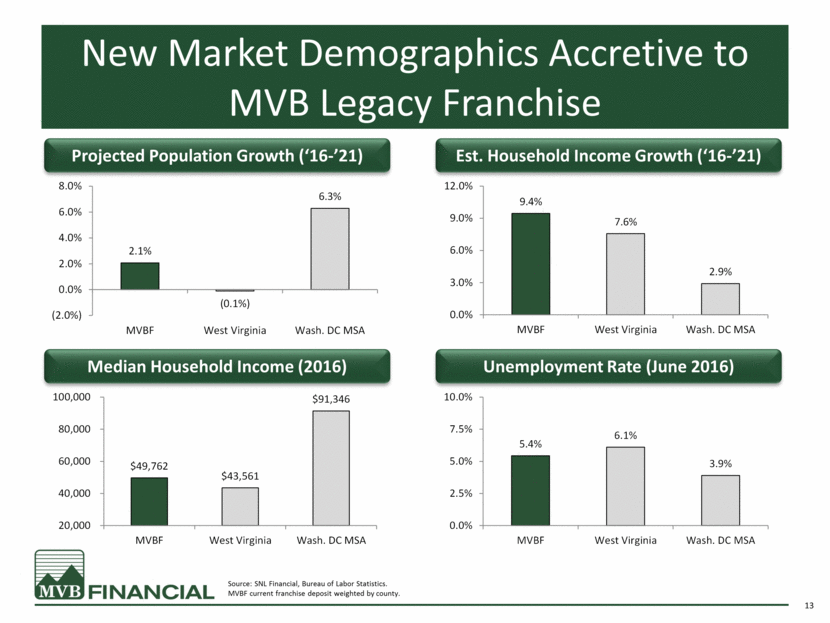
Projected Population Growth (‘16-’21) New Market Demographics Accretive to MVB Legacy Franchise 13 Est. Household Income Growth (‘16-’21) Median Household Income (2016) Unemployment Rate (June 2016) Source: SNL Financial, Bureau of Labor Statistics. MVBF current franchise deposit weighted by county. 2.1% (0.1%) 6.3% (2.0%) 0.0% 2.0% 4.0% 6.0% 8.0% MVBF West Virginia Wash. DC MSA 9.4% 7.6% 2.9% 0.0% 3.0% 6.0% 9.0% 12.0% MVBF West Virginia Wash. DC MSA $49,762 $43,561 $91,346 20,000 40,000 60,000 80,000 100,000 MVBF West Virginia Wash. DC MSA 5.4% 6.1% 3.9% 0.0% 2.5% 5.0% 7.5% 10.0% MVBF West Virginia Wash. DC MSA |
|
|
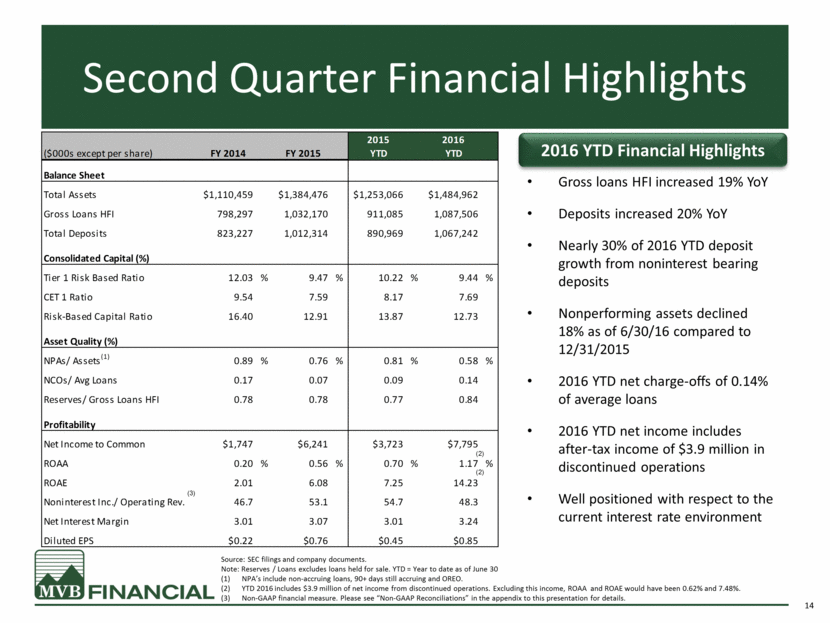
Second Quarter Financial Highlights 14 Source: SEC filings and company documents. Note: Reserves / Loans excludes loans held for sale. YTD = Year to date as of June 30 NPA’s include non-accruing loans, 90+ days still accruing and OREO. YTD 2016 includes $3.9 million of net income from discontinued operations. Excluding this income, ROAA and ROAE would have been 0.62% and 7.48%. Non-GAAP financial measure. Please see “Non-GAAP Reconciliations” in the appendix to this presentation for details. 2016 YTD Financial Highlights Gross loans HFI increased 19% YoY Deposits increased 20% YoY Nearly 30% of 2016 YTD deposit growth from noninterest bearing deposits Nonperforming assets declined 18% as of 6/30/16 compared to 12/31/2015 2016 YTD net charge-offs of 0.14% of average loans 2016 YTD net income includes after-tax income of $3.9 million in discontinued operations Well positioned with respect to the current interest rate environment 2015 2016 ($000s except per share) FY 2014 FY 2015 YTD YTD Balance Sheet Total Assets $1,110,459 $1,384,476 $1,253,066 $1,484,962 Gross Loans HFI 798,297 1,032,170 911,085 1,087,506 Total Deposits 823,227 1,012,314 890,969 1,067,242 Consolidated Capital (%) Tier 1 Risk Based Ratio 12.03 % 9.47 % 10.22 % 9.44 % CET 1 Ratio 9.54 7.59 8.17 7.69 Risk-Based Capital Ratio 16.40 12.91 13.87 12.73 Asset Quality (%) NPAs/ Assets (1) 0.89 % 0.76 % 0.81 % 0.58 % NCOs/ Avg Loans 0.17 0.07 0.09 0.14 Reserves/ Gross Loans HFI 0.78 0.78 0.77 0.84 Profitability Net Income to Common $1,747 $6,241 $3,723 $7,795 ROAA 0.20 % 0.56 % 0.70 % 1.17 % ROAE 2.01 6.08 7.25 14.23 Noninterest Inc./ Operating Rev. 46.7 53.1 54.7 48.3 Net Interest Margin 3.01 3.07 3.01 3.24 Diluted EPS $0.22 $0.76 $0.45 $0.85 (2) (2) (3) |
|
|
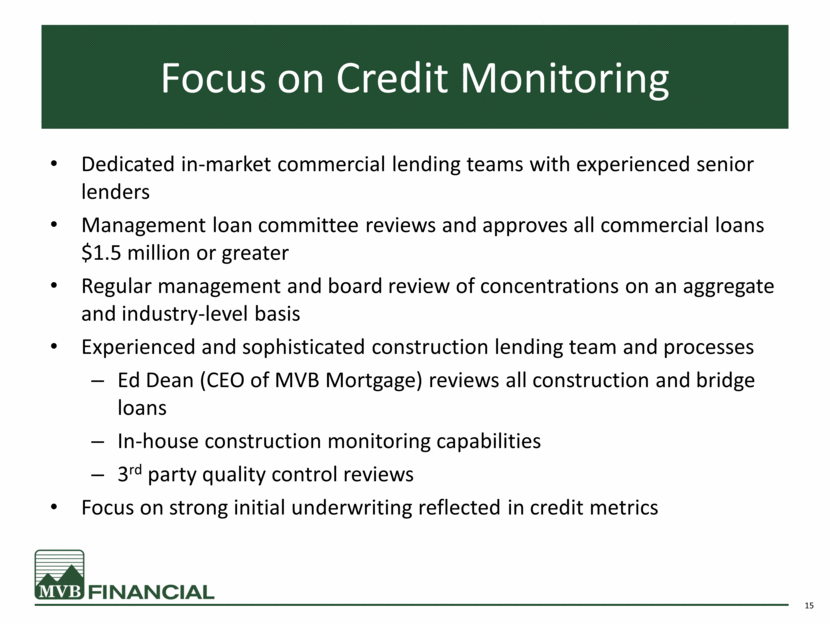
Focus on Credit Monitoring Dedicated in-market commercial lending teams with experienced senior lenders Management loan committee reviews and approves all commercial loans $1.5 million or greater Regular management and board review of concentrations on an aggregate and industry-level basis Experienced and sophisticated construction lending team and processes Ed Dean (CEO of MVB Mortgage) reviews all construction and bridge loans In-house construction monitoring capabilities 3rd party quality control reviews Focus on strong initial underwriting reflected in credit metrics 15 |
|
|
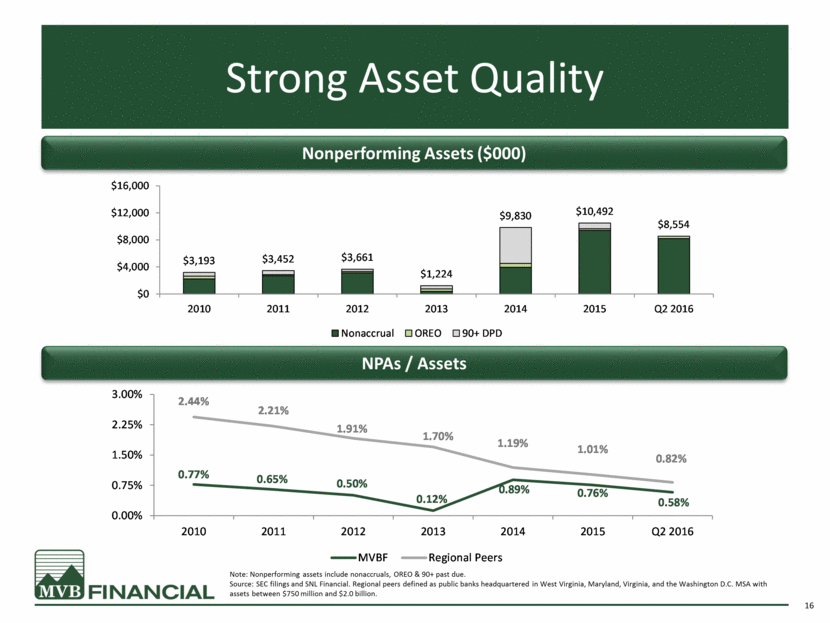
Strong Asset Quality Note: Nonperforming assets include nonaccruals, OREO & 90+ past due. Source: SEC filings and SNL Financial. Regional peers defined as public banks headquartered in West Virginia, Maryland, Virginia, and the Washington D.C. MSA with assets between $750 million and $2.0 billion. 16 Nonperforming Assets ($000) NPAs / Assets $3,193 $3,452 $3,661 $1,224 $9,830 $10,492 $8,554 $0 $4,000 $8,000 $12,000 $16,000 2010 2011 2012 2013 2014 2015 Q2 2016 Nonaccrual OREO 90+ DPD 0.77% 0.65% 0.50% 0.12% 0.89% 0.76% 0.58% 2.44% 2.21% 1.91% 1.70% 1.19% 1.01% 0.82% 0.00% 0.75% 1.50% 2.25% 3.00% 2010 2011 2012 2013 2014 2015 Q2 2016 MVBF Regional Peers |
|
|
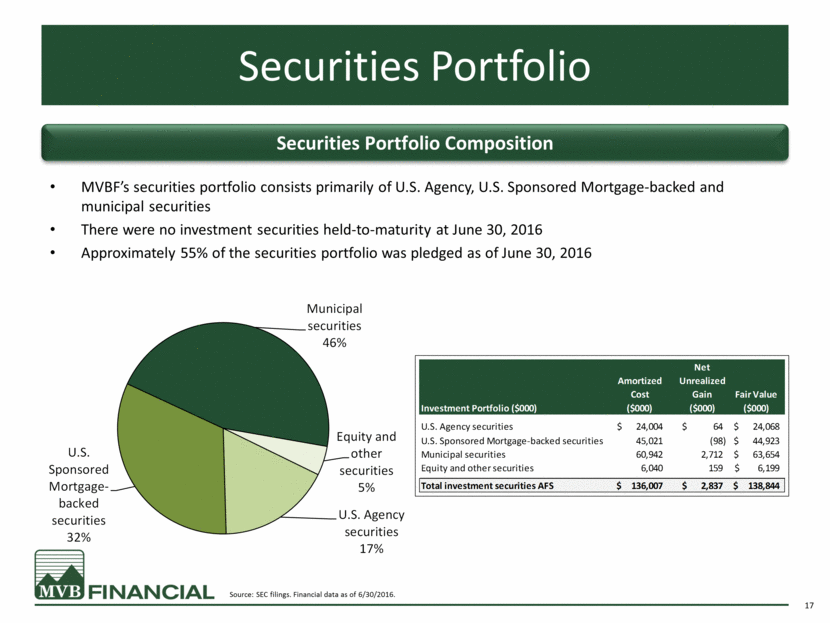
Securities Portfolio 17 Securities Portfolio Composition MVBF’s securities portfolio consists primarily of U.S. Agency, U.S. Sponsored Mortgage-backed and municipal securities There were no investment securities held-to-maturity at June 30, 2016 Approximately 55% of the securities portfolio was pledged as of June 30, 2016 Source: SEC filings. Financial data as of 6/30/2016. Net Amortized Unrealized Cost Gain Fair Value Investment Portfolio ($000) ($000) ($000) ($000) U.S. Agency securities 24,004 $ 64 $ 24,068 $ U.S. Sponsored Mortgage-backed securities 45,021 (98) 44,923 $ Municipal securities 60,942 2,712 63,654 $ Equity and other securities 6,040 159 6,199 $ Total investment securities AFS 136,007 $ 2,837 $ 138,844 $ U.S. Agency securities 17% U.S. Sponsored Mortgage - backed securities 32% Municipal securities 46% Equity and other securities 5% |
|
|
MVB Mortgage |
|
|
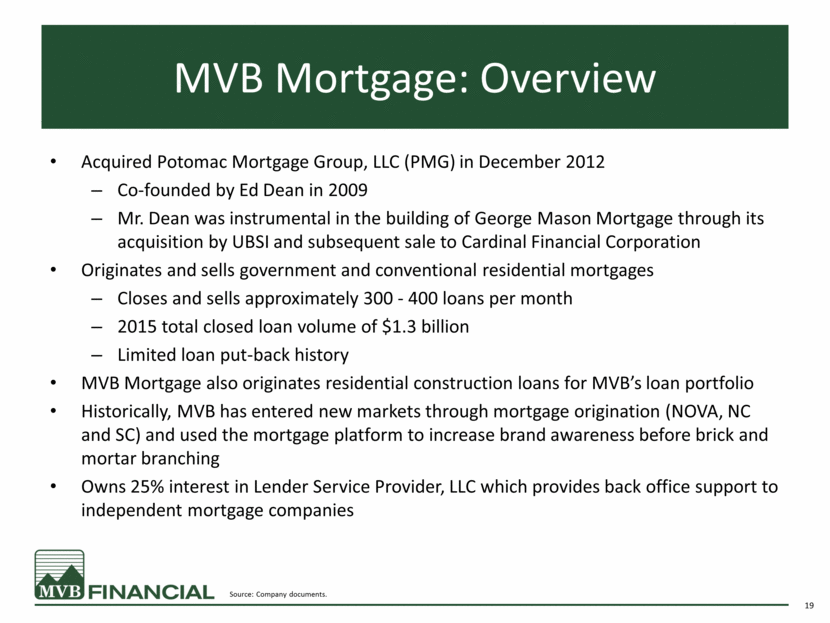
MVB Mortgage: Overview 19 Acquired Potomac Mortgage Group, LLC (PMG) in December 2012 Co-founded by Ed Dean in 2009 Mr. Dean was instrumental in the building of George Mason Mortgage through its acquisition by UBSI and subsequent sale to Cardinal Financial Corporation Originates and sells government and conventional residential mortgages Closes and sells approximately 300 - 400 loans per month 2015 total closed loan volume of $1.3 billion Limited loan put-back history MVB Mortgage also originates residential construction loans for MVB’s loan portfolio Historically, MVB has entered new markets through mortgage origination (NOVA, NC and SC) and used the mortgage platform to increase brand awareness before brick and mortar branching Owns 25% interest in Lender Service Provider, LLC which provides back office support to independent mortgage companies Source: Company documents. |
|
|
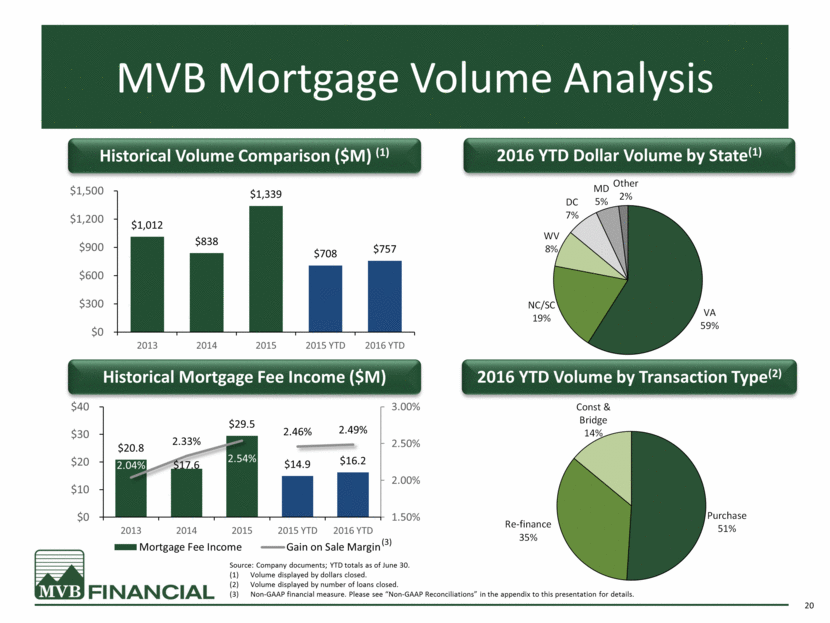
MVB Mortgage Volume Analysis 20 2016 YTD Dollar Volume by State(1) 2016 YTD Volume by Transaction Type(2) Historical Volume Comparison ($M) (1) Historical Mortgage Fee Income ($M) Source: Company documents; YTD totals as of June 30. Volume displayed by dollars closed. Volume displayed by number of loans closed. Non-GAAP financial measure. Please see “Non-GAAP Reconciliations” in the appendix to this presentation for details. $1,012 $838 $1,339 $708 $757 $0 $300 $600 $900 $1,200 $1,500 2013 2014 2015 2015 YTD 2016 YTD $20.8 $17.6 $29.5 $14.9 $16.2 2.04% 2.33% 2.54% 2.46% 2.49% 1.50% 2.00% 2.50% 3.00% $0 $10 $20 $30 $40 2013 2014 2015 2015 YTD 2016 YTD Mortgage Fee Income Gain on Sale Margin (3) VA 59% NC/SC 19% WV 8% DC 7% MD 5% Other 2% Purchase 51% Re - finance 35% Const & Bridge 14% |
|
|
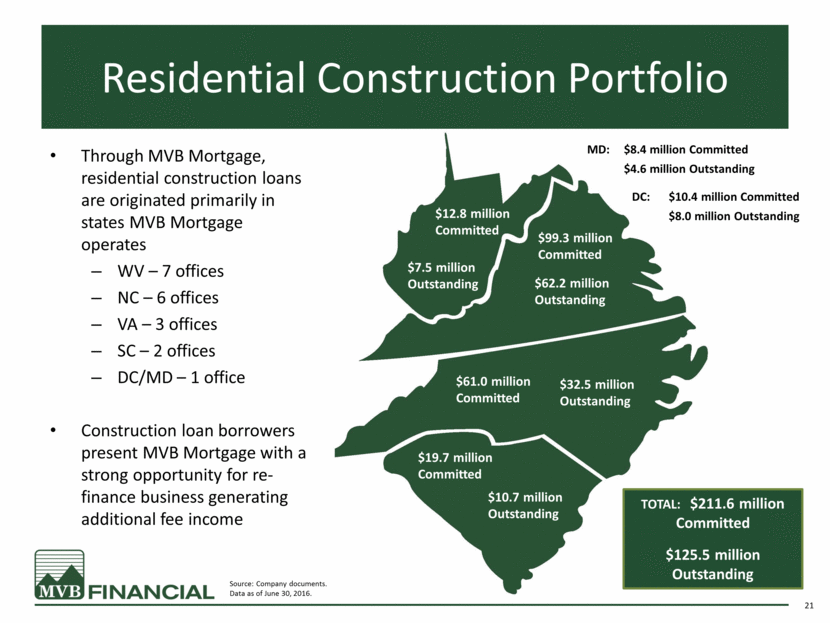
Residential Construction Portfolio $12.8 million Committed $7.5 million Outstanding $99.3 million Committed $62.2 million Outstanding $61.0 million Committed $32.5 million Outstanding $19.7 million Committed $10.7 million Outstanding MD: $8.4 million Committed $4.6 million Outstanding TOTAL: $211.6 million Committed $125.5 million Outstanding 21 Through MVB Mortgage, residential construction loans are originated primarily in states MVB Mortgage operates WV – 7 offices NC – 6 offices VA – 3 offices SC – 2 offices DC/MD – 1 office Construction loan borrowers present MVB Mortgage with a strong opportunity for re-finance business generating additional fee income Source: Company documents. Data as of June 30, 2016. DC: $10.4 million Committed $8.0 million Outstanding |
|
|
Capital Structure and Pro-Forma Impacts |
|
|
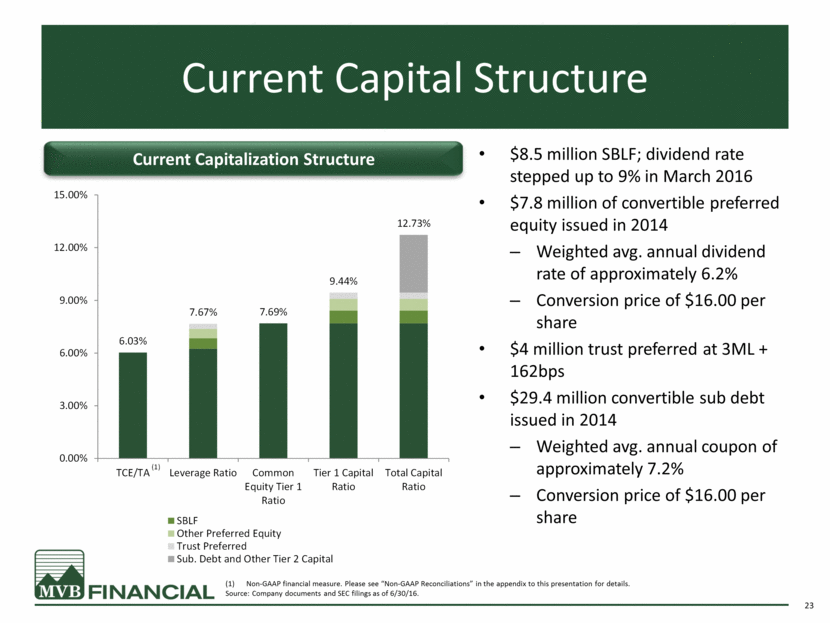
Current Capital Structure Non-GAAP financial measure. Please see “Non-GAAP Reconciliations” in the appendix to this presentation for details. Source: Company documents and SEC filings as of 6/30/16. $8.5 million SBLF; dividend rate stepped up to 9% in March 2016 $7.8 million of convertible preferred equity issued in 2014 Weighted avg. annual dividend rate of approximately 6.2% Conversion price of $16.00 per share $4 million trust preferred at 3ML + 162bps $29.4 million convertible sub debt issued in 2014 Weighted avg. annual coupon of approximately 7.2% Conversion price of $16.00 per share 23 Current Capitalization Structure 6.03% 7.67% 7.69% 9.44% 12.73% 0.00% 3.00% 6.00% 9.00% 12.00% 15.00% TCE/TA Leverage Ratio Common Equity Tier 1 Ratio Tier 1 Capital Ratio Total Capital Ratio SBLF Other Preferred Equity Trust Preferred Sub. Debt and Other Tier 2 Capital (1) |
|
|
Outlook and Goals |
|
|
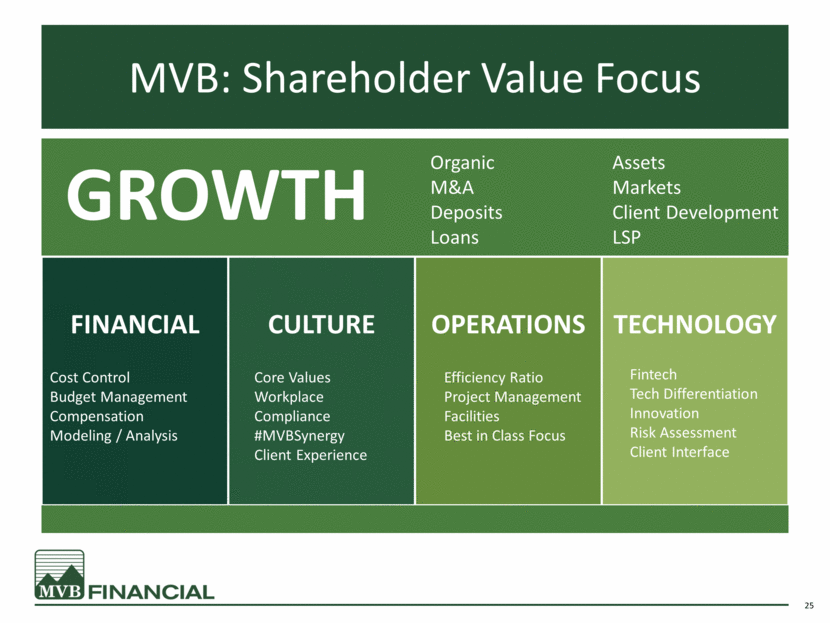
MVB: Shareholder Value Focus 25 Organic M&A Deposits Loans Assets Markets Client Development LSP Cost Control Budget Management Compensation Modeling / Analysis Core Values Workplace Compliance #MVBSynergy Client Experience Efficiency Ratio Project Management Facilities Best in Class Focus Fintech Tech Differentiation Innovation Risk Assessment Client Interface GROWTH FINANCIAL CULTURE OPERATIONS TECHNOLOGY |
|
|
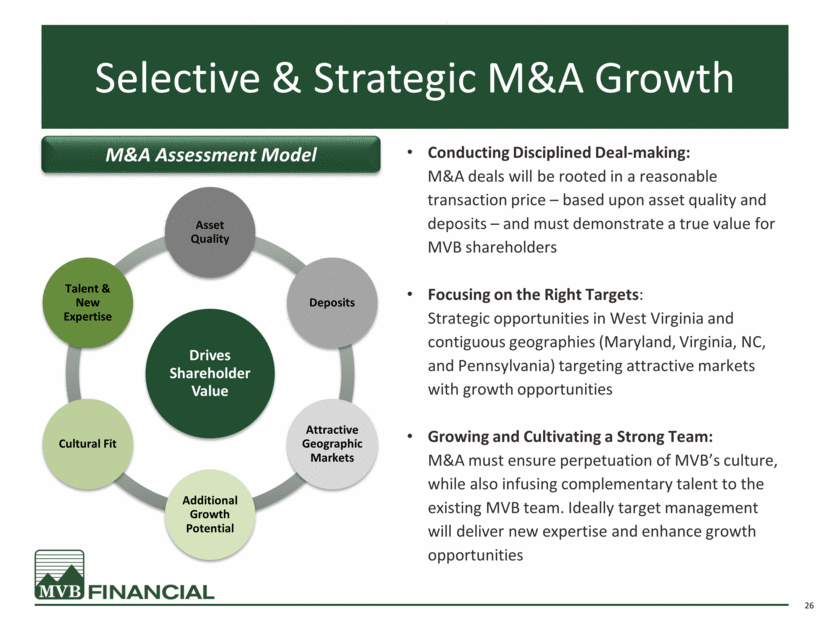
Selective & Strategic M&A Growth Conducting Disciplined Deal-making: M&A deals will be rooted in a reasonable transaction price – based upon asset quality and deposits – and must demonstrate a true value for MVB shareholders Focusing on the Right Targets: Strategic opportunities in West Virginia and contiguous geographies (Maryland, Virginia, NC, and Pennsylvania) targeting attractive markets with growth opportunities Growing and Cultivating a Strong Team: M&A must ensure perpetuation of MVB’s culture, while also infusing complementary talent to the existing MVB team. Ideally target management will deliver new expertise and enhance growth opportunities M&A Assessment Model 26 Drives Shareholder Value Asset Quality Deposits Attractive Geographic Markets Additional Growth Potential Cultural Fit Talent & New Expertise |
|
|
Concluding Remarks |
|
|
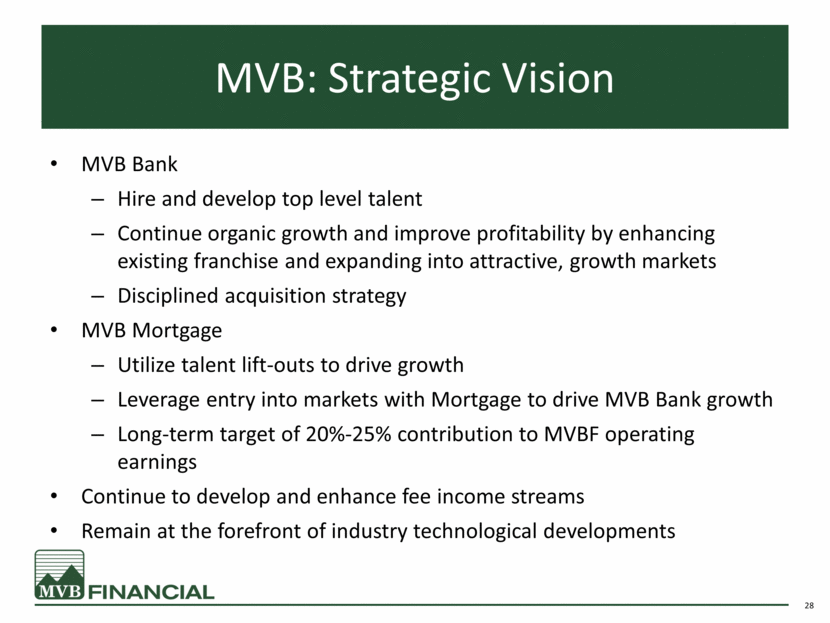
MVB: Strategic Vision 28 MVB Bank Hire and develop top level talent Continue organic growth and improve profitability by enhancing existing franchise and expanding into attractive, growth markets Disciplined acquisition strategy MVB Mortgage Utilize talent lift-outs to drive growth Leverage entry into markets with Mortgage to drive MVB Bank growth Long-term target of 20%-25% contribution to MVBF operating earnings Continue to develop and enhance fee income streams Remain at the forefront of industry technological developments |
|
|
Appendix |
|
|
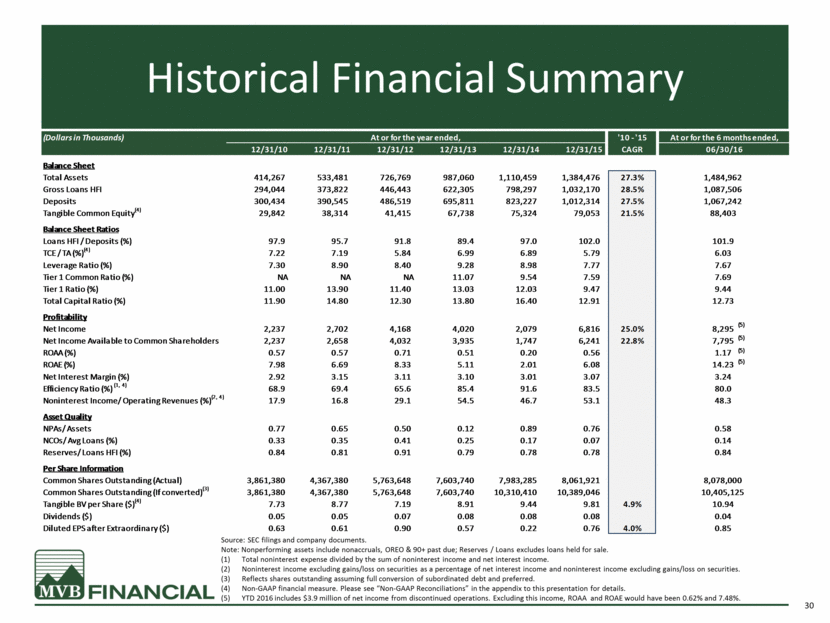
Historical Financial Summary 30 Source: SEC filings and company documents. Note: Nonperforming assets include nonaccruals, OREO & 90+ past due; Reserves / Loans excludes loans held for sale. Total noninterest expense divided by the sum of noninterest income and net interest income. Noninterest income excluding gains/loss on securities as a percentage of net interest income and noninterest income excluding gains/loss on securities. Reflects shares outstanding assuming full conversion of subordinated debt and preferred. Non-GAAP financial measure. Please see “Non-GAAP Reconciliations” in the appendix to this presentation for details. YTD 2016 includes $3.9 million of net income from discontinued operations. Excluding this income, ROAA and ROAE would have been 0.62% and 7.48%. (Dollars in Thousands) At or for the year ended, '10 - '15 At or for the 6 months ended, 12/31/10 12/31/11 12/31/12 12/31/13 12/31/14 12/31/15 CAGR 06/30/16 Balance Sheet Total Assets 414,267 533,481 726,769 987,060 1,110,459 1,384,476 27.3% 1,484,962 Gross Loans HFI 294,044 373,822 446,443 622,305 798,297 1,032,170 28.5% 1,087,506 Deposits 300,434 390,545 486,519 695,811 823,227 1,012,314 27.5% 1,067,242 Tangible Common Equity (4) 29,842 38,314 41,415 67,738 75,324 79,053 21.5% 88,403 Balance Sheet Ratios Loans HFI / Deposits (%) 97.9 95.7 91.8 89.4 97.0 102.0 101.9 TCE / TA (%) (4) 7.22 7.19 5.84 6.99 6.89 5.79 6.03 Leverage Ratio (%) 7.30 8.90 8.40 9.28 8.98 7.77 7.67 Tier 1 Common Ratio (%) NA NA NA 11.07 9.54 7.59 7.69 Tier 1 Ratio (%) 11.00 13.90 11.40 13.03 12.03 9.47 9.44 Total Capital Ratio (%) 11.90 14.80 12.30 13.80 16.40 12.91 12.73 Profitability Net Income 2,237 2,702 4,168 4,020 2,079 6,816 25.0% 8,295 Net Income Available to Common Shareholders 2,237 2,658 4,032 3,935 1,747 6,241 22.8% 7,795 ROAA (%) 0.57 0.57 0.71 0.51 0.20 0.56 1.17 ROAE (%) 7.98 6.69 8.33 5.11 2.01 6.08 14.23 Net Interest Margin (%) 2.92 3.15 3.11 3.10 3.01 3.07 3.24 Efficiency Ratio (%) (1, 4) 68.9 69.4 65.6 85.4 91.6 83.5 80.0 Noninterest Income/ Operating Revenues (%) (2, 4) 17.9 16.8 29.1 54.5 46.7 53.1 48.3 Asset Quality NPAs/ Assets 0.77 0.65 0.50 0.12 0.89 0.76 0.58 NCOs/ Avg Loans (%) 0.33 0.35 0.41 0.25 0.17 0.07 0.14 Reserves/ Loans HFI (%) 0.84 0.81 0.91 0.79 0.78 0.78 0.84 Per Share Information Common Shares Outstanding (Actual) 3,861,380 4,367,380 5,763,648 7,603,740 7,983,285 8,061,921 8,078,000 Common Shares Outstanding (If converted) (3) 3,861,380 4,367,380 5,763,648 7,603,740 10,310,410 10,389,046 10,405,125 Tangible BV per Share ($) (4) 7.73 8.77 7.19 8.91 9.44 9.81 4.9% 10.94 Dividends ($) 0.05 0.05 0.07 0.08 0.08 0.08 0.04 Diluted EPS after Extraordinary ($) 0.63 0.61 0.90 0.57 0.22 0.76 4.0% 0.85 (5) (5) (5) (5) |
|
|
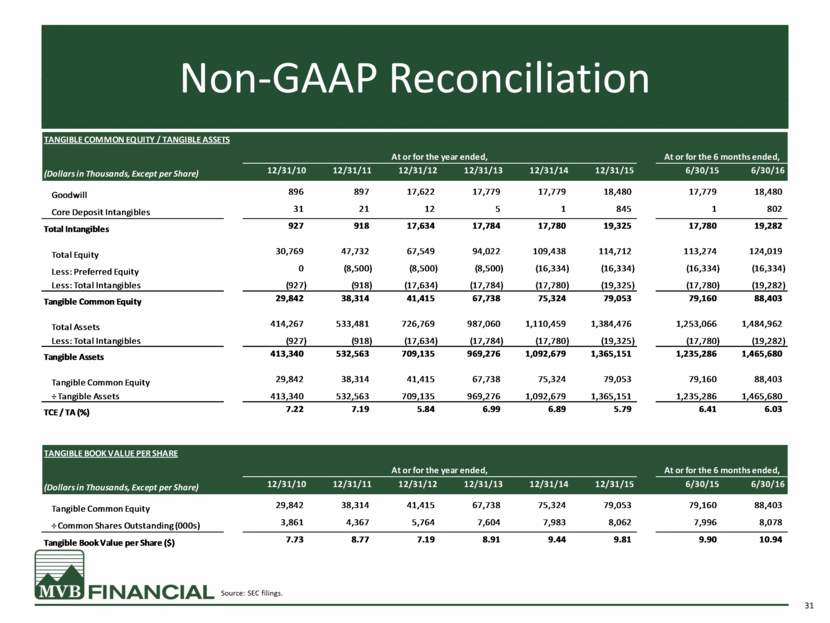
Non-GAAP Reconciliation 31 Source: SEC filings. TANGIBLE COMMON EQUITY / TANGIBLE ASSETS At or for the year ended, At or for the 6 months ended, (Dollars in Thousands, Except per Share) 12/31/10 12/31/11 12/31/12 12/31/13 12/31/14 12/31/15 6/30/15 6/30/16 Goodwill 896 897 17,622 17,779 17,779 18,480 17,779 18,480 Core Deposit Intangibles 31 21 12 5 1 845 1 802 Total Intangibles 927 918 17,634 17,784 17,780 19,325 17,780 19,282 Total Equity 30,769 47,732 67,549 94,022 109,438 114,712 113,274 124,019 Less: Preferred Equity 0 (8,500) (8,500) (8,500) (16,334) (16,334) (16,334) (16,334) Less: Total Intangibles (927) (918) (17,634) (17,784) (17,780) (19,325) (17,780) (19,282) Tangible Common Equity 29,842 38,314 41,415 67,738 75,324 79,053 79,160 88,403 Total Assets 414,267 533,481 726,769 987,060 1,110,459 1,384,476 1,253,066 1,484,962 Less: Total Intangibles (927) (918) (17,634) (17,784) (17,780) (19,325) (17,780) (19,282) Tangible Assets 413,340 532,563 709,135 969,276 1,092,679 1,365,151 1,235,286 1,465,680 Tangible Common Equity 29,842 38,314 41,415 67,738 75,324 79,053 79,160 88,403 ÷ Tangible Assets 413,340 532,563 709,135 969,276 1,092,679 1,365,151 1,235,286 1,465,680 TCE / TA (%) 7.22 7.19 5.84 6.99 6.89 5.79 6.41 6.03 TANGIBLE BOOK VALUE PER SHARE At or for the year ended, At or for the 6 months ended, (Dollars in Thousands, Except per Share) 12/31/10 12/31/11 12/31/12 12/31/13 12/31/14 12/31/15 6/30/15 6/30/16 Tangible Common Equity 29,842 38,314 41,415 67,738 75,324 79,053 79,160 88,403 ÷ Common Shares Outstanding (000s) 3,861 4,367 5,764 7,604 7,983 8,062 7,996 8,078 Tangible Book Value per Share ($) 7.73 8.77 7.19 8.91 9.44 9.81 9.90 10.94 |
|
|
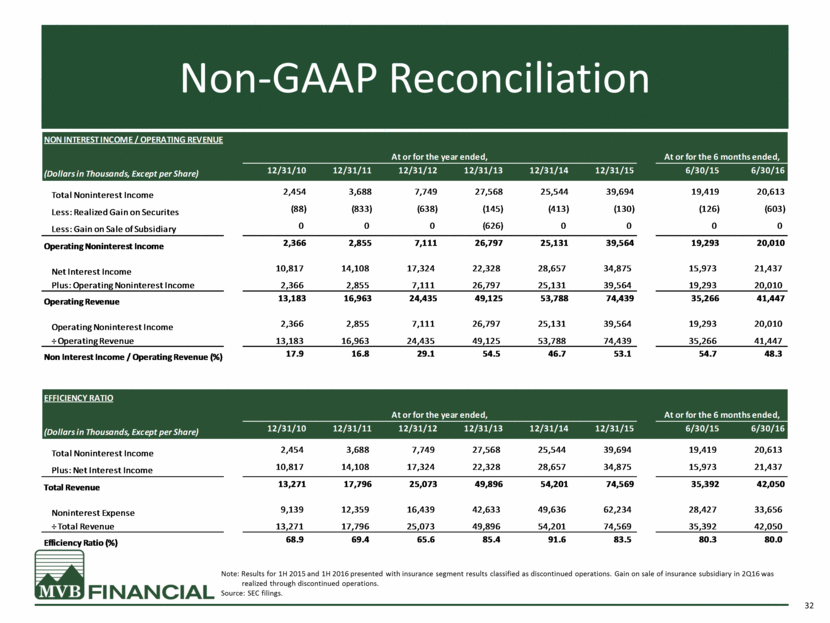
Non-GAAP Reconciliation 32 Note: Results for 1H 2015 and 1H 2016 presented with insurance segment results classified as discontinued operations. Gain on sale of insurance subsidiary in 2Q16 was realized through discontinued operations. Source: SEC filings. NON INTEREST INCOME / OPERATING REVENUE At or for the year ended, At or for the 6 months ended, (Dollars in Thousands, Except per Share) 12/31/10 12/31/11 12/31/12 12/31/13 12/31/14 12/31/15 6/30/15 6/30/16 Total Noninterest Income 2,454 3,688 7,749 27,568 25,544 39,694 19,419 20,613 Less: Realized Gain on Securites (88) (833) (638) (145) (413) (130) (126) (603) Less: Gain on Sale of Subsidiary 0 0 0 (626) 0 0 0 0 Operating Noninterest Income 2,366 2,855 7,111 26,797 25,131 39,564 19,293 20,010 Net Interest Income 10,817 14,108 17,324 22,328 28,657 34,875 15,973 21,437 Plus: Operating Noninterest Income 2,366 2,855 7,111 26,797 25,131 39,564 19,293 20,010 Operating Revenue 13,183 16,963 24,435 49,125 53,788 74,439 35,266 41,447 Operating Noninterest Income 2,366 2,855 7,111 26,797 25,131 39,564 19,293 20,010 ÷ Operating Revenue 13,183 16,963 24,435 49,125 53,788 74,439 35,266 41,447 Non Interest Income / Operating Revenue (%) 17.9 16.8 29.1 54.5 46.7 53.1 54.7 48.3 EFFICIENCY RATIO At or for the year ended, At or for the 6 months ended, (Dollars in Thousands, Except per Share) 12/31/10 12/31/11 12/31/12 12/31/13 12/31/14 12/31/15 6/30/15 6/30/16 Total Noninterest Income 2,454 3,688 7,749 27,568 25,544 39,694 19,419 20,613 Plus: Net Interest Income 10,817 14,108 17,324 22,328 28,657 34,875 15,973 21,437 Total Revenue 13,271 17,796 25,073 49,896 54,201 74,569 35,392 42,050 Noninterest Expense 9,139 12,359 16,439 42,633 49,636 62,234 28,427 33,656 ÷ Total Revenue 13,271 17,796 25,073 49,896 54,201 74,569 35,392 42,050 Efficiency Ratio (%) 68.9 69.4 65.6 85.4 91.6 83.5 80.3 80.0 |
|
|
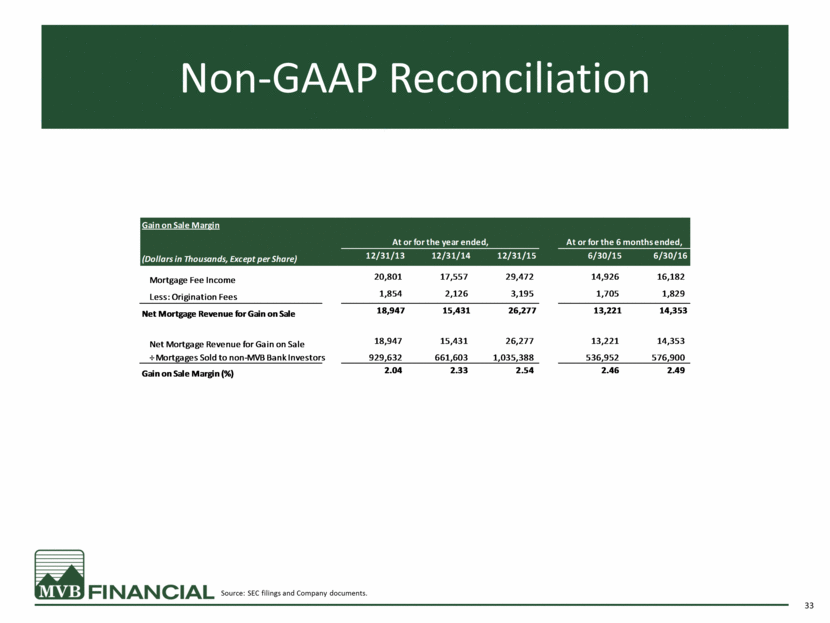
Non-GAAP Reconciliation 33 Source: SEC filings and Company documents. Gain on Sale Margin At or for the year ended, At or for the 6 months ended, (Dollars in Thousands, Except per Share) 12/31/13 12/31/14 12/31/15 6/30/15 6/30/16 Mortgage Fee Income 20,801 17,557 29,472 14,926 16,182 Less: Origination Fees 1,854 2,126 3,195 1,705 1,829 Net Mortgage Revenue for Gain on Sale 18,947 15,431 26,277 13,221 14,353 Net Mortgage Revenue for Gain on Sale 18,947 15,431 26,277 13,221 14,353 ÷ Mortgages Sold to non-MVB Bank Investors 929,632 661,603 1,035,388 536,952 576,900 Gain on Sale Margin (%) 2.04 2.33 2.54 2.46 2.49 |
|
|
[LOGO] |

