Attached files
Table of Contents
As filed with the Securities and Exchange Commission on August 19, 2016.
Registration Statement No. 333-
UNITED STATES
SECURITIES AND EXCHANGE COMMISSION
WASHINGTON, D.C. 20549
FORM S-1
REGISTRATION STATEMENT
UNDER
THE SECURITIES ACT OF 1933
EVERBRIDGE, INC.
(Exact name of registrant as specified in its charter)
| Delaware | 7372 | 26-2919312 | ||
| (State or other jurisdiction of incorporation or organization) |
(Primary Standard Industrial Classification Code Number) |
(I.R.S. Employer Identification Number) |
25 Corporate Drive, Suite 400
Burlington, Massachusetts 01803
(818) 230-9700
(Address, including zip code, and telephone number, including area code, of registrant’s principal executive offices)
Jaime Ellertson
President and Chief Executive Officer
Everbridge, Inc.
25 Corporate Drive, Suite 400
Burlington, Massachusetts 01803
(818) 230-9700
(Name, address, including zip code, and telephone number, including area code, of agent for service)
Copies to:
| C. Thomas Hopkins, Esq. Nicole C. Brookshire, Esq. Richard C. Segal, Esq. Cooley LLP 1333 2nd Street, Suite 400 Santa Monica, California 90401 (310) 883-6400 |
Kenneth S. Goldman Elliot J. Mark, Esq. Everbridge, Inc. 25 Corporate Drive, Suite 400 Burlington, Massachusetts 01803 (818) 230-9700 |
Kenneth J. Gordon, Esq. Goodwin Procter LLP 100 Northern Avenue Boston, Massachusetts 02210 (617) 570-1000 |
Approximate date of commencement of proposed sale to the public: As soon as practicable after the effective date of this registration statement.
If any of the securities being registered on this Form are to be offered on a delayed or continuous basis pursuant to Rule 415 under the Securities Act of 1933, as amended, check the following box. ¨
If this Form is filed to register additional securities for an offering pursuant to Rule 462(b) under the Securities Act, check the following box and list the Securities Act registration statement number of the earlier effective registration statement for the same offering. ¨
If this Form is a post-effective amendment filed pursuant to Rule 462(c) under the Securities Act, check the following box and list the Securities Act registration statement number of the earlier effective registration statement for the same offering. ¨
If this Form is a post-effective amendment filed pursuant to Rule 462(d) under the Securities Act, check the following box and list the Securities Act registration number of the earlier effective registration statement for the same offering. ¨
Indicate by check mark whether the registrant is a large accelerated filer, an accelerated filer, a non-accelerated filer or a smaller reporting company. See the definitions of “large accelerated filer,” “accelerated filer” and “smaller reporting company” in Rule 12b-2 of the Exchange Act.
|
Large Accelerated Filer ¨ |
Accelerated Filer ¨ | Non-accelerated Filer x | Smaller Reporting Company ¨ |
CALCULATION OF REGISTRATION FEE
|
| ||||
| Title of Securities Being Registered | Proposed Maximum Aggregate Offering Price(1)(2) |
Amount of Registration Fee | ||
| Common Stock, $0.001 par value per share |
$90,000,000 | $9,063 | ||
|
| ||||
|
| ||||
| (1) | In accordance with Rule 457(o) under the Securities Act of 1933, as amended, the number of shares being registered and the proposed maximum offering price per share are not included in this table. |
| (2) | Estimated solely for purposes of computing the amount of the registration fee pursuant to Rule 457(o) under the Securities Act of 1933, as amended. Includes the offering price of shares that the underwriters have the option to purchase to cover over-allotments, if any. |
The registrant hereby amends this Registration Statement on such date or dates as may be necessary to delay its effective date until the registrant shall file a further amendment that specifically states that this Registration Statement shall thereafter become effective in accordance with Section 8(a) of the Securities Act of 1933, as amended, or until the Registration Statement shall become effective on such date as the Securities and Exchange Commission, acting pursuant to said Section 8(a), may determine.
Table of Contents
The information in this prospectus is not complete and may be changed. We and the selling stockholders may not sell these securities until the registration statement filed with the Securities and Exchange Commission is effective. This prospectus is not an offer to sell these securities and we and the selling stockholders are not soliciting offers to buy these securities in any state where the offer or sale is not permitted.
SUBJECT TO COMPLETION, DATED AUGUST 19, 2016
PRELIMINARY PROSPECTUS
Shares

Common Stock
We are selling shares of common stock and the selling stockholders are selling shares of common stock. We will not receive any of the proceeds from the shares of common stock sold by the selling stockholders.
Prior to this offering, there has been no public market for our common stock. The initial public offering price of our common stock is expected to be between $ and $ per share. We have applied to list our common stock on the NASDAQ Global Market under the symbol “EVBG.”
We are an “emerging growth company” as defined under the U.S. federal securities laws and have elected to comply with certain reduced public company disclosure and reporting requirements for this prospectus and future filings. See “Prospectus Summary—Implications of Being an Emerging Growth Company.”
The underwriters have an option to purchase a maximum of additional shares from the selling stockholders at the initial public offering price, less underwriting discounts and commissions, within 30 days from the date of this prospectus solely to cover over-allotments of shares.
Investing in our common stock involves risks. See “Risk Factors” beginning on page 18.
| Price to Public |
Underwriting |
Proceeds to |
Proceeds to | |||||
| Per Share |
$ | $ | $ | $ | ||||
| Total |
$ | $ | $ | $ |
| (1) | See “Underwriting” beginning on page 138 for additional information regarding underwriting compensation. |
The underwriters expect to deliver the shares of our common stock on or about , 2016.
Neither the Securities and Exchange Commission nor any state securities commission has approved or disapproved of these securities or determined if this prospectus is truthful or complete. Any representation to the contrary is a criminal offense.
| Credit Suisse | BofA Merrill Lynch | |||
| Stifel | Pacific Crest Securities a division of KeyBanc Capital Markets | |||
| Raymond James | Canaccord Genuity | William Blair | ||
The date of this prospectus is , 2016
Table of Contents

Table of Contents

Table of Contents
You should rely only on the information contained in this document and any free writing prospectus we provide to you. We have not, the selling stockholders have not and the underwriters have not authorized anyone to provide any information or to make any representations other than those contained in this prospectus or in any free writing prospectuses we have prepared. We take no responsibility for, and can provide no assurance as to the reliability of, any other information that others may give you. This prospectus is an offer to sell only the shares offered hereby, but only under circumstances and in jurisdictions where it is lawful to do so. The information contained in this prospectus is current only as of its date.
For investors outside the United States: We have not, the selling stockholders have not and the underwriters have not done anything that would permit this offering, or possession or distribution of this prospectus in any jurisdiction where action for that purpose is required, other than in the United States. Persons outside the United States who come into possession of this prospectus must inform themselves about, and observe any restrictions relating to, the offering of the shares of common stock and the distribution of this prospectus outside of the United States.
DEALER PROSPECTUS DELIVERY OBLIGATION
Through and including , 2016 (25 days after the date of this prospectus), all dealers that effect transactions in our common stock, whether or not participating in this offering, may be required to deliver a prospectus. This is in addition to the dealer’s obligation to deliver a prospectus when acting as an underwriter and with respect to unsold allotments or subscriptions.
i
Table of Contents
This summary highlights information contained elsewhere in this prospectus and does not contain all of the information that you should consider in making your investment decision. Before investing in our common stock, you should carefully read this entire prospectus, including our consolidated financial statements and the related notes and the information set forth under the sections titled “Risk Factors,” “Special Note Regarding Forward-Looking Statements,” and “Management’s Discussion and Analysis of Financial Condition and Results of Operations,” in each case included in this prospectus. Unless the context otherwise requires, we use the terms “Everbridge,” “company,” “our,” “us,” and “we” in this prospectus to refer to Everbridge, Inc. and, where appropriate, our consolidated subsidiaries.
EVERBRIDGE, INC.
Overview
We are a global software company that provides critical communications and enterprise safety applications that enable customers to automate and accelerate the process of keeping people safe and businesses running during critical events. During public safety threats such as active shooter situations, terrorist attacks or severe weather conditions, as well as critical business events such as IT outages or cyber incidents, our SaaS-based platform enables our customers to quickly and reliably aggregate and assess threat data, locate people at risk and responders able to assist, and automate the execution of pre-defined communications processes. Our customers use our platform to deliver intelligent, contextual messages to, and receive verification of delivery from, hundreds or millions of recipients, across multiple communications modalities such as voice, SMS and e-mail. Our applications enable the delivery of messages in near real-time to more than 100 different communication devices, in over 200 countries and territories, in 15 languages and dialects – all simultaneously. We delivered 1.1 billion communications in 2015. We automate the process of sending contextual notifications to multiple constituencies and receiving return information on a person’s or operation’s status so that organizations can act quickly and precisely. Our critical communications and enterprise safety applications include Mass Notification, Incident Management, IT Alerting, Safety Connection, Community Engagement, Secure Messaging and Internet of Things, and are easy-to-use and deploy, secure, highly scalable and reliable. We believe that our broad suite of integrated, enterprise applications delivered via a single global platform is a significant competitive advantage in the market for critical communications and enterprise safety solutions, which we refer to generally as critical communications.
In critical situations, the speed at which information is transmitted and accessed is essential. For example, United States Department of Homeland Security research indicates that the average duration of an active shooter event at a school is approximately 12.5 minutes, while a U.S. Federal Bureau of Investigation study of active shooter events between 2000 and 2013 found that 60% of the incidents ended before the police arrived. Accordingly, organizations must be able to rapidly deliver messages that are tailored to multiple, specific audiences, in precise locations and must be assured of delivery. Further, the proliferation of mobile and digital communications has resulted in individuals spending less time in a fixed office location, with International Data Corporation estimating that by 2020 mobile workers will account for 72% of the total United States workforce, and this trend has simultaneously increased the number of pathways through which people receive information. These developments have made it imperative that critical communications be delivered to social media, outdoor signage and personal computers, as well as via voice, SMS and email. Moreover, organizations require the ability to leverage all of these pathways, individually or in sequence, to reach people in situations where a certain means of communication may be inoperative or individuals are not responsive to a single pathway. During public safety threats and critical business events, the ability to gather, organize and analyze data, and to enable secure, scalable, reliable and automated communications to people can be essential to saving lives and protecting assets. Further, the ability to rapidly organize a response with automated communications can also result in significant economic savings, as each minute of unplanned downtime costs organizations an average of approximately $5,600, according to Gartner, Inc.
1
Table of Contents
The severity, complexity and frequency of these critical events, their implications for business performance and personal safety, and regulatory and compliance challenges are increasing. The need for active shooter preparedness and public safety protection from terrorist attacks, as well as notifications about IT outages, cyber incidents, severe weather conditions, missing persons, failing equipment and other urgent events, drive the need for a secure, scalable and reliable notification system that can be operated quickly and easily. In addition, there has been a rapid proliferation of connected devices and networked physical objects – the Internet of Things, or IoT – that have the capability to communicate information about status and environment and generate data that enables individuals and enterprises to take appropriate action. These dynamics have led to a growing need for enterprise critical communications solutions that can deliver comprehensive yet targeted and contextually relevant content that facilitates the desired outcomes in critical situations and overcomes the information overload that individuals face. We estimate, based on data from Frost & Sullivan, presented in an independent study commissioned by us, and data from Markets and Markets, that the market for critical communications solutions represented a $15.6 billion worldwide opportunity in 2015 and is expected to grow to $31.9 billion in 2020.
Our SaaS-based critical communications platform is built on a secure, scalable and reliable infrastructure with multiple layers of redundancy to enable the rapid delivery of critical communications, with near real-time verification, over numerous devices and contact paths. Mass Notification is our most established application and enables enterprises and governmental entities to aggregate and assess threat data, locate people based on their dynamic location, send and receive two-way, contextually aware notifications to individuals or groups to keep them informed before, during and after natural or man-made disasters and other emergencies. By automating the delivery of these types of critical communications, we enable customers to increase the speed and accuracy of their response and reduce associated costs. Importantly, given the pressure and anxiety most people experience in critical situations, our Mass Notification application provides a simple user interface and automated workflows for ease of use. The expertise that we garnered developing our Mass Notification application and our customers’ reliance on our solutions led us to leverage our platform to deploy solutions for additional critical communications use cases. In turn, we have developed a full suite of enterprise-scale applications that enable our customers to inform and organize people during critical situations, whether a broad audience or a targeted subset of individuals, globally or locally, and accounting for cultural, linguistic, regulatory and technological differences. As all of our applications leverage our critical communications platform, customers can use a single contacts database, rules engine of algorithms and hierarchies and user interface to accomplish multiple objectives. Our applications are easy-to-use, quickly deployable and require minimal implementation services and no development resources.
The following situations reflect examples of how our applications aggregate and assess data and enable and optimize critical communications processes:
| • | When an active shooter situation or terrorist attack occurs, organizations can quickly identify employees in the affected area, including employees not at their usual business location, in order to confirm that they are safe and provide tailored instructions. For example, shelter-in-place instructions may be provided to people in an impacted building while evacuation instructions are provided to those in an adjacent building. At the same time, first responders and hospitals can use multiple modes of alerting to mobilize resources and call in staff to provide emergency care. |
| • | When a hurricane is imminent, local emergency management departments can alert affected communities with relevant safety and evacuation instructions while organizations can notify employees of office closures and provide safety instructions. |
| • | When IT systems fail, IT administrators can shorten the time required to alert cross-department responders, use scheduling information to determine availability and quickly assemble appropriate personnel on a conference bridge, thereby reducing the costs incurred from downtime. |
2
Table of Contents
| • | When a patient is suspected of having a stroke, an on-call specialist can provide a patient assessment via video communications during the ambulance trip and the emergency room can be readied for an immediate stroke treatment, accelerating critical time to treatment. |
| • | When a cyber incident shuts down an IT network, management can alert employees of the network shutdown via a secure, alternate communication path. |
| • | When a power line is down, utility workers can utilize pre-configured incident management templates to alert affected customers and responders and provide service updates. |
| • | When engine readings in critical equipment detect a malfunction, technicians with the appropriate skills can be automatically alerted and quickly deployed to minimize downtime and avoid revenue loss or service interruption. |
| • | When readings from an implanted medical device are abnormal, that information can be automatically routed to the individual’s healthcare provider to enable timely medical care. |
| • | When a young child goes missing, local officials can send alerts to and receive tips from their communities to aid in locating and returning the child. |
| • | When a financial services firm experiences disruptions in service, clients can be promptly notified and audit confirmations can be provided to document delivery. |
Our customer base has grown from 867 customers at the end of 2011 to more than 3,000 customers as of
July 31, 2016. As of July 31, 2016, our customers were based in 25 countries and included eight of the 10 largest U.S. cities, seven of the 10 largest U.S.-based investment banks, 24 of the 25 busiest North American airports, six of the 10 largest global auto makers, all four of the largest global accounting firms and four of the 10 largest U.S.-based health care providers. We generated revenue of $23.4 million in 2012, $30.0 million in 2013, $42.4 million in 2014 and $58.7 million in 2015, representing year-over-year increases of 29% in 2013, 41% in 2014 and 38% in 2015. We generated revenue of $27.3 million and $35.6 million in the six months ended June 30, 2015 and 2016, respectively, representing a period-over-period increase of 30%. We derive substantially all of our revenue from subscriptions to our critical communications applications, which represented 96%, 97% and 95% of our total revenue in 2013, 2014 and 2015, respectively. Historically, we derived more than 90% of our revenue in each of the last three fiscal years from sales of our Mass Notification application. We had net losses of $5.1 million, $0.9 million, $0.6 million and $10.8 million in 2012, 2013, 2014 and 2015, respectively. We had net losses of $3.2 million and $6.0 million for the six months ended June 30, 2015 and 2016, respectively. Our adjusted EBITDA, which is a measure that is not calculated and presented in accordance with generally accepted accounting principles in the United States, or GAAP, decreased from $2.2 million to $(3.4) million from 2013 to 2015 and was $(0.3) million and $(0.7) million for the six months ended June 30, 2015 and 2016, respectively. See note 2 to the table contained in “Summary Consolidated Financial and Other Data—Key Metrics” for a reconciliation of adjusted EBITDA to net loss, the most directly comparable financial measure calculated and presented in accordance with GAAP.
Industry Background
Over the past two decades, methods to assess critical events and to automate and accelerate the process of using critical communications, have evolved rapidly, in tandem with advances in technology, to include system-generated voice calls, text messages, emails, social media and outdoor digital signage. In critical situations, the speed at which information is transmitted and accessed is essential.
Key Trends Driving a Fundamental Shift in Communications
Governmental entities and enterprises face increasing threats to the safety of their geographically disparate and constantly mobile residents and employees. According to the Global Terrorism Database, the number of global
3
Table of Contents
fatalities and injuries from terrorist acts has increased 400% from 2005 to 2015, and in recent months the world has witnessed devastating attacks in Paris, Brussels, Nice, San Bernardino, Istanbul and other global cities. In addition, according to the Third National Climate Assessment prepared by the U.S. Global Change Research Program, the United States has been experiencing severe weather events above long-term averages, with, for example, the number of heat waves in 2011 and 2012 at nearly triple the long-term average. Similarly, a PricewaterhouseCoopers study found that the number of cyber security incidents across all industries rose by 38% in 2015 versus the prior year, which was the biggest increase in the 12 years since the study was first published. Taken together, global reinsurer Swiss Reinsurance Company Ltd. found that the cost of disaster events, including man-made and severe weather incidents, reached $85 billion worldwide in 2015.
At the same time, key business and technology trends continue to shift both the fundamental way that organizations communicate with relevant stakeholders and how individuals regularly consume information. People increasingly consume most of their information through mobile devices and applications as well as through social media and other digital channels. Increasingly, less information is shared using traditional “analog” communication methods, such as printed media, television and landline telephones. The proliferation of mobile and digital communications has accelerated the speed at which people communicate and, together with the emergence of the IoT, has exponentially increased the volume of communications that individuals must process. In light of these trends, communications have become one of the most important areas of technology investment. In a 2015 report, Gartner, Inc. estimates that $1.5 trillion, or 42.5%, of information technology, or IT, expenditure was for communications in 2015.
During public safety threats and critical business events, the ability to communicate life-saving or damage-mitigating information is crucial. Speed, security, scalability and reliability of communications are essential. The severity, complexity and frequency of these critical events, their implications for personal safety or business performance and rising regulatory and compliance challenges are driving demand for critical communications solutions, which we estimate, based on data from Frost & Sullivan, presented in an independent study commissioned by us, and data from Markets and Markets, represented a $15.6 billion worldwide market opportunity in 2015.
Evolution of Critical Communications Solutions
Traditional solutions for critical communications have not kept pace with the increasingly digital world, the evolving threat landscape and opportunity to leverage technological innovation to more effectively communicate with people. These solutions are often developed in-house or are not truly enterprise in scale and reliability, leaving many organizations to use analog, manual, one-way and people-based modalities to communicate with relevant stakeholders. These solutions lack the scale to reliably address the breadth of challenges that organizations increasingly face, the sophistication required to address evolving needs with aggregated data and analysis for threat assessment, automated workflows and the ability to rapidly deliver messages that are tailored to multiple, specific audiences, in precise locations, using a variety of different communication modalities.
Organizations today require a solution that is engineered for modern critical communications. While traditional mass notification solutions are designed to support infrequent one-way messages, new targeted and contextually relevant critical communications systems must be deployed to deliver interactive support for a far broader range of incidents, both operational and emergency-oriented in nature. Global threats have increased in complexity—from the failure of data centers to more sophisticated cyber incidents and terrorist threats. At the same time, more routine, everyday situations such as those involving IT operations, incident response teams or colleagues that need to converse securely also require a solution that can quickly and contextually reach anyone on any device, anywhere, at any time. As a result of these dynamics, it has become imperative that communications be appropriately contextualized, meaningful and actionable in order to overcome the profound information overload and enable the desired outcomes in critical situations to be achieved.
4
Table of Contents
Requirements of Effective Critical Communications Solutions
In order to deliver effective critical communications solutions, several requirements must be met:
| • | Comprehensive Solution. Organizations require an enterprise-scale, comprehensive solution that can provide them with aggregated data and automated workflows and deliver intelligent, contextual messages across multiple communications modalities – all operated from desktop or mobile devices to address their diverse critical communications needs. |
| • | Scalability and Speed. Organizations require a solution that is agile and flexible enough to reach individuals at both high volume/low frequency intervals, such as emergency mass notification situations, and low volume/high frequency intervals, such as for IT alerting and secure messaging. |
| • | Enterprise-Grade Reliability. Given the inherent nature of critical communications, organizations require a solution that is robust, resilient and highly redundant, with a high level of assured uptime and a low degree of fault tolerance. |
| • | Situational Assessment. Organizations require ready access to information from weather feeds, threat sources and IT monitoring systems, as well as the ability to incorporate trends from social media and feedback from their personnel in the field, in order to assess critical events and impacted areas. |
| • | Dynamic Location Capability. With today’s mobile workforce, organizations need to be able to notify and organize people based on where they actually are, not just based on their static office or home location. |
| • | Security and Regulatory Compliance. Organizations require a solution that is architected to ensure secure communications given the significance of the content being distributed and the regulatory requirements that apply to the sensitive data being transmitted. |
| • | Intelligent Communication and Contextual Personalization. Organizations require sophisticated, intelligent technology that can tailor both the content of communications and the modalities through which they are delivered based on differing individual preferences and roles and responsibilities within the organization. |
| • | Ease-of-Use. Given the need for speed and the pressure and anxiety most people experience in critical situations, organizations require a solution that is simple and easy-to-use, particularly when lives and property are at risk. |
| • | Real-Time and After-Event Reporting and Analytics. To ensure that organizations can deliver appropriate communications during critical events, a solution should provide detailed, timely and compliant reporting and analytics to optimize the overall communication process. |
| • | Global Reach and Local Expertise. Global communications require a “local” approach to deal with the complexity of varying cultural preferences, languages and device types, as well as technical and regulatory requirements. |
Key Benefits of Our Solutions and Competitive Strengths
Everbridge was founded with a vision to help organizations communicate quickly and reliably to deliver the right message to the right people, on the right device, in the right location, at the right time during public safety threats and critical business events. Key benefits of our solutions and competitive strengths include the following:
| • | Comprehensive, Enterprise-Scale Platform. The core of our solutions is our critical communications platform, which provides multiple layers of redundancy to assure uptime and delivery of |
5
Table of Contents
| communications regardless of volume or throughput requirements. The platform is secure, scalable and reliable, enabling the delivery and verification of tens of millions of different communications virtually anywhere, in any volume, in near real-time. In 2015, we delivered 1.1 billion communications, or over 30 communications per second, through our globally distributed data centers. |
| • | Out-of-the-Box, Scalable and Mobile Applications. Our SaaS-based applications are out-of-the box, enterprise-ready and can be utilized without customer development, testing or ongoing maintenance. Regardless of a customer or prospect’s size or needs, our applications are built to scale to its largest and most complex critical communications requirements. |
| • | Aggregated Threat Data and Analysis. Our software gathers and analyzes information from weather data feeds, public safety and threat data feeds, social media, IT ticketing systems and monitoring systems, as well as inputs and feedback from two-way and polling messages. Data can be geo-mapped and threat and incident data can be used to automatically trigger simple or complex workflows that are tied to standard operating procedures or run-books. |
| • | Contextual Communications. We enable intelligence and personalization in the critical communications process by delivering contextual communications. Our customers can deliver and escalate critical communications broadly to a mass population or to a targeted subset of individuals based on geographic location, skill level, role and communication modality preferences for rich, two-way collaboration. |
| • | Dynamic Location Awareness. Our platform can provide organizations with the ability to send and receive notifications based on the last known locations of people, not just based on a static office or home address. Our platform integrates with a variety of sources of location information, including building access control systems and corporate network access solutions. This location-specific approach enables organizations to quickly determine which individuals may be affected by a public safety threat or able to respond to a critical business event, and to provide targeted and relevant instructions and two-way communications. |
| • | Large, Dynamic and Rich Communications Data Asset. As of July 31, 2016, our data asset consists of our contacts databases that manage approximately 100 million contact profiles and connections from more than 3,000 customers based in 25 countries. Our contacts databases, which we refer to as contact stores, are initially created through an upload of contacts from the customer and automatically updated with the most current contact information provided by the customer or by individuals who opt-in to receive notifications from our Community Engagement application. Our contact stores are repositories for all contact details, attributes and business rules and preferences, such as a person’s last-known location, language spoken, special needs, technical certifications and on-call status. |
| • | Robust Security, Industry Certification and Compliance. Our platform is built on a secure and resilient infrastructure with multiple layers of redundancy. Many of our enterprise applications are designed to meet rigorous security and compliance requirements for financial services firms, healthcare institutions, the U.S. federal government and other regulated industries, including facilitating compliance with FINRA and HIPAA standards. Our solutions received designation under the Support Anti-terrorism by Fostering Effective Technology Act of 2002, or SAFETY ACT, and certification by U.S. Department of Homeland Security that places us on the approved product list for homeland security. Our solutions are also accredited under the Federal Information Security Management Act of 2002, or FISMA, and we are in the process of seeking accreditation under the Federal Risk and Authorization Management Program, or FedRAMP, which we expect to receive during 2017. |
| • | Automated Workflows. Our platform automates the workflows required to complete a critical notification, including establishing the individuals within an organization authorized to send messages, the groups of stakeholders to whom messages will be sent and the content of messages to be sent to |
6
Table of Contents
| different groups of relevant stakeholders, in each case based on incident type. We believe that this automation reduces the amount of time required to send critical notification as well as the associated cost. Our platform also enables customers to automatically establish procedures for improving the success of communication efforts. |
| • | Globally Local. Our platform is designed to be utilized globally while accounting for local cultural, linguistic, regulatory and technological differences. We have relationships with suppliers and carriers in multiple countries to ensure delivery in compliance with local, technical and regulatory requirements. We have localized our user interface in 15 languages and dialects that are spoken by more than 60% of the world’s population. |
| • | Next-Generation, Open Architecture. We developed our platform to easily integrate our applications with other systems. Our solutions provide open APIs and configurable integrations, enabling our platform to work with our customers’ and partners’ pre-existing processes and solutions, increasing the business value we deliver. |
| • | Actionable Reporting and Analytics. Our platform provides real-time dashboards, advanced map-based visualization and ad-hoc reporting across notifications, incidents and contacts. This information is easily accessed for required after-event reviews, continuous communication process improvements and regulatory compliance. |
Our Growth Strategy
We intend to drive growth in our business by building on our position as a global provider of critical communications and enterprise safety applications. Key elements of our growth strategy include:
| • | Accelerate Our Acquisition of New Customers. We believe that we are in the early stages of penetration of the large and growing market for targeted and contextually relevant critical communications. We intend to capitalize on our growing portfolio of applications and the technological advantages of our critical communications platform to continue to attract new customers. In parallel, we plan to attract new customers by investing in sales and marketing and expanding our channel partner relationships. |
| • | Further Penetrate Our Existing Customers. With revenue retention rates of over 110% for each of the last three years, we believe that there is a significant opportunity within our existing customer base to expand their use of our platform, both by selling new applications and features to our existing customers new applications and features and selling to additional departments in their organizations. We believe that we have a significant opportunity to increase the lifetime value of our customer relationships as we educate customers about the benefits of our current and future applications that they do not already utilize. In the last three years we have added five new applications, which have already begun to experience significant growth. These new applications have grown from 6% in the first quarter of 2015 to 25% in the second quarter of 2016 of our contracted sales, which represent the total dollar value of new agreements entered into within the period, exclusive of renewals. |
| • | Develop New Applications to Target New Markets and Use Cases. Our platform is highly flexible and can support the development of new applications to meet evolving safety and operational challenges. For example, our Safety Connection application enables organizations to send notifications based on the dynamic last known location of an individual, while actively incorporating threat and other data to allow for targeted and relevant communications. While the historic market for corporate security and safety solutions has been focused on establishing perimeters – locks, alarms and guards – to keep threats to employees outside of the physical premises, our solutions are responsive to the dramatic shift towards |
7
Table of Contents
| an increasingly mobile workforce where employees spend less time in traditional offices. At the same time, protection of employees at traditional places of business remains crucial. Market research completed in 2016 by us together with Emergency Management & Safety Solutions, found that while organizations were very concerned about the risk of workplace violence, 79% said they were at best only somewhat prepared for an active shooter event, and communicating with people in an impacted building was seen as the biggest challenge. In light of these dynamics, we intend to continue to develop new applications for use cases in a variety of new markets and to leverage our platform and our existing customer relationships as a source of new applications, industry use cases, features and solutions. |
| • | Expand Our International Footprint. We intend to continue to expand our local presence in regions such as Europe, the Middle East and Asia to leverage our relationships with local carriers and our ability to deliver messages to over 200 countries and territories in 15 languages and dialects as well as expand our channel partnerships, in order to capitalize on this significant opportunity and also to opportunistically consider expanding in other regions. |
| • | Maintain Our Technology and Thought Leadership. We will continue to invest in our core aggregation, assessment and critical communications platform and our applications to maintain our technology leadership position. For example, we believe that we provide the first solution to offer dynamic versus static location awareness integrated with analysis and communications for the employee safety and security marketplace, and plan to continue disrupting the existing physical safety and security solution model. Further, we believe we have a competitive advantage through our commitment to innovation and thought leadership that has enabled us to take market share from our competitors and accelerate our growth. |
| • | Opportunistically Pursue Acquisitions. We plan to selectively pursue acquisitions of complementary businesses, technologies and teams that allow us to penetrate new markets and add features and functionalities to our platform. |
Selected Risks Affecting Our Business
Our business is subject to numerous risks and uncertainties, including those highlighted in the section titled “Risk Factors” immediately following this prospectus summary. These risks include, among others, the following:
| • | If our business does not grow as we expect or if we fail to manage our growth effectively, our operating results and business prospects would suffer. |
| • | We have not been profitable on a consistent basis historically and may not achieve or maintain profitability in the future. |
| • | Historically, we derived 95%, 96%, 91%, 92% and 88% of our revenue from sales of our Mass Notification application in 2013, 2014, 2015 and the six months ended June 30, 2015 and 2016, respectively. If we are unable to renew or increase sales of this application, or if we are unable to increase sales of our other applications, our business and operating results could be adversely affected. |
| • | If we are unable to develop upgrades to our platform, develop new applications, sell our platform and applications into new markets or further penetrate our existing market, our revenue may not grow. |
| • | The nature of our business exposes us to inherent liability risks. |
| • | Our estimates of market opportunity and forecasts of market growth may prove to be inaccurate, and even if the market in which we compete achieves the forecasted growth, our business could fail to grow at similar rates, if at all. |
8
Table of Contents
| • | The markets in which we participate are competitive, and if we do not compete effectively, our operating results could be harmed. |
| • | An assertion by a third party that we are infringing its intellectual property could subject us to costly and time-consuming litigation or expensive licenses that could harm our business and results of operations. |
| • | Our executive officers, directors and principal stockholders own a significant percentage of our stock and will be able to exert significant control over matters subject to stockholder approval. Following this offering, our directors, executive officers and holders of more than 5% of our common stock, all of whom are represented on our board of directors, together with their affiliates will beneficially own % of the voting power of our outstanding capital stock. |
Corporate Information
Everbridge, Inc. was initially incorporated under the laws of the State of Delaware under the name 3n Global, Inc. in January 2008. 3n Global, Inc. was initially a wholly-owned subsidiary of National Notification Network, LLC, which was formed in November 2002 as a limited liability company organized under the laws of the State of California. In May 2008, pursuant to a merger agreement between 3n Global, Inc. and National Notification Network, LLC, National Notification Network, LLC merged with and into 3n Global, Inc. We changed our name to Everbridge, Inc. in April 2009.
Our principal executive offices are located at 25 Corporate Drive, Suite 400, Burlington, Massachusetts 01803 and at 155 North Lake Avenue, Suite 900, Pasadena, California 91101. Our telephone number is (818) 230-9700. Our website address is www.everbridge.com. The information contained on, or that can be accessed through, our website is not incorporated by reference into this prospectus, and you should not consider any information contained on, or that can be accessed through, our website as part of this prospectus or in deciding whether to purchase our common stock.
“Everbridge”, the Everbridge logo, and other trademarks or service marks of Everbridge, Inc. appearing in this prospectus are the property of Everbridge, Inc. This prospectus contains additional trade names, trademarks and service marks of others, which are the property of their respective owners. Solely for convenience, trademarks and trade names referred to in this prospectus may appear without the ® or TM symbols.
Implications of Being an Emerging Growth Company
We qualify as an “emerging growth company” as defined in the Jumpstart Our Business Startups Act of 2012, or the JOBS Act. An emerging growth company may take advantage of specified reduced reporting and other burdens that are otherwise applicable generally to public companies. These provisions include:
| • | a requirement to have only two years of audited financial statements and only two years of related selected financial data and management’s discussion and analysis of financial condition and results of operations disclosure; |
| • | an exemption from the auditor attestation requirement in the assessment of our internal control over financial reporting pursuant to the Sarbanes-Oxley Act of 2002, or the Sarbanes-Oxley Act; |
| • | an exemption from new or revised financial accounting standards until they would apply to private companies and from compliance with any new requirements adopted by the Public Company Accounting Oversight Board requiring mandatory audit firm rotation; |
| • | reduced disclosure about the emerging growth company’s executive compensation arrangements; and |
| • | no requirement to seek nonbinding advisory votes on executive compensation or golden parachute arrangements. |
9
Table of Contents
We may take advantage of some or all these provisions until we are no longer an emerging growth company. We will remain an emerging growth company until the earlier to occur of (1) the last day of the fiscal year (a) following the fifth anniversary of the completion of this offering, (b) in which we have total annual gross revenues of at least $1.0 billion or (c) in which we are deemed to be a “large accelerated filer,” under the rules of the U.S. Securities and Exchange Commission, or SEC, which means the market value of our common stock that is held by non-affiliates exceeds $700 million as of the prior June 30th, and (2) the date on which we have issued more than $1.0 billion in non-convertible debt during the prior three-year period.
We are choosing to “opt out” of the provision of the JOBS Act that permits emerging growth companies to take advantage of an extended transition period to comply with new or revised accounting standards applicable to public companies and, as a result, we will comply with new or revised accounting standards as required when they are adopted. This decision to opt out of the extended transition period is irrevocable.
We have elected to adopt certain of the reduced disclosure requirements available to emerging growth companies. As a result of these elections, the information that we provide in this prospectus may be different than the information you may receive from other public companies in which you hold equity interests. In addition, it is possible that some investors will find our common stock less attractive as a result of these elections, which may result in a less active trading market for our common stock and higher volatility in our stock price.
10
Table of Contents
The Offering
| Common stock offered by Everbridge | shares | |||
| Common stock offered by the selling stockholders | shares | |||
| Total common stock offered | shares | |||
| Total common stock to be outstanding after this offering | shares | |||
| Over-allotment option offered by the selling stockholders | shares | |||
| Use of proceeds | We estimate that we will receive net proceeds of approximately $ million, assuming an initial public offering price of $ per share, the midpoint of the price range set forth on the cover page of this prospectus, after deducting the underwriting discounts and commissions and estimated offering expenses payable by us. The principal purposes of this offering are to increase our financial flexibility, create a public market for our common stock, and facilitate our future access to the capital markets. We expect to use the net proceeds of this offering for working capital and other general corporate purposes. We also intend to use approximately $6.5 million of the net proceeds to pay all outstanding principal and interest under our revolving line of credit with Western Alliance Bank. We may use a portion of the proceeds from this offering for acquisitions or strategic investments in complementary businesses or technologies, although we do not currently have any plans for any such acquisitions or investments. These expectations are subject to change. We will not receive any of the proceeds from the sale of shares to be offered by the selling stockholders. See “Use of Proceeds” for additional information. | |||
| Risk factors | See “Risk Factors” and the other information included in this prospectus for a discussion of factors you should carefully consider before deciding to invest in our common stock. | |||
| Proposed NASDAQ Global Market Symbol | “EVBG” | |||
The number of shares of our common stock that will be outstanding after this offering is based on 118,875,481 shares of common stock outstanding as of June 30, 2016, and excludes:
| • | 11,230,416 shares of common stock issuable upon the exercise of options outstanding as of June 30, 2016, at a weighted-average exercise price of $1.66 per share; |
| • | 749,712 shares of common stock issuable upon the exercise of warrants outstanding as of June 30, 2016, at an exercise price of $0.4335 per share, which warrants, prior to the completion of this offering, are exercisable to purchase shares of our Series A-1 preferred stock; |
11
Table of Contents
| • | shares of our common stock reserved for future issuance pursuant to our 2016 Equity Incentive Plan, which will become effective prior to the completion of this offering and will include provisions that automatically increase the number of shares of common stock reserved for issuance thereunder each year; and |
| • | shares of common stock reserved for future issuance under our 2016 Employee Stock Purchase Plan, which will become effective prior to the completion of this offering and will include provisions that automatically increase the number of shares of common stock reserved for issuance thereunder each year. |
Unless otherwise indicated, this prospectus reflects and assumes the following:
| • | the conversion of all of our outstanding shares of class A common stock into an aggregate of 6,694,854 shares of our common stock immediately prior to the closing of this offering; |
| • | the conversion of all of our outstanding shares of our preferred stock into an aggregate of 48,041,096 shares of our common stock immediately prior to the closing of this offering; |
| • | the filing and effectiveness of our amended and restated certificate of incorporation in Delaware and the adoption of our amended and restated bylaws, each of which will occur immediately prior to the completion of this offering; |
| • | no exercise of outstanding options or warrants after June 30, 2016; |
| • | no exercise by the underwriters of their over-allotment option to purchase additional shares of our common stock; and |
| • | a one-for- reverse stock split of our common stock to be effected prior to the closing of this offering. |
12
Table of Contents
Summary Consolidated Financial and Other Data
We derived the summary consolidated statements of operations data for the years ended December 31, 2013, 2014 and 2015 from our audited consolidated financial statements included elsewhere in this prospectus. We derived the summary consolidated statements of operations data for the six months ended June 30, 2015 and 2016 and the summary consolidated balance sheet data as of June 30, 2016 from our unaudited financial statements included elsewhere in this prospectus. We have prepared the unaudited financial statements on the same basis as the audited financial statements, and the unaudited financial data include, in our opinion, all adjustments, consisting only of normal recurring adjustments, that we consider necessary for a fair presentation of our financial position and results of operations for these periods. Our historical results are not necessarily indicative of the results to be expected in the future and our operating results for the six months ended June 30, 2016 are not necessarily indicative of the results that may be expected for the year ending December 31, 2016.
When you read this summary consolidated financial data, it is important that you read it together with the historical consolidated financial statements and related notes to those statements, as well as “Selected Consolidated Financial Data” and “Management’s Discussion and Analysis of Financial Condition and Results of Operations,” included elsewhere in this prospectus.
| Year Ended December 31, | Six Months Ended June 30, |
|||||||||||||||||||
| 2013 | 2014 | 2015 | 2015 | 2016 | ||||||||||||||||
| (in thousands, except share and per share data) |
||||||||||||||||||||
| (unaudited) | ||||||||||||||||||||
| Consolidated Statements of Operations Data: |
||||||||||||||||||||
| Revenue |
$ | 30,040 | $ | 42,421 | $ | 58,720 | $ | 27,313 | $ | 35,634 | ||||||||||
| Cost of revenue:(1) |
8,699 | 12,089 | 19,789 | 9,045 | 11,151 | |||||||||||||||
|
|
|
|
|
|
|
|
|
|
|
|||||||||||
| Gross profit |
21,341 | 30,332 | 38,931 | 18,268 | 24,483 | |||||||||||||||
|
|
|
|
|
|
|
|
|
|
|
|||||||||||
| Operating expenses: (1) |
||||||||||||||||||||
| Sales and marketing |
11,695 | 15,818 | 25,925 | 11,337 | 17,054 | |||||||||||||||
| Research and development |
5,697 | 7,365 | 11,521 | 5,469 | 6,643 | |||||||||||||||
| General and administrative |
4,352 | 7,435 | 12,272 | 4,578 | 6,586 | |||||||||||||||
|
|
|
|
|
|
|
|
|
|
|
|||||||||||
| Total operating expenses |
21,744 | 30,618 | 49,718 | 21,384 | 30,283 | |||||||||||||||
|
|
|
|
|
|
|
|
|
|
|
|||||||||||
| Operating loss |
(403 | ) | (286 | ) | (10,787 | ) | (3,116 | ) | (5,800 | ) | ||||||||||
| Other expense, net |
368 | 426 | 599 | 276 | 339 | |||||||||||||||
|
|
|
|
|
|
|
|
|
|
|
|||||||||||
| Loss before (provision for) benefit from income taxes | (771 | ) | (712 | ) | (11,386 | ) | (3,392 | ) | (6,139 | ) | ||||||||||
| (Provision for) benefit from income taxes |
(118 | ) | 89 | 562 | 188 | 110 | ||||||||||||||
|
|
|
|
|
|
|
|
|
|
|
|||||||||||
| Net loss |
$ | (889 | ) | $ | (623 | ) | $ | (10,824 | ) | $ | (3,204 | ) | $ | (6,029 | ) | |||||
|
|
|
|
|
|
|
|
|
|
|
|||||||||||
| Net loss attributable to common stockholders | $ | (889 | ) | $ | (623 | ) | $ | (10,824 | ) | $ | (3,204 | ) | $ | (6,029 | ) | |||||
|
|
|
|
|
|
|
|
|
|
|
|||||||||||
| Net loss per share attributable to common stockholders:(2) | ||||||||||||||||||||
| Basic |
$ | (0.01 | ) | $ | (0.01 | ) | $ | (0.15 | ) | $ | (0.05 | ) | $ | (0.09 | ) | |||||
|
|
|
|
|
|
|
|
|
|
|
|||||||||||
| Diluted |
$ | (0.01 | ) | $ | (0.01 | ) | $ | (0.15 | ) | $ | (0.05 | ) | $ | (0.09 | ) | |||||
|
|
|
|
|
|
|
|
|
|
|
|||||||||||
| Weighted-average common shares outstanding:(2) |
||||||||||||||||||||
| Basic |
63,484,370 | 67,788,061 | 70,482,217 | 70,463,457 | 70,652,785 | |||||||||||||||
| Diluted |
63,484,370 | 67,788,061 | 70,482,217 | 70,463,457 | 70,652,785 | |||||||||||||||
| Pro forma net loss per share attributable to common stockholders, basic and diluted (unaudited):(3) | $ | $ | ||||||||||||||||||
|
|
|
|
|
|||||||||||||||||
| Pro forma weighted average common shares outstanding, basic and diluted (unaudited):(3) | ||||||||||||||||||||
|
|
|
|
|
|||||||||||||||||
13
Table of Contents
| (1) | Includes stock-based compensation expense and depreciation and amortization expense as follows: |
| Year Ended December 31, |
Six Months Ended June 30, |
|||||||||||||||||||
| 2013 | 2014 | 2015 | 2015 | 2016 | ||||||||||||||||
| (in thousands) | (unaudited) | |||||||||||||||||||
| Stock-based compensation expense: |
||||||||||||||||||||
| Cost of revenue |
$ | 48 | $ | 82 | $ | 150 | $ | 57 | $ | 89 | ||||||||||
| Sales and marketing |
82 | 120 | 315 | 102 | 292 | |||||||||||||||
| Research and development |
28 | 147 | 297 | 134 | 176 | |||||||||||||||
| General and administrative |
18 | 27 | 760 | 65 | 849 | |||||||||||||||
|
|
|
|
|
|
|
|
|
|
|
|||||||||||
| Total stock-based compensation expense |
$ | 176 | $ | 376 | $ | 1,522 | 358 | 1,406 | ||||||||||||
|
|
|
|
|
|
|
|
|
|
|
|||||||||||
| Depreciation and amortization expense: |
||||||||||||||||||||
| Cost of revenue |
$ | 2,374 | $ | 1,615 | $ | 4,457 | $ | 1,826 | 2,982 | |||||||||||
| Sales and marketing |
46 | 101 | 227 | 76 | 115 | |||||||||||||||
| Research and development |
16 | 31 | 134 | 122 | 207 | |||||||||||||||
| General and administrative |
19 | 765 | 1,158 | 505 | 397 | |||||||||||||||
|
|
|
|
|
|
|
|
|
|
|
|||||||||||
| Total depreciation and amortization expense |
$ | 2,455 | $ | 2,512 | $ | 5,976 | $ |
2,529 |
|
3,701 | ||||||||||
|
|
|
|
|
|
|
|
|
|
|
|||||||||||
| (2) | See notes (2) and (13) to our consolidated financial statements appearing elsewhere in this prospectus for further details on the calculation of basic and diluted net loss per share attributable to common stockholders. |
| (3) | Pro forma basic and diluted net loss per share represents net loss divided by the pro forma weighted-average shares of common stock outstanding and reflects (1) the repayment of $ million of outstanding principal and accrued interest under our revolving line of credit from the proceeds from our sale of shares of common stock in this offering at an assumed initial public offering price of $ per share, the midpoint of the price range set forth on the cover page of this prospectus, after deducting underwriting discounts and commissions and (2) our write-off of the associated debt issuance costs. Pro forma weighted-average shares outstanding reflects the conversion of all outstanding shares of class A common stock and preferred stock (using the if-converted method) into common stock as though the conversion had occurred on the later of the first day of the relevant period and the date of issuance. |
| As of June 30, 2016 | ||||||||||||
| Actual | Pro forma(1) | Pro forma as adjusted(2)(3) |
||||||||||
| (in thousands) | ||||||||||||
| (unaudited) | ||||||||||||
| Consolidated Balance Sheet Data: |
||||||||||||
| Cash |
$ | 1,048 | $ | 1,048 | $ | |||||||
| Accounts receivable, net |
17,213 | 17,213 | ||||||||||
| Total assets |
48,892 | 48,892 | ||||||||||
| Total deferred revenue |
43,520 | 43,520 | ||||||||||
| Total debt |
15,462 | 15,462 | ||||||||||
| Total liabilities |
69,747 | 69,747 | ||||||||||
| Convertible preferred stock |
48 | — | ||||||||||
| Class A common stock |
7 | — | ||||||||||
| Common stock |
64 | 119 | ||||||||||
| Accumulated deficit |
(84,361 | ) | (84,361 | ) | ||||||||
| Total stockholders’ deficit |
(20,855 | ) | (20,855 | ) | ||||||||
(1) Pro forma consolidated balance sheet data reflects the automatic conversion of all outstanding shares of class A common stock and preferred stock into common stock immediately prior to the closing of this offering.
(2) Pro forma as adjusted consolidated balance sheet data reflects the pro forma items described immediately above plus (1) our sale of shares of common stock in this offering at an assumed initial public offering price of $ per share, the midpoint of the price range set forth on the cover page of this prospectus, after deducting underwriting discounts and commissions and estimated offering expenses payable by us, (2) repayment of principal and interest under our revolving line of credit and (3) our write-off of the associated debt issuance costs.
14
Table of Contents
(3) Pro forma as adjusted consolidated balance sheet data is illustrative only and will change based on the actual initial public offering price and other terms of this offering determined at pricing. Each $1.00 increase or decrease in the assumed initial public offering price of $ per share, the midpoint of the price range set forth on the cover page of this prospectus, would increase or decrease pro forma as adjusted cash, total assets and total stockholders’ (deficit) equity by approximately $ million, assuming that the number of shares offered by us, as set forth on the cover page of this prospectus, remains the same, and after deducting underwriting discounts and commissions payable by us. We may also increase or decrease the number of shares we are offering. A 1,000,000 share increase or decrease in the number of shares offered by us would increase or decrease pro forma as adjusted cash, total assets and total stockholders’ (deficit) equity by approximately $ million, at the assumed initial public offering price, and after deducting underwriting discounts and commissions payable by us.
Key Metrics
We regularly monitor a number of financial and operating metrics in order to measure our current performance and estimate our future performance. For a further description of how we use these financial and operating metrics, see “Management’s Discussion and Analysis of Financial Condition and Results of Operations—Key Metrics.”
| Year Ended December 31, |
Six Months Ended June 30, |
|||||||||||||||||||
| 2013 | 2014 | 2015 | 2015 | 2016 | ||||||||||||||||
| (dollars in thousands) | ||||||||||||||||||||
| Revenue retention rate(1) |
112 | % | 111 | % | 112 | % | 112 | % | |
116 |
% | |||||||||
| Adjusted EBITDA(2) |
$ | 2,152 | $ | 2,524 | $ | (3,351 | ) | $ | (261 | ) | $ | (721 | ) | |||||||
| Adjusted gross margin(3) |
$ | 21,412 | $ | 30,663 | $ | 41,084 | $ | 19,064 | $ | 25,757 | ||||||||||
| Free cash flow(4) |
$ | 2,548 | $ | 3,884 | $ | (2,953 | ) | $ | (1,009 | ) | $ | (5,077 | ) | |||||||
| (1) | We calculate our revenue retention rate by dividing (1) total revenue in the current 12-month period from those customers who were customers during the prior 12-month period by (2) total revenue from all customers in the prior 12-month period. For the purposes of calculating our revenue retention rate, we count as customers all entities with whom we had contracts in the applicable period other than (1) customers of our wholly-owned subsidiary, Microtech, which generates an immaterial amount of our revenue in any given year and (2) in the first year following our acquisition of another business, customers that we acquired in connection with such acquisition. We believe that our ability to retain our customers and expand their use of our solutions over time is an indicator of the stability of our revenue base and the long-term value of our customer relationships. Our revenue retention rate provides insight into the impact on current period revenue of the number of new customers acquired during the prior 12-month period, the timing of our implementation of those new customers, growth in the usage of our solutions by our existing customers and customer attrition. If our revenue retention rate for a period exceeds 100%, this means that the revenue retained during the period including upsells, more than offset the revenue that we lost from customers that did not renew their contracts during the period. |
| (2) | Adjusted EBITDA represents our net loss before interest income and interest expense, income tax expense and benefit, depreciation and amortization expense and stock-based compensation expense. We do not consider these items to be indicative of our core operating performance. The items that are non-cash include depreciation and amortization expense and stock-based compensation expense. Adjusted EBITDA is a key measure used by management to understand and evaluate our core operating performance and trends and to generate future operating plans, make strategic decisions regarding the allocation of capital and invest in initiatives that are focused on cultivating new markets for our solutions. In particular, the exclusion of certain expenses in calculating adjusted EBITDA facilitates comparisons of our operating performance on a period-to-period basis. Adjusted EBITDA is not a measure calculated in accordance with United States generally accepted accounting principles, or GAAP. |
15
Table of Contents
We believe that adjusted EBITDA provides useful information to investors and others in understanding and evaluating our operating results in the same manner as our management and board of directors. Nevertheless, use of adjusted EBITDA has limitations as an analytical tool, and you should not consider it in isolation or as a substitute for analysis of our financial results as reported under GAAP. Some of these limitations are: (1) although depreciation and amortization are non-cash charges, the capitalized software that is amortized will need to be replaced in the future, and adjusted EBITDA does not reflect cash capital expenditure requirements for such replacements or for new capital expenditure requirements; (2) adjusted EBITDA does not reflect changes in, or cash requirements for, our working capital needs; (3) adjusted EBITDA does not reflect the potentially dilutive impact of equity-based compensation; (4) adjusted EBITDA does not reflect tax payments or receipts that may represent a reduction or increase in cash available to us; and (5) other companies, including companies in our industry, may calculate adjusted EBITDA or similarly titled measures differently, which reduces the usefulness of the metric as a comparative measure. Because of these and other limitations, you should consider adjusted EBITDA alongside our other GAAP-based financial performance measures, net loss and our other GAAP financial results. The following table presents a reconciliation of adjusted EBITDA to net loss, the most directly comparable GAAP measure, for each of the periods indicated.
| Year Ended December 31, |
Six Months Ended June 30, |
|||||||||||||||||||
| 2013 | 2014 | 2015 | 2015 | 2016 | ||||||||||||||||
| (in thousands) | ||||||||||||||||||||
| (unaudited) | ||||||||||||||||||||
| Net loss |
$ | (889 | ) | $ | (623 | ) | $ | (10,824 | ) | $ | (3,204 | ) | $ | (6,029 | ) | |||||
| Interest expense, net |
292 | 348 | 537 | 244 | 311 | |||||||||||||||
| Provision for (benefit from) income taxes |
118 | (89 | ) | (562 | ) | (188) | (110 | ) | ||||||||||||
| Depreciation and amortization expense |
2,455 | 2,512 | 5,976 | 2,529 | 3,701 | |||||||||||||||
| Stock-based compensation expense |
176 | 376 | 1,522 | 358 | 1,406 | |||||||||||||||
|
|
|
|
|
|
|
|
|
|
|
|||||||||||
| Total net adjustments |
$ | 3,041 | $ | 3,147 | $ | 7,473 | $ | 2,943 | $ | 5,308 | ||||||||||
|
|
|
|
|
|
|
|
|
|
|
|||||||||||
| Adjusted EBITDA |
$ | 2,152 | $ | 2,524 | $ | (3,351 | ) | $ | (261 | ) | $ | (721 | ) | |||||||
| (3) | Adjusted gross margin represents gross profit plus stock-based compensation and amortization expenses related to acquisitions. Adjusted gross margin is a key measure used by management to understand and evaluate our core operating performance and trends and to generate future operating plans. The exclusion of stock-based compensation expense and amortization expenses related to acquisitions facilitates comparisons of our operating performance on a period-to-period basis. Adjusted gross margin is not a measure calculated in accordance with GAAP. We believe that adjusted gross margin provides useful information to investors and others in understanding and evaluating our operating results in the same manner as our management and board of directors. Nevertheless, our use of adjusted gross margin has limitations as an analytical tool, and you should not consider it in isolation or as a substitute for analysis of our financial results as reported under GAAP. You should consider adjusted gross margin alongside our other GAAP-based financial performance measures, gross profit and our other GAAP financial results. The following table presents a reconciliation of adjusted gross margin to gross profit, the most directly comparable GAAP measure, for each of the periods indicated. |
| Year Ended December 31, |
Six Months Ended June 30, |
|||||||||||||||||||
| 2013 | 2014 | 2015 | 2015 | 2016 | ||||||||||||||||
| (in thousands) | ||||||||||||||||||||
| (unaudited) | ||||||||||||||||||||
| Gross profit |
$ | 21,341 | $ | 30,332 | $ | 38,931 | $ | 18,268 | $ | 24,483 | ||||||||||
| Stock-based compensation expense |
48 | 82 | 150 | 57 | 89 | |||||||||||||||
| Amortization expense related to acquisitions |
23 | 249 | 2,003 | 739 | 1,185 | |||||||||||||||
|
|
|
|
|
|
|
|
|
|
|
|||||||||||
| Adjusted gross margin |
$ | 21,412 | $ | 30,663 | $ | 41,084 | $ | 19,064 | $ | 25,757 | ||||||||||
16
Table of Contents
| (4) | Free cash flow represents net cash provided by (used in) operating activities minus capital expenditures and capitalized software development costs. Free cash flow is a key measure used by management to understand and evaluate our core operating performance and trends and to generate future operating plans. The exclusion of capital expenditures and amounts capitalized for internally-developed software facilitates comparisons of our operating performance on a period-to-period basis and excludes items that we do not consider to be indicative of our core operating performance. Free cash flow is not a measure calculated in accordance with GAAP. We believe that free cash flow provides useful information to investors and others in understanding and evaluating our operating results in the same manner as our management and board of directors. Nevertheless, our use of free cash flow has limitations as an analytical tool, and you should not consider it in isolation or as a substitute for analysis of our financial results as reported under GAAP. You should consider free cash flow alongside our other GAAP-based financial performance measures, net cash provided by (used in) operating activities, and our other GAAP financial results. The following table presents a reconciliation of free cash flow to net cash for operating activities, the most directly comparable GAAP measure, for each of the periods indicated. |
| Year Ended December 31, |
Six Months Ended June 30, |
|||||||||||||||||||
| 2013 | 2014 | 2015 | 2015 | 2016 | ||||||||||||||||
| (in thousands) | (unaudited) | |||||||||||||||||||
| Net cash provided by (used in) operating activities |
$ | 3,998 | $ | 7,716 | $ | 4,451 | $ | 2,578 | $ | (1,691 | ) | |||||||||
| Capital expenditures |
(688 | ) | (2,155 | ) | (2,502 | ) | (1,327 | ) | (346 | ) | ||||||||||
| Capitalized software development costs |
(762 | ) | (1,677 | ) | (4,902 | ) | (2,260 | ) | (3,040 | ) | ||||||||||
|
|
|
|
|
|
|
|
|
|
|
|||||||||||
| Total net adjustments |
$ | (1,450 | ) | $ | (3,832 | ) | $ | (7,404 | ) | $ | (3,587 | ) | $ | (3,386 | ) | |||||
|
|
|
|
|
|
|
|
|
|
|
|||||||||||
| Free cash flow |
$ | 2,548 | $ | 3,884 | $ | (2,953 | ) | $ | (1,009 | ) | $ | (5,077 | ) | |||||||
17
Table of Contents
Investing in our common stock involves a high degree of risk. You should consider carefully the risks and uncertainties described below, together with all of the other information in this prospectus, including our consolidated financial statements and related notes, before deciding whether to purchase shares of our common stock. If any of the following risks is realized, our business, financial condition, results of operations and prospects could be materially and adversely affected. In that event, the price of our common stock could decline, and you could lose part or all of your investment.
Risks Related to Our Business and Our Industry
If our business does not grow as we expect, or if we fail to manage our growth effectively, our operating results and business prospects would suffer.
We increased our number of full-time employees from 189 to 303 to 418 as of December 31, 2013, 2014 and 2015, respectively, and to 430 as of June 30, 2016. From June 30, 2015 to June 30, 2016, we increased the headcount of our sales organization by 24%, and our revenue increased by $8.3 million for the six months ended June 30, 2016 compared to the six months ended June 30, 2015, due in part to the increase in our customer base.
However, our business may not continue to grow as quickly or at all in the future, which would adversely affect our revenue and business prospects. Our business growth depends on a number of factors including:
| • | our ability to execute upon our business plan effectively; |
| • | our ability to accelerate our acquisition of new customers; |
| • | our ability to further sell to our existing customers new applications and features and to additional departments in their organizations; |
| • | our ability to develop new applications to target new markets and use cases; |
| • | our ability to expand our international footprint; |
| • | the growth of the market in which we operate; |
| • | our ability to maintain our technology leadership position; and |
| • | our ability to acquire complementary business, technologies and teams we need. |
Further, our growth has placed, and will continue to place, a strain on our managerial, operational, financial and other resources, and our future operating results depend to a large extent on our ability to successfully manage our anticipated expansion and growth. To manage our growth successfully and handle the responsibilities of being a public company, we believe we must effectively, among other things:
| • | increase our customer base and upsell and cross-sell additional and new applications to our existing customers; |
| • | invest in sales and marketing and expand our channel partner relationships; |
| • | develop new applications that target new markets and use cases; |
| • | expand our international operations; and |
| • | improve our platform and applications, financial and operational systems, procedures and controls. |
18
Table of Contents
We intend to continue our investment in sales and marketing, our platform and applications, research and development, and general and administrative functions and other areas to grow our business. We are likely to recognize the costs associated with these investments earlier than some of the anticipated benefits and the return on these investments may be lower, or may develop more slowly, than we expect, which could adversely affect our operating results.
If we are unable to manage our growth effectively in a manner that preserves the key aspects of our corporate culture, we may not be able to take advantage of market opportunities or develop new applications or upgrades to our existing applications and we may fail to satisfy customer requirements, maintain the quality and security of our applications, execute on our business plan or respond to competitive pressures, which could result in our financial results suffering and a decline in our stock price.
We have not been profitable on a consistent basis historically and may not achieve or maintain profitability in the future.
We have posted a net loss in each year since inception, including net losses of $0.9 million, $0.6 million, $10.8 million and $6.0 million in the years ended December 31, 2013, 2014, 2015 and six months ended June 30, 2016, respectively. As of June 30, 2016, we had an accumulated deficit of $84.4 million. While we have experienced significant revenue growth in recent periods and profitability solely in the quarters ended March 31, 2014, June 30, 2014 and September 30, 2014, we are not certain whether or when we will obtain a high enough volume of sales of our applications to sustain or increase our growth or achieve or maintain profitability in the future. We also expect our costs to increase in future periods, which could negatively affect our future operating results if our revenue does not increase. In particular, we expect to continue to expend substantial financial and other resources on:
| • | sales and marketing, including a significant expansion of our sales organization, both domestically and internationally; |
| • | research and development related to our platform and applications, including investments in our research and development team; |
| • | continued international expansion of our business; and |
| • | general administration expenses, including legal and accounting expenses related to being a public company. |
These investments may not result in increased revenue or growth in our business. If we are unable to increase our revenue at a rate sufficient to offset the expected increase in our costs, our business, financial position and results of operations will be harmed, and we may not be able to achieve or maintain profitability over the long term. Additionally, we may encounter unforeseen operating expenses, difficulties, complications, delays and other unknown factors that may result in losses in future periods. If our revenue growth does not meet our expectations in future periods, our financial performance may be harmed, and we may not achieve or maintain profitability in the future.
To date, we have derived substantially all of our revenue from the sale of our Mass Notification application. If we are unable to renew or increase sales of this application, or if we are unable to increase sales of our other applications, our business and operating results could be adversely affected.
While we have recently introduced five new critical communications applications, one of which was introduced in the middle of 2014, three of which were introduced in 2015 and one of which was introduced in 2016, we derived 95%, 96%, 91%, 92% and 88% of our revenue from sales of our Mass Notification application in 2013, 2014, 2015 and the six months ended June 30, 2015 and 2016, respectively, and expect to continue to derive a substantial portion of our revenue from sales of this application in the near term. As a result, our operating results could suffer due to:
| • | any decline in demand for our Mass Notification application; |
| • | pricing or other competitive pressures from competing products; |
19
Table of Contents
| • | the introduction of applications and technologies that serve as a replacement or substitute for, or represent an improvement over, our Mass Notification application; |
| • | technological innovations or new standards that our Mass Notification application do not address; and |
| • | sensitivity to current or future prices offered by us or competing solutions. |
Because of our reliance on our Mass Notification application, our inability to renew or increase sales of this application or a decline in prices of this application would harm our business and operating results more seriously than if we derived significant revenue from a variety of applications. Any factor adversely affecting sales of our historical or new applications, including release cycles, market acceptance, competition, performance and reliability, reputation and economic and market conditions, could adversely affect our business and operating results.
If we are unable to develop upgrades to our platform, develop new applications, sell our platform and applications into new markets or further penetrate our existing market, our revenue may not grow.
Our ability to increase sales will depend in large part on our ability to enhance and improve our platform and applications, introduce new applications in a timely manner, develop new use cases for our platform and further penetrate our existing market. The success of any enhancement to our platform or new applications depends on several factors, including the timely completion, introduction and market acceptance of enhanced or new applications, the ability to maintain and develop relationships with channel partners and communications carriers, the ability to attract, retain and effectively train sales and marketing personnel and the effectiveness of our marketing programs. Any new application that we develop or acquire may not be introduced in a timely or cost-effective manner, and may not achieve the broad market acceptance necessary to generate significant revenue. Any new markets into which we attempt to sell our applications, including new vertical markets and new countries or regions, may not be receptive. Our ability to further penetrate our existing markets depends on the quality of our platform and applications and our ability to design our platform and applications to meet consumer demand. Any failure to enhance or improve our platform and applications as well as introduce new applications may adversely affect our revenue growth and operating results.
If we are unable to attract new customers or sell additional applications to our existing customers, our revenue and revenue growth will be harmed.
A part of our growth strategy is to add new customers and sell additional applications to our existing customers. Our ability to maintain existing customers, sell them new applications and to add new customers will depend in significant part on our ability to anticipate industry evolution, practices and standards and to continue to introduce and enhance the applications we offer on a timely basis to keep pace with technological developments. However, we may prove unsuccessful in developing new applications and improving existing applications. In addition, the success of any new application depends on several factors, including the timely completion, introduction and market acceptance of the application. Any new applications we develop or acquire might not be introduced in a timely or cost-effective manner and might not achieve the broad market acceptance necessary to generate significant revenue. If any of our competitors implements new technologies before we are able to implement them or better anticipates market opportunities, those competitors may be able to provide more effective or cheaper products than ours. As a result, we may be unable to renew our agreements with existing customers, attract new customers or grow or maintain our business from existing customers, which could harm our revenue and growth.
Failure to effectively develop and expand our sales and marketing capabilities could harm our ability to increase our customer base and achieve broader market acceptance of our platform and applications.
To increase total customers and achieve broader market acceptance of our platform and applications, we will need to expand our sales and marketing organization, including the vertical and geographic distribution of our salesforce and our teams of account executives focused on new accounts, account managers responsible for renewal and growth of existing accounts, and business development representatives targeting new and growth business opportunity creation. We will continue to dedicate significant resources to our global sales and
20
Table of Contents
marketing organizations. The effectiveness of our sales and marketing teams has varied over time and may vary in the future, and depends in part on our ability to maintain and improve our platform and applications. All of these efforts will require us to invest significant financial and other resources and we are unlikely to see the benefits, if any, of these increases until future periods after incurring these expenses. Our business will be seriously harmed if our efforts do not generate a correspondingly significant increase in revenue. We may not achieve revenue growth from expanding our salesforce if we are unable to hire, develop and retain talented sales personnel, if our new sales personnel are unable to achieve desired productivity levels in a reasonable period of time or if our sales and marketing programs are not effective.
The nature of our business exposes us to inherent liability risks.
Our applications, including our Mass Notification, Incident Management, IT Alerting, Safety Connection, Community Engagement, Secure Messaging and Internet of Things applications, are designed to communicate life-saving or damage-mitigating information to the right people, on the right device, in the right location, at the right time during public safety threats and critical business events. Due to the nature of such applications, we are potentially exposed to greater risks of liability for employee acts or omissions or system failures than may be inherent in other businesses. Although substantially all of our customer agreements contain provisions limiting our liability to our customers, we cannot assure you that these limitations will be enforced or the costs of any litigation related to actual or alleged omissions or failures would have a material adverse effect on us even if we prevail. Further, certain of our insurance policies and the laws of some states may limit or prohibit insurance coverage for punitive or certain other types of damages or liability arising from gross negligence and we cannot assure you that we are adequately insured against the risks that we face.
Because we generally recognize revenue ratably over the term of our contract with a customer, downturns or upturns in sales will not be fully reflected in our operating results until future periods.
Our revenue is primarily generated from subscriptions to our critical communications applications. Our customers do not have the right to take possession of our software platform and applications. Revenue from subscriptions, including additional fees for items such as incremental usage is recognized ratably over the subscription period beginning on the date that the subscription is made available to the customer. Our agreements with our customers typically range from one to three years. As a result, much of the revenue that we report in each quarter is attributable to agreements entered into during previous quarters. Consequently, a decline in sales, customer renewals or market acceptance of our applications in any one quarter would not necessarily be fully reflected in the revenue in that quarter, and would negatively affect our revenue and profitability in future quarters. This ratable revenue recognition also makes it difficult for us to rapidly increase our revenue through additional sales in any period, as revenue from new customers generally is recognized over the applicable agreement term.
We operate in an emerging and evolving market, which may develop more slowly or differently than we expect. If our market does not grow as we expect, or if we cannot expand our platform and applications to meet the demands of this market, our revenue may decline, fail to grow or fail to grow at an accelerated rate, and we may incur operating losses.
The market for targeted and contextually relevant critical communications is in an early stage of development, and it is uncertain whether this market will develop, and even if it does develop, how rapidly or how consistently it will develop or whether our platform and applications will be accepted into the markets in which we operate and plan to operate. Our success will depend to a substantial extent on the widespread adoption of our platform and applications as an alternative to historical mass notification systems. Some organizations may be reluctant or unwilling to use our platform and applications for a number of reasons, including concerns about additional costs, uncertainty regarding the reliability and security of cloud-based offerings or lack of awareness of the benefits of our platform and applications. Many organizations have invested substantial personnel and financial resources to integrate traditional on-premise applications into their businesses, and therefore may be reluctant or unwilling to migrate to cloud-based applications. Our ability to expand sales of our platform and applications into new markets depends on
21
Table of Contents
several factors, including the awareness of our platform and applications; the timely completion, introduction and market acceptance of enhancements to our platform and applications or new applications that we may introduce; our ability to attract, retain and effectively train sales and marketing personnel; our ability to develop relationships with channel partners and communication carriers; the effectiveness of our marketing programs; the costs of our platform and applications; and the success of our competitors. If we are unsuccessful in developing and marketing our platform and applications into new markets, or if organizations do not perceive or value the benefits of our platform and applications, the market for our platform and applications might not continue to develop or might develop more slowly than we expect, either of which would harm our revenue and growth prospects.
Our estimates of market opportunity and forecasts of market growth may prove to be inaccurate, and even if the market in which we compete achieves the forecasted growth, our business could fail to grow at similar rates, if at all.
Market opportunity estimates and growth forecasts are subject to significant uncertainty and are based on assumptions and estimates that may not prove to be accurate. Our estimates and forecasts relating to the size and expected growth of our addressable market may prove to be inaccurate. Even if the market in which we compete meets our size estimates and forecasted growth, our business could fail to grow at similar rates, if at all.
The markets in which we participate are competitive, and if we do not compete effectively, our operating results could be harmed.
The market for critical communications solutions is highly fragmented, competitive and constantly evolving. With the introduction of new technologies and market entrants, we expect that the competitive environment in which we compete will remain intense going forward. Some of our competitors have made or may make acquisitions or may enter into partnerships or other strategic relationships to provide a more comprehensive offering than they individually had offered or achieve greater economies of scale. In addition, new entrants not currently considered to be competitors may enter the market through acquisitions, partnerships or strategic relationships. We compete on the basis of a number of factors, including:
| • | application functionality, including local and multi-modal delivery in international markets; |
| • | breadth of offerings; |
| • | performance, security, scalability and reliability; |
| • | compliance with local regulations and multi-language support; |
| • | brand recognition, reputation and customer satisfaction; |
| • | ease of application implementation, use and maintenance; and |
| • | total cost of ownership. |
We face competition from in-house solutions, large integrated systems vendors and established and emerging cloud and SaaS and other software providers. Our competitors vary in size and in the breadth and scope of the products and services offered. Many of our competitors and potential competitors have greater name recognition, longer operating histories, more established customer relationships, larger marketing budgets and greater resources than we do. While some of our competitors provide a platform with applications to support one or more use cases, many others provide point-solutions that address a single use case. Further, other potential competitors not currently offering competitive applications may expand their offerings to compete with our solutions. Our competitors may be able to respond more quickly and effectively than we can to new or changing opportunities, technologies, standards and customer requirements. An existing competitor or new entrant could introduce new technology that reduces demand for our solutions. In addition to application and technology competition, we face pricing competition. Some of our competitors offer their applications or services at a lower price, which has resulted in pricing pressures. Some of our larger competitors have the operating flexibility to
22
Table of Contents
bundle competing applications and services with other offerings, including offering them at a lower price as part of a larger sale. For all of these reasons, we may not be able to compete successfully and competition could result in reduced sales, reduced margins, losses or the failure of our applications to achieve or maintain market acceptance, any of which could harm our business.
We may not be able to scale our business quickly enough to meet our customers’ growing needs and if we are not able to grow efficiently, our operating results could be harmed.
As usage of our platform and applications grows, we will need to continue making significant investments to develop and implement new applications, technologies, security features and cloud-based infrastructure operations. In addition, we will need to appropriately scale our internal business systems and our services organization, including customer support and professional services, to serve our growing customer base, particularly as our customer demographics change over time. Any failure of, or delay in, these efforts could impair the performance of our platform and applications and reduce customer satisfaction. Even if we are able to upgrade our systems and expand our staff, any such expansion may be expensive and complex, requiring management’s time and attention. To the extent that we do not effectively scale our platform and operations to meet the growing needs of our customers, we may not be able to grow as quickly as we anticipate, our customers may reduce or cancel use of our applications and professional services, we may be unable to compete effectively and our business and operating results may be harmed.
Our quarterly results of operations may fluctuate, and if we fail to meet or exceed the expectations of investors or securities analysts, our stock price could decline.
Our quarterly revenue and results of operations have historically varied from period to period, and we expect that they will continue to do so as a result of a variety of factors, including many that are outside of our control. Our future revenue is difficult to predict. Our expense levels are relatively fixed in the short term and are based, in part, on our expectations as to future revenue. If revenue levels are below our expectations, we may incur higher losses and may never attain or maintain consistent profitability. Our operating results may be disproportionately affected by a reduction in revenue because a proportionately smaller amount of our expenses varies with our revenues. If our quarterly revenue or results of operations fall below the expectations of investors or securities analysts, the price of our common stock could decline substantially. Fluctuations in our results of operations may be due to a number of factors, including:
| • | fluctuations in demand for our platform and applications; |
| • | changes in our business or pricing policies in response to competitive pricing actions or otherwise; |
| • | the timing and success of introductions of new applications or upgrades to our platform; |
| • | the impact of acquisition transaction-related amortization expenses and other certain expenses on our gross profit; |
| • | competition, including entry into the industry by new competitors and new offerings by existing competitors; |
| • | changes in the business or pricing policies of our competitors; |
| • | the amount and timing of expenditures, including those related to expanding our operations, increasing research and development, enhancing our platform, introducing new applications or growing our sales and marketing teams; |
| • | our ability to effectively manage growth within existing and new markets, both domestically and internationally; |
| • | changes in the payment terms for our applications; |
23
Table of Contents
| • | our ability to successfully manage any future acquisitions of businesses or technologies; |
| • | the strength of regional, national and global economies; and |
| • | the impact of natural disasters or man-made problems such as cyber incidents and terrorism. |
Due to the foregoing factors and the other risks discussed in this prospectus, you should not rely on quarter-to-quarter comparisons of our results of operations as an indication of our future performance nor should you consider our recent revenue growth or results in any single period to be indicative of our future performance.
Interruptions or delays in service from our third-party data center providers could impair our ability to make our platform and applications available to our customers, resulting in customer dissatisfaction, damage to our reputation, loss of customers, limited growth and reduction in revenue.
We currently serve part of our platform functions from third-party data center hosting facilities operated by Century Link and located in the Los Angeles, California and Denver, Colorado areas. In addition, we serve ancillary functions for our customers from third-party data center hosting facilities operated by Interoute located in the United Kingdom, Germany and the Netherlands, and by Elastichost in Toronto, Canada. We also rely on Amazon Web Services located in California and Virginia to host certain of our platform functions and applications. Our operations depend, in part, on our third-party facility providers’ abilities to protect these facilities against damage or interruption from natural disasters, power or telecommunications failures, cyber incidents, criminal acts and similar events. In the event that any of our third-party facilities arrangements is terminated, or if there is a lapse of service or damage to a facility, we could experience interruptions in our platform as well as delays and additional expenses in arranging new facilities and services. Any changes in third-party service levels at our data centers or any errors, defects, disruptions, cyber incidents or other performance problems with our solutions could harm our reputation.
Any damage to, or failure of, the systems of our third-party providers could result in interruptions to our platform. Despite precautions taken at our data centers, the occurrence of spikes in usage volume, natural disasters, cyber incidents, acts of terrorism, vandalism or sabotage, closure of a facility without adequate notice or other unanticipated problems could result in lengthy interruptions in the availability of our platform and applications. Problems faced by our third-party data center locations, with the telecommunications network providers with whom they contract, or with the systems by which our telecommunications providers allocate capacity among their customers, including us, could adversely affect the experience of our customers. Because of the nature of the services that we provide to our customers during public safety threats and critical business events, any such interruption may arise when our customers are most reliant on our applications, thereby compounding the impact of any interruption on our business. Interruptions in our services might reduce our revenue, cause us to issue refunds to customers and subject us to potential liability.
Further, our insurance policies may not adequately compensate us for any losses that we may incur in the event of damage or interruption. Although we benefit from liability protection under the Support Anti-Terrorism by Fostering Effective Technology Act of 2002, the occurrence of any of the foregoing could reduce our revenue, still subject us to liability, cause us to issue credits to customers or cause customers not to renew their subscriptions for our applications, any of which could materially adversely affect our business.
Failures or reduced accessibility of third-party software on which we rely could impair the availability of our platform and applications and adversely affect our business.
We license software from third parties for integration into our platform and applications, including open source software. These licenses might not continue to be available to us on acceptable terms, or at all. While we are not substantially dependent upon any third-party software, the loss of the right to use all or a significant portion of our third-party software required for the development, maintenance and delivery of our applications could result in delays in the provision of our applications until we develop or identify, obtain and integrate equivalent technology, which could harm our business.
24
Table of Contents
Any errors or defects in the hardware or software we use could result in errors, interruptions, cyber incidents or a failure of our applications. Any significant interruption in the availability of all or a significant portion of such software could have an adverse impact on our business unless and until we can replace the functionality provided by these applications at a similar cost. Furthermore, this software may not be available on commercially reasonable terms, or at all. The loss of the right to use all or a significant portion of this software could limit access to our platform and applications. Additionally, we rely upon third parties’ abilities to enhance their current applications, develop new applications on a timely and cost-effective basis and respond to emerging industry standards and other technological changes. We may be unable to effect changes to such third-party technologies, which may prevent us from rapidly responding to evolving customer requirements. We also may be unable to replace the functionality provided by the third-party software currently offered in conjunction with our applications in the event that such software becomes obsolete or incompatible with future versions of our platform and applications or is otherwise not adequately maintained or updated.
If we do not or cannot maintain the compatibility of our platform with third-party applications that our customers use in their businesses, our revenue will decline.
As a significant percentage of our customers choose to integrate our solutions with certain capabilities provided by third-party providers, the functionality and popularity of our solutions depend, in part, on our ability to integrate our platform and applications with certain third-party systems. Third-party providers may change the features of their technologies, restrict our access to their applications or alter the terms governing use of their applications in an adverse manner. Such changes could functionally limit or terminate our ability to use these third-party technologies in conjunction with our platform and applications, which could negatively impact our solutions and harm our business. If we fail to integrate our solutions with new third-party applications that our customers use, we may not be able to offer the functionality that our customers need, which would negatively impact our ability to generate revenue and adversely impact our business.
Changes in the mix of sizes or types of businesses or government agencies that purchase our platform and applications purchased or used by our customers could affect our operating results.
We have sold and will continue to sell to enterprises of all sizes, municipal and regional governmental agencies, non-profit organizations, educational institutions and healthcare organizations. Sales to larger organizations may entail longer sales cycles and more significant selling efforts. Selling to small businesses may involve greater credit risk and uncertainty. Changes in the sizes or types of businesses that purchase our applications could cause our operating results to be adversely affected.
If our, our customers’ or our third-party providers’ security measures are compromised or unauthorized access to the data of our customers or their employees, customers or constituents is otherwise obtained, our platform may be perceived as not being secure, our customers may be harmed and may curtail or cease their use of our applications, our reputation may be damaged and we may incur significant liabilities.
Our operations involve the storage and transmission of data of our customers and their employees, customers and constituents, including personally identifiable information such as contact information and physical location. Security incidents, whether as a result of third-party action, employee or customer error, technology impairment or failure, malfeasance or criminal activity, could result in unauthorized access to, or loss or unauthorized disclosure of, this information, litigation, indemnity obligations and other possible liabilities, as well as negative publicity, which could damage our reputation, impair our sales and harm our customers and our business. Cyber incidents and malicious internet-based activity continue to increase generally, and providers of cloud-based services have been targeted. If third parties with whom we work, such as vendors or developers, violate applicable laws or our security policies, such violations may also put our customers’ information at risk and could in turn have an adverse effect on our business. We may be unable to anticipate or prevent techniques used to obtain unauthorized access or to sabotage systems because they change frequently and often are not detected until after an incident has occurred. As we increase our customer base and our brand becomes more widely known and recognized, third parties may increasingly seek to compromise our security controls or gain
25
Table of Contents
unauthorized access to our sensitive corporate information or customers’ data. Further, because of the nature of the services that we provide to our customers during public safety threats and critical business events, we may be a unique target for attacks.
Many governments have enacted laws requiring companies to notify individuals of data security incidents or unauthorized transfers involving certain types of personal data. In addition, some of our customers contractually require notification of any data security incident. Accordingly, security incidents experienced by our competitors, by our customers or by us may lead to public disclosures, which may lead to widespread negative publicity. Any security compromise in our industry, whether actual or perceived, could harm our reputation, erode customer confidence in the effectiveness of our security measures, negatively impact our ability to attract new customers, cause existing customers to elect not to renew their subscriptions or subject us to third-party lawsuits, regulatory fines or other action or liability, which could materially and adversely affect our business and operating results. Further, the costs of compliance with notification laws and contractual obligations may be significant and any requirement that we provide such notifications as a result of an actual or alleged compromise could have a material and adverse effect on our business.
While we maintain general liability insurance coverage and coverage for errors or omissions, we cannot assure you that such coverage would be adequate or would otherwise protect us from liabilities or damages with respect to claims alleging compromises of personal data or that such coverage will continue to be available on acceptable terms or at all.
If our applications fail to function in a manner that allows our customers to operate in compliance with regulations and/or industry standards, our revenue and operating results could be harmed.
Certain of our customers require applications that ensure secure communications given the nature of the content being distributed and associated applicable regulatory requirements. In particular, our healthcare customers rely on our applications to communicate in a manner that is designed to comply with the requirements of the Health Insurance Portability and Accountability Act of 1996, the 2009 Health Information Technology for Economic and Clinical Health Act, the Final Omnibus Rule of January 25, 2013, which are collectively referred to as HIPAA, and which impose privacy and data security standards that protect individually identifiable health information by limiting the uses and disclosures of individually identifiable health information and requiring that certain data security standards be implemented to protect this information. As a “business associate” to “covered entities” that are subject to HIPAA, we also have our own compliance obligations directly under HIPAA and pursuant to the business associate agreements that we are required to enter into with our customers that are HIPAA-covered entities.
Governments and industry organizations may also adopt new laws, regulations or requirements, or make changes to existing laws or regulations, that could impact the demand for, or value of, our applications. If we are unable to adapt our applications to changing legal and regulatory standards or other requirements in a timely manner, or if our applications fail to allow our customers to communicate in compliance with applicable laws and regulations, our customers may lose confidence in our applications and could switch to products offered by our competitors, or threaten or bring legal actions against us.
In addition, governmental and other customers may require our applications to comply with certain privacy, security or other certifications and standards. For instance, with regard to transfers of personal data, the EU-US Safe Harbor program, which provided a valid legal basis for transfers of personal data from Europe to the United States, was invalidated in October 2015, which has a significant impact on the transfer of data from the European Union to U.S. companies, including us. While we have other legally recognized mechanisms in place that we believe allow for the lawful transfer of EU customer and employee information to the United States, it is possible that these mechanisms may also be challenged or evolve to include new legal requirements that could have an impact on how we move this data. Recently, the United States and the European Union agreed in principle upon a new framework called the Privacy Shield as a potential replacement for the EU-US Safe Harbor, but it has not yet been finalized, published or interpreted. The Privacy Shield may add significant requirements that could impact our business and result in substantial expense, and changes to our operations, to implement, and it is unclear that it will be appropriate for us. If our applications are late in achieving or fail to achieve or maintain
26
Table of Contents
compliance with these certifications and standards, or our competitors achieve compliance with these certifications and standards, we may be disqualified from selling our applications to such customers, or may otherwise be at a competitive disadvantage, either of which would harm our business, results of operations and financial condition. If our policies and practices are, or are perceived to be, insufficient or if our customers have concerns regarding the transfer of data from the European Union to the United States, we could be subject to enforcement actions or investigations by EU Data Protection Authorities or lawsuits by private parties, and our business could be negatively impacted.
If we fail to offer high-quality customer support, our business and reputation may suffer.
We offer our customers implementation services and 24/7 support through our customer support centers as well as education, professional development and certification through Everbridge University as well as a range of consulting services. Consulting service offerings include onsite implementation packages, Certified Emergency Management professional operational reviews, dedicated client care representatives, custom web-based training, and development of client-specific communications materials to increase internal awareness of system value.
Providing this education, training and support requires that our personnel who manage our training resources or provide customer support have specific experience, knowledge and expertise, making it more difficult for us to hire qualified personnel and to scale up our support operations. The importance of high-quality customer support will increase as we expand our business and pursue new customers and larger organizations. We may be unable to respond quickly enough to accommodate short-term increases in customer demand for support services or scale our services if our business grows. We also may be unable to modify the format of our support services or change our pricing to compete with changes in support services provided by our competitors. Increased customer demand for these services, without corresponding revenue, could increase our costs and harm our operating results. If we do not help our customers use applications within our platform and provide effective ongoing support, our ability to sell additional applications to, or to retain, existing customers may suffer and our reputation with existing or potential customers may be harmed.
Our strategy includes pursuing acquisitions, and our potential inability to successfully integrate newly-acquired technologies, assets or businesses may harm our financial results. Future acquisitions of technologies, assets or businesses, which are paid for partially or entirely through the issuance of stock or stock rights, could dilute the ownership of our existing stockholders.
We have acquired businesses and technology in the past. For example, we acquired Vocal Limited in March 2014, the assets of Nixle, LLC in December 2014 and technology from Tapestry Telemed LLC in December 2014. We believe that part of our continued growth will be driven by acquisitions of other companies or their technologies, assets, businesses and teams. Any acquisitions we complete will give rise to risks, including:
| • | incurring higher than anticipated capital expenditures and operating expenses; |
| • | failing to assimilate the operations and personnel or failing to retain the key personnel of the acquired company or business; |
| • | failing to integrate the acquired technologies, or incurring significant expense to integrate acquired technologies, into our platform and applications; |
| • | disrupting our ongoing business; |
| • | diverting our management’s attention and other company resources; |
| • | failing to maintain uniform standards, controls and policies; |
| • | incurring significant accounting charges; |
| • | impairing relationships with our customers and employees; |
27
Table of Contents
| • | finding that the acquired technology, asset or business does not further our business strategy, that we overpaid for the technology, asset or business or that we may be required to write off acquired assets or investments partially or entirely; |
| • | failing to realize the expected synergies of the transaction; |
| • | being exposed to unforeseen liabilities and contingencies that were not identified prior to acquiring the company; and |
| • | being unable to generate sufficient revenue and profits from acquisitions to offset the associated acquisition costs. |
Fully integrating an acquired technology, asset or business into our operations may take a significant amount of time. We may not be successful in overcoming these risks or any other problems encountered with acquisitions. To the extent that we do not successfully avoid or overcome the risks or problems related to any such acquisitions, our results of operations and financial condition could be harmed. Acquisitions also could impact our financial position and capital requirements, or could cause fluctuations in our quarterly and annual results of operations. Acquisitions could include significant goodwill and intangible assets, which may result in future impairment charges that would reduce our stated earnings. We may incur significant costs in our efforts to engage in strategic transactions and these expenditures may not result in successful acquisitions.
We expect that the consideration we might pay for any future acquisitions of technologies, assets, businesses or teams could include stock, rights to purchase stock, cash or some combination of the foregoing. If we issue stock or rights to purchase stock in connection with future acquisitions, net income per share and then-existing holders of our common stock may experience dilution.
We rely on the performance of our senior management and highly skilled personnel, and if we are unable to attract, retain and motivate well-qualified employees, our business and results of operations could be harmed.
We believe our success has depended, and continues to depend, on the efforts and talents of senior management and key personnel, including Jaime Ellertson, our President, Chief Executive Officer and Chairman of our board of directors, Kenneth S. Goldman, our Senior Vice President and Chief Financial Officer, and Imad Mouline, our Senior Vice President and Chief Technology Officer. Our future success depends on our continuing ability to attract, develop, motivate and retain highly qualified and skilled employees. Qualified individuals are in high demand, and we may incur significant costs to attract them. In addition, the loss of any of our senior management or key personnel could interrupt our ability to execute our business plan, as such individuals may be difficult to replace. If we do not succeed in attracting well- qualified employees or retaining and motivating existing employees, our business and results of operations could be harmed.
Uncertain or weakened global economic conditions may adversely affect our industry, business and results of operations.
Our overall performance depends on domestic and worldwide economic conditions, which may remain challenging for the foreseeable future. Financial developments seemingly unrelated to us or to our industry may adversely affect us and our planned international expansion. The U.S. economy and other key international economies have been impacted by threatened sovereign defaults and ratings downgrades, falling demand for a variety of goods and services, restricted credit, threats to major multinational companies, poor liquidity, reduced corporate profitability, volatility in credit, equity and foreign exchange markets, bankruptcies and overall uncertainty. These conditions affect the rate of information technology spending and could adversely affect our customers’ ability or willingness to purchase our applications and services, delay prospective customers’ purchasing decisions, reduce the value or duration of their subscriptions or affect renewal rates, any of which could adversely affect our operating results. We cannot predict the timing, strength or duration of the economic recovery or any subsequent economic slowdown worldwide, in the United States, or in our industry.
28
Table of Contents
Any future litigation against us could be costly and time-consuming to defend.
We have in the past and may in the future become subject, from time to time, to legal proceedings and claims that arise in the ordinary course of business such as claims brought by our customers in connection with commercial disputes or employment claims made by our current or former employees. Litigation might result in substantial costs and may divert management’s attention and resources, which might seriously harm our business, overall financial condition and operating results. Insurance might not cover such claims, might not provide sufficient payments to cover all the costs to resolve one or more such claims and might not continue to be available on terms acceptable to us. A claim brought against us that is uninsured or underinsured could result in unanticipated costs, thereby reducing our operating results and leading analysts or potential investors to reduce their expectations of our performance, which could reduce the trading price of our stock.
Because our long-term growth strategy involves further expansion of our sales to customers outside the United States, our business will be susceptible to risks associated with international operations.
A component of our growth strategy involves the further expansion of our operations and customer base internationally. We opened our first international office in Beijing, China in April 2012 and subsequently opened an office in Windsor, United Kingdom in September 2012 as part of our geographic expansion. In March 2014, we acquired Vocal Limited, a mass notification company based in Colchester, United Kingdom. For each of the years ended December 31, 2014 and 2015, approximately 14% of our revenue was derived from customers located outside of the United States. For the six months ended June 30, 2016, approximately 12% of our revenue was derived from customers located outside of the United States. We intend to further expand our local presence in regions such as Europe, the Middle East and Asia. Our current international operations and future initiatives will involve a variety of risks, including:
| • | currency exchange rate fluctuations and the resulting effect on our revenue and expenses, and the cost and risk of entering into hedging transactions if we chose to do so in the future; |
| • | economic or political instability in foreign markets; |
| • | greater difficulty in enforcing contracts, accounts receivable collection and longer collection periods; |
| • | more stringent regulations relating to technology, including with respect to privacy, data security and the unauthorized use of, access to, or deletion of commercial and personal information, particularly in the European Union; |
| • | difficulties in maintaining our company culture with a dispersed and distant workforce; |
| • | unexpected changes in regulatory requirements, taxes or trade laws; |
| • | differing labor regulations, especially in the European Union, where labor laws are generally more advantageous to employees as compared to the United States, including deemed hourly wage and overtime regulations in these locations; |
| • | challenges inherent in efficiently managing an increased number of employees over large geographic distances, including the need to implement appropriate systems, policies, benefits and compliance programs; |
| • | difficulties in managing a business in new markets with diverse cultures, languages, customs, legal systems, alternative dispute systems and regulatory systems; |
| • | limitations on our ability to reinvest earnings from operations in one country to fund the capital needs of our operations in other countries; |
| • | limited or insufficient intellectual property protection; |
29
Table of Contents
| • | political instability or terrorist activities; |
| • | likelihood of potential or actual violations of domestic and international anticorruption laws, such as the U.S. Foreign Corrupt Practices Act and the U.K. Bribery Act, or of U.S. and international export control and sanctions regulations, which likelihood may increase with an increase of sales or operations in foreign jurisdictions and operations in certain industries; and |
| • | adverse tax burdens and foreign exchange controls that could make it difficult to repatriate earnings and cash. |
Our limited experience in operating our business internationally increases the risk that any potential future expansion efforts that we may undertake will not be successful. If we invest substantial time and resources to expand our international operations and are unable to do so successfully and in a timely manner, our business and operating results will suffer. We continue to implement policies and procedures to facilitate our compliance with U.S. laws and regulations applicable to or arising from our international business. Inadequacies in our past or current compliance practices may increase the risk of inadvertent violations of such laws and regulations, which could lead to financial and other penalties that could damage our reputation and impose costs on us.
If we cannot maintain our company culture as we grow, our success and our business may be harmed.
We believe our culture has been a key contributor to our success to-date and that the critical nature of the solutions that we provide promotes a sense of greater purpose and fulfillment in our employees. We have invested in building a strong corporate culture and believe it is one of our most important and sustainable sources of competitive advantage. Any failure to preserve our culture could negatively affect our ability to retain and recruit personnel and to effectively focus on and pursue our corporate objectives. As we grow and develop the infrastructure of a public company, we may find it difficult to maintain these important aspects of our company culture. If we fail to maintain our company culture, our business may be adversely impacted.
We may be subject to additional obligations to collect and remit sales tax and other taxes, and we may be subject to tax liability for past sales, which could harm our business.
State, local and foreign jurisdictions have differing rules and regulations governing sales, use, value added and other taxes, and these rules and regulations are subject to varying interpretations that may change over time. Further, these jurisdictions’ rules regarding tax nexus are complex and vary significantly. If one or more jurisdictions were to assert that we have failed to collect taxes for sales of applications that leverage our platform, we could face the possibility of tax assessments and audits. A successful assertion that we should be collecting additional sales, use, value added or other taxes in those jurisdictions where we have not historically done so and do not accrue for such taxes could result in substantial tax liabilities and related penalties for past sales or otherwise harm our business and operating results.
We face exposure to foreign currency exchange rate fluctuations.
As our international operations expand, our exposure to the effects of fluctuations in currency exchange rates grows. While we have primarily transacted with customers and vendors in U.S. dollars historically, we expect to continue to expand the number of transactions with our customers that are denominated in foreign currencies in the future. Fluctuations in the value of the U.S. dollar and foreign currencies may make our subscriptions more expensive for international customers, which could harm our business. Additionally, we incur expenses for employee compensation and other operating expenses at our non-U.S. locations in the local currency for such locations. Fluctuations in the exchange rates between the U.S. dollar and other currencies could result in an increase to the U.S. dollar equivalent of such expenses. These fluctuations could cause our results of operations to differ from our expectations or the expectations of our investors. Additionally, such foreign currency exchange rate fluctuations could make it more difficult to detect underlying trends in our business and results of operations.
We do not currently maintain a program to hedge transactional exposures in foreign currencies. However, in the future, we may use derivative instruments, such as foreign currency forward and option contracts, to hedge
30
Table of Contents
certain exposures to fluctuations in foreign currency exchange rates. The use of such hedging activities may not offset any or more than a portion of the adverse financial effects of unfavorable movements in foreign exchange rates over the limited time the hedges are in place. Moreover, the use of hedging instruments may introduce additional risks if we are unable to structure effective hedges with such instruments.
Our ability to raise capital in the future may be limited, and our failure to raise capital when needed could prevent us from growing.
Our business and operations may consume resources faster than we anticipate. In the future, we may need to raise additional funds to invest in future growth opportunities. Additional financing may not be available on favorable terms, if at all. If adequate funds are not available on acceptable terms, we may be unable to invest in future growth opportunities, which could seriously harm our business and operating results. If we incur debt, the debt holders would have rights senior to common stockholders to make claims on our assets, and the terms of any debt could restrict our operations, including our ability to pay dividends on our common stock. Furthermore, if we issue equity securities, stockholders will experience dilution, and the new equity securities could have rights senior to those of our common stock. Because our decision to issue securities in any future offering will depend on market conditions and other factors beyond our control, we cannot predict or estimate the amount, timing or nature of our future offerings. As a result, our stockholders bear the risk of our future securities offerings reducing the market price of our common stock and diluting their interest.
Our sales cycle can be unpredictable, time-consuming and costly, which could harm our business and operating results.
Our sales process involves educating prospective customers and existing customers about the use, technical capabilities and benefits of our platform and applications. Prospective customers, especially larger organizations, often undertake a prolonged evaluation process, which typically involves not only our solutions, but also those of our competitors and lasts from four to nine months or longer. We may spend substantial time, effort and money on our sales and marketing efforts without any assurance that our efforts will produce any sales.
Events affecting our customers’ businesses may occur during the sales cycle that could affect the size or timing of a purchase, contributing to more unpredictability in our business and operating results. As a result of these factors, we may face greater costs, longer sales cycles and less predictability in the future.
Our ability to use our net operating losses to offset future taxable income may be subject to certain limitations.
As of December 31, 2015, we had federal and state net operating loss carryforwards, or NOLs, of $39.2 million and $36.6 million, respectively, due to prior period losses, which expire in various years beginning in 2028 if not utilized. In general, under Section 382 of the Internal Revenue Code of 1986, as amended, or the Code, a corporation that undergoes an “ownership change” is subject to limitations on its ability to utilize its NOLs to offset future taxable income. Our existing NOLs may be subject to limitations arising from previous ownership changes. Future changes in our stock ownership, some of which are outside of our control, could result in an ownership change. There is also a risk that due to regulatory changes, such as suspensions on the use of NOLs, or other unforeseen reasons, our existing NOLs could expire or otherwise be unavailable to offset future income tax liabilities. Additionally, state NOLs generated in one state cannot be used to offset income generated in another state. For these reasons, we may not be able to realize a tax benefit from the use of our NOLs, whether or not we attain profitability.
Our business is subject to the risks of earthquakes, fires, floods and other natural catastrophic events and to interruption by man-made problems such as cyber incidents or terrorism.
Our business and operations are vulnerable to damage or interruption from earthquakes, fires, floods, power losses, telecommunications failures, terrorist attacks, acts of war, human errors, break-ins and similar events affecting us or third-party vendors we rely on, any of which could have a material adverse impact on our business, operating results and financial condition. Acts of terrorism, which may be targeted at metropolitan
31
Table of Contents
areas that have higher population density than rural areas, could cause disruptions in our or our customers’ businesses or the economy as a whole. Our servers and those of our third-party vendors may also be vulnerable to cyber incidents, break-ins and similar disruptions from unauthorized tampering with our computer systems, which could lead to interruptions, delays, loss of critical data or the unauthorized disclosure of confidential customer data. We or our customers may not have sufficient protection or recovery plans in place, and our business interruption insurance may be insufficient to compensate us for losses that may occur. As we rely heavily on our servers, computer and communications systems, that of third parties and the Internet to conduct our business and provide high quality customer service, such disruptions could have an adverse effect on our business, operating results and financial condition.
Impairment of goodwill and other intangible assets would result in a decrease in our earnings.
Current accounting rules provide that goodwill and other intangible assets with indefinite useful lives may not be amortized but instead must be tested for impairment at least annually. These rules also require that intangible assets with definite useful lives be amortized over their respective estimated useful lives to their estimated residual values, and reviewed for impairment whenever events or changes in circumstances indicate that the carrying amount of such assets may not be recoverable. We have substantial goodwill and other intangible assets, and we would be required to record a significant charge to earnings in our consolidated financial statements during the period in which any impairment of our goodwill or intangible assets is determined. Any impairment charges or changes to the estimated amortization periods would result in a decrease in our earnings.
Our reported financial results may be adversely affected by changes in accounting principles generally accepted in the United States.
Generally accepted accounting principles in the United States are subject to interpretation by the Financial Accounting Standards Board, or FASB, the SEC and various bodies formed to promulgate and interpret appropriate accounting principles. A change in these principles or interpretations could have a significant effect on our reported financial results, and could affect the reporting of transactions completed before the announcement of a change.
Risks Related to Our Intellectual Property
If we fail to protect our intellectual property and proprietary rights adequately, our business could be harmed.
Our future success and competitive position depend in part on our ability to protect our intellectual property and proprietary technologies. To safeguard these rights, we rely on a combination of patent, trademark, copyright and trade secret laws and contractual protections in the United States and other jurisdictions, some of which afford only limited protection.
As of July 31, 2016, we had nine issued patents and three patent applications pending in the United States. We cannot assure you that any patents will issue from any patent applications, that patents that issue from such applications will give us the protection that we seek or that any such patents will not be challenged, invalidated, or circumvented. Any patents that may issue in the future from our pending or future patent applications may not provide sufficiently broad protection and may not be enforceable in actions against alleged infringers. In addition, we have registered the “Everbridge” and “Nixle” names in the United States, and have registered the “Everbridge” name in the European Union. We have registrations and/or pending applications for additional marks in the United States; however, we cannot assure you that any future trademark registrations will be issued for pending or future applications or that any registered trademarks will be enforceable or provide adequate protection of our proprietary rights.
In order to protect our unpatented proprietary technologies and processes, we rely on trade secret laws and confidentiality agreements with our employees, consultants, vendors and others. Despite our efforts to protect our proprietary technology and trade secrets, unauthorized parties may attempt to misappropriate, reverse engineer or
32
Table of Contents
otherwise obtain and use them. In addition, others may independently discover our trade secrets, in which case we would not be able to assert trade secret rights, or develop similar technologies and processes. Further, the contractual provisions that we enter into may not prevent unauthorized use or disclosure of our proprietary technology or intellectual property rights and may not provide an adequate remedy in the event of unauthorized use or disclosure of our proprietary technology or intellectual property rights. Effective trade secret protection may not be available in every country in which our services are available or where we have employees or independent contractors. The loss of trade secret protection could make it easier for third parties to compete with our solutions by copying functionality. In addition, any changes in, or unexpected interpretations of, the trade secret and employment laws in any country in which we operate may compromise our ability to enforce our trade secret and intellectual property rights. Costly and time-consuming litigation could be necessary to enforce and determine the scope of our proprietary rights, and failure to obtain or maintain trade secret protection could adversely affect our competitive business position.
In addition, to protect our intellectual property rights, we may be required to spend significant resources to monitor and protect these rights. Litigation brought to protect and enforce our intellectual property rights could be costly, time-consuming and distracting to management and could result in the impairment or loss of portions of our intellectual property. Failure to adequately enforce our intellectual property rights could also result in the impairment or loss of those rights. Furthermore, our efforts to enforce our intellectual property rights may be met with defenses, counterclaims and countersuits attacking the validity and enforceability of our intellectual property rights. Patent, copyright, trademark and trade secret laws offer us only limited protection and the laws of many of the countries in which we sell our services do not protect proprietary rights to the same extent as the United States and Europe. Accordingly, defense of our trademarks and proprietary technology may become an increasingly important issue as we continue to expand our operations and solution development into countries that provide a lower level of intellectual property protection than the United States or Europe. Policing unauthorized use of our intellectual property and technology is difficult and the steps we take may not prevent misappropriation of the intellectual property or technology on which we rely. For example, in the event of inadvertent or malicious disclosure of our proprietary technology, trade secret laws may no longer afford protection to our intellectual property rights in the areas not otherwise covered by patents or copyrights. Accordingly, we may not be able to prevent third parties from infringing upon or misappropriating our intellectual property.
We may elect to initiate litigation in the future to enforce or protect our proprietary rights or to determine the validity and scope of the rights of others. That litigation may not be ultimately successful and could result in substantial costs to us, the reduction or loss in intellectual property protection for our technology, the diversion of our management’s attention and harm to our reputation, any of which could materially and adversely affect our business and results of operations.
Our failure or inability to adequately protect our intellectual property and proprietary rights could harm our business, financial condition and results of operations.
An assertion by a third party that we are infringing its intellectual property could subject us to costly and time-consuming litigation or expensive licenses that could harm our business and results of operations.
Patent and other intellectual property disputes are common in our industry and we have been involved in such disputes from time to time in the ordinary course of our business. Some companies, including some of our competitors, own large numbers of patents, copyrights and trademarks, which they may use to assert claims against us. Third parties may in the future assert claims of infringement, misappropriation or other violations of intellectual property rights against us. They may also assert such claims against our customers whom we typically indemnify against claims that our solution infringes, misappropriates or otherwise violates the intellectual property rights of third parties. As the numbers of products and competitors in our market increase and overlaps occur, claims of infringement, misappropriation and other violations of intellectual property rights may increase. Any claim of infringement, misappropriation or other violation of intellectual property rights by a third party, even those without merit, could cause us to incur substantial costs defending against the claim and could distract our management from our business.
33
Table of Contents
As we seek to extend our platform and applications, we could be constrained by the intellectual property rights of others and it may also be more likely that competitors or other third parties will claim that our solutions infringe their proprietary rights. We might not prevail in any intellectual property infringement litigation given the complex technical issues and inherent uncertainties in such litigation. Defending such claims, regardless of their merit, could be time-consuming and distracting to management, result in costly litigation or settlement, cause development delays or require us to enter into royalty or licensing agreements. In addition, we currently have a limited portfolio of issued patents compared to our larger competitors, and therefore may not be able to effectively utilize our intellectual property portfolio to assert defenses or counterclaims in response to patent infringement claims or litigation brought against us by third parties. Further, litigation may involve patent holding companies or other adverse patent owners who have no relevant applications or revenue and against which our potential patents provide no deterrence, and many other potential litigants have the capability to dedicate substantially greater resources to enforce their intellectual property rights and to defend claims that may be brought against them. If our platform or any of our applications exceed the scope of in-bound licenses or violate any third-party proprietary rights, we could be required to withdraw those applications from the market, re-develop those applications or seek to obtain licenses from third parties, which might not be available on reasonable terms or at all. Any efforts to re-develop our platform and our applications, obtain licenses from third parties on favorable terms or license a substitute technology might not be successful and, in any case, might substantially increase our costs and harm our business, financial condition and results of operations. If we were compelled to withdraw any of our applications from the market, our business, financial condition and results of operations could be harmed.
We have indemnity obligations to our customers and certain of our channel partners for certain expenses and liabilities resulting from intellectual property infringement claims regarding our platform and our applications, which could force us to incur substantial costs.
We have indemnity obligations to our customers and certain of our channel partners for intellectual property infringement claims regarding our platform and our applications. As a result, in the case of infringement claims against these customers and channel partners, we could be required to indemnify them for losses resulting from such claims or to refund amounts they have paid to us. We also expect that some of our channel partners with whom we do not have express contractual obligations to indemnify for intellectual property infringement claims may seek indemnification from us in connection with infringement claims brought against them. We may elect to indemnify these channel partners where we have no contractual obligation to indemnify them and we will evaluate each such request on a case-by-case basis. If a channel partner elects to invest resources in enforcing a claim for indemnification against us, we could incur significant costs disputing it. If we do not succeed in disputing it, we could face substantial liability.
We may be subject to damages resulting from claims that our employees or contractors have wrongfully used or disclosed alleged trade secrets of their former employers or other parties.
We have in the past and may in the future be subject to claims that employees or contractors, or we, have inadvertently or otherwise used or disclosed trade secrets or other proprietary information of our competitors or other parties. Litigation may be necessary to defend against these claims. If we fail in defending against such claims, a court could order us to pay substantial damages and prohibit us from using technologies or features that are essential to our solutions, if such technologies or features are found to incorporate or be derived from the trade secrets or other proprietary information of these parties. In addition, we may lose valuable intellectual property rights or personnel. A loss of key personnel or their work product could hamper or prevent our ability to develop, market and support potential solutions or enhancements, which could severely harm our business. Even if we are successful in defending against these claims, such litigation could result in substantial costs and be a distraction to management.
The use of open source software in our platform and applications may expose us to additional risks and harm our intellectual property.
Our platform and some of our applications use or incorporate software that is subject to one or more open source licenses and we may incorporate open source software in the future. Open source software is typically freely
34
Table of Contents
accessible, usable and modifiable; however, certain open source software licenses require a user who intends to distribute the open source software as a component of the user’s software to disclose publicly part or all of the source code to the user’s software. In addition, certain open source software licenses require the user of such software to make any modifications or derivative works of the open source code available to others on potentially unfavorable terms or at no cost. Use and distribution of open source software may entail greater risks than use of third-party commercial software, as open source licensors generally do not provide warranties or other contractual protections regarding infringement claims or the quality of the code.
The terms of many open source licenses to which we are subject have not been interpreted by U.S. or foreign courts, and accordingly there is a risk that those licenses could be construed in a manner that imposes unanticipated conditions or restrictions on our ability to commercialize our platform and applications. In that event, we could be required to seek licenses from third parties in order to continue offering our platform and applications, to re-develop our platform and applications, to discontinue sales of our platform and applications or to release our proprietary software code in source code form under the terms of an open source license, any of which could harm our business. Further, given the nature of open source software, it may be more likely that third parties might assert copyright and other intellectual property infringement claims against us based on our use of these open source software programs. Litigation could be costly for us to defend, have a negative effect on our operating results and financial condition or require us to devote additional research and development resources to change our applications.
Although we are not aware of any use of open source software in our platform and applications that would require us to disclose all or a portion of the source code underlying our core applications, it is possible that such use may have inadvertently occurred in deploying our platform and applications, or that persons or entities may claim such disclosure to be required. Disclosing our proprietary source code could allow our competitors to create similar products with lower development effort and time and ultimately could result in a loss of sales for us. Disclosing the source code of our proprietary software could also make it easier for cyber attackers and other third parties to discover vulnerabilities in or to defeat the protections of our products, which could result in our products failing to provide our customers with the security they expect. Any of these events could have a material adverse effect on our business, operating results and financial condition. Additionally, if a third-party software provider has incorporated certain types of open source software into software we license from such third party for our platform and applications without our knowledge, we could, under certain circumstances, be required to disclose the source code to our platform and applications. This could harm our intellectual property position and our business, results of operations and financial condition.
Risks Related to Government Regulation
Failure to comply with governmental laws and regulations could harm our business.
Our business is subject to regulation by various federal, state, local and foreign governments. In certain jurisdictions, these regulatory requirements may be more stringent than those in the United States. Noncompliance with applicable regulations or requirements could subject us to investigations, sanctions, enforcement actions, disgorgement of profits, fines, damages, civil and criminal penalties, injunctions or other collateral consequences. If any governmental sanctions are imposed, or if we do not prevail in any possible civil or criminal litigation, our business, results of operations, and financial condition could be materially adversely affected. In addition, responding to any action will likely result in a significant diversion of management’s attention and resources and an increase in professional fees. Enforcement actions and sanctions could harm our business, reputation, results of operations and financial condition.
A portion of our revenue is generated by subscriptions sold to governmental entities and heavily regulated organizations, which are subject to a number of challenges and risks.
A portion of our revenue is generated by subscriptions sold to government entities. Additionally, many of our current and prospective customers, such as those in the financial services, and healthcare and life sciences
35
Table of Contents
industries, are highly regulated and may be required to comply with more stringent regulations in connection with subscribing to and implementing our applications. Selling subscriptions to these entities can be highly competitive, expensive and time consuming, often requiring significant upfront time and expense without any assurance that we will successfully complete a sale.
Furthermore, engaging in sales activities to foreign governments introduces additional compliance risks specific to the Foreign Corrupt Practices Act, the U.K. Bribery Act and other similar statutory requirements prohibiting bribery and corruption in the jurisdictions in which we operate. Governmental and highly regulated entities often require contract terms that differ from our standard arrangements. For example, the federal government provides grants to certain state and local governments for our applications and if such governmental entities do not continue to receive these grants, they have the ability to terminate their contracts without penalty. Governmental and highly regulated entities impose compliance requirements that are complicated, require preferential pricing or “most favored nation” terms and conditions, or are otherwise time consuming and expensive to satisfy. If we undertake to meet special standards or requirements and do not meet them, we could be subject to increased liability from our customers or regulators. Even if we do meet these special standards or requirements, the additional costs associated with providing our applications to government and highly regulated customers could harm our margins. Moreover, changes in the underlying regulatory conditions that affect these types of customers could harm our ability to efficiently provide our applications to them and to grow or maintain our customer base.
Governmental demand and payment for our applications may also be impacted by public sector budgetary cycles and funding authorizations, with funding reductions or delays adversely affecting public sector demand for our solutions.
We are subject to governmental regulation and other legal obligations, particularly related to privacy, data protection and information security, and our actual or perceived failure to comply with such obligations could harm our business. Compliance with such laws could also impair our efforts to maintain and expand our customer base, and thereby decrease our revenue.
Our handling and storage of data is subject to a variety of laws and regulations, including regulation by various government agencies, including the U.S. Federal Trade Commission, or FTC, and various state, local and foreign agencies. We collect personally identifiable information and other data directly from our customers and through our channel partners. We also process or otherwise handle personally identifiable information about our customers’ employees, customers and constituents in certain circumstances. We use this information to provide applications to our customers, to support, expand and improve our business. We may also share customers’ personally identifiable information with third parties as described in our privacy policy and/or as otherwise authorized by our customers.
The U.S. federal and various state and foreign governments have adopted or proposed legislation that regulates the collection, distribution, use and storage of personal information of individuals and that mandates security requirements with respect to certain personally identifiable information. In the United States, the FTC and numerous state attorneys general are imposing standards for the online collection, distribution, use and storage of data by applying federal and state consumer protection laws. The lack of a clear and universal standard for protecting such information means, however, that these obligations may be interpreted and applied in a manner that is inconsistent from one jurisdiction to another and may conflict with other requirements or our practices. Any failure or perceived failure by us to comply with privacy or security laws, policies, legal obligations or industry standards or any security incident that results in the unauthorized release or transfer of sensitive corporate information, personally identifiable information or other customer data may result in governmental enforcement actions, litigation, fines and penalties and/or adverse publicity, and could cause our customers to lose trust in us, which could have an adverse effect on our reputation and business.
Some proposed laws or regulations concerning privacy, data protection and information security are in their early stages, and we cannot yet determine how these laws and regulations may be interpreted nor can we determine the impact these proposed laws and regulations, may have on our business. Such proposed laws and regulations may require companies to implement privacy and security policies, permit users to access, correct and delete personal
36
Table of Contents
information stored or maintained by such companies, inform individuals of security breaches that affect their personal information, and, in some cases, obtain individuals’ consent to use personal information for certain purposes. In addition, a foreign government could require that any personal information collected in a country not be disseminated outside of that country, and we may not be currently equipped to comply with such a requirement. Our failure to comply with federal, state and international data privacy laws and regulators could harm our ability to successfully operate our business and pursue our business goals.
In addition, several foreign countries and governmental bodies, including the European Union and Canada, have regulations governing the collection and use of personal information obtained from their residents, which are often more restrictive than those in the United States. Laws and regulations in these jurisdictions apply broadly to the collection, use, storage, disclosure and security of personal information that identifies or may be used to identify an individual, such as names, email addresses and in some jurisdictions, Internet Protocol, or IP, addresses. Such regulations and laws may be modified and new laws may be enacted in the future. Within the European Union, legislators are currently considering a revision to the 1995 European Union Data Protection Directive that would include more stringent operational requirements for processors and controllers of personal information and that would impose significant penalties for non-compliance. If our privacy or data security measures fail to comply with current or future laws and regulations, we may be subject to litigation, regulatory investigations, fines or other liabilities, as well as negative publicity and a potential loss of business. Moreover, if future laws and regulations limit our customers’ ability to use and share personal information or our ability to store, process and share personal information, demand for our applications could decrease, our costs could increase, and our business, results of operations and financial condition could be harmed.
New interpretations of existing laws, regulations or standards could require us to incur additional compliance costs and could restrict our business operations, and any failure by us to comply with applicable requirements may result in governmental enforcement actions, litigation, fines and penalties or adverse publicity, which could have an adverse effect on our reputation and business.
Potential regulatory requirements placed on our applications and content could impose increased costs on us, delay or prevent our introduction of new applications, and impair the function or value of our existing applications.
Certain of our existing applications, such as HipaaBridge, a tailored version of our Secure Messaging application that is designed to comply with HIPAA, are and are likely to continue to be subject to increasing regulatory requirements in a number of ways and as we continue to introduce new applications, we may be subject to additional regulatory requirements and other risks that could be costly and difficult to comply with or that could harm our business. In addition, we market our applications and professional services in certain countries outside of the United States and plan to expand our local presence in regions such as Europe, the Middle East and Asia. If additional legal and/or regulatory requirements are implemented in the foreign countries in which we provide our services, the cost of developing or selling our applications may increase. As these requirements proliferate and as existing legal requirements become subject to new interpretations, we must change or adapt our applications and professional services to comply. Changing regulatory requirements might render certain of our applications obsolete or might block us from accomplishing our work or from developing new applications. This might in turn impose additional costs upon us to comply or to further develop our applications. It might also make introduction of new applications or service types more costly or more time-consuming than we currently anticipate. It might even prevent introduction by us of new applications or cause the continuation of our existing applications or professional services to become unprofitable or impossible.
Risks Related to this Offering and Ownership of Our Common Stock
Our stock price may be volatile and you may lose some or all of your investment.
The initial public offering price for the shares of our common stock will be determined by negotiations between us and the representative of the underwriters and may not be indicative of the market price of our common stock following this offering. The market price of our common stock may be highly volatile and may fluctuate substantially as a result of a variety of factors, some of which are related in complex ways, including:
| • | actual or anticipated fluctuations in our financial condition and operating results; |
| • | variance in our financial performance from expectations of securities analysts; |
37
Table of Contents
| • | changes in the prices of our applications; |
| • | changes in our projected operating and financial results; |
| • | changes in laws or regulations applicable to our platform and applications; |
| • | announcements by us or our competitors of significant business developments, acquisitions or new applications; |
| • | our involvement in any litigation; |
| • | our sale of our common stock or other securities in the future; |
| • | changes in senior management or key personnel; |
| • | trading volume of our common stock; |
| • | changes in the anticipated future size and growth rate of our market; and |
| • | general economic, regulatory and market conditions. |
Recently, the stock markets have experienced extreme price and volume fluctuations that have affected and continue to affect the market prices of equity securities of many companies. These fluctuations have often been unrelated or disproportionate to the operating performance of those companies. Broad market and industry fluctuations, as well as general economic, political, regulatory and market conditions, may negatively impact the market price of our common stock. If the market price of our common stock after this offering does not exceed the initial public offering price, you may lose some or all of your investment. In the past, companies that have experienced volatility in the market price of their securities have been subject to securities class action litigation. We may be the target of this type of litigation in the future, which could result in substantial costs and divert our management’s attention.
No public market for our common stock currently exists and an active trading market may not develop or be sustained following this offering.
Prior to this initial public offering, there has been no public market for our common stock. An active trading market may not develop or be sustained following the completion of this offering. The lack of an active market may impair your ability to sell your shares at the time you wish to sell them or at a price that you consider reasonable. The lack of an active market may also reduce the fair market value or the trading price of your shares. An inactive market may also impair our ability to raise capital to continue to fund operations by selling shares and may impair our ability to acquire other companies or technologies by using our shares as consideration.
We are an emerging growth company, and we cannot be certain if the reduced reporting requirements applicable to emerging growth companies will make our common stock less attractive to investors.
We are an emerging growth company, as defined in the Jumpstart Our Business Startups Act, or the JOBS Act, enacted in April 2012. For as long as we continue to be an emerging growth company, we may take advantage of exemptions from various reporting requirements that are applicable to other public companies that are not emerging growth companies, including not being required to comply with the auditor attestation requirements of Section 404 of the Sarbanes-Oxley Act of 2002, as amended, or the Sarbanes-Oxley Act, reduced disclosure obligations regarding executive compensation in this prospectus and our periodic reports and proxy statements and exemptions from the requirements of holding nonbinding advisory votes on executive compensation and stockholder approval of any golden parachute payments not previously approved. We could be an emerging growth company for up to five years following the year in which we complete this offering, although circumstances could cause us to lose that status earlier. We will remain an emerging growth company until the earlier of (1) the last day of the fiscal year (a) following the fifth anniversary of the completion of this offering, (b) in which we have total annual gross
38
Table of Contents
revenue of at least $1 billion or (c) in which we are deemed to be a large accelerated filer, which requires the market value of our common stock that is held by non-affiliates to exceed $700 million as of the prior June 30th, and (2) the date on which we have issued more than $1 billion in non-convertible debt during the prior three-year period. We cannot predict if investors will find our common stock less attractive because we may rely on these exemptions. If some investors find our common stock less attractive as a result, there may be a less active trading market for our common stock and our stock price may be more volatile.
As a result of becoming a public company, we will be obligated to develop and maintain a system of effective internal control over financial reporting. We may not complete our analysis of our internal control over financial reporting in a timely manner, or these internal controls may not be determined to be effective, which may harm investor confidence in our company and, as a result, the value of our common stock.
We will be required, pursuant to Section 404 of the Sarbanes-Oxley Act, to furnish a report by management on, among other things, the effectiveness of our internal control over financial reporting in the second annual report we file with the U.S. Securities and Exchange Commission, or SEC. This assessment will need to include disclosure of any material weaknesses identified by our management in our internal control over financial reporting. However, our auditors will not be required to formally attest to the effectiveness of our internal control over financial reporting pursuant to Section 404 until we are no longer an “emerging growth company” as defined in the JOBS Act if we take advantage of the exemptions available to us through the JOBS Act.
We are in the very early stages of the costly and challenging process of compiling the system and process documentation necessary to perform the evaluation needed to comply with Section 404. In this regard, we will need to continue to dedicate internal resources, engage outside consultants and adopt a detailed work plan to assess and document the adequacy of internal control over financial reporting, continue steps to improve control processes as appropriate, validate through testing that controls are functioning as documented and implement a continuous reporting and improvement process for internal control over financial reporting. As we transition to the requirements of reporting as a public company, we may need to add additional finance staff. We may not be able to remediate any future material weaknesses, or to complete our evaluation, testing and any required remediation in a timely fashion. During the evaluation and testing process, if we identify one or more material weaknesses in our internal control over financial reporting, we will be unable to assert that our internal controls are effective. If we are unable to assert that our internal control over financial reporting is effective, or if our auditors are unable to express an opinion on the effectiveness of our internal controls when they are required to issue such opinion, investors could lose confidence in the accuracy and completeness of our financial reports, which could harm our stock price.
If securities or industry analysts do not publish research or reports about our business, or if they issue an adverse or misleading opinion regarding our stock, our stock price and trading volume could decline.
The trading market for our common stock will be influenced by the research and reports that industry or securities analysts publish about us or our business. We do not currently have and may never obtain research coverage by securities and industry analysts and we will have no control over any analysts that may choose to cover us. If no or few securities or industry analysts commence coverage of us, the trading price for our stock would be negatively impacted. In the event that we obtain securities or industry analyst coverage, if any of the analysts who cover us issue an adverse or misleading opinion regarding us, our business model, our intellectual property or our stock performance, or if operating results fail to meet the expectations of analysts, our stock price would likely decline. If one or more of these analysts cease coverage of us or fail to publish reports on us regularly, we could lose visibility in the financial markets, which in turn could cause our stock price or trading volume to decline.
We will incur increased costs as a result of operating as a public company and our management will be required to devote substantial time to new compliance initiatives and corporate governance practices.
As a public company, and particularly after we are no longer an “emerging growth company,” we will incur significant legal, accounting and other expenses that we did not incur as a private company. The Sarbanes-Oxley Act, the Dodd-Frank Wall Street Reform and Consumer Protection Act, the listing requirements of the NASDAQ Stock Market and
39
Table of Contents
other applicable securities rules and regulations impose various requirements on public companies. Our management and other personnel will need to devote a substantial amount of time to compliance with these requirements. Moreover, these rules and regulations will increase our legal and financial compliance costs and will make some activities more time-consuming and costly. For example, we expect that these rules and regulations may make it more difficult and more expensive for us to obtain directors’ and officers’ liability insurance, which could make it more difficult for us to attract and retain qualified members of our board of directors. We cannot predict or estimate the amount of additional costs we will incur as a public company or the timing of such costs.
We do not anticipate paying any cash dividends in the foreseeable future, and accordingly, stockholders must rely on stock appreciation for any return on their investment.
After the completion of this offering, we do not anticipate declaring any cash dividends to holders of our common stock in the foreseeable future. In addition, our ability to pay cash dividends is currently prohibited by the terms of our existing credit agreement and may be prohibited by future credit agreements. As a result, capital appreciation, if any, of our common stock will be your sole source of gain for the foreseeable future.
Our executive officers, directors and principal stockholders own a significant percentage of our stock and will be able to exert significant control over matters subject to stockholder approval.
Following this offering, our directors, executive officers and holders of more than 5% of our common stock, all of whom are represented on our board of directors, together with their affiliates will beneficially own % of the voting power of our outstanding capital stock. As a result, these stockholders will, immediately following this offering, be able to determine the outcome of matters submitted to our stockholders for approval. This ownership could affect the value of your shares of common stock by, for example, these stockholders electing to delay, defer or prevent a change in corporate control, merger, consolidation, takeover or other business combination. This concentration of ownership may also adversely affect the market price of our common stock.
We may invest or spend the proceeds of this offering in ways with which you may not agree or in ways which may not yield a return.
A portion of the net proceeds from this offering may be used for general corporate purposes, including working capital. We may also use a portion of the net proceeds to acquire complementary businesses, applications, services or technologies. However, we do not have any agreements or commitments for any acquisitions at this time. Our management will have considerable discretion in the application of the net proceeds, and you will not have the opportunity, as part of your investment decision, to assess whether the proceeds are being used appropriately. The net proceeds may be invested with a view towards long-term benefits for our stockholders and this may not increase our operating results or market value. The failure by our management to apply these funds effectively may adversely affect the return on your investment.
Anti-takeover provisions in our charter documents and under Delaware law could make an acquisition of us more difficult, limit attempts by our stockholders to replace or remove our current management and limit the market price of our common stock.
Provisions in our certificate of incorporation and bylaws, as amended and restated in connection with this offering, may have the effect of delaying or preventing a change in control or changes in our management. Our amended and restated certificate of incorporation and amended and restated bylaws will include provisions that:
| • | authorize our board of directors to issue preferred stock, without further stockholder action and with voting liquidation, dividend and other rights superior to our common stock; |
| • | require that any action to be taken by our stockholders be effected at a duly called annual or special meeting and not by written consent, and limit the ability of our stockholders to call special meetings; |
| • | establish an advance notice procedure for stockholder proposals to be brought before an annual meeting, including proposed nominations of persons for director nominees; |
40
Table of Contents
| • | establish that our board of directors is divided into three classes, with directors in each class serving three-year staggered terms; |
| • | require the approval of holders of two-thirds of the shares entitled to vote at an election of directors to adopt, amend or repeal our bylaws or amend or repeal the provisions of our certificate of incorporation regarding the election and removal of directors and the ability of stockholders to take action by written consent or call a special meeting; |
| • | prohibit cumulative voting in the election of directors; and |
| • | provide that vacancies on our board of directors may be filled only by the vote of a majority of directors then in office, even though less than a quorum. |
These provisions may frustrate or prevent any attempts by our stockholders to replace or remove our current management by making it more difficult for stockholders to replace members of our board of directors, which is responsible for appointing the members of our management. In addition, because we are incorporated in Delaware, we are governed by the provisions of Section 203 of the General Corporation Law of the State of Delaware, which generally prohibits a Delaware corporation from engaging in any of a broad range of business combinations with any “interested” stockholder for a period of three years following the date on which the stockholder became an “interested” stockholder. Any of the foregoing provisions could limit the price that investors might be willing to pay in the future for shares of our common stock, and they could deter potential acquirers of our company, thereby reducing the likelihood that you would receive a premium for your common stock in an acquisition.
Our amended and restated certificate of incorporation will designate the Court of Chancery of the State of Delaware as the exclusive forum for certain litigation that may be initiated by our stockholders, which could limit our stockholders’ ability to obtain a favorable judicial forum for disputes with us.
Pursuant to our amended and restated certificate of incorporation, as will be in effect upon the completion of this offering, unless we consent in writing to the selection of an alternative forum, the Court of Chancery of the State of Delaware will be the sole and exclusive forum for (1) any derivative action or proceeding brought on our behalf, (2) any action asserting a claim of breach of a fiduciary duty owed by any of our directors, officers or other employees to us or our stockholders, (3) any action asserting a claim arising pursuant to any provision of the Delaware General Corporation Law, our amended and restated certificate of incorporation or our amended and restated bylaws or (4) any action asserting a claim governed by the internal affairs doctrine. Our amended and restated certificate of incorporation will further provide that any person or entity purchasing or otherwise acquiring any interest in shares of our common stock is deemed to have notice of and consented to the foregoing provision. The forum selection clause in our amended and restated certificate of incorporation may limit our stockholders’ ability to obtain a favorable judicial forum for disputes with us.
Future sales of our common stock in the public market could cause our share price to decline.
After this offering, there will be shares of our common stock outstanding. Sales of a substantial number of shares of our common stock in the public market after this offering, or the perception that these sales might occur, could depress the market price of our common stock and could impair our ability to raise capital through the sale of additional equity securities. Of our issued and outstanding shares of our common stock, all of the shares sold in this offering will be freely transferrable without restrictions or further registration under the Securities Act, except for any shares acquired by our affiliates, as defined in Rule 144 under the Securities Act. The remaining shares outstanding after this offering will be restricted as a result of securities laws, lock-up agreements or other contractual restrictions that restrict transfers for 180 days after the date of this prospectus.
Additionally, following the completion of this offering, stockholders holding approximately % of our common stock outstanding, will, after the expiration of the lock-up periods specified above, have the right, subject to various conditions and limitations, to include their shares of our common stock in registration statements relating to our securities. If the offer and sale of these shares are registered, they will be freely tradable without restriction
41
Table of Contents
under the Securities Act. Shares of common stock sold under such registration statements can be freely sold in the public market. In the event such registration rights are exercised and a large number of shares of common stock are sold in the public market, such sales could reduce the trading price of our common stock. See “Description of Capital Stock—Registration Rights” and “Shares Eligible for Future Sale—Lock-Up Agreements” for a more detailed description of these registration rights and the lock-up period.
We intend to file a registration statement on Form S-8 under the Securities Act to register the total number of shares of our common stock that may be issued under our equity incentive plans. See “Shares Eligible for Future Sale—Form S-8 Registration Statements” for a more detailed description of the shares of common stock that will be available for future sale upon the registration and issuance of such shares, subject to any applicable vesting or lock-up period or other restrictions provided under the terms of the applicable plan and/or the option agreements entered into with the option holders. In addition, in the future we may issue common stock or other securities if we need to raise additional capital. The number of new shares of our common stock issued in connection with raising additional capital could constitute a material portion of the then outstanding shares of our common stock.
Purchasers in this offering will experience immediate and substantial dilution in the book value of their investment.
The initial public offering price of our common stock will be substantially higher than the pro forma net tangible book value per share of our common stock, as of June 30, 2016, immediately after this offering. Therefore, if you purchase shares of our common stock in this offering, you will suffer immediate dilution of $ per share, in net tangible book value after giving effect to the sale of common stock in this offering at an assumed public offering price of $ per share, the midpoint of the estimated initial public offering price range set forth on the cover page of this prospectus. We have also issued options to acquire common stock at prices below the initial public offering price. To the extent outstanding options are ultimately exercised, there will be further dilution to investors who purchase shares in this offering. As a result of the dilution to investors purchasing shares in this offering, investors may receive significantly less than the purchase price paid in this offering, if anything, in the event of our liquidation. See “Dilution.”
42
Table of Contents
SPECIAL NOTE REGARDING FORWARD-LOOKING STATEMENTS
This prospectus contains forward-looking statements that involve substantial risks and uncertainties. The forward-looking statements are contained principally in the sections of this prospectus entitled “Prospectus Summary,” “Risk Factors,” “Management’s Discussion and Analysis of Financial Condition and Results of Operations” and “Business,” but are also contained elsewhere in this prospectus. In some cases, you can identify forward-looking statements by the words “anticipate,” “believe,” “continue,” “could,” “estimate,” “expect,” “intend,” “may,” “might,” “objective,” “ongoing,” “plan,” “predict,” “project,” “potential,” “should,” “will,” or “would,” or the negative of these terms, or other comparable terminology intended to identify statements about the future. These statements involve known and unknown risks, uncertainties and other factors that may cause our actual results, levels of activity, performance or achievements to be materially different from the information expressed or implied by these forward-looking statements. Although we believe that we have a reasonable basis for each forward-looking statement contained in this prospectus, we caution you that these statements are based on a combination of facts and factors currently known by us and our expectations of the future, about which we cannot be certain. Forward-looking statements include statements about:
| • | our ability to continue to add new customers, maintain existing customers and sell new applications to new and existing customers; |
| • | the effects of increased competition as well as innovations by new and existing competitors in our market; |
| • | our ability to adapt to technological change and effectively enhance, innovate and scale our applications; |
| • | our ability to effectively manage or sustain our growth and to achieve profitability on an annual and consistent basis; |
| • | potential acquisitions and integration of complementary business and technologies; |
| • | our expected use of proceeds; |
| • | our ability to maintain, or strengthen awareness of, our brand; |
| • | perceived or actual integrity, reliability, quality or compatibility problems with our applications, including related to unscheduled downtime or outages; |
| • | statements regarding future revenue, hiring plans, expenses, capital expenditures, capital requirements and stock performance; |
| • | our ability to attract and retain qualified employees and key personnel and further expand our overall headcount; |
| • | our ability to grow both domestically and internationally; |
| • | our ability to stay abreast of new or modified laws and regulations that currently apply or become applicable to our business both in the United States and internationally; |
| • | our ability to maintain, protect and enhance our intellectual property; |
| • | costs associated with defending intellectual property infringement and other claims; and |
| • | the future trading prices of our common stock and the impact of securities analysts’ reports on these prices. |
We caution you that the foregoing list may not contain all of the forward-looking statements made in this prospectus.
You should refer to the “Risk Factors” section of this prospectus for a discussion of important factors that may cause our actual results to differ materially from those expressed or implied by our forward-looking statements.
43
Table of Contents
As a result of these factors, we cannot assure you that the forward-looking statements in this prospectus will prove to be accurate. Furthermore, if our forward-looking statements prove to be inaccurate, the inaccuracy may be material. In light of the significant uncertainties in these forward-looking statements, you should not regard these statements as a representation or warranty by us or any other person that we will achieve our objectives and plans in any specified time frame or at all. We undertake no obligation to publicly update any forward-looking statements, whether as a result of new information, future events or otherwise, except as required by law. The Private Securities Litigation Reform Act of 1995 and Section 27A of the Securities Act of 1933, as amended, or the Securities Act, do not protect any forward-looking statements that we make in connection with this offering. In addition, statements that “we believe” and similar statements reflect our beliefs and opinions on the relevant subject. These statements are based upon information available to us as of the date of this prospectus, and while we believe such information forms a reasonable basis for such statements, such information may be limited or incomplete, and our statements should not be read to indicate that we have conducted an exhaustive inquiry into, or review of, all potentially available relevant information. These statements are inherently uncertain and investors are cautioned not to unduly rely upon these statements.
You should read this prospectus and the documents that we reference in this prospectus and have filed as exhibits to the registration statement, of which this prospectus is a part, completely and with the understanding that our actual future results may be materially different from what we expect. We qualify all of our forward-looking statements by these cautionary statements.
44
Table of Contents
Unless otherwise indicated, information contained in this prospectus concerning our industry and the market in which we operate, including our general expectations and market position, market opportunity and market size is based on information from various sources, including independent industry publications by Gartner, Inc., Frost & Sullivan and Markets and Markets. In presenting this information, we have also made assumptions based on such data and other similar sources, and on our knowledge of, and in our experience to date in, the markets for our applications. This information involves a number of assumptions and limitations, and you are cautioned not to give undue weight to such estimates. Although neither we nor the underwriters have independently verified the accuracy or completeness of any third-party information, we believe the market position, market opportunity and market size information included in this prospectus is reliable. The industry in which we operate is subject to a high degree of uncertainty and risk due to a variety of factors, including those described in the “Risk Factors” section. These and other factors could cause results to differ materially from those expressed in the estimates made by the independent parties and by us.
45
Table of Contents
We estimate that the net proceeds from our issuance and sale of shares of our common stock in this offering will be approximately $ million, based upon an assumed initial public offering price of $ per share, the midpoint of the price range set forth on the cover page of this prospectus, after deducting underwriting discounts and commissions and estimated offering expenses payable by us. We will not receive any of the proceeds from the sale of shares by the selling stockholders, although we will bear the costs, other than underwriting discounts and commissions, associated with those sales.
Each $1.00 increase or decrease in the assumed initial public offering price of $ per share, the midpoint of the price range set forth on the cover page of this prospectus, would increase or decrease the net proceeds to us from this offering by approximately $ million, assuming that the number of shares offered by us, as set forth on the cover page of this prospectus, remains the same, and after deducting underwriting discounts and commissions payable by us. We may also increase or decrease the number of shares we are offering. A 1,000,000 share increase or decrease in the number of shares offered by us would increase or decrease the net proceeds to us from this offering by approximately $ million, at the assumed initial public offering price, and after deducting underwriting discounts and commissions payable by us. We do not expect that a change in the initial price to the public or the number of shares by these amounts would have a material effect on uses of the proceeds from this offering, although it may accelerate the time at which we will need to seek additional capital.
The principal purposes of this offering are to increase our financial flexibility, create a public market for our common stock and facilitate our future access to the capital markets. Although we have not yet determined with certainty the manner in which we will allocate the net proceeds of this offering, we expect to use the net proceeds from this offering for working capital and other general corporate purposes, including investments in sales and marketing in the United States and internationally and in research and development. We also intend to use approximately $6.5 million of the net proceeds to pay all outstanding principal and interest under our revolving line of credit with Western Alliance Bank, which carries a current interest rate of the prime rate, but in no event less than 3.25%, plus 0.75% and terminates in June 2018. We may also use a portion of the proceeds from this offering for acquisitions or strategic investments in complementary businesses or technologies, although we do not currently have any plans for any such acquisitions or investments. We have not allocated specific amounts of net proceeds for any of these purposes.
The expected use of net proceeds from this offering represents our intentions based upon our present plans and business conditions. We cannot predict with certainty all of the particular uses for the proceeds of this offering or the amounts that we will actually spend on the uses set forth above. Accordingly, our management will have significant flexibility in applying the net proceeds of this offering. The timing and amount of our actual expenditures will be based on many factors, including cash flows from operations and the anticipated growth of our business. Pending their use, we intend to invest the net proceeds of this offering in a variety of capital-preservation investments, including short- and intermediate-term, interest-bearing, investment-grade securities.
46
Table of Contents
We have never declared or paid any dividends on our capital stock. We currently intend to retain all available funds and any future earnings for the operation and expansion of our business and, therefore, we do not anticipate declaring or paying cash dividends in the foreseeable future. The payment of dividends will be at the discretion of our board of directors and will depend on our results of operations, capital requirements, financial condition, prospects, contractual arrangements, any limitations on payment of dividends present in our current and future debt agreements, and other factors that our board of directors may deem relevant. We are subject to several covenants under our debt arrangements that place restrictions on our ability to pay dividends.
47
Table of Contents
The following table sets forth our cash and our capitalization as of June 30, 2016:
| • | on an actual basis; |
| • | on a pro forma basis as adjusted to reflect (1) the conversion of all outstanding shares of our class A common stock and preferred stock into an aggregate of 54,735,950 shares of common stock immediately prior to the closing of this offering and (2) the filing of our amended and restated certificate of incorporation, which will become effective immediately prior to the closing of this offering; and |
| • | on a pro forma as adjusted basis to reflect (1) the sale of shares of common stock in this offering at an assumed initial public offering price of $ per share, the midpoint of the price range set forth on the cover page of this prospectus, after deducting underwriting discounts and commissions and estimated offering expenses payable by us, (2) repayment of principal and interest under our revolving line of credit and (3) our write-off of the associated debt issuance costs. |
You should read this table together with “Selected Consolidated Financial Statements,” “Management’s Discussion and Analysis of Financial Condition and Results of Operations” and our consolidated financial statements and the related notes appearing elsewhere in this prospectus.
| As of June 30, 2016 | ||||||||||||
| Actual | Pro Forma | Pro Forma As Adjusted(1) |
||||||||||
| (in thousands, except share and per share data) | ||||||||||||
| (unaudited) | ||||||||||||
| Cash |
$ | 1,048 | $ | 1,048 | $ | |||||||
|
|
|
|
|
|
|
|||||||
| Debt obligations |
15,462 | 15,462 | ||||||||||
| Stockholders’ deficit: |
||||||||||||
| Series A and A-1 convertible preferred stock, $0.001 par value per share; 50,000,000 shares authorized, 48,041,096 shares issued and outstanding, actual; no shares authorized, issued or outstanding, pro forma and pro forma as adjusted |
48 | — | — | |||||||||
| Class A common stock, $0.001 par value per share; 8,841,040 shares authorized, 6,694,854 shares issued and outstanding, actual; no shares authorized, issued or outstanding, pro forma and pro forma as adjusted |
7 | — | — | |||||||||
| Preferred stock, $0.001 par value per share; no shares authorized, issued or outstanding, actual; 10,000,000 shares authorized, no shares issued or outstanding, pro forma and pro forma as adjusted |
— | — | — | |||||||||
| Common stock, $0.001 par value per share; 125,000,000 shares authorized, 64,139,531 shares issued and outstanding, actual; shares authorized, 118,875,481 shares issued and outstanding, pro forma; shares authorized, shares issued and outstanding, pro forma as adjusted |
64 | 119 | ||||||||||
| Additional paid-in capital |
63,766 | 63,766 | ||||||||||
| Accumulated deficit |
(84,361 | ) | (84,361 | ) | ||||||||
| Accumulated other comprehensive loss |
(379 | ) | (379 | ) | ||||||||
|
|
|
|
|
|
|
|||||||
| Total stockholders’ deficit |
(20,855 | ) | (20,855 | ) | ||||||||
|
|
|
|
|
|
|
|||||||
| Total capitalization |
$ | (5,393 | ) | $ | (5,393 | ) | $ | |||||
|
|
|
|
|
|
|
|||||||
| (1) | The pro forma as adjusted information set forth above is illustrative only and will change based on the actual initial public offering price and other terms of this offering determined at pricing. Each $1.00 increase or decrease in the assumed initial public offering price |
48
Table of Contents
| of $ per share, the midpoint of the price range set forth on the cover page of this prospectus, would increase or decrease pro forma as adjusted cash, additional paid-in capital, total stockholders’ (deficit) equity and total capitalization by approximately $ million, assuming that the number of shares offered by us, as set forth on the cover page of this prospectus, remains the same, and after deducting underwriting discounts and commissions payable by us. We may also increase or decrease the number of shares we are offering. A 1,000,000 share increase or decrease in the number of shares offered by us would increase or decrease pro forma as adjusted cash, additional paid-in capital, total stockholders’ (deficit) equity and total capitalization by approximately $ million, at the assumed initial public offering price, and after deducting underwriting discounts and commissions payable by us. |
The number of shares of our common stock shown as issued and outstanding on a pro forma as adjusted basis in the table above is based on 118,875,481 shares of common stock outstanding as of June 30, 2016, and excludes:
| • | 11,230,416 shares of common stock issuable upon the exercise of options outstanding as of June 30, 2016, at a weighted-average exercise price of $1.66 per share; |
| • | 749,712 shares of common stock issuable upon the exercise of warrants outstanding as of June 30, 2016, at an exercise price of $0.4335 per share, which warrants, prior to the completion of this offering, are exercisable to purchase shares of our Series A-1 preferred stock; |
| • | shares of our common stock reserved for future issuance pursuant to our 2016 Equity Incentive Plan, which will become effective prior to the completion of this offering and will include provisions that automatically increase the number of shares of common stock reserved for issuance thereunder each year; and |
| • | shares of common stock reserved for future issuance under our 2016 Employee Stock Purchase Plan, which will become effective prior to the completion of this offering and will include provisions that automatically increase the number of shares of common stock reserved for issuance thereunder each year. |
49
Table of Contents
If you invest in our common stock, your interest will be diluted to the extent of the difference between the initial public offering price per share of our common stock and the pro forma as adjusted net tangible book value per share of our common stock immediately after the completion of this offering.
Our historical net tangible book value as of June 30, 2016 was $(31.8) million, or $(0.45) per share of common stock. Our historical net tangible book value per share represents our total tangible assets less our total liabilities and preferred stock (which is not included within stockholders’ deficit), divided by the number of shares of common stock outstanding as of June 30, 2016.
Our pro forma net tangible book value as of June 30, 2016 was $(31.8) million, or $(0.27) per share of common stock. Pro forma net tangible book value per share represents our total tangible assets less our total liabilities, divided by the number of shares of common stock outstanding as of June 30, 2016, after giving effect to the conversion of all of our outstanding shares of our class A common stock and preferred stock into an aggregate of 54,735,950 shares of common stock immediately prior to the closing of this offering.
Our pro forma as adjusted net tangible book value represents our pro forma net tangible book value, plus the effect of (1) the sale of shares of common stock in this offering at an assumed initial public offering price of $ per share, the midpoint of the price range set forth on the cover page of this prospectus, after deducting underwriting discounts and commissions and estimated offering expenses payable by us, (2) repayment of principal and interest under our revolving line of credit and (3) our write-off of the associated debt issuance costs. Our pro forma as adjusted net tangible book value as of June 30, 2016 was $ million, or $ per share of common stock. This amount represents an immediate increase in pro forma as adjusted net tangible book value of $ per share to our existing stockholders and an immediate dilution of $ per share to investors participating in this offering. We determine dilution per share to investors participating in this offering by subtracting pro forma as adjusted net tangible book value per share after this offering from the assumed initial public offering price per share paid by investors participating in this offering.
The following table illustrates this dilution on a per share basis to new investors:
| Assumed initial public offering price per share |
$ | |||||||
| Historical net tangible book value per share as of June 30, 2016 |
$ | (0.45 | ) | |||||
| Increase per share attributable to the pro forma transactions described above |
||||||||
| Pro forma net tangible book value per share as of June 30, 2016 |
||||||||
| Increase in pro forma net tangible book value per share attributed to new investors purchasing shares from us in this offering |
||||||||
|
|
|
|||||||
| Pro forma as adjusted net tangible book value per share after giving effect to this offering |
||||||||
|
|
|
|||||||
| Dilution in pro forma as adjusted net tangible book value per share to new investors in this offering |
$ | |||||||
|
|
|
The dilution information discussed above is illustrative only and will change based on the actual initial public offering price and other terms of this offering determined at pricing. Each $1.00 increase or decrease in the assumed initial public offering price of $ per share, the midpoint of the price range set forth on the cover page of this prospectus, would increase or decrease the pro forma as adjusted net tangible book value per share by $ per share and the dilution per share to investors participating in this offering by $ per share, assuming that the number of shares offered by us, as set forth on the cover page of this prospectus, remains the same and after deducting underwriting discounts and commissions payable by us, after repayment of principal and interest under our revolving line of credit and our write-off of the associated debt issuance costs. We may also increase or decrease the number of shares we are offering. A 1,000,000 share increase in the number of shares offered by us, as set forth on the cover page of this prospectus, would increase the pro forma as adjusted net tangible book value per share by $ and decrease the dilution per share to investors participating in this offering by $ , at the assumed initial public offering price of $ per share, the midpoint of the price range set forth on the cover page of this
50
Table of Contents
prospectus, and after deducting underwriting discounts and commissions payable by us, after repayment of principal and interest under our revolving line of credit and our write-off of the associated debt issuance costs. A 1,000,000 share decrease in the number of shares offered by us, as set forth on the cover page of this prospectus, would decrease the pro forma as adjusted net tangible book value per share after this offering by $ and increase the dilution per share to new investors participating in this offering by $ , at the assumed initial public offering price of $ per share, the midpoint of the price range set forth on the cover page of this prospectus, and after deducting underwriting discounts and commissions payable by us, after repayment of principal and interest under our revolving line of credit and our write-off of the associated debt issuance costs. The pro forma as adjusted information discussed above is illustrative only and will adjust based on the actual initial price to public and other terms of this offering determined at pricing.
The following table summarizes as of June 30, 2016, on the pro forma as adjusted basis described above, the number of shares of our common stock, the total consideration and the average price per share (1) paid to us by our existing stockholders and (2) to be paid by investors purchasing our common stock in this offering at an assumed initial public offering price of $ per share, the midpoint of the price range set forth on the cover page of this prospectus, before deducting underwriting discounts and commissions and estimated offering expenses payable by us.
| Shares Purchased | Total Consideration | Weighted- Average Price Per Share |
||||||||||||||||||
| Number | Percent | Amount |
Percent |
|||||||||||||||||
| Existing stockholders |
% | $ | % | $ | ||||||||||||||||
| New investors |
||||||||||||||||||||
|
|
|
|
|
|
|
|
|
|
|
|||||||||||
| Total |
100.0 | % | $ | 100.0 | % | $ | ||||||||||||||
|
|
|
|
|
|
|
|
|
|
|
|||||||||||
The foregoing table does not reflect the sales by existing stockholders in connection with sales made by them in this offering. Sales by the selling stockholders in this offering will reduce the number of shares held by existing stockholders to shares, or % of the total number of shares of our common stock outstanding after this offering, and will increase the number of shares held by new investors to shares, or % of the total number of shares of our common stock outstanding after this offering.
The foregoing table and calculations above are based on 118,875,481 shares of common stock outstanding as of June 30, 2016, and exclude:
| • | 11,230,416 shares of common stock issuable upon the exercise of options outstanding as of June 30, 2016, at a weighted-average exercise price of $1.66 per share; |
| • | 749,712 shares of common stock issuable upon the exercise of warrants outstanding as of June 30, 2016, at an exercise price of $0.4335 per share, which warrants, prior to the completion of this offering, are exercisable to purchase shares of our Series A-1 preferred stock; |
| • | shares of our common stock reserved for future issuance pursuant to our 2016 Equity Incentive Plan, which will become effective prior to the completion of this offering and will include provisions that automatically increase the number of shares of common stock reserved for issuance thereunder each year; and |
| • | shares of common stock reserved for future issuance under our 2016 Employee Stock Purchase Plan, which will become effective prior to the completion of this offering and will include provisions that automatically increase the number of shares of common stock reserved for issuance thereunder each year. |
To the extent that options or warrants are exercised, new options or other securities are issued under our equity incentive plans, or we issue additional shares of common stock in the future, there will be further dilution to investors participating in this offering. In addition, we may choose to raise additional capital because of market conditions or strategic considerations, even if we believe that we have sufficient funds for our current or future operating plans. If we raise additional capital through the sale of equity or convertible debt securities, the issuance of these securities could result in further dilution to our stockholders.
51
Table of Contents
SELECTED CONSOLIDATED FINANCIAL DATA
We derived the selected consolidated statements of operations data for the years ended December 31, 2013, 2014 and 2015 and the selected consolidated balance sheet data as of December 31, 2014 and 2015 from our audited consolidated financial statements included elsewhere in this prospectus. We derived the selected consolidated statement of operations data for the year ended December 31, 2012 from our audited consolidated financial statements not included in this prospectus. We derived the summary consolidated statements of operations data for the six months ended June 30, 2015 and 2016 and the summary consolidated balance sheet data as of June 30, 2016 from our unaudited financial statements included elsewhere in this prospectus. We have prepared the unaudited financial statements on the same basis as the audited financial statements, and the unaudited financial data include, in our opinion, all adjustments, consisting only of normal recurring adjustments, that we consider necessary for a fair presentation of our financial position and results of operations for these periods. Our historical results are not necessarily indicative of the results to be expected in the future and our operating results for the six months ended June 30, 2016 are not necessarily indicative of the results that may be expected for the year ending December 31, 2016.
When you read this selected consolidated financial data, it is important that you read it together with the historical consolidated financial statements and related notes to those statements, as well as “Management’s Discussion and Analysis of Financial Condition and Results of Operations,” included elsewhere in this prospectus.
| Year Ended December 31, |
Six Months Ended June 30, |
|||||||||||||||||||||||
| 2012 | 2013 | 2014 | 2015 | 2015 | 2016 | |||||||||||||||||||
| (in thousands, except share and per share data) | ||||||||||||||||||||||||
| (unaudited) | ||||||||||||||||||||||||
| Consolidated Statements of Operations Data: |
||||||||||||||||||||||||
| Revenue |
$ | 23,361 | $ | 30,040 | $ | 42,421 | $ | 58,720 | $ | 27,313 | $ | 35,634 | ||||||||||||
| Cost of revenue:(1) |
7,570 | 8,699 | 12,089 | 19,789 | 9,045 | 11,151 | ||||||||||||||||||
|
|
|
|
|
|
|
|
|
|
|
|
|
|||||||||||||
| Gross profit |
15,791 | 21,341 | 30,332 | 38,931 | 18,268 | 24,483 | ||||||||||||||||||
|
|
|
|
|
|
|
|
|
|
|
|
|
|||||||||||||
| Operating expenses: (1) |
||||||||||||||||||||||||
| Sales and marketing |
7,998 | 11,695 | 15,818 | 25,925 | 11,337 | 17,054 | ||||||||||||||||||
| Research and development |
5,057 | 5,697 | 7,365 | 11,521 | 5,469 | 6,643 | ||||||||||||||||||
| General and administrative |
7,371 | 4,352 | 7,435 | 12,272 | 4,578 | 6,586 | ||||||||||||||||||
|
|
|
|
|
|
|
|
|
|
|
|
|
|||||||||||||
| Total operating expense |
20,426 | 21,744 | 30,618 | 49,718 | 21,384 | 30,283 | ||||||||||||||||||
|
|
|
|
|
|
|
|
|
|
|
|
|
|||||||||||||
| Operating loss |
(4,635 | ) | (403 | ) | (286 | ) | (10,787 | ) | (3,116 | ) | (5,800 | ) | ||||||||||||
| Other expense, net |
399 | 368 | 426 | 599 | 276 | 339 | ||||||||||||||||||
|
|
|
|
|
|
|
|
|
|
|
|
|
|||||||||||||
| Loss before (provision for) benefit from income taxes | (5,034 | ) | (771 | ) | (712 | ) | (11,386 | ) | (3,392 | ) | (6,139 | ) | ||||||||||||
| (Provision for) benefit from income taxes |
(57 | ) | (118 | ) | 89 | 562 | 188 | 110 | ||||||||||||||||
|
|
|
|
|
|
|
|
|
|
|
|
|
|||||||||||||
| Net loss |
$ | (5,091 | ) | $ | (889 | ) | $ | (623 | ) | $ | (10,824 | ) | $ | (3,204 | ) | $ | (6,029 | ) | ||||||
|
|
|
|
|
|
|
|
|
|
|
|
|
|||||||||||||
| Net loss attributable to common stockholders | $ | (5,091 | ) | $ | (889 | ) | $ | (623 | ) | $ | (10,824 | ) | $ | (3,204 | ) | $ | (6,029 | ) | ||||||
|
|
|
|
|
|
|
|
|
|
|
|
|
|||||||||||||
| Net loss per share attributable to common stockholders:(2) | ||||||||||||||||||||||||
| Basic |
$ | (0.09 | ) | $ | (0.01 | ) | $ | (0.01 | ) | $ | (0.15 | ) | $ | (0.05 | ) | $ | (0.09 | ) | ||||||
|
|
|
|
|
|
|
|
|
|
|
|
|
|||||||||||||
| Diluted |
$ | (0.09 | ) | $ | (0.01 | ) | $ | (0.01 | ) | $ | (0.15 | ) | $ | (0.05 | ) | $ | (0.09 | ) | ||||||
|
|
|
|
|
|
|
|
|
|
|
|
|
|||||||||||||
| Weighted-average common shares outstanding:(2) |
||||||||||||||||||||||||
| Basic |
54,999,974 | 63,484,370 | 67,788,061 | 70,482,217 | 70,463,457 | 70,652,785 | ||||||||||||||||||
| Diluted |
54,999,974 | 63,484,370 | 67,788,061 | |
70,482,217 |
|
70,463,457 | 70,652,785 | ||||||||||||||||
| Pro forma net loss per share attributable to common stockholders, basic and diluted (unaudited):(3) | $ | $ | ||||||||||||||||||||||
|
|
|
|
|
|||||||||||||||||||||
| Pro forma weighted average common shares outstanding, basic and diluted (unaudited):(3) | ||||||||||||||||||||||||
|
|
|
|
|
|||||||||||||||||||||
52
Table of Contents
| (1) | Includes stock-based compensation expense and depreciation and amortization expense as follows: |
| Year Ended December 31, | Six Months Ended June 30, |
|||||||||||||||||||||||
| 2012 | 2013 | 2014 | 2015 | 2015 | 2016 | |||||||||||||||||||
| (in thousands) | ||||||||||||||||||||||||
| (unaudited) | ||||||||||||||||||||||||
| Stock-based compensation expense: |
||||||||||||||||||||||||
| Cost of revenue |
$ | 3 | $ | 48 | $ | 82 | $ | 150 | $ | 57 | $ | 89 | ||||||||||||
| Sales and marketing |
10 | 82 | 120 | 315 | 102 | 292 | ||||||||||||||||||
| Research and development |
424 | 28 | 147 | |
297 |
|
134 | 176 | ||||||||||||||||
| General and administrative |
1,859 | 18 | 27 | 760 | 65 | 849 | ||||||||||||||||||
|
|
|
|
|
|
|
|
|
|
|
|
|
|||||||||||||
| Total stock-based compensation expense |
$ | 2,296 | $ | 176 | $ | 376 | $ | 1,522 | $ | 358 | $ | 1,406 | ||||||||||||
|
|
|
|
|
|
|
|
|
|
|
|
|
|||||||||||||
| Depreciation and amortization expense: |
||||||||||||||||||||||||
| Cost of revenue |
$ | 2,481 | $ | 2,374 | $ | 1,615 | $ | 4,457 | $ | 1,826 | $ | 2,982 | ||||||||||||
| Sales and marketing |
23 | 46 | 101 | 227 | 76 | 115 | ||||||||||||||||||
| Research and development |
19 | 16 | 31 | 134 | 122 | 207 | ||||||||||||||||||
| General and administrative |
9 | 19 | 765 | 1,158 | 505 | 397 | ||||||||||||||||||
|
|
|
|
|
|
|
|
|
|
|
|
|
|||||||||||||
| Total depreciation and amortization expense |
$ | 2,532 | $ | 2,455 | $ | 2,512 | $ | 5,976 | $ | 2,529 | $ | 3,701 | ||||||||||||
|
|
|
|
|
|
|
|
|
|
|
|
|
|||||||||||||
| (2) | See notes (2) and (13) to our consolidated financial statements appearing elsewhere in this prospectus for further details on the calculation of basic and diluted net loss per share attributable to common stockholders. |
| (3) | Pro forma basic and diluted net loss per share represents net loss divided by the pro forma weighted-average shares of common stock outstanding and reflects (1) the repayment of $ million of outstanding principal and accrued interest under our revolving line of credit from the proceeds from our sale of shares of common stock in this offering at an assumed initial public offering price of $ per share, the midpoint of the price range set forth on the cover page of this prospectus, after deducting underwriting discounts and commissions and (2) our write-off of the associated debt issuance costs. Pro forma weighted-average shares outstanding reflects the conversion of all outstanding shares of our class A common stock and preferred stock (using the if-converted method) into common stock as though the conversion had occurred on the later of the first day of the relevant period and the date of issuance. |
| As of December 31, | As of June 30, 2016 |
|||||||||||
| 2014 | 2015 | |||||||||||
| (in thousands) | (unaudited) | |||||||||||
| Consolidated Balance Sheet Data: |
||||||||||||
| Cash |
$ | 4,412 | $ | 8,578 | $ | 1,048 | ||||||
| Accounts receivable, net |
11,252 | 15,699 | 17,213 | |||||||||
| Total assets |
40,066 | 53,509 | 48,892 | |||||||||
| Total deferred revenue |
28,844 | 40,467 | 43,520 | |||||||||
| Total debt |
6,863 | 16,970 | 15,462 | |||||||||
| Total liabilities |
45,393 | 69,560 | 69,747 | |||||||||
| Convertible preferred stock |
48 | 48 | 48 | |||||||||
| Class A common stock |
7 | 7 | 7 | |||||||||
| Common stock |
64 | 64 | 64 | |||||||||
| Accumulated deficit |
(67,508 | ) | (78,332 | ) | (84,361 | ) | ||||||
| Total stockholders’ deficit |
(5,327 | ) | (16,051 | ) | (20,855 | ) | ||||||
53
Table of Contents
MANAGEMENT’S DISCUSSION AND ANALYSIS OF FINANCIAL CONDITION
AND RESULTS OF OPERATIONS
You should read the following discussion and analysis of our financial condition and results of operations together with our consolidated financial statements and the related notes and other financial information included elsewhere in this prospectus. Some of the information contained in this discussion and analysis or set forth elsewhere in this prospectus, including information with respect to our plans and strategy for our business, includes forward-looking statements that involve risks and uncertainties. You should review the “Risk Factors” section of this prospectus for a discussion of important factors that could cause actual results to differ materially from the results described in or implied by the forward-looking statements contained in the following discussion and analysis.
Overview
We are a global software company that provides critical communications and enterprise safety applications that enable customers to automate and accelerate the process of keeping people safe and businesses running during critical events. During public safety threats such as active shooter situations, terrorist attacks or severe weather conditions, as well as critical business events such as IT outages or cyber incidents, our SaaS-based platform enables our customers to quickly and reliably aggregate and assess threat data, locate people at risk and responders able to assist, and automate the execution of pre-defined communications processes. Our customers use our platform to deliver intelligent, contextual messages to, and receive verification of delivery from, hundreds or millions of recipients, across multiple communications modalities such as voice, SMS and e-mail. Our applications enable the delivery of messages in near real-time to more than 100 different communication devices, in over 200 countries and territories, in 15 languages and dialects – all simultaneously. We delivered 1.1 billion communications in 2015. We automate the process of sending contextual notifications to multiple constituencies and receiving return information on a person’s or operations’s status so that organizations can act quickly and precisely. Our critical communication and enterprise safety applications include Mass Notification, Incident Management, IT Alerting, Safety Connection, Community Engagement, Secure Messaging and Internet of Things, and are easy-to-use and deploy, secure, highly scalable and reliable. We believe that our broad suite of integrated, enterprise applications delivered via a single global platform is a significant competitive advantage in the market for critical communications and enterprise safety solutions, which we refer to generally as critical communications.
Our customer base has grown from 867 customers at the end of 2011 to more than 3,000 customers as of July 31, 2016. As of July 31, 2016, our customers were based in 25 countries and included eight of the 10 largest U.S. cities, seven of the 10 largest U.S.-based investment banks, 24 of the 25 busiest North American airports, six of the 10 largest global auto makers, all four of the largest global accounting firms and four of the 10 largest U.S.-based health care providers. We provide our applications to customers of varying sizes, including enterprises, small businesses, non-profit organizations, educational institutions and governmental agencies. Our customers span a wide variety of industries including technology, energy, financial services, healthcare and life sciences, manufacturing, media and entertainment, retail, higher education and professional services.
We sell all of our critical communications applications on a subscription basis. We generally enter into contracts that range from one to three years in length, with an average contract duration of 2.1 years as of June 30, 2016, and generally bill and collect payment annually in advance. We derive most of our revenue from subscriptions to applications. Our subscription revenue represented 96%, 97% and 95% of our total revenue in 2013, 2014 and 2015, respectively. Historically, we derived more than 88% of our revenue in each of the last three fiscal years and the six months ended June 30, 2015 and 2016 from sales of our Mass Notification application. Our pricing model is based on the number of applications subscribed to and, per application, the number of people, locations and things connected to our platform as well as the volume of communications. We also offer premium services including data feeds for social media, threat intelligence and weather. We generate additional revenue by expanding the number of applications that our customers subscribe to and the number of contacts and devices connected to our platform.
54
Table of Contents
We generated revenue of $23.4 million, $30.0 million, $42.4 million and $58.7 million in 2012, 2013, 2014 and 2015, respectively, representing year-over-year increases of 29% in 2013, 41% in 2014 and 38% in 2015. We generated revenue of $27.3 million and $35.6 million in the six months ended June 30, 2015 and 2016, respectively, representing a period-over-period increase of 30%. We had net losses of $5.1 million, $0.9 million, $0.6 million and $10.8 million in 2012, 2013, 2014 and 2015, respectively. We had net losses of $3.2 million and $6.0 million for the six months ended June 30, 2015 and 2016, respectively. Our adjusted EBITDA, which is a measure that is not calculated and presented in accordance with generally accepted accounting principles in the United States, or GAAP, decreased from $2.2 million to $(3.4) million from 2013 to 2015 and was $(0.3) million and $(0.7) million for the six months ended June 30, 2015 and 2016, respectively. See note 2 to the table contained in “Summary Consolidated Financial and Other Data—Key Metrics” for a reconciliation of adjusted EBITDA to net loss, the most directly comparable financial measure calculated and presented in accordance with GAAP.
As of December 31, 2014, December 31, 2015 and June 30, 2016, 14%, 17% and 17% of our customers, respectively, were located outside of the United States and these customers generated 14%, 14% and 12% of our total revenue for 2014, 2015 and the six months ended June 30, 2016, respectively. We opened our first international office in Windsor, England in September 2012 as part of our geographic expansion and, in March 2014, we acquired Vocal Limited, or Vocal, a mass notification company based in Colchester, England.
We have focused on rapidly growing our business and believe that the future growth of our business is dependent on many factors, including our ability to increase the functionality of our platform and applications, expand our customer base, accelerate adoption of our applications beyond Mass Notification within our existing customer base and expand our international presence. Our future growth will also depend on the growth in the market for critical communications solutions and our ability to effectively compete. In order to further penetrate the market for critical communications solutions and capitalize on what we believe to be a significant opportunity, we intend to continue to invest in research and development, build-out our data center infrastructure and services capabilities and hire additional sales representatives, both domestically and internationally, to drive sales to new customers and incremental sales of new applications to existing customers. Nevertheless, we expect to continue to incur losses in the near term and, if we are unable to achieve our growth objectives, we may not be able to achieve profitability.
Recent Acquisitions
We have in the past pursued, and plan to selectively pursue in the future, acquisitions of complementary businesses, technologies and teams that allow us to add new features and functionalities to our platform and accelerate the pace at which we can bring new applications and features to market.
In March 2014, we acquired Vocal for cash consideration of $2.0 million, notes payable of $4.3 million and 2,252,451 shares of our common stock. Vocal is a United Kingdom-based provider of emergency notification services that help enterprises and governmental entities communicate, plan and manage their responses to any business-affecting situation or day-to-day communication requirement.
In December 2014, we acquired technology through an acquisition from Tapestry Telemed LLC, or Telemed, for cash consideration of $1.4 million, notes payable of $1.4 million and 693,140 shares of our common stock. The technology, which we refer to as HipaaBridge, was acquired in order for us to develop an application that provides secure messaging within health care organizations in a manner intended to comply with the requirements of the federal Health Insurance Portability and Accountability Act, or HIPAA.
In December 2014, we acquired the assets of Nixle LLC, or Nixle, for cash consideration of $1.5 million and 1,858,275 shares of our common stock. The Nixle notification service allows governmental agencies to send notification messages to local residents via phone, email and the web.
Presentation of Financial Statements
Our consolidated financial statements include the accounts of our wholly-owned subsidiaries. Business acquisitions are included in our consolidated financial statements from the date of the acquisition. Our purchase
55
Table of Contents
accounting resulted in all assets and liabilities of acquired businesses being recorded at their estimated fair values on the acquisition dates. All intercompany balances and transactions have been eliminated in consolidation.
We report our financial results as one operating segment. Our operating results are regularly reviewed on a consolidated basis by our chief executive officer, who is our chief operating decision maker, principally to make strategic decisions regarding how we allocate our resources and to assess our consolidated operating performance.
Key Metrics
We regularly monitor a number of financial and operating metrics in order to measure our current performance and estimate our future performance. Our key business metrics may be calculated in a manner different than similar key business metrics used by other companies.
| Year Ended December 31, | Six Months Ended June 30, |
|||||||||||||||||||
| 2013 | 2014 | 2015 | 2015 | 2016 | ||||||||||||||||
| (dollars in thousands) | ||||||||||||||||||||
| Revenue retention rate |
112 | % | 111 | % | 112 | % | 112 | % | 116 | % | ||||||||||
| Adjusted EBITDA |
$ | 2,152 | $ | 2,524 | $ | (3,351 | ) | $ | (261 | ) | $ | (721 | ) | |||||||
| Adjusted gross margin |
$ | 21,412 | $ | 30,663 | $ | 41,084 | $ | 19,064 | $ | 25,757 | ||||||||||
| Free cash flow |
$ | 2,548 | $ | 3,884 | $ | (2,953 | ) | $ | (1,009 | ) | $ | (5,077 | ) | |||||||
| • | Revenue Retention Rate. We calculate our revenue retention rate by dividing (1) total revenue in the current 12-month period from those customers who were customers during the prior 12-month period by (2) total revenue from all customers in the prior 12-month period. For the purposes of calculating our revenue retention rate, we count as customers all entities with whom we had contracts in the applicable period other than (1) customers of our wholly-owned subsidiary, Microtech, which generates an immaterial amount of our revenue in any given year and (2) in the first year following our acquisition of another business, customers that we acquired in connection with such acquisition. We believe that our ability to retain our customers and expand their use of our solutions over time is an indicator of the stability of our revenue base and the long-term value of our customer relationships. Our revenue retention rate provides insight into the impact on current period revenue of the number of new customers acquired during the prior 12-month period, the timing of our implementation of those new customers, growth in the usage of our solutions by our existing customers and customer attrition. If our revenue retention rate for a period exceeds 100%, this means that the revenue retained during the period including upsells more than offset the revenue that we lost from customers that did not renew their contracts during the period. Our revenue retention rate may decline or fluctuate as a result of a number of factors, including customers’ satisfaction or dissatisfaction with our platform and applications, pricing, economic conditions or overall reductions in our customers’ spending levels. |
| • | Adjusted EBITDA. Adjusted EBITDA represents our net loss before interest income and interest expense, income tax expense and benefit, depreciation and amortization expense and stock-based compensation expense. We do not consider these items to be indicative of our core operating performance. The items that are non-cash include depreciation and amortization expense and stock-based compensation expense. Adjusted EBITDA is a key measure used by management to understand and evaluate our core operating performance and trends and to generate future operating plans, make strategic decisions regarding the allocation of capital and invest in initiatives that are focused on cultivating new markets for our solution. In particular, the exclusion of certain expenses in calculating adjusted EBITDA facilitates comparisons of our operating performance on a period-to-period basis. Adjusted EBITDA is not a measure calculated in accordance with GAAP. See note 2 to the table contained in “Summary Consolidated Financial and Other Data—Key Metrics” for a reconciliation of adjusted EBITDA to net loss, the most directly comparable financial measure calculated and presented in accordance with GAAP for 2013, 2014 and 2015, and for the six months ended June 30, 2015 and 2016, and a discussion of the limitations of adjusted EBITDA. |
| • | Adjusted Gross Margin. Adjusted gross margin represents gross profit plus stock-based compensation and amortization expenses related to acquisitions. Adjusted gross margin is a key measure used by |
56
Table of Contents
| management to understand and evaluate our core operating performance and trends and to generate future operating plans. The exclusion of stock-based compensation and amortization expenses related to acquisitions facilitates comparisons of our operating performance on a period-to-period basis. In the near term, we expect these expenses to continue to negatively impact our gross profit. Adjusted gross margin is not a measure calculated in accordance with GAAP. See note 3 to the table contained in “Summary Consolidated Financial and Other Data—Key Metrics” for a reconciliation of adjusted gross margin and a reconciliation of adjusted gross margin to gross profit, the most comparable GAAP measurement, for 2013, 2014 and 2015, and for the six months ended June 30, 2015 and 2016, and a discussion of the limitations of adjusted gross margin. |
| • | Free Cash Flow. Free cash flow represents net cash provided by (used in) operating activities minus capital expenditures and capitalized software development costs. Free cash flow is a key measure used by management to understand and evaluate our core operating performance and trends and to generate future operating plans. The exclusion of capital expenditures and amounts capitalized for internally- developed software facilitates comparisons of our operating performance on a period-to-period basis and excludes items that we do not consider to be indicative of our core operating performance. Free cash flow is not a measure calculated in accordance with GAAP. See note 4 to the table contained in “Summary Consolidated Financial and Other Data—Key Metrics” for a reconciliation of free cash flow to net cash for operating activities, the most comparable GAAP measurement, for 2013, 2014 and 2015, and for the six months ended June 30, 2015 and 2016, and a discussion of the limitations of free cash flow. |
Components of Results of Operations
Revenue
We derive substantially all of our revenue from the sale of subscriptions to our critical communications applications.
We generally bill and collect payment for our subscriptions annually in advance. All revenue billed in advance of services being delivered is recorded in deferred revenue. The initial subscription period typically ranges from one to three years. We offer varying levels of customer support based on customer needs and the complexity of their businesses, including the level of usage by a customer in terms of minutes or the amount of data used to transmit the notifications. Our pricing model is based on the number of applications subscribed to and, per application, the number of people, locations and things connected to our platform as well as the volume of communications. We also offer premium services including data feeds for social media, threat intelligence and weather. We generate additional revenue by expanding the number of premium features and applications that our customers subscribe to and the number of contacts connected to our platform.
We generate an immaterial amount of revenue from set-up fees, which consist of participant process mapping, configuration, customer data migration and integration. We also sell professional services, which have been immaterial to date.
Cost of Revenue
Cost of revenue includes expenses related to the fulfillment of our subscription services, consisting primarily of employee-related expenses for data center operations and customer support, including salaries, bonuses, benefits and stock-based compensation expense. Cost of revenue also includes hosting costs, messaging costs and depreciation and amortization. As we add data center capacity and support personnel in advance of anticipated growth, our cost of revenue will increase and, if anticipated revenue growth does not occur, our gross profit will be adversely affected.
Operating Expenses
Operating expenses consist of sales and marketing, research and development and general and administrative expenses. Salaries, bonuses, stock-based compensation expense and other personnel costs are the most significant
57
Table of Contents
components of each of these expense categories. We include stock-based compensation expense incurred in connection with the grant of stock options to the applicable operating expense category based on the equity award recipient’s functional area.
Sales and Marketing
Sales and marketing expense primarily consists of employee-related expenses for sales, marketing and public relations employees, including salaries, bonuses, commissions, benefits and stock-based compensation expense. Sales and marketing expense also includes trade show, market research, advertising and other related marketing expense as well as office related costs to support sales. We defer certain sales commissions related to acquiring new customers and amortize these expenses ratably over the term of the corresponding subscription agreement. We plan to continue to expand our sales and marketing functions to grow our customer base and increase sales to existing customers. This growth will include adding sales personnel and expanding our marketing activities to continue to generate additional leads and build brand awareness. In the near term, we expect our sales and marketing expense to increase on an absolute dollars basis as we hire new sales representatives in the United States and worldwide and grow our marketing staff.
Research and Development
Research and development expense primarily consists of employee-related expenses for research and development staff, including salaries, bonuses, benefits and stock-based compensation expense. Research and development expense also includes the cost of certain third-party service providers, office related costs to support research and development activities and hosting costs. We capitalize certain software development costs that are attributable to developing new applications and adding incremental functionality to our platform and amortize these costs over the estimated life of the new application or incremental functionality, which is generally three years. We focus our research and development efforts on improving our applications, developing new applications and delivering new functionality. In the near term, we expect our research and development expense to increase on an absolute dollar basis as we continue to increase the functionality of our platform and applications.
General and Administrative
General and administrative expense primarily consists of employee-related expenses for administrative, legal, finance and human resource personnel, including salaries, bonuses, benefits and stock-based compensation expense. General and administrative expense also includes professional fees, insurance premiums, corporate expenses, transaction-related costs, facility costs, depreciation and amortization and software license costs. In the near term, we expect our general and administrative expense to increase on an absolute dollar basis as we incur the costs associated with being a publicly traded company.
Interest Income
Interest income consists of interest earned on our cash balances held at financial institutions.
Interest Expense
Interest expense consists of interest on our outstanding debt obligations, interest on our capital leases and accretion of interest resulting from a discount on the fair value of notes payable issued in connection with the acquisition of Vocal and the acquisition of the HipaaBridge technology from Telemed.
Other Expense, Net
Other expense, net consists primarily of realized foreign currency gains and losses. The acquisition of Vocal in 2014 has increased our exposure to foreign currencies, particularly the British pound.
58
Table of Contents
Results of Operations
The following table sets forth our selected consolidated statements of operations data:
| Year Ended December 31, |
Six Months Ended June 30, |
|||||||||||||||||||
| 2013 | 2014 | 2015 | 2015 | 2016 | ||||||||||||||||
| (in thousands) | ||||||||||||||||||||
| (unaudited) | ||||||||||||||||||||
| Consolidated Statements of Operations Data: |
||||||||||||||||||||
| Revenue |
$ | 30,040 | $ | 42,421 | $ | 58,720 | $ | 27,313 | $ | 35,634 | ||||||||||
| Cost of revenue:(1) |
8,699 | 12,089 | 19,789 | 9,045 | 11,151 | |||||||||||||||
|
|
|
|
|
|
|
|
|
|
|
|||||||||||
| Gross profit |
21,341 | 30,332 | 38,931 | 18,268 | 24,483 | |||||||||||||||
|
|
|
|
|
|
|
|
|
|
|
|||||||||||
| Operating expenses:(1) |
||||||||||||||||||||
| Sales and marketing |
11,695 | 15,818 | 25,925 | 11,337 | 17,054 | |||||||||||||||
| Research and development |
5,697 | 7,365 | 11,521 | 5,469 | 6,643 | |||||||||||||||
| General and administrative |
4,352 | 7,435 | 12,272 | 4,578 | 6,586 | |||||||||||||||
|
|
|
|
|
|
|
|
|
|
|
|||||||||||
| Total operating expense |
21,744 | 30,618 | 49,718 | 21,384 | 30,283 | |||||||||||||||
|
|
|
|
|
|
|
|
|
|
|
|||||||||||
| Operating loss |
(403 | ) | (286 | ) | (10,787 | ) | (3,116 | ) | (5,800 | ) | ||||||||||
| Other expense, net |
368 | 426 | 599 | 276 | 339 | |||||||||||||||
|
|
|
|
|
|
|
|
|
|
|
|||||||||||
| Loss before (provision for) benefit from income taxes | (771 | ) | (712 | ) | (11,386 | ) | (3,392 | ) | (6,139 | ) | ||||||||||
| (Provision for) benefit from income taxes |
(118 | ) | 89 | 562 | 188 | 110 | ||||||||||||||
|
|
|
|
|
|
|
|
|
|
|
|||||||||||
| Net loss |
$ | (889 | ) | $ | (623 | ) | $ | (10,824 | ) | $ | (3,204 | ) | $ | (6,029 | ) | |||||
|
|
|
|
|
|
|
|
|
|
|
|||||||||||
| (1) | Includes stock-based compensation expense and depreciation and amortization expense as follows: |
| Year Ended December 31, |
Six Months Ended June 30, |
|||||||||||||||||||
| 2013 | 2014 | 2015 | 2015 | 2016 | ||||||||||||||||
|
|
|
|
|
|
|
|||||||||||||||
| (in thousands) | ||||||||||||||||||||
| (unaudited) | ||||||||||||||||||||
| Stock-based compensation expense: |
||||||||||||||||||||
| Cost of revenue |
$ | 48 | $ | 82 | $ | 150 | $ | 57 | $ | 89 | ||||||||||
| Sales and marketing |
82 | 120 | 315 | 102 | 292 | |||||||||||||||
| Research and development |
28 | 147 | 297 | 134 | 176 | |||||||||||||||
| General and administrative |
18 | 27 | 760 | 65 | 849 | |||||||||||||||
|
|
|
|
|
|
|
|
|
|
|
|||||||||||
| Total stock-based compensation expense |
$ | 176 | $ | 376 | $ | 1,522 | $ | 358 | 1,406 | |||||||||||
|
|
|
|
|
|
|
|
|
|
|
|||||||||||
| Depreciation and amortization expense: |
||||||||||||||||||||
| Cost of revenue |
$ | 2,374 | $ | 1,615 | $ | 4,457 | $ | 1,826 | $ | 2,982 | ||||||||||
| Sales and marketing |
46 | 101 | 227 | 76 | 115 | |||||||||||||||
| Research and development |
16 | 31 | 134 | 122 | 207 | |||||||||||||||
| General and administrative |
19 | 765 | 1,158 | 505 | 397 | |||||||||||||||
|
|
|
|
|
|
|
|
|
|
|
|||||||||||
| Total depreciation and amortization expense |
$ | 2,455 | $ | 2,512 | $ | 5,976 | $ | 2,529 | $ | 3,701 | ||||||||||
|
|
|
|
|
|
|
|
|
|
|
|||||||||||
59
Table of Contents
The following table sets forth our selected consolidated statements of operations data expressed as a percentage of total revenue:
| Year Ended December 31, |
Six Months Ended June 30, |
|||||||||||||||||||
| 2013 | 2014 | 2015 | 2015 | 2016 | ||||||||||||||||
| (unaudited) | ||||||||||||||||||||
| Consolidated Statements of Operations Data: |
||||||||||||||||||||
| Revenue |
100 | % | 100 | % | 100% | 100 | % | 100 | % | |||||||||||
| Cost of revenue: |
29 | 28 | 34 | 33 | 31 | |||||||||||||||
|
|
|
|
|
|
|
|
|
|
|
|||||||||||
| Gross profit |
71 | 72 | 66 | 67 | 69 | |||||||||||||||
|
|
|
|
|
|
|
|
|
|
|
|||||||||||
| Operating expenses: |
||||||||||||||||||||
| Sales and marketing |
39 | 37 | 44 | 42 | 48 | |||||||||||||||
| Research and development |
19 | 17 | 20 | 20 | 19 | |||||||||||||||
| General and administrative |
14 | 18 | 20 | 16 | 18 | |||||||||||||||
|
|
|
|
|
|
|
|
|
|
|
|||||||||||
| Total operating expense |
72 | 72 | 84 | 78 | 85 | |||||||||||||||
|
|
|
|
|
|
|
|
|
|
|
|||||||||||
| Operating loss |
(1 | ) | — | (18 | ) | (11 | ) | (16 | ) | |||||||||||
| Other expense, net |
1 | 1 | 1 | 1 | 1 | |||||||||||||||
|
|
|
|
|
|
|
|
|
|
|
|||||||||||
| Loss before (provision for) benefit from income taxes |
(2 | ) | (1 | ) | (19 | ) | (12 | ) | (17 | ) | ||||||||||
| (Provision for) benefit from income taxes |
— | — | 1 | — | — | |||||||||||||||
|
|
|
|
|
|
|
|
|
|
|
|||||||||||
| Net loss |
(2 | )% | (1 | )% | (18 | )% | (12 | )% | (17 | )% | ||||||||||
|
|
|
|
|
|
|
|
|
|
|
|||||||||||
Six Months Ended June 30, 2015 and 2016 (unaudited)
Revenue
| Six Months Ended June 30, |
2015 v. 2016 Change | |||||||||||||||
| 2015 | 2016 | $ | % | |||||||||||||
| (dollars in thousands) | ||||||||||||||||
| Revenue |
$ | 27,313 | $ | 35,634 | $ | 8,321 | 30.5 | % | ||||||||
Revenue increased by $8.3 million for the six months ended June 30, 2016 compared to the same period in 2015. The increase was due to a $8.3 million increase in sales of our solutions driven by expansion of our customer base from 2,391 customers as of June 30, 2015 to 2,981 as of June 30, 2016, including increased sales to larger organizations with greater numbers of contacts and locations.
Cost of Revenue
| Six Months Ended June 30, |
2015 v. 2016 Change | |||||||||||||||
| 2015 | 2016 | $ | % | |||||||||||||
| (dollars in thousands) | ||||||||||||||||
| Cost of revenue |
$ | 9,045 | $ | 11,151 | $ | 2,106 | 23.3 | % | ||||||||
| Gross margin % |
67 | % | 69 | % | ||||||||||||
Cost of revenue increased by $2.1 million for the six months ended June 30, 2016 compared to the same period in 2015. The increase was primarily due to a $1.2 million increase in depreciation and amortization expense attributable to our acquired intangible assets, a $0.6 million increase in employee-related costs associated with our increased headcount from 83 employees as of June 30, 2015 to 94 employees as of June 30, 2016 and a $0.3 million increase in messaging costs.
60
Table of Contents
Gross margin percentage increased due to an increase in revenue, primarily offset by an increase in amortization of acquired intangible assets and capitalized software, as well as our continued investment in personnel to support our growth.
Operating Expenses
Sales and Marketing Expense
| Six Months Ended June 30, |
2015 v. 2016 Change | |||||||||||||||
| 2015 | 2016 | $ | % | |||||||||||||
| (dollars in thousands) | ||||||||||||||||
| Sales and marketing |
$ | 11,337 | $ | 17,054 | $ | 5,717 | 50.4 | % | ||||||||
| % of revenue |
42 | % | 48 | % | ||||||||||||
Sales and marketing expense increased by $5.7 million for the six months ended June 30, 2016 compared to the same period in 2015. The increase was primarily due to a $4.9 million increase in employee-related costs associated with our increased headcount from 134 employees as of June 30, 2015 to 168 employees as of June 30, 2015. The remaining increase was principally the result of a $0.5 million increase in advertising costs and a $0.3 million increase in office related expense to support our sales team.
Research and Development Expense
| Six Months Ended June 30, |
2015 v. 2016 Change | |||||||||||||||
| 2015 | 2016 | $ | % | |||||||||||||
| (dollars in thousands) | ||||||||||||||||
| Research and development |
$ | 5,469 | $ | 6,643 | $ | 1,174 | 21.5 | % | ||||||||
| % of revenue |
20 | % | 19 | % | ||||||||||||
Research and development expense increased by $1.2 million for the six months ended June 30, 2016 compared to the same period in 2015. The increase was primarily due to a $2.0 million increase in employee-related costs associated with our increased headcount from 99 employees as of June 30, 2015 to 111 employees as of June 30, 2016. The remaining increase was principally the result of a $0.2 million increase in software subscriptions to support research and development activities. A total of $2.0 million of internally developed software costs during the six months ended June 30, 2015 and $3.1 million of internally developed software costs during the six months ended June 30, 2016 were capitalized, resulting in a reduction of the expense by $1.1 million in the 2016 period.
General and Administrative Expense
| Six Months Ended June 30, |
2015 v. 2016 Change | |||||||||||||||
| 2015 | 2016 | $ | % | |||||||||||||
| (dollars in thousands) | ||||||||||||||||
| General and administrative |
$ | 4,578 | $ | 6,586 | $ | 2,008 | 43.9 | % | ||||||||
| % of revenue |
16 | % | 18 | % | ||||||||||||
General and administrative expense increased by $2.0 million for the six months ended June 30, 2016 compared to the same period in 2015. The increase was primarily due to a $1.7 million increase in employee-related costs associated with our increased headcount from 53 employees as of June 30, 2015 to 57 employees as of June 30, 2016. The remaining increase was the result of a $0.1 million increase in professional fees due to increased legal, accounting and audit services, a $0.1 million increase in facilities costs and a $0.1 million increase in software subscriptions to support our operations.
61
Table of Contents
Other Expense, Net
| Six Months Ended June 30, |
2015 v. 2016 Change | |||||||||||||||
| 2015 | 2016 | $ | % | |||||||||||||
| (dollars in thousands) | ||||||||||||||||
| Other expense, net |
$ | 276 | $ | 339 | $ | 63 | 22.8 | % | ||||||||
| % of revenue |
1 | % | 1 | % | ||||||||||||
Other expense, net remained relatively consistent for the six months ended June 30, 2016 compared to the same period in 2015 as there were no significant changes to the interest expense related to our line of credit in the two periods.
Years Ended December 31, 2013, 2014 and 2015
Revenue
| Year Ended December 31, | 2013 v. 2014 Change | 2014 v. 2015 Change | ||||||||||||||||||||||||||
| 2013 | 2014 | 2015 | $ | % | $ | % | ||||||||||||||||||||||
| (dollars in thousands) | ||||||||||||||||||||||||||||
| Revenue |
$ | 30,040 | $ | 42,421 | $ | 58,720 | $ | 12,381 | 41.2 | % | $ | 16,299 | 38.4 | % | ||||||||||||||
2014 Compared to 2015
Revenue increased by $16.3 million in 2015 compared to 2014. The increase was primarily due to a $14.0 million increase in sales of our solutions driven by expansion of our customer base from 2,167 customers as of December 31, 2014 to 2,662 as of December 31, 2015, including increased sales to larger organizations with greater numbers of contacts and locations. In 2015, we also had a $2.3 million increase in revenue attributable to the acquisition of Nixle, which occurred in December 2014.
2013 Compared to 2014
Revenue increased by $12.4 million in 2014 compared to 2013. The increase was primarily due to a $9.2 million increase in sales of our solutions driven by the expansion of our customer base and increased sales to larger organizations with greater numbers of contacts and locations, as well as $3.2 million of revenue attributable to the acquisition of Vocal. We grew our customer base from 1,285 as of December 31, 2013 to 2,167 as of December 31, 2014, inclusive of 338 customers acquired in connection with our acquisition of Vocal and 277 customers acquired in connection with our acquisition of Nixle in March 2014 and December 2014, respectively.
Cost of Revenue
| Year Ended December 31, | 2013 v. 2014 Change | 2014 v. 2015 Change | ||||||||||||||||||||||||||
| 2013 | 2014 | 2015 | $ | % | $ | % | ||||||||||||||||||||||
| (dollars in thousands) | ||||||||||||||||||||||||||||
| Cost of revenue |
$ | 8,699 | $ | 12,089 | $ | 19,789 | $ | 3,390 | 39.0 | % | $ | 7,700 | 63.7 | % | ||||||||||||||
| Gross margin % |
71 | % | 72 | % | 66 | % | ||||||||||||||||||||||
62
Table of Contents
2014 Compared to 2015
Cost of revenue increased by $7.7 million in 2015 compared to 2014. The increase was primarily due to a $2.7 million increase in employee-related costs associated with our increased headcount from 72 employees as of December 31, 2014 to 90 employees as of December 31, 2015. The remaining increase was principally the result of a $2.8 million increase in depreciation and amortization expense attributable to our acquired intangible assets, a $1.8 million increase in hosting and messaging costs and a $0.3 million increase in office related expenses.
Gross margin percentage decreased due to an increase in amortization of acquired intangible assets and capitalized software, as well as our continued investment in personnel to support our growth.
2013 Compared to 2014
Cost of revenue increased by $3.4 million in 2014 compared to 2013. The increase was primarily due to a $2.2 million increase in employee-related costs associated with our increase in headcount from 42 employees as of December 31, 2013 to 72 employees as of December 31, 2014. The remaining increase was principally the result of a $1.8 million increase in hosting and messaging costs and a $0.2 million increase in office related expenses. These increases were offset by a decrease in depreciation and amortization of $0.8 million as a result of lower amortization of software development costs and our termination of a license with a vendor.
Gross margin percentage increased due to an increase in revenue and a decrease in the growth of infrastructure costs as a percentage of revenue.
Operating Expense
Sales and Marketing Expense
| Year Ended December 31, | 2013 v. 2014 Change | 2014 v. 2015 Change | ||||||||||||||||||||||||||
| 2013 | 2014 | 2015 | $ | % | $ | % | ||||||||||||||||||||||
| (dollars in thousands) | ||||||||||||||||||||||||||||
| Sales and marketing |
$ | 11,695 | $ | 15,818 | $ | 25,925 | $ | 4,123 | 35.3 | % | $ | 10,107 | 63.9 | % | ||||||||||||||
| % of revenue |
39 | % | 37 | % | 44 | % | ||||||||||||||||||||||
2014 Compared to 2015
Sales and marketing expense increased by $10.1 million in 2015 compared to 2014. The increase was primarily due to a $8.1 million increase in employee-related costs associated with our increased headcount from 104 employees as of December 31, 2014 to 157 employees as of December 31, 2015. The remaining increase was principally the result of a $0.9 million increase in office related costs to support sales and a $1.1 million increase in trade show and advertising costs.
2013 Compared to 2014
Sales and marketing expense increased by $4.1 million in 2014 compared to 2013. The increase was primarily due to a $3.5 million increase in employee-related costs associated with our increased headcount from 69 employees as of December 31, 2013 to 104 employees as of December 31, 2014. The remaining increase was attributable to a $0.2 million increase in office related costs to support sales and a $0.4 million increase in trade show and marketing expenses.
Research and Development Expense
| Year Ended December 31, | 2013 v. 2014 Change | 2014 v. 2015 Change | ||||||||||||||||||||||||||
| 2013 | 2014 | 2015 | $ | % | $ | % | ||||||||||||||||||||||
| (dollars in thousands) | ||||||||||||||||||||||||||||
| Research and development |
$ | 5,697 | $ | 7,365 | $ | 11,521 | $ | 1,668 | 29.3 | % | $ | 4,156 | 56.4 | % | ||||||||||||||
| % of revenue |
19 | % | 17 | % | 20 | % | ||||||||||||||||||||||
63
Table of Contents
2014 Compared to 2015
Research and development expense increased by $4.2 million in 2015 compared to 2014. The increase was primarily due to a $6.5 million increase in employee-related costs associated with our increased headcount from 83 employees as of December 31, 2014 to 109 employees as of December 31, 2015. The remaining increase was principally the result of a $0.9 million increase in office and software related cost to support research and development activities. A total of $4.8 million of internally-developed software costs during 2015 and $1.6 million of internally-developed software costs during 2014 were capitalized, resulting in a reduction of the expense by $3.2 million in 2015.
2013 Compared to 2014
Research and development expense increased by $1.7 million in 2014 compared to 2013. The increase was primarily due to a $2.6 million increase in employee-related costs associated with our increased headcount from 54 employees as of December 31, 2013 to 83 employees as of December 31, 2014 and a $0.2 million increase in office related expenses to support research and development activities. A total of $1.7 million of internally-developed software costs during 2014 and $0.8 million of internally-developed software costs during 2013 were capitalized, resulting in a reduction of the expense by $0.9 million in 2014.
General and Administrative Expense
| Year Ended December 31, | 2013 v. 2014 Change | 2014 v. 2015 Change | ||||||||||||||||||||||||||
| 2013 | 2014 | 2015 | $ | % | $ | % | ||||||||||||||||||||||
| (dollars in thousands) | ||||||||||||||||||||||||||||
| General and administrative |
$ | 4,352 | $ | 7,435 | $ | 12,272 | $ | 3,083 | 70.8 | % | $ | 4,837 | 65.1 | % | ||||||||||||||
| % of revenue |
14 | % | 18 | % | 20 | % | ||||||||||||||||||||||
2014 Compared to 2015
General and administrative expense increased by $4.8 million in 2015 compared to 2014. The increase was primarily due to a $2.5 million increase in employee-related costs associated with our increased headcount from 44 employees as of December 31, 2014 to 62 employees as of December 31, 2015. The remaining increase was the result of a $1.7 million increase in professional fees due to increased legal, accounting and audit services to support our operations and our preparations to become a public company, a $0.4 million increase in office related expenses and a $0.4 million increase in depreciation and amortization expense related to equipment. These increases were offset by a $0.2 million decrease in legal and transaction-related costs in 2015.
2013 Compared to 2014
General and administrative expense increased by $3.1 million in 2014 compared to 2013. The increase was primarily due to a $1.6 million increase in employee-related costs associated with our increased headcount from 24 employees as of December 31, 2013 to 44 employees as of December 31, 2014. The remaining increase was attributable to a $0.2 million increase in facility costs, as we opened new offices and expanded certain of our existing facilities to accommodate our increase in personnel, and a $0.7 million increase in depreciation and amortization expense related to equipment and intangible assets, as well as $0.6 million of transaction costs incurred in connection with the two acquisitions that we completed in 2014.
Other Expense, Net
| Year Ended December 31, | 2013 v. 2014 Change | 2014 v. 2015 Change | ||||||||||||||||||||||||||
| 2013 | 2014 | 2015 | $ | % | $ | % | ||||||||||||||||||||||
| (dollars in thousands) | ||||||||||||||||||||||||||||
| Other expense, net |
$ | 368 | $ | 426 | $ | 599 | $ | 58 | 15.8% | $ | 173 | 40.6 | % | |||||||||||||||
| % of revenue |
1 | % | 1 | % | 1 | % | ||||||||||||||||||||||
64
Table of Contents
2014 Compared to 2015
Other expense, net increased by $0.2 million in 2015 compared to 2014 as a result of increased interest expense related to accretion of interest on our notes payable, interest expense due under our term loan and revolving line of credit.
2013 Compared to 2014
Other expense, net remained relatively consistent and was not significant for 2013 or 2014.
Quarterly Results of Operations
The following table sets forth our unaudited quarterly consolidated statements of operations data for each of the ten quarters in the period ended June 30, 2016. We have prepared the quarterly financial data on the same basis as the audited consolidated financial statements included in this prospectus. In our opinion, the quarterly financial data reflects all adjustments, consisting only of normal recurring adjustments, which we consider necessary for a fair presentation of this data. This quarterly financial data should be read in conjunction with our consolidated financial statements and related notes included elsewhere in this prospectus. Our historical results are not necessarily indicative of the results to be expected in the future.
| Three Months Ended | ||||||||||||||||||||||||||||||||||||||||
| March 31, 2014 |
June 30, 2014 |
September 30, 2014 |
December 31, 2014 |
March 31, 2015 |
June 30, 2015 |
September 30, 2015 |
December 31, 2015 |
March 31, 2016 |
June 30, 2016 |
|||||||||||||||||||||||||||||||
| Consolidated Statements of Operations Data: |
||||||||||||||||||||||||||||||||||||||||
| Revenue |
$ | 8,798 | $ | 10,680 | $ | 11,255 | $ | 11,688 | $ | 13,160 | $ | 14,153 | $ | 15,187 | $ | 16,220 | $ | 17,069 | 18,565 | |||||||||||||||||||||
| Cost of revenue: |
2,350 | 2,971 | 3,353 | 3,415 | 4,126 | 4,919 | 5,165 | 5,579 | 5,475 | 5,676 | ||||||||||||||||||||||||||||||
|
|
|
|
|
|
|
|
|
|
|
|
|
|
|
|
|
|
|
|
|
|||||||||||||||||||||
| Gross profit |
6,448 | 7,709 | 7,902 | 8,273 | 9,034 | 9,234 | 10,022 | 10,641 | 11,594 | 12,889 | ||||||||||||||||||||||||||||||
|
|
|
|
|
|
|
|
|
|
|
|
|
|
|
|
|
|
|
|
|
|||||||||||||||||||||
| Operating expenses: |
||||||||||||||||||||||||||||||||||||||||
| Sales and marketing |
3,167 | 3,874 | 3,981 | 4,796 | 5,512 | 5,825 | 6,761 | 7,827 | 8,205 | 8,849 | ||||||||||||||||||||||||||||||
| Research and development |
1,464 | 1,612 | 2,021 | 2,268 | 2,687 | 2,782 | 3,025 | 3,027 | 3,180 | 3,463 | ||||||||||||||||||||||||||||||
| General and administrative |
1,352 | 1,837 | 1,738 | 2,508 | 2,041 | 2,537 | 3,863 | 3,831 | 3,458 | 3,128 | ||||||||||||||||||||||||||||||
|
|
|
|
|
|
|
|
|
|
|
|
|
|
|
|
|
|
|
|
|
|||||||||||||||||||||
| Total operating expense |
5,983 | 7,323 | 7,740 | 9,572 | 10,240 | 11,144 | 13,649 | 14,685 | 14,843 | 15,440 | ||||||||||||||||||||||||||||||
|
|
|
|
|
|
|
|
|
|
|
|
|
|
|
|
|
|
|
|
|
|||||||||||||||||||||
| Operating income (loss) |
465 | 386 | 162 | (1,299 | ) | (1,206 | ) | (1,910 | ) | (3,627 | ) | (4,044 | ) | (3,249 | ) | (2,551 | ) | |||||||||||||||||||||||
| Other income (expense), net |
(82 | ) | (113 | ) | (98 | ) | (133 | ) | (131 | ) | (145 | ) | (180 | ) | (143 | ) | (131 | ) | (208 | ) | ||||||||||||||||||||
|
|
|
|
|
|
|
|
|
|
|
|
|
|
|
|
|
|
|
|
|
|||||||||||||||||||||
| Income (loss) before (provision for) benefit from income taxes |
383 | 273 | 64 | (1,432 | ) | (1,337 | ) | (2,055 | ) | (3,807 | ) | (4,187 | ) | (3,380 | ) | (2,759 | ) | |||||||||||||||||||||||
| (Provision for) benefit from income taxes |
(57 | ) | (41 | ) | (9 | ) | 196 | (24 | ) | 212 | 186 | 188 | 155 | (45 | ) | |||||||||||||||||||||||||
|
|
|
|
|
|
|
|
|
|
|
|
|
|
|
|
|
|
|
|
|
|||||||||||||||||||||
| Net income (loss) |
$ | 326 | $ | 232 | $ | 55 | $ | (1,236 | ) | $ | (1,361 | ) | $ | (1,843 | ) | $ | (3,621 | ) | $ | (3,999 | ) | $ | (3,225 | ) | (2,804 | ) | ||||||||||||||
|
|
|
|
|
|
|
|
|
|
|
|
|
|
|
|
|
|
|
|
|
|||||||||||||||||||||
Quarterly Trends
The sequential increases in our quarterly revenue was due primarily to increases in our number of new customers as well as increased revenue from existing customers as they expanded their use of our solutions.
Our operating expenses generally have increased sequentially for the periods presented due primarily to increases in headcount and other related expenses to support our growth. We anticipate our operating expenses will continue to increase in absolute dollar terms as we invest in the long-term growth of our business.
65
Table of Contents
Our gross profit has increased sequentially for the periods presented due primarily to greater growth in revenue than expenses, which expenses are primarily related to our increase in headcount as we invest in the growth of our business. This increase in revenue was partially offset by increases in amortization expense attributed to our acquisitions and capitalized software development costs.
Liquidity and Capital Resources
To date, we have financed our operations primarily through cash from operating activities, along with equity issuances and debt financing arrangements. Our principal source of liquidity is cash totaling $8.6 million and $1.0 million as of December 31, 2015 and June 30, 2016, respectively.
We have incurred cumulative losses of $78.3 million from our operations through December 31, 2015 and expect to incur additional losses in the future. We believe that our existing sources of liquidity will be sufficient to fund our operations for at least the next 12 months. However, our future capital requirements will depend on many factors, including our rate of revenue growth, the expansion of our sales and marketing activities and the timing and extent of our spending to support our research and development efforts. To the extent that existing cash and cash from operations are insufficient to fund our future activities, we may need to raise additional funds through public or private equity or debt financing. In the event that additional financing is required from outside sources, we may be unable to raise the funds on acceptable terms, if at all. If we are unable to raise additional capital when desired, our business, operating results and financial condition could be adversely affected.
The following table shows a summary of our cash flows for the years ended December 31, 2013, 2014 and 2015 and for the six months ended June 30, 2015 and 2016:
| Year Ended December 31, |
Six Months Ended June 30, |
|||||||||||||||||||
| 2013 | 2014 | 2015 | 2015 | 2016 | ||||||||||||||||
| (in thousands) | ||||||||||||||||||||
| (unaudited) | ||||||||||||||||||||
| Cash at beginning of period |
$ | 1,712 | $ | 3,040 | $ | 4,412 | $ | 4,412 | 8,578 | |||||||||||
| Net cash provided by (used in) operating activities | 3,998 | 7,716 | 4,451 | 2,578 | (1,691 | ) | ||||||||||||||
| Net cash used in investing activities |
(1,335 | ) | (4,136 | ) | (7,404 | ) | (3,664 | ) | (3,386 | ) | ||||||||||
| Net cash (used in) provided by financing activities | (1,352 | ) | (2,120 | ) | 7,219 | 476 | (2,492 | ) | ||||||||||||
| Effects of exchange rates on cash |
17 | (88 | ) | (100 | ) | 13 | 39 | |||||||||||||
|
|
|
|
|
|
|
|
|
|
|
|||||||||||
| Cash at end of period |
$ | 3,040 | $ | 4,412 | $ | 8,578 | $ | 3,815 | $ | 1,048 | ||||||||||
|
|
|
|
|
|
|
|
|
|
|
|||||||||||
As of December 31, 2015, $1.4 million in cash was held by our consolidated foreign subsidiaries. We intend to use these funds for foreign operations and do not intend to repatriate these funds to the United States. In the future, if we were to repatriate unremitted earnings, we would be subject to income tax on the remittances.
Sources of Funds
Since our inception, we have financed our operations in large part with equity issuances and debt financing arrangements, including net proceeds of $42.5 million from the sale of equity securities.
Credit Facilities
In April 2013, we entered into an amendment to our credit facility agreement with Silicon Valley Bank, or the SVB credit facility. The SVB credit facility provided for advances under a formula-based revolving line of credit that matured on April 19, 2015. The revolving line of credit provided advances equal to 80% of eligible accounts receivable and was subject to sublimits for letters of credit, foreign exchange and cash management services, respectively. The maximum amount available under the line of credit was $7.0 million, $3.7 million of which was available under the credit facility as of December 31, 2014. As of December 31, 2014, $3.0 million in principal was outstanding under the credit facility. In April 2015, the credit facility was extended until July 17, 2015, but was paid off in full on July 8, 2015.
66
Table of Contents
In June 2015, we entered into a loan and security agreement, or the loan agreement, with Western Alliance Bank (formerly known as Bridge Bank) and terminated the credit facility with Silicon Valley Bank. The loan agreement originally provided for a $10.0 million revolving line of credit and the amount of the revolving line of credit was increased to $15.0 million in February 2016. Availability under the revolving line of credit is subject to a formula based on monthly recurring revenue. There is a $250,000 cash management sublimit and a $250,000 international sublimit under the revolving line of credit for cash management services, foreign exchange and letters of credit. The advances under the revolving line of credit bear interest at a floating per annum rate equal to the prime rate, but in no event less than 3.25%, plus 0.75%. The revolving line of credit terminates on June 30, 2018, at which time the principal amount of all outstanding advances becomes due and payable. As of June 30, 2016, we had $10.5 million outstanding under the revolving line of credit and $4.5 million of availability. Subsequent to June 30, 2016, we paid down $4.0 million under the revolving line of credit such that we had outstanding $6.5 million under the revolving line of credit and $8.5 million of availability as of August 15, 2016.
The loan agreement also provides for a $5.0 million growth capital term loan. The term loan bears interest at a floating per annum rate equal to the prime rate, but in no event less than 3.25%, plus 1.75%. Interest on the term loan was payable monthly in arrears for the first 12 months. Thereafter, pursuant to an amendment to the loan agreement entered into on July 1, 2016, the term loan will be payable in thirty equal monthly installments of principal, plus all accrued interest, beginning on January 10, 2017. The term loan maturity date is June 30, 2019. The term loan may be prepaid at our option, subject to a prepayment fee equal to 2% of the principal amount being repaid if such prepayment occurs on or prior to the first anniversary of the closing date. As of June 30, 2016, we had $5.0 million outstanding under the term loan.
Western Alliance Bank maintains a security interest in substantially all of our tangible and intangible assets, excluding intellectual property, to secure any outstanding amounts under the loan agreement. The loan agreement contains customary events of default, conditions to borrowing and covenants, including restrictions on our ability to dispose of assets, make acquisitions, incur debt, incur liens and make distributions and dividends to stockholders. The loan agreement also includes a financial covenant related to our recurring revenue renewal rate. During the continuance of an event of default, Western Alliance Bank may accelerate amounts outstanding, terminate the credit facility and foreclose on the collateral.
As of June 30, 2016, we were in compliance with all covenants in the loan agreement.
Uses of Funds
Our historical uses of cash have primarily consisted of cash used for operating activities, such as expansion of our sales and marketing operations, research and development activities and other working capital needs.
Operating Activities
Our net loss and cash flows provided by operating activities are significantly influenced by our investments in headcount and infrastructure to support our growth, marketing and sponsorship expenses, and our ability to bill and collect in a timely manner. Our net loss has been significantly greater than our use of cash for operating activities due to the inclusion of non-cash expenses and charges.
Operating activities used $1.7 million in cash in the six months ended June 30, 2016, primarily from $0.7 million in cash used in operations as a result of changes in operating assets and liabilities, which was offset by $5.0 million of non-cash operating expenses and partially increased by our net loss of $6.0 million. Specifically, we recognized non-cash charges aggregating $3.7 million for depreciation and amortization of intangible assets, capitalized software development costs and property and equipment and $1.4 million for stock-based compensation, which was offset by a decrease of $0.2 million in our deferred tax liability balance. The change in operating assets and liabilities reflected a $1.6 million increase in accounts receivables, a $1.2 million increase in other assets due to timing of payments made for deferred initial public offering costs and commissions, a $0.8 million increase in pre-paid expenses and a $0.4 million decrease in accrued expenses. These decreases were partially offset by a $3.1 million increase in deferred revenue and a $0.3 million increase in accrued employee related expenses.
67
Table of Contents
Operating activities provided $2.6 million in cash in the six months ended June 30, 2015, primarily from $2.8 million in cash provided as a result of changes in operating assets and liabilities, which was increased by $3.0 million of non-cash operating expenses and partially offset by our net loss of $3.2 million. Specifically, we recognized non-cash charges aggregating $2.5 million for depreciation and amortization of intangible assets, capitalized software development costs and property and equipment, $0.4 million for stock-based compensation expense, $0.1 million related to non-cash interest on notes payable and $0.1 million for the increase in our accounts receivable provision. The change in operating assets and liabilities reflected a $4.9 million increase in deferred revenue, a $1.3 million increase in accounts payable due to timing of payments made to vendors and a $0.2 million increase in accrued employee-related expenses due to timing of payments. These increases were partially offset by a $1.6 million increase in accounts receivable, $1.2 million increase in prepaid expenses as a result of the increase in upfront payments made for insurance services, a $0.5 million increase in accrued expenses due to the timing of payments made and a $0.4 million increase in other assets due to the timing of payments made for future services.
Operating activities provided $4.5 million in 2015, primarily from $7.7 million in cash provided as a result of changes in operating assets and liabilities, which was increased by $7.5 million of non-cash operating expenses and partially offset by our net loss of $10.8 million. Specifically, we recognized non-cash charges aggregating $6.0 million for depreciation and amortization of intangible assets, capitalized software development costs and property and equipment, $1.5 million for stock-based compensation expense, $0.1 million related to non-cash interest on notes payable and $0.4 million for the increase in our accounts receivable provision, offset by a $0.4 million decrease in our deferred income taxes. The change in operating assets and liabilities reflected a $0.9 million increase in accounts payable due to timing of payments made to vendors, a $11.6 million increase in deferred revenue and a $1.2 million increase in accrued employee-related expenses due to timing of payments. These increases were partially offset by a $4.8 million increase in accounts receivable, $0.7 million increase in prepaid expenses as a result of the increase in upfront payments made for insurance services, a $0.4 million increase in other assets due to timing of payments made for deferred IPO cost and commissions and a $0.2 million decrease in accrued expenses due to the timing of payments made.
Operating activities provided $7.7 million in 2014, primarily from $5.6 million cash provided as result of changes in operating assets and liabilities, which was increased by $2.8 million of non-cash operating expenses, and partially offset by our net loss of $0.6 million. Specifically, we recognized non-cash charges aggregating $2.5 million for depreciation and amortization of intangible assets, capitalized software development costs and property and equipment, a $0.2 million increase in our reserve for bad debts, a $0.4 million increase in stock-based compensation expense and a $0.3 million increase in deferred income taxes as a result of the Vocal acquisition. The change in operating assets and liabilities reflected a $1.0 million increase in accounts receivable as a result of our increased revenue, a $0.3 million increase in prepaid expenses primarily associated with our increased insurance spend and a $0.2 million increase in other assets, partially offset by a $1.6 million increase in accrued and employee-related expenses due to timing of payments made to vendors and employees and $5.0 million increase in deferred revenue.
Operating activities provided $4.0 million in 2013, primarily from $2.7 million of non-cash operating expenses and $2.2 million of net operating assets and liabilities, partially offset by our net loss of $0.9 million. Specifically, we recognized non-cash charges aggregating $2.5 million for depreciation and amortization of intangible assets, capitalized software development costs and property and equipment, $0.2 million for stock-based compensation expense and $0.1 million for our reserve for bad debts. The change in operating assets and liabilities reflected a $2.1 million increase in accounts receivable as a result of our increased revenues and a $0.1 million increase in prepaid expenses primarily associated with our increased insurance spend, partially offset by a $1.5 million increase in accrued and employee-related expenses due to timing of payments made to vendors and employees and a $3.0 million increase in deferred revenue.
Investing Activities
Our investing activities consist primarily of payments for acquisitions of businesses and technologies and capital expenditures for capitalized software development costs, property and equipment expenses.
68
Table of Contents
Investing activities used $3.4 million in cash in the six months ended June 30, 2016, primarily from our investment in software development of $3.0 million and property and equipment of $0.3 million.
Investing activities used $3.7 million in cash in the six months ended June 30, 2015, primarily from our investment in software development of $2.3 million and property and equipment of $1.3 million.
Investing activities used $7.4 million in cash in 2015, primarily from our investment in software development of $4.9 million and property and equipment of $2.5 million.
Investing activities used $4.1 million in 2014, primarily from net cash paid in acquisitions of $0.3 million, our investment in software development of $1.7 million and property and equipment of $2.2 million.
Investing activities used $1.3 million in 2013, primarily from our investment in software development of $0.8 million and property and equipment of $0.7 million, partially offset by the release of $0.1 million in restricted cash.
Financing Activities
Cash generated by financing activities includes borrowings under our term loan and credit facilities and proceeds from the issuance of common stock upon the exercise of employee stock options. Cash used in financing activities includes deferred initial public offering costs and payments on capital leases, notes payable and repayments of debt under our credit facilities.
Financing activities used $2.5 million of cash in the six months ended June 30, 2016, which reflects payment of $9.0 million on our line of credit, payment of notes payable related to the HipaaBridge and Vocal acquisitions of $2.0 million and $1.1 million in payments attributed to deferred initial public offering costs, offset by proceeds of $0.2 million from the exercise of stock options and proceeds from our line of credit of $9.5 million.
Financing activities provided $0.5 million in cash in the six months ended June 30, 2015, primarily from proceeds from our line of credit of $2.0 million, partially offset by a $1.5 million payment to repurchase outstanding shares of our common stock.
Financing activities provided $7.2 million in cash in 2015, primarily from proceeds from our term loan of $5.0 million and proceeds from our line of credit of $12.0 million, partially offset by a $1.5 million payment to repurchase outstanding shares of our common stock, $5.0 million in payments on our line of credit, $1.8 million in payments on notes payable, $1.4 million in payments attributed to deferred initial public offering costs, $0.1 million in payments for debt issuance costs and $0.1 million in payments on capital leases.
Financing activities used $2.1 million of cash in 2014, which reflects net payments of $0.4 million on our line of credit, payment of notes payable related to the Vocal acquisition of $1.9 million and payment of $0.1 million of capital lease obligations, offset by proceeds of $0.2 million from the exercise of stock options.
Financing activities used $1.4 million of cash in 2013, which reflects net payments of $1.2 million on our line of credit and payment of $0.2 million of capital lease obligations.
69
Table of Contents
Contractual Obligations and Commitments
The following table summarizes our commitments to settle contractual obligations as of December 31, 2015:
| Less than 1 Year |
1 to 3 Years |
3 to 5 Years |
More than 5 Years |
Total | ||||||||||||||||
| (in thousands) |
||||||||||||||||||||
| Debt obligations(1) |
$ | 2,851 | $ | 13,334 | $ | 833 | $ | — | $ | 17,018 | ||||||||||
| Capital leases(2) |
58 | — | — | — | 58 | |||||||||||||||
| Operating leases(3) |
1,317 | 645 | 101 | — | 2,063 | |||||||||||||||
|
|
|
|
|
|
|
|
|
|
|
|||||||||||
| Total |
$ | 4,226 | $ | 13,979 | $ | 934 | $ | — | $ | 19,139 | ||||||||||
|
|
|
|
|
|
|
|
|
|
|
|||||||||||
| (1) | Includes principal payments on our line of credit, notes payable and term loan, excluding estimated cash interest payments of $0.7 million in 2016, as described in notes (9) and (10) to our consolidated financial statements included in this prospectus. The debt obligation balance excludes $48,000 of debt issuance cost capitalized on our balance sheet and shown net of our debt obligations. |
| (2) | Capital leases include future commitments associated with our acquisition of fixed assets. |
| (3) | Operating leases include total future minimum rent payments under non-cancelable operating lease agreements as described in note (17) of our consolidated financial statements included in this prospectus. |
Future minimum operating lease payments have been reduced by future minimum sublease income of $0.3 million.
In March 2016, we entered into a lease for our new executive offices in Pasadena, California that will increase our future minimum lease commitments over the next three years by $1.0 million.
The commitment amounts in the table above are associated with contracts that are enforceable and legally binding and that specify all significant terms, including fixed or minimum services to be used, fixed, minimum or variable price provisions and the approximate timing of the actions under the contracts. The table does not include obligations under agreements that we can cancel without a significant penalty.
Backlog
We sell all of our critical communications applications on a subscription basis. We generally enter into contracts that range from one to three years in length, with an average contract duration of 2.1 years as of June 30, 2016, and generally bill and collect payment annually in advance. Since we bill many of our customers at the beginning of each contract year, there can be amounts that we have not yet been contractually able to invoice. Until such time as these amounts are invoiced, they are not recorded in revenue, deferred revenue or elsewhere in our consolidated financial statements. As of June 30, 2016, the dollar amount of this backlog believed to be firm was $50.1 million. We expect that the amount of backlog relative to the total value of our subscription agreements will change from year to year for several reasons, including the specific timing and duration of customer agreements, varying invoicing cycles of agreements, the specific timing of customer renewals and changes in customer financial circumstances. In addition, because revenue for any period is a function of revenue recognized from deferred revenue under contracts in existence at the beginning of the period, as well as contracts that are renewed and new customer contracts that are entered into during the period, backlog at the beginning of any period is not necessarily indicative of future performance. Our presentation of backlog may also differ from that of other companies in our industry. Due to these factors, as well as variances in billing arrangements with customers, we do not utilize backlog as a key management metric internally.
Off-Balance Sheet Arrangements
We do not have any relationships with unconsolidated entities or financial partnerships, including entities sometimes referred to as structured finance or special purpose entities that were established for the purpose of facilitating off-balance sheet arrangements or other contractually narrow or limited purposes. We do not engage in off-balance sheet financing arrangements. In addition, we do not engage in trading activities involving non-exchange traded contracts.
Critical Accounting Policies
Our consolidated financial statements are prepared in accordance with GAAP. The preparation of our consolidated financial statements require us to make estimates, assumptions and judgments that affect the reported amounts of revenue, assets, liabilities, costs and expenses. We base our estimates and assumptions on
70
Table of Contents
historical experience and other factors that we believe to be reasonable under the circumstances. We evaluate our estimates and assumptions on an ongoing basis. Our actual results may differ from these estimates. Our most critical accounting policies are summarized below. See note 2 to our consolidated financial statements beginning on page F-9 of this prospectus for a description of our other significant accounting policies.
Revenue Recognition
We derive substantially all of our revenue from contract subscription fees for use of our applications.
We recognize revenue in accordance with ASC Topic 605, Revenue Recognition, with respect to a transaction when all of the following conditions have been satisfied:
| • | persuasive evidence of an agreement exists; |
| • | the service has been provided to the customer; |
| • | fees are fixed or determinable; and |
| • | the collection of the fees is reasonably assured and acceptance criteria, if any, have been met. |
If any of these criteria are not met, revenue recognition is deferred until such time that all of the criteria are met.
Our subscription arrangements do not provide customers with the right to take possession of our software at any time.
Subscription Revenue
We recognize subscription revenue ratably over the initial subscription period committed by the customer commencing when the customer’s environment has been created in our hosted environment. The initial subscription period is typically one to three years and the level of service provided each customer varies is based on the level of service required by the complexity of a customer’s business.
Other Revenue
We recognize revenue for set-up fees, which historically have not been material to our financial statements. We have concluded that set-up fees do not meet the criteria for separation from our primary service as they do not have stand-alone value as we have historically not sold set-up fees separately. We charge set-up fees for substantially all new applications and services. These set-up fees are recognized ratably over the contractual period, which approximates the life of the application. We also sell professional services, which have been immaterial to date.
Deferred Revenue
Deferred revenue includes amounts collected or billed in excess of recognizable revenue. Such amounts are recognized by us over the life of the contract upon meeting the revenue recognition criteria. Deferred revenue that will be recognized during the succeeding 12-month period is recorded as current deferred revenue and the remaining portion is recorded as non-current deferred revenue. Because the mix of billing terms with customers can vary from period to period, the annualized value of the contracts that we enter into with our customers will not be completely reflected in deferred revenue at any single point in time.
Business Combinations
The results of businesses acquired in a business combination are included in our consolidated financial statements from the date of the acquisition. Purchase accounting results in assets and liabilities of an acquired business being recorded at their estimated fair values on the acquisition date. Any excess consideration over the fair value of assets acquired and liabilities assumed is recognized as goodwill.
We perform valuations of assets acquired and liabilities assumed on each acquisition accounted for as a business combination and allocate the purchase price to the tangible and intangible assets acquired and liabilities assumed
71
Table of Contents
based on our best estimate of fair value. We determine the appropriate useful life of intangible assets by performing an analysis of cash flows based on historical experience of the acquired businesses. Intangible assets are amortized over their estimated useful lives based on the pattern in which the economic benefits associated with the asset are expected to be consumed, which to date has approximated the straight-line method of amortization.
Transaction costs associated with business combinations are expensed as incurred and are included in general and administrative expense in our consolidated statements of comprehensive loss.
Goodwill
Goodwill represents the excess of the aggregate purchase price paid over the fair value of the net assets acquired in our business combinations. Goodwill is not amortized and is tested for impairment at least annually or whenever events or changes in circumstances indicate that the carrying value may not be recoverable. Events or changes in circumstances that could trigger an impairment review include a significant adverse change in business climate, an adverse action or assessment by a regulator, unanticipated competition, a loss of key personnel, significant changes in the manner of our use of the acquired assets or the strategy for our overall business, significant negative industry or economic trends, or significant underperformance relative to expected historical or projected future results of operations.
We have the option to first assess qualitative factors to determine whether the existence of events or circumstances leads to a determination that it is more likely than not that the fair value of a reporting unit is less than its carrying value, including goodwill. If, after assessing the totality of events or circumstances, we determine that it is not more likely than not that the fair value of a reporting unit is less than its carrying amount, additional impairment testing is not required. However, if we conclude otherwise, we are required to perform the first step of a two-step impairment test. Alternatively, we may elect to proceed directly to the first step of the two-step impairment test and bypass the qualitative assessment.
The first step of the impairment test involves comparing the estimated fair value of a reporting unit with its book value, including goodwill. If the estimated fair value exceeds book value, goodwill is considered not to be impaired and no additional steps are necessary. If, however, the fair value of the reporting unit is less than book value, the carrying amount of the goodwill is compared to its implied fair value. The estimate of implied fair value of goodwill may require valuations of certain internally generated and unrecognized intangible assets. If the carrying amount of goodwill exceeds the implied fair value of that goodwill, an impairment loss is recognized in an amount equal to the excess. We test for goodwill impairment on November 30 of each year.
Software Development Costs
We capitalize the costs of software developed or obtained for internal use in accordance with ASC Topic 350-40, Internal Use Software. Capitalized software development costs consist of costs incurred during the application development stage and include purchased software licenses, implementation costs, consulting costs, and payroll-related costs for projects that qualify for capitalization. These costs relate to major new functionality. All other costs, primarily related to maintenance and minor software fixes, are expensed as incurred.
Stock-Based Compensation
We recognize stock-based compensation expense for stock-based compensation awards granted to our employees, directors, consultants and other service providers that can be settled in shares of our common stock. Compensation expense for stock-based compensation awards granted is based on the grant date fair value estimate for each award as determined by our board of directors or the compensation committee of our board of directors. We recognize these compensation costs on a straight-line basis over the requisite service period of the award, which is generally four years. As stock-based compensation expense recognized is based on awards ultimately expected to vest, such expense is reduced for estimated forfeitures.
72
Table of Contents
We estimate the fair value of stock-based compensation awards at the date of grant using the Black-Scholes option pricing model, which was developed for use in estimating the value of traded options that have no vesting restrictions and are freely transferable. The fair values generated by the model may not be indicative of the actual fair values of our awards as it does not consider other factors important to those stock-based payment awards, such as continued employment, periodic vesting requirements and limited transferability.
Determining the fair value of stock-based awards at the grant date requires judgment. We use the Black-Scholes option-pricing model to determine the fair value of stock options. The determination of the grant date fair value of options using an option-pricing model is affected by our estimated common stock fair value as well as assumptions regarding a number of other complex and subjective variables. These variables include the fair value of our common stock, the expected term of the options, our expected stock price volatility, risk-free interest rates, and expected dividends, which are estimated as follows:
| • | Fair value of our common stock. Because our stock is not publicly traded, we must estimate the fair value of common stock, as discussed in “—Common Stock Valuations” below. |
| • | Expected term. The expected term represents the period that the stock-based compensation awards are expected to be outstanding. Since we did not have sufficient historical information to develop reasonable expectations about future exercise behavior, we use the simplified method to compute expected term, which represents the average of the time-to-vesting and the contractual life. |
| • | Expected volatility. As we do not have a trading history for our common stock, the expected stock price volatility for our common stock was estimated by taking the average historic price volatility for industry peers based on daily price observations over a period equivalent to the expected term of the stock option grants. We did not rely on implied volatilities of traded options in our industry peers’ common stock because the volume of activity was relatively low. We intend to continue to consistently apply this process using the same or similar public companies until a sufficient amount of historical information regarding the volatility of our own common stock share price becomes available. |
| • | Risk-free interest rate. The risk-free interest rate is based on the U.S. Treasury yield curve in effect at the time of grant for zero coupon U.S. Treasury notes with maturities approximately equal to the expected term of the options. |
| • | Expected dividend yield. We have never declared or paid any cash dividends and do not presently plan to declare or pay cash dividends in the foreseeable future. Consequently, we used an expected dividend yield of zero. |
If any of the assumptions used in the Black-Scholes model change significantly, stock-based compensation for future awards may differ materially compared with the awards granted previously.
The following table presents the weighted-average assumptions used to estimate the fair value of options granted during the periods presented:
| Year Ended December 31, |
Six Months Ended June 30, | |||||||||
| 2013 | 2014 | 2015 | 2015 | 2016 | ||||||
| Expected term (years) |
5.53 - 7.03 | 5.89 - 6.13 | 5.09 - 6.15 | 5.52 - 6.15 | 5.29 -6.10 | |||||
| Expected volatility |
65% | 51.7% - 69% | 60% | 60% | 70% | |||||
| Risk-free interest rate |
0.91% - 2.14% | 1.63% - 2.06% | 1.41% - 1.94% | 1.47% - 1.81% | 1.28% - 1.86% | |||||
| Expected dividend yield |
—% | —% | —% | —% | —% | |||||
Common Stock Valuations
The fair value of the common stock underlying our stock options was determined by our board of directors, which intended that all options granted have an exercise price that is not less than the estimated fair market value
73
Table of Contents
of a share of our common stock underlying those options on the date of grant. The valuations of our common stock were determined in accordance with the guidelines outlined in the American Institute of Certified Public Accountants Practice Aid, Valuation of Privately-Held-Company Equity Securities Issued as Compensation. The assumptions we used in the valuation model were based on future expectations combined with management judgment. In the absence of a public trading market, our board of directors, with input from management, exercised significant judgment and considered numerous objective and subjective factors to determine the fair market value of our common stock as of the date of each option grant, including the following factors:
| • | contemporaneous third-party valuations performed at periodic intervals by a valuation firm; |
| • | the prices, rights, preferences and privileges of our preferred stock relative to the common stock; |
| • | the purchases of shares of preferred stock by unaffiliated venture capital firms; |
| • | actual operating and financial performance and forecasts; |
| • | present value of forecasted future cash flows; |
| • | the likelihood of achieving a liquidity event, such as an initial public offering or a sale of our company given prevailing market conditions; |
| • | any adjustment necessary to recognize a lack of marketability for our common stock; |
| • | the market performance of comparable publicly-traded technology companies; |
| • | the U.S. and global capital market conditions; |
| • | our stage of development; and |
| • | industry information such as market size and growth and our competitive position in the market. |
We have granted stock options with the following exercise prices since January 1, 2014:
| Grant Date |
Number of Shares Underlying Awards |
Exercise Price Per Share |
Common Stock Fair Value Per Share at Grant Date |
|||||||||
| February 11, 2014 |
45,000 | $ | 1.22 | $ | 1.22 | |||||||
| May 8, 2014 |
222,500 | $ | 1.22 | $ | 1.22 | |||||||
| July 31, 2014 |
126,500 | $ | 1.22 | $ | 1.22 | |||||||
| October 21, 2014 |
285,500 | $ | 1.22 | $ | 1.22 | |||||||
| March 5, 2015 |
793,500 | $ | 1.63 | $ | 1.63 | |||||||
| April 22, 2015 |
1,506,500 | $ | 1.63 | $ | 1.63 | |||||||
| July 15, 2015 |
4,454,000 | $ | 2.37 | $ | 2.37 | |||||||
| October 19, 2015 |
90,000 | $ | 2.45 | $ | 2.32 | |||||||
| January 7, 2016 |
527,000 | $ | 2.55 | $ | 2.47 | |||||||
| May 11, 2016 |
758,500 | $ | 2.55 | $ | 2.51 | |||||||
| August 4, 2016 |
103,500 | $ | 2.55 | $ | 2.51 | |||||||
Based upon the assumed initial public offering price of $ per share, which is the midpoint of the estimated offering price range set forth on the cover page of this prospectus, the aggregate intrinsic value of options outstanding as of June 30, 2016 was $ million, of which $ million related to vested options and $ million related to unvested options.
Common Stock Valuation Methodology
In valuing our common stock, our board of directors determined the equity value of our business generally using a combination of the income approach and the market approach valuation methods.
The income approach estimates value based on the expectation of future cash flows that a company will generate, such as cash earnings, cost savings, tax deductions and the proceeds from disposition. These future cash flows
74
Table of Contents
are discounted to their present values using a discount rate derived based on an analysis of the cost of capital of comparable publicly traded companies in similar lines of business, as of each valuation date, and is adjusted to reflect the risks inherent in our cash flows.
The market approach estimates the fair value of a company by applying market multiples of comparable publicly traded companies in a similar line of business. The market multiples are based on relevant metrics implied by the price that investors have paid for the equity of publicly traded companies. Given our significant focus on investing in and growing our business as well the financial metrics influencing the market values of the publicly traded companies examined, we primarily utilized the revenue multiple when performing valuation assessments under the market approach. When considering which companies to include as our comparable industry peer companies, we focused on U.S.-based publicly traded companies that were broadly comparable to us based on consideration of industry, market and line of business. From the comparable companies, a representative market value multiple was determined and applied to our operating results to estimate the value of our company. The market value multiple was determined based on consideration of multiples of revenue to each of the comparable companies’ last 12-month revenue and the forecasted future 12-month revenue. In addition, the market approach considers merger and acquisition transactions involving companies similar to the company’s business being valued. Multiples of revenue are calculated for these transactions and then applied to the business being valued, after reduction by an appropriate discount.
Historically, our equity value was determined using a weighted average combination of the income approach and the market approach. Once an equity value was determined, we utilized the option pricing method, or OPM, for all valuations prior to June 30, 2015 and subsequently used a hybrid method to allocate the total value of equity to various shares classes, which is a probability weighted expected return method, or PWERM, that incorporates the use of an OPM.
The OPM treats common stock and convertible preferred stock as call options on a company’s enterprise value with exercise prices based on the liquidation preferences of the convertible preferred stock. The OPM prices the call option using the Black-Scholes model. The OPM is used when the range of possible future outcomes is difficult to predict.
The PWERM relies on a forward-looking analysis to predict the possible future value of a company. Under this method, discrete future outcomes, including an initial public offering, or IPO, and non-IPO scenarios, are weighted based on the estimated the probability of each scenario. The PWERM is used when discrete future outcomes can be predicted with reasonable certainty based on a probability distribution.
The hybrid method is generally preferred for a company expecting a liquidity event in the near future but where, due to market or other factors, the form of a liquidity event under one or more scenarios is uncertain. In the application of the hybrid method, we weighted scenarios under which the company would complete its public offering or a sale to allocate the value of equity under a near-term liquidity scenario and the OPM to allocate the value of equity under a long-term liquidity scenario. The equity values relied upon in the different scenarios within PWERM were based on (1) the weighted average indications of the enterprise value using the discounted cash flow method, which is an income approach, and the guideline public company method, which is a market approach, and (2) our expectation of the pre-money valuation that we needed to achieve to consider an IPO as a viable scenario.
Contemporaneous Valuations
To assist our board of directors with the determinations of the exercise price for our stock options and the fair market value of the common stock underlying the options, we obtained third-party valuations of our common stock as of January 31, 2014, January 31, 2015, April 30, 2015, June 30, 2015, August 31, 2015, October 31, 2015, December 31, 2015, February 29, 2016, April 30, 2016 and June 30, 2016. An analysis of our third-party valuations and determinations of the exercise prices and the fair value of the underlying common stock for our stock-based awards granted on or between the respective valuation dates are discussed further below.
February through October 2014 Grants. We obtained an independent third-party valuation of our common stock as of January 31, 2014. This valuation was determined using the OPM method. With respect to the OPM,
75
Table of Contents
the enterprise value was determined by using a combination of income and market approaches, each weighted at 50% of the overall valuation. The income approach utilized a five-year cash flow forecast as the primary method for determining our enterprise value and applied a discount rate of 25%. This discount rate was based upon benchmark venture capital studies of required rates of return for investment in companies at similar stages of development, as well as an analysis of weighted-average costs of capital of comparable companies using a capital asset pricing model. The market approach was developed by applying revenue market multiples of comparable companies to our historical and forecasted revenue.
After a consideration of this valuation, our board of directors determined the fair market value of our common stock to be $1.22 per share for each of the grants issued during 2014 and granted stock options with an exercise price of $1.22 per share on each of these dates. This is the same fair value per share we used for financial reporting purposes. In connection with each such determination, our board of directors determined that there were no material changes in our business since January 31, 2014 or in the assumptions upon which the January 31, 2014 valuation was based that affected the fair market value of our common stock.
March and April 2015 Grants. We obtained an independent third-party valuation of our common stock as of January 31, 2015. This valuation was determined using the OPM method. With respect to the OPM, the enterprise value was determined by using a combination of income and market approaches, each weighted at 50% of the overall valuation. The income approach utilized a five-year cash flow forecast as the primary method for determining our enterprise value and applied a discount rate of 20%. This discount rate was based upon benchmark venture capital studies of required rates of return for investment in companies at similar stages of development, as well as an analysis of weighted-average costs of capital of comparable companies using a capital asset pricing model. The market approach was developed by applying revenue market multiples of comparable companies to our historical and forecasted revenue.
After a consideration of this valuation, our board of directors determined the fair market value of our common stock to be $1.63 per share for each of the grants issued in March and April of 2015 and granted stock options with an exercise price of $1.63 per share on each of these dates. This is the same fair value per share we used for financial reporting purposes. In connection with each such determination, our board of directors determined that there were no material changes in our business since January 31, 2015, or in the assumptions upon which the January 31, 2015 valuation was based that affected the fair value of our common stock.
July 2015 Grants. We obtained an independent third-party valuation of our common stock as of June 30, 2015. Given our continued growth and improving operational metrics as well as our plans to pursue an IPO, the valuation as of June 30, 2015 was determined using the hybrid method. This method uses a PWERM that was calculated assuming a 60% probability of an initial public offering within six months, a 20% probability of an initial public offering in one year, a 10% probability of a sale in approximately one year and a 10% probability of our continuing as a private company. For each scenario of the PWERM, a total equity value was determined by using a combination of income and market approaches. Total equity value under the income approach was estimated based on the present value of our future cash flows and a revenue multiple for the terminal value that was determined based upon a guideline public company analysis considering companies of relative size, growth and profitability at that future date. Total equity value under the market approach was estimated based on the application of market multiples to our last-twelve-months and forward-looking revenues, each of which was weighted at 50%. The equity values determined were allocated to the common stock under each PWERM scenario. Finally, the probability weighted indication for the common stock was then discounted for lack of marketability by 15%. For the purposes of the PWERM, we estimated an IPO date of between November 30, 2015 and June 30, 2016 and used a risk adjusted discount rate of 21%.
After a consideration of this valuation, our board of directors determined the fair value of our common stock to be $2.37 per share as of June 30, 2015 and granted stock options with an exercise price of $2.37 per share in July 2015. This is the same fair value per share we used for financial reporting purposes. The increase in the value from the prior valuation principally reflected our business outlook for 2015, an increase in industry multiples and our progress towards an initial public offering.
76
Table of Contents
October 2015 Grants. We obtained an independent third-party valuation of our common stock as of August 31, 2015. Given our continued growth and improving operational metrics as well as our plans to pursue an IPO, the valuation as of August 31, 2015 was determined using the hybrid method. This method uses a PWERM that was calculated assuming a 60% probability of an initial public offering within six months, a 20% probability of an initial public offering within one year, a 10% probability of a sale within one year and a 10% probability of our continuing as a private company. For each scenario of the PWERM, a total equity value was determined by using a combination of income and market approaches. Total equity value under the income approach was estimated based on the present value of our future cash flows and a revenue multiple for the terminal value that was determined based upon a guideline public company analysis considering companies of relative size, growth and profitability at that future date. Total equity value under the market approach was estimated based on the application of market multiples to our last-twelve-months and forward-looking revenues, each of which was weighted at 50%. The equity values determined were allocated to the common stock under each PWERM scenario. Finally, the probability weighted indication for the common stock was then discounted for lack of marketability by 15%. For the purposes of the PWERM, we estimated an IPO date of between November 30, 2015 and June 30, 2016 and used a risk adjusted discount rate of 21%.
This third-party valuation indicated the fair market value of our common stock to be $2.32 per share as of August 31, 2015, with the decrease in value from the prior valuation principally reflecting a decrease in industry multiples, partially offset by our progress towards an IPO. Nevertheless, our board of directors determined the fair value of our common stock to be $2.45 per share as of August 31, 2015 and granted stock options with an exercise price of $2.45 in October 2015.
January 2016 Grants. We obtained an independent third-party valuation of our common stock as of December 31, 2015. Given our continued growth and improving operational metrics as well as our plans to pursue an IPO, the valuation as of December 31, 2015 was determined using the hybrid method. This method uses a PWERM that was calculated assuming a 80% probability of an initial public offering within one year, a 10% probability of a sale within one year and a 10% probability of our continuing as a private company. For each scenario of the PWERM, a total equity value was determined by using a combination of income and market approaches. Total equity value under the income approach was estimated based on the present value of our future cash flows and a revenue multiple for the terminal value that was determined based upon a guideline public company analysis considering companies of relative size, growth and profitability at that future date. Total equity value under the market approach was estimated based on the application of market multiples to our last-twelve-months and forward-looking revenues. The income approach was weighted at 33% and the market approach was weighted at 67% in order to determine our equity value. The equity values determined were allocated to the common stock under each PWERM scenario. Finally, the probability weighted indication for the common stock was then discounted for lack of marketability by 15%. For the purposes of the PWERM, we estimated an IPO date of between March 31, 2016 and July 31, 2016 and used a risk adjusted discount rate of 20%.
This third-party valuation indicated the fair market value of our common stock to be $2.47 per share as of December 31, 2015. Nevertheless, our board of directors determined the fair market value of our common stock to be $2.55 per share as of December 31, 2015 and granted stock options with an exercise price of $2.55 in January 2016.
May 2016 Grants. We obtained an independent third-party valuation of our common stock as of April 30, 2016. Given our continued growth and improving operational metrics as well as our plans to pursue an IPO, the valuation as of April 30, 2016 was determined using the hybrid method. This method uses a PWERM that was calculated assuming a 80% probability of an initial public offering within one year, a 10% probability of a sale within one year and a 10% probability of our continuing as a private company. For each scenario of the PWERM, a total equity value was determined by using a combination of income and market approaches. Total equity value under the income approach was estimated based on the present value of our future cash flows and a revenue multiple for the terminal value that was determined based upon a guideline public company analysis considering companies of relative size, growth and profitability at that future date. Total equity value under the market approach was estimated based on the application of market multiples to our last-twelve-months and forward-looking revenues. The income approach was weighted at 33% and the market approach was weighted at 67% in
77
Table of Contents
order to determine our equity value. The equity values determined were allocated to the common stock under each PWERM scenario. Finally, the probability weighted indication for the common stock was then discounted for lack of marketability by 15%. For the purposes of the PWERM, we estimated an IPO date of between August 31, 2016 and December 15, 2016 and used a risk adjusted discount rate of 20%.
This third-party valuation indicated the fair market value of our common stock to be $2.51 per share as of April 30, 2016. Nevertheless, our board of directors determined the fair market value of our common stock to be $2.55 per share as of April 30, 2016 and granted stock options with an exercise price of $2.55 in May 2016.
August 2016 Grants. We obtained an independent third-party valuation of our common stock as of June 30, 2016. Given our continued growth and improving operational metrics as well as our plans to pursue an IPO, the valuation as of June 30, 2016 was determined using the hybrid method. This method uses a PWERM that was calculated assuming a 80% probability of an initial public offering within one year, a 10% probability of a sale within one year and a 10% probability of our continuing as a private company. For each scenario of the PWERM, a total equity value was determined by using a combination of income and market approaches. Total equity value under the income approach was estimated based on the present value of our future cash flows and a revenue multiple for the terminal value that was determined based upon a guideline public company analysis considering companies of relative size, growth and profitability at that future date. Total equity value under the market approach was estimated based on the application of market multiples to our last-twelve-months and forward-looking revenues. The income approach was weighted at 33% and the market approach was weighted at 67% in order to determine our equity value. The equity values determined were allocated to the common stock under each PWERM scenario. Finally, the probability weighted indication for the common stock was then discounted for lack of marketability by 15%. For the purposes of the PWERM, we estimated an IPO date of between September 30, 2016 and December 15, 2016 and used a risk adjusted discount rate of 20%.
This third-party valuation indicated the fair market value of our common stock to be $2.51 per share as of June 30, 2016. Nevertheless, our board of directors determined the fair market value of our common stock to be $2.55 per share as of June 30, 2016 and granted stock options with an exercise price of $2.55 in August 2016.
Following the closing of this offering, the fair value of our common stock will be determined based on the closing price of our common stock on the NASDAQ Global Market.
Recent Accounting Pronouncements
In May 2014, the Financial Accounting Standards Board issued Accounting Standards Update, or ASU, 2014-09, Revenue from Contracts with Customers (Topic 606), which supersedes the revenue recognition in Accounting Standards Codification 605, Revenue Recognition. Under this guidance, revenue is recognized when promised goods or services are transferred to customers in an amount that reflects the consideration that is expected to be received for those goods or services. The updated standard will replace all existing revenue recognition guidance under GAAP when it becomes effective and permits the use of either the retrospective or cumulative effect transition method. This ASU is effective for annual periods beginning after December 15, 2017 and shall be applied either retrospectively to each period presented or as a cumulative-effect adjustment as of the date of adoption. Early adoption for annual period beginning after December 15, 2016 would be permitted. We are evaluating the potential impact of this adoption on our consolidated financial statements.
In August 2014, the FASB issued ASU 2014-15, Disclosure of Uncertainties About an Entity’s Ability to Continue as a Going Concern. This standard update provides guidance around management’s responsibility to evaluate whether there is substantial doubt about an entity’s ability to continue as a going concern and to provide related footnote disclosures. The new guidance is effective for all annual and interim periods ending after December 15, 2016. The adoption of this guidance is not expected to have a material impact on our financial statements.
In April 2015, the FASB issued ASU 2015-03, Interest—Imputation of Interest (Subtopic 835-30): Simplifying the Presentation of Debt Issuance Costs. ASU 2015-03 provides accounting guidance regarding financial
78
Table of Contents
statement presentation of debt issuance costs related to a recognized debt liability. The guidance states that debt issuance costs related to a recognized debt liability be presented in the balance sheet as a direct deduction from the carrying amount of the debt liability, consistent with that of debt discounts. Given the absence of authoritative guidance within ASU 2015-03 for debt issuance costs related to line-of-credit arrangements, the SEC staff would not object to an entity deferring and presenting debt issuance costs as an asset and subsequently amortizing the deferred debt issuance costs ratably over the term of the line-of-credit arrangement, regardless of whether there are any outstanding borrowings on the line-of-credit arrangement. This ASU is effective for annual periods and interim periods within those annual periods, beginning after December 15, 2015. Early adoption is permitted, but only for financial statements which have not been previously issued. An entity should apply this guidance on a retrospective basis wherein the balance sheet of each individual period be adjusted to reflect the period-specific effect of the new guidance. Upon transition, an entity is required to comply with the appropriate disclosures associated with a change in accounting principle. We have adopted this standard as of January 1, 2016 with retroactive application. Adoption of ASU 2015-03 resulted in a decrease in pre-paid expense of $48,000 and a decrease in our line of credit and term loan debt of $48,000 as of December 31, 2015 on our consolidated balance sheet.
In November 2015, the FASB issued ASU 2015-17, Income Taxes (Topic 740): Balance Sheet Classification of Deferred Taxes. This standard amends the accounting for income taxes and requires all deferred tax assets and liabilities to be classified as non-current on the balance sheet. The new standard is effective for reporting periods beginning after December 15, 2016, with early adoption permitted. The standard may be adopted either prospectively or retrospectively. We elected to adopt the accounting standard retrospectively in 2015.
In February 2016, the FASB issued ASU 2016-02: Leases (Topic 842). The amendments in this update require lessees, among other things, to recognize lease assets and lease liabilities on the balance sheet for those leases classified as operating leases under previous authoritative guidance. This update also introduces new disclosure requirements for leasing arrangements. ASU 2016-02 will be effective in fiscal year 2019, but early application is permitted. We are evaluating the potential impact of this update on our consolidated financial statements.
Qualitative and Quantitative Disclosures about Market Risk
Market risk represents the risk of loss that may impact our financial position due to adverse changes in financial market prices and rates. Our market risk exposure is primarily the result of fluctuations in interest rates and foreign exchange rates as well as, to a lesser extent, inflation.
Interest Rate Risk
We are exposed to interest rate risk in the ordinary course of our business. Our cash includes cash in readily available checking and money market accounts and marketable securities. These securities are not dependent on interest rate fluctuations that may cause the principal amount of these assets to fluctuate. Additionally, the interest rate on our notes payable loans are fixed and not subject to changes in market interest rates.
We had cash of $8.6 million as of December 31, 2015, which consists entirely of bank deposits. To date, fluctuations in interest income have not been significant. We also had total outstanding debt subject to interest rate risk of $15.0 million as of December 31, 2015, which is due within four years. Amounts outstanding under our credit facility carry a variable interest rate of the prime rate, but in no event less than 3.25%, plus 0.75%. Amounts outstanding under our growth capital term loan carry a variable interest rate of the prime rate, but in no event less than 3.25%, plus 1.75%. As of December 31, 2015, the applicable prime rate was 3.50%. We monitor our cost of borrowing under our credit facility, taking into account our funding requirements, and our expectation for short-term rates in the future.
We do not enter into investments for trading or speculative purposes and have not used any derivative financial instruments to manage our interest rate risk exposure. Although our credit facility and term loan have variable interest rates, a hypothetical 10% change in interest rates during any of the periods presented would not have had a material impact on our financial statements.
79
Table of Contents
Foreign Currency Exchange Risk
We have foreign currency risks related to our revenue and operating expenses denominated in currencies other than our functional currency, the U.S. dollar, principally British pounds. Movements in foreign currencies in which we transact business could significantly affect future net earnings. For example, if the average value of the British pound had been 10% higher relative to the U.S. dollar during 2015, our operating expenses would have increased by $0.4 million and if the average value of the British pound had been 10% higher relative to the U.S. dollar during 2014, our operating expenses would have increased by $0.2 million. To date, we have not engaged in any hedging strategies. As our international operations grow, we will continue to reassess our approach to manage our risk relating to fluctuations in foreign currency rate.
Inflation Risk
We do not believe that inflation has had a material effect on our business, financial condition or results of operations. If our costs were to become subject to significant inflationary pressures, we may not be able to fully offset such higher costs through price increases. Our inability or failure to do so could harm our business, financial condition and results of operations.
JOBS Act Transition Period
In April 2012, the Jumpstart Our Business Startups Act of 2012, or the JOBS Act, was enacted. Section 107 of the JOBS Act provides that an “emerging growth company” can take advantage of the extended transition period provided in Section 7(a)(2)(B) of the Securities Act for complying with new or revised accounting standards. Thus, an emerging growth company can delay the adoption of certain accounting standards until those standards would otherwise apply to private companies. We have irrevocably elected not to avail ourselves of this extended transition period and, as a result, we will adopt new or revised accounting standards on the relevant dates on which adoption of such standards is required for other public companies.
We are in the process of evaluating the benefits of relying on other exemptions and reduced reporting requirements under the JOBS Act. Subject to certain conditions, as an emerging growth company, we may rely on certain of these exemptions, including without limitation, (i) providing an auditor’s attestation report on our system of internal controls over financial reporting pursuant to Section 404(b) of the Sarbanes-Oxley Act and (ii) complying with any requirement that may be adopted by the Public Company Accounting Oversight Board regarding mandatory audit firm rotation or a supplement to the auditor’s report providing additional information about the audit and the financial statements, known as the auditor discussion and analysis. We will remain an emerging growth company until the earlier to occur of (1) the last day of the fiscal year (a) following the fifth anniversary of the completion of this offering, (b) in which we have total annual gross revenues of at least $1.0 billion or (c) in which we are deemed to be a “large accelerated filer” under the rules of the U.S. Securities and Exchange Commission, which means the market value of our common stock that is held by non-affiliates exceeds $700 million as of the prior June 30th, and (2) the date on which we have issued more than $1.0 billion in non-convertible debt during the prior three-year period.
80
Table of Contents
Overview
We are a global software company that provides critical communications and enterprise safety applications that enable customers to automate and accelerate the process of keeping people safe and businesses running during critical events. During public safety threats such as active shooter situations, terrorist attacks or severe weather conditions, as well as critical business events such as IT outages or cyber incidents, our SaaS-based platform enables our customers to quickly and reliably aggregate and assess threat data, locate people at risk and responders able to assist, and automate the execution of pre-defined communications processes. Our customers use our platform to deliver intelligent, contextual messages to, and receive verification of delivery from, hundreds or millions of recipients, across multiple communications modalities such as voice, SMS and e-mail. Our applications enable the delivery of messages in near real-time to more than 100 different communication devices, in over 200 countries and territories, in 15 languages and dialects – all simultaneously. We delivered 1.1 billion communications in 2015. We automate the process of sending contextual notifications to multiple constituencies and receiving return information on a person’s or operations’ status so that organizations can act quickly and precisely. Our critical communications and enterprise safety applications include Mass Notification, Incident Management, IT Alerting, Safety Connection, Community Engagement, Secure Messaging and Internet of Things, and are easy-to-use and deploy, secure, highly scalable and reliable. We believe that our broad suite of integrated, enterprise applications delivered via a single global platform is a significant competitive advantage in the market for critical communications and enterprise safety solutions, which we refer to generally as critical communications.
In critical situations, the speed at which information is transmitted and accessed is essential. For example, United States Department of Homeland Security research indicates that the average duration of an active shooter event at a school is approximately 12.5 minutes, while a U.S. Federal Bureau of Investigation study of active shooter events between 2000 and 2013 found that 60% of the incidents ended before the police arrived. Accordingly, organizations must be able to rapidly deliver messages that are tailored to multiple, specific audiences, in precise locations and must be assured of delivery. Further, the proliferation of mobile and digital communications has resulted in individuals spending less time in a fixed office location, with International Data Corporation estimating that by 2020 mobile workers will account for 72% of the total United States workforce, and this trend has simultaneously increased the number of pathways through which people receive information. These developments have made it imperative that critical communications be delivered to social media, outdoor signage and personal computers, as well as via voice, SMS and email. Moreover, organizations require the ability to leverage all of these pathways, individually or in sequence, to reach people in situations where a certain means of communication may be inoperative or individuals are not responsive to a single pathway. During public safety threats and critical business events, the ability to gather, organize and analyze data, and to enable secure, scalable, reliable and automated communications to people can be essential to saving lives and protecting assets. Further, the ability to rapidly organize a response with automated communications can also result in significant economic savings, as each minute of unplanned downtime costs organizations an average of approximately $5,600, according to Gartner, Inc.
The severity, complexity and frequency of these critical events, their implications for business performance and personal safety, and regulatory and compliance challenges are increasing. The need for active shooter preparedness and public safety protection from terrorist attacks, as well as notifications about IT outages, cyber incidents, severe weather conditions, missing persons, failing equipment and other urgent events, drive the need for a secure, scalable and reliable notification system that can be operated quickly and easily. In addition, there has been a rapid proliferation of connected devices and networked physical objects – the Internet of Things, or IoT – that have the capability to communicate information about status and environment and generate data that enables individuals and enterprises to take appropriate action. These dynamics have led to a growing need for enterprise critical communications solutions that can deliver comprehensive yet targeted and contextually relevant content that facilitates the desired outcomes in critical situations and overcomes the information overload that individuals face. We estimate, based on data from Frost & Sullivan, presented in an independent
81
Table of Contents
study commissioned by us, and data from Markets and Markets, that the market for critical communications solutions represented a $15.6 billion worldwide opportunity in 2015 and is expected to grow to $31.9 billion in 2020.
Following the tragic events of 9/11, Everbridge was founded with a vision of helping people communicate effectively in critical situations. Our SaaS-based critical communications platform is built on a secure, scalable and reliable infrastructure with multiple layers of redundancy to enable the rapid delivery of critical communications, with near real-time verification, over numerous devices and contact paths. Our Mass Notification application is our most established application and enables enterprises and governmental entities to aggregate and assess threat data, locate people based on their dynamic location and send and receive two-way, contextually aware notifications to individuals or groups to keep them informed before, during and after natural or man-made disasters and other emergencies. For example, during Hurricane Sandy, our Mass Notification application was used along the U.S. East Coast to deliver more than eight million communications. By automating the delivery of these types of critical communications, we enable customers to increase the speed and accuracy of their response and reduce associated costs. Importantly, given the pressure and anxiety most people experience in critical situations, our Mass Notification application provides a simple user interface and automated workflows for ease of use. The expertise that we garnered developing our Mass Notification application and our customers’ reliance on our solutions led us to leverage our platform to deploy solutions for additional critical communications use cases. In turn, we have developed a full suite of enterprise-scale applications that enable our customers to inform and organize people during critical situations, whether a broad audience or a targeted subset of individuals, globally or locally, and accounting for cultural, linguistic, regulatory and technological differences. As all of our applications leverage our critical communications platform, customers can use a single contacts database, rules engine of algorithms and hierarchies and user interface to accomplish multiple objectives. Our applications are easy-to-use, quickly deployable and require limited implementation services and no development resources.
The following situations reflect examples of how our applications aggregate and assess data and enable and optimize critical communications processes:
| • | When an active shooter situation or terrorist attack occurs, organizations can quickly identify employees in the affected area, including employees not at their usual business location, in order to confirm that they are safe and provide tailored instructions. For example, shelter-in-place instructions may be provided to people in an impacted building while evacuation instructions are provided to those in an adjacent building. At the same time, first responders and hospitals can use multiple modes of alerting to mobilize resources and call in staff to provide emergency care. |
| • | When a hurricane is imminent, local emergency management departments can alert affected communities with relevant safety and evacuation instructions while organizations can notify employees of office closures and provide safety instructions. |
| • | When IT systems fail, IT administrators can shorten the time required to alert cross-department responders, use scheduling information to determine availability and quickly assemble appropriate personnel on a conference bridge, thereby reducing the costs incurred from downtime. |
| • | When a patient is suspected of having a stroke, an on-call specialist can provide a patient assessment via video communications during the ambulance trip and the emergency room can be readied for an immediate stroke treatment, accelerating critical time to treatment. |
| • | When a cyber incident shuts down an IT network, management can alert employees of the network shutdown via a secure, alternate communication path. |
| • | When a power line is down, utility workers can utilize pre-configured incident management templates to alert affected customers and responders and provide service updates. |
82
Table of Contents
| • | When engine readings in critical equipment detect a malfunction, technicians with the appropriate skills can be automatically alerted and quickly deployed to minimize downtime and avoid revenue loss or service interruption. |
| • | When readings from an implanted medical device are abnormal, that information can be automatically routed to the individual’s healthcare provider to enable timely medical care. |
| • | When a young child goes missing, local officials can send alerts to and receive tips from their communities to aid in locating and returning the child. |
| • | When a financial services firm experiences disruptions in service, clients can be promptly notified and audit confirmations can be provided to document delivery. |
Our customer base has grown from 867 customers at the end of 2011 to more than 3,000 customers as of July 31, 2016. As of July 31, 2016, our customers were based in 25 countries and included eight of the 10 largest U.S. cities, seven of the 10 largest U.S.-based investment banks, 24 of the 25 busiest North American airports, six of the 10 largest global auto makers, all four of the largest global accounting firms and four of the 10 largest U.S.-based health care providers. We provide products and services to customers of varying sizes, including enterprises, small businesses, non-profit organizations, educational institutions and government agencies. Our customers span a wide variety of industries including technology, energy, financial services, healthcare and life sciences, manufacturing, media and entertainment, retail, higher education and professional services.
We derive substantially all of our revenue from subscriptions to our critical communications applications, which represented 96%, 97% and 95% of our total revenue in 2013, 2014 and 2015, respectively. Historically, we derived more than 88% of our revenue in each of the last three fiscal years and the six months ended June 30, 2015 and 2016 from sales of our Mass Notification application. Our pricing model is based on the number of applications subscribed to and, per application, the number of people, locations and things connected to our platform, as well as the volume of communications. We also offer premium services including data feeds for social media, threat intelligence and weather. We generate additional revenue by expanding the number of applications, number of contacts and number of devices that our customers purchase over time.
We generated revenue of $23.4 million in 2012, $30.0 million in 2013, $42.4 million in 2014 and $58.7 million in 2015, representing year-over-year increases of 29% in 2013, 41% in 2014 and 38% in 2015. We generated revenue of $27.3 million and $35.6 million in the six months ended June 30, 2015 and 2016, respectively, representing a period-over-period increase of 30%. We had net losses of $5.1 million, $0.9 million, $0.6 million and $10.8 million in 2012, 2013, 2014 and 2015, respectively. We had net losses of $3.2 million and $6.0 million for the six months ended June 30, 2015 and 2016, respectively. Our adjusted EBITDA, which is a measure that is not calculated and presented in accordance with generally accepted accounting principles in the United States, or GAAP, decreased from $2.2 million to $(3.4) million from 2013 to 2015 and was $(0.3) million and $(0.7) million for the six months ended June 30, 2015 and 2016, respectively. See note 2 to the table contained in “Summary Consolidated Financial and Other Data—Key Metrics” for a reconciliation of adjusted EBITDA to net loss, the most directly comparable financial measure calculated and presented in accordance with GAAP.
Industry Background
Over the past two decades, methods to assess critical events and to automate and accelerate the process of using critical communications have evolved rapidly, in tandem with advances in technology, to include system-generated voice calls, text messages, emails, social media and outdoor digital signage. In critical situations, the speed at which information is transmitted and accessed is essential.
Key Trends Driving a Fundamental Shift in Communications
Governmental entities and enterprises face increasing threats to the safety of their geographically disparate and constantly mobile residents and employees. According to the Global Terrorism Database, the number of global
83
Table of Contents
fatalities and injuries from terrorist acts has increased 400% from 2005 to 2015, and in recent months the world has witnessed devastating attacks in Paris, Brussels, Nice, San Bernardino, Istanbul and other global cities. In addition, according to the Third National Climate Assessment prepared by the U.S. Global Change Research Program, the United States has been experiencing severe weather events above long-term averages, with, for example, the number of heat waves in 2011 and 2012 at nearly triple the long-term average. Similarly, a PricewaterhouseCoopers study found that the number of cyber security incidents across all industries rose by 38% in 2015 versus the prior year, which was the biggest increase in the 12 years since the study was first published. Taken together, global reinsurer Swiss Reinsurance Company Ltd. found that the cost of disaster events, including man-made and severe weather incidents, reached $85 billion worldwide in 2015.
At the same time, key business and technology trends continue to shift both the fundamental way that organizations communicate with relevant stakeholders and how individuals regularly consume information. People increasingly consume most of their information through mobile devices and applications as well as through social media and other digital channels. Increasingly, less information is shared using traditional “analog” communication methods, such as printed media, television and landline telephones. The proliferation of mobile and digital communications, as well as the emergence of the IoT, has accelerated the speed at which people communicate, exponentially increasing the volume of communications that individuals must process. As a result of these dynamics, it has become imperative that communications be appropriately contextualized, meaningful and actionable.
In light of these trends, communications have become one of the most important areas of technology investment. In a 2015 report, Gartner, Inc. estimates that $1.5 trillion, or 42.5%, of information technology, or IT, expenditure was for communications in 2015. Organizations are reaping the benefits of digital communications to more easily and relevantly interact with their target constituents including customers, partners, employees, residents and other key stakeholders. Likewise, as IT innovation continues to shift to on-demand models, organizations have increasingly migrated from on-premises software to cloud-based solutions in order to improve agility and efficiency when seeking to communicate with their global, mobile, distributed stakeholders.
In order to connect people across disparate communication modalities in diverse locations, organizations are increasingly investing in technologies that unify different analog and digital real-time and non-real-time communications. The integration of real-time enterprise communication services such as instant messaging and voice and video conferencing with non-real-time communication services such as voicemail, facsimile and e-mail can provide a consistent and unified user experience across multiple devices and media types.
During public safety threats and critical business events, the ability to communicate life-saving or damage-mitigating information is crucial. Speed, security, scalability and reliability of communications is essential. The severity, complexity and frequency of these critical events, their implications for personal safety or business performance and rising regulatory and compliance challenges are driving demand for critical communications solutions, which we estimate, based on data from Frost & Sullivan, presented in an independent study commissioned by us, and data from Markets and Markets, represented a $15.6 billion worldwide market opportunity in 2015.
Evolution of Critical Communications Solutions
Traditional solutions for critical communications have not kept pace with the increasingly digital world, the evolving threat landscape and the opportunity to leverage technological innovation to more effectively communicate with people. These solutions are often developed in-house or are not truly enterprise in scale and reliability, leaving many organizations to use analog, manual, one-way and people-based modalities to communicate with relevant stakeholders. These solutions lack the scale to reliably address the breadth of the different critical challenges that organizations increasingly face, the sophistication required to address evolving needs with aggregated data and analysis for threat assessment, automated workflows and the ability to rapidly deliver messages that are tailored to multiple, specific audiences, in precise locations, using a variety of different communication modalities.
Organizations today require a solution that is engineered for modern critical communications. While traditional mass notification solutions are designed to support infrequent one-way messages, new targeted and contextually
84
Table of Contents
relevant critical communications systems must be deployed to deliver interactive support for a far broader range of incidents, both operational and emergency-oriented in nature. Global threats have increased in complexity—from the failure of data centers to more sophisticated cyber incidents and terrorist threats. At the same time, more routine, everyday situations such as those involving IT operations, incident response teams or colleagues that need to converse securely also require a solution that can quickly and contextually reach anyone on any device, anywhere, at any time. As a result of these dynamics, it has become imperative that communications be appropriately contextualized, meaningful and actionable in order to overcome the profound information overload and enable the desired outcome in critical situations to be achieved.
Requirements of Effective Critical Communications Solutions
In order to deliver effective critical communications solutions, several requirements must be met:
| • | Comprehensive Solution. Organizations require an enterprise-scale, comprehensive solution that can provide them with aggregated data and automated workflows and deliver intelligent, contextual messages across multiple communications modalities – all operated from desktop or mobile devices to address their diverse critical communications needs. Traditional providers largely offer point-based products to address a single customer communication challenge, rather than a unified platform with applications that address a wide range of inter-connected critical communications requirements including enabling delivery to a wide variety of device types and geographic locations. |
| • | Scalability and Speed. Organizations require a solution that is agile and flexible enough to reach individuals at both high volume/low frequency intervals, such as emergency mass notification situations, and low volume/high frequency intervals, such as for IT alerting and secure messaging. Critical communications must be capable of delivering tens of millions of communications in near real-time and be architected with redundant delivery pathways to maximize verification and confirmation of receipt of these communications. Traditional products often deliver only one-way “blast” messages and fail to provide reliable infrastructure to support the rapid delivery of communications at the appropriate volume, on any device, to any location around the globe. |
| • | Enterprise-Grade Reliability. Given the inherent nature of critical communications, organizations require a solution that is robust, resilient and highly redundant, with a high level of assured uptime and a low degree of fault tolerance. Organizations expect multiple layers of redundancy and a horizontal scaling model across infrastructure to deliver high availability and performance as well as redundant downstream communications providers to enable services to remain uninterrupted even if a particular provider encounters technical difficulties. |
| • | Situational Assessment. Organizations require ready access to information from weather feeds, threat sources and IT monitoring systems, as well as the ability to incorporate trends from social media and feedback from their personnel in the field, in order to assess critical events and impacted areas. |
| • | Dynamic Location Capability. With today’s mobile workforce, organizations need to be able to notify and organize people based on where they actually are, not just based on their static office or home location. |
| • | Security and Regulatory Compliance. Organizations require a solution that is architected to ensure secure communications given the significance of the content being distributed and the regulatory requirements that apply to the sensitive data being transmitted. These rigorous security and compliance requirements apply to financial services firms, healthcare institutions, the U.S. federal government and other regulated industries, including facilitating compliance with FINRA and HIPAA standards and the privacy and data protection laws and requirements of states and foreign jurisdictions, including, those of the European Union. |
| • | Intelligent Communication and Contextual Personalization. Organizations require sophisticated, intelligent technology that can tailor both the content of communications and the modalities through |
85
Table of Contents
| which they are delivered based on differing individual preferences and roles and responsibilities within the organization. For example, rather than a one-way “blast” message streamed to the masses, technology should enable communications to be tailored to the intended recipient, through any communication modality, to any geography, with contextualized and personalized content relevant to the specific critical situation. Traditional products also do not typically incorporate business rules, workflows and logic to enable contextual and effective communications. These products also generally lack the ability to effectively verify and confirm delivery and receipt of critical communications, failing to enable collaboration during a critical event to ensure that the desired action is successfully taken. |
| • | Ease-of-Use. Given the need for speed and the pressure and anxiety most people experience in critical situations, organizations require a solution that is simple and easy-to-use, particularly when lives and property are at risk. For emergencies, simple user interfaces, automated best practice workflows and ease of use are essential. For operational incidents, applications to meet compliance, security and workflow demands of IT departments and other response teams are critical. |
| • | Real-Time and After-Event Reporting and Analytics. Critical communications by their very definition are of significance to people and businesses and therefore require the highest level of insight and preparation. To ensure that organizations can deliver appropriate communications during critical events, a solution should provide detailed, timely and compliant reporting and analytics to optimize the overall communication process. These solutions should also provide a historical record of past communication events for users who have compliance and regulatory reporting needs. In addition, organizations typically have differentiated reporting requirements based on use cases and management preferences. Critical communications solutions must enable users to easily create and manage many different custom reports throughout the critical communications lifecycle. |
| • | Global Reach and Local Expertise. Global communications require a “local” approach to deal with the complexity of varying cultural preferences, languages and device types, as well as technical and regulatory requirements. With increasingly global workforces, customers demand solutions that can seamlessly overcome geographic boundaries. |
Our Market Opportunity
There is a significant demand for critical communications solutions that meet the above requirements. We estimate, based on data from Frost & Sullivan, presented in an independent study commissioned by us, and data from Markets and Markets, that the market for critical communications solutions represented a $15.6 billion worldwide opportunity in 2015. This consists of an estimated addressable market of $6.3 billion in North America and $9.3 billion outside of North America. As the adoption of targeted and contextually aware critical communications solutions continues to expand and take hold across a broader cross-section of organizations and industry verticals, we estimate, based on data from Frost & Sullivan, presented in an independent study commissioned by us, and data from Markets and Markets, that our addressable market will grow at a compound annual growth rate of 15.4% to $31.9 billion in 2020.
More specifically, Markets and Markets estimates that the aggregate market for mass notification software and services was $3.6 billion in 2015 and is projected to grow at a compound annual growth rate of 18.4% to $9.7 billion in 2021. Within the market for mass notification software and services, Markets and Markets estimates that the distributed recipient solutions segment was $713 million in 2015, and is projected to grow at a compound annual growth rate of 24.8% to $2.6 billion in 2021. Further, Frost & Sullivan estimates that: (1) the market for IT service alerting was $183 million in 2015 and is projected to grow at a compound annual growth rate of 32.7% to $753 million in 2020; (2) the market for telemedicine was $374 million in 2015 and is projected to grow at a compound annual growth rate of 15.0% to $752 million in 2020; (3) the market for secure mobile messaging was $325 million in 2015 and is projected to grow at a compound annual growth rate of 16.4% to $694 million in 2020; (4) the market for community engagement was $122 million in 2015 and is projected to grow at a compound annual growth rate of 33.4% to $516 million in 2020; and (5) the market for internet of things was
86
Table of Contents
$3.3 billion in 2015 and is projected to grow at a compound annual growth rate of 24.6% to $9.9 billion in 2020. Finally, Markets and Markets estimates that the market for safety and security and physical security and information management was $ 9.6 billion in 2015, and is projected to grow at a compound annual growth rate of 8.9% to $14.8 billion in 2020.
Key Benefits of Our Solutions and Competitive Strengths
Everbridge was founded with a vision to help organizations communicate quickly and reliably to deliver the right message to the right people, on the right device, in the right location, at the right time during public safety threats and critical business events. Our critical communications platform enables enterprises and governmental entities to communicate quickly and securely with key stakeholders during critical situations through a variety of applications. Key benefits of our solutions and competitive strengths include the following:
| • | Comprehensive, Enterprise-Scale Platform. The core of our solutions is our SaaS-based critical communications platform, which provides multiple layers of redundancy to assure uptime and delivery of communications regardless of volume or throughput requirements. The platform is secure, scalable and reliable, enabling the delivery and verification of tens of millions of different communications virtually anywhere, in any volume, in near real-time. In 2015, we delivered 1.1 billion communications, or over 30 communications per second, through our globally distributed data centers, up from 251 million communications delivered in 2014, 95 million communications delivered in 2013 and 60 million communications delivered in 2012. We leverage robust, automated rules, workflows, geo-targeting, and algorithms to optimize communication delivery. In addition, we leverage third-party and proprietary data feeds such as police and weather reports to provide organizations with critical and pertinent situational information. Once implemented, our platform provides an environment that makes it easy for enterprises and governmental entities to standardize their critical communications. This standardization enables them to reduce costs and increase the efficiency of multiple critical communications processes. |
| • | Out-of-the-Box, Scalable and Mobile Applications. Our SaaS-based applications are out-of-the box, enterprise-ready and can be utilized without customer development, testing or ongoing maintenance. Regardless of a customer or prospect’s size or needs, our applications are built to scale to its largest and most complex critical communication requirements. Our applications are accessible through a single login and leverage our secure, reliable and resilient platform with a common and intuitive user interface. Our applications are also built for mobile use, delivering key application functionality through common wireless devices, untethering our customers from the desktop. Our SaaS-based platform is updated on a regular basis with new features and functions, with minimal impact to our customers, enabling them to easily take advantage of new capabilities. |
| • | Aggregated Threat Data and Analysis. Our software gathers and analyzes information from weather data feeds, public safety and threat data feeds, social media, IT ticketing systems and monitoring systems, as well as inputs and feedback from two-way and polling messages. Data can be geo-mapped and threat and incident data can be used to automatically trigger simple or complex workflows that are tied to standard operating procedures or run-books. |
| • | Contextual Communications. We enable intelligence and personalization in the critical communications process by delivering contextual communications. Our customers can deliver and escalate critical communications broadly to a mass population or to a targeted subset of individuals based on geographic location, skill level, role and communication modality preferences for rich, two-way collaboration. For example, after Hurricane Sandy, one of our customers used the polling capability of our Mass Notification application to establish transportation options, as well as to communicate with and organize its affected workforce, in order to help thousands of its employees determine whether to return to work or work remotely. Communications can be initiated through an automated process combining rules and situational intelligence or through a manual process directed by an end user, each with a rich critical communications output. |
87
Table of Contents
| • | Dynamic Location Awareness. Our platform can provide organizations with the ability to send and receive notifications based on the last known locations of people, not just based on a static office or home address. Our platform integrates with a variety of sources of location information, including building access control systems and corporate network access solutions. This location-specific approach enables organizations to quickly determine which individuals may be affected by a public safety threat or able to respond to a critical business event, and to provide targeted and relevant instructions and two-way communications. |
| • | Large, Dynamic and Rich Communications Data Asset. As of July 31, 2016, our data asset consists of our contacts databases that manage approximately 100 million contact profiles and connections from more than 3,000 customers based in 25 countries. Our contacts databases, which we refer to as contact stores, are initially created through an upload of contacts from the customer and automatically updated with the most current contact information provided by the customer or by individuals who opt-in to receive notification from our Community Engagement application. This eliminates the need for time consuming manual updates and reduces the likelihood of missing or out-of-date information. Contact profiles are also simultaneously enriched by geographic, situational and other real-time data. Our contact stores are repositories for all contact details, attributes and business rules and preferences, such as a person’s last-known location, language spoken, special needs, technical certifications and on-call status. |
| • | Robust Security, Industry Certification and Compliance. Our platform is built on a secure and resilient infrastructure with multiple layers of redundancy. Many of our enterprise applications are designed to meet rigorous security and compliance requirements for financial services firms, healthcare institutions, the U.S. federal government and other regulated industries, including facilitating compliance with standards imposed by FINRA and HIPAA. Our solutions received designation under the Support Anti- terrorism by Fostering Effective Technology Act of 2002, or SAFETY ACT, and certification by U.S. Department of Homeland Security, or DHS, that places us on the approved product list for homeland security. Our solutions are also accredited under the Federal Information Security Management Act of 2002, or FISMA, and we are in the process of seeking accreditation under the Federal Risk and Authorization Management Program, or FedRAMP, which we expect to receive during 2017. Further, we maintain multiple local contact stores across North America and Europe to ensure that we meet local data privacy requirements, such as the data protection laws implemented by the European Union Member States under Directive 95/46 EC, and we seek to follow and comply with guidelines and rules established by local or national telecommunications regulatory bodies, such as the Telecom Regulatory Authority of India, or TRAI. In addition, we work directly with multiple telecommunications providers to ensure we meet local messaging requirements, which also vary by country. |
| • | Automated Workflows. Our platform automates the workflows required to complete a critical notification, including establishing the individuals within an organization authorized to send messages, the groups of stakeholders to whom messages will be sent and the content of messages to be sent to different groups of relevant stakeholders, in each case based on incident type. We believe that this automation reduces the amount of time required to send critical notification as well as the associated cost. Our platform also enables customers to automatically establish procedures for improving the success of communication efforts. For example, if a voice message does not receive a live response, our platform can be programmed to automatically send a text or e-mail message to the intended recipient. Likewise, in the context of an IT outage, if the first individual contacted does not respond in a prescribed period of time, our platform can be programmed to automatically contact a second individual with a similar skill set. |
| • | Globally Local. Our platform is designed to be utilized globally while accounting for local cultural, linguistic, regulatory and technological differences. We have relationships with suppliers and carriers in multiple countries to ensure delivery in compliance with local, technical and regulatory requirements. We have localized our user interface in 15 languages and dialects that are spoken by more than 60% of |
88
Table of Contents
| the world’s population. We deliver communications to more than 200 countries and territories and work with multiple SMS providers to identify and overcome regulatory hurdles. We deploy and actively manage an optimal mix of redundant message-based communication paths to ensure high delivery and response rates for text-based communications. Where applicable, we follow and comply with guidelines and rules established by local or national telecommunications regulatory bodies, which affords us a competitive differentiation. |
| • | Next-Generation, Open Architecture. We developed our platform to easily integrate our applications with other systems. Our solutions provide open APIs and configurable integrations, enabling our platform to work with our customers’ and partners’ pre-existing processes and solutions, increasing the business value we deliver. This allows customers’ to integrate third-party applications to configure solutions that best leverage our enterprise critical communications platform. As technology continues to evolve, our open next-generation platform allows us to rapidly integrate new innovations, such as IoT connected devices, and remain critical to our customers’ ongoing and future needs. |
| • | Actionable Reporting and Analytics. Our platform provides real-time dashboards, advanced map-based visualization, and ad-hoc reporting across notifications, incidents and contacts. This information is easily accessed for required after-event reviews, continuous communication process improvements and regulatory compliance. Our platform also provides longer term historical information on past communication events for users who have compliance and regulatory reporting needs. |
Our Growth Strategy
We intend to drive growth in our business by building on our position as a global provider of critical communications and enterprise safety applications. Key elements of our growth strategy include:
| • | Accelerate Our Acquisition of New Customers. We believe that we are in the early stages of penetration of the large and growing market for targeted and contextually relevant critical communications. We intend to capitalize on our growing portfolio of applications and the technological advantages of our critical communications platform to continue to attract new customers. In parallel, we plan to attract new customers by investing in sales and marketing and expanding our channel partner relationships. |
| • | Further Penetrate Our Existing Customers. With revenue retention rates of over 110% for each of the last three years, we believe that there is a significant opportunity within our existing customer base to expand their use of our platform, both by selling new applications and features to our existing customers new applications and features and selling to additional departments in their organizations. Our pricing model is based on the number of applications subscribed to and, per application, the number of people, locations and things connected to our platform as well as volume of communications, which allows us to capture more spend as our customers grow. While our platform currently includes seven different critical communications applications, one of these applications was introduced in the middle of 2014, three of these applications were introduced in 2015 and one was not introduced until 2016. Accordingly, we believe that we have a significant opportunity to increase the lifetime value of our customer relationships as we educate customers about the benefits of our current and future applications that they do not already utilize. We have already begun to demonstrate success in this regard as these new applications, which include our IT Alerting, Safety Connection, Community Engagement, Secure Messaging and Internet of Things applications, are comprising an increasing proportion of our contracted sales, which represent the total dollar value of new agreements entered into during the prior 12 months, exclusive of renewals, growing from 6% in the first quarter of 2015 to 12% in the second quarter of 2015, 17% in the third quarter of 2015, 22% in the fourth quarter of 2015, 26% in the first quarter of 2016 and 27% in the second quarter of 2016. |
| • | Develop New Applications to Target New Markets and Use Cases. Our platform is highly flexible and can support the development of new applications to meet evolving safety and operational challenges. For example, our Safety Connection application enables organizations to send notifications based on the dynamic last known location of an individual, while actively incorporating threat and other data to allow |
89
Table of Contents
| for targeted and relevant communications. While the historic market for corporate security and safety solutions has been focused on establishing perimeters – locks, alarms and guards – to keep threats to employees outside of the physical premises, our solutions are responsive to the dramatic shift towards an increasingly mobile workforce where employees spend less time in traditional offices. At the same time, protection of employees at traditional places of business remains crucial. Market research completed in 2016 by us together with Emergency Management & Safety Solutions, found that while organizations were very concerned about the risk of workplace violence, 79% said they were at best only somewhat prepared for an active shooter event, and communicating with people in an impacted building was seen as the biggest challenge. In light of these dynamics, we intend to continue to develop new applications for use cases in a variety of new markets and leverage our platform and existing customer relationships as a source of new applications, industry use cases, features and solutions. We have a disciplined process for tracking, developing and releasing new applications and features that are designed to provide our customers with a strong value proposition. |
| • | Expand Our International Footprint. We estimate, based on data from Frost & Sullivan, presented in an independent study commissioned by us, and data from Markets and Markets, that the market for critical communications solutions outside of North America was $9.3 billion in 2015, and is expected to grow at a compound annual growth rate of 16.2% to $19.8 billion in 2020. For the year ended December 31, 2015, approximately 14% of our revenue was derived from customers located outside of the United States and we therefore believe that we have a significant opportunity to grow our international footprint. We intend to continue to expand our local presence in regions such as Europe, the Middle East and Asia to leverage our relationships with local carriers and our ability to deliver messages to over 200 countries and territories in 15 languages and dialects, as well as expand our channel partnerships, in order to capitalize on this significant opportunity, and also to opportunistically consider expanding in other regions. |
| • | Maintain Our Technology and Thought Leadership. We will continue to invest in our aggregation, assessment and critical communications platform and our applications to maintain our technology leadership position. For example, we believe that we provide the first solution to offer dynamic versus static location awareness integrated with analysis and communications for the employee safety and security marketplace, and plan to continue disrupting the existing physical safety and security solution model. Further, we believe we have a competitive advantage through our commitment to innovation and thought leadership that has enabled us to take market share from our competitors and accelerate our growth. For example, we continue to enhance Everbridge University as a comprehensive best practices and critical communications learning environment, which we believe provides substantial value to our customers and supports our industry position. To date, Everbridge University online sessions have grown to deliver over 590,000 lessons. |
| • | Opportunistically Pursue Acquisitions. We plan to selectively pursue acquisitions of complementary businesses, technologies and teams that allow us to penetrate new markets and add features and functionalities to our platform. Our management team has completed a significant number of M&A transactions during their careers and we plan to leverage their proven track record of successfully sourcing, executing and integrating acquisitions as we pursue new opportunities. |
Our Platform
Since inception, our SaaS-based critical communications platform was architected on a single code base to deliver multi-tenant capability and the speed, scale and resilience necessary to communicate globally when a serious event occurs. Our platform is designed to address both the emergency and operational components of a critical communications program. Our platform is capable of providing two-way communications and verified delivery in accordance with our customers’ escalation policies. Our platform has multi-modal communications reach, including redundant global SMS and voice delivery capabilities, and is designed to comply with local,
90
Table of Contents
technical and regulatory requirements, which we believe has provided us with a competitive advantage. For example, we believe that our early deployment of local SMS codes intended to comply with rules established by the TRAI allowed us to increase our SMS delivery success rates in India.
Additional core attributes of our platform include:
| • | Multi-tenant architecture that supports multiple layers of redundancy to maximize uptime and delivery of critical content, regardless of volume or throughput requirements. |
| • | Dynamic spatial/geographic information system capability to geo-target communications by zip code, street address or a specific radius from a location. |
| • | Support for two-way communications and alerting on over 100 different devices and endpoints, including landline and wireless phones, hand-held communication and other voice-capable devices, satellite, SMS, two-way radios, outdoor digital signage, sirens and internet enabled devices. |
| • | Designed to meet rigorous security and compliance requirements for financial services firms, healthcare institutions, the U.S. federal government and other regulated industries, including facilitating compliance with health care requirements such as HIPAA privacy and security standards. |
| • | Extensive set of APIs and configuration capabilities to allow customers and partners to easily integrate our platform with other systems. Our APIs’ two-way invocation capabilities enable third-party systems to flexibly and easily integrate with our platform. |
| • | Supports easy-to-use native mobile applications, including multiple secure mobile applications for message initiation, management and reporting. |
| • | Supports push notifications and two-way conversations that enable mobile users to send and receive secure messages such as text, pictures, videos and the users’ current geographic locations. |
Our Contact Stores
Our contact stores manage approximately 100 million contact profiles and connections from more than 3,000 customers based in 25 countries as of July 31, 2016, up from 15 million contact profiles as of December 31, 2012. They are initially created through an upload of contacts from the customer and are automatically updated with the most current contact information provided by the customer or by individuals who opt-in to receive notification from our Community Engagement application. Our contact stores are simultaneously enriched by geographic, situational and other real-time data. Our contact stores are repositories for all contact details, attributes and business rules and preferences, such as a person’s last-known location, language spoken, special needs, technical certifications and on-call status.
We leverage the data contained in our contact stores in a number of significant ways. Our data asset across multiple verticals enables us to develop best practices for reaching the intended contact, on the correct device, at the right location, at the appropriate time. We also use this data to better understand our customer base and their emerging use cases in order to improve our existing applications and develop new applications.
Everbridge Publishing Network
An important component of our platform is our Everbridge Publishing Network, which allows our customers to share relevant situational awareness information with each other. Public safety agencies, for example, can publish information to the Everbridge Publishing Network about incidents that might prove disruptive to the movement of people, goods and services for businesses within a certain area. If any of those businesses are also customers of ours, they will receive this information from a source they know is vetted and reliable, and will be able to take timely steps to mitigate or remediate the situation.
91
Table of Contents
Our Applications
Through our critical communications platform, we deliver reliable enterprise-ready applications that provide organizations with the ability to deliver contextual communications in any volume, in near-real time. We have designed our applications’ user interface to be easy to use. We understand that since some of our applications will be utilized to send large volumes of messages to key stakeholders during stressful situations, streamlining the user interface to reduce user errors and anxiety is essential. We conduct extensive usability testing and design reviews with our stakeholders, and have applied in our designs the lessons learned over more than a decade of working with critical communications users and professionals.
Our applications enable:
| • | Communications to key stakeholders during emergency situations. |
| • | Corporate communications with customers and employees. |
| • | Automated outreach to on-call personnel. |
| • | Integration of physical security data with location awareness data gathered from travel, network and access systems to rapidly find and communicate with employees during disruptive events. |
| • | Securely designed and efficiently implemented communications among healthcare providers and patients. |
| • | Community engagement and collaboration with citizens and businesses. |
| • | Workgroup collaboration on mobile devices. |
| • | Critical IoT communications between machines and from machines to people. |
Our applications include:
| • | Mass Notification. Our secure, scalable and reliable Mass Notification application is our most established application and enables enterprises and governmental entities to send contextually aware notifications to individuals or groups to keep them informed before, during and after natural or man-made disasters and other emergencies. We provide robust analytics, map-based targeting, flexible group management, distributed contact data, language localization, multiple options for contact data management and a globally-optimized approach to voice and SMS routing. We also support community engagement functionality, which provides a direct link between residents and emergency management departments with the goal of fostering public safety. |
| • | Incident Management. Our Incident Management application enables organizations to automate workflows and make their communications contextually relevant using drag and drop business rules to determine who should be contacted, how they should be contacted and what information is required. We believe that this application decreases costly human errors and reduces downtime, while simultaneously capturing required compliance information. We also support cross-account collaboration and situational intelligence sharing during crises for corporations and communities. |
| • | IT Alerting. Our IT Alerting application enables IT professionals to alert and communicate with key members of their teams during an IT incident or outage, including during a cyber security breach. The application integrates with IT service management platforms, including ServiceNow, and uses automatic escalation of alerts, on-call scheduling and mobile alerting to automate manual tasks and keep IT teams collaborating during an incident. We also provide real-time shift calendars with integrated on-call notifications to help users better manage employee resources and get the right message to the right person, at the right time through automated staffing. Taken together, our IT Alerting application has the potential to provide meaningful savings to organizations by reducing mean-time-to-repair as each minute of unplanned downtime costs organizations an average of approximately $5,600, according to Gartner. |
92
Table of Contents
| • | Safety Connection. Our Safety Connection application enables organizations to send notifications based on dynamic last known location of an individual, including the airport, street, building floor or conference room at which the individual was most recently present, while actively incorporating threat and other data to allow for targeted and relevant communications. When fully deployed, the application can also aggregate near real-time data from multiple sources, including building access control systems, wired and wireless network access points, travel management systems and mobile application check-ins. We believe that Safety Connection represents a significant advance in helping organizations use critical communications to keep their constituents safe, as many current solutions use only static office and residential locations that are not sufficiently location-aware relative to an increasingly mobile workforce. |
| • | Community Engagement. Our Community Engagement application integrates emergency management and community outreach by providing local governments with a unified solution to connect residents to both their public safety department, public information resources, and neighbors via social media and mobile applications. This creates a stronger and more engaged community improving the communication reach for emergency personnel, while providing residents with real-time emergency and community information, and allows residents to anonymously opt-in and provide tips. For example, the City of Philadelphia experienced a 70% increase in opt-ins in 2015 with our Community Engagement application. |
| • | Secure Messaging. Our Secure Messaging application meets the compliance and security requirements of organizations that need to provide an alternative way for their employees to communicate and share nonpublic information. A tailored version of our Secure Messaging application, HipaaBridge, is designed for medical professionals and facilitates HIPAA-compliant communications without the need for pagers and other single use devices, supporting the development of a “connected” hospital. HipaaBridge also facilitates telemedicine by allowing medical professionals to hold video conferences with patients and other medical professionals as well as share medical imaging, lab results and other critical information. Our Secure Messaging application also enables financial services organizations’ employees and customers to securely communicate via text, voice, and video, while remaining FINRA compliant. |
| • | Internet of Things. Our Internet of Things application enables customers to extend traditional machine-to-machine communication to people when required. Through our secure communications channels, our critical communications engine can integrate directly with medical devices, workplace security controls, public infrastructure and other systems to either activate the device, confirm activation, or mobilize people for interaction and response. |
Our Technology
The design and development of our critical communications platform includes the following key attributes:
| • | Robust, Enterprise-Grade Scalability and Reliability. Given the mission-critical nature of our solutions, our multi-tenant platform was designed to provide a robust, high level of resiliency, scalability and redundancy. We use multiple geographically distributed service providers and communications carriers to achieve a high degree of redundancy, fault tolerance and cost-effective operations. We have multiple layers of redundancy and a horizontal scaling model across our infrastructure to deliver high availability and performance. Our redundant data centers are located in Los Angeles, California; Denver, Colorado; San Francisco, California; and Toronto, Canada as well as in Germany, the United Kingdom and the Netherlands. Similarly, we leverage redundant downstream communications providers to enable our services to remain uninterrupted even if a particular provider encounters technical difficulties. |
| • | Multi-Modal, Globally Local Communications Delivery. We optimize international call routing across hundreds of telecommunications providers to enable higher voice quality, improved delivery rates during emergencies and the ability to configure local caller IDs to improve recognition and answer rates. We also work with multiple SMS providers to identify regulatory hurdles and deploy and actively manage an optimal mix of national and international SMS codes to ensure high delivery and response rates. |
93
Table of Contents
| • | Security and Compliance. Our security and data protection policies and controls are based on the Federal Information Security Management Act risk management framework defined by the National Institute of Standards and Technology, or NIST, special publication, or SP, 800-37. To meet the rigorous standards of our enterprise and government customers, an independent and accredited third-party security assessment firm annually verifies our compliance with over 800 security and data protection requirements detailed in NIST SP 800-53. Through this process, we map our compliance with other security and data privacy frameworks including ISO 27001 and HIPAA. In addition, we hold certifications including SysTrust Statement on Standards for Attestation Engagements No. 16, Service Operations Controls 2 & 3 and operate in accordance with the TRUSTe Data Privacy Seal for personal data. We have also been awarded approvals by DHS that enable us to receive priority treatment for vital voice and data circuits or other telecommunications services. Most recently, our critical communications solutions received designation under the SAFETY ACT and certification by DHS that places us on the approved product list for homeland security and provides us with the highest level of liability protection available under the SAFETY ACT. The certification similarly protects our customers from legal liability claims arising from acts of terrorism, as contemplated by the SAFETY ACT. Further, our solutions are also accredited under FISMA and we are in the process of seeking accreditation under FedRAMP, which we expect to receive during 2017. |
| • | Hybrid Infrastructure. To provide highly scalable and global solutions, we employ redundant, geographically diverse production implementations of our platform infrastructure in multiple SOC 2-compliant data center facilities in North America and Europe. Within each data center, we utilize a hybrid-cloud architecture that enables us to leverage both proprietary and third-party infrastructure services to enable “on-demand” capacity and performance without substantial upfront investment. Our hybrid-cloud architecture enables our customers to select the location in which to store their contact data, allowing for compliance with local and international data privacy laws. Our architecture also enables our platform to dynamically determine the best location from which to deliver critical communications on behalf of our customers and solves many international communications delivery challenges by utilizing in-country or in-region telephony, messaging and data communication providers. Our infrastructure is continuously maintained and monitored by dedicated engineers based in redundant network operations centers in the Los Angeles and Boston areas. |
| • | Dynamic Location Detection. Our platform can create and update dynamic data sets containing a contact’s last-known location, including the airport, street, building floor or conference room at which the contact was most recently present. Multiple data sources can be aggregated including building access control and badging systems, wired and wireless network access points, and corporate travel management and office hoteling systems. This data is used to best locate a contact in an emergency or critical business situation, independent of the contact’s home or office location. Contacts can also share their location via a three-in-one mobile panic button application, which sends a panic message to the applicable organization’s security team, and also includes the ability to send audio and video content, to check-in to capture and report geo-location data and to establish a safe corridor through a potentially unsafe area. |
Our Comprehensive Customer Support Services
We are committed to the success of our customers. We demonstrate this commitment by offering a comprehensive set of support services to help our customers get started quickly, follow best practices, and realize on-going value from our critical communications solution. Our support services include:
| • | Rapid Onboarding. We leverage a proven methodology and domain expertise, honed through thousands of customer onboardings worldwide, to enable rapid use of our platform and compliance with industry best practices. Promptly after a customer purchases one or more of our applications, our dedicated onboarding team begins to configure our solutions to meet the customer’s needs, including specific messages and scenarios, ad-hoc report templates and incident management reviews. The onboarding |
94
Table of Contents
| service incorporates years of critical communications experiences, including our critical communications certification training through Everbridge University, to improve customer success. |
| • | Everbridge University. We offer online education, training and professional development through Everbridge University, with role-based training modules that can be customized to meet a customer’s needs and that can facilitate formalized knowledge transfer and ensure ongoing self-sufficiency. Everbridge University is available anytime, online and is configured for self-paced use. To date, Everbridge University has delivered over 590,000 online training lessons. |
| • | Dedicated Account Management. We assign dedicated account managers to all customers. Our account managers work exclusively with customers in a specific industry so they understand the applicable needs and challenges. They act as informed guides to help our customers make effective decisions in deploying our applications. Account managers perform regular service reviews and post-incident analyses of customer communications to incorporate communication best practices, and recommend additional applications to meet the customer’s critical communications needs. |
| • | 24/7 Technical Support & Emergency Live Operator Service. We have established geographically redundant technical support centers in the Los Angeles, California; Boston, Massachusetts; and London, United Kingdom areas. From these support centers, we offer our customers 24/7 support by phone, email or through our online support center. In addition, our support centers offer a 24/7 emergency live operator service to assist customers with sending critical communications. |
| • | Premium Support Services. With an understanding of the critical role that our solution plays, we have invested in assembling an expert professional services organization to deliver premium support service packages to our customers. Our professional services team includes certified emergency management and critical communications practitioners. Our premium support services address the unique challenges of customers’ organizational structures, operational requirements, implementation and training needs. We believe that we help customers achieve faster time-to-value by providing on-site project management, consultation with a certified critical communications professional, creation of client-specific message and scenarios, development of ad-hoc report templates and on-site emergency and incident management reviews. |
Our Customers
Our customer base has grown from 867 customers at the end of 2011 to more than 3,000 customers as of July 31, 2016. We define a customer as a contracting entity from which we generated $100 or more of revenue in the prior month, either directly or through a channel partner. We do not include customers of our wholly-owned subsidiary, Microtech, which generates an immaterial amount of our revenue in any given year. At the end of 2011 we had 20 customers with contracts valued at $100,000 or more, whereas as of June 30, 2016 we had 100 customers with contracts valued at $100,000 or more, including seven customers with contracts in excess of $500,000. As of July 31, 2016, our customers were based in 25 countries and included eight of the 10 largest U.S. cities, seven of the 10 largest U.S.-based investment banks, 24 of the 25 busiest North American airports, six of the 10 largest global auto makers, all four of the largest global accounting firms and four of the 10 largest U.S.-based health care providers. We provide solutions to customers of varying sizes, including enterprises, small businesses, non-profit organizations, educational institutions and government agencies. Our customers span a wide variety of industries including technology, energy, financial services, transportation, healthcare and life sciences, manufacturing, media and entertainment, retail, higher education and professional services. No customer contributed more than 4% of our total revenue in 2015 or the six months ended June 30, 2016.
95
Table of Contents
Some of our representative customers by sector include the following:
| Enterprise |
Healthcare |
State and Local Government | ||
| Alexion Pharmaceuticals |
Alexian Brothers Medical Center | Boston Police Department | ||
| Cardtronics |
Boston Children’s Hospital | Chicago Department of Aviation | ||
| Choice Hotels |
Catholic Health Initiatives | City of Torrance | ||
| Customers Bank |
Children’s Hospital of Philadelphia | Florida Division of Emergency Management | ||
| Digital Realty |
Covenant Health System | Los Angeles Police Department | ||
| DTE Energy |
Florida Health | Miami International Airport | ||
| East West Bank |
Hawaii Pacific Health | Muskingum Watershed Conservancy District | ||
| EnerNOC |
Molina Healthcare | National Capital Region | ||
| Ericsson |
Penrose St. Francis Health Services | Northeast Region Community Awareness | ||
| Express Scripts |
Spectrum Health | Emergency Response | ||
| |
Vanderbilt University Medical Center | State of Connecticut, Department of | ||
| KOR Energy |
Emergency Services and Public Protection | |||
| Pearson |
University of Louisiana System | |||
| Sierra Nevada |
U.S. Department of Transportation | |||
| Uber |
||||
| Xerox |
96
Table of Contents
Everbridge Case Studies
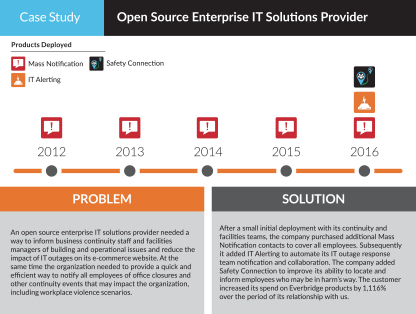
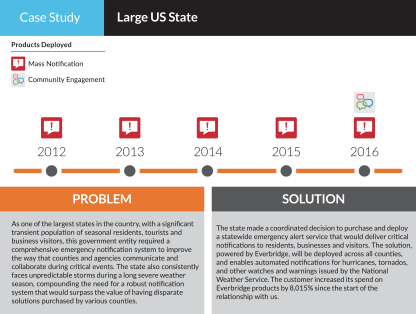
97
Table of Contents
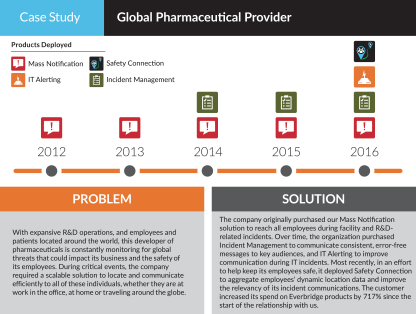
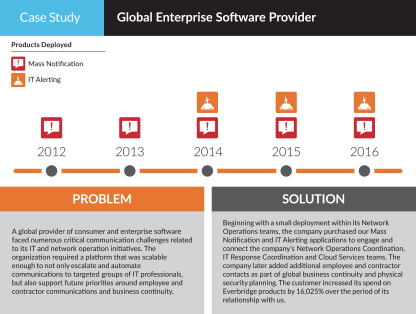
Sales and Marketing
Our sales and marketing organizations collaborate to create brand preference, efficiently and effectively generate leads, build a strong sales pipeline and cultivate customer relationships to help drive revenue growth. Our go-to-market strategy consists of a strong thought-leadership program, digital marketing engine and a diversified sales organization designed to efficiently sell across vertical markets to organizations of all sizes. We have dedicated sales teams focused on corporate customers, government customers and healthcare organizations, which covers U.S. federal, state and local governmental entities.
We believe that our sales and marketing model is economically compelling. We spent $0.93 to generate each $1.00 of new sales in 2015, which reflects our sales and marketing expense incurred in 2015 (other than expense
98
Table of Contents
related to full-time employees dedicated to client retention) compared to 12 months of contract value for contracts entered into in 2015, and $0.06 to renew each $1.00 of renewal sales in 2015, which reflects our sales and marketing expense related to full-time employees dedicated to client retention compared to 12 months of contract value for contracts renewed in 2015.
Sales
We sell our solutions through our telephone and direct inside sales teams, a direct field sales team and a growing partner channel. Our global sales teams focus on both new customer acquisition and up-selling and cross-selling additional and new offerings, respectively, to our existing customers. Our sales teams are organized by geography, consisting of the Americas; Europe, the Middle East and Africa, or EMEA; as well as by target organization size. Our inside sales team focuses typically on small and middle-market transactions, while larger or more complex transactions are generally handled by our direct field sales teams. Our highly trained sales engineers help define customer use cases, manage pilots and train channel partners.
In addition to the vertical and geographic distribution of our salesforce, we have dedicated teams of account executives focused on net new accounts, account managers responsible for renewal and growth of existing accounts, and business development representatives targeting new and growth business opportunity creation. Our sales representatives use phone, email and web meetings to interact with prospects and customers. In 2015, we increased the headcount of our sales organization by 51%. We intend to continue to invest in building our global sales and go-to-market organizations.
We also sell through channel partners both domestically and internationally. To help integrate our applications with other third-party services and take advantage of current and emerging technologies, we seek to enter into alliances with leading technology companies.
Marketing
We focus our marketing efforts on increasing the strength of the Everbridge brand, communicating product advantages and business benefits, generating leads for our salesforce and channel partners, leveraging geographic market strengths and driving product adoption. We run campaigns that take advantage of a network effect in which success within a region encourages other organizations within that area to choose our solutions, in part to be using a system consistent with that of other entities in the area with which they may share information or best practices. We deliver targeted content to demonstrate our thought leadership in critical communications best practices and use digital advertising methods to drive conversion of potential prospects, which convert to opportunities for our sales organization.
Our marketing team focuses on inbound marketing through our industry-leading content, resources, and sharing customer best practices. We rely on multiple marketing and sales automation tools to efficiently market to, and automatically identify qualified individuals using product and industry specific criteria. We use multiple marketing tactics to engage with prospective customers including: email marketing, event marketing, print and digital advertising, and webinar events. We engage with existing customers to provide vertically-based education and awareness and to promote expanded use of our current and new software offerings within these customers. We also host regional and national events to engage both customers and prospects, deliver product training and foster community.
Research and Development
We invest substantial resources in research and development and leverage offshore development in multiple geographies to implement a “follow the sun” engineering strategy and to increase the efficiency of our overall development efforts. We enhance our core technology platform and applications, develop new end market-specific solutions and applications, and conduct application and quality assurance testing. Our technical and engineering team monitors and tests our applications on a regular basis, and we maintain a regular release process to refine, update, and enhance our existing applications. Research and development expense totaled $5.7 million, $7.4 million, $11.5 million and $6.6 million for 2013, 2014, 2015 and the six months ended June 30, 2016 respectively.
99
Table of Contents
Our Competition
The market for critical communications solutions is highly fragmented, intensely competitive and constantly evolving. We compete with an array of established and emerging companies, many of whom are single product or single market focused, as well as in-house solutions. With the introduction of new technologies and market entrants, we expect that the competitive environment to remain intense going forward. The primary competitors for our Mass Notification and Incident Management applications include: BlackBerry Limited, Emergency Communications Network, F24 AG, Enera Inc., Nuance Communications, Inc., SWN Communications Inc., SunGard Data Systems Inc. and xMatters, Inc. The primary competitors for our IT Alerting application include: PagerDuty, Inc. and xMatters, Inc. The primary competitors for our Secure Messaging application include: DocHalo, LLC, Spok, Inc., Perfect Serve, Inc. and TigerText, Inc.
We compete on the basis of a number of factors, including:
| • | product functionality, including local and multi-modal delivery in international markets; |
| • | breadth of offerings; |
| • | performance, security, scalability and reliability; |
| • | compliance with local regulations and multi-language support; |
| • | brand recognition, reputation and customer satisfaction; |
| • | ease of implementation, use and maintenance; and |
| • | total cost of ownership. |
We believe that we compete favorably with respect to all of these factors and that we are well positioned as a leading provider of targeted and contextually relevant critical communications.
Intellectual Property
Our future success and competitive position depend in part on our ability to protect our intellectual property and proprietary technologies. To safeguard these rights, we rely on a combination of patent, trademark, copyright and trade secret laws and contractual protections in the United States and other jurisdictions.
As of July 31, 2016, we had nine issued patents and three patent applications pending in the United States. We also expect to complete the purchase of an additional four issued United States patents in the fourth quarter of 2016. We cannot assure you that any patents will issue from any patent applications, that patents that issue from such applications will give us the protection that we seek or that any such patents will not be challenged, invalidated, or circumvented. Any patents that may issue in the future from our pending or future patent applications may not provide sufficiently broad protection and may not be enforceable in actions against alleged infringers.
We have registered the “Everbridge” and “Nixle” names in the United States, and have registered the “Everbridge” name in the European Union. We have registrations and/or pending applications for additional marks in the United States; however, we cannot assure you that any future trademark registrations will be issued for pending or future applications or that any registered trademarks will be enforceable or provide adequate protection of our proprietary rights.
We also license software from third parties for integration into our offerings, including open source software and other software available on commercially reasonable terms. We cannot assure you that such third parties will maintain such software or continue to make it available.
We are the registered holder of a variety of domestic and international domain names that include everbridge.com, as well as similar variations on that name.
100
Table of Contents
In order to protect our unpatented proprietary technologies and processes, we rely on trade secret laws and confidentiality agreements with our employees, consultants, vendors and others. Despite our efforts to protect our proprietary technology and trade secrets, unauthorized parties may attempt to misappropriate, reverse engineer or otherwise obtain and use them. In addition, others may independently discover our trade secrets, in which case we would not be able to assert trade secret rights, or develop similar technologies and processes. Further, the contractual provisions that we enter into may not prevent unauthorized use or disclosure of our proprietary technology or intellectual property rights and may not provide an adequate remedy in the event of unauthorized use or disclosure of our proprietary technology or intellectual property rights.
If we become more successful, we believe that competitors will be more likely to try to develop solutions that are similar to ours and that may infringe our proprietary rights. It may also be more likely that competitors or other third parties will claim that our solutions infringe their proprietary rights.
Patent and other intellectual property disputes are common in our industry and we have been involved in such disputes from time to time in the ordinary course of our business. Some companies, including some of our competitors, own large numbers of patents, copyrights and trademarks, which they may use to assert claims against us. Third parties may in the future assert claims of infringement, misappropriation or other violations of intellectual property rights against us. They may also assert such claims against our customers whom we typically indemnify against claims that our solution infringes, misappropriates or otherwise violates the intellectual property rights of third parties. As the numbers of products and competitors in our market increase and overlaps occur, claims of infringement, misappropriation and other violations of intellectual property rights may increase. Any claim of infringement, misappropriation or other violation of intellectual property rights by a third party, even those without merit, could cause us to incur substantial costs defending against the claim and could distract our management from our business.
Culture and Employees
We believe that our culture has been a key contributor to our success to-date and that the critical nature of the solutions that we provide promotes a sense of greater purpose and fulfillment in our employees. We have invested in building a strong corporate culture and believe it is one of our most important and sustainable sources of competitive advantage.
As of June 30, 2016, we had 430 full-time employees, including 94 in data center operations and customer support, 168 in sales and marketing, 111 in research and development and 57 in general and administrative. As of June 30, 2016, we had 332 full-time employees in the United States and 98 full-time employees internationally. None of our U.S. employees are covered by collective bargaining agreements. We believe our employee relations are good and we have not experienced any work stoppages.
Facilities
Our principal executive offices are located in Burlington, Massachusetts, where we occupy an approximately 35,000 square-foot facility under a lease expiring on May 30, 2017, and in Pasadena, California, where we occupy an approximately 19,000 square-foot facility under a lease expiring on June 30, 2018. We also have offices in San Francisco, California; Windsor, United Kingdom; Colchester, United Kingdom and Beijing, China.
Legal Proceedings
From time to time we may become involved in legal proceedings or be subject to claims arising in the ordinary course of our business. We are not presently a party to any legal proceedings that, if determined adversely to us, would individually or taken together have a material adverse effect on our business, operating results, financial condition or cash flows. Regardless of the outcome, litigation can have an adverse impact on us because of defense and settlement costs, diversion of management resources and other factors.
101
Table of Contents
Executive Officers and Directors
The following table sets forth information concerning our executive officers and directors as of June 30, 2016:
| Name |
Age |
Position(s) | ||
| Executive Officers | ||||
| Jaime Ellertson | 58 | President, Chief Executive Officer and Chairman of the Board of Directors | ||
| Kenneth S. Goldman | 57 | Senior Vice President, Chief Financial Officer and Treasurer | ||
| Imad Mouline | 46 | Senior Vice President and Chief Technology Officer | ||
| Joel Rosen | 58 | Chief Marketing Officer | ||
| Elliot J. Mark | 51 | Senior Vice President and General Counsel | ||
| Scott Burnett | 50 | Senior Vice President, Operations | ||
| Yuan Cheng | 44 | Senior Vice President, Engineering | ||
| Nicholas Hawkins | 54 | Managing Director, EMEA | ||
| Gary Phillips | 56 | Senior Vice President, Sales | ||
| Non-Employee Directors | ||||
| Richard D’Amore | 62 | Director | ||
| Bruns Grayson | 69 | Director | ||
| David Henshall | 48 | Director | ||
| Kent Mathy | 56 | Director | ||
| Cinta Putra | 50 |
Director | ||
Executive Officers
Jaime Ellertson has served as our President and Chief Executive Officer since September 2011 and as Chairman of our board of directors since March 2011, after joining our board of directors in April 2010. From November 2010 to September 2011, Mr. Ellertson was Chief Executive Officer and chairman of the board of directors of CloudFloor Corporation, a provider of cloud solutions, which we acquired in 2011. Previously, Mr. Ellertson served as the Chief Executive Officer and President and as a member of the board of directors of Gomez Inc., a company specializing in monitoring and managing website data and web application performance, from December 2005 to October 2010. From 2000 to July 2005, Mr. Ellertson served as Chief Executive Officer and President and as a member of the board of directors of S1 Corporation, a software provider to the financial services marketplace, which was acquired by ACI Worldwide Inc. He also previously served as chairman of the board of directors and Chief Executive Officer of Interleaf, Inc., a provider of software tools for e-content management, from 1997 until its acquisition by BroadVision, Inc. in April 2000, after which he served as Executive Vice President and General Manager of Worldwide Strategic Operations for BroadVision, a provider of self-service applications, until November 2000. Earlier in his career, Mr. Ellertson founded several software companies including Openware Technologies Inc., Document Automation Corporation and Purview Technologies Inc. Since June 2014, Mr. Ellertson has served as chairman of the board of directors of hVIVO PLC, a viral challenge and services company, and since August 2012, Mr. Ellertson has served as a member of the board of directors of PeopleFluent, a provider of human capital management software and services. From December 2010 to December 2014, Mr. Ellertson served as a member of the board of director of Qvidian, a provider of cloud-based sales execution solutions. Our board of directors believes that Mr. Ellertson’s business expertise and his daily insight into corporate matters as our Chief Executive Officer qualify him to serve on our board of directors.
Kenneth S. Goldman has served as our Senior Vice President and Chief Financial Officer since April 2015. From July 2014 to March 2015, Mr. Goldman was Executive Vice President and Chief Financial Officer of Fiksu, Inc., a provider of mobile application marketing technologies. Previously, Mr. Goldman served as Executive Vice President and Chief Financial Officer of Black Duck Software, Inc., an open source software solutions provider, from March 2008 to July 2014, as Senior Vice President, Chief Financial Officer and a member of the board of directors of Salary.com, a provider of compensation management software, from March 2006 to February 2008, as a
102
Table of Contents
principal and Mirus Capital Advisors, Inc., an investment banking firm, from April 2004 to March 2006. Earlier in his career, Mr. Goldman held financial executive leadership positions at LODESTAR Corporation, a provider of software solutions for energy market participants that was acquired by Oracle Corporation, Student Advantage, Inc., a provider of marketing and commerce solutions aimed at college students, and MediaMap, Inc., a provider of workflow and database management solutions that was acquired by Cision, Inc. Mr. Goldman began his career at KPMG LLP. He is a CPA and holds a B.S. in accounting and managerial law & public policy, from the Martin J. Whitman School of Management at Syracuse University.
Imad Mouline has served as our Senior Vice President and Chief Technology Officer since September 2011. From March 2011 to September 2011, Mr. Mouline was Chief Technology Officer of CloudFloor. Previously, Mr. Mouline served as Chief Technology Officer of Compuware Corporation’s Application Performance Management Solutions division from November 2009 to March 2011, as Chief Technology Officer of Gomez from January 2006 to November 2009 and as Chief Technology Officer of S1 from June 2001 to October 2005. Earlier in his career, Mr. Mouline held positions at BroadVision and Interleaf. Mr. Mouline holds an S.B. in Management Science / Information Technology from the Massachusetts Institute of Technology.
Joel Rosen has served as our Chief Marketing Officer since January 2016. From September 2013 to October 2015, Mr. Rosen served as Executive Vice President, Product and Marketing of Endurance International Group, Inc., a web hosting company. Previously, Mr. Rosen was a principal at Landmark Associates, a consulting company, from September 2008 to September 2013, was President and Chief Executive Officer of Tizor Systems, Inc., a data security company which was subsequently acquired by Netezza Corp., from June 2006 to August 2008 and was a partner at Charles River Ventures, a venture capital firm, from September 2001 to June 2005. Earlier in his career, Mr. Rosen was President and Chief Executive Officer of NaviSite Inc., a web hosting company which was subsequently acquired by Time Warner Cable Inc., and also held positions at Aspen Technology, Inc., a software solutions provider for process manufacturers, and at Bain & Company, a management consulting firm. Mr. Rosen holds a B.A. in economics from Harvard University and an M.B.A. from Harvard Business School.
Elliot J. Mark has served as our Senior Vice President and General Counsel since November 2015. From September 2010 to November 2015, Mr. Mark served as Vice President and General Counsel of Northern Power Systems Corp., a designer and manufacturer of wind turbines and power converters. Previously, Mr. Mark served as General Counsel of Gomez from May 2009 to February 2010, as Senior Vice President and General Counsel of Salary.com from October 2006 to January 2009 and as Senior Vice President and General Counsel of Viisage Technology, Inc., a provider of identity verification technology which merged with Identix Incorporated, from August 2003 to September 2006. Earlier in his career, Mr. Mark held positions at eRoom Technology Inc., a provider of collaboration software, SimPlayer.com Ltd., a sports media technology company, Arthur D. Little Inc., a management consulting firm, and Molten Metal Technology Inc., a recycling technology company. Mr. Mark holds a B.A. in international relations from Wesleyan University and a J.D. from Georgetown University Law Center.
Scott Burnett has served as our Senior Vice President, Operations since March 2013. From March 2011 to March 2013, Mr. Burnett served as Executive Vice President, Product Development, Engineering and Operations for Axeda Corporation, a provider of software for connected products that was acquired by PTC. Previously, Mr. Burnett served as Vice President, Global Engineering and Operations of Compuware’s Application Performance Management Solutions division from January 2010 to March 2011 and as Vice President, Global Engineering and Operations of Gomez, from September 2007 to January 2010. Earlier in his career, Mr. Burnett held positions at Arbor Networks, a provider of network security solutions, ModusLink Global Solutions, Inc. (formerly CMGI, Inc.), an Internet investment and holding company, and Liberty Global plc, a telecommunications company. Mr. Burnett holds a B.S.E.E. in electrical engineering and computer science from the Georgia Institute of Technology and an M.S.E.E. in electrical engineering and communication systems management from Southern Methodist University.
Yuan Cheng has served as our Senior Vice President, Engineering since April 2012. From March 2011 to April
2012, Mr. Cheng served as Chief Executive Officer of Hypersun Group Ltd., an internet and software
103
Table of Contents
engineering services firm, which we acquired in 2012. Previously, Mr. Cheng served as General Manager of Gomez’s China operations from March 2006 to February 2011 and as manager of the BroadVision Commerce product at BroadVision from January 2001 to January 2006. Mr. Cheng holds a B.E. in precisions instruments from Tsinghua University and a Ph.D. in mechanical engineering from the Massachusetts Institute of Technology.
Nicholas Hawkins has served as our Senior Vice President, Europe since April 2015. From March 2012 to March 2015, Mr. Hawkins served as Vice President of Sales, EMEA at Trustwave Holdings, Inc., an information security company, from January 2010 to January 2012, Mr. Hawkins served as Vice President, EMEA Managed Service Products at M86 Security Ltd., an information security company, and from January 2008 to December 2009, Mr. Hawkins served as Vice President, EMEA Sales at M86 Security. Earlier in his career, Mr. Hawkins held sales positions at Marshal Systems Ltd., a global information security company, and MessageLabs, an integrated messaging and web security services company that was acquired by Symantec Corporation. Mr. Hawkins joined the Metropolitan Police in 1980 and served as an operational police officer in London for 10 years.
Gary Phillips has served as our Senior Vice President, Sales since January 2012. From March 2010 to December 2011, Mr. Phillips served Vice President, North American Sales of Compuware’s Application Performance Management Solutions division and as Vice President, North American Sales of Gomez from September 2009 to March 2010. Previously, Mr. Phillips served as Chief Executive Officer of Marathon Technologies Corp., a software and network technology company, from May 2005 to July 2009. Earlier in his career, Mr. Phillips held positions at Avaki, a provider of enterprise network solutions, BroadVision and Interleaf, a provider of software products for the publishing industry. Mr. Phillips holds a B.S. in business administration and marketing from Plymouth State University.
Non-Employee Directors
Richard D’Amore has served as a member of our board of directors since April 2015. Mr. D’Amore has been a General Partner of North Bridge Venture Partners, an early-stage venture capital and growth equity firm, since its inception in 1994. From 1982 until starting North Bridge, Mr. D’Amore served in various roles at Hambro International Equity Partners. Previously, Mr. D’Amore worked as a consultant at Bain and Company and as a certified public accountant with Arthur Young and Company. Mr. D’Amore has served as a member of the board of directors of Veeco Instruments, Inc., a developer and manufacturer of electronics equipment, since 1990. From 1997 to 2010, Mr. D’Amore served as a member of the board of directors of Phase Forward Incorporated, a provider of software solutions for clinical trial and drug safety monitoring that was acquired by Oracle Corporation. Mr. D’Amore holds a B.S. in business from Northeastern University and an M.B.A. from Harvard Business School. Our board of directors believes that Mr. D’Amore’s broad entrepreneurial experience and his extensive service on public company boards qualify him to serve on our board of directors.
Bruns Grayson has served as a member of our board of directors since 2011. Mr. Grayson is a managing partner at ABS Ventures, a venture capital firm, where he has managed all of the firm’s venture capital partnerships since 1983. Mr. Grayson began his career as a venture capitalist in 1981 at Adler & Co., a venture capital firm. Previously, Mr. Grayson was an associate at McKinsey and Co., a management consulting firm. From May 2009 to December 2013, Mr. Grayson served as a member of the board of directors of Active Network, Inc., a provider of cloud computing applications. Mr. Grayson holds a B.A. in history from Harvard College, an M.A. in politics and philosophy from Oxford University and a J.D. from the University of Virginia Law School. Our board of directors believes that Mr. Grayson’s experience investing in technology business and his service on numerous private and public company boards qualify him to serve on our board of directors.
David Henshall has served a member of our board of directors since July 2015. Mr. Henshall has served as Executive Vice President and Chief Financial Officer of Citrix Systems, Inc., a provider of workplace mobility solutions, since September 2011 and as Citrix’s Chief Operating Officer since February 2014. Mr. Henshall served as Citrix’s Acting Chief Executive Officer and President from October 2013 to February 2014. From
104
Table of Contents
January 2006 to September 2011, Mr. Henshall served as Citrix’s Senior Vice President and Chief Financial Officer, and from April 2003 to January 2006, he served as Citrix’s Vice President and Chief Financial Officer. Our board of directors believes that Mr. Henshall’s financial expertise and experience on the technology industry qualify him to serve on our board of directors.
Kent Mathy has served as a member of our board of directors since August 2012. Since November 2013, Mr. Mathy has served as a President, Southeast Region of AT&T Mobility. From November 2008 to November 2013, Mr. Mathy was President, North Central Region for AT&T Mobility, and from December 2007 to November 2008, he was President, Small Business for AT&T Mobility. From January 2003 to December 2007, he was President, Business Markets Group at the former Cingular Wireless. Earlier in his career, Mr. Mathy held a variety of management positions at AT&T over a period of 18 years. Mr. Mathy holds a B.A. in marketing from the University of Wisconsin-Oshkosh and attended the University of Michigan, Executive Program in 1993. Our board of directors believes Mr. Mathy’s experience in the telecommunications industry qualifies him to serve on our board of directors.
Cinta Putra has served as a member of our board of directors since November 2002. Ms. Putra was a co-founder of Everbridge and served as our Chief Executive Officer from November 2002 to September 2011 and as our Chief Financial Officer and Senior Vice President, Business Operations from September 2011 to November 2014. Our board of directors believes that Ms. Putra’s deep understanding of our business and technology and her role as a co-founder of our company qualify her to serve on our board of directors.
Family Relationships
There are no family relationships among any of our executive officers or directors.
Board Composition
Our board of directors currently consists of six members. Each director is currently elected to the board of directors for a one-year term, to serve until the election and qualification of a successor director at our annual meeting of stockholders, or until the director’s earlier removal, resignation or death.
All of our directors currently serve on the board of directors pursuant to the voting provisions of a voting agreement between us and several of our stockholders. This agreement will terminate upon the completion of this offering, after which there will be no further contractual obligations regarding the election of our directors.
In accordance with our amended and restated certificate of incorporation, which will become effective immediately prior to completion of this offering, our board of directors will be divided into three classes with staggered three-year terms. At each annual meeting of stockholders, the successors to directors whose terms then expire will be elected to serve from the time of election and qualification until the third annual meeting following election. Our directors will be divided among the three classes as follows:
| • | Class I, which will consist of Mr. Ellertson and Ms. Putra, and whose term will expire at our first annual meeting of stockholders to be held after the completion of this offering; |
| • | Class II, which will consist of Messrs. Henshall and Mathy and whose term will expire at our second annual meeting of stockholders to be held after the completion of this offering; and |
| • | Class III, which will consist of Messrs. D’Amore and Grayson, and whose term will expire at our third annual meeting of stockholders to be held after the completion of this offering. |
Our amended and restated bylaws, which will become effective upon completion of this offering, will provide that the authorized number of directors may be changed only by resolution approved by a majority of our board of directors. Any additional directorships resulting from an increase in the number of directors will be distributed among the three classes so that, as nearly as possible, each class will consist of one-third of the directors.
The division of our board of directors into three classes with staggered three-year terms may delay or prevent a change of our management or a change in control.
105
Table of Contents
Director Independence
Our board of directors has undertaken a review of the independence of the directors and considered whether any director has a material relationship with us that could compromise his or her ability to exercise independent judgment in carrying out his or her responsibilities. Based upon information requested from and provided by each director concerning such director’s background, employment and affiliations, including family relationships, our board of directors determined that Messrs. D’Amore, Grayson, Henshall and Mathy representing four of our six directors, are “independent directors” as defined under current rules and regulations of the SEC and the listing standards of the NASDAQ Stock Market. In making these determinations, our board of directors considered the current and prior relationships that each non-employee director has with our company and all other facts and circumstances that our board of directors deemed relevant in determining their independence, including the beneficial ownership of our capital stock by each non-employee director and the transactions involving them described in “Certain Relationships and Related Party Transactions.”
Lead Independent Director
Our corporate governance guidelines provide that one of our independent directors shall serve as a lead independent director at any time when an independent director is not serving as the chairman of the board of directors. Our board of directors has appointed Mr. Grayson, effective upon the completion of this offering, to serve as our lead independent director. As lead independent director, Mr. Grayson will preside over periodic meetings of our independent directors, coordinate activities of the independent directors and perform such additional duties as our board of directors may otherwise determine and delegate.
Board Committees
Our board of directors has established an audit committee and a compensation committee and intends to establish a nominating and corporate governance committee in connection with this offering, each of which has the composition and responsibilities described below. From time to time, our board of directors may establish other committees to facilitate the management of our business.
Audit Committee
Our audit committee consists of three directors, Messrs. D’Amore, Henshall and Mathy, each of whom our board of directors has determined satisfies the independence requirements for audit committee members under the listing standards of the NASDAQ Stock Market and Rule 10A-3 of the Securities Exchange Act of 1934, as amended, or the Exchange Act. Each member of our audit committee meets the financial literacy requirements of the listing standards of the NASDAQ Stock Market. Mr. D’Amore is the chairman of the audit committee and our board of directors has determined that Mr. D’Amore is an audit committee “financial expert” as defined by Item 407(d) of Regulation S-K under the Securities Act. The principal duties and responsibilities of our audit committee include, among other things:
| • | selecting a qualified firm to serve as the independent registered public accounting firm to audit our financial statements; |
| • | helping to ensure the independence and performance of the independent registered public accounting firm; |
| • | discussing the scope and results of the audit with the independent registered public accounting firm, and reviewing, with management and the independent accountants, our interim and year-end operating results; |
| • | developing procedures for employees to submit concerns anonymously about questionable accounting or audit matters; |
| • | reviewing our policies on risk assessment and risk management; |
106
Table of Contents
| • | reviewing related party transactions; |
| • | obtaining and reviewing a report by the independent registered public accounting firm at least annually, that describes our internal quality-control procedures, any material issues with such procedures, and any steps taken to deal with such issues when required by applicable law; and |
| • | approving (or, as permitted, pre-approving) all audit and all permissible non-audit services, other than de minimis non-audit services, to be performed by the independent registered public accounting firm. |
Our audit committee will operate under a written charter, to be effective immediately prior to the completion of this offering that satisfies the applicable rules of the SEC and the listing standards of the NASDAQ Stock Market.
Compensation Committee
Our compensation committee consists of three directors, Messrs. D’Amore, Grayson and Mathy, each of whom our board of directors has determined is a non-employee member of our board of directors as defined in Rule 16b-3 under the Exchange Act and an outside director as that term is defined in Section 162(m) of the Internal Revenue Code of 1986, as amended, or the Code. Mr. Grayson is the chairman of the compensation committee. The composition of our compensation committee meets the requirements for independence under current listing standards of the NASDAQ Stock Market and current SEC rules and regulations. The principal duties and responsibilities of our compensation committee include, among other things:
| • | reviewing and approving, or recommending that our board of directors approve, the compensation of our executive officers; |
| • | reviewing and recommending to our board of directors the compensation of our directors; |
| • | reviewing and approving, or recommending that our board of directors approve, the terms of compensatory arrangements with our executive officers; |
| • | administering our stock and equity incentive plans; |
| • | reviewing and approving, or recommending that our board of directors approve, incentive compensation and equity plans; and |
| • | reviewing and establishing general policies relating to compensation and benefits of our employees and reviewing our overall compensation philosophy. |
Our compensation committee will operate under a written charter, to be effective immediately prior to the completion of this offering, that satisfies the applicable rules of the SEC and the listing standards of the NASDAQ Stock Market.
Nominating and Corporate Governance Committee
Our nominating and corporate governance committee, which will be established prior to the completion of this offering, will consist of three directors, Messrs. Grayson, Henshall and Mathy. Mr. Henshall will be the chairman of the nominating and corporate governance committee. The composition of our nominating and governance committee meets the requirements for independence under current listing standards of the NASDAQ Stock Market and current SEC rules and regulations. The nominating and corporate governance committee’s responsibilities include, among other things:
| • | identifying, evaluating and selecting, or recommending that our board of directors approve, nominees for election to our board of directors and its committees; |
| • | evaluating the performance of our board of directors and of individual directors; |
107
Table of Contents
| • | considering and making recommendations to our board of directors regarding the composition of our board of directors and its committees; |
| • | reviewing developments in corporate governance practices; |
| • | evaluating the adequacy of our corporate governance practices and reporting; |
| • | developing and making recommendations to our board of directors regarding corporate governance guidelines and matters; and |
| • | overseeing an annual evaluation of the board’s performance. |
Our nominating and governance committee will operate under a written charter, to be effective immediately prior to the completion of this offering, that satisfies the applicable rules of the SEC and the listing standards of the NASDAQ Stock Market.
Code of Business Conduct and Ethics
In connection with this offering, we intend to adopt a Code of Business Conduct and Ethics, or the Code of Conduct, applicable to all of our employees, executive officers and directors. Following the completion of this offering, the Code of Conduct will be available on our website at www.everbridge.com. The nominating and corporate governance committee of our board of directors will be responsible for overseeing the Code of Conduct and must approve any waivers of the Code of Conduct for employees, executive officers and directors. We expect that any amendments to the Code of Conduct, or any waivers of its requirements, will be disclosed on our website.
Compensation Committee Interlocks and Insider Participation
None of our executive officers currently serves, or in the past year has served, as a member of the board of directors or compensation committee of any entity that has one or more executive officers serving on our board of directors or compensation committee. None of the members of our compensation committee is an officer or employee of our company, nor have they ever been an officer or employee of our company.
108
Table of Contents
EXECUTIVE AND DIRECTOR COMPENSATION
2015 Summary Compensation Table
The following table sets forth information regarding compensation earned with respect to the year ended December 31, 2015 by our principal executive officer and the next two most highly compensated executive officers in 2015. These individuals are our named executive officers for 2015.
| Name and Principal Position |
Year | Salary | Option Awards(1) |
Non-equity Incentive Plan Compensation(2) |
All Other Compensation |
Total | ||||||||||||||||
| Jaime Ellertson(3) President, Chief Executive Officer and Chairman of the Board of Directors |
2015 2014 |
$
|
250,000 250,000 |
|
$
|
4,040,226 — |
|
$
|
140,000 214,800 |
|
$
|
25,912(4) 75,000(4) |
|
$
|
4,456,138 539,800 |
| ||||||
| Kenneth S. Goldman Senior Vice President, Chief Financial Officer and Treasurer |
2015 | 197,917 | 971,300 | 54,600 | — | 1,223,817 | ||||||||||||||||
| Nicholas Hawkins(5) Managing Director, EMEA |
2015 | 133,656 | 433,800 | 98,000 | — | 665,456 | ||||||||||||||||
| (1) | This column reflects the full grant date fair value of options granted during the year as measured pursuant to Financial Accounting Standard Board Accounting Standards Codification Topic 718 (ASC 718) as stock-based compensation in our consolidated financial statements. Unlike the calculations contained in our consolidated financial statements, this calculation does not give effect to any estimate of forfeitures related to service-based vesting, but assumes that the named executive officer will perform the requisite service for the award to vest in full. The assumptions we used in valuing options are described in note (12) to our consolidated financial statements included in this prospectus. |
| (2) | See “—Employment Arrangements—2014 Bonus Plan” and “—Employment Arrangements—2015 Bonus Plan” below for descriptions of the material terms of the plans pursuant to which this compensation was awarded. |
| (3) | Mr. Ellertson is also a member of our board of directors, but did not receive any additional compensation in his capacity as a director. |
| (4) | Includes amounts paid to Mr. Ellertson for company use of his primary residence, vacation residence and boat for company-related events. |
| (5) | Mr. Hawkins’ compensation is paid in British pounds; all amounts have been converted to U.S. dollars based on the inverse noon buying rate of the Federal Reserve Bank of New York for the British pound on December 31, 2015. |
109
Table of Contents
Outstanding Equity Awards as of December 31, 2015
The following table sets forth certain information about outstanding equity awards granted to our named executive officers that remain outstanding as of December 31, 2015.
|
|
Option awards(1) | |||||||||||||||||||
| Name |
Grant Date | Number of Securities Underlying Unexercised Options (#) Exercisable |
Number of Securities Underlying Unexercised Options (#) Unexercisable |
Option Exercise Price(2) ($) |
Option Expiration Date |
|||||||||||||||
| Jaime Ellertson |
3/1/2011 | 25,000 | — | 0.23 | 3/1/2021 | |||||||||||||||
| 7/15/2015 | — | 2,997,200 | (3) | 2.37 | 7/15/2025 | |||||||||||||||
| Kenneth S. Goldman |
4/22/2015 | — | 950,000 | (4) | 1.63 | 4/22/2025 | ||||||||||||||
| 7/15/2015 | — | 75,000 | (5) | 2.37 | 7/15/2025 | |||||||||||||||
| Nicholas Hawkins |
4/22/2015 | — | 400,000 | (6) | 1.63 | 4/22/2025 | ||||||||||||||
| 7/15/2015 | — | 50,000 | (7) | 2.37 | 7/15/2025 | |||||||||||||||
| (1) | All of the option awards listed in the table above were granted under our 2008 Equity Incentive Plan, the terms of which are described below under “—Equity Incentive Plans.” |
| (2) | All of the option awards listed in the table above were granted with a per share exercise price equal to the fair market value of one share of our common stock on the date of grant, as determined in good faith by our board of directors with the assistance of a third-party valuation expert. |
| (3) | Option vests over a four-year period as to 25% of the common stock underlying the option on July 15, 2016 and as to 75% of the common stock underlying the option in 12 equal quarterly installments at the end of each three-month period thereafter, subject to Mr. Ellertson’s continuous service through each vesting date. |
| (4) | Option vests over a four-year period as to 25% of the common stock underlying the option on April 1, 2016 and as to 75% of the common stock underlying the option in 12 equal quarterly installments at the end of each three-month period thereafter, subject to Mr. Goldman’s continuous service through each vesting date. |
| (5) | Option vests over a four-year period as to 25% of the common stock underlying the option on July 15, 2016 and as to 75% of the common stock underlying the option in 12 equal quarterly installments at the end of each three-month period thereafter, subject to Mr. Goldman’s continuous service through each vesting date. |
| (6) | Option vests over a four-year period as to 25% of the common stock underlying the option on April 20, 2016 and as to 75% of the common stock underlying the option in 12 equal quarterly installments at the end of each three-month period thereafter, subject to Mr. Hawkins’ continuous service through each vesting date. |
| (7) | Option vests over a four-year period as to 25% of the common stock underlying the option on July 15, 2016 and as to 75% of the common stock underlying the option in 12 equal quarterly installments at the end of each three-month period thereafter, subject to Mr. Hawkins’ continuous service through each vesting date. |
See “—Potential Payments upon Termination or Change of Control” for a description of vesting acceleration applicable to stock options held by our named executive officers.
Employment Arrangements
Below are written descriptions of our employment agreements or offer letters, as applicable, with each of our named executive officers. Each of our named executive officers’ employment is “at will” and may be terminated at any time.
Jaime Ellertson. We entered into an offer letter agreement with Mr. Ellertson in July 2012 setting forth the terms of his employment. Mr. Ellertson was entitled to an initial annual base salary of $250,000, which has not been subsequently increased. Pursuant to the agreement, Mr. Ellertson was granted a restricted stock award of 7,770,361 shares of our common stock in July 2012. Mr. Ellertson is also eligible to receive annual performance bonuses pursuant to the company bonus plans described below, with a target bonus of $200,000 for 2016. Mr. Ellertson’s offer letter agreement also provides for certain severance benefits, the terms of which are described below under “—Potential Payments Upon Termination or Change of Control.”
110
Table of Contents
Kenneth S. Goldman. We entered into an offer letter agreement with Mr. Goldman in April 2015 setting forth the terms of his employment. Mr. Goldman was entitled to an initial annual base salary of $250,000, which was increased in August 2015 to $275,000. Pursuant to the agreement, Mr. Goldman was granted a stock option to purchase 950,000 shares of our common stock in April 2015 that is subject to vesting as to 25% of the underlying shares on April 1, 2016 and as to the remaining shares in equal quarterly installments over 12 quarters thereafter, subject to Mr. Goldman’s continued service. Mr. Goldman is also eligible to receive annual performance bonuses pursuant to the company bonus plans described below, with a target bonus of $100,000 for 2016. Mr. Goldman’s employment agreement also provides for certain severance benefits, the terms of which are described below under “—Potential Payments Upon Termination or Change on Control.”
Nicholas Hawkins. We entered into an employment agreement with Mr. Hawkins in December 2014 setting forth the terms of his employment. Mr. Hawkins was entitled to an initial base salary of approximately $192,000, which has not been subsequently increased. Pursuant to the agreement, Mr. Hawkins was granted a stock option to purchase 400,000 shares of our common stock in April 2015 that is subject to vesting as to 25% of the underlying shares on April 20, 2016 and as to the remaining shares in equal quarterly installments over 12 quarters thereafter, subject to Mr. Hawkins’ continued service. Mr. Hawkins is also eligible to receive annual performance bonuses pursuant to the company bonus plans described below, with an initial target bonus of approximately $192,000 for 2016. Mr. Hawkins’ employment agreement also provides for certain accelerated vesting benefits, the terms of which are described below under “—Potential Payments Upon Termination or Change on Control.”
2014 Bonus Plan
In 2014, our executive officers were eligible to participate in our 2014 management incentive plan, or the 2014 bonus plan. Bonuses were measured as of December 31, 2014 and paid in June 2015. The 2014 bonus plan was designed to motivate and reward executives for the attainment of company-wide performance goals. The annual cash target for Mr. Ellertson was set at $200,000, 65% of which was subject to the achievement of certain sales targets and 35% of which was subject to the achievement of other company objectives. Mr. Ellertson was eligible to receive more than 100% of his target bonus if the company’s performance exceeded the targets set forth in the 2014 bonus plan. Mr. Ellertson received a bonus of $214,800 pursuant to the 2014 bonus plan.
2015 Bonus Plan
Messrs. Ellertson, Goldman and Hawkins were eligible to participate in our 2015 management incentive plan, or the 2015 bonus plan. Bonuses were measured as of December 31, 2015 and paid in May 2016. The 2015 bonus plan was designed to motivate and reward executives for the attainment of company-wide performance goals. The annual cash targets for Messrs. Ellertson and Goldman were set at $200,000 and $100,000, respectively, 65% of which was subject to the achievement of certain sales targets and 35% of which was subject to the achievement of other company objectives. The annual cash target for Mr. Hawkins was set at approximately $192,000, 80% of which was subject to the achievement of certain sales targets and 20% of which was subject to the achievement of other company objectives. Messrs. Ellertson, Goldman and Hawkins were eligible to receive more than 100% of their target bonuses if the company’s performance exceeded the targets set forth in the 2015 bonus plan. Messrs. Ellertson, Goldman and Hawkins received bonuses of $140,000, $54,600 and $98,000, respectively, pursuant to the 2015 bonus plan.
2016 Bonus Plan
Messrs. Ellertson, Goldman and Hawkins are eligible to participate in our 2016 management incentive plan, or the 2016 bonus plan. Bonuses are measured as of December 31, 2016 and are expected to be calculated in the first quarter of 2017 and paid in April 2017. The 2016 bonus plan is designed to motivate and reward executives for the attainment of company-wide performance goals. The annual cash targets for Messrs. Ellertson and Goldman are set at $200,000 and $100,000, respectively, 90% of which is subject to the achievement of certain sales, customer retention and growth targets and 10% of which is subject to the achievement of other company objectives. The annual cash target for Mr. Hawkins is set at approximately $192,000, 80% of which is subject to the achievement of certain sales targets and 20% of which is subject to the achievement of other company objectives. Messrs. Ellertson, Goldman and Hawkins are eligible to receive more than 100% of their target bonuses if the company’s performance exceeds the targets set forth in the 2016 bonus plan.
111
Table of Contents
Potential Payments Upon Termination or Change of Control
Regardless of the manner in which a named executive officer’s service terminates, the named executive officer is entitled to receive amounts earned during his term of service, including salary.
Jaime Ellertson. Pursuant to his offer letter agreement, if Mr. Ellertson’s employment with us ends due to his resignation for “good reason” or his termination by us other than for “cause,” he is entitled to (1) continued payment of his base salary for twelve months following his termination and (2) payment of premiums for continued health benefits under either the Company’s sponsored health care program, or COBRA, for twelve months. If Mr. Ellertson’s employment with us ends due to his death or disability, he (or his estate in the event of death) is entitled to continued payment of his base salary for six months following the termination of his employment. Mr. Ellertson’s benefits are conditioned, among other things, on his complying with his post-termination obligations under his offer letter agreement and signing a general release of claims in our favor. In addition, if our company undergoes a change of control and Mr. Ellertson undergoes an involuntary termination of his employment with us or our successor within 12 months following such change of control, 2,997,200 of Mr. Ellertson’s outstanding stock options will vest as to 100% of the then-unvested underlying shares of common stock.
Kenneth S. Goldman. Pursuant to his offer letter agreement, if Mr. Goldman’s employment with us ends due to his resignation for “good reason” or his termination by us other than for “cause,” he is entitled to (1) continued payment of his base salary for three months following his termination if his employment with us ends before April 13, 2016 or for six months following his termination if his employment with us ends on or after April 13, 2016 and (2) payment of premiums for continued health benefits under either the Company’s sponsored health care program, or COBRA, for the severance period. If Mr. Goldman’s employment with us ends due to his death or disability, he (or his estate in the event of death) is entitled to continued payment of his base salary for three months following the termination of his employment. Mr. Goldman’s benefits are conditioned, among other things, on his complying with his post-termination obligations under his offer letter agreement and signing a general release of claims in our favor. In addition, if our company undergoes a change of control, 950,000 of Mr. Goldman’s outstanding stock options will vest as to (1) a fraction of the then-unvested underlying shares of common stock equal to the number of months of Mr. Goldman’s full-time employment with us divided by forty eight, plus (2) 50% of the remaining then-unvested underlying shares of common stock. In the event that, after giving effect to the accelerated vesting above, our successor does not assume or convert all of Mr. Goldman’s remaining unvested shares, or does not offer him equivalently valued options and incentives, Mr. Goldman’s outstanding stock options will vest as to all of the then-unvested underlying shares of common stock. Furthermore, if our company undergoes a change of control and Mr. Goldman undergoes an involuntary termination of his employment with us or our successor within 12 months following such change of control, an additional 75,000 of Mr. Goldman’s outstanding stock options will vest as to 100% of the then-unvested underlying shares of common stock.
Nicholas Hawkins. If our company undergoes a change of control and our successor does not assume or replace Mr. Hawkins’ outstanding stock options with equivalently valued options and incentives, 400,000 of Mr. Hawkins’ outstanding stock options will vest as to 25% of the then-unvested underlying shares of common stock. If Mr. Hawkins’ outstanding stock options are assumed by our successor and if Mr. Hawkins’ employment with our successor ends within 12 months following such change of control due to his termination by our successor other than for “misconduct,” these options will vest as to all of the then-unvested underlying shares of common stock. Furthermore, if our company undergoes a change of control and Mr. Hawkins undergoes an involuntary termination of his employment with us or our successor within 12 months following such change of control, an additional 50,000 of Mr. Hawkins’ outstanding stock options will vest as to 100% of the then-unvested underlying shares of common stock.
Non-Employee Director Compensation
Historically, we have provided equity-based compensation to certain of our independent directors for the time and effort necessary to serve as a member of our board of directors. However, our directors are not currently entitled to receive any compensation in connection with their service on our board of directors, except for reimbursement of direct expenses incurred in connection with attending meetings of the board or committees thereof.
112
Table of Contents
We expect that our board of directors will adopt a director compensation policy for non-employee directors to be effective upon the completion of this offering.
2015 Director Compensation Table
The following table sets forth information regarding the compensation earned for service on our board of directors during the year ended December 31, 2015 by our directors who were not also our employees. Jaime Ellertson, our President and Chief Executive Officer, is also a member of our board of directors, but did not receive any additional compensation for his service as a director. Mr. Ellertson’s compensation as an executive officer is set forth above under “Executive and Director Compensation—2015 Summary Compensation Table.”
| Name |
Fees Earned or Paid in Cash ($) |
Option Awards ($)(1)(2) |
All Other Compensation ($) |
Total ($) | ||||||||||||
| Richard D’Amore |
— | $ | 131,800 | — | $ | 131,800 | ||||||||||
| Bruns Grayson |
— | 131,800 | — | 131,800 | ||||||||||||
| David Henshall. |
— | 131,800 | — | 131,800 | ||||||||||||
| Kent Mathy |
— | — | — | — | ||||||||||||
| Cinta Putra |
— | — | — | — | ||||||||||||
| (1) | This column reflects the full grant date fair value for options granted during the year as measured pursuant to Financial Accounting Standard Board Accounting Standards Codification Topic 718 (ASC 718) as stock-based compensation in our consolidated financial statements. Unlike the calculations contained in our consolidated financial statements, this calculation does not give effect to any estimate of forfeitures related to service-based vesting, but assumes that directors will perform the requisite service for the award to vest in full. The assumptions we used in valuing options are described in note (12) to our consolidated financial statements included in this prospectus. |
| (2) | The table below shows the aggregate number of option awards outstanding for each of our non-employee directors as of December 31, 2015: |
| Name |
Option Awards (#) |
|||
| Richard D’Amore(1) |
100,000 | |||
| Bruns Grayson(1) |
100,000 | |||
| David Henshall(1) |
100,000 | |||
| Kent Mathy(2) |
305,839 | |||
| Cinta Putra |
— | |||
| (1) | Option vests over a three-year period in 12 equal quarterly installments beginning on July 15, 2015, subject to the recipient’s continued service on our board of directors through each vesting date. Option will vest in full upon our company undergoing a change of control. |
| (2) | Option is vested in full. |
Equity Incentive Plans
2016 Equity Incentive Plan
We expect that our board of directors will adopt and our stockholders will approve prior to the completion of this offering our 2016 Equity Incentive Plan, or 2016 Plan. We do not expect to utilize our 2016 Plan until after the completion of this offering, at which point no further grants will be made under our 2008 Equity Incentive Plan, or 2008 Plan, as described below under “2008 Equity Incentive Plan.” No awards have been granted and no shares of our common stock have been issued under our 2016 Plan.
Stock Awards. The 2016 Plan provides for the grant of incentive stock options within the meaning of Section 422 of the Internal Revenue Code of 1986, as amended, or the Code, nonstatutory stock options, stock appreciation rights, restricted stock awards, restricted stock unit awards, performance-based stock awards, and other forms of equity compensation, which are collectively referred to as stock awards. Additionally, the 2016 Plan provides for the grant of performance cash awards. Incentive stock options may be granted only to employees. All other awards may be granted to employees, including officers, and to non-employee directors and consultants.
113
Table of Contents
Share Reserve. Initially, the aggregate number of shares of our common stock that may be issued pursuant to stock awards under the 2016 Plan after the 2016 Plan becomes effective is the sum of (1) shares and (2) the number of shares reserved for issuance under our 2008 Plan at the time our 2016 Plan becomes effective. Additionally, any shares subject to stock options or other stock awards granted under our 2008 Plan that would have otherwise returned to our 2008 Plan (such as upon the expiration or termination of a stock award prior to vesting) will be added to, and available for issuance under, our 2016 Plan and the number of shares of our common stock reserved for issuance under our 2016 Plan will automatically increase on January 1 of each year, beginning on January 1, 2017 (assuming the 2016 Plan becomes effective before such date) and continuing through and including January 1, 2026, by % of the total number of shares of our capital stock outstanding on December 31 of the preceding calendar year, or a lesser number of shares determined by our board of directors. The maximum number of shares that may be issued upon the exercise of incentive stock options under our 2016 Plan is shares.
No person may be granted stock awards covering more than shares of our common stock under our 2016 Plan during any calendar year pursuant to stock options, stock appreciation rights and other stock awards whose value is determined by reference to an increase over an exercise or strike price of at least 100% of the fair market value on the date the stock award is granted. Additionally, no person may be granted in a calendar year a performance stock award covering more than shares or a performance cash award having a maximum value in excess of $ . Such limitations are designed to help assure that any deductions to which we would otherwise be entitled with respect to such awards will not be subject to the $1,000,000 limitation on the income tax deductibility of compensation paid to any covered executive officer imposed by Section 162(m) of the Code.
If a stock award granted under the 2016 Plan expires or otherwise terminates without being exercised in full, or is settled in cash, the shares of our common stock not acquired pursuant to the stock award again will become available for subsequent issuance under the 2016 Plan. In addition, the following types of shares under the 2016 Plan may become available for the grant of new stock awards under the 2016 Plan: (1) shares that are forfeited to or repurchased by us prior to becoming fully vested; (2) shares withheld to satisfy income or employment withholding taxes; or (3) shares used to pay the exercise or purchase price of a stock award. Shares issued under the 2016 Plan may be previously unissued shares or reacquired shares bought by us on the open market.
Administration. Our board of directors, or a duly authorized committee thereof, has the authority to administer the 2016 Plan. Our board of directors may also delegate to one or more of our officers the authority to (1) designate employees (other than other officers) to be recipients of certain stock awards, (2) determine the number of shares of common stock to be subject to such stock awards, and (3) specify the other terms and conditions, including the strike price or purchase price and vesting schedule, applicable to such awards. Subject to the terms of the 2016 Plan, our board of directors or the authorized committee, referred to as the plan administrator, determines recipients, dates of grant, the numbers and types of stock awards to be granted and the terms and conditions of the stock awards, including the period of their exercisability and vesting schedule applicable to a stock award. Subject to the limitations set forth below, the plan administrator will also determine the exercise price, strike price or purchase price of awards granted and the types of consideration to be paid for the award.
The plan administrator has the authority to modify outstanding awards under our 2016 Plan. Subject to the terms of our 2016 Plan, the plan administrator has the authority, without stockholder approval, to reduce the exercise, purchase or strike price of any outstanding stock award, cancel any outstanding stock award in exchange for new stock awards, cash or other consideration, or take any other action that is treated as a repricing under generally accepted accounting principles, with the consent of any adversely affected participant.
Stock Options. Incentive and nonstatutory stock options are evidenced by stock option agreements adopted by the plan administrator. The plan administrator determines the exercise price for a stock option, within the terms and conditions of the 2016 Plan, provided that the exercise price of a stock option generally cannot be less than 100% of the fair market value of our common stock on the date of grant. Options granted under the 2016 Plan vest at the rate specified by the plan administrator.
114
Table of Contents
The plan administrator determines the term of stock options granted under the 2016 Plan, up to a maximum of 10 years. Unless the terms of an option holder’s stock option agreement provide otherwise, if an option holder’s service relationship with us, or any of our affiliates, ceases for any reason other than disability, death or cause, the option holder may generally exercise any vested options for a period of three months following the cessation of service. The option term will automatically be extended in the event that exercise of the option following such a termination of service is prohibited by applicable securities laws or our insider trading policy. If an option holder’s service relationship with us or any of our affiliates ceases due to disability or death, or an optionholder dies within a certain period following cessation of service, the optionholder or a beneficiary may generally exercise any vested options for a period of 12 months in the event of disability and 18 months in the event of death. In the event of a termination for cause, options generally terminate immediately. In no event may an option be exercised beyond the expiration of its term.
Acceptable consideration for the purchase of common stock issued upon the exercise of a stock option will be determined by the plan administrator and may include (1) cash, check, bank draft or money order, (2) a broker-assisted cashless exercise, (3) the tender of shares of our common stock previously owned by the optionholder, (4) a net exercise of the option if it is an nonqualified stock option, and (5) other legal consideration approved by the plan administrator.
Unless the plan administrator provides otherwise, options generally are not transferable except by will, the laws of descent and distribution, or pursuant to a domestic relations order. An optionholder may designate a beneficiary, however, who may exercise the option following the option holder’s death.
Tax Limitations on Incentive Stock Options. The aggregate fair market value, determined at the time of grant, of our common stock with respect to incentive stock options that are exercisable for the first time by an optionholder during any calendar year under all of our stock plans may not exceed $100,000. Options or portions thereof that exceed such limit will be treated as nonqualified stock options. No incentive stock option may be granted to any person who, at the time of the grant, owns or is deemed to own stock possessing more than 10% of our total combined voting power or that of any of our affiliates unless (1) the option exercise price is at least 110% of the fair market value of the stock subject to the option on the date of grant and (2) the term of the incentive stock option does not exceed five years from the date of grant.
Restricted Stock Awards. Restricted stock awards are evidenced by restricted stock award agreements adopted by the plan administrator. Restricted stock awards may be granted in consideration for (1) cash, check, bank draft or money order, (2) services rendered to us or our affiliates, or (3) any other form of legal consideration. Common stock acquired under a restricted stock award may, but need not, be subject to a share repurchase option in our favor in accordance with a vesting schedule as determined by the plan administrator. Rights to acquire shares under a restricted stock award may be transferred only upon such terms and conditions as set by the plan administrator. Except as otherwise provided in the applicable award agreement, restricted stock awards that have not vested will be forfeited upon the participant’s cessation of continuous service for any reason.
Restricted Stock Unit Awards. Restricted stock unit awards are evidenced by restricted stock unit award agreements adopted by the plan administrator. Restricted stock unit awards may be granted in consideration for any form of legal consideration or for no consideration. A restricted stock unit award may be settled by cash, delivery of stock, a combination of cash and stock as deemed appropriate by the plan administrator, or in any other form of consideration set forth in the restricted stock unit award agreement. Additionally, dividend equivalents may be credited in respect of shares covered by a restricted stock unit award. Rights under a restricted stock units award may be transferred only upon such terms and conditions as set by the plan administrator. Restricted stock unit awards may be subject to vesting as determined by the plan administrator. Except as otherwise provided in the applicable award agreement, restricted stock units that have not vested will be forfeited upon the participant’s cessation of continuous service for any reason.
Stock Appreciation Rights. Stock appreciation rights are evidenced by stock appreciation grant agreements adopted by the plan administrator. The plan administrator determines the strike price for a stock appreciation
115
Table of Contents
right, which generally cannot be less than 100% of the fair market value of our common stock on the date of grant. Upon the exercise of a stock appreciation right, we will pay the participant an amount in cash or stock equal to (1) the excess of the per share fair market value of our common stock on the date of exercise over the strike price, multiplied by (2) the number of shares of common stock with respect to which the stock appreciation right is exercised. A stock appreciation right granted under the 2016 Plan vests at the rate specified in the stock appreciation right agreement as determined by the plan administrator.
The plan administrator determines the term of stock appreciation rights granted under the 2016 Plan, up to a maximum of ten years. Unless the terms of a participant’s stock appreciation right agreement provides otherwise, if a participant’s service relationship with us or any of our affiliates ceases for any reason other than cause, disability or death, the participant may generally exercise any vested stock appreciation right for a period of three months following the cessation of service. The stock appreciation right term will be further extended in the event that exercise of the stock appreciation right following such a termination of service is prohibited by applicable securities laws. If a participant’s service relationship with us, or any of our affiliates, ceases due to disability or death, or a participant dies within a certain period following cessation of service, the participant or a beneficiary may generally exercise any vested stock appreciation right for a period of 12 months in the event of disability and 18 months in the event of death. In the event of a termination for cause, stock appreciation rights generally terminate immediately upon the occurrence of the event giving rise to the termination of the individual for cause. In no event may a stock appreciation right be exercised beyond the expiration of its term.
Unless the plan administrator provides otherwise, stock appreciation rights generally are not transferable except by will, the laws of descent and distribution, or pursuant to a domestic relations order. A stock appreciation right holder may designate a beneficiary, however, who may exercise the stock appreciation right following the holder’s death.
Performance Awards. The 2016 Plan permits the grant of performance-based stock and cash awards that may qualify as performance-based compensation that is not subject to the $1,000,000 limitation on the income tax deductibility of compensation paid to a covered executive officer imposed by Section 162(m) of the Code. To help assure that the compensation attributable to certain types of performance-based awards will so qualify, our compensation committee can structure such awards so that stock or cash will be issued or paid pursuant to such award only after the achievement of certain pre-established performance goals during a designated performance period.
The performance goals that may be selected include one or more of the following: (1) earnings (including earnings per share and net earnings); (2) earnings before interest, taxes and depreciation; (3) earnings before interest, taxes, depreciation and amortization; (4) total stockholder return; (5) return on equity or average stockholders’ equity; (6) return on assets, investment, or capital employed; (7) stock price; (8) margin (including gross margin); (9) income (before or after taxes); (10) operating income; (11) operating income after taxes; (12) pre-tax profit; (13) operating cash flow; (14) sales or revenue targets; (15) increases in revenue or product revenue; (16) expenses and cost reduction goals; (17) improvement in or attainment of working capital levels; (18) economic value added (or an equivalent metric); (19) market share; (20) cash flow; (21) cash flow per share; (22) share price performance; (23) debt reduction; (24) implementation or completion of projects or processes; (25) subscriber satisfaction; (26) stockholders’ equity; (27) capital expenditures; (28) debt levels; (29) operating profit or net operating profit; (30) workforce diversity; (31) growth of net income or operating income; (32) billings; and (33) to the extent that an award is not intended to comply with Section 162(m) of the Code, other measures of performance selected by our board of directors.
The performance goals may be based on company-wide performance or performance of one or more business units, divisions, affiliates, or business segments, and may be either absolute or relative to the performance of one or more comparable companies or the performance of one or more relevant indices. Unless specified otherwise (1) in the award agreement at the time the award is granted or (2) in such other document setting forth the performance goals at the time the goals are established, we will appropriately make adjustments in the method of calculating the attainment of performance goals as follows: (a) to exclude restructuring and/or certain other
116
Table of Contents
specified nonrecurring charges; (b) to exclude exchange rate effects, as applicable, for non-U.S. dollar denominated goals; (c) to exclude the effects of changes to generally accepted accounting principles; (d) to exclude the effects of any statutory adjustments to corporate tax rates; and (e) to exclude the effects of any “extraordinary items” as determined under generally accepted accounting principles. In addition, we retain the discretion to reduce or eliminate the compensation or economic benefit due upon attainment of the goals. The performance goals may differ from participant to participant and from award to award.
Other Stock Awards. The plan administrator may grant other awards based in whole or in part by reference to our common stock. The plan administrator will set the number of shares under the stock award and all other terms and conditions of such awards.
Changes to Capital Structure. In the event that there is a specified type of change in our capital structure, such as a stock split or recapitalization, appropriate adjustments will be made to (1) the class and maximum number of shares reserved for issuance under the 2016 Plan, (2) the class and maximum number of shares by which the share reserve may increase automatically each year, (3) the class and maximum number of shares that may be issued upon the exercise of incentive stock options, (4) the class and maximum number of shares subject to stock awards that can be granted in a calendar year or as performance stock awards (as established under the 2016 Plan pursuant to Section 162(m) of the Code) and (5) the class and number of shares and exercise price, strike price, or purchase price, if applicable, of all outstanding stock awards.
Corporate Transactions. In the event of certain specified significant corporate transactions, the plan administrator has the discretion to take any of the following actions with respect to stock awards:
| • | arrange for the assumption, continuation or substitution of a stock award by a surviving or acquiring entity or parent company; |
| • | arrange for the assignment of any reacquisition or repurchase rights held by us to the surviving or acquiring entity or parent company; |
| • | accelerate the vesting of the stock award and provide for its termination prior to the effective time of the corporate transaction; |
| • | arrange for the lapse of any reacquisition or repurchase right held by us; |
| • | cancel or arrange for the cancellation of the stock award in exchange for such cash consideration, if any, as our board of directors may deem appropriate or for no consideration; or |
| • | make a payment equal to the excess of (1) the value of the property the participant would have received upon exercise of the stock award over (2) the exercise price or strike price otherwise payable in connection with the stock award. |
Our plan administrator is not obligated to treat all stock awards, even those that are of the same type, in the same manner.
Under the 2016 Plan, a significant corporate transaction is generally the consummation of (1) a sale or other disposition of all or substantially all of our consolidated assets, (2) a sale or other disposition of at least 50% of our outstanding securities, (3) a merger, consolidation or similar transaction following which we are not the surviving corporation, or (4) a merger, consolidation or similar transaction following which we are the surviving corporation but the shares of our common stock outstanding immediately prior to such transaction are converted or exchanged into other property by virtue of the transaction.
Change in Control. The plan administrator may provide, in an individual award agreement or in any other written agreement between a participant and us that the stock award will be subject to additional acceleration of vesting and exercisability or settlement in the event of a change in control. Under the 2016 Plan, a change in control is generally (1) the acquisition by a person or entity of more than 50% of our combined voting power
117
Table of Contents
other than by merger, consolidation or similar transaction; (2) a consummated merger, consolidation or similar transaction immediately after which our stockholders cease to own more than 50% of the combined voting power of the surviving entity; or (3) a consummated sale, lease or exclusive license or other disposition of all or substantially all of our consolidated assets.
Amendment and Termination. Our board of directors has the authority to amend, suspend, or terminate our 2016 Plan, provided that such action does not materially impair the existing rights of any participant without such participant’s written consent and provided further that certain types of amendments will require the approval of our stockholders. No incentive stock options may be granted after the tenth anniversary of the date our board of directors adopted our 2016 Plan.
2008 Equity Incentive Plan
Our 2008 Equity Incentive Plan, or 2008 Plan, was adopted by our board of directors on March 12, 2008 and approved by our stockholders on May 12, 2008. As of June 30, 2016, 7,014,836 shares of our common stock have been issued pursuant to the exercise of options granted under our 2008 Plan, options to purchase 11,230,416 shares of our common stock were outstanding at a weighted-average exercise price of $1.66 per share and 305,803 shares remained available for future grant under our 2008 Plan. Following this offering, no further grants will be made under our 2008 Plan and all outstanding stock awards granted under our 2008 Plan will continue to be governed by the terms of our 2008 Plan.
Stock Awards. Our 2008 Plan provides for the grant of incentive stock options, nonqualified stock options, stock bonuses and rights to acquire restricted stock, referred to collectively as stock awards, to employees, non-employee directors and consultants providing services to us or our affiliates. The exercise price of stock options may not be less than the fair market value of the stock on the date of grant.
Share Reserve. The aggregate number of shares of our common stock reserved for issuance pursuant to stock awards under the 2008 Plan is 18,551,055 shares, subject to adjustment as provided in the 2008 Plan.
Changes to Capital Structure. In the event that there is a specified type of change in our capital structure, such as a stock split or recapitalization, appropriate adjustments will be made by the board of directors to (1) the class and number of shares available for future grants under the 2008 Plan and (2) the class and number of shares covered by, and the exercise or purchase price of, each outstanding stock award.
Administration. Our board of directors, or a duly authorized committee thereof, each referred to as the plan administrator, has the authority to administer the 2008 Plan. Subject to the terms of the 2008 Plan, the plan administrator may determine recipients, dates of grant, the numbers and types of stock awards to be granted and the terms and conditions of the stock awards, including the period of their exercisability and vesting schedule applicable to a stock award. Subject to the terms of the 2008 Plan, the plan administrator has full authority and discretion to interpret the 2008 Plan, prescribe and rescind rules and regulations related to it, and to amend, terminate or discontinue the 2008 Plan. The board of directors may also delegate authority to one of our officers to designate certain non-officer employees to receive stock awards and to determine the number shares subject to those awards, subject to limits imposed by the board of directors.
Change in Control. In the event of a Change in Control, the plan administrator has the discretion to provide for the assumption of stock awards, the issuance of comparable securities under an incentive program, or, in the case of options, settlement in cash or other property to the extent that the options are vested and have an exercise price less than the price paid per share in the Change in Control. The plan administrator may also accelerate the exercisability or vesting of stock awards. Outstanding options that are not assumed in a Change in Control will terminate as of the Change in Control.
Under the 2008 Plan, a Change in Control is generally defined as the consummation of (1) the sale of voting securities of the Company in which the holders of the voting securities immediately prior to the transaction hold less than 20% of the total combined voting power of the voting securities of the Company or acquiring entity
118
Table of Contents
immediately after the transaction; (2) a merger in which the Company is not the surviving entity, unless holders of the Company’s voting securities immediately prior to the transaction hold more than 50% of the combined voting power of the voting securities of the surviving entity or its parent immediately after the transaction; (3) a reverse merger in which the Company is the surviving entity but holders of the Company’s voting securities immediately prior to the transaction hold less than 50% of the combined voting power of the voting securities of the Company or acquiring entity immediately after the transaction; or (4) the sale, transfer or disposition of all or substantially all of the assets of the Company, except where the holders of the Company’s voting securities immediately prior to the transaction receive as a distribution securities possessing more than 50% of the total combined voting power of all outstanding voting securities of the acquiring entity immediately after the transaction.
Amendment and Termination. As noted above, in connection with this offering, our 2008 Plan will be terminated and no further stock awards will be granted thereunder. All outstanding stock awards under the 2008 Plan will continue to be governed by their existing terms.
2016 Employee Stock Purchase Plan
We expect that our board will adopt and our stockholders will approve prior to the closing of this offering our 2016 Employee Stock Purchase Plan, or our 2016 ESPP. We do not expect to grant purchase rights under our 2016 ESPP until after the closing of this offering.
Share Reserve. The maximum number of shares of our common stock that may be issued under our 2016 ESPP is shares. Additionally, the number of shares of our common stock reserved for issuance under our 2016 ESPP will automatically increase on January 1 of each year, beginning on January 1, 2017 (assuming the 2016 ESPP becomes effective before such date) and continuing through and including January 1, 2026, by the lesser of (1) % of the total number of shares of our common stock outstanding on December 31 of the preceding calendar year, (2) shares of our common stock or (3) such lesser number of shares of common stock as determined by our board of directors. Shares subject to purchase rights granted under our 2016 Plan that terminate without having been exercised in full will not reduce the number of shares available for issuance under our 2016 ESPP.
Administration. Our board of directors, or a duly authorized committee thereof, will administer our 2016 ESPP. Our board of directors has delegated its authority to administer our 2016 ESPP to our compensation committee under the terms of the compensation committee’s charter.
Limitations. Our employees, including executive officers, and the employees of any of our designated affiliates will be eligible to participate in our 2016 ESPP, provided they may have to satisfy one or more of the following service requirements before participating in our 2016 ESPP, as determined by the administrator: (1) customary employment with us or one of our affiliates for more than 20 hours per week and more than five months per calendar year or (2) continuous employment with us or one of our affiliates for a minimum period of time, not to exceed two years, prior to the first date of an offering. An employee may not be granted rights to purchase stock under our 2016 ESPP (a) if such employee immediately after the grant would own stock possessing 5% or more of the total combined voting power or value of all classes of our common stock or (b) to the extent that such rights would accrue at a rate that exceeds $25,000 worth of our stock for each calendar year that the rights remain outstanding.
Our 2016 ESPP is intended to qualify as an employee stock purchase plan under Section 423 of the Code. The administrator may specify offerings with a duration of not more than 27 months, and may specify one or more shorter purchase periods within each offering. Each offering will have one or more purchase dates on which shares of our common stock will be purchased for the employees who are participating in the offering. The administrator, in its discretion, will determine the terms of offerings under our 2016 ESPP.
A participant may not transfer purchase rights under our 2016 ESPP other than by will, the laws of descent and distribution or as otherwise provided under our 2016 ESPP.
119
Table of Contents
Payroll Deductions. Our 2016 ESPP permits participants to purchase shares of our common stock through payroll deductions up to 15% of their earnings. Unless otherwise determined by the administrator, the purchase price of the shares will be 85% of the lower of the fair market value of our common stock on the first day of an offering or on the date of purchase. Participants may end their participation at any time during an offering and will be paid their accrued contributions that have not yet been used to purchase shares. Participation ends automatically upon termination of employment with us.
Corporate Transactions. In the event of certain specified significant corporate transactions, such as our merger or change in control, a successor corporation may assume, continue or substitute each outstanding purchase right. If the successor corporation does not assume, continue or substitute for the outstanding purchase rights, the offering in progress will be shortened and a new exercise date will be set. The participants’ purchase rights will be exercised on the new exercise date and such purchase rights will terminate immediately thereafter.
Amendment and Termination. Our board of directors has the authority to amend, suspend or terminate our 2016 ESPP, at any time and for any reason, provided certain types of amendments will require the approval of our stockholders. Our 2016 ESPP will remain in effect until terminated by our board of directors in accordance with the terms of the 2016 ESPP.
401(k) Plan
We maintain a defined contribution retirement plan that provides eligible U.S. employees with an opportunity to save for retirement on a tax advantaged basis. Eligible employees may defer eligible compensation on a pre-tax basis, up to the statutorily prescribed annual limits on contributions under the Internal Revenue Code of 1986, as amended. Contributions are allocated to each participant’s individual account and are then invested in selected investment alternatives according to the participants’ directions. Employees are immediately and fully vested in their contributions. The 401(k) plan is intended to be qualified under Section 401(a) of the Code with the 401(k) plan’s related trust intended to be tax exempt under Section 501(a) of the Code. As a tax-qualified retirement plan, contributions to the 401(k) plan and earnings on those contributions are not taxable to the employees until distributed from the 401(k) plan.
Limitations on Liability and Indemnification Matters
Upon completion of this offering, our amended and restated certificate of incorporation will contain provisions that limit the liability of our current and former directors for monetary damages to the fullest extent permitted by Delaware law. Delaware law provides that directors of a corporation will not be personally liable for monetary damages for any breach of fiduciary duties as directors, except liability for:
| • | any breach of the director’s duty of loyalty to the corporation or its stockholders; |
| • | any act or omission not in good faith or that involves intentional misconduct or a knowing violation of law; |
| • | unlawful payments of dividends or unlawful stock repurchases or redemptions as provided in Section 174 of the Delaware General Corporation Law; or |
| • | any transaction from which the director derived an improper personal benefit. |
This limitation of liability does not apply to liabilities arising under federal securities laws and does not affect the availability of equitable remedies such as injunctive relief or rescission.
Our amended and restated certificate of incorporation and our amended and restated bylaws to be in effect upon the completion of this offering will provide that we are required to indemnify our directors to the fullest extent permitted by Delaware law. Our amended and restated bylaws will also provide that, upon satisfaction of certain conditions, we are required to advance expenses incurred by a director in advance of the final disposition of any action or proceeding, and permit us to secure insurance on behalf of any officer, director, employee or other
120
Table of Contents
agent for any liability arising out of his or her actions in that capacity regardless of whether we would otherwise be permitted to indemnify him or her under the provisions of Delaware law. Our amended and restated bylaws will also provide our board of directors with discretion to indemnify our officers and employees when determined appropriate by our board of directors. We have entered and expect to continue to enter into agreements to indemnify our directors, executive officers and other employees as determined by the board of directors. With certain exceptions, these agreements provide for indemnification for related expenses including, among other things, attorneys’ fees, judgments, fines and settlement amounts incurred by any of these individuals in any action or proceeding. We believe that these provisions and agreements are necessary to attract and retain qualified persons as directors and officers. We also maintain customary directors’ and officers’ liability insurance.
The limitation of liability and indemnification provisions in our amended and restated certificate of incorporation and amended and restated bylaws to be in effect upon the completion of this offering may discourage stockholders from bringing a lawsuit against our directors for breach of their fiduciary duty. They may also reduce the likelihood of derivative litigation against our directors and officers, even though an action, if successful, might benefit us and other stockholders. Further, a stockholder’s investment may be adversely affected to the extent that we pay the costs of settlement and damage awards against directors and officers as required by these indemnification provisions. At present, there is no pending litigation or proceeding involving any of our directors, officers or employees for which indemnification is sought and we are not aware of any threatened litigation that may result in claims for indemnification.
Rule 10b5-1 Sales Plans
Our directors and executive officers may adopt written plans, known as Rule 10b5-1 plans, in which they will contract with a broker to buy or sell shares of our common stock on a periodic basis. Under a Rule 10b5-1 plan, a broker executes trades pursuant to parameters established by the director or executive officer when entering into the plan, without further direction from them. The director or executive officer may amend a Rule 10b5-1 plan in some circumstances and may terminate a plan at any time. Our directors and executive officers also may buy or sell additional shares outside of a Rule 10b5-1 plan when they are not in possession of material nonpublic information subject to compliance with the terms of our insider trading policy. Prior to 180 days after the date of this offering, subject to early termination, the sale of any shares under such plan would be subject to the lock-up agreement that the director or executive officer has entered into with the underwriters.
121
Table of Contents
CERTAIN RELATIONSHIPS AND RELATED PARTY TRANSACTIONS
The following is a summary of transactions since January 1, 2013 to which we have been a participant in which the amount involved exceeded or will exceed $120,000, and in which any of our then directors, executive officers or holders of more than 5% of any class of our capital stock at the time of such transaction, or any members of their immediate family, had or will have a direct or indirect material interest, other than compensation arrangements which are described in “Executive and Director Compensation.”
Investors’ Rights, Voting and Co-Sale Agreements
In connection with our preferred stock financings, we entered into investors’ rights, voting and right of first refusal and co-sale agreements containing registration rights, information rights, voting rights and rights of first refusal, among other things, with certain holders of our preferred stock, certain holders of our class A common stock and certain holders of our common stock. These stockholder agreements will terminate upon the closing of this offering, except for the registration rights granted under our investors’ rights agreement, as more fully described in “Description of Capital Stock—Registration Rights.”
Cinta Putra, Jaime Ellertson and ABS Ventures IX L.P. are parties to our investors’ rights agreement, voting agreement and right of first refusal and co-sale agreement. Imad Mouline and Steve Kirchmeier, Ms. Putra’s spouse, are parties to our voting agreement and right of first refusal and co-sale agreement.
Employment Arrangements and Separation Agreements
We have entered into employment agreements or offer letters with our executive officers. For more information regarding these agreements with our named executive officers, see “Executive and Director Compensation—Employment Arrangements.”
We entered into a separation agreement with Cinta Putra, our former Chief Financial Officer and Senior Vice President, Business Operations, in November 2014. Pursuant to the agreement, in exchange for a general release of all claims in our favor, we paid (1) cash severance of $125,000 to Ms. Putra in a lump sum, (2) the premiums for continued health benefits for Ms. Putra under COBRA for six months and (3) 100% of Ms. Putra’s 2014 performance bonus as if she had fully performed her full duties for the performance period.
Steve Kirchmeier, one of our co-founders, is employed by us as Associate Vice President of Sales. For the years ended December 31, 2013, December 31, 2014 and December 31, 2015, we paid Mr. Kirchmeier total cash compensation of approximately $298,000, $491,000 and $479,000, respectively. From January 1, 2016 to June 30, 2016, we paid Mr. Kirchmeier cash compensation of approximately $208,000. Mr. Kirchmeier is also the husband of Cinta Putra, one of our co-founders and a member of our board of directors.
Stock Repurchases
In January 2015, we repurchased 1,000,000 shares of common stock from Cinta Putra, a member of our board of directors, at a purchase price of $1.50 per share for aggregate consideration of $1,500,000.
Loans from Our Executive Officers
In 2007, we issued a series of promissory notes in the aggregate principal amount of $180,000 to Cinta Putra, a member of our board of directors who at that time was our Chief Financial Officer and Senior Vice President, Business Operations. The maturity date of each of the promissory notes, as amended, was January 21, 2012. The rate at which interest accrued on the loans fluctuated between 18% and 20% per annum. On September 9, 2013, we and Ms. Putra agreed to cancel the principal and interest due on the loans as payment for the exercise of options to purchase 2,568,507 shares of our common stock. At the time the loans were cancelled, the principal due on the loans totaled $180,000 and the interest due totaled $333,701.
Stock Option Grants to Directors and Executive Officers
We have granted stock options to our certain of our directors and executive officers. For more information regarding the stock options and stock awards granted to our directors and named executive officers see “Executive and Director Compensation—Equity Incentive Plans.”
122
Table of Contents
Indemnification Agreements
We plan to enter into indemnification agreements with each of our directors and executive officers in connection with this offering. The indemnification agreements and our amended and restated certificate of incorporation and amended and restated bylaws, each to be in effect upon the completion of this offering, require us to indemnify our directors and executive officers to the fullest extent permitted by Delaware law. For more information regarding these agreements, see “Executive and Director Compensation—Limitations on Liability and Indemnification Matters.”
Related Person Transaction Policy
Prior to this offering, we have not had a formal policy regarding approval of transactions with related parties. Prior to the completion of this offering, we expect to adopt a related person transaction policy that sets forth our procedures for the identification, review, consideration and approval or ratification of related person transactions. The policy will become effective immediately upon the execution of the underwriting agreement for this offering. For purposes of our policy only, a related person transaction is a transaction, arrangement or relationship, or any series of similar transactions, arrangements or relationships, in which we and any related person are, were or will be participants in which the amount involves exceeds $120,000. Transactions involving compensation for services provided to us as an employee or director are not covered by this policy. A related person is any executive officer, director or beneficial owner of more than 5% of any class of our voting securities, including any of their immediate family members and any entity owned or controlled by such persons.
Under the policy, if a transaction has been identified as a related person transaction, including any transaction that was not a related person transaction when originally consummated or any transaction that was not initially identified as a related person transaction prior to consummation, our management must present information regarding the related person transaction to our audit committee, or, if audit committee approval would be inappropriate, to another independent body of our board of directors, for review, consideration and approval or ratification. The presentation must include a description of, among other things, the material facts, the interests, direct and indirect, of the related persons, the benefits to us of the transaction and whether the transaction is on terms that are comparable to the terms available to or from, as the case may be, an unrelated third party or to or from employees generally. Under the policy, we will collect information that we deem reasonably necessary from each director, executive officer and, to the extent feasible, significant stockholder to enable us to identify any existing or potential related-person transactions and to effectuate the terms of the policy.
In addition, under our Code of Business Conduct and Ethics, which we intend to adopt in connection with this offering, our employees and directors have an affirmative responsibility to disclose any transaction or relationship that reasonably could be expected to give rise to a conflict of interest.
In considering related person transactions, our audit committee, or other independent body of our board of directors, will take into account the relevant available facts and circumstances including, but not limited to:
| • | the risks, costs and benefits to us; |
| • | the impact on a director’s independence in the event that the related person is a director, immediate family member of a director or an entity with which a director is affiliated; |
| • | the availability of other sources for comparable services or products; and |
| • | the terms available to or from, as the case may be, unrelated third parties or to or from employees generally. |
The policy requires that, in determining whether to approve, ratify or reject a related person transaction, our audit committee, or other independent body of our board of directors, must consider, in light of known circumstances, whether the transaction is in, or is not inconsistent with, our best interests and those of our stockholders, as our audit committee, or other independent body of our board of directors, determines in the good faith exercise of its discretion.
All of the transactions described above were entered into prior to the adoption of the written policy, but all were approved by our board of directors considering similar factors to those described above.
123
Table of Contents
PRINCIPAL AND SELLING STOCKHOLDERS
The following table sets forth the beneficial ownership of our common stock as of June 30, 2016, as adjusted to reflect the sale of common stock offered by us and the selling stockholders in this offering, for:
| • | each person, or group of affiliated persons, who is known by us to beneficially own more than 5% of our common stock; |
| • | each of our named executive officers; |
| • | each of our directors; |
| • | all of our executive officers and directors as a group; and |
| • | each of the selling stockholders. |
The percentage ownership information shown in the table prior to this offering is based upon 118,875,481 shares of common stock outstanding as of June 30, 2016, after giving effect to the conversion of all outstanding shares of class A common stock and preferred stock into an aggregate of 54,735,950 shares of our common stock. The percentage ownership information shown in the table after this offering is based upon shares outstanding, assuming the sale of shares of our common stock by us in the offering and no exercise of the underwriters’ over-allotment option.
We have determined beneficial ownership in accordance with the rules of the SEC. These rules generally attribute beneficial ownership of securities to persons who possess sole or shared voting power or investment power with respect to those securities. In addition, the rules include shares of common stock issuable pursuant to the exercise of stock options or warrants that are either immediately exercisable or exercisable on or before August 29, 2016, which is 60 days after June 30, 2016. These shares are deemed to be outstanding and beneficially owned by the person holding those options or warrants for the purpose of computing the percentage ownership of that person, but they are not treated as outstanding for the purpose of computing the percentage ownership of any other person. Unless otherwise indicated, the persons or entities identified in this table have sole voting and investment power with respect to all shares shown as beneficially owned by them, subject to applicable community property laws.
124
Table of Contents
Except as otherwise noted below, the address for persons listed in the table is c/o Everbridge, Inc., 25 Corporate Drive, Suite 400, Burlington, Massachusetts 01803.
| Shares Beneficially Owned Prior to this Offering |
Number of Shares Offered |
Shares Beneficially Owned After this Offering |
Number of Shares to be Sold if Underwriters’ Option is Exercised in Full |
Shares Beneficially Owned After this Offering if Underwriters’ Option is Exercised in Full |
||||||||||||||||||||||||||||
| Name of Beneficial Owner |
Shares | Percentage | Shares | Percentage | Shares | Percentage | ||||||||||||||||||||||||||
| 5% or greater stockholders: |
||||||||||||||||||||||||||||||||
| ABS Ventures IX, L.P.(1) |
37,049,616 | 31.2 | % | |||||||||||||||||||||||||||||
| Jaime Ellertson(2) |
16,319,360 | 13.6 | ||||||||||||||||||||||||||||||
| Cinta Putra(3) |
12,647,670 | 10.6 | ||||||||||||||||||||||||||||||
| Other named executive officers and directors: |
||||||||||||||||||||||||||||||||
| Kenneth S. Goldman(4) |
315,625 | * | ||||||||||||||||||||||||||||||
| Nicholas Hawkins(5) |
137,500 | * | ||||||||||||||||||||||||||||||
| Richard D’Amore(6) |
33,332 | * | ||||||||||||||||||||||||||||||
| Bruns Grayson(1) |
37,049,616 | 31.2 | ||||||||||||||||||||||||||||||
| David Henshall(7) |
33,332 | * | ||||||||||||||||||||||||||||||
| Kent Mathy(8) |
305,839 | * | ||||||||||||||||||||||||||||||
| All current executive officers and directors as a group (14 persons)(9) |
71,105,693 | 58.1 | ||||||||||||||||||||||||||||||
| Other selling stockholders: |
||||||||||||||||||||||||||||||||
| * | Represents beneficial ownership of less than 1%. |
| (1) | Includes 36,958,614 shares of common stock held by ABS Ventures IX, L.P. Calvert Capital V LLC is the general partner of ABS Ventures IX, L.P. Bruns Grayson, the managing member of Calvert Capital IV LLC, has voting and dispositive power with respect to the shares held by ABS Ventures IX, L.P. R. William Burgess, Jr. is also a managing member of Calvert Capital V LLC and shares voting and dispositive power with respect to the securities held by ABS Ventures IX, L.P. Also includes 57,670 shares of common stock issuable upon the exercise of warrants that are exercisable on or before August 29, 2016 held by ABS Ventures IX, L.P. and 33,332 shares of common stock issuable upon the exercise of options that are exercisable on or before August 29, 2016 held by Bruns Grayson. The address of the entities affiliated with ABS Ventures is 950 Winter Street, Suite 2600, Waltham, Massachusetts 02451. |
| (2) | Includes 774,300 shares of common stock issuable upon the exercise of options that are exercisable on or before August 29, 2016 and 1,000,000 shares of common stock held by Mr. Ellertson’s children. |
| (3) | Includes (i) 6,506,889 shares of common stock held by the Steven T. Kirchmeier and Cintawati W. Putra Living Trust Dated May 5, 2015 (the “Living Trust”), of which Ms. Putra and Steven Kirchmeier, Ms. Putra’s spouse, are trustees, (ii) 3,000,000 shares of common stock held by the Cintawati W. Putra 2015 Grantor Retained Annuity Trust (the “Putra Trust”), of which Ms. Putra and Mr. Kirchmeier are trustees, (iii) 3,000,000 shares of common stock held by the Steven T. Kirchmeier 2015 Grantor Retained Annuity Trust (the “Kirchmeier Trust”), of which Ms. Putra and Mr. Kirchmeier are trustees and (iv) 7,500 shares of common stock issuable upon the exercise of options that are exercisable on or before August 29, 2016 held by Mr. Kirchmeier. Ms. Putra and Mr. Kirchmeier have shared voting and dispositive power over the shares held by the Living Trust, the Putra Trust and the Kirchmeier Trust. |
| (4) | Consists of 315,625 shares of common stock issuable upon the exercise of options that are exercisable on or before August 29, 2016. |
| (5) | Consists of 137,500 shares of common stock issuable upon the exercise of options that are exercisable on or before August 29, 2016. |
| (6) | Consists of 33,332 shares of common stock issuable upon the exercise of options that are exercisable on or before August 29, 2016. |
| (7) | Consists of 33,332 shares of common stock issuable upon the exercise of options that are exercisable on or before August 29, 2016. |
| (8) | Consists of 305,839 shares of common stock issuable upon the exercise of options that are exercisable on or before August 29, 2016. |
| (9) | Includes (i) 36,958,614 shares of common stock held by ABS Ventures, IX, L.P., (ii) 1,000,000 shares of common stock held by Mr. Ellertson’s children, (iii) 6,506,889 shares of common stock held by the Living Trust, of which Ms. Putra and Mr. Kirchemeier are trustees, (iv) 3,000,000 shares of common stock held by the Putra Trust, of which Ms. Putra and Mr. Kirchemeier are trustees, (v) 3,000,000 shares of common stock held by the Kirchmeier Trust, of which Ms. Putra and Mr. Kirchmeier are trustees, (vi) 7,500 shares of common stock issuable upon the exercise of options that are exercisable on or before August 29, 2016 held by Mr. Kirchmeier, (vii) 57,670 shares of common stock issuable upon the exercise of warrants that are exercisable on or before August 29, 2016 held by ABS Ventures IV, L.P. and (viii) 3,340,136 shares of common stock issuable upon the exercise of options that are exercisable on or before August 29, 2016 held by the directors and officers. |
125
Table of Contents
The following description of our capital stock, certain provisions of our amended and restated certificate of incorporation and amended and restated bylaws, as each will be in effect upon the completion of this offering, and certain provisions of Delaware law are summaries. You should also refer to the amended and restated certificate of incorporation and the amended and restated bylaws, which are filed as exhibits to the registration statement of which this prospectus is part. We refer in this section to our amended and restated certificate of incorporation and amended and restated bylaws that we intend to adopt in connection with this offering as our certificate of incorporation and bylaws, respectively.
General
Upon the completion of this offering, our certificate of incorporation will authorize us to issue up to shares of common stock, $0.001 par value per share, and 10,000,000 shares of preferred stock, $0.001 par value per share, all of which shares of preferred stock will be undesignated. Our board of directors may establish the rights and preferences of the preferred stock from time to time. As of June 30, 2016, after giving effect to the conversion of all outstanding class A common stock and preferred stock into shares of our common stock in connection with the completion of the offering, there would have been an aggregate of 118,875,481 shares of common stock issued and outstanding, held of record by 654 stockholders.
Common Stock
Voting Rights
Upon the completion of this offering, each holder of our common stock is entitled to one vote for each share on all matters submitted to a vote of the stockholders, including the election of directors. Under our amended and restated certificate of incorporation and amended and restated bylaws, each to be in effect upon the completion of this offering, our stockholders will not have cumulative voting rights. Because of this, the holders of a majority of the shares of common stock entitled to vote in any election of directors will be able elect all of the directors standing for election, if they should so choose.
Dividends
Subject to preferences that may be applicable to any then-outstanding preferred stock, holders of common stock will be entitled to receive ratably those dividends, if any, as may be declared from time to time by the board of directors out of legally available funds.
Liquidation
In the event of our liquidation, dissolution or winding up, holders of common stock will be entitled to share ratably in the net assets legally available for distribution to stockholders after the payment of all of our debts and other liabilities and the satisfaction of any liquidation preference granted to the holders of any then-outstanding shares of preferred stock.
Rights and Preferences
Holders of common stock have no preemptive, conversion or subscription rights and there are no redemption or sinking fund provisions applicable to the common stock. The rights, preferences and privileges of the holders of common stock are subject to, and may be adversely affected by, the rights of the holders of shares of any series of preferred stock that we may designate in the future.
Class A Common Stock
All currently outstanding shares of Class A common stock will be converted to common stock upon the completion of this offering.
126
Table of Contents
Preferred Stock
All currently outstanding shares of preferred stock will be converted to common stock upon the completion of this offering.
Following the completion of this offering, our board of directors will have the authority, without further action by our stockholders, to issue up to 10,000,000 shares of preferred stock in one or more series, to establish from time to time the number of shares to be included in each such series, to fix the rights, preferences and privileges of the shares of each wholly unissued series and any qualifications, limitations or restrictions thereon, and to increase or decrease the number of shares of any such series, but not below the number of shares of such series then outstanding.
Our board of directors may authorize the issuance of preferred stock with voting or conversion rights that could adversely affect the voting power or other rights of the holders of our common stock. The purpose of authorizing our board of directors to issue preferred stock and determine its rights and preferences is to eliminate delays associated with a stockholder vote on specific issuances. The issuance of preferred stock, while providing flexibility in connection with possible acquisitions and other corporate purposes, could, among other things, have the effect of delaying, deferring or preventing a change in control of us and may adversely affect the market price of our common stock and the voting and other rights of the holders of our common stock. It is not possible to state the actual effect of the issuance of any shares of preferred stock on the rights of holders of common stock until the board of directors determines the specific rights attached to that preferred stock.
We have no present plans to issue any shares of preferred stock.
Options
As of June 30, 2016, options to purchase an aggregate of 11,230,416 shares of common stock were outstanding under our 2008 Plan at a weighted-average exercise price of $1.66 per share. For additional information regarding the terms of our 2008 Plan, see “Executive and Director Compensation—Equity Incentive Plans—2008 Equity Incentive Plan.”
Warrants
As of June 30, 2016, warrants to purchase an aggregate of 749,712 shares of our Series A-1 preferred stock at an exercise price of $0.4335 per share were outstanding. The warrant with respect to 57,670 shares will terminate upon the completion of this offering if not earlier exercised and the warrant with respect to the remaining 692,042 shares will become exercisable for an equivalent number of shares of our common stock upon the completion of this offering. The warrants contain a provision for the adjustment of the exercise price and the number of shares issuable upon the exercise of the applicable warrant in the event of certain stock dividends, stock splits, reorganizations, reclassifications and consolidations.
Registration Rights
After the completion of this offering, certain holders of shares of our common stock, including those shares of our common stock that will be issued upon conversion of our preferred stock in connection with this offering, will be entitled to certain rights with respect to registration of such shares under the Securities Act pursuant to the terms of an investors’ rights agreement. These shares are collectively referred to herein as registrable securities.
The investors’ rights agreement provides the holders of registrable securities with demand, piggyback and S-3 registration rights as described more fully below. As of June 30, 2016, after giving effect to the conversion of all outstanding shares of our class A common stock and preferred stock into shares of our common stock in connection with the completion of the offering, there would have been an aggregate of 71,876,018 registrable securities that were entitled to these demand, piggyback and S-3 registration rights.
127
Table of Contents
Demand Registration Rights
At any time beginning 180 days following the effective date of the registration statement of which this prospectus forms a part, the holders of 20% of the registrable securities have the right to make up to two demands that we file a registration statement under the Securities Act covering at least 20% of the registrable securities then outstanding and with an anticipated aggregate offering price of greater than $10.0 million, net of underwriting discounts and commissions, subject to specified exceptions.
Piggyback Registration Rights
If we register any securities for public sale, the holders of our registrable securities then outstanding will each be entitled to notice of the registration and will have the right to include their shares in the registration statement. The underwriters of any underwritten offering will have the right to limit the number of shares having registration rights to be included in the registration statement, provided that the registration does not include shares of any other selling stockholder. If the registration does not include shares of any other selling stockholder, any or all of the registrable securities may be excluded from such registration.
Registration on Form S-3
If we are eligible to file a registration statement on Form S-3, the holders of our registrable securities have the right to demand that we file registration statements on Form S-3; provided, that the aggregate amount of securities to be sold under the registration statement is at least $3.0 million, net of underwriting discounts and commissions. We are not obligated to effect a demand for registration on Form S-3 by holders of our registrable securities more than twice during any 12-month period, and not more than four times in total. The right to have such shares registered on Form S-3 is further subject to other specified conditions and limitations.
Expenses of Registration
We will pay all expenses relating to any demand, piggyback or Form S-3 registration, other than underwriting discounts and commissions, subject to specified conditions and limitations.
Termination of Registration Rights
The registration rights will terminate three years following the completion of this offering.
Anti-Takeover Provisions
Anti-Takeover Statute
We are subject to Section 203 of the Delaware General Corporation Law, which generally prohibits a publicly held Delaware corporation from engaging in any business combination with any interested stockholder for a period of three years after the date that such stockholder became an interested stockholder, with the following exceptions:
| • | before such date, the board of directors of the corporation approved either the business combination or the transaction that resulted in the stockholder becoming an interested stockholder; |
| • | upon completion of the transaction that resulted in the stockholder becoming an interested stockholder, the interested stockholder owned at least 85% of the voting stock of the corporation outstanding at the time the transaction began, excluding for purposes of determining the voting stock outstanding, but not the outstanding voting stock owned by the interested stockholder, those shares owned (1) by persons who are directors and also officers and (2) employee stock plans in which employee participants do not have the right to determine confidentially whether shares held subject to the plan will be tendered in a tender or exchange offer; or |
128
Table of Contents
| • | on or after such date, the business combination is approved by the board of directors and authorized at an annual or special meeting of the stockholders, and not by written consent, by the affirmative vote of at least 66 2⁄3% of the outstanding voting stock that is not owned by the interested stockholder. |
In general, Section 203 defines a “business combination” to include the following:
| • | any merger or consolidation involving the corporation and the interested stockholder; |
| • | any sale, transfer, pledge or other disposition of 10% or more of the assets of the corporation involving the interested stockholder; |
| • | subject to certain exceptions, any transaction that results in the issuance or transfer by the corporation of any stock of the corporation to the interested stockholder; |
| • | any transaction involving the corporation that has the effect of increasing the proportionate share of the stock or any class or series of the corporation beneficially owned by the interested stockholder; or |
| • | the receipt by the interested stockholder of the benefit of any loans, advances, guarantees, pledges or other financial benefits by or through the corporation. |
In general, Section 203 defines an “interested stockholder” as an entity or person who, together with the person’s affiliates and associates, beneficially owns, or within three years prior to the time of determination of interested stockholder status did own, 15% or more of the outstanding voting stock of the corporation.
Anti-Takeover Effects of Certain Provisions of our Certificate of Incorporation and Bylaws to be in Effect Upon the Completion of this Offering
Our certificate of incorporation will provide for our board of directors to be divided into three classes with staggered three-year terms. Only one class of directors will be elected at each annual meeting of our stockholders, with the other classes continuing for the remainder of their respective three-year terms. Because our stockholders do not have cumulative voting rights, stockholders holding a majority of the shares of common stock outstanding will be able to elect all of our directors. Our certificate of incorporation and bylaws will also provide that directors may be removed by the stockholders only for cause upon the vote of 66 2⁄3% or more of our outstanding common stock. Furthermore, the authorized number of directors may be changed only by resolution of the board of directors, and vacancies and newly created directorships on the board of directors may, except as otherwise required by law or determined by the board, only be filled by a majority vote of the directors then serving on the board, even though less than a quorum.
Our certificate of incorporation and bylaws will also provide that all stockholder actions must be effected at a duly called meeting of stockholders and will eliminate the right of stockholders to act by written consent without a meeting. Our bylaws will also provide that only our chairman of the board, chief executive officer or the board of directors pursuant to a resolution adopted by a majority of the total number of authorized directors may call a special meeting of stockholders.
Our bylaws will also provide that stockholders seeking to present proposals before our annual meeting of stockholders or to nominate candidates for election as directors at a meeting of stockholders must provide timely advance notice in writing, and, subject to applicable law, will specify requirements as to the form and content of a stockholder’s notice.
Our certificate of incorporation and bylaws will provide that the stockholders cannot amend many of the provisions described above except by a vote of 66 2⁄3% or more of our outstanding common stock.
The combination of these provisions will make it more difficult for our existing stockholders to replace our board of directors as well as for another party to obtain control of us by replacing our board of directors. Since our
129
Table of Contents
board of directors has the power to retain and discharge our officers, these provisions could also make it more difficult for existing stockholders or another party to effect a change in management. In addition, the authorization of undesignated preferred stock makes it possible for our board of directors to issue preferred stock with voting or other rights or preferences that could impede the success of any attempt to change our control.
These provisions are intended to enhance the likelihood of continued stability in the composition of our board of directors and its policies and to discourage coercive takeover practices and inadequate takeover bids. These provisions are also designed to reduce our vulnerability to hostile takeovers and to discourage certain tactics that may be used in proxy fights. However, such provisions could have the effect of discouraging others from making tender offers for our shares and may have the effect of delaying changes in our control or management. As a consequence, these provisions may also inhibit fluctuations in the market price of our stock that could result from actual or rumored takeover attempts. We believe that the benefits of these provisions, including increased protection of our potential ability to negotiate with the proponent of an unfriendly or unsolicited proposal to acquire or restructure our company, outweigh the disadvantages of discouraging takeover proposals, because negotiation of takeover proposals could result in an improvement of their terms.
Choice of Forum
Our certificate of incorporation to be in effect upon the completion of this offering will provide that the Court of Chancery of the State of Delaware will be the exclusive forum for any derivative action or proceeding brought on our behalf; any action asserting a breach of fiduciary duty owed by any of our directors, officers or employees to us or our stockholders; any action asserting a claim against us arising pursuant to the Delaware General Corporation Law, our certificate of incorporation or our bylaws; or any action asserting a claim against us that is governed by the internal affairs doctrine. Several lawsuits have been filed in Delaware challenging the enforceability of similar choice of forum provisions and it is possible that a court determines such provisions are not enforceable.
Transfer Agent and Registrar
The transfer agent and registrar for our common stock is Computershare Trust Company, N.A. The transfer agent’s address is 250 Royall Street, Canton, Massachusetts 02021.
Listing
We have applied for listing of our common stock on the NASDAQ Global Market under the trading symbol “EVBG.”
130
Table of Contents
SHARES ELIGIBLE FOR FUTURE SALE
Prior to this offering, no public market existed for our common stock, and although we expect that our common stock will be approved for listing on the NASDAQ Global Market, we cannot assure investors that there will be an active public market for our common stock following this offering. We cannot predict what effect, if any, sales of our shares in the public market or the availability of shares for sale will have on the market price of our common stock. Future sales of substantial amounts of common stock in the public market, including shares issued upon exercise of outstanding options or warrants, or the perception that such sales may occur, however, could adversely affect the market price of our common stock and also could adversely affect our future ability to raise capital through the sale of our common stock or other equity-related securities at times and prices we believe appropriate.
Based on our shares outstanding as of June 30, 2016, upon completion of this offering, shares of our common stock will be outstanding.
All of the shares of common stock sold in this offering will be freely tradable without restrictions or further registration under the Securities Act, except for any shares sold to our “affiliates,” as that term is defined under Rule 144 under the Securities Act. The remaining outstanding shares of common stock held by existing stockholders are “restricted securities,” as that term is defined in Rule 144 under the Securities Act. Restricted securities may be sold in the public market only if the offer and sale is registered under the Securities Act or if the offer and sale of those securities qualifies for exemption from registration, including exemptions provided by Rules 144 and 701 promulgated under the Securities Act.
As a result of lock-up agreements and market standoff provisions described below and the provisions of Rules 144 and 701, the restricted securities will be available for sale in the public market as follows:
| • | shares will be eligible for immediate sale upon the completion of this offering; and |
| • | approximately shares will be eligible for sale upon expiration of lock-up agreements and market standoff provisions described below, beginning 181 days after the date of this prospectus, subject in certain circumstances to the volume, manner of sale and other limitations under Rule 144 and Rule 701. |
We may issue shares of our common stock from time to time for a variety of corporate purposes, including in capital-raising activities through future public offerings or private placements, in connection with exercise of stock options and warrants, vesting of restricted stock units and other issuances relating to our employee benefit plans and as consideration for future acquisitions, investments or other purposes. The number of shares of our common stock that we may issue may be significant, depending on the events surrounding such issuances. In some cases, the shares we issue may be freely tradable without restriction or further registration under the Securities Act; in other cases, we may grant registration rights covering the shares issued in connection with these issuances, in which case the holders of the common stock will have the right, under certain circumstances, to cause us to register any resale of such shares to the public.
Rule 144
In general, persons who have beneficially owned restricted shares of our common stock for at least six months, and any affiliate of the company who owns either restricted shares of our common stock, are entitled to sell their securities without registration with the SEC under an exemption from registration provided by Rule 144 under the Securities Act.
Non-Affiliates
Any person who is not deemed to have been one of our affiliates at the time of, or at any time during the three months preceding, a sale may sell an unlimited number of restricted securities under Rule 144 if:
| • | the restricted securities have been held for at least six months, including the holding period of any prior owner other than one of our affiliates; |
131
Table of Contents
| • | we have been subject to the Exchange Act periodic reporting requirements for at least 90 days before the sale; and |
| • | we are current in our Exchange Act reporting at the time of sale. |
Any person who is not deemed to have been an affiliate of ours at the time of, or at any time during the three months preceding, a sale and has held the restricted securities for at least one year, including the holding period of any prior owner other than one of our affiliates, will be entitled to sell an unlimited number of restricted securities without regard to the length of time we have been subject to Exchange Act periodic reporting or whether we are current in our Exchange Act reporting.
Affiliates
Persons seeking to sell restricted securities who are our affiliates at the time of, or any time during the three months preceding, a sale, would be subject to the restrictions described above. They are also subject to additional restrictions, by which such person would be required to comply with the manner of sale and notice provisions of Rule 144 and would be entitled to sell within any three-month period only that number of securities that does not exceed the greater of either of the following:
| • | 1% of the number of shares of our common stock then outstanding, which will equal approximately shares immediately after the completion of this offering based on the number of shares outstanding as of June 30, 2016; or |
| • | the average weekly trading volume of our common stock on the NASDAQ Global Market during the four calendar weeks preceding the filing of a notice on Form 144 with respect to the sale. |
Rule 701
In general, under Rule 701 a person who purchased shares of our common stock pursuant to a written compensatory plan or contract and who is not deemed to have been one of our affiliates during the immediately preceding 90 days may sell these shares in reliance upon Rule 144, but without being required to comply with the notice, manner of sale or public information requirements or volume limitation provisions of Rule 144. Rule 701 also permits affiliates to sell their Rule 701 shares under Rule 144 without complying with the holding period requirements of Rule 144. All holders of Rule 701 shares, however, are required to wait until 90 days after the date of this prospectus before selling such shares pursuant to Rule 701. As of June 30, 2016, 7,014,836 shares of our outstanding common stock had been issued in reliance on Rule 701 as a result of exercises of stock options. However, all Rule 701 shares are subject to lock-up agreements as described below and in “Underwriting” and will become eligible for sale upon the expiration of the restrictions set forth in those agreements.
Form S-8 Registration Statements
As of June 30, 2016, options to purchase an aggregate 11,230,416 of our common stock were outstanding. As soon as practicable after the completion of this offering, we intend to file with the SEC one or more registration statements on Form S-8 under the Securities Act to register the shares of our common stock that are issuable pursuant to our equity incentive plans, including pursuant to outstanding options. See “Executive and Director Compensation—Equity Incentive Plans” for a description of our equity incentive plans. These registration statements will become effective immediately upon filing. Shares covered by these registration statements will then be eligible for sale in the public markets, subject to vesting restrictions, any applicable lock-up agreements described below and Rule 144 limitations applicable to affiliates.
Lock-Up Agreements
In connection with this offering, we, our directors and officers, and of the holders of equity securities outstanding immediately prior to this offering, including all of the selling stockholders, have agreed, subject to
132
Table of Contents
certain exceptions, not to offer, sell, or transfer any common stock or securities convertible into or exchangeable for our common stock for 180 days after the date of this prospectus without the prior written consent of Credit Suisse Securities (USA) LLC and Merrill Lynch, Pierce, Fenner & Smith Incorporated on behalf of the underwriters.
The agreements do not contain any pre-established conditions to the waiver by Credit Suisse Securities (USA) LLC and Merrill Lynch, Pierce, Fenner & Smith Incorporated on behalf of the underwriters of any terms of the lock-up agreements. Any determination to release shares subject to the lock-up agreements would be based on a number of factors at the time of determination, including but not necessarily limited to the market price of the common stock, the liquidity of the trading market for the common stock, general market conditions, the number of shares proposed to be sold, contractual obligations to release certain shares subject to the lock-up agreements in the event any such shares are released, subject to certain specific limitations and thresholds, and the timing, purpose and terms of the proposed sale.
In addition to the restrictions contained in the lock-up agreements described above, we have entered into agreements with certain of our security holders, including our investors’ rights agreement and agreements governing our equity awards, that contain market stand-off provisions imposing restrictions on the ability of such security holders to offer, sell or transfer our equity securities for a period of 180 days following the date of this prospectus.
Registration Rights
Upon the completion of this offering, the holders of 71,876,018 shares of our common stock, or their transferees, will be entitled to specified rights with respect to the registration of the offer and sale of their shares under the Securities Act. Registration of the offer and sale of these shares under the Securities Act would result in the shares becoming freely tradable without restriction under the Securities Act immediately upon the effectiveness of the registration. See “Description of Capital Stock—Registration Rights” for additional information.
133
Table of Contents
MATERIAL U.S. FEDERAL INCOME TAX AND ESTATE TAX CONSIDERATIONS
FOR NON-U.S. HOLDERS
The following is a general discussion of the material U.S. federal income and estate tax consequences of the acquisition, ownership and disposition of our common stock by “Non-U.S. Holders” (as defined below). This discussion is for general information purposes only and does not consider all aspects of U.S. federal income taxation that may be relevant to particular Non-U.S. Holders in light of their individual circumstances or to certain types of Non-U.S. Holders subject to special tax rules, including partnerships or other pass-through entities for U.S. federal income tax purposes, banks, financial institutions or other financial services entities, foreign governments or governmental entities, brokers or dealers in securities or currencies, insurance companies, tax-exempt organizations, pension plans, real estate investment trusts, controlled foreign corporations, passive foreign investment companies, corporations that accumulate earnings to avoid U.S. federal income tax, persons who use or are required to use mark-to-market accounting, persons that hold our shares as part of a “straddle,” a “hedge”, a “conversion transaction,” “synthetic security”, integrated investment or other risk reduction strategy, certain former citizens or permanent residents of the United States, persons who hold or receive shares of our common stock pursuant to the exercise of an employee stock option or otherwise as compensation, or investors in pass-through entities (or entities that are treated as disregarded entities for U.S. federal income tax purposes). In addition, this discussion does not address, except to the extent discussed below, the effects of any applicable gift or estate tax, and this discussion does not address the potential application of alternative minimum tax, or any tax considerations that may apply to Non-U.S. Holders of our common stock under state, local or non-U.S. tax laws and any other U.S. federal tax laws.
This discussion is based on the Internal Revenue Code of 1986, as amended, or the Code, and applicable Treasury Regulations, rulings, administrative pronouncements and judicial decisions that are issued and available as of the date of this registration statement, all of which are subject to change or differing interpretations at any time with possible retroactive effect. We have not sought, and will not seek, any ruling from the Internal Revenue Service, or the IRS, with respect to the tax consequences discussed herein, and there can be no assurance that the IRS will not take a position contrary to the tax consequences discussed below or that any position taken by the IRS would not be sustained. This discussion is limited to a Non-U.S. Holder who will hold our common stock as a capital asset within the meaning of the Code (generally, property held for investment). For purposes of this discussion, the term “Non-U.S. Holder” means a beneficial owner of our shares that is not a partnership (or entity or arrangement treated as a partnership for U.S. federal income tax purposes) and is not:
| • | an individual who is a citizen or resident of the United States; |
| • | a corporation (or other entity treated as a corporation) created or organized in the United States or under the laws of the United States or of any state thereof or the District of Columbia; |
| • | an estate, the income of which is subject to U.S. federal income tax regardless of its source; or |
| • | a trust if (1) a court within the United States can exercise primary supervision over the trust’s administration and one or more U.S. persons have the authority to control all of the trust’s substantial decisions or (2) the trust has a valid election in effect under applicable U.S. Treasury Regulations to be treated as a U.S. person. |
If a partnership (or entity or arrangement treated as a partnership for U.S. federal income tax purposes) is a beneficial owner of our common stock, the tax treatment of such partnership and a partner in such partnership generally will depend upon the status of the partner and the activities of the partnership. If you are a partner of a partnership holding our shares, you should consult your tax advisor regarding the tax consequences of the purchase, ownership, and disposition of our common stock.
THIS SUMMARY IS NOT INTENDED TO BE TAX ADVICE. PROSPECTIVE INVESTORS SHOULD CONSULT THEIR TAX ADVISORS REGARDING THE PARTICULAR U.S. FEDERAL INCOME
134
Table of Contents
TAX CONSEQUENCES TO THEM OF ACQUIRING, OWNING AND DISPOSING OF OUR COMMON STOCK, AS WELL AS ANY TAX CONSEQUENCES ARISING UNDER ANY STATE, LOCAL OR FOREIGN TAX LAWS AND ANY OTHER U.S. FEDERAL TAX LAWS.
Distributions on Our Common Stock
In general, subject to the discussion below under the headings “Information Reporting and Backup Withholding” and “Foreign Accounts,” distributions, if any, paid on our common stock to a Non-U.S. Holder (to the extent paid out of our current or accumulated earnings and profits, as determined under U.S. federal income tax principles) will constitute dividends and be subject to U.S. withholding tax at a rate equal to 30% of the gross amount of the dividend, or a lower rate prescribed by an applicable income tax treaty, unless the dividends are effectively connected with a trade or business carried on by the Non-U.S. Holder within the United States. The portion of any distribution that exceeds our current and accumulated earnings and profits will be treated first as reducing the Non-U.S. Holder’s basis in its shares of common stock, but not below zero, and to the extent it exceeds the Non-U.S. Holder’s basis, as gain from the sale or exchange of our common stock (see “Gain on Sale, Exchange or Other Taxable Disposition of Common Stock” below).
A Non-U.S. Holder who claims the benefit of an applicable income tax treaty generally will be required to satisfy certain certification and other requirements prior to the distribution date. Such Non-U.S. Holders must generally provide us or our paying agent with a properly executed IRS Form W-8BEN or IRS Form W-8BEN-E (or other appropriate form) claiming an exemption from or reduction in withholding under an applicable income tax treaty. Such certificate must be provided before the payment of dividends and must be updated periodically. If tax is withheld in an amount in excess of the amount applicable under an income tax treaty, a refund of the excess amount may generally be obtained by a Non-U.S. Holder by timely filing an appropriate claim for refund with the IRS. Non-U.S. Holders should consult their tax advisors regarding their entitlement to benefits under an applicable income tax treaty.
Dividends that are effectively connected with a Non-U.S. Holder’s conduct of a U.S. trade or business generally will not be subject to the 30% U.S. withholding tax if the Non-U.S. Holder files the required forms, including IRS Form W-8ECI, with us or our paying agent. Instead, such Non-U.S. Holder generally will be subject to U.S. federal income tax on those dividends on a net income basis at regular graduated rates in the same manner as if the Non-U.S. Holder were a resident of the United States (except to the extent provided in an applicable income tax treaty, which may require that such dividends be attributable to a U.S. permanent establishment or fixed base in order to be subject to tax as described herein). A corporate Non-U.S. Holder that receives effectively connected dividends may be subject to an additional branch profits tax at a rate of 30% (or such lower rate as may be prescribed by an applicable income tax treaty) on its effectively connected earnings and profits as adjusted under the Code.
Gain on Sale, Exchange or Other Disposition of Our Common Stock
In general, subject to the discussion below under the headings “Information Reporting and Backup Withholding” and “Foreign Accounts,” a non-U.S. holder will not be subject to U.S. federal income tax or withholding tax on any gain realized upon such holder’s sale, exchange or other disposition of shares of our common stock unless:
(1) the gain is effectively connected with a trade or business carried on by the Non-U.S. Holder within the United States (and, if required by an applicable income tax treaty, attributable to a U.S. permanent establishment or fixed base of the Non-U.S. Holder);
(2) the Non-U.S. Holder is an individual who is present in the United States for 183 days or more in the taxable year of disposition and certain other conditions are met; or
(3) we are or have been a “United States real property holding corporation” for U.S. federal income tax purposes at any time during the shorter of the five-year period ending on the date of disposition or the period that the Non-U.S. Holder held the common stock, and, in the case where shares of our common stock are regularly traded on an established securities market, the Non-U.S. Holder owns, or is treated as owning, more than 5% of our common stock at any time during the foregoing period.
135
Table of Contents
Net gain realized by a Non-U.S. Holder described in clause (1) above generally will be subject to U.S. federal income tax rates in the same manner as if the Non-U.S. Holder were a resident of the United States. Any gains of a corporate Non-U.S. Holder described in clause (1) above may also be subject to an additional “branch profits tax” at a 30% rate (or such lower rate as may be specified by an applicable income tax treaty) on its effectively connected earnings and profits as adjusted under the Code.
Gain realized by an individual Non-U.S. Holder described in clause (2) above will be subject to a flat 30% tax, which gain may be offset by U.S. source capital losses, even though the individual is not considered a resident of the United States.
For purposes of clause (3) above, a corporation generally is a United States real property holding corporation, or USRPHC, if the fair market value of its United States real property interests equals or exceeds 50% of the sum of the fair market value of its worldwide real property interests plus its other assets used or held for use in a trade or business. We believe that we are not, and we do not anticipate that we will become, a USRPHC. However, because the determination of whether we are a USRPHC depends on the fair market value of our U.S. real property interests relative to the fair market value of our other business assets, there can be no assurance that we will not become a USRPHC in the future. Even if we became a USRPHC, a Non-U.S. Holder would not be subject to U.S. federal income tax on a sale, exchange or other taxable disposition of our common stock by reason of our status as an USRPHC so long as our common stock is regularly traded on an established securities market (within the meaning of the applicable regulations) and such Non-U.S. Holder does not own and is not deemed to own (directly, indirectly or constructively) more than 5% of our outstanding common stock at any time during the shorter of the five year period ending on the date of disposition and such holder’s holding period. However, no assurance can be provided that our common stock will be regularly traded on an established securities market for purposes of the rules described above. Prospective investors are encouraged to consult their own tax advisors regarding the possible consequences to them if we are, or were to become, a USRPHC.
Information Reporting and Backup Withholding
Generally, we must report annually to the IRS and to each Non-U.S. Holder the amount of dividends paid, the name and address of the recipient, and the amount, if any, of tax withheld. These information reporting requirements apply even if withholding was not required because the dividends were effectively connected with the Non-U.S. Holder’s conduct of a trade or business within the United States or withholding was reduced by an applicable income tax treaty. Under applicable income tax treaties or other agreements, the IRS may make its reports available to the tax authorities in the Non-U.S. Holder’s country of residence or country in which the Non-U.S. Holder was established.
Dividends paid to a Non-U.S. Holder that is not an exempt recipient generally will be subject to backup withholding, currently at a rate of 28%, unless the Non-U.S. Holder certifies to the payor as to its foreign status, which certification may generally be made on an applicable IRS Form W-8.
Proceeds from the sale or other disposition of common stock by a Non-U.S. Holder effected by or through a U.S. office of a broker will generally be subject to information reporting and backup withholding, currently at a rate of 28%, unless the Non-U.S. Holder certifies to the withholding agent under penalties of perjury as to, among other things, its name, address and status as a Non-U.S. Holder or otherwise establishes an exemption. Payment of disposition proceeds effected outside the United States by or through a non-U.S. office of a non-U.S. broker generally will not be subject to information reporting or backup withholding if the payment is not received in the United States. Information reporting, but generally not backup withholding, will apply to such a payment if the broker has certain connections with the United States unless the broker has documentary evidence in its records that the beneficial owner thereof is a Non-U.S. Holder and specified conditions are met or an exemption is otherwise established.
Backup withholding is not an additional tax. Any amount withheld under the backup withholding rules from a payment to a Non-U.S. Holder that results in an overpayment of taxes generally will be refunded, or credited against the holder’s U.S. federal income tax liability, if any, provided that the required information is timely furnished to the IRS.
136
Table of Contents
Foreign Accounts
A U.S. federal withholding tax of 30% may apply to dividends on, and the gross proceeds of, a disposition of our common stock paid to a “foreign financial institution” (as specially defined under applicable rules) unless such institution enters into an agreement with the U.S. government to withhold on certain payments and to collect and provide to the U.S. tax authorities substantial information regarding certain U.S. account holders of such institution (which includes certain equity holders of such institution, as well as certain account holders that are foreign entities with U.S. owners) or otherwise qualifies for an exemption from these rules. This U.S. federal withholding tax of 30% will also apply to payments of dividends on, and the gross proceeds of, a disposition of our common stock paid to a non-financial foreign entity (as specifically defined by applicable rules), unless such entity either certifies it does not have any substantial direct or indirect U.S. owners or provides the withholding agent with a certification identifying substantial direct and indirect U.S. owners of the entity or otherwise qualifies for an exemption from these rules. The withholding tax described above will not apply if the foreign financial institution or non-financial foreign entity otherwise qualifies for an exemption from the rules. Under certain circumstances, a Non-U.S. Holder might be eligible for refunds or credits of such taxes. The U.S. has entered into agreements with certain countries that modify these general rules for entities resident in those countries. Prospective investors are encouraged to consult with their own tax advisors regarding the possible implications of these rules on their investment in our common stock.
The withholding provisions described above currently apply to payments of dividends on our common stock and will apply to payments of gross proceeds from a sale or other disposition of our common stock by a foreign financial institution on or after January 1, 2019.
U.S. Federal Estate Tax
An individual who at the time of death is not a citizen or resident of the United States and who is treated as the owner of, or has made certain lifetime transfers of, an interest in our common stock will be required to include the value thereof in his or her taxable estate for U.S. federal estate tax purposes, and may be subject to U.S. federal estate tax unless an applicable estate tax treaty provides otherwise. The test for whether an individual is a resident of the United States for U.S. federal estate tax purposes differs from the test used for U.S. federal income tax purposes. Some individuals, therefore, may be “Non-U.S. Holders” for U.S. federal income tax purposes, but not for U.S. federal estate tax purposes, and vice versa.
137
Table of Contents
Under the terms and subject to the conditions contained in an underwriting agreement dated , 2016, we and the selling stockholders have agreed to sell to the underwriters named below, for whom Credit Suisse Securities (USA) LLC and Merrill Lynch, Pierce, Fenner & Smith Incorporated are acting as representatives, the following respective numbers of shares of common stock:
| Name |
Number of Shares | |
| Credit Suisse Securities (USA) LLC |
||
| Merrill Lynch, Pierce, Fenner & Smith Incorporated |
||
| Stifel, Nicolaus & Company, Incorporated |
||
| Pacific Crest Securities, a division of KeyBanc Capital Markets Inc. |
||
| Raymond James & Associates, Inc. |
||
| Canaccord Genuity Inc. |
||
| William Blair & Company, L.L.C. |
||
|
| ||
| Total |
||
|
|
The underwriting agreement provides that the underwriters are obligated to purchase all the shares of common stock in the offering if any are purchased, other than those shares covered by the over-allotment option described below. The underwriting agreement also provides that if an underwriter defaults, the purchase commitments of non-defaulting underwriters may be increased or the offering may be terminated.
The selling stockholders have granted to the underwriters a 30-day option to purchase on a pro rata basis up to additional shares at the initial public offering price less the underwriting discounts and commissions. The option may be exercised only to cover any over-allotments of common stock.
The underwriters propose to offer the shares of common stock initially at the public offering price on the cover page of this prospectus and to selling group members at that price less a selling concession of $ per share. After the initial public offering the representatives may change the public offering price and concession.
The following table summarizes the compensation and estimated expenses we and the selling stockholders will pay:
| Per Share | Total | |||||||||||||||
| Without Over- allotment |
With Over- allotment |
Without Over- allotment |
With Over- allotment |
|||||||||||||
| Underwriting discounts and commissions paid by us |
$ | $ | $ | $ | ||||||||||||
| Expenses payable by us |
||||||||||||||||
| Underwriting discounts and commissions paid by selling stockholders | ||||||||||||||||
| Expenses payable by selling stockholders |
||||||||||||||||
The estimated offering expenses payable by us, exclusive of the estimated underwriting discounts and commissions, are approximately $ . We have agreed to reimburse the underwriters for all expenses and fees related to the review by the Financial Industry Regulatory Authority up to $ .
The representatives have informed us that the underwriters do not expect sales to accounts over which the underwriters have discretionary authority to exceed 5% of the shares of common stock being offered.
We, the selling stockholders, all our directors and executive officers and certain other stockholders and holders of stock options have agreed that, without the prior written consent of Credit Suisse Securities (USA) LLC and
138
Table of Contents
Merrill Lynch, Pierce, Fenner & Smith Incorporated, on behalf of the underwriters, we and they will not, during the period ending 180 days after the effective date of the registration statement of which this prospectus is a part:
| • | offer, pledge, sell, contract to sell, sell any option or contract to purchase, purchase any option or contract to sell, grant any option, right or warrant to purchase, lend or otherwise transfer or dispose of, directly or indirectly, any shares of our common stock or any securities convertible into or exercisable or exchangeable for shares of our common stock; or |
| • | enter into any swap or other arrangement that transfers to another, in whole or in part, any of the economic consequences of ownership of our common stock. |
The restrictions described in the immediately preceding paragraph to do not apply to:
| • | the sale of shares to the underwriters; |
| • | the issuance by us of shares of common stock upon the exercise of an option or a warrant or the conversion of a security outstanding on the date of this prospectus and disclosed in the prospectus; |
| • | the issuance by us of shares or options to purchase shares of common stock pursuant to our equity plans outstanding on the date of this prospectus and disclosed in the prospectus; |
| • | the filing by us of a registration statement with the SEC on Form S-8 relating to the offering of securities in accordance with the terms of a plan in effect on the date of this prospectus and described in the prospectus; |
| • | the entry by us into an agreement providing for the issuance by us of shares of common stock or any security convertible into or exercisable for shares of common stock in connection with the acquisition by us or our subsidiaries of the securities, business, property or other assets of another person or entity or the entry into a joint venture; provided, that the aggregate number of shares of common stock that we may sell or issue or agree to sell or issue as described in this bullet point shall not exceed 10% of the total number of our shares of common stock issued and outstanding (on an as-converted or as-exercised basis, as the case may be) immediately following the completion of the offering; and provided further, that each recipient of such shares of common stock or securities convertible into or exercisable for common stock will execute a lock-up agreement; |
| • | transactions by a security holder relating to shares of common stock or other securities acquired in open market transactions after the completion of the offering, provided that no filing under the Exchange Act will be required or will be voluntarily made in connection with subsequent sales of common stock or other securities acquired in such open market transactions prior to or after the expiration of the lock-up period (other than a filing on form 5 made after the expiration of the lock-up period); |
| • | the transfer by a security holder of shares of common stock or any securities convertible into or exercisable or exchangeable for common stock (1) to an immediate family member or trust for the benefit of such security holder or an immediate family member, (2) by bona fide gift or for bona fide estate planning purposes, (3) by will or intestacy or to any trust for the benefit of such security holder or an immediate family member, (4) pursuant to a court order, or by operation of law, as a result of divorce, (5) to a limited liability company or partnership wholly-owned and controlled by the security holder, (6) if the security holder is a corporation, partnership or limited liability company, to any controlled subsidiary of such entity, or to the partners, members, or stockholders of such entity as part of a distribution, (7) to any investment fund or other entity controlled or managed by the security holder, or (8) if the security holder is a trust, to any beneficiary of such security holder or the estate of any such beneficiary; provided that in each case, (a) each transferee, trustee, donee or distributee signs and delivers a lock-up agreement, (b) such transfer will not involve a disposition for value and (c) no filing or public announcement by any party under the Exchange Act or otherwise will be required or voluntarily made in connection with such transfer prior to or after the expiration of the lock-up period |
139
Table of Contents
| (other than a filing on form 5 made after the expiration of the lock-up period, which clearly indicate in the footnotes thereto that, with respect to a transfer pursuant to clauses (1), (2) or (3) above, such transfer is not a transfer for value and, with respect to a transfer pursuant to clause (4) above, such transfer is by operation of law or court order in connection with a divorce settlement); |
| • | the transfer by a security holder to us in connection with the net exercise or cashless exercise of an option or other securities to purchase shares of common stock granted under an employee benefit plan described in this prospectus and outstanding on the date hereof; provided that any filing under the Exchange Act made after the expiration of the lock-up period will clearly indicate in the footnote thereto that (a) such transfer relates to the net or cashless exercise, (b) no securities were sold by the reporting person and (c) the securities received upon the net or cashless exercise are subject to a lock-up agreement with the underwriters; |
| • | the transfer by a security holder to us pursuant to our right to repurchase securities in connection with the termination of such security holder’s service relationship with us; provided that any filing under the Exchange Act made after the expiration of the lock-up period will clearly indicate in the footnote thereto that the filing relates to a repurchase by us and no other securities were sold by the reporting person; and |
| • | the establishment of a trading plan pursuant to Rule 10b5-1 under the Exchange Act for the transfer of shares of common stock, provided that the plan does not provide for the transfer of common stock during the lock-up period and no public announcement or filing under the Exchange Act regarding the establishment of such plan will be required of or voluntarily made by or on behalf of the security holder or us prior to the expiration of the lock-up period. |
In addition, we and each of the above persons agrees that, without the prior written consent of Credit Suisse Securities (USA) LLC and Merrill Lynch, Pierce, Fenner & Smith Incorporated on behalf of the underwriters, we or such other person will not, during the period ending 180 days after the effective date of registration statement of which this prospectus is a part, file, make any demand for, or exercise any right with respect to, the registration of any shares of common stock or any security convertible into or exercisable or exchangeable for common stock.
Credit Suisse Securities (USA) LLC and Merrill Lynch, Pierce, Fenner & Smith Incorporated, in their sole discretion, may release the common stock and other securities subject to the lock-up agreements described in the preceding in whole or in part at any time with or without notice; provided, however, that if the release is granted for one of our officers or directors, (i) Credit Suisse Securities (USA) LLC and Merrill Lynch, Pierce, Fenner & Smith Incorporated, on behalf of the underwriters, agree that at least three business days before the effective date of the release or waiver, Credit Suisse Securities (USA) LLC and Merrill Lynch, Pierce, Fenner & Smith Incorporated, on behalf of the underwriters, will notify us of the impending release or waiver, and (ii) we are obligated to announce the impending release or waiver by press release through a major news service at least two business days before the effective date of the release or waiver. The agreements do not contain any pre-established conditions to the waiver by Credit Suisse Securities (USA) LLC and Merrill Lynch, Pierce, Fenner & Smith Incorporated on behalf of the underwriters of any terms of the lock-up agreements. Any determination to release shares subject to the lock-up agreements would be based on a number of factors at the time of determination, including but not necessarily limited to the market price of the common stock, the liquidity of the trading market for the common stock, general market conditions, the number of shares proposed to be sold, contractual obligations to release certain shares subject to the lock-up agreements in the event any such shares are released, subject to certain specific limitations and thresholds, and the timing, purpose and terms of the proposed sale.
We and the selling stockholders have agreed to indemnify the underwriters against certain liabilities under the Securities Act, or contribute to payments that the underwriters may be required to make in that respect.
We have applied to have the shares of common stock authorized for listing on the NASDAQ Global Market under the symbol “EVBG.”
140
Table of Contents
In connection with the offering the underwriters may engage in stabilizing transactions, over-allotment transactions, syndicate covering transactions and penalty bids in accordance with Regulation M under the Exchange Act.
| • | Stabilizing transactions permit bids to purchase the underlying security so long as the stabilizing bids do not exceed a specified maximum. |
| • | Over-allotment involves sales by the underwriters of shares in excess of the number of shares the underwriters are obligated to purchase, which creates a syndicate short position. The short position may be either a covered short position or a naked short position. In a covered short position, the number of shares over-allotted by the underwriters is not greater than the number of shares that they may purchase in the over-allotment option. In a naked short position, the number of shares involved is greater than the number of shares in the over-allotment option. The underwriters may close out any covered short position by either exercising their over-allotment option and/or purchasing shares in the open market. |
| • | Syndicate covering transactions involve purchases of the common stock in the open market after the distribution has been completed in order to cover syndicate short positions. In determining the source of shares to close out the short position, the underwriters will consider, among other things, the price of shares available for purchase in the open market as compared to the price at which they may purchase shares through the over-allotment option. If the underwriters sell more shares than could be covered by the over-allotment option, a naked short position, the position can only be closed out by buying shares in the open market. A naked short position is more likely to be created if the underwriters are concerned that there could be downward pressure on the price of the shares in the open market after pricing that could adversely affect investors who purchase in the offering. |
| • | Penalty bids permit the representatives to reclaim a selling concession from a syndicate member when the common stock originally sold by the syndicate member is purchased in a stabilizing or syndicate covering transaction to cover syndicate short positions. |
These stabilizing transactions, syndicate covering transactions and penalty bids may have the effect of raising or maintaining the market price of our common stock or preventing or retarding a decline in the market price of the common stock. As a result the price of our common stock may be higher than the price that might otherwise exist in the open market. These transactions may be effected on The NASDAQ Global Market or otherwise and, if commenced, may be discontinued at any time.
A prospectus in electronic format will be made available on the websites maintained by one or more of the underwriters, or selling group members, if any, participating in this offering and one or more of the underwriters participating in this offering may distribute prospectuses electronically. The representatives may agree to allocate a number of shares to underwriters and selling group members for sale to their online brokerage account holders. Internet distributions will be allocated by the underwriters and selling group members that will make Internet distributions on the same basis as other allocations.
The underwriters and their respective affiliates are full service financial institutions engaged in various activities, which may include securities trading, commercial and investment banking, financial advisory, investment management, principal investment, hedging, financing and brokerage activities. Certain of the underwriters and their respective affiliates have, from time to time, performed, and may in the future perform, various financial advisory and investment banking services for us or our affiliates, for which they received or will receive customary fees and expenses.
Pricing the Offering
Prior to this offering, there has been no public market for our common stock. The initial public offering price was determined by negotiations between us and the representatives. Among the factors considered in determining the initial public offering price were our future prospects and those of our industry in general, our sales, earnings and
141
Table of Contents
certain other financial and operating information in recent periods, and the price-earnings ratios, price-sales ratios, market prices of securities, and certain financial and operating information of companies engaged in activities similar to ours.
Notice to Investors in the European Economic Area
In relation to each Member State of the European Economic Area that has implemented the Prospectus Directive, each, a Relevant Member State, each underwriter represents and agrees that with effect from and including the date on which the Prospectus Directive is implemented in that Relevant Member State, or the Relevant Implementation Date, it has not made and will not make an offer of our common stock to the public in that Relevant Member State prior to the publication of a prospectus in relation to our common stock that has been approved by the competent authority in that Relevant Member State or, where appropriate, approved in another Relevant Member State and notified to the competent authority in that Relevant Member State, all in accordance with the Prospectus Directive, except that it may, with effect from and including the Relevant Implementation Date, make an offer of our common stock to the public in that Relevant Member State at any time:
| • | to any legal entity which is a qualified investor as defined in the Prospectus Directive; |
| • | to fewer than 100 or, if the Relevant Member State has implemented the relevant provision of the PD Amending Directive, 150, natural or legal persons (other than qualified investors as defined in the Prospectus Directive) subject to obtaining the prior consent of the manager for any such offer; or |
| • | in any other circumstances falling within Article 3(2) of the Prospectus Directive, provided that no such offer of our common stock shall require the publication by the issuer or any underwriter of a prospectus pursuant to Article 3 of the Prospectus Directive. |
For the purposes of this provision, the expression an “offer to the public” in relation to any shares of our common stock in any Relevant Member State means the communication in any form and by any means of sufficient information on the terms of the offer and our common stock to be offered so as to enable an investor to decide to purchase or subscribe our common stock, as the same may be varied in that Relevant Member State by any measure implementing the Prospectus Directive in that Member State and the expression Prospectus Directive means Directive 2003/71/EC and (and amendments thereto, including Directive 2010/73/EU, to the extent implemented in each Relevant Member State) includes any relevant implementing measure in each Relevant Member State.
Notice to Prospective Investors in Canada
The common stock may be sold only to purchasers purchasing, or deemed to be purchasing, as principal that are accredited investors, as defined in National Instrument 45-106 Prospectus Exemptions or subsection 73.3(1) of the Securities Act (Ontario), and are permitted clients, as defined in National Instrument 31-103 Registration Requirements, Exemptions and Ongoing Registrant Obligations. Any resale of the common stock must be made in accordance with an exemption from, or in a transaction not subject to, the prospectus requirements of applicable securities laws.
Securities legislation in certain provinces or territories of Canada may provide a purchaser with remedies for rescission or damages if this prospectus (including any amendment thereto) contains a misrepresentation, provided that the remedies for rescission or damages are exercised by the purchaser within the time limit prescribed by the securities legislation of the purchaser’s province or territory. The purchaser should refer to any applicable provisions of the securities legislation of the purchaser’s province or territory for particulars of these rights or consult with a legal advisor.
Pursuant to section 3A.3 (or, in the case of securities issued or guaranteed by the government of a non-Canadian jurisdiction, section 3A.4) of National Instrument 33-105 Underwriting Conflicts (NI 33-105), the underwriters are not required to comply with the disclosure requirements of NI 33-105 regarding underwriter conflicts of interest in connection with this offering.
142
Table of Contents
Notice to Investors in the United Kingdom
Each underwriter:
| • | has only communicated or caused to be communicated and will only communicate or cause to be communicated any invitation or inducement to engage in investment activity within the meaning of section 21 of the Financial Services and Markets Act 2000, or FSMA, in connection with the sale or issue of common stock in circumstances in which section 21 of FSMA does not apply to such underwriter; and |
| • | has complied with, and will comply with all applicable provisions of FSMA with respect to anything done by it in relation to the shares of common stock in, from or otherwise involving the United Kingdom. |
This prospectus is directed solely at persons who (i) are outside the United Kingdom, (ii) have professional experience in matters relating to investments or (iii) are persons falling within Article 49(2)(a) to (d) of The Financial Services and Markets Act (Financial Promotion) Order 2005 (all such persons together being referred to as Relevant Persons). This prospectus must not be acted on or relied on by persons who are not Relevant Persons. Any investment or investment activity to which this prospectus relates is available only to relevant persons and will be engaged in with Relevant Persons only.
Notice to Prospective Investors in Switzerland
The shares may not be publicly offered in Switzerland and will not be listed on the SIX Swiss Exchange, or SIX, or on any other stock exchange or regulated trading facility in Switzerland. This document has been prepared without regard to the disclosure standards for issuance prospectuses under art. 652a or art. 1156 of the Swiss Code of Obligations or the disclosure standards for listing prospectuses under art. 27 ff. of the SIX Listing Rules or the listing rules of any other stock exchange or regulated trading facility in Switzerland. Neither this document nor any other offering or marketing material relating to the shares or the offering may be publicly distributed or otherwise made publicly available in Switzerland.
Neither this document nor any other offering or marketing material relating to the offering, the company, or our shares have been or will be filed with or approved by any Swiss regulatory authority. In particular, this document will not be filed with, and the offer of shares will not be supervised by, the Swiss Financial Market Supervisory Authority FINMA, and the offer of shares has not been and will not be authorized under the Swiss Federal Act on Collective Investment Schemes, or the CISA. The investor protection afforded to acquirers of interests in collective investment schemes under the CISA does not extend to acquirers of shares.
Notice to Prospective Investors in the Dubai International Financial Centre
This prospectus relates to an Exempt Offer in accordance with the Offered Securities Rules of the Dubai Financial Services Authority, or the DFSA. This prospectus is intended for distribution only to persons of a type specified in the Offered Securities Rules of the DFSA. It must not be delivered to, or relied on by, any other person. The DFSA has no responsibility for reviewing or verifying any documents in connection with Exempt Offers. The DFSA has not approved this prospectus nor taken steps to verify the information set forth herein and has no responsibility for the prospectus. The shares to which this prospectus relates may be illiquid and/or subject to restrictions on their resale. Prospective purchasers of the shares offered should conduct their own due diligence on the shares. If you do not understand the contents of this prospectus you should consult an authorized financial advisor.
Notice to Prospective Investors in Australia
No placement document, prospectus, product disclosure statement or other disclosure document has been lodged with the Australian Securities and Investments Commission, or the ASIC, in relation to the offering. This prospectus does not constitute a prospectus, product disclosure statement or other disclosure document under the
143
Table of Contents
Corporations Act 2001, the Corporations Act, and does not purport to include the information required for a prospectus, product disclosure statement or other disclosure document under the Corporations Act.
Any offer in Australia of the shares may only be made to persons, the Exempt Investors, who are “sophisticated investors” (within the meaning of section 708(8) of the Corporations Act), “professional investors” (within the meaning of section 708(11) of the Corporations Act) or otherwise pursuant to one or more exemptions contained in section 708 of the Corporations Act so that it is lawful to offer the shares without disclosure to investors under Chapter 6D of the Corporations Act.
The shares applied for by Exempt Investors in Australia must not be offered for sale in Australia in the period of 12 months after the date of allotment under the offering, except in circumstances where disclosure to investors under Chapter 6D of the Corporations Act would not be required pursuant to an exemption under section 708 of the Corporations Act or otherwise or where the offer is pursuant to a disclosure document which complies with Chapter 6D of the Corporations Act. Any person acquiring shares must observe such Australian on-sale restrictions.
This prospectus contains general information only and does not take account of the investment objectives, financial situation or particular needs of any particular person. It does not contain any securities recommendations or financial product advice. Before making an investment decision, investors need to consider whether the information in this prospectus is appropriate to their needs, objectives and circumstances, and, if necessary, seek expert advice on those matters.
Notice to Prospective Investors in Hong Kong
The shares of common stock have not been offered or sold and will not be offered or sold in Hong Kong, by means of any document, other than (a) to “professional investors” as defined in the Securities and Futures Ordinance (Cap. 571) of Hong Kong and any rules made under that Ordinance; or (b) in other circumstances which do not result in the document being a “prospectus” as defined in the Companies Ordinance (Cap. 32) of Hong Kong or which do not constitute an offer to the public within the meaning of that Ordinance. No advertisement, invitation or document relating to the common stock has been or may be issued or has been or may be in the possession of any person for the purposes of issue, whether in Hong Kong or elsewhere, which is directed at, or the contents of which are likely to be accessed or read by, the public of Hong Kong (except if permitted to do so under the securities laws of Hong Kong) other than with respect to common stock which are or are intended to be disposed of only to persons outside Hong Kong or only to “professional investors” as defined in the Securities and Futures Ordinance and any rules made under that Ordinance.
Notice to Prospective Investors in Japan
The shares of common stock have not been and will not be registered under the Financial Instruments and Exchange Law of Japan (Law No. 25 of 1948, as amended) and, accordingly, will not be offered or sold, directly or indirectly, in Japan, or for the benefit of any Japanese Person or to others for re-offering or resale, directly or indirectly, in Japan or to any Japanese Person, except in compliance with all applicable laws, regulations and ministerial guidelines promulgated by relevant Japanese governmental or regulatory authorities in effect at the relevant time. For the purposes of this paragraph, “Japanese Person” shall mean any person resident in Japan, including any corporation or other entity organized under the laws of Japan.
Notice to Prospective Investors in Singapore
This prospectus has not been registered as a prospectus with the Monetary Authority of Singapore. Accordingly, this prospectus and any other document or material in connection with the offer or sale, or invitation for subscription or purchase, of Non-CIS Securities may not be circulated or distributed, nor may the Non-CIS Securities be offered or sold, or be made the subject of an invitation for subscription or purchase, whether directly or indirectly, to persons in Singapore other than (i) to an institutional investor under Section 274 of the Securities and Futures Act, Chapter 289 of Singapore, the SFA, (ii) to a relevant person pursuant to
144
Table of Contents
Section 275(1), or any person pursuant to Section 275(1A), and in accordance with the conditions specified in Section 275, of the SFA, or (iii) otherwise pursuant to, and in accordance with the conditions of, any other applicable provision of the SFA.
Where the Non-CIS Securities are subscribed or purchased under Section 275 of the SFA by a relevant person which is:
| (a) | a corporation (which is not an accredited investor (as defined in Section 4A of the SFA)) the sole business of which is to hold investments and the entire share capital of which is owned by one or more individuals, each of whom is an accredited investor; or |
| (b) | a trust (where the trustee is not an accredited investor) whose sole purpose is to hold investments and each beneficiary of the trust is an individual who is an accredited investor, |
securities (as defined in Section 239(1) of the SFA) of that corporation or the beneficiaries’ rights and interest (howsoever described) in that trust shall not be transferred within six months after that corporation or that trust has acquired the Non-CIS Securities pursuant to an offer made under Section 275 of the SFA except:
| (a) | to an institutional investor or to a relevant person defined in Section 275(2) of the SFA, or to any person arising from an offer referred to in Section 275(1A) or Section 276(4)(i)(B) of the SFA; |
| (b) | where no consideration is or will be given for the transfer; |
| (c) | where the transfer is by operation of law; |
| (d) | as specified in Section 276(7) of the SFA; or |
| (e) | as specified in Regulation 32 of the Securities and Futures (Offers of Investments) (Shares and Debentures) Regulations 2005 of Singapore. |
Other Relationships
In the ordinary course of their various business activities, the underwriters and certain of their affiliates may make or hold a broad array of investments and actively trade debt and equity securities (or related derivative securities) and financial instruments (including bank loans) for their own account and for the accounts of their customers, and such investment and securities activities may involve securities and/or instruments of the issuer or its affiliates. If the underwriters or their affiliates have a lending relationship with us, the underwriters or their affiliates may hedge, their credit exposure to us consistent with their customary risk management policies. Typically, the underwriters and their affiliates would hedge such exposure by entering into transactions which consist of either the purchase of credit default swaps or the creation of short positions in our securities or the securities of our affiliates, including potentially the shares of common stock offered hereby. Any such credit default swaps or short positions could adversely affect future trading prices of the shares of common stock offered hereby. The underwriters and certain of their affiliates may also communicate independent investment recommendations, market color or trading ideas and/or publish or express independent research views in respect of such securities or instruments and may at any time hold, or recommend to clients that they acquire, long and/or short positions in such securities and instruments.
145
Table of Contents
The validity of the shares of common stock being offered by this prospectus will be passed upon for us by Cooley LLP, Santa Monica, California. Goodwin Procter LLP, Boston, Massachusetts, is representing the underwriters.
The consolidated financial statements of Everbridge, Inc. as of December 31, 2014 and 2015, and for each of the years in the three-year period ended December 31, 2015, have been included herein in reliance upon the report of KPMG LLP, an independent registered public accounting firm, appearing elsewhere herein, and upon the authority of said firm as experts in accounting and auditing.
The consolidated financial statements of Nixle, LLC as of December 31, 2012 and 2013, and for each of the years in the two-year period ended December 31, 2013, have been included herein and in the registration statement in reliance on the report of Werdann Devito LLC, an independent accounting firm, appearing elsewhere herein, and upon the authority of said firm as experts in accounting and auditing.
WHERE YOU CAN FIND ADDITIONAL INFORMATION
We have filed with the SEC a registration statement on Form S-1 under the Securities Act with respect to the shares of common stock being offered by this prospectus, which constitutes a part of the registration statement. This prospectus, which constitutes part of the registration statement, does not contain all of the information in the registration statement and its exhibits. For further information with respect to us and the common stock offered by this prospectus, we refer you to the registration statement and its exhibits. Statements contained in this prospectus as to the contents of any contract or any other document referred to are not necessarily complete, and in each instance, we refer you to the copy of the contract or other document filed as an exhibit to the registration statement.
You can read our SEC filings, including the registration statement, over the internet at the SEC’s website at www.sec.gov. You may also read and copy any document we file with the SEC at its public reference facilities at 100 F Street, N.E., Washington, D.C. 20549. You may also obtain copies of these documents at prescribed rates by writing to the Public Reference Section of the SEC at 100 F Street, N.E., Washington, D.C. 20549. Please call the SEC at 1-800-SEC-0330 for further information on the operation of the public reference facilities.
Upon completion of this offering, we will be subject to the information reporting requirements of the Exchange Act, and we will file reports, proxy statements and other information with the SEC. These reports, proxy statements and other information will be available for inspection and copying at the public reference room and website of the SEC referred to above. We also maintain a website at www.everbridge.com, at which you may access these materials free of charge as soon as reasonably practicable after they are electronically filed with, or furnished to, the SEC. However, the information contained in or accessible through our website is not part of this prospectus or the registration statement of which this prospectus forms a part, and investors should not rely on such information in making a decision to purchase our common stock in this offering.
146
Table of Contents
F-1
Table of Contents
| Page | ||||
| NIXLE, LLC | ||||
| Condensed Financial Statements (Unaudited) Nine Months Ended September 30, 2013 and 2014 |
||||
| F-61 | ||||
| F-62 | ||||
| F-63 | ||||
| F-64 | ||||
| F-65 | ||||
| F-66 | ||||
F-2
Table of Contents
Report of Independent Registered Public Accounting Firm
The Board of Directors and Stockholders
Everbridge, Inc.:
We have audited the accompanying consolidated balance sheets of Everbridge, Inc. and subsidiaries as of December 31, 2014 and 2015, and the related consolidated statements of comprehensive loss, stockholders’ deficit, and cash flows for each of the years in the three-year period ended December 31, 2015. These consolidated financial statements are the responsibility of the Company’s management. Our responsibility is to express an opinion on these consolidated financial statements based on our audits.
We conducted our audits in accordance with the standards of the Public Company Accounting Oversight Board (United States). Those standards require that we plan and perform the audit to obtain reasonable assurance about whether the financial statements are free of material misstatement. An audit includes examining, on a test basis, evidence supporting the amounts and disclosures in the financial statements. An audit also includes assessing the accounting principles used and significant estimates made by management, as well as evaluating the overall financial statement presentation. We believe that our audits provide a reasonable basis for our opinion.
In our opinion, the consolidated financial statements referred to above present fairly, in all material respects, the financial position of Everbridge, Inc. and subsidiaries as of December 31, 2014 and 2015, and the results of their operations and their cash flows for each of the years in the three-year period ended December 31, 2015, in conformity with U.S. generally accepted accounting principles.
/s/ KPMG LLP
Los Angeles, California
April 15, 2016
F-3
Table of Contents
EVERBRIDGE, INC. AND SUBSIDIARIES
Consolidated Balance Sheets
| As of December 31, | As of June 30, 2016 |
Pro Forma as of June 30, 2016 |
||||||||||||||
| 2014 | 2015 | |||||||||||||||
| (in thousands, except share data) |
||||||||||||||||
| Assets | (unaudited) | |||||||||||||||
| Current assets: |
||||||||||||||||
| Cash |
$ | 4,412 | $ | 8,578 | $ | 1,048 | $ | |||||||||
| Accounts receivable, net |
11,252 | 15,699 | 17,213 | |||||||||||||
| Prepaid expenses |
715 | 1,371 | 2,127 | |||||||||||||
| Other current assets |
1,055 | 3,972 | 5,413 | |||||||||||||
|
|
|
|
|
|
|
|
|
|||||||||
| Total current assets |
17,434 | 29,620 | 25,801 | |||||||||||||
| Property and equipment, net |
2,655 | 3,620 | 3,124 | |||||||||||||
| Capitalized software development costs, net |
6,339 | 8,178 | 8,980 | |||||||||||||
| Goodwill |
7,839 | 7,839 | 7,839 | |||||||||||||
| Intangible assets, net |
5,723 | 4,119 | 3,064 | |||||||||||||
| Other assets |
76 | 133 | 84 | |||||||||||||
|
|
|
|
|
|
|
|
|
|||||||||
| Total assets |
$ | 40,066 | $ | 53,509 | 48,892 | $ | ||||||||||
|
|
|
|
|
|
|
|
|
|||||||||
| Liabilities and Stockholders’ Deficit | ||||||||||||||||
| Current liabilities: |
||||||||||||||||
| Accounts payable |
$ | 1,745 | $ | 3,521 | $ | 2,504 | $ | |||||||||
| Accrued payroll and employee related liabilities |
4,881 | 6,062 | 6,325 | |||||||||||||
| Accrued expenses |
1,493 | 1,460 | 1,159 | |||||||||||||
| Line of credit |
3,000 | — | — | |||||||||||||
| Term loan |
— | 830 | 1,662 | |||||||||||||
| Deferred revenue |
27,696 | 39,159 | 42,259 | |||||||||||||
| Notes payable |
3,863 | 2,018 | — | |||||||||||||
| Other current liabilities |
692 | 569 | 541 | |||||||||||||
|
|
|
|
|
|
|
|
|
|||||||||
| Total current liabilities |
43,370 | 53,619 | 54,450 | |||||||||||||
| Long-term liabilities: |
||||||||||||||||
| Deferred revenue, noncurrent |
1,148 | 1,308 | 1,261 | |||||||||||||
| Line of credit |
— | 9,976 | 10,481 | |||||||||||||
| Term loan, net of current portion |
— | 4,146 | 3,319 | |||||||||||||
| Deferred tax liabilities |
776 | 345 | 94 | |||||||||||||
| Other long term liabilities |
99 | 166 | 142 | |||||||||||||
|
|
|
|
|
|
|
|
|
|||||||||
| Total liabilities |
45,393 | 69,560 | 69,747 | |||||||||||||
|
|
|
|
|
|
|
|
|
|||||||||
| Commitments and contingencies |
||||||||||||||||
| Stockholders’ deficit: |
||||||||||||||||
| Series A preferred stock, $0.001 par value. 17,992,237 shares authorized, 17,992,237 shares issued and outstanding as of December 31, 2014, 2015 and June 30, 2016 (unaudited), respectively; no shares issued and outstanding, pro forma as of June 30, 2016 (unaudited); aggregate liquidation preference of $10,793, $11,357 and $11,637 as of December 31, 2014, 2015 and June 30, 2016 (unaudited), respectively |
18 | 18 | 18 | — | ||||||||||||
| Series A-1 preferred stock, $0.001 par value. 32,007,763 shares authorized, 30,048,859 issued and outstanding as of December 31, 2014, 2015, and June 30, 2016 (unaudited) respectively; no shares issued and outstanding, pro forma as of June 30, 2016 (unaudited); aggregate liquidation preference of $17,249, $18,291 and $18,809 as of December 31, 2014, 2015 and June 30, 2016 (unaudited), respectively |
30 | 30 | 30 | — | ||||||||||||
| Class A common stock, $0.001 par value. 8,841,040 shares authorized, 6,694,854 shares issued and
outstanding, as of December 31, 2014, 2015 and June 30, 2016 (unaudited), respectively; no shares issued and outstanding, pro forma as of December 31, 2015 (unaudited); aggregate liquidation preference of $1,339 as of
December 31, 2014, 2015 and June 30, 2016 (unaudited), |
7 | 7 | 7 | — | ||||||||||||
| Common stock, $0.001 par value. 125,000,000 shares authorized, 64,615,006, 63,865,705 and 64,139,531 shares issued and outstanding as of December 31, 2014, 2015 and June 30, 2016 (unaudited), respectively; 118,875,481 shares issued and outstanding, pro forma as of June 30, 2016 (unaudited) |
64 | 64 | 64 | 119 | ||||||||||||
| Additional paid-in capital |
62,104 | 62,175 | 63,766 | 63,766 | ||||||||||||
| Accumulated deficit |
(67,508 | ) | (78,332 | ) | (84,361 | ) | (84,361 | ) | ||||||||
| Accumulated other comprehensive loss |
(42 | ) | (13 | ) | (379 | ) | (379 | ) | ||||||||
|
|
|
|
|
|
|
|
|
|||||||||
| Total stockholders’ deficit |
(5,327 | ) | (16,051 | ) | (20,855 | ) | (20,855 | ) | ||||||||
|
|
|
|
|
|
|
|
|
|||||||||
| Total liabilities and stockholders’ deficit |
$ | 40,066 | $ | 53,509 | $ | 48,892 | $ | 48,892 | ||||||||
|
|
|
|
|
|
|
|
|
|||||||||
See accompanying notes to consolidated financial statements.
F-4
Table of Contents
EVERBRIDGE, INC. AND SUBSIDIARIES
Consolidated Statements of Comprehensive Loss
| Year Ended December 31, | Six Months Ended June 30, |
|||||||||||||||||||
| 2013 | 2014 | 2015 | 2015 | 2016 | ||||||||||||||||
| (in thousands, except share and per share data) | ||||||||||||||||||||
| (unaudited) | ||||||||||||||||||||
| Revenue |
$ | 30,040 | $ | 42,421 | $ | 58,720 | $ | 27,313 | $ | 35,634 | ||||||||||
| Cost of revenue: |
8,699 | 12,089 | 19,789 | 9,045 | 11,151 | |||||||||||||||
|
|
|
|
|
|
|
|
|
|
|
|||||||||||
| Gross profit |
21,341 | 30,332 | 38,931 | 18,268 | 24,483 | |||||||||||||||
|
|
|
|
|
|
|
|
|
|
|
|||||||||||
| Operating expenses: |
||||||||||||||||||||
| Sales and marketing |
11,695 | 15,818 | 25,925 | 11,337 | 17,054 | |||||||||||||||
| Research and development |
5,697 | 7,365 | 11,521 | 5,469 | 6,643 | |||||||||||||||
| General and administrative |
4,352 | 7,435 | 12,272 | 4,578 | 6,586 | |||||||||||||||
|
|
|
|
|
|
|
|
|
|
|
|||||||||||
| Total operating expenses |
21,744 | 30,618 | 49,718 | 21,384 | 30,283 | |||||||||||||||
|
|
|
|
|
|
|
|
|
|
|
|||||||||||
| Operating loss |
(403 | ) | (286 | ) | (10,787 | ) | (3,116 | ) | (5,800 | ) | ||||||||||
|
|
|
|
|
|
|
|
|
|
|
|||||||||||
| Other income (expense), net: |
||||||||||||||||||||
| Interest income |
3 | 2 | 1 | 1 | — | |||||||||||||||
| Interest expense |
(295 | ) | (350 | ) | (538 | ) | (245 | ) | (311 | ) | ||||||||||
| Other expenses, net |
(76 | ) | (78 | ) | (62 | ) | (32 | ) | (28 | ) | ||||||||||
|
|
|
|
|
|
|
|
|
|
|
|||||||||||
| Total other expense, net |
(368 | ) | (426 | ) | (599 | ) | (276 | ) | (339 | ) | ||||||||||
|
|
|
|
|
|
|
|
|
|
|
|||||||||||
| Loss before (provision for) benefit from income taxes |
(771 | ) | (712 | ) | (11,386 | ) | (3,392 | ) | (6,139 | ) | ||||||||||
| (Provision for) benefit from income taxes |
(118 | ) | 89 | 562 | 188 | 110 | ||||||||||||||
|
|
|
|
|
|
|
|
|
|
|
|||||||||||
| Net loss |
$ | (889 | ) | $ | (623 | ) | $ | (10,824 | ) | $ | (3,204 | ) | $ | (6,029 | ) | |||||
|
|
|
|
|
|
|
|
|
|
|
|||||||||||
| Net loss per share attributable to common stockholders: |
||||||||||||||||||||
| Basic |
$ | (0.01 | ) | $ | (0.01 | ) | $ | (0.15 | ) | $ | (0.05 | ) | $ | (0.09 | ) | |||||
|
|
|
|
|
|
|
|
|
|
|
|||||||||||
| Diluted |
$ | (0.01 | ) | $ | (0.01 | ) | $ | (0.15 | ) | $ | (0.05 | ) | $ | (0.09 | ) | |||||
|
|
|
|
|
|
|
|
|
|
|
|||||||||||
| Weighted-average common shares outstanding |
||||||||||||||||||||
| Basic |
63,484,370 | 67,788,061 | 70,482,217 | 70,463,457 | 70,652,785 | |||||||||||||||
| Diluted |
63,484,370 | 67,788,061 | 70,482,217 | 70,463,457 | 70,652,785 | |||||||||||||||
| Pro forma net loss per share attributable to common stockholders, basic and diluted (unaudited) |
$ | (0.09 | ) | $ | (0.05 | ) | ||||||||||||||
|
|
|
|
|
|||||||||||||||||
| Pro forma weighted average common shares outstanding, basic and diluted (unaudited) |
118,523,313 | 118,693,881 | ||||||||||||||||||
| Other comprehensive income (loss): |
||||||||||||||||||||
| Foreign currency translation adjustment, net of tax |
22 | (68 | ) | 29 | (61 | ) | (366 | ) | ||||||||||||
|
|
|
|
|
|
|
|
|
|
|
|||||||||||
| Total comprehensive loss |
$ | (867 | ) | $ | (691 | ) | $ | (10,795 | ) | $ | (3,265 | ) | $ | (6,395 | ) | |||||
|
|
|
|
|
|
|
|
|
|
|
|||||||||||
See accompanying notes to consolidated financial statements.
F-5
Table of Contents
EVERBRIDGE, INC. AND SUBSIDIARIES
Consolidated Statements of Stockholders’ Deficit
(in thousands, except share and per share data)
| Series A preferred stock |
Series A-1 preferred stock |
Common stock | Class A common stock |
Additional paid-in capital |
Accumulated deficit |
Accumulated —other comprehensive income (loss) |
Total | |||||||||||||||||||||||||||||||||||||||||
| Shares | Par value | Shares | Par value | Shares | Par value | Shares | Par value | |||||||||||||||||||||||||||||||||||||||||
| Balance at January 1, 2013 |
17,992,237 | $ | 18 | 30,048,859 | $ | 30 | 55,866,202 | $ | 55 | 6,694,854 | $ | 7 | $ | 53,946 | $ | (65,996 | ) | $ | 4 | $ | (11,936 | ) | ||||||||||||||||||||||||||
| Stock-based compensation |
— | — | — | — | — | — | — | — | 176 | — | — | 176 | ||||||||||||||||||||||||||||||||||||
| Exercise of stock options |
— | — | — | — | 2,803,588 | 3 | — | — | 536 | — | — | 539 | ||||||||||||||||||||||||||||||||||||
| Other comprehensive income |
— | — | — | — | — | — | — | — | — | — | 22 | 22 | ||||||||||||||||||||||||||||||||||||
| Net loss |
— | — | — | — | — | — | — | — | — | (889 | ) | — | (889 | ) | ||||||||||||||||||||||||||||||||||
|
|
|
|
|
|
|
|
|
|
|
|
|
|
|
|
|
|
|
|
|
|
|
|
|
|||||||||||||||||||||||||
| Balance at December 31, 2013 |
17,992,237 | $ | 18 | 30,048,859 | $ | 30 | 58,669,790 | $ | 58 | 6,694,854 | $ | 7 | $ | 54,658 | $ | (66,885 | ) | $ | 26 | $ | (12,088 | ) | ||||||||||||||||||||||||||
| Stock-based compensation |
— | — | — | — | — | — | — | — | 376 | — | — | 376 | ||||||||||||||||||||||||||||||||||||
| Exercise of stock options |
— | — | — | — | 1,068,249 | 1 | — | — | 224 | — | — | 225 | ||||||||||||||||||||||||||||||||||||
| Issuance of common stock for acquisitions |
— | — | — | — | 4,769,209 | 5 | — | — | 6,846 | — | — | 6,851 | ||||||||||||||||||||||||||||||||||||
| Cashless exercise of warrant |
— | — | — | — | 107,758 | — | — | — | — | — | — | — | ||||||||||||||||||||||||||||||||||||
| Other comprehensive loss |
— | — | — | — | — | — | — | — | — | — | (68 | ) | (68 | ) | ||||||||||||||||||||||||||||||||||
| Net loss |
— | — | — | — | — | — | — | — | — | (623 | ) | — | (623 | ) | ||||||||||||||||||||||||||||||||||
|
|
|
|
|
|
|
|
|
|
|
|
|
|
|
|
|
|
|
|
|
|
|
|
|
|||||||||||||||||||||||||
| Balance at December 31, 2014 |
17,992,237 | $ | 18 | 30,048,859 | $ | 30 | 64,615,006 | $ | 64 | 6,694,854 | $ | 7 | $ | 62,104 | $ | (67,508 | ) | $ | (42 | ) | $ | (5,327 | ) | |||||||||||||||||||||||||
|
|
|
|
|
|
|
|
|
|
|
|
|
|
|
|
|
|
|
|
|
|
|
|
|
|||||||||||||||||||||||||
| Stock-based compensation |
— | — | — | — | 34,657 | — | — | — | 1,522 | — | — | 1,522 | ||||||||||||||||||||||||||||||||||||
| Repurchase of common stock |
— | — | — | — | (1,000,000 | ) | (1 | ) | — | — | (1,499 | ) | — | — | (1,500 | ) | ||||||||||||||||||||||||||||||||
| Exercise of stock options |
— | — | — | — | 216,042 | 1 | — | — | 48 | — | — | 49 | ||||||||||||||||||||||||||||||||||||
| Other comprehensive income |
— | — | — | — | — | — | — | — | — | — | 29 | 29 | ||||||||||||||||||||||||||||||||||||
| Net loss |
— | — | — | — | — | — | — | — | — | (10,824 | ) | — | (10,824 | ) | ||||||||||||||||||||||||||||||||||
|
|
|
|
|
|
|
|
|
|
|
|
|
|
|
|
|
|
|
|
|
|
|
|
|
|||||||||||||||||||||||||
| Balance at December 31, 2015 |
17,992,237 | $ | 18 | 30,048,859 | $ | 30 | 63,865,705 | $ | 64 | 6,694,854 | $ | 7 | $ | 62,175 | $ | (78,332 | ) | $ | (13 | ) | $ | (16,051 | ) | |||||||||||||||||||||||||
|
|
|
|
|
|
|
|
|
|
|
|
|
|
|
|
|
|
|
|
|
|
|
|
|
|||||||||||||||||||||||||
| Stock-based compensation (unaudited) |
— | — | — | — | — | — | — | — | 1,406 | — | — | 1,406 | ||||||||||||||||||||||||||||||||||||
| Exercise of stock options (unaudited) |
— | — | — | — | 273,826 | — | — | — | 185 | — | — | 185 | ||||||||||||||||||||||||||||||||||||
| Other comprehensive loss (unaudited) |
— | — | — | — | — | — | — | — | — | — | (366 | ) | (366 | ) | ||||||||||||||||||||||||||||||||||
| Net loss (unaudited) |
— | — | — | — | — | — | — | — | — | (6,029 | ) | — | (6,029 | ) | ||||||||||||||||||||||||||||||||||
|
|
|
|
|
|
|
|
|
|
|
|
|
|
|
|
|
|
|
|
|
|
|
|
|
|||||||||||||||||||||||||
| Balance at June 30, 2016 (unaudited) |
17,992,237 | 18 | 30,048,859 | 30 | 64,139,531 | 64 | 6,694,854 | 7 | 63,766 | (84,361 | ) | (379 | ) | (20,855 | ) | |||||||||||||||||||||||||||||||||
|
|
|
|
|
|
|
|
|
|
|
|
|
|
|
|
|
|
|
|
|
|
|
|
|
|||||||||||||||||||||||||
See accompanying notes to consolidated financial statements.
F-6
Table of Contents
EVERBRIDGE, INC. AND SUBSIDIARIES
Consolidated Statements of Cash Flows
| Year Ended December 31, |
Six Months Ended June 30, |
|||||||||||||||||||
| 2013 | 2014 | 2015 | 2015 | 2016 | ||||||||||||||||
| (in thousands) | ||||||||||||||||||||
| (unaudited) | ||||||||||||||||||||
| Cash flows from operating activities: |
||||||||||||||||||||
| Net loss |
$ | (889 | ) | $ | (623 | ) | $ | (10,824 | ) | $ | (3,204 | ) | $ | (6,029 | ) | |||||
| Adjustments to reconcile net loss to net cash provided by operating activities: |
||||||||||||||||||||
| Depreciation and amortization |
2,455 | 2,512 | 5,976 | 2,529 | 3,701 | |||||||||||||||
| Loss on disposal of assets |
— | — | — | — | 74 | |||||||||||||||
| Deferred income taxes |
— | (315 | ) | (431 | ) | — | (224 | ) | ||||||||||||
| Accretion of interest on notes payable |
— | — | 130 | 72 | — | |||||||||||||||
| Non-cash interest expense on line of credit and term loan |
— | — | 11 | — | 10 | |||||||||||||||
| Provision for doubtful accounts |
72 | 206 | 366 | 89 | 87 | |||||||||||||||
| Stock-based compensation |
176 | 376 | 1,488 | 358 | 1,378 | |||||||||||||||
| Increase (decrease) in operating assets and liabilities: |
||||||||||||||||||||
| Accounts receivable |
(2,066 | ) | (1,008 | ) | (4,813 | ) | (1,613 | ) | (1,601 | ) | ||||||||||
| Prepaid expenses |
(111 | ) | (304 | ) | (656 | ) | (1,153 | ) | (756 | ) | ||||||||||
| Other assets |
(86 | ) | (217 | ) | (408 | ) | (428 | ) | (1,214 | ) | ||||||||||
| Accounts payable |
(245 | ) | 414 | 866 | 1,333 | (66 | ) | |||||||||||||
| Accrued labor |
1,149 | 1,407 | 1,181 | 204 | 263 | |||||||||||||||
| Accrued expenses |
352 | 152 | (171 | ) | (543 | ) | (373 | ) | ||||||||||||
| Deferred revenue |
3,048 | 4,973 | 11,623 | 4,935 | 3,053 | |||||||||||||||
| Other liabilities |
143 | 143 | 113 | (1 | ) | 6 | ||||||||||||||
|
|
|
|
|
|
|
|
|
|
|
|||||||||||
| Net cash provided by (used in) operating activities |
3,998 | 7,716 | 4,451 | 2,578 | (1,691 | ) | ||||||||||||||
|
|
|
|
|
|
|
|
|
|
|
|||||||||||
| Cash flows from investing activities: |
||||||||||||||||||||
| Capital expenditures |
(688 | ) | (2,155 | ) | (2,502 | ) | (1,327 | ) | (346 | ) | ||||||||||
| Payments for acquisitions, net of acquired cash |
— | (304 | ) | — | — | — | ||||||||||||||
| Additions to capitalized software development costs |
(762 | ) | (1,677 | ) | (4,902 | ) | (2,260 | ) | (3,040 | ) | ||||||||||
| Change in restricted cash |
115 | — | — | (77 | ) | — | ||||||||||||||
|
|
|
|
|
|
|
|
|
|
|
|||||||||||
| Net cash used in investing activities |
(1,335 | ) | (4,136 | ) | (7,404 | ) | (3,664 | ) | (3,386 | ) | ||||||||||
|
|
|
|
|
|
|
|
|
|
|
|||||||||||
| Cash flows from financing activities: |
||||||||||||||||||||
| Proceeds from line of credit |
28,955 | 6,400 | 12,000 | 2,000 | 9,500 | |||||||||||||||
| Payments on line of credit |
(30,158 | ) | (6,766 | ) | (5,000 | ) | — | (9,000 | ) | |||||||||||
| Payments of issuance costs relating to line of credit and term loan |
— | — | (59 | ) | — | — | ||||||||||||||
| Principal payments on capital leases |
(174 | ) | (85 | ) | (101 | ) | (48 | ) | (58 | ) | ||||||||||
| Payments of initial public offering costs |
— | — | (1,391 | ) | — | (1,101 | ) | |||||||||||||
| Payments on notes payable |
— | (1,894 | ) | (1,779 | ) | — | (2,018 | ) | ||||||||||||
| Proceeds from term loan |
— | — | 5,000 | — | — | |||||||||||||||
| Proceeds from issuance of common shares, net |
25 | 225 | 49 | 24 | 185 | |||||||||||||||
| Repurchase of common stock |
— | — | (1,500 | ) | (1,500 | ) | — | |||||||||||||
|
|
|
|
|
|
|
|
|
|
|
|||||||||||
| Net cash provided by (used in) financing activities |
(1,352 | ) | (2,120 | ) | 7,219 | 476 | (2,492 | ) | ||||||||||||
|
|
|
|
|
|
|
|
|
|
|
|||||||||||
| Effect of exchange rates on cash and cash equivalents |
17 | (88 | ) | (100 | ) | 13 | 39 | |||||||||||||
|
|
|
|
|
|
|
|
|
|
|
|||||||||||
| Net increase in cash and cash equivalents |
1,328 | 1,372 | 4,166 | (597 | ) | (7,530 | ) | |||||||||||||
| Cash—beginning of year |
1,712 | 3,040 | 4,412 | 4,412 | 8,578 | |||||||||||||||
|
|
|
|
|
|
|
|
|
|
|
|||||||||||
| Cash—end of year |
$ | 3,040 | $ | 4,412 | $ | 8,578 | $ | 3,815 | $ |
1,048 |
| |||||||||
|
|
|
|
|
|
|
|
|
|
|
|||||||||||
| Supplemental disclosures of cash flow information: |
||||||||||||||||||||
| Cash paid during the year for: |
||||||||||||||||||||
| Interest |
$ | 295 | $ | 217 | $ | 369 | $ | 114 | $ | 315 | ||||||||||
| Taxes |
— | 93 | 124 | 111 | — | |||||||||||||||
| Supplemental disclosure of non-cash activities |
||||||||||||||||||||
| Acquisition of property and equipment with capital leases |
294 | — | — | — | — | |||||||||||||||
| Exercise of common stock options in exchange for settlement of notes payable—related party |
514 | — | — | — | — | |||||||||||||||
| Issuance of common stock in connection with acquisitions |
— | 6,851 | — | — | — | |||||||||||||||
| Issuance of notes payable in connection with acquisitions |
— | 5,815 | — | — | — | |||||||||||||||
| Capitalized assets included in accounts payable and accrued expenses |
274 | 190 | 63 | 820 | 107 | |||||||||||||||
| Deferred offering costs in accounts payable and accrued expenses |
— | — | 1,175 | 367 | 126 | |||||||||||||||
| Stock-based compensation capitalized for software development |
— | — | 34 | — | 28 | |||||||||||||||
See accompanying notes to consolidated financial statements.
F-7
Table of Contents
Everbridge, Inc.
Notes to the Consolidated Financial Statements
(1) Business and Nature of Operations
Everbridge, Inc., a Delaware corporation (together with its wholly-owned subsidiaries, referred to as Everbridge or the Company), is a global software company that provides critical communications and enterprise safety applications that enable customers to automate and accelerate the process of keeping people safe and businesses running during critical events. The Company’s SaaS-based platform enables the Company’s customers to quickly and reliably deliver messaging to a large group of people during critical situations. The Company’s enterprise applications automate numerous critical communications processes such as Mass Notification, Incident Management, IT Alerting, Safety Connection, Community Engagement, Secure Messaging and Internet of Things. The Company generates revenue primarily from subscription fees to the Company’s enterprise applications. The Company has operations in the United States, the United Kingdom and China.
Liquidity
The Company has experienced operating losses since inception. For the years ended December 31, 2013, 2014 and 2015, the Company has incurred net losses of $0.9 million, $0.6 million and $10.8 million, respectively, and has generated cash inflows from operations of $4.0 million, $7.7 million and $4.4 million, respectively. For the six months ended June 30, 2016, the Company incurred a net loss of $6.0 million (unaudited) and used $1.7 million (unaudited) of cash in operations. As of December 31, 2014 and 2015 and June 30, 2016, the Company had an accumulated deficit of $67.5 million, $78.3 million and $84.4 million (unaudited), respectively. To date, the Company’s operations have been primarily financed through third-party debt and proceeds from the issuance of convertible preferred and common stock. At December 31, 2015 and June 30, 2016, the Company had an available line of credit with Western Alliance Bank (formerly known as Bridge Bank) with $0 and $4.5 million, respectively, of unfunded capacity. At December 31, 2014 and 2015 and June 30, 2016, the Company had cash of $4.4 million, $8.6 million and $1.0 million (unaudited), respectively.
In June 2015, the Company entered into an agreement with Western Alliance Bank to provide a secured revolving line of credit that allows the Company to borrow up to $10.0 million for working capital and general business requirements. Amounts outstanding under the credit facility bear interest at the prime rate plus 0.75% with accrued interest payable on a monthly basis and outstanding and unpaid principal due upon maturity of the line of credit in June 2018. The line of credit is secured by substantially all accounts receivable and other corporate assets of the Company. The Company is also subject to certain reporting and financial performance covenants that require it to meet certain revenue targets. In February 2016, the Company entered into an amendment of its loan and security agreement with Western Alliance Bank to increase the capacity of its revolving line of credit by $5.0 million.
In addition to the revolving credit facility, a $5.0 million growth capital term loan was entered into with Western Alliance Bank. The term loan bears interest at a floating per annum rate equal to the prime rate plus 1.75%. Interest on the term loan was payable monthly in arrears for the first 12 months. Thereafter, the term loan will be payable in thirty-six equal monthly installments of principal, plus all accrued interest, beginning on June 30, 2016. The term loan may be prepaid at the Company’s option, subject to a prepayment fee equal to 2% of the principal amount being repaid if such prepayment occurs on or prior to the first anniversary of the closing date. The loan maturity date is June 30, 2019.
The Company believes that it has sufficient working capital from recent financings, cash generated from operations, and capacity under its revolving line of credit to fund its operations through at least the next 12 months.
F-8
Table of Contents
(2) Summary of Significant Accounting Policies
Basis of Presentation
The Company’s accounting and financial reporting policies conform to generally accepted accounting principles in the United States of America, or GAAP.
Principles of Consolidation
The consolidated financial statements include the accounts of the Company and its wholly-owned subsidiaries. Business acquisitions are included in the Company’s consolidated financial statements from the date of the acquisition. The Company’s purchase accounting resulted in all assets and liabilities of acquired businesses being recorded at their estimated fair values on the acquisition dates. Intercompany balances and transactions have been eliminated in consolidation.
Unaudited Interim Consolidated Financial Information
The accompanying consolidated balance sheet as of June 30, 2016, the consolidated statements of comprehensive loss, and statements of cash flows for the six months ended June 30, 2015 and 2016, the consolidated statement of stockholders’ deficit for the six months ended June 30, 2016 and the related footnote disclosures are unaudited. The unaudited interim consolidated financial statements have been prepared on the same basis as the annual consolidated financial statements and, in the opinion of management, reflect all adjustments necessary to present fairly the Company’s consolidated financial position as of June 30, 2016 and results of operations, comprehensive loss, and cash flows for the six months ended June 30, 2015 and 2016. The results for the six months ended June 30, 2016 are not necessarily indicative of the results to be expected for the year ending December 31, 2016 or for any other periods.
Unaudited Pro Forma Information
Upon the consummation of the Company’s initial public offering, all of the outstanding shares of the convertible preferred stock and class A common stock will automatically convert and be reclassified into shares of common stock. The December 31, 2015 unaudited consolidated pro forma stockholders’ deficit has been prepared assuming the conversion and reclassification of the outstanding shares of convertible preferred stock and class A common stock into 48,041,096 and 6,694,854 shares of common stock, respectively.
Use of Estimates
The preparation of consolidated financial statements in conformity with GAAP requires management to make estimates and assumptions that affect the reported amounts of assets and liabilities and disclosure of contingent assets and liabilities at the date of the consolidated financial statements, and the reported amount of revenues and expenses during the reporting period. Actual results could differ from those estimates.
Assets and liabilities which are subject to judgment and use of estimates include allowances for doubtful accounts, the fair value of assets acquired and liabilities assumed in business combinations, the recoverability of goodwill and long-lived assets, valuation allowances with respect to deferred tax assets, useful lives associated with property and equipment and intangible assets, contingencies, and the valuation and assumptions underlying stock-based compensation. On an ongoing basis, the Company evaluates its estimates compared to historical experience and trends, which form the basis for making judgments about the carrying value of assets and liabilities. In addition, the Company engaged valuation specialists to assist with management’s determination of the valuation of its fair values of assets acquired and liabilities assumed in business combinations and the valuation of the Company’s common stock.
Recent Accounting Standards
In May 2014, the Financial Accounting Standards Board, or FASB, issued Accounting Standards Update, or ASU, 2014-09, Revenue from Contracts with Customers (Topic 606), which supersedes the revenue recognition criteria in Accounting Standard Codification, or ASC, 605, Revenue Recognition. Under this guidance, revenue is recognized when promised goods or services are transferred to customers in an amount that reflects the
F-9
Table of Contents
Everbridge, Inc.
Notes to the Consolidated Financial Statements—(Continued)
consideration that is expected to be received for those goods or services. The updated standard will replace all existing revenue recognition guidance under GAAP when it becomes effective and permits the use of either the retrospective or cumulative effect transition method. This ASU is effective for annual periods beginning after December 15, 2017 and shall be applied either retrospectively to each period presented or as a cumulative-effect adjustment as of the date of adoption. Early adoption for annual periods beginning after December 15, 2016 would be permitted. The Company is evaluating the potential impact of this adoption on its consolidated financial statements.
In August 2014, the FASB issued ASU 2014-15, Disclosure of Uncertainties About an Entity’s Ability to Continue as a Going Concern. This standard update provides guidance around management’s responsibility to evaluate whether there is substantial doubt about an entity’s ability to continue as a going concern and to provide related footnote disclosures. The new guidance is effective for all annual and interim periods ending after December 15, 2016. The adoption of this guidance is not expected to have a material impact on the Company’s financial statements.
In April 2015, FASB issued ASU 2015-03, Interest—Imputation of Interest (Subtopic 835-30): Simplifying the Presentation of Debt Issuance Costs. ASU 2015-03 provides accounting guidance regarding financial statement presentation of debt issuance costs related to a recognized debt liability. The guidance states that debt issuance costs related to a recognized debt liability be presented in the balance sheet as a direct deduction from the carrying amount of the debt liability, consistent with that of debt discounts. Given the absence of authoritative guidance within ASU 2015-03 for debt issuance costs related to line-of-credit arrangements, the SEC staff would not object to an entity deferring and presenting debt issuance costs as an asset and subsequently amortizing the deferred debt issuance costs ratably over the term of the line-of-credit arrangement, regardless of whether there are any outstanding borrowings on the line-of-credit arrangement. This ASU is effective for annual periods and interim periods within those annual periods, beginning after December 15, 2015. Early adoption is permitted, but only for financial statements which have not been previously issued. An entity should apply this guidance on a retrospective basis wherein the balance sheet of each individual period be adjusted to reflect the period-specific effect of the new guidance. Upon transition, an entity is required to comply with the appropriate disclosures associated with a change in accounting principle. The Company adopted this standard as of January 1, 2016 with retroactive application. Adoption of ASU 2015-03 resulted in a decrease in pre-paid expense of $48,000 and a decrease in the Company’s line of credit and term loan debt of $48,000 as of December 31, 2015 on the Company’s consolidated balance sheet.
In November 2015, the FASB issued ASU 2015-17, Income Taxes (Topic 740): Balance Sheet Classification of Deferred Taxes. This standard amends the accounting for income taxes and requires all deferred tax assets and liabilities to be classified as non-current on the balance sheet. The new standard is effective for reporting periods beginning after December 15, 2016, with early adoption permitted. The standard may be adopted either prospectively or retrospectively. The Company elected to adopt the accounting standard retrospectively in 2015.
In February 2016, the FASB issued ASU 2016-02, Leases (Topic 842). The amendments in this update require lessees, among other things, to recognize lease assets and lease liabilities on the balance sheet for those leases classified as operating leases under previous authoritative guidance. This update also introduces new disclosure requirements for leasing arrangements. ASU 2016-02 will be effective in fiscal year 2019, but early application is permitted. The Company is evaluating the potential impact of this update on its consolidated financial statements.
Fair Value Measurements
Fair value is defined as the exchange price that would be received for an asset or paid to transfer a liability (an exit price) in the principal or most advantageous market for the asset or liability in an orderly transaction between market participants on the measurement date.
F-10
Table of Contents
Everbridge, Inc.
Notes to the Consolidated Financial Statements—(Continued)
Valuation techniques used to measure fair value must maximize the use of observable inputs and minimize the use of unobservable inputs. Accounting standards describe a fair value hierarchy based on three levels of inputs, of which the first two are considered observable and the last unobservable, that may be used to measure fair value which are the following:
Level 1—Quoted prices in active markets for identical assets or liabilities or funds.
Level 2—Inputs other than Level 1 that are observable, either directly or indirectly, such as quoted prices for similar assets or liabilities; quoted prices in markets that are not active; or other inputs that are observable or can be corroborated by observable market data for substantially the full term of the assets or liabilities.
Level 3—Unobservable inputs that are supported by little or no market activity and that are significant to the fair value of the assets or liabilities.
Fair value is based on quoted market prices, if available. If listed prices or quotes are not available, fair value is based on internally-developed models that primarily use market-based or independently sourced market parameters as inputs.
For financial instruments measured at fair value, the following section describes the valuation methodologies, key inputs and significant assumptions.
The carrying amounts of cash, accounts receivable, accounts payable, capital leases and accrued liabilities approximate fair value because of the short maturity of these items. The fair value of the Company’s revolving line of credit and term loan approximates carrying value based on the Company’s current incremental borrowing rate for similar types of borrowing arrangements. The fair value of the Company’s notes payable approximates carrying value due to the short term nature of the arrangement.
Certain assets, including long-lived assets, goodwill and intangible assets are also subject to measurement at fair value on a non-recurring basis if they are deemed to be impaired as a result of an impairment review. For the years ended December 31, 2014 and 2015 and for the six months ended June 30, 2016 (unaudited), no impairments were identified of those assets requiring measurement at fair value on a non-recurring basis.
There were no level 3 financials instruments for the years ended December 31, 2014 and 2015 and for the six months ended June 30, 2016 (unaudited).
Concentrations of Credit and Business Risk
Financial instruments that potentially subject the Company to a concentration of credit risk consist of cash and accounts receivable.
The Company maintains cash balances at several banks. Accounts located in the United States are insured by the Federal Deposit Insurance Corporation, or FDIC, up to $250,000. From time to time, balances may exceed amounts insured by the FDIC. The Company has not experienced any losses in such amounts.
The Company’s accounts receivable are generally unsecured and are derived from revenue earned from customers located in the United States and the United Kingdom and are generally denominated in U.S. dollars or British pounds. Each reporting period, the Company reevaluates each customer’s ability to satisfy credit obligations and maintains an allowance for doubtful accounts based on the evaluations. No single customer comprised more than 10% of the Company’s total revenue for the years ended December 31, 2014 and 2015 and for the six months ended June 30, 2016 (unaudited). No single customer comprised more than 10% of the Company’s accounts receivable balance at December 31, 2014 and 2015 and for the six months ended June 30, 2016 (unaudited).
F-11
Table of Contents
Everbridge, Inc.
Notes to the Consolidated Financial Statements—(Continued)
Cash
The Company considers all highly liquid investments purchased with an original maturity of three months or less to be cash equivalents.
Accounts Receivable
Accounts receivable includes trade accounts receivables from the Company’s customers, net of an allowance for doubtful accounts. Accounts receivable are recorded at the invoiced amount and do not bear interest. Allowance for doubtful accounts is established based on various factors including credit profiles of the Company’s customers, historical payments and current economic trends. The Company reviews its allowance by assessing individual accounts receivable over a specific aging and amount and all other balances are pooled based on historical collection experience. Accounts receivable are written-off on a case by case basis, net of any amounts that may be collected.
Deferred Commissions
The Company capitalizes commission costs earned by sales personnel that are incremental and directly related to the acquisition of customer contracts. Commission costs are accrued and capitalized upon execution of the sales contract by the customer. Payments to sales personnel are made shortly after the receipt of the related customer payment. Commissions are earned based on annual billings and are not earned on multi-year contracts until the annual billing is renewed. Deferred commissions are amortized over the commissionable portion of the contract which is subject to clawback should the customer cancel, which generally can only occur if the Company materially fails to perform under the contract. Amortization of deferred commissions is included in sales and marketing expenses in the accompanying consolidated statements of comprehensive loss. Deferred commissions, net of amortization, are included in other assets in the accompanying consolidated balance sheet.
Deferred Offering Costs
Deferred offering costs consist primarily of direct incremental costs related to the Company’s proposed initial public offering of its common stock. Upon completion of an initial public offering, these amounts will be offset against the proceeds of the offering. If the offering is terminated, the deferred offering costs will be expensed.
Property and Equipment, Net
Property and equipment are stated at cost, less accumulated depreciation. Depreciation is computed using the straight-line method over the estimated useful lives of the assets, which is generally three years for computer software, office computers and system software, five years for system hardware and furniture and equipment, and over the shorter of lease term or useful life of the assets for leasehold improvements. Maintenance and repairs are expensed as incurred. When assets are retired or otherwise disposed of, the cost and related accumulated depreciation are removed from the accounts and any resulting gain or loss is reflected in the Company’s results of operations.
Assets held under capital lease are recorded at the net present value of the minimum lease payments of the leased asset at the inception of the lease. Depreciation expense is computed using the straight-line method over the shorter of the estimated useful lives of the asset or the period of the related lease for leasehold improvements.
Capitalized Software Development Costs
The Company capitalizes the costs of software developed or obtained for internal use in accordance with ASC Topic 350-40, Internal Use Software. Capitalized software development costs consist of costs incurred during the application development stage and include purchased software licenses, implementation costs,
F-12
Table of Contents
Everbridge, Inc.
Notes to the Consolidated Financial Statements—(Continued)
consulting costs, and payroll-related costs for projects that qualify for capitalization. These costs relate to major new functionality. All other costs, primarily related to maintenance and minor software fixes, are expensed as incurred.
The Company amortizes the capitalized software development costs on a straight-line basis over the estimated useful life of the software, which is generally three years, beginning when the asset is substantially ready for use. The amortization of capitalized software development costs is reflected in cost of revenue.
Business Combinations
The results of businesses acquired in a business combination are included in the Company’s consolidated financial statements from the date of acquisition. Purchase accounting results in assets and liabilities of an acquired business being recorded at their estimated fair values on the acquisition date. Any excess consideration over the value of the assets acquired and liabilities assumed is recognized as goodwill.
The Company performs valuations of assets acquired and liabilities assumed on each acquisition accounted for as a business combination, and allocates the purchase price to the tangible and intangible assets acquired and liabilities assumed based on its best estimate of fair value. Acquired intangible assets include: tradenames, customer relationships, and developed technology. The Company determines the appropriate useful life of intangible assets by performing an analysis of cash flows based on historical experience of the acquired businesses. Intangible assets are amortized over their estimated useful lives based on the pattern in which the economic benefits associated with the asset are expected to be consumed, which to date has approximated the straight-line method of amortization. The estimated useful lives for tradenames, customer relationships, and technology are generally, two to seven years, five years, and two to seven years, respectively.
Long Lived Assets
The Company evaluates the recoverability of its long lived assets with finite useful lives for impairment whenever events or changes in circumstances indicate that the carrying amounts may not be recoverable. The Company performs impairment testing at the asset group level that represents the lowest level for which identifiable cash flows are largely independent of the cash flows of other assets and liabilities. If events or changes in circumstances indicate that the carrying amount of an asset group may not be recoverable and the expected undiscounted future cash flows attributable to the asset group are less than the carrying amount of the asset group, an impairment loss equal to the excess of the asset’s carrying value over its fair value is recorded. Fair value is determined based upon estimated discounted future cash flows, if any.
Goodwill
Goodwill represents the excess of the aggregate purchase price paid over the fair value of the net assets acquired in our business combinations. Goodwill is not amortized and is tested for impairment at least annually or whenever events or changes in circumstances indicate that the carrying value may not be recoverable. Events or changes in circumstances that could trigger an impairment review include a significant adverse change in business climate, an adverse action or assessment by a regulator, unanticipated competition, a loss of key personnel, significant changes in the manner of our use of the acquired assets or the strategy for our overall business, significant negative industry or economic trends, or significant underperformance relative to expected historical or projected future results of operations. The Company has the option to first assess qualitative factors to determine whether the existence of events or circumstances leads to a determination that it is more likely than not that the fair value of a reporting unit is less than its carrying value, including goodwill. If, after assessing the totality of events or circumstances, the Company determines that it is not more likely than not that the fair value of a reporting unit is less than its carrying amount, additional impairment testing is not required. However, if the Company concludes otherwise, the Company is required to perform the first step of a two-step impairment test.
F-13
Table of Contents
Everbridge, Inc.
Notes to the Consolidated Financial Statements—(Continued)
Alternatively, the Company may elect to proceed directly to the first step of the two-step impairment test and bypass the qualitative assessment. The first step of the impairment test involves comparing the estimated fair value of a reporting unit with its book value, including goodwill. If the estimated fair value exceeds book value, goodwill is considered not to be impaired and no additional steps are necessary. If, however, the fair value of the reporting unit is less than book value, the carrying amount of the goodwill is compared to its implied fair value. The estimate of implied fair value of goodwill may require valuations of certain internally generated and unrecognized intangible assets. If the carrying amount of goodwill exceeds the implied fair value of that goodwill, an impairment loss is recognized in an amount equal to the excess. The Company tests for goodwill impairment annually on November 30.
The Company performed a qualitative goodwill assessment at November 30, 2015 and concluded there was no impairment based on consideration of a number of factors, including the improvement in the Company’s key operating metrics over the prior year, obtaining valuation analysis in the determination of the fair value of the Company’s common stock in connection with the granting of stock-based compensation awards during 2015, improvement in the strength of the general economy and the Company’s continued execution against its overall strategic objectives. Based on the foregoing, the Company determined that it was not more likely than not that the fair value of its reporting unit is less than its carrying amount and therefore that no further impairment testing was required.
Revenue Recognition
The Company derives substantially all of its revenue from contract subscription fees for use of its applications. The Company recognizes revenues in accordance with ASC 605, and accordingly revenue is recognized when persuasive evidence of an arrangement exists, delivery has occurred, the fee is fixed or determinable, collectability is reasonably assured and acceptance criteria, if any, have been met. If any of these criteria are not met, revenue recognition is deferred until such time that all of the criteria are met. The Company’s subscription arrangements do not provide customers with the right to take possession of the software at any time.
Subscription Revenue
Subscription revenue is recognized ratably over the initial subscription period committed by the customer commencing when the customer’s environment has been created in the Company’s hosted environment. The initial subscription period is typically one to three years and the level of service provided each customer varies based on the level of service required by the complexity of a customer’s business. The level of service also specifies the level of usage by the customer in terms of minutes or data used to transmit the notifications. In the event actual usage exceeds the level purchased, overages are invoiced and are recorded as revenue during the service period. The subscription services are noncancelable, although customers have the right to terminate their contracts if the Company materially fail to perform. The Company generally invoices the Company’s customers in advance in annual installments for the subscription fees, including the set-up fees on the first annual invoice.
Other Revenue
The Company recognizes revenue for set-up fees, which historically have not been material to the Company’s financial statements. The Company has concluded that set-up fees do not meet the criteria for separation from the Company’s primary service as they do not have stand-alone value as the Company has historically not sold set-up fees separately. Since set-up fees are charged for substantially all new applications and services, they are recognized ratably over the contractual period, which approximates the life of the application. The Company also sells professional services, which have been immaterial to date.
F-14
Table of Contents
Everbridge, Inc.
Notes to the Consolidated Financial Statements—(Continued)
Deferred Revenue
Deferred revenue includes amounts collected or billed in excess of recognizable revenue. Such amounts are recognized by the Company over the life of the contract upon meeting the revenue recognition criteria. Deferred revenue that will be recognized during the succeeding 12-month period is recorded as current deferred revenue and the remaining portion is recorded as non-current deferred revenue.
Cost of Revenue
Cost of revenue includes expenses related to the fulfillment of the Company’s subscription services, consisting primarily of employee-related expenses for data center operations and customer support, including salaries, bonuses, benefits and stock-based compensation expense. Cost of revenue also includes hosting costs, messaging costs and depreciation and amortization.
Advertising Expenses
Advertising expenses to promote the Company’s services are expensed as incurred. Advertising expenses included in sales and marketing expense were $0.2 million, $0.3 million and $0.8 million for the years ended December 31, 2013, 2014 and 2015, respectively. Advertising expenses were $0.3 million (unaudited) and $0.5 million (unaudited) for the six months ended June 30, 2015 and 2016, respectively.
Research and Development
Research and development expenses primarily consist of employee-related costs for research and development staff, including salaries, bonuses, benefits and stock-based compensation and the cost of certain third-party service providers related to the development of the Company’s solutions that do not meet the criteria to be capitalized under ASC Topic 350-40, Internal Use Software.
Stock-Based Compensation
Stock-based compensation expense is comprised of stock options, which are issued under the Company’s 2008 equity incentive plan, and restricted stock awards, or RSAs.
Stock-based compensation related to stock options and RSAs is measured at the grant date based on the fair value of the award and is recognized straight-line as expense, net of estimated forfeitures, over the requisite service period, which is generally the vesting period of the respective award. The Company utilizes the Black-Scholes pricing model for determining the estimated fair value of the stock options and RSAs. The Black-Scholes pricing model requires the use of subjective assumptions including the option’s expected term, the volatility of the underlying stock, the fair value of the stock and the expected forfeiture rate.
Income Taxes
The Company accounts for income taxes using the asset and liability method of accounting for income taxes in which deferred tax assets and liabilities are recognized for the future tax consequences attributable to differences between the financial statement carrying amounts of existing assets and liabilities and their respective tax bases. Deferred tax assets and liabilities are measured using enacted tax rates expected to apply to taxable income in the years in which those temporary differences are expected to be recovered or settled. The effect on deferred tax assets and liabilities of a change in tax rates is recognized as income in the period that includes the enactment date. A valuation allowance is established if it is more likely than not that all or a portion of the deferred tax asset will not be realized.
F-15
Table of Contents
Everbridge, Inc.
Notes to the Consolidated Financial Statements—(Continued)
The calculation of the Company’s tax liabilities involves dealing with uncertainties of the application of complex tax regulations. The Company recognizes liabilities for uncertain tax positions based on a two-step approach. The first step is to evaluate the tax position for recognition by determining if the weight of available evidence indicates it is more likely than not, that the position will be sustained on audit, including resolution of related appeals or litigation processes, if any. The second step is to measure the tax benefit as the largest amount, which is more than 50% likely of being realized upon ultimate settlement. The Company considers many factors when evaluating and estimating its tax positions and tax benefits, which may require periodic adjustments.
Foreign Currency Translation
The functional currency for the Company’s foreign subsidiaries is the local currency. For those subsidiaries, the assets and liabilities are translated into U.S. dollars at the exchange rate method at the balance sheet date. Income and expenses are translated at the average exchange rates for the period. Foreign currency exchange gain and losses are recorded in other expenses.
Other Comprehensive Income (Loss)
For all periods presented, the Company’s other comprehensive income (loss) is comprised of foreign currency translation adjustments related to the Company’s foreign subsidiaries.
Net Loss and Pro Forma Net Loss Per Share Attributable to Common Stockholders
The Company applies the two-class method in calculating the net loss per share amounts which requires net loss to be allocated between the common and convertible preferred stockholders based on their respective right to receive dividends. Accordingly, the Company’s basic net loss per share attributable to common stockholders is calculated by dividing the net loss attributable to common stockholders by the weighted-average number of shares of common stock outstanding during the period. Net loss attributable to common stockholders is equal to the Company’s net loss.
Diluted loss per share attributable to common stockholders adjusts the basic weighted-average number of shares of common stock outstanding for the potential dilution that could occur if stock options, warrants, and convertible preferred stock were exercised or converted into common stock.
Pro forma basic and diluted net loss per share attributable to common stockholders represents net loss divided by the pro forma weighted-average shares outstanding as though the conversion of our preferred stock into common stock occurred on the original issuance date of the preferred stock.
(3) Accounts Receivable, Net
Accounts receivable, net, is as follows:
| As of December 31, | ||||||||||||
| 2014 | 2015 | As of June 30, 2016 |
||||||||||
| (in thousands) |
(unaudited) | |||||||||||
| Accounts receivable |
$ | 11,534 | $ | 16,080 | $ | 17,635 | ||||||
| Allowance for doubtful accounts |
(282 | ) | (381 | ) | (422 | ) | ||||||
|
|
|
|
|
|
|
|||||||
| Net accounts receivable |
$ | 11,252 | $ | 15,699 | $ | 17,213 | ||||||
|
|
|
|
|
|
|
|||||||
Bad debt expense for the years ended December 31, 2013, 2014 and 2015 and for the six months ended June 30, 2015 and 2016 was $0.1 million, $0.2 million, $0.4 million, $0.1 million (unaudited) and $0.1 million (unaudited), respectively.
F-16
Table of Contents
Everbridge, Inc.
Notes to the Consolidated Financial Statements—(Continued)
The following table summarizes the changes in the allowance for doubtful accounts:
| As of December 31, | ||||||||||||
| 2014 | 2015 | As of June 30, 2016 |
||||||||||
| (in thousands) |
(unaudited) | |||||||||||
| Allowance, at beginning of period |
$ | (100 | ) | $ | (282 | ) | $ | (381 | ) | |||
| Charged to bad debt expense |
(206 | ) | (366 | ) | (87 | ) | ||||||
| Write-offs, net of recoveries |
24 | 267 | 46 | |||||||||
|
|
|
|
|
|
|
|||||||
| Allowance, at end of period |
$ | (282 | ) | (381 | ) | $ | (422 | ) | ||||
|
|
|
|
|
|
|
|||||||
(4) Property and Equipment
Property and equipment consists of the following at December 31, 2014 and 2015 and June 30, 2016:
| Useful life in years |
As of December 31, | |||||||||||||||
| 2014 | 2015 | As of June 30, 2016 |
||||||||||||||
| (in thousands) | (unaudited) | |||||||||||||||
| Furniture and equipment |
5 | $ | 542 | $ | 822 | $ | 721 | |||||||||
| System hardware |
5 | 5,644 | 6,495 | 3,272 | ||||||||||||
| Office computers |
3 | 1,344 | 2,003 | 1,613 | ||||||||||||
| Computer and system software |
3 | 755 | 1,341 | 1,263 | ||||||||||||
|
|
|
|
|
|
|
|||||||||||
| 8,285 | 10,661 | 6,869 | ||||||||||||||
| Less accumulated depreciation and amortization |
(5,630 | ) | (7,041 | ) | (3,745 | ) | ||||||||||
|
|
|
|
|
|
|
|||||||||||
| Property and equipment, net |
$ | 2,655 | $ | 3,620 | $ | 3,124 | ||||||||||
|
|
|
|
|
|
|
|||||||||||
Depreciation and amortization expense for the years ended December 31, 2013, 2014 and 2015 was $1.0 million, $0.7 million and $1.4 million, respectively. Depreciation and amortization expense was $0.6 million (unaudited) and $0.8 million (unaudited) for the six months ended June 30, 2015 and 2016, respectively.
F-17
Table of Contents
Everbridge, Inc.
Notes to the Consolidated Financial Statements—(Continued)
(5) Business Combinations
The following table summarizes the allocation of the purchase consideration and the estimated fair value of the assets acquired and the liabilities assumed for business acquisitions made by the Company during the year ended December 31, 2014 (in thousands):
| Assets acquired |
Vocal | Nixle | ||||||
| Cash |
$ | 4,732 | $ | — | ||||
| Accounts receivable |
1,246 | 633 | ||||||
| Other assets |
126 | 17 | ||||||
| Property and equipment |
69 | 10 | ||||||
| Tradenames |
162 | 420 | ||||||
| Acquired technology |
551 | 500 | ||||||
| Customer relationships |
4,021 | 920 | ||||||
| Goodwill |
2,086 | 3,300 | ||||||
|
|
|
|
|
|||||
| Total assets acquired |
$ | 12,993 | $ | 5,800 | ||||
|
|
|
|
|
|||||
| Liabilities assumed |
||||||||
| Accounts payable and accrued expenses |
446 | — | ||||||
| Deferred revenue |
2,019 | 1,238 | ||||||
| Deferred taxes |
1,097 | — | ||||||
| Other liabilities |
338 | 33 | ||||||
|
|
|
|
|
|||||
| Net assets acquired |
$ | 9,093 | $ | 4,529 | ||||
|
|
|
|
|
|||||
| Consideration paid |
||||||||
| Cash paid |
2,030 | 1,500 | ||||||
| Issuance of notes payable |
4,315 | — | ||||||
| Common stock issued |
2,748 | 3,029 | ||||||
|
|
|
|
|
|||||
| Total |
$ | 9,093 | $ | 4,529 | ||||
|
|
|
|
|
|||||
The weighted average useful life of all identified acquired intangible assets is 4.65 years. The weighted average useful lives for acquired technologies, customer relationships and tradenames are 2.28 years 5.0 years, and 5.55 years, respectively. Identifiable intangible assets with definite lives are amortized over the period of estimated benefit using the straight-line method and the estimated useful lives of two to seven years. The straight-line method of amortization represents the Company’s best estimate of the distribution of the economic value of the identifiable intangible assets.
Vocal
On March 13, 2014, the Company acquired Vocal Ltd., or Vocal, in exchange for cash consideration of $2.0 million, notes payable of $4.3 million and 2,252,451 shares of the Company’s common stock valued at $1.22 per share. The shares of common stock were valued based on the Company’s stock price on the acquisition date. At December 31, 2014 and 2015, notes payable in the amount of $2.4 million and $0.5 million, respectively, remained on the Company’s financial statements as a result of the acquisition. The notes are owed to the former owner of Vocal and accrue interest at a rate of 2.5%. Vocal is a provider of emergency notification services to both public and private organizations. This mass notification application helps organizations communicate, plan and manage their responses to any business affecting situation or day-to-day communication requirement. The Company acquired Vocal for its customer base and to expand its current operations in the United Kingdom and Europe.
F-18
Table of Contents
Everbridge, Inc.
Notes to the Consolidated Financial Statements—(Continued)
Nixle
On December 23, 2014, the Company acquired the assets of Nixle, LLC, or Nixle, in exchange for cash consideration of $1.5 million and 1,858,275 shares of the Company’s common stock valued at $1.63 per share. At the date of acquisition, $0.5 million and 1,858,275 shares were put in an escrow account to adjust the purchase price based on Nixle meeting certain financial target thresholds as of December 31, 2014. In addition, Nixle was required to meet certain accounts receivable collections thresholds at March 31, 2015. At the date of the acquisition, the Company assessed the probabilities of Nixle meeting the future sales and collections thresholds and determined them not to be probable. Therefore, no contingent consideration was recorded as part of the purchase price allocation and the final consideration for the acquisition was determined to be $1.5 million in cash and 1,858,275 shares of the Company’s common stock based on the Company’s fair value common stock price of $1.63 per share on the acquisition date. The financial target thresholds were deemed not to be met as of December 31, 2014. The Nixle application offers free and paid notification services for local police departments, county emergency management offices, municipal governments and their agencies and allows government agencies to send notification messages to local residents via phone, email and the web. The Company acquired Nixle for its customer base and to expand its current operations in the local and state agencies market along with complimenting some of the existing facets of its business.
As a result of the acquisitions, the Company recorded $2.1 million and $3.3 million of goodwill for the acquisitions of Vocal and Nixle, respectively. Goodwill recorded in connection with the acquisitions is primarily attributable to the synergies expected to benefit the Company’s existing customer base and expand domestically and internationally. The Company believes that the factors listed above in relation to the purchase of the two companies support the amount of goodwill recorded as a result of the purchase price paid for the two acquisitions, in relation to other acquired tangible and intangible assets. The resulting goodwill from the Nixle acquisition is deductible for income tax purposes, however the goodwill attributed to the Vocal acquisition is not deductible for income tax purposes.
For the year ended December 31, 2014, the Company incurred transaction costs of $0.5 million in connection with the above acquisitions which were expensed as incurred and included in general and administrative expenses within the accompanying consolidated statements of comprehensive loss.
Unaudited Pro Forma Financial Information
The following table reflects the unaudited pro forma consolidated revenue and net loss for the year ended December 31, 2014 as if the acquisitions of Vocal and Nixle had taken place on January 1, 2014, after giving effect to certain adjustments including the amortization of acquired intangible assets and the associated tax effect and the elimination of the Company’s and the acquiree’s non-recurring acquisition related expenses:
| Year Ended | ||
| (in thousands) | ||
| Revenues |
$45,142 | |
| Net loss |
$4,810 |
Revenue attributable to the acquisitions for the period from the acquisition dates to December 31, 2014 was $3.2 million. Revenue and net income attributable solely to Vocal from the acquisition date to December 31, 2014 were $3.2 million and $0.5 million, respectively. Revenue and net loss attributed to Nixle from the acquisition date to December 31, 2014 were $45,000 and $69,000, respectively. The unaudited pro forma information presented does not purport to be indicative of the results that would have been achieved had the acquisitions been consummated at January 1, 2014 nor of the results which may occur in the future. The pro forma adjustments are based upon available information and certain assumptions that the Company believes are reasonable.
F-19
Table of Contents
Everbridge, Inc.
Notes to the Consolidated Financial Statements—(Continued)
No acquisitions were consummated during the year ended December 31, 2015 and the six months ended June 30, 2016 (unaudited).
(6) Capitalized Software Development Costs
Capitalized software development costs consisted of the following at December 31, 2014 and 2015 and at June 30, 2016 (unaudited):
| As of December 31, 2014 | ||||||||||||||||
| Gross carrying amount |
Amortization period |
Accumulated amortization |
Net carrying amount |
|||||||||||||
| (dollar amounts in thousands) | ||||||||||||||||
| Capitalized software development costs |
$ | 20,251 | 3 years | $ | (13,912 | ) | $ | 6,339 | ||||||||
|
|
|
|
|
|
|
|||||||||||
| Total capitalized software development costs |
$ | 20,251 | $ | (13,912 | ) | $ | 6,339 | |||||||||
|
|
|
|
|
|
|
|||||||||||
| As of December 31, 2015 | ||||||||||||||||
| Gross carrying amount |
Amortization period |
Accumulated amortization |
Net carrying amount |
|||||||||||||
| (dollar amounts in thousands) | ||||||||||||||||
| Capitalized software development costs |
$ | 25,119 | 3 years | $ | (16,941 | ) | $ | 8,178 | ||||||||
|
|
|
|
|
|
|
|||||||||||
| Total capitalized software development costs |
$ | 25,119 | $ | (16,941 | ) | $ | 8,178 | |||||||||
|
|
|
|
|
|
|
|||||||||||
| As of June 30, 2016 | ||||||||||||||||
| (unaudited) | ||||||||||||||||
| Gross carrying amount |
Amortization period |
Accumulated amortization |
Net carrying amount |
|||||||||||||
| (dollar amounts in thousands) | ||||||||||||||||
| Capitalized software development costs |
$ | 28,187 | 3 years | $ | (19,207 | ) | $ | 8,980 | ||||||||
|
|
|
|
|
|
|
|||||||||||
| Total capitalized software development costs |
$ | 28,187 | $ | (19,207 | ) | $ | 8,980 | |||||||||
|
|
|
|
|
|
|
|||||||||||
The Company capitalized software development costs of $1.7 million, $4.9 million and $3.1 million (unaudited) during the years ended December 31, 2014 and 2015 and the six months ended June 30, 2016, respectively.
In December 2014, the Company acquired technology through an asset acquisition of Tapestry Telemed LLC or “HipaaBridge”. The Company acquired the HipaaBridge technology in order to develop an application that provides secure messaging within health care organizations in a manner intended to comply with the requirements of the federal Health Insurance Portability and Accountability Act, or HIPAA. The Company capitalized $4.1 million into capitalized software development costs consisting of the consideration paid for the asset acquisition and related transaction costs.
The total amortization expense related to capitalized software development costs for the years ended December 31, 2013, 2014 and 2015 was $1.4 million, $0.8 million and $3.0 million, respectively. Amortization
F-20
Table of Contents
Everbridge, Inc.
Notes to the Consolidated Financial Statements—(Continued)
was $1.1 million (unaudited) and $2.3 million (unaudited) for the six months ended June 30, 2015 and 2016, respectively. Amortization of capitalized software development costs is classified within cost of revenue in the consolidated statements of comprehensive loss.
In January 2012, with the planned introduction of new technology, the Company decided to revise the remaining estimated useful life of a capitalized software license associated with an older technology to two years. The portion of the system development and software license costs related to the older technology was fully depreciated by the end of fiscal year 2013. As a result, an additional $0.3 million of amortization expense was recognized in 2013 pertaining to the accelerated depreciation.
The expected amortization, as of December 31, 2015, for each of the next three years is as follows:
| Year ending December 31: |
| |||
| (in thousands) | ||||
| 2016 |
$ | 4,579 | ||
| 2017 |
2,733 | |||
| 2018 |
866 | |||
|
|
|
|||
| $ | 8,178 | |||
|
|
|
|||
F-21
Table of Contents
Everbridge, Inc.
Notes to the Consolidated Financial Statements—(Continued)
| (7) | Intangible Assets |
Intangible assets consisted of the following finite lived intangible assets at December 31, 2014 and 2015 and June 30, 2016:
| As of December 31, 2014 | ||||||||||||||||
| Gross carrying amount |
Amortization period |
Accumulated amortization |
Net carrying amount |
|||||||||||||
| (dollar amounts in thousands) | ||||||||||||||||
| Amortizable intangible assets: |
||||||||||||||||
| Developed technology |
$ | 1,211 | 2-7 years | $ | (297 | ) | $ | 914 | ||||||||
| Tradenames |
582 | 2-7 years | (74 | ) | 508 | |||||||||||
| Customer relationships |
4,941 | 5 years | (640 | ) | 4,301 | |||||||||||
|
|
|
|
|
|
|
|||||||||||
| Total intangible assets |
$ | 6,734 | $ | (1,011 | ) | $ | 5,723 | |||||||||
|
|
|
|
|
|
|
|||||||||||
| As of December 31, 2015 | ||||||||||||||||
| Gross carrying amount |
Amortization period |
Accumulated amortization |
Net carrying amount |
|||||||||||||
| (dollar amounts in thousands) | ||||||||||||||||
| Amortizable intangible assets: |
||||||||||||||||
| Developed technology |
$ | 1,211 | 2-7 years | $ | (763 | ) | $ | 448 | ||||||||
| Tradenames |
582 | 2-7 years | (223 | ) | 359 | |||||||||||
| Customer relationships |
4,941 | 5 years | (1,629 | ) | 3,312 | |||||||||||
|
|
|
|
|
|
|
|||||||||||
| Total intangible assets |
$ | 6,734 | $ | (2,615 | ) | $ | 4,119 | |||||||||
|
|
|
|
|
|
|
|||||||||||
| As of June 30, 2016 | ||||||||||||||||
| (unaudited) | ||||||||||||||||
| Gross carrying amount |
Amortization period |
Accumulated amortization |
Net carrying amount |
|||||||||||||
| (dollar amounts in thousands) | ||||||||||||||||
| Amortizable intangible assets: |
||||||||||||||||
| Developed technology |
$ | 1,115 | 2-7 years | $ | (819 | ) | $ | 296 | ||||||||
| Tradenames |
554 | 2-7 years | (225 | ) | 329 | |||||||||||
| Customer relationships |
4,241 | 5 years | (1,802 | ) | 2,439 | |||||||||||
|
|
|
|
|
|
|
|||||||||||
| Total intangible assets |
$ | 5,910 | $ | (2,846 | ) | $ | 3,064 | |||||||||
|
|
|
|
|
|
|
|||||||||||
Total amortization expense for the years ended December 31, 2013, 2014 and 2015 was $23,000, $1.0 million and $1.5 million, respectively. Total amortization expense for the six months ended June 30, 2015 and 2016 was $0.8 million (unaudited) and $0.6 million (unaudited), respectively. Amortization expense of tradenames and customer relationships is included within general and administrative expenses, while amortization of developed technology is included in cost of revenue. The Company recorded amortization expense attributed to developed technology of $23,000, $0.2 million and $0.4 million for the period ended December 31, 2013, 2014 and 2015, respectively. The Company recorded amortization expense attributed to developed technology of $0.2 million (unaudited) and $0.1 million (unaudited) for the six months ended June 30, 2015 and 2016, respectively.
F-22
Table of Contents
Everbridge, Inc.
Notes to the Consolidated Financial Statements—(Continued)
The expected amortization of the intangible assets, as of December 31, 2015, for each of the next five years and thereafter is as follows:
| Year ending December 31: | (in thousands) | |||
| 2016 |
$ | 1,295 | ||
| 2017 |
1,234 | |||
| 2018 |
1,063 | |||
| 2019 |
408 | |||
| 2020 |
60 | |||
| Thereafter |
59 | |||
|
|
|
|||
| $ | 4,119 | |||
|
|
|
|||
(8) Income Taxes
The components of loss before income taxes are as follows:
| Year Ended December 31, | ||||||||||||
| 2013 | 2014 | 2015 | ||||||||||
| (in thousands) | ||||||||||||
| Domestic |
$ | (671 | ) | $ | 395 | $ | (8,016 | ) | ||||
| Foreign |
(100 | ) | (1,107 | ) | (3,370 | ) | ||||||
|
|
|
|
|
|
|
|||||||
| Total |
$ | (771 | ) | $ | (712 | ) | $ | (11,386 | ) | |||
|
|
|
|
|
|
|
|||||||
For purposes of the reconciling the Company’s provision for income taxes at the statutory rate and the Company’s provision (benefit) for income taxes at the effective tax rate, a notional 34% tax rate was applied as follows:
| Year Ended December 31, | ||||||||||||
| 2013 | 2014 | 2015 | ||||||||||
| (in thousands) | ||||||||||||
| Income tax (benefit) at federal statutory rate |
$ | (262 | ) | $ | (242 | ) | $ | (3,871 | ) | |||
| Increase/(decrease) in tax resulting from: |
||||||||||||
| State income tax expense, net of federal |
— | 9 | (103 | ) | ||||||||
| Nondeductible permanent items |
86 | 123 | 567 | |||||||||
| Foreign rate differential |
— | 228 | 474 | |||||||||
| State rate change |
24 | 9 | (74 | ) | ||||||||
| Adjustment to deferred taxes |
(74 | ) | (2 | ) | (525 | ) | ||||||
| Change in valuation allowance |
259 | (248 | ) | 2,921 | ||||||||
| Uncertain tax positions |
72 | 12 | 50 | |||||||||
| Other |
13 | 22 | (1 | ) | ||||||||
|
|
|
|
|
|
|
|||||||
| Total |
$ | 118 | $ | (89 | ) | $ | (562 | ) | ||||
|
|
|
|
|
|
|
|||||||
The difference between the statutory federal income tax rate and the Company’s effective tax rate in 2013, 2014 and 2015 is primarily attributable to the effect of state income taxes, difference between the U.S. and foreign tax
rates, deferred tax state rate adjustment, share-based compensation and other non-deductible permanent items, and the change in valuation allowance. The Company’s China and U.K. subsidiaries were subject to 25% and 20% applicable statutory income tax rates, respectively, for the periods presented.
F-23
Table of Contents
Everbridge, Inc.
Notes to the Consolidated Financial Statements—(Continued)
In determining quarterly provisions for income taxes, the Company uses the annual estimated effective tax rate applied to the actual year-to-date loss. The Company’s annual estimated effective tax rate differs from the statutory rate primarily as a result of state taxes, tax amortization of goodwill and difference between the U.S. and foreign tax rates. For the six months ended June 30, 2015 and 2016, the Company recorded income tax benefit of $0.2 million (unaudited) and $0.1 million (unaudited), respectively.
The provision for (benefit from) income taxes is as follows:
| Year Ended December 31, | ||||||||||||
| 2013 | 2014 | 2015 | ||||||||||
| (in thousands) |
||||||||||||
| Current: |
||||||||||||
| Federal |
$ | 20 | $ | 16 | $ | (14 | ) | |||||
| State |
26 | 24 | 4 | |||||||||
| Foreign |
72 | 191 | (101 | ) | ||||||||
|
|
|
|
|
|
|
|||||||
| 118 | 231 | (111 | ) | |||||||||
|
|
|
|
|
|
|
|||||||
| Deferred: |
||||||||||||
| Federal |
(301 | ) | 255 | (2,536 | ) | |||||||
| State |
42 | (1 | ) | (315 | ) | |||||||
| Foreign |
— | (326 | ) | (521 | ) | |||||||
|
|
|
|
|
|
|
|||||||
| (259 | ) | (72 | ) | (3,372 | ) | |||||||
|
|
|
|
|
|
|
|||||||
| Change in valuation allowance |
259 | (248 | ) | 2,921 | ||||||||
|
|
|
|
|
|
|
|||||||
| Total |
$ | 118 | $ | (89 | ) | $ | (562 | ) | ||||
|
|
|
|
|
|
|
|||||||
The net deferred tax assets (liabilities) at December 31, 2014 and 2015 are comprised of the following:
| As of December 31, |
||||||||
| 2014 | 2015 | |||||||
| (in thousands) | ||||||||
| Deferred rent |
$ | 66 | $ | 110 | ||||
| AMT credit |
64 | 50 | ||||||
| Accrued expenses |
1,112 | 1,341 | ||||||
| Deferred revenue |
328 | 359 | ||||||
| Net operating loss carryforward |
12,835 | 15,737 | ||||||
| Other assets |
121 | 411 | ||||||
| Intangible assets |
(1,312 | ) | (1,524 | ) | ||||
| Property and equipment |
(380 | ) | (282 | ) | ||||
| Other liabilities |
— | (16 | ) | |||||
| Valuation allowance |
(13,610 | ) | (16,531 | ) | ||||
|
|
|
|
|
|||||
| Total non-current deferred income tax liabilities |
$ | (776 | ) | $ | (345 | ) | ||
|
|
|
|
|
|||||
In November 2015, the FASB issued ASU 2015-17, Balance Sheet Classification of Deferred Taxes, requiring all deferred tax assets and liabilities, and any related valuation allowance, to be classified as non-current on the balance sheet. The Company elected to retrospectively adopt the accounting standard in the fourth quarter of 2015.
F-24
Table of Contents
Everbridge, Inc.
Notes to the Consolidated Financial Statements—(Continued)
Management assesses the available positive and negative evidence to estimate if sufficient future taxable income will be generated to use the existing deferred tax assets. A significant piece of objective negative evidence evaluated was the cumulative loss incurred over the three-year period ended December 31, 2015. Such objective evidence limits the ability to consider other subjective evidence such as its projections for future growth. On the basis of this evaluation, at December 31, 2014 and 2015, a valuation allowance of $13.6 million and $16.5 million, respectively, has been recorded since it is more likely than not that the deferred tax assets will not be realized.
At December 31, 2014, the Company has federal and state net operating loss carryforwards of $32.2 million and $33.1 million, respectively. At December 31, 2015, the Company has federal and state net operating loss carryforwards of $39.2 million and $36.6 million, respectively, which expire in varying amounts through 2032. Section 382 of the Internal Revenue Service, or IRS, Code, or Section 382, imposes limitations on a corporation’s ability to utilize its Net Operating Losses, or NOLs, if it experiences an “ownership change.” In general terms, an ownership change may result from transactions increasing the ownership percentage of certain stockholders in the stock of the corporation by more than 50% over a three year period. In the event of an ownership change, utilization of the NOLs would be subject to an annual limitation under Section 382 determined by multiplying the value of the Company’s stock at the time of the ownership change by the applicable long-term tax exempt rate. The Company has not completed a Section 382 study at this time; however should a study be completed certain NOLs may be subject to such limitations. Any future annual limitation may result in the expiration of NOLs before utilization.
For the period ended December 31, 2013, 2014 and 2015, the Company has recorded $72,000, $12,000 and $50,000 related to uncertain tax positions. For the six months ended June 30, 2015 and 2016, the Company recorded $0 (unaudited) and $0.1 million (unaudited) related to uncertain tax positions. The Company’s policy is to recognize interest and penalties related to uncertain tax positions, if any, in the income tax provision. At December 31, 2014 and 2015 and June 30, 2016, the Company had $0, $0 and $5,000 (unaudited) in accrued interest and penalties related to uncertain tax positions.
The Company is subject to taxation in the United States and various states along with other foreign countries. Due to the presence of net operating loss carryforwards, all of the income tax years remain open for examination by the IRS and various state and foreign taxing authorities. The Company has not been notified that it is under audit by the IRS for any of the tax years currently open. The Company is not currently under audit from any state taxing authorities.
The following changes occurred in the amount of unrecognized tax benefits during the years ended December 31, 2013, 2014, and 2015:
| Year Ended December 31, | ||||||||||||
| 2013 | 2014 | 2015 | ||||||||||
| (in thousands) | ||||||||||||
| Beginning balance of unrecognized tax benefits |
$ | 33 | $ | 105 | $ | 117 | ||||||
| Additions for current year tax positions |
72 | 12 | 50 | |||||||||
|
|
|
|
|
|
|
|||||||
| Ending balance of unrecognized tax benefits (excluding interest and penalties) |
$ | 105 | $ | 117 | $ | 167 | ||||||
| Interest and penalties associated with unrecognized tax benefits |
— | — | — | |||||||||
|
|
|
|
|
|
|
|||||||
| Ending balance of unrecognized tax benefits (including interest and penalties) |
$ | 105 | $ | 117 | $ | 167 | ||||||
|
|
|
|
|
|
|
|||||||
The amount of income taxes the Company pays is subject to ongoing audits by taxing jurisdictions around the world. The Company’s estimate of the potential outcome of any uncertain tax position is subject to management’s assessment of relevant risks, facts, and circumstances existing at that time. The Company believes that it has adequately provided for these matters. However, the Company’s future results may include favorable
F-25
Table of Contents
Everbridge, Inc.
Notes to the Consolidated Financial Statements—(Continued)
or unfavorable adjustments to its estimates in the period the audits are resolved, which may impact the Company’s effective tax rate. The Company does not believe that it is reasonably possible that the total amount of unrecognized tax benefits will significantly increase or decrease in the next 12 months. As of December 31, 2015, the Company’s tax filings are generally subject to examination in major tax jurisdictions for years ending on or after December 31, 2013.
Deferred income taxes have not been provided for undistributed earnings of the Company’s consolidated foreign subsidiaries because of the Company’s intent to reinvest such earnings indefinitely in active foreign operations. At December 31, 2015, the Company had $0.1 million in unremitted earnings that were permanently reinvested related to its consolidated foreign subsidiaries.
(9) Debt
At December 31, 2014, the Company had a $7.0 million line of credit with Silicon Valley Bank against the Company’s accounts receivable, bearing an interest rate of prime plus 1.75% per annum if the “Adjusted Quick Ratio” is at least 1.00 at all times during each of the preceding three calendar months and prime plus 2% per annum otherwise. “Adjusted Quick Ratio” is defined as the ratio of unrestricted cash plus net trade accounts receivable to current liabilities minus deferred revenue. The Company could borrow a maximum of the lesser of $5.0 million or 80% of the eligible account receivable balance.
The line of credit required the Company to comply with certain financial and nonfinancial covenants that restrict the Company’s ability to, among other things, (1) incur additional indebtedness; (2) incur liens; (3) pay dividends or repurchase its convertible preferred stock; (4) merge or consolidate with another entity; or (5) sell, transfer, assign, lease or otherwise dispose of all or substantially all of the Company’s assets. Failure to comply with these covenants would have required all or a portion of the loans to become immediately payable. The line of credit had a first priority lien over the Company’s accounts receivable. As of December 31, 2014 the Company was in compliance with the financial covenants under the agreement.
At December 31, 2014 and 2015, $3.0 million and $0, respectively, was outstanding under the line of credit. The line of credit was set to mature on April 30, 2015 and was subsequently extended to July 17, 2015. In July 2015, the Company paid off its line of credit with Silicon Valley Bank.
Interest cost incurred and charged to expense related to the line of credit was $0.2 million and $0.1 million for the years ended December 31, 2014 and 2015, respectively.
In June 2015, the Company entered into a loan and security agreement with Western Alliance Bank (formerly known as Bridge Bank) to provide a secured revolving line of credit that allows the Company to borrow up to $10.0 million for working capital and general business requirements. In February 2016, the Company entered into an amendment of its loan and security agreement with Western Alliance Bank to increase the capacity of its revolving line of credit by $5.0 million. Amounts outstanding under the line of credit bear interest at the prime rate plus 0.75% with accrued interest payable on a monthly basis and outstanding and unpaid principal due upon maturity of the credit facility in June 2018. At December 31, 2015 and June 30, 2016, $10.0 million and $10.5 million (unaudited), respectively, was outstanding under the line of credit. There was no unused borrowing availability and $4.5 million (unaudited) under the line of credit at December 31, 2015 and June 30, 2016, respectively.
In addition to the revolving line of credit, the loan and security agreement also provides for a $5.0 million growth capital term loan. The term loan bears interest at a floating per annum rate equal to the prime rate plus 1.75%. Interest on the term loan was payable monthly in arrears for the first 12 months. Thereafter, the term loan will be payable in thirty-six equal monthly installments of principal, plus all accrued interest, beginning on June 30, 2016. The term loan may be prepaid at the Company’s option, subject to a prepayment fee equal to 2% of the
F-26
Table of Contents
Everbridge, Inc.
Notes to the Consolidated Financial Statements—(Continued)
principal amount being repaid if such prepayment occurs on or prior to the first anniversary of the closing date. The loan maturity date is June 30, 2019.
Western Alliance Bank maintains a security interest in substantially all of the Company’s tangible and intangible assets, excluding intellectual property, to secure any outstanding amounts under the loan and security agreement. The loan and security agreement contains customary events of default, conditions to borrowing and covenants, including restrictions on the Company’s ability to dispose of assets, make acquisitions, incur debt, incur liens and make distributions and dividends to stockholders. The loan and security agreement also includes a financial covenant related to the Company’s recurring revenue renewal rate. During the continuance of an event of default, Western Alliance Bank may accelerate amounts outstanding, terminate the credit facility and foreclose on the collateral.
As of December 31, 2015 and June 30, 2016, $5.0 million was outstanding under the growth capital term loan, and the Company was in compliance with all covenants in the loan and security agreement.
Interest cost incurred and charged to expense related to the term loan and line of credit was $0.1 million and $0.1 million, respectively, for the year ended December 31, 2015. Interest cost incurred and charged to expense related to the term loan and line of credit were $0.1 million (unaudited) and $0.2 million (unaudited), respectively, for the six months ended June 30, 2015 and 2016.
In February 2016, the Company entered into an amendment of its loan and security agreement with Western Alliance Bank to (1) increase the capacity of its revolving line of credit by $5.0 million to $15.0 million and (2) set the minimum prime rate based on which interest due is calculated at 3.25%. No other changes were made to the loan and security agreement. The loan and security agreement, as amended, allows the Company to borrow up to $15.0 million for working capital and general business requirements.
The Company adopted ASU 2015-03 in the first quarter of 2016 and reclassified $48,000 of deferred financing costs, net, resulting in a deduction from the carrying value of the Company’s long term line of credit and term loan, respectively, within its December 31, 2015 consolidated balance sheet. See note 2, “Summary of Significant Accounting Policies,” for further information.
Future maturities of debt are as follows (in thousands):
| Year ending December 31, |
| |||
| 2016 |
$ | 833 | ||
| 2017 |
1,667 | |||
| 2018 |
|
11,667 |
| |
| 2019 |
833 | |||
|
|
|
|||
| $ | 15,000 | |||
|
|
|
|||
(10) Notes Payable
In March 2014, the Company issued two seller notes payable in connection with the acquisition of Vocal. The notes had an aggregate principal amount of $2.7 million, scheduled to mature on September 13, 2015 in the amount of $2.1 million and December 31, 2015 in the amount of $0.6 million. Both notes have a stated interest rate of 2.5%. The notes were recorded at their estimated fair value of $2.5 million at the issuance date, and imputed interest will be accreted to non-cash interest expense to the maturity date, using a 5.25% interest rate. At December 31, 2015, the carrying value of the notes was $0.5 million. The former owner of Vocal was retained as an employee of the Company; however, the former owner’s employment ended in 2015. The final note payable was repaid in January 2016.
In December 2014, the Company issued a note payable to the seller in connection with the acquired technology of HipaaBridge. The note has an aggregate principal amount of $1.5 million, scheduled to mature on December 15, 2015, and has no stated interest rate. The note was recorded at its estimated fair value of
F-27
Table of Contents
Everbridge, Inc.
Notes to the Consolidated Financial Statements—(Continued)
$1.4 million at the acquisition date, and imputed interest will be accreted to non-cash interest expense to the maturity date, using a 5.25% interest rate. At December 31, 2015, the carrying value of the note was $1.5 million. The former majority owner of HipaaBridge was retained as an employee of the Company. The note was paid in full in January 2016.
Interest cost incurred and charged to expense related to the notes payable was $0.1 million, $0.2 million, $0.1 million (unaudited) and $0 (unaudited) for the years ended December 31, 2014 and 2015 and the six months ended June 30, 2015 and 2016, respectively.
(11) Stockholders’ Deficit
Preferred Stock
At December 31, 2014 and 2015, there are 17,992,237 shares of Series A convertible preferred stock, or Series A, and 30,048,859 shares of Series A-1 convertible preferred stock, or Series A-1, issued and outstanding.
The rights, preferences, and privileges of the Series A and Series A-1 are as follows:
Dividend Provisions—Holders of the Series A and Series A-1 are entitled to receive, prior and in preference to holders of the Company’s common stock and the Company’s Class A common stock, or Class A, cumulative dividends from the respective dates of issuance that accrue at a rate of 8% per annum payable only if and when declared by the Company’s board of directors or upon the liquidation, sale or change in control of the Company.
At December 31, 2014 and 2015, the amount of undeclared cumulative dividends totaled $8.0 million and $9.6 million, respectively.
Liquidation Preference. If the Company is liquidated, dissolved or wound up, or if all or substantially all of the Company’s assets are acquired or if the Company undergo a change in control, the holders of the Series A and Series A-1 then outstanding shall be entitled to be paid out of the Company’s assets available for distribution, before any payment shall be made to the holders of common stock or Class A, the greater of (1) an amount in cash equal to the stated value per share of such holders’ preferred stock plus any accrued but unpaid dividends, whether or not declared, through the date of such liquidation, sale or change in control or (2) such amounts as such holders would receive if, immediately prior to such liquidation, sale or change in control, the outstanding Series A, Series A-1, and Class A were converted into the Company’s common stock. If the assets or funds available for distribution to the holders of Series A and Series A-1 are insufficient to pay such holders the full amount to which they are entitled, the holders would share prorata in the assets and funds available for distribution, based upon the aggregate value per share of such holders’ preferred stock plus any unpaid dividends, whether or not declared.
Conversion Rights. Each share of preferred stock is convertible at the option of the holder into common stock at a conversion price per share of $0.392 and $0.4335 (each subject to adjustments upon the occurrence of certain dilutive events) for Series A and Series A-1, respectively. Each share of Series A and Series A-1 is currently convertible into shares of common stock on a one-for-one basis.
Mandatory Conversion Rights. Each share of Series A and Series A-1 shall automatically be converted into shares of common stock at the then effective conversion price for such shares upon the affirmative election of at least a majority of the outstanding shares of preferred stock, or the closing of an underwritten initial public offering with aggregate gross proceeds of at least $35.0 million and a per share price to the public of at least $2.1675.
Voting Rights. Holders of each share of Series A and Series A-1 are entitled to the number of votes equal to the number of shares of common stock into which each such share of Series A and Series A-1 is convertible.
F-28
Table of Contents
Everbridge, Inc.
Notes to the Consolidated Financial Statements—(Continued)
Redemption Rights. The preferred stock is not redeemable.
Common Stock
Holders of the Company’s common stock have one vote per share and no preferences. The Series A, Series A-1 and common stock holders vote together on an as-converted basis. Issuance of additional shares of Class A requires the approval of at least a majority of the holders of the Series A and Series A-1. The Class A holders do not have any voting rights.
The Class A holders have dividend rights. The Company cannot declare, pay or set aside dividends on shares of common stock unless the holders of Common A receive the same dividend per share as the holders of common stock. The Class A holders also have liquidation rights if the Company is liquidated, dissolved or wound up, if all or substantially all of the Company’s assets are acquired or if the Company undergo a change in control. If, upon such an event, the Series A and Series A-1 receive their liquidation preference amount, the Class A will be entitled to receive an amount per share equal to $0.20 (as adjusted for stock splits, combinations and similar events) plus any dividends declared but unpaid on shares of the Class A. If the assets or funds available for distribution to the holders of Class A are insufficient to pay such holders the full amount to which they are entitled, the holders would share prorata in the assets and funds available for distribution, based upon the aggregate value per share of such holders’ Class A, plus any declared and unpaid dividends thereon. If the holders of preferred stock receive their liquidation preference on an as-converted to common basis, the Company’s remaining assets, after distribution to the holders of preferred stock, will be distributed ratably among the holders of common stock and Class A. Each share of Class A shall convert automatically into one share of common stock upon the mandatory conversion of the Series A and Series A-1.
At December 31, 2014 and 2015 and June 30, 2016, there were 64,615,006, 63,865,705 and 64,139,531 (unaudited) shares of common stock issued and outstanding, respectively, and 6,694,854 shares of Class A issued and outstanding.
In January 2015, the Company, pursuant to its repurchase right, repurchased 1,000,000 shares of its common stock from a former employee, who was also a stockholder and current board member for $1.5 million. The shares of common stock were retired and recorded as a reduction of common stock and additional paid-in-capital.
Warrants
In July 2007, the Company entered into a loan and security agreement with PMC Financial Services Group, LLC, or PMC, which was accompanied by a warrant to purchase up to 625,000 shares of common stock at an exercise price of $1.20 per share. PMC elected to exercise this warrant, effective July 11, 2014, on a cashless basis for 107,758 shares of common stock.
In June 2009, the Company issued a warrant to purchase 57,670 shares of the Company’s Series A-1 preferred stock at an exercise price of $0.43 per share in connection with a preferred stock offering. The warrant expires upon the earlier of (1) 10 years after the issuance date, (2) the closing of an initial public offering; or (3) when a change in control transaction takes place. At December 31, 2014 and 2015, the warrant remained unexercised.
In June 2009, the Company issued a warrant to purchase 692,042 shares of the Company’s Series A-1 preferred stock at an exercise price of $0.43 per share in connection with a preferred stock offering. The warrant expires upon the earlier of (1) 10 years after the issuance date, (2) five years after the closing of an initial public offering; or (3) when a change in control transaction takes place. At December 31, 2014 and 2015, the warrant remained unexercised.
No warrants were exercised during the six months ended June 30, 2016 (unaudited).
F-29
Table of Contents
Everbridge, Inc.
Notes to the Consolidated Financial Statements—(Continued)
| (12) | Stock Plans and Stock-Based Compensation |
In June 2008, the Company adopted the 2008 Plan, which permits the granting of stock options to the Company’s’ employees, directors and consultants. The total number of shares authorized for awards of stock options under the 2008 Plan was 8,465,500 shares of common stock. On September 7, 2011, that number was increased to 13,950,000, on May 1, 2012, the number was decreased to 13,051,055 and on July 15, 2015 the number was increased to 18,551,055. As of December 31, 2014 and 2015, there were 2,518,057 and 1,335,746 shares available for grant under the 2008 Plan, respectively. Stock option awards are granted with an exercise price equal to the fair market value of the Company’s common stock at the date of grant as determined by the Company’s board of directors. The option awards generally vest over four years and are exercisable any time after vesting. The stock options expire ten years after the date of grant.
The weighted-average grant-date fair value per share of options granted for the years ended December 31, 2013, 2014 and 2015 and the six months ended June 30, 2015 and 2016, was $0.51, $0.74, $2.12, $0.92 (unaudited) and $1.56 (unaudited), respectively. The Company recorded stock-based compensation expense of $0.2 million, $0.4 million, $1.5 million, $0.4 million (unaudited) and $1.4 million (unaudited) for the years ended December 31, 2013, 2014 and 2015 and the six months ended June 30, 2015 and 2016, respectively.
The total intrinsic value of options exercised in 2013, 2014, 2015 and the six months ended June 30, 2015 and 2016 was $0.3 million, $1.1 million, $0.5 million, $0.1 million (unaudited) and $0.5 million (unaudited), respectively. This intrinsic value represents the difference between the fair market value of the Company’s common stock on the date of exercise and the exercise price of each option. Based on the fair market value of the Company’s common stock at December 31, 2013, 2014 and 2015 and at June 30, 2015 and 2016 the total intrinsic value of all outstanding options was $0.3 million, $5.0 million, $10.1 million, $4.8 million (unaudited) and $9.6 million (unaudited), respectively.
There were no excess tax benefits realized for the tax deductions from stock options exercised during the years ended December 31, 2013, 2014 and 2015 and the six months ended June 30, 2015 and 2016 (unaudited).
The fair value of stock option grants is determined using the Black-Scholes option pricing model with the following weighted average assumptions.
| Year Ended December 31, | Six Months Ended June 30, | |||||||||||||||||
| 2013 | 2014 | 2015 | 2015 | 2016 | ||||||||||||||
| Expected term (in years)(1) |
5.53 - 7.03 | 5.89 - 6.13 | 5.09 - 6.15 | 5.52 - 6.15 | 5.29 - 6.10 | |||||||||||||
| Expected volatility(2) |
65% | 51.7% - 69 | % | 60% | 60% | 70% | ||||||||||||
| Risk-free interest rate(3) |
0.91 - 2.14 | % | 1.63% - 2.06 | % | 1.41% - 1.94% | 1.47% - 1.81 | % | 1.28% - 1.86% | ||||||||||
| Expected dividend yield(4) |
—% | —% | —% | —% | —% | |||||||||||||
| (1) | The expected term represents the period that the stock-based compensation awards are expected to be outstanding. Since the Company did not have sufficient historical information to develop reasonable expectations about future exercise behavior, the Company used the simplified method to compute expected term, which reflects the average of the time-to-vesting and the contractual life; |
| (2) | The expected volatility of the Company’s common stock on the date of grant is based on the volatilities of publicly traded peer companies that are reasonably comparable to the Company’s own operations; |
| (3) | The risk-free interest rate is based on the U.S. Treasury yield curve in effect at the time of grant for zero coupon U.S. Treasury notes with maturities approximately equal to the expected term of the options; and |
| (4) | The expected dividend yield is assumed to be zero as the Company have never paid dividends and have no current plans to pay any dividends on the Company’s common stock. |
F-30
Table of Contents
Everbridge, Inc.
Notes to the Consolidated Financial Statements—(Continued)
Total unrecognized compensation cost, adjusted for estimated forfeitures, related to nonvested stock options was approximately $1.0 million and $6.8 million as of December 31, 2014 and 2015, respectively, and is expected to be recognized over a weighted average period of 1.46 years and 1.62 years as of December 31, 2014 and 2015, respectively.
The amount of cash received from the exercise of stock options in 2014 and 2015 was $0.2 million and $0.1 million, respectively. The Company issued 113,860 shares of common stock during the year ended December 31, 2013 for stock options exercised prior to vesting. The unvested shares are subject to the Company’s repurchase right at the lesser of the original exercise price or market price. The proceeds from the early exercise of stock options are recorded in accrued expenses and reclassified to common stock as the shares vest and the Company’s repurchase rights lapse. There are 113,860 shares held in escrow which are subject to repurchase for early exercise of stock options at an aggregate price of $0.31 per share at December 31, 2014 and 2015.
A summary of activities under the 2008 Option Plan is shown as follows for the years ended December 31, 2014 and 2015 and the six months ended June 30, 2016 (unaudited):
| Stock options outstanding |
Weighted average exercise price |
|||||||
| Outstanding at December 31, 2013 |
5,089,465 | $ | 0.25 | |||||
| Granted |
679,500 | 1.22 | ||||||
| Exercised |
(1,068,249 | ) | 0.21 | |||||
| Forfeited/canceled |
(692,686 | ) | 0.49 | |||||
|
|
|
|||||||
| Outstanding at December 31, 2014 |
4,008,030 | 0.39 | ||||||
| Granted |
6,844,000 | 2.12 | ||||||
| Exercised |
(216,042 | ) | 0.23 | |||||
| Forfeited/canceled |
(161,689 | ) | 1.35 | |||||
|
|
|
|||||||
| Outstanding at December 31, 2015 |
10,474,299 | 1.51 | ||||||
| Granted (unaudited) |
1,285,500 | 2.55 | ||||||
| Exercised (unaudited) |
(273,826 | ) | 0.53 | |||||
| Forfeited/canceled (unaudited) |
(255,557 | ) | 1.08 | |||||
|
|
|
|||||||
| Outstanding at June 30, 2016 (unaudited) |
11,230,416 | 1.66 | ||||||
|
|
|
|||||||
Stock-based compensation expense is recognized over the award’s expected vesting schedule, which is reduced for estimated forfeitures. Forfeitures are estimated at the time of grant and revised, if necessary, in subsequent periods if actual forfeitures differ from those estimates. Forfeitures were estimated based on the Company’s historical experience and future expectations.
F-31
Table of Contents
Everbridge, Inc.
Notes to the Consolidated Financial Statements—(Continued)
Stock options outstanding, and options exercisable and vested are as follows:
| Outstanding as
of |
Remaining contractual life (years) |
Weighted average exercise price |
Exercisable as of December 31, 2014 |
Remaining contractual life (years) |
Weighted average exercise price |
|||||||||||||||
| 4,008,030 |
8.00 | $ | 0.39 | 1,992,189 | 7.45 | $ | 0.26 | |||||||||||||
| Outstanding as
of |
Remaining contractual life (years) |
Weighted average exercise price |
Exercisable as of December 31, 2015 |
Remaining contractual life (years) |
Weighted average exercise price |
|||||||||||||||
| 10,474,299 |
8.62 | $ | 1.51 | 2,716,659 | 6.88 | $ | 0.33 | |||||||||||||
| Outstanding as
of |
Remaining contractual life (years) |
Weighted average exercise price |
Exercisable as of June 30, 2016 |
Remaining contractual life (years) |
Weighted average exercise price |
|||||||||||||||
| 11,230,416 |
8.35 | 1.66 | 3,536,610 | 6.91 | $ | 0.63 | ||||||||||||||
Vested and nonvested stock option activity under the Plan was as follows:
| Vested | Nonvested | |||||||||||||||
| Options outstanding |
Weighted average exercise price |
Options outstanding |
Weighted average exercise price |
|||||||||||||
| Outstanding at December 31, 2014 |
1,992,189 | 0.26 | 2,015,841 | 0.52 | ||||||||||||
| Outstanding at December 31, 2015 |
2,716,659 | 0.33 | 7,757,640 | 1.89 | ||||||||||||
| Outstanding at June 30, 2016 (unaudited) |
3,536,610 | 0.63 | 7,693,806 | 2.11 | ||||||||||||
From time to time, the Company grants stock options that contain performance conditions. During 2013, the Company granted certain employees stock options to purchase 40,000 shares of common stock at a weighted average exercise price of $0.31 per share. These awards contain performance conditions based on achieving certain revenue targets. These performance based stock options vest over a 48 month requisite service period beginning on March 1, 2013. Based on the achievement levels of the performance criteria, as of December 31, 2015, there are 20,000 outstanding stock options with a weighted average exercise price of $0.31 that are eligible for vesting over the requisite service period. No stock options that contain performance conditions were issued during 2014 and 2015 or the six months ended June 30, 2016 (consolidated).
In January and May of 2016, the Company’s board of directors granted options to purchase a total of 1,285,500 shares of the Company’s common stock to employees at a weighted-average exercise price of $2.55 per share. The stock options vest over periods ranging from two to four years. The estimated total stock-based compensation expense associated with these stock options of $2.0 million (unaudited) is expected to be recognized over a weighted average period of 3.8 years (unaudited).
F-32
Table of Contents
Everbridge, Inc.
Notes to the Consolidated Financial Statements—(Continued)
The Company classified stock based compensation relating to stock options and RSAs in the following captions in the accompanying consolidated statements of comprehensive loss:
| Year Ended December 31, |
Six Months Ended June 30 |
|||||||||||||||||||
| 2013 | 2014 | 2015 | 2015 | 2016 | ||||||||||||||||
| (in thousands) | (unaudited) | |||||||||||||||||||
| Cost of revenue |
$ | 48 | $ | 82 | 150 | 57 | 89 | |||||||||||||
| Sales and marketing |
82 | 120 | 315 | 102 | 292 | |||||||||||||||
| Research and development |
28 | 147 | 297 | 134 | 176 | |||||||||||||||
| General and administrative |
18 | 27 | 760 | 65 | 849 | |||||||||||||||
|
|
|
|
|
|
|
|
|
|
|
|||||||||||
| Total stock based compensation cost |
$ | 176 | $ | 376 | 1,522 | 358 | 1,406 | |||||||||||||
|
|
|
|
|
|
|
|
|
|
|
|||||||||||
(13) Basic and Diluted Net Loss per Share
The Company has two classes of stock and, consequently, basic and diluted net loss per common share is presented in conformity with the two-class method required for participating securities. Holders of Series A and Series A-1 preferred stock are each entitled to receive cumulative dividends at a rate of 8% per annum, payable prior and in preference to any dividends on any shares of the Company’s common stock. In the event a dividend is paid on common stock, the holders of preferred stock are entitled to a proportionate share of any such dividend as if they were holders of common stock (on an as-if converted basis). As a result, the Company’s outstanding series of preferred stock are considered to be participating securities. The holders of our preferred stock do not have a contractual obligation to share in our losses; therefore, no amount of total undistributed loss is allocated to preferred stock. If the Company declares, pays or sets aside dividends on shares of common stock, the holders of class A common stock are entitled to receive the same dividend per share as the holders of common stock.
Under the two-class method, basic net loss per share attributable to common stockholders is computed by dividing the net loss attributable to common stockholders by the weighted-average number of shares of common stock outstanding, including participating securities, if applicable, during the period. Net loss attributable to common stockholders is determined by allocating undistributed earnings, calculated as net loss less current period preferred stock dividends, between holders of common stock and class A common stock, including participating securities, if applicable. Diluted net loss per share attributable to common stockholders is computed by dividing the net loss attributable to common stockholders by the weighted-average number of shares of common stock outstanding, including potential dilutive shares of common stock assuming the dilutive effect of preferred stock and outstanding stock options and warrants using the treasury stock method or if-converted method, whichever is more dilutive. As the Company reported losses attributable to common stockholders for all periods presented, all potentially dilutive shares of common stock are antidilutive for those periods.
The following common equivalent shares were excluded from the diluted net loss per share calculation because their inclusion would have been anti-dilutive:
| Year Ended December 31, | Six Months Ended June 30, | |||||||||||||||||||
| 2013 | 2014 | 2015 | 2015 | 2016 | ||||||||||||||||
| (unaudited) | ||||||||||||||||||||
| Stock options |
5,089,465 | 4,008,030 | 10,474,299 | 6,109,406 | 11,230,416 | |||||||||||||||
| Common stock warrants |
625,000 | — | — | — | — | |||||||||||||||
| Series A-1 preferred stock warrants |
749,712 | 749,712 | 749,712 | 749,712 | 749,712 | |||||||||||||||
| Convertible preferred stock |
48,041,096 | 48,041,096 | 48,041,096 | 48,041,096 | 48,041,096 | |||||||||||||||
|
|
|
|
|
|
|
|
|
|
|
|||||||||||
| Total |
54,505,273 | 52,798,838 | 59,265,107 | 54,900,214 | 60,021,224 | |||||||||||||||
|
|
|
|
|
|
|
|
|
|
|
|||||||||||
F-33
Table of Contents
Everbridge, Inc.
Notes to the Consolidated Financial Statements—(Continued)
The Company is required to reserve and keep available from the Company’s authorized but unissued shares of common stock such number of shares sufficient for the exercise of all outstanding warrants, plus shares granted and available for grant under the Company’s 2008 Plan.
The amount of such shares of the Company’s common stock reserved for these purposes at December 31, 2015 is as follows:
| Number of Shares | ||||
| Outstanding stock options |
10,474,299 | |||
| Outstanding Series A-1 warrants |
749,712 | |||
| Outstanding Class A common stock |
6,694,854 | |||
| Convertible preferred stock |
48,041,096 | |||
| Additional shares available for grant under equity plan |
1,335,746 | |||
|
|
|
|||
| Total |
67,295,707 | |||
|
|
|
|||
(14) Segment information
The Company operates as one operating segment. Operating segments are defined as components of an enterprise for which separate financial information is evaluated regularly by the chief operating decision maker, or CODM, who is the Company’s chief executive officer, in deciding how to allocate resources and assess the Company’s financial and operational performance. While the Company has applications that address multiple mass notification use cases, all of the Company’s applications operate on and leverage a single technology platform and are deployed and sold in an identical way. In addition, the Company CODM evaluates the Company’s financial information and resources and assesses the performance of these resources on a consolidated basis. As a result, the Company has determined that the Company’s business operates in a single operating segment. Since the Company operates as one operating segment, all required financial segment information can be found in the consolidated financial statements.
(15) Geographic Concentrations
Revenue by location is determined by the billing address of the customer. Approximately 99%, 86%, 86% and 88% (unaudited) of the Company’s revenue was from the United States for the fiscal years ended December 31, 2013, 2014, 2015 and for the six months ended June 30, 2016 (unaudited), respectively. No other individual country comprised more than 10% of total revenue for the fiscal years ended December 31, 2013, 2014, 2015 or for the six months ended June 30, 2016 (unaudited). Property and equipment by geographic location is based on the location of the legal entity that owns the asset. As of December 31, 2014 and 2015 and June 30, 2016 (unaudited), more than 95% of the Company’s property and equipment was located in the United States.
(16) Employee Benefit Plan
The Company maintains a 401(k) plan for the benefit of the Company’s eligible employees. The plan covers all employees who have attained minimum service requirements. The Company currently does not contribute to the retirement plan for any of its employees.
(17) Commitments and Contingencies
(a) Leases
The Company leases office space in Glendale, California; Pasadena, California; San Francisco, California; Burlington, Massachusetts; Colchester, England; Windsor, England and Beijing, China under operating leases and recognizes escalating rent expense on a straight-line basis over the expected lease term.
F-34
Table of Contents
Everbridge, Inc.
Notes to the Consolidated Financial Statements—(Continued)
Future minimum lease payments under non-cancelable capital and operating leases in effect at December 31, 2015 are as follows:
| Capital | Operating | |||||||
| (in thousands) | ||||||||
| Year ending December 31: |
||||||||
| 2016 |
$ | 61 | $ | 1,317 | ||||
| 2017 |
— | 584 | ||||||
| 2018 |
— | 61 | ||||||
| 2019 |
— | 61 | ||||||
| 2020 |
— | 40 | ||||||
|
|
|
|
|
|||||
| Total minimum lease payments |
61 | $ | 2,063 | |||||
|
|
|
|
|
|||||
| Less amount representing interest lease payments |
3 | |||||||
|
|
|
|||||||
| Capital lease obligations, current |
$ | 58 | ||||||
|
|
|
|||||||
Future minimum operating lease payments have been reduced by future minimum sublease income of $0.3 million.
(b) Rent
Rent expense for the years ended December 31, 2013, 2014 and 2015 was $0.6 million, $0.9 million and $1.7 million respectively. Rent expense for the six months ended June 30, 2015 and 2016 was $0.7 million (unaudited) and $0.8 million (unaudited), respectively.
Rent expense of $46,000, $50,000, $26,000 (unaudited) and $22,000 (unaudited) for the years ended December 31, 2014 and 2015 and the six months ended June 30, 2015 and 2016, respectively, was paid to the former owner of Vocal who is no longer an employee of the Company.
In March 2016, the Company entered into a lease for its new executive offices in Pasadena, California that will result in future minimum lease payments of $1.0 million over the next three years.
Deferred rent expense at December 31, 2014 and 2015 was $0.2 million and $0.2 million, respectively, and was recorded in accrued expenses.
(c) Litigation
In the normal course of business, the Company has been subjected to various unasserted claims. The Company does not believe these will have a material adverse impact to the financial statements.
(d) Employee Contracts
The Company has entered into employment contracts with certain of the Company’s executive officers which provide for at-will employment. However, under the provisions of the contracts, the Company would incur severance obligations of up to twelve months of the executive’s annual base salary for certain events, such as involuntary terminations.
| (18) | Subsequent Events |
In preparing the financial statements as of and for the year ended December 31, 2015, the Company evaluated subsequent events for recognition and measurement purposes through April 15, 2016, the date that the independent auditors’ report was originally issued and the audited annual consolidated financial statements were
F-35
Table of Contents
Everbridge, Inc.
Notes to the Consolidated Financial Statements—(Continued)
available for issuance. After the original issuance of the consolidated financial statements and through August 19, 2016, the Company evaluated subsequent events or transactions that have occurred that may require disclosure in the accompanying financial statements. Except as described below, the Company has concluded that no events or transactions have occurred that require disclosure in the accompanying financial statements.
On July 1, 2016, the Company’s growth capital term loan agreement was amended to allow the Company to make 30 equal monthly payments of principal, plus all accrued interest, beginning on January 10, 2017.
In August 2016, the Company’s board of directors granted options to purchase a total of 103,500 shares of the Company’s common stock to employees at a weighted-average exercise price of $2.55 per share. The stock options vest over periods ranging from three to four years. The estimated total stock-based compensation expense associated with these stock options of $0.2 million (unaudited) is expected to be recognized over a weighted-average period of 3.9 years (unaudited).
F-36
Table of Contents
To the Management of Everbridge
Burlington, Massachusetts
We have audited the accompanying financial statements of Nixle, LLC which comprise the balance sheet as of December 31, 2013, and the related statements of operations, changes in members’ equity (deficit), and cash flows for the year then ended, and the related notes to the financial statements.
Management’s Responsibility for the Financial Statements
Management is responsible for the preparation and fair presentation of these financial statements in accordance with accounting principles generally accepted in the United States of America; this includes the design, implementation, and maintenance of internal control relevant to the preparation and fair presentation of financial statements that are free from material misstatement, whether due to fraud or error.
Auditor’s Responsibility
Our responsibility is to express an opinion on these financial statements based on our audit. We conducted our audit in accordance with auditing standards generally accepted in the United States of America. Those standards require that we plan and perform the audit to obtain reasonable assurance about whether the financial statements are free from material misstatement.
An audit involves performing procedures to obtain audit evidence about the amounts and disclosures in the financial statements. The procedures selected depend on the auditor’s judgment, including the assessment of the risks of material misstatement of the financial statements, whether due to fraud or error. In making those risk assessments, the auditor considers internal control relevant to the entity’s preparation and fair presentation of the financial statements in order to design audit procedures that are appropriate in the circumstances, but not for the purpose of expressing an opinion on the effectiveness of the entity’s internal control. Accordingly, we express no such opinion. An audit also includes evaluating the appropriateness of accounting policies used and the reasonableness of significant accounting estimates made by management, as well as evaluating the overall presentation of the financial statements.
We believe the audit evidence we obtained is sufficient and appropriate to provide a basis for our audit opinion.
Opinion
In our opinion, the financial statements referred to above present fairly, in all material respects, the financial position of Nixle, LLC as of December 31, 2013, and the results of its operations and its cash flows for the year then ended in accordance with accounting principles generally accepted in the United States of America.
The accompanying financial statements have been prepared assuming that Nixle will continue as a going concern. The conditions described in Note 2 indicate Nixle may not be able to continue as a going concern. The accompanying financial statements do not include any adjustments that might be necessary as a result of the outcome of this uncertainty. Our opinion is not modified with respect to that matter.
/s/ Werdann Devito LLC
WERDANN DEVITO LLC
Clark, New Jersey
July 15, 2015
F-37
Table of Contents
Balance Sheet
December 31, 2013
| ASSETS |
| |||||||
| Current assets |
||||||||
| Cash |
$ | 116,178 | ||||||
| Accounts receivable |
310,847 | |||||||
| Prepaid expenses and other current assets |
28,381 | |||||||
|
|
|
|||||||
| Total current assets |
$ | 455,406 | ||||||
| Equipment, net |
36,002 | |||||||
| Other assets |
||||||||
| Security deposits |
13,000 | |||||||
|
|
|
|||||||
| Total other assets |
13,000 | |||||||
|
|
|
|||||||
| Total assets |
$ | 504,408 | ||||||
|
|
|
|||||||
| LIABILITIES AND EQUITY (DEFICIT) | ||||||||
| Current liabilities |
||||||||
| Accounts payable |
$ | 474,786 | ||||||
| Accrued expenses and other current liabilities |
5,331,167 | |||||||
| Current portion of deferred revenue |
658,514 | |||||||
| Note payable – 8% |
13,090,000 | |||||||
|
|
|
|||||||
| Total current liabilities |
$ | 19,554,467 | ||||||
| Long-term liabilities |
||||||||
| Deferred revenue |
51,428 | |||||||
| Note payable – 11.25% |
6,957,590 | |||||||
| Convertible promissory notes |
1,200,000 | |||||||
| Loans payable |
1,255,000 | |||||||
|
|
|
|||||||
| Total long-term liabilities |
9,464,018 | |||||||
| Commitments and contingencies |
— | |||||||
| Equity (deficit) |
||||||||
| Class A Units |
427,005 | |||||||
| Class B Units |
9,677,100 | |||||||
| Class C Units |
— | |||||||
| Accumulated deficit |
(38,618,182 | ) | ||||||
|
|
|
|||||||
| Total equity (deficit) |
(28,514,077 | ) | ||||||
|
|
|
|||||||
| Total liabilities and equity (deficit) |
$ | 504,408 | ||||||
|
|
|
|||||||
See notes to financial statements.
F-38
Table of Contents
Statement of Operations
Year Ended December 31, 2013
| Revenue |
$ | 597,366 | ||||||
| Direct costs |
1,950,645 | |||||||
|
|
|
|||||||
| Gross profit (loss) |
(1,353,279 | ) | ||||||
| Selling and general and administrative expenses |
||||||||
| Selling |
$ | 1,175,300 | ||||||
| General and administrative |
1,888,206 | |||||||
|
|
|
|||||||
| Total |
3,063,506 | |||||||
|
|
|
|||||||
| Loss before interest and state tax expense |
(4,416,785 | ) | ||||||
| Interest expense |
2,095,655 | |||||||
|
|
|
|||||||
| Loss before state tax expense |
(6,512,440 | ) | ||||||
| State tax expense |
3,024 | |||||||
|
|
|
|||||||
| Net loss |
$ | (6,515,464 | ) | |||||
|
|
|
See notes to financial statements.
F-39
Table of Contents
Statement of Members’ Equity (Deficit)
Year Ended December 31, 2013
| Class A | Class B | Class C | Accumulated Deficit |
Total | ||||||||||||||||
| Balance—beginning of year |
427,005 | 9,677,100 | — | $ | (32,102,718 | ) | $ | (21,998,613 | ) | |||||||||||
| Net income (loss) |
— | — | — | (6,515,464 | ) | (6,515,464 | ) | |||||||||||||
| Contributions |
— | — | — | — | — | |||||||||||||||
| Distributions |
— | — | — | — | — | |||||||||||||||
|
|
|
|
|
|
|
|
|
|
|
|||||||||||
| Balance—end of year |
427,005 | 9,677,100 | — | $ | (38,618,182 | ) | $ | (28,514,077 | ) | |||||||||||
|
|
|
|
|
|
|
|
|
|
|
|||||||||||
See notes to financial statements.
F-40
Table of Contents
Statement of Cash Flows
Year Ended December 31, 2013
| Cash flows used by operations |
||||||||
| Net (loss) |
$ | (6,515,464 | ) | |||||
| Adjustments to reconcile net (loss) to net cash used by operations |
||||||||
| Depreciation |
36,541 | |||||||
| Changes in operating assets and liabilities |
||||||||
| Accounts receivable |
(265,665 | ) | ||||||
| Prepaid expenses and other current assets |
4,172 | |||||||
| Accounts payable |
186,072 | |||||||
| Accrued expenses and other current liabilities |
2,071,365 | |||||||
| Deferred revenue |
470,345 | |||||||
|
|
|
|||||||
| Net cash used by operating activities |
$ | (4,012,634 | ) | |||||
| Cash flows from investing activities |
||||||||
| Equipment purchases |
(33,667 | ) | ||||||
|
|
|
|||||||
| Net cash used by investing activities |
(33,667 | ) | ||||||
| Cash flows from financing activities |
||||||||
| Proceeds from note payable |
4,075,000 | |||||||
|
|
|
|||||||
| Net cash provided by financing activities |
4,075,000 | |||||||
|
|
|
|||||||
| Net increase in cash |
28,699 | |||||||
| Cash—beginning of year |
87,479 | |||||||
|
|
|
|||||||
| Cash—end of year |
$ | 116,178 | ||||||
|
|
|
|||||||
| Supplemental disclosures of cash flow information |
||||||||
| Cash paid during the year for: |
||||||||
| Interest |
$ | 16,067 | ||||||
|
|
|
|||||||
| Income taxes |
$ | 3,024 | ||||||
|
|
|
See notes to financial statements.
F-41
Table of Contents
Notes to Financial Statements
December 31, 2013
Note 1—Nature of Operations and Summary of Significant Accounting Policies
Nature of Operations
Nixle LLC (Nixle), organized in New Jersey on January 15, 2007, originally under the name “Rockstar Media LLC” to develop, market and operate an information exchange system. The Members of Rockstar Media agreed to change the name to Nixle to coincide with the product name.
Nixle designs, develops and services secure communications systems. The systems let government agencies and other users simultaneously exchange information with residents. Its products, (1) Nixle Connect is a free notification service provided to registered police departments allowing them to connect with residents by text message, e-mail and the internet. (2) Nixle Engage, Nixle 360, and Nixle Connect for Schools are enhanced versions of the Nixle Connect system, offering users registered under paid subscription plans, the ability to participate in the real-time exchange of information with the public.
Summary of Significant Accounting Policies
Estimates
The preparation of financial statements in conformity with generally accepted accounting principles (GAAP) requires management to make estimates and assumptions that affect certain reported amounts and disclosures. Actual results may differ significantly from those estimates.
Cash Equivalents
For the purpose of the statement of cash flows short term investments maturing in three months or less are considered cash equivalents. Nixle had no investments considered cash equivalents at December 31, 2013.
Accounts Receivable
Accounts receivable are uncollateralized and non-interest bearing amounts Nixle expects to collect from its customers.
Equipment
Equipment is stated at cost. Depreciation is recorded using straight-line and accelerated methods over the equipment’s estimated useful life (3 to 7 years). Costs for maintenance and repairs are expensed as incurred.
Software Development Costs
Nixle internally develops and acquires software that it uses in providing services to its customers. Nixle accounts for costs of developing software according to Financial Accounting Standards Board (FASB) Accounting Standards Codification (“ASC”) 985-20 “Costs of Software to Be Sold, Leased, or Marketed.” Under ASC 985-20 costs for developing software to be sold, licensed or marketed are expensed until technological feasibility is established. When technological feasibility is reached capitalization of costs begins. Capitalization of costs ends and amortization begins when the application is available for release to customers.
Nixle recognizes technological feasibility when a working model is completed. Under this approach after successful internal quality assurance testing is performed the application is released to the subscriber base or market place. If changes are needed after the software is released Nixle takes care of it in later versions of the product. Modifications made during customer support services or while performing maintenance are expensed. Costs qualifying for capitalization between establishing technological feasibility and introducing the product to the market are minimal and thus expensed as incurred.
F-42
Table of Contents
Capital Accounts
Individual capital accounts are increased by cash investments or the fair market value of property contributed and the distributive shares of profits and separately allocated items of income or gain.
Capital accounts are decreased by cash distributions or the book value of property distributed and the distributive share of losses and separately allocated items of expense or loss. Allocations of losses or deductions that would result in a deficit capital account balance are prohibited as losses are limited to each member’s capital investment.
Revenue Recognition
Nixle earns revenue by providing premium services mostly under one year subscription agreements with customers. Revenue earned under subscription agreements is billed to and due by the customer prior to Nixle granting them access to service. Revenue is recognized over the term of the agreement. Unearned revenue for subscriptions still in effect at the end of a period are included as a liability in deferred revenue.
Financial Instruments
All financial instruments are carried at amounts that approximate fair value.
Advertising
Nixle expenses advertising costs when incurred. Nixle expensed advertising costs of $86,065 during the year ended December 31, 2013.
Income Taxes
Nixle was formed as a Limited Liability Company (LLC) electing to be taxed as a partnership under the Internal Revenue Code and applicable state laws. As a partnership, profits and losses pass through to the members and profits are taxed at the individual rather than the partnership level. Accordingly, Nixle has no tax liability, although distributions to members for personal income taxes incurred on partnership profits may be made during the year.
When reporting income or loss on its tax return, Nixle must account for certain transactions according to methods required by taxing authorities. As a result, the net income or loss and members’ capital balances reported on the tax return are usually different from amounts reported in the financial statements.
Uncertain Tax Positions
Nixle is required to identify, measure, and disclose in the financial statements uncertain tax positions Management takes or expects to take when filing the partnership return. At December 31, 2013 Nixle had no uncertain tax positions requiring disclosure. Positions taken on tax matters on partnership returns are subject to review by Federal and State authorities may result in additional taxes and penalty or interest charges to Nixle or its members.
Tax returns are subject to examination by Federal and State authorities for three years from the date of filing. At December 31, 2013 Nixle’s Federal and State tax returns for 2010, 2011 and 2012 are open to examination by the Internal Revenue Service, New Jersey and other state agencies.
Note 2—Going Concern and Uncertainties
Going concern
Nixle has reported net losses since inception and has an accumulated deficit of $38,618,182. Nixle is unable to pay back debt of $27,749,894, and current liabilities exceed current assets by $19,099,061. Nixle’s financial statements are prepared on a going concern basis, which assumes the business operates without threat of liquidation for at least twelve months from the date that the financial statements were available to be issued.
F-43
Table of Contents
Cash Flow and Funding
Nixle is unable to generate cash flow sufficient to fund operations under its current subscription agreements and service model. As a result Nixle is dependent on an “Angel Investor” to subsidize operations. This funding may end or significantly decrease at any time.
Management’s Plans
Management is working on plans to sell substantially all of Nixle’s assets including accounts receivable, customers, software, Nixle’s name and website, subscribers and other assets for cash and stock according to an asset purchase agreement (APA) with a buyer. After a successfully negotiated APA, Management plans to change Nixle’s name to NXL Holdings. NXL Holdings (a/k/a Nixle) will transfer its assets to the buyer and discontinue all software development projects and public notification services, terminate all employees and restructure the business to operate as a holding company with cash, investment in stock, and debt.
Uncertainties
Funding provided to Nixle by an Angel investor is winding down. Management is using cash for paying professionals representing Nixle on a sale of its assets, restructuring and to settle claims by two former members. The future of NXL Holdings (a/k/a Nixle) to continue as a going concern will be largely dependent on the final proceeds NXL Holdings (a/k/a Nixle) realizes from the fulfillment of the terms of an APA. However, even if Management is successful in its efforts to sell assets and restructure operations too many variables exist that may affect the results of Management’s plans.
Nixle’s future depends on whether the buyer of its assets achieves success in an initial public offering (IPO) and meets the terms of an APA in effect with Nixle at the time. Due to the uncertainty of the outcome of Management’s plans and risks associated with debt obligations and individual members’ investments on Nixle’s books there remains a substantial doubt about Nixle’s ability to continue as a going concern.
The financial statements do not include any adjustments that may be necessary if Nixle is unable to continue as a going concern.
Note 3—Equipment
Equipment consists of the following at December 31, 2013:
| Computer software |
$ | 289,652 | ||
| Furniture and fixtures |
65,836 | |||
| Office and other equipment |
395,389 | |||
|
|
|
|||
| Total |
750,877 | |||
| Less: accumulated depreciation and amortization |
(714,875 | ) | ||
|
|
|
|||
| $ | 36,002 | |||
|
|
|
Depreciation expense for the year ended December 31, 2013 was $36,541.
Note 4—Accrued Expenses
Accrued expenses consists of the following at December 31, 2013:
| Due to customer—overpayments |
$ | 6,090 | ||
| Payroll taxes |
2,385 | |||
| Licensing and consulting fees |
75,388 | |||
| Accrued interest |
5,247,304 | |||
|
|
|
|||
| $ | 5,331,167 | |||
|
|
|
F-44
Table of Contents
Note 5—Long-Term Debt
Loans Payable
Nixle has loans payable of $1,255,000 to six individuals, loaned during the years ended 2007 to 2010 under verbal agreements. Nixle computes simple interest accrued of $247,199 on the principal balances at 5.25%. Nixle considers the balances outstanding to be long-term obligations because repayment is not expected to occur within one year.
Note Payable—11.25%
11.25% Secured Convertible Promissory Note
On October 1, 2010 Nixle and the Angel Investor (Holder) executed a “Secured Convertible Promissory Note Agreement” (Note A) for $6,957,590 as a result of a loan restructure for amounts loaned to Nixle between January 2008 and September 2010. The Holder of Note A is entitled to convert all or part of the outstanding principal and accrued interest into Class B Units at a pre-determined conversion price using a $17.5 million valuation of Nixle.
Note A has accrued interest of $3,133,321, accruing daily at an annual rate of 11.25% through October 1, 2015 and is collateralized by a first priority security interest in all of Nixle’s assets.
Note Payable—8%
8% Secured Convertible Promissory Note
On March 31, 2011 Nixle executed a $1,800,000 Secured Convertible Promissory Note Agreement (Note B) with the Angel Investor. Advances made to Nixle during the period increase the principal of Note B. Accrued simple interest of $2,454,228) is calculated at 8% on the outstanding principal balance bi-annually and each time an advance is made and the principal balance changes. Note B was due June 30, 2012, but will continue in effect until another note agreement is executed. The balance outstanding on Note B is $13,090,000 at December 31, 2014.
Convertible Promissory Notes
Nixle has authorized the issuance and sale of Convertible Promissory Notes (the Convertible Notes) up to $5,500,000 in a private offering with each principal unit convertible into one Class B Unit at a price equal to the principal amount subscribed. Upon written notice, holders of the Convertible Notes are entitled to exchange all or part of the outstanding principal and accrued interest into Class B Units each at a price of $14 (the “Conversion Price”). With 30 days of advance written notice Nixle (the Borrower) has the right to convert all or part of the outstanding principal and accrued interest into Class B Units at the “Conversion Price.”
The Convertible Notes accrue interest daily at an annual rate of 8.0%. Details of Convertible Notes outstanding at December 31, 2013 are listed in the table below.
| 8% Convertible Note (Note C) dated October 27, 2010 issued under an agreement with the Angel Investor in exchange for debt, maturing October 26, 2015. Accrued interest on Note C at December 31, 2014 is $182,000 |
$ | 700,000 | ||
| 8% Convertible Note (Note D) dated November 9, 2010, issued under an agreement with a partnership in exchange for cash, maturing November 8, 2015. Accrued interest on Note D at December 31, 2014 is $125,000 |
500,000 | |||
|
|
|
|||
| Total |
$ | 1,200,000 | ||
|
|
|
F-45
Table of Contents
Long-term debt maturing during the years ending December 31, is as follows:
| Year Ending |
Debt Maturing | |||
| 2015 |
$ | 8,157,590 | ||
| 2016 |
— | |||
| 2017 |
— | |||
| 2018 |
— | |||
| 2019 |
— | |||
| Thereafter |
1,255,000 | |||
|
|
|
|||
| $ | 9,412,590 | |||
|
|
|
|||
Note 6—Equity
Membership Units
Equity interests in the membership of Nixle are identified by Units. Each member’s percentage ownership in Nixle is determined by dividing the number of Units owned by the total number of Units issued. Membership Units are broken down into three classes that carry different member rights. No member has the right to act for, on behalf of, or bind Nixle other than the members of the Management Committee.
Class A Units
Class A Units carry rights to purchase Units from a selling member after a first offer is made to purchase Nixle, and drag along rights in connection with the sale of all Nixle Units as indicated in the Agreement. Class A members rank second to receive distributions of net ordinary and capital proceeds until capital contributions reach zero.
There are 943,169 Class A Units issued at December 31, 2013.
Class A Units were originally issued to and held by two individuals who were the founders and original managers of Nixle. In two separate “Membership Interest Pledge Agreements both dated October 1, 2010” these individuals pledged their Class A Units to collateralize the 11.25% Note (Note 5). On September 9, 2011 after the 11.25% Note was defaulted on, the Majority Investor accepted the collateral in satisfaction of outstanding interest payments owed to him.
Class B Units
Class B Units are issued in exchange for capital contributions. Class B unit holders rank first to receive distributions of net ordinary proceeds and net capital proceeds until capital contributions are reduced to zero.
There are 606,755 Class B Units issued at December 31, 2013.
Class C Units
Class C Units are issued in exchange for services rendered to Nixle. Class C Units have a liquidation value of zero when issued and constitute “Profits Interests” in accordance with the provisions of Revenue Procedure 93-27. Class C Units are subject to vesting and forfeiture provisions set forth in separate agreements between Nixle and each Class C Unit Member.
There are 225,183 Class C Units issued and 193,614 Class C Units vested at December 31, 2013.
Note 7—Warrants and Options
Management, has the authority to issue warrants, options or other instruments to purchase Units.
On December 16, 2010 a Warrant was issued to the Majority Investor in exchange for value received. The warrant is exercisable in whole or in part and entitles the Majority Investor to purchase 150,000 Class B Units at $7.01 each until December 16, 2015.
F-46
Table of Contents
Note 8—Retirement Plan
Effective October 1, 2011 Nixle provides retirement benefits through the Nixle 401(k) Plan (the Plan). The Plan allows eligible employees over 18 years of age to defer a portion of their compensation under Section 401(k) of the Internal Revenue Code. The Plan provides Management with a discretionary matching option, allowing Nixle to contribute and allocate to each eligible employees’ account a percentage of their elective deferrals as determined at the end of each Plan year. Nixle made no contribution to the Plan during the year ended December 31, 2013.
Note 9—Operating Leases
Nixle rents office space in San Francisco, California for $12,000 a month plus utility charges. Under a lease agreement through December 31, 2014. Rent expense for the year ended December 31, 2013 was $133,296.
Nixle rents storage space in San Francisco, California at a rate of $149 a month. Rent expense for the year ended December 31, 2013 was $1,788.
Following is a schedule by year of approximate future minimum lease payments required under the above operating lease agreements that have remaining non-cancelable lease terms as of December 31, 2013:
| Year ending December 31, |
Payment | |||
| 2014 |
$ | 144,000 | ||
| Thereafter |
— | |||
|
|
|
|||
| Total |
$ | 144,000 | ||
|
|
|
|||
Note 10—Noncash Transactions
Nixle had recorded a $50,000 advance as a capital contribution during 2010. The member contended that the $50,000 was an addition to a convertible note payable (Note 5). On January 1, 2012 Nixle agreed to recognize the addition to the convertible note payable and reclassified $50,000 of Members’ Equity to a long-term note payable.
Note 11—Risks and Uncertainties
Concentration of Credit Risk
Nixle, at times, maintains cash balances in financial institutions that are in excess of the $250,000 insurance provided by the Federal Deposit Insurance Corporation (FDIC). At December 31, 2013 Nixle’s cash balances did not exceed the FDIC limits. Nixle has not experienced any loss on its cash or cash equivalents. Management believes any significant credit risk on Nixle’s deposits in financial institutions is minimal.
Competition
The market for Nixle’s products and services is highly competitive and the technology is subject to shifts in market preferences. There exists a risk that Nixle’s financial condition and results of operations could be negatively affected if market preferences shift.
Litigation
Nixle has a complaint against them from an investor’s estate for a total of $1,000,000. The complaint is for the return of equity of $500,000 and repayment of a loan for $500,000. Both these amounts are recorded in the financial statements and no additional liability is expected when this case is settled.
Nixle has a complaint against them for the return of equity of approximately $250,000 from an investor. The plaintiff’s investment of $250,000 is included in the financial statements. Management believes any amounts sought beyond the investment will be negligible and not material to the financial statements.
F-47
Table of Contents
Both complaints were resolved for $275,000 subsequent to December 31, 2013.
Note 12—Licensing Agreement
Nixle terminated its licensing agreement with emergency notification systems service provider, Everbridge effective December 31, 2013. For the year ended December 31, 2013 Nixle paid $400,000 under its licensing agreement with Everbridge.
Nixle entered into a new licensing agreement effective January 1, 2014 with a telecommunications firm, Shoutpoint, for voice applications solutions. The agreement is standard for one year, automatically renewing each January 1 successively, for two more years unless cancelled with 30 days advance notice. The base licensing fee is $45,000 per quarter with additional Price Per Minute (PPM) and Price Per Contact (PPC) charges. Beginning with the second annual term of the agreement, minimum pricing rules take effect.
Note 13—Subsequent Events and Future Uncertainties
Management has evaluated subsequent events through July 15, 2015 which is the date these financial statements were available to be issued.
Subsequent to year end on December 23, 2014 the Director of Nixle entered into an Asset Purchase Agreement (APA) with its service provider—Everbridge. Under the terms of the APA, Everbridge, purchased substantially all of Nixle’s assets and a portion of accounts payable in exchange for cash and stock. Everbridge is planning an initial public offering (IPO) of its stock in late July 2015 and will include pro-forma financial information and other information related to the APA with Nixle.
The effects of Everbridge’s IPO on Nixle are highly speculative and impossible to determine, accordingly these financial statements contain no adjustments for events that may occur as a result of this subsequent event.
F-48
Table of Contents
To the Management of Everbridge -
Burlington, Massachusetts
We have audited the accompanying financial statements of Nixle, LLC which comprise the balance sheet as of December 31, 2012, and the related statements of operations, members’ equity (deficit), and cash flows for the year then ended, and the related notes to the financial statements.
Management’s Responsibility for the Financial Statements
Management is responsible for the preparation and fair presentation of these financial statements in accordance with accounting principles generally accepted in the United States of America; this includes the design, implementation, and maintenance of internal control relevant to the preparation and fair presentation of financial statements that are free from material misstatement, whether due to fraud or error.
Auditor’s Responsibility
Our responsibility is to express an opinion on these financial statements based on our audit. We conducted our audit in accordance with auditing standards generally accepted in the United States of America. Those standards require that we plan and perform the audit to obtain reasonable assurance about whether the financial statements are free from material misstatement.
An audit involves performing procedures to obtain audit evidence about the amounts and disclosures in the financial statements. The procedures selected depend on the auditor’s judgment, including the assessment of the risks of material misstatement of the financial statements, whether due to fraud or error. In making those risk assessments, the auditor considers internal control relevant to the entity’s preparation and fair presentation of the financial statements in order to design audit procedures that are appropriate in the circumstances, but not for the purpose of expressing an opinion on the effectiveness of the entity’s internal control. Accordingly, we express no such opinion. An audit also includes evaluating the appropriateness of accounting policies used and the reasonableness of significant accounting estimates made by management, as well as evaluating the overall presentation of the financial statements.
We believe that the audit evidence we have obtained is sufficient and appropriate to provide a basis for our audit opinion.
Opinion
In our opinion, the financial statements referred to above present fairly, in all material respects, the financial position of Nixle, LLC as of December 31, 2012, and the results of its operations and its cash flows for the year then ended in accordance with accounting principles generally accepted in the United States of America.
The accompanying financial statements have been prepared assuming that Nixle will continue as a going concern. The conditions described in Note 2 indicate Nixle may not be able to continue as a going concern. The accompanying financial statements do not include any adjustments that might be necessary as a result of the outcome of this uncertainty. Our opinion is not modified with respect to that matter.
/s/ Werdann Devito LLC
WERDANN DEVITO LLC
Clark, New Jersey
July 15, 2015
F-49
Table of Contents
NIXLE, LLC
December 31, 2012
| ASSETS |
| |||||||
| Current assets |
||||||||
| Cash |
$ | 87,479 | ||||||
| Accounts receivable |
45,182 | |||||||
| Prepaid expenses and other current assets |
36,105 | |||||||
|
|
|
|||||||
| Total current assets |
$ | 168,766 | ||||||
| Equipment, net |
38,876 | |||||||
| Other assets |
||||||||
| Security deposits |
9,448 | |||||||
|
|
|
|||||||
| Total other assets |
9,448 | |||||||
|
|
|
|||||||
| Total assets |
$ | 217,090 | ||||||
|
|
|
|||||||
| LIABILITIES AND EQUITY (DEFICIT) | ||||||||
| Current liabilities |
||||||||
| Accounts payable |
$ | 288,714 | ||||||
| Accrued expenses and other current liabilities |
3,259,802 | |||||||
| Current portion of deferred revenue |
217,909 | |||||||
| Note payable – 8% |
9,015,000 | |||||||
|
|
|
|||||||
| Total current liabilities |
$ | 12,781,425 | ||||||
| Long-term liabilities |
||||||||
| Deferred revenue |
21,688 | |||||||
| Note payable – 11.25% |
6,957,590 | |||||||
| Convertible promissory notes |
1,200,000 | |||||||
| Loans payable |
1,255,000 | |||||||
|
|
|
|||||||
| Total long-term liabilities |
9,434,278 | |||||||
| Commitments and contingencies |
— | |||||||
| Equity (deficit) |
||||||||
| Class A Units |
427,005 | |||||||
| Class B Units |
9,677,100 | |||||||
| Class C Units |
— | |||||||
| Accumulated deficit |
(32,102,718 | ) | ||||||
|
|
|
|||||||
| Total equity (deficit) |
(21,998,613 | ) | ||||||
|
|
|
|||||||
| Total liabilities and equity (deficit) |
$ | 217,090 | ||||||
|
|
|
|||||||
See notes to financial statements.
F-50
Table of Contents
NIXLE, LLC
Year Ended December 31, 2012
| Revenue |
$ | 101,627 | ||||||
| Direct costs |
1,542,667 | |||||||
|
|
|
|||||||
| Gross profit (loss) |
(1,441,040 | ) | ||||||
| Selling and general and administrative expenses |
||||||||
| Selling |
$ | 580,124 | ||||||
| General and administrative |
1,734,894 | |||||||
|
|
|
|||||||
| Total |
2,315,018 | |||||||
|
|
|
|||||||
| Loss before interest and state tax expense |
(3,756,058 | ) | ||||||
| Interest expense |
1,628,320 | |||||||
|
|
|
|||||||
| Loss before state tax expense |
(5,384,378 | ) | ||||||
| State tax expense |
3,268 | |||||||
|
|
|
|||||||
| Net loss |
$ | (5,387,646 | ) | |||||
|
|
|
See notes to financial statements.
F-51
Table of Contents
NIXLE, LLC
Statement of Members’ Equity (Deficit)
Year Ended December 31, 2012
| Class A | Class B | Class C | Accumulated Deficit |
Total | ||||||||||||||||
| Balance—beginning of year |
427,005 | 9,727,100 | — | $ | (26,714,235 | ) | $ | (16,560,130 | ) | |||||||||||
| Net income (loss) |
(5,387,646 | ) | (5,387,646 | ) | ||||||||||||||||
| Re-classify equity to debt |
— | (50,000 | ) | — | — | (50,000 | ) | |||||||||||||
| Contributions |
— | — | — | — | — | |||||||||||||||
| Distributions |
— | — | — | (837 | ) | (837 | ) | |||||||||||||
|
|
|
|
|
|
|
|
|
|
|
|||||||||||
| Balance—end of year |
427,005 | 9,677,100 | — | $ | (32,102,718 | ) | $ | (21,998,613 | ) | |||||||||||
|
|
|
|
|
|
|
|
|
|
|
|||||||||||
See notes to financial statements.
F-52
Table of Contents
NIXLE, LLC
Year Ended December 31, 2012
| Cash flows from operating activities |
||||||||
| Net (loss) |
$ | (5,387,646 | ) | |||||
| Adjustments to reconcile net (loss) to net cash used by operating activities |
||||||||
| Depreciation |
48,342 | |||||||
| (Increase)decrease in: |
||||||||
| Accounts receivable |
(34,182 | ) | ||||||
| Prepaid expenses and other current assets |
44,768 | |||||||
| Increase(decrease) in: |
||||||||
| Accounts payable |
(77,589 | ) | ||||||
| Accrued expenses and other current liabilities |
1,510,645 | |||||||
| Deferred revenue |
239,597 | |||||||
|
|
|
|||||||
| Net cash used by operating activities |
$ | (3,656,065 | ) | |||||
| Cash flows from investing activities |
||||||||
| Equipment purchases |
(24,499 | ) | ||||||
|
|
|
|||||||
| Net cash used by investing activities |
(24,499 | ) | ||||||
| Cash flows from financing activities |
||||||||
| Proceeds from note payable |
3,765,000 | |||||||
| Distributions |
(837 | ) | ||||||
|
|
|
|||||||
| Net cash provided by financing activities |
3,764,163 | |||||||
|
|
|
|||||||
| Net increase in cash |
83,599 | |||||||
| Cash at beginning of year |
3,880 | |||||||
|
|
|
|||||||
| Cash at end of year |
$ | 87,479 | ||||||
| Supplemental disclosures |
||||||||
| Interest paid |
$ | 2,296 | ||||||
| Income taxes paid |
$ | 3,268 |
See notes to financial statements.
F-53
Table of Contents
NIXLE, LLC
December 31, 2012
Note 1—Summary of Significant Accounting Policies
Nature of Operations
Nixle LLC (Nixle), organized in New Jersey on January 15, 2007, originally under the name “Rockstar Media LLC” to develop, market and operate an information exchange system. On December 1, 2007 the Members of Rockstar Media agreed to change the name to Nixle LLC to coincide with the name of the product.
Nixle designs, develops and services secure communications systems. The systems let government agencies and other users simultaneously exchange information with residents. Its products, (1) Nixle Connect offers free, to registered police departments, a notification system that allows them to connect with residents by text message, e-mail and the internet. (2) Nixle Engage, Nixle 360, and Nixle Connect for Schools are enhanced versions of the Nixle Connect system, offering users under subscription agreements, the ability to participate in the real-time exchange of information with the public.
Estimates
The preparation of financial statements in conformity with generally accepted accounting principles (GAAP) requires management to make estimates and assumptions that affect certain reported amounts and disclosures. Actual results could differ from those estimates.
Cash and Cash Equivalents
For the purpose of the statement of cash flows all highly liquid debt instruments with maturities of three months or less are considered cash equivalents. Nixle had no investments considered cash equivalents at December 31, 2012.
Accounts Receivable
Accounts receivable are non-interest bearing, uncollateralized amounts Nixle expects to collect from its customers.
Equipment
Equipment is stated at cost. Depreciation is computed using the straight-line method over the equipment’s estimated useful life (3 to 7 years). Amounts disbursed for maintenance and repairs are charged to expense as incurred.
Software Development Costs
Nixle internally develops software and acquires software that it uses in providing services to its customers. Nixle accounts for software development costs according to Financial Accounting Standards Board (FASB) Accounting Standards Codification (“ASC”) 985-20 “Costs of Software to Be Sold, Leased, or Marketed.” Costs for developing software to be licensed are expensed.
Nixle recognizes technological feasibility when a working model is completed. Under this approach after successful internal quality assurance testing is performed the application is released to the subscriber base or market place. If changes are needed after the software is released Nixle takes care of it in later versions of the product. Modifications made during customer support services or while performing maintenance are expensed. Costs qualifying for capitalization between establishing technological feasibility and introducing the product to the market are minimal and thus expensed as incurred.
F-54
Table of Contents
Capital Accounts
Individual capital accounts are increased by cash investments or the fair market value of property contributed and the distributive shares of profits and separately allocated items of income or gain.
Capital accounts are decreased by cash distributions or the book value of property distributed and the distributive share of losses and separately allocated items of expense or loss. Allocations of losses or deductions that would result in a deficit capital account balance are prohibited as losses are limited to each member’s capital investment.
Revenue Recognition
Nixle earns revenue by providing premium services mostly under one year subscription agreements with customers. Revenue earned under subscription agreements is billed to and due by the customer prior to Nixle granting them access to service. Revenue is recognized over the term of the agreement. Unearned revenue for subscriptions still in effect at the end of a period are included as a liability in deferred revenue.
Financial Instruments
All financial instruments are carried at amounts that approximate fair value.
Advertising
Advertising costs are expensed as incurred. Nixle incurred advertising costs of $239,731 for the year ended December 31, 2012.
Income Taxes
Nixle was formed as a Limited Liability Company (LLC) electing to be taxed as a partnership under the Internal Revenue Code and applicable state laws. As a partnership, profits and losses pass through to the members and profits are taxed at the individual rather than the partnership level. Accordingly, Nixle has no tax liability, although distributions to members for personal income taxes incurred on partnership profits may be made during the year.
When reporting net income or loss on its tax return, Nixle accounts for certain transactions according to methods required by law. As a result, the net income or loss and members’ capital balances reported on the tax return are usually different from those amounts reported in the financial statements.
Uncertain Tax Positions
Nixle is required to identify, measure, and disclose in the financial statements uncertain tax positions Management takes or expects to take when filing the partnership return. At December 31, 2012 Nixle had no uncertain tax positions requiring disclosure. Tax positions taken on partnership returns may be rejected by taxing authorities and may result in tax, penalty or interest charges to Nixle or its members.
Tax returns are subject to examination by Federal and State authorities for three years from the date of filing. Nixle’s Federal and State tax returns for 2009, 2010 and 2011 are open to examination by the Internal Revenue Service, New Jersey and other state agencies.
Note 2— Going Concern and Uncertainties
Going Concern
Nixle has reported net losses since inception and an accumulated deficit of $32,102,718. Nixle is unable to pay back debt of $21,595,306, and current liabilities exceed current assets by $12,612,659. Nixle’s financial statements are prepared on a going concern basis, which assumes the business operates without threat of liquidation for at least twelve months from the date that the financial statements were available to be issued.
F-55
Table of Contents
Cash Flow and Funding
Nixle is unable to generate cash flow sufficient to fund operations under its current subscription agreements and service model. As a result Nixle is dependent on an “Angel Investor” to subsidize operations. This funding may end or significantly decrease at any time.
Management’s Plans
Management is working on plans to sell substantially all of Nixle’s assets including accounts receivable, customers, software, Nixle’s name and website, subscribers and other assets for cash and stock according to an asset purchase agreement (APA) with a buyer. After a successfully negotiated APA, Management plans to change Nixle’s name to NXL Holdings. NXL Holdings (a/k/a Nixle) will transfer its assets to the buyer and discontinue all software development projects and public notification services, terminate all employees and restructure the business to operate as a holding company with cash, investment in stock, and debt.
Uncertainties
Funding provided to Nixle by an Angel investor is winding down. Management is using cash for paying professionals representing Nixle on a sale of its assets, restructuring and to settle claims by two former members. The future of NXL Holdings (a/k/a Nixle) to continue as a going concern will be largely dependent on the final proceeds NXL Holdings (a/k/a Nixle) realizes from the fulfillment of the terms of an APA. However, even if Management is successful in its efforts to sell assets and restructure operations too many variables exist that may affect the results of Management’s plans.
Nixle’s future depends on whether the buyer of its assets achieves success in an initial public offering (IPO) and meets the terms of an APA in effect with Nixle at the time. Due to the uncertainty of the outcome of Management’s plans and risks associated with debt obligations and individual members’ investments on Nixle’s books there remains a substantial doubt about Nixle’s ability to continue as a going concern.
The financial statements do not include any adjustments that may be necessary if Nixle is unable to continue as a going concern.
Note 3—Equipment
Equipment consists of the following at December 31, 2012:
| Computer software |
$ | 289,652 | ||
| Furniture and fixtures |
54,840 | |||
| Office and other equipment |
372,718 | |||
|
|
|
|||
| Total |
717,210 | |||
| Less: accumulated depreciation |
(678,334 | ) | ||
|
|
|
|||
| $ | 38,876 | |||
|
|
|
Depreciation expense for the year ended December 31, 2012 was $48,342.
Note 4—Accrued Expenses
Accrued expenses consists of the following at December 31, 2012:
| Payroll taxes |
$ | 6,977 | ||
| Licensing and consulting fees |
85,109 | |||
| Accrued interest |
3,167,716 | |||
|
|
|
|||
| $ | 3,259,802 | |||
|
|
|
F-56
Table of Contents
Note 5—Long-Term Debt
Loans Payable
Nixle has a total of $1,255,000 in loans payable to six individuals under verbal agreements made during the period January 1, 2007 to December 31, 2010. Nixle computes simple interest on the principal balance at a rate of 5.25%. The loans are considered long-term obligations because repayment is not expected to happen within one year. At December 31, 2012 there is $193,866 accrued interest due on these loans, included in accrued expenses.
Note Payable—11.25%
11.25% Secured Convertible Promissory Note
On October 1, 2010 Nixle and the Angel Investor (Holder) executed a “Secured Convertible Promissory Note Agreement” (Note A) for $6,957,590 as a result of a loan restructure for amounts the Angel Investor loaned to Nixle between January 2008 and September 2010. The Holder of Note A is entitled to convert all or part of the outstanding principal and accrued interest into Class B Units at a pre-determined conversion price using a $17.5 million valuation of Nixle.
Note A has accrued interest of $2,044,950 accruing daily at an annual rate of 11.25% through October 1, 2015 and is collateralized by a first priority security interest in all of Nixle’s assets.
Note Payable—8%
8% Secured Convertible Promissory Note
On March 31, 2011 Nixle executed a $1,800,000 Secured Convertible Promissory Note Agreement (Note B) with the Angel Investor. Advances during the period increase Note B. Accrued simple interest of $717,900 is calculated at 8% on the outstanding principal balance bi-annually, and each time an advance is made and the principal balance changes. Note B was due June 30, 2012, but will continue in effect until another note agreement is executed. The balance outstanding on Note B is $9,015,000 at December 31, 2012.
Convertible Promissory Notes
Nixle authorized the issuance and sale of Convertible Promissory Notes (the Convertible Notes) up to $5,500,000 in a private offering with each principal unit convertible into one Class B Unit at a price equal to the principal amount subscribed. Upon written notice, holders of the Convertible Notes are entitled to exchange all or part of the outstanding principal and accrued interest into Class B Units each at a price of $14 (the “Conversion Price”). With 30 days of advance written notice Nixle (the Borrower) has the right to convert all or part of the outstanding principal and accrued interest into Class B Units at the “Conversion Price.”
The Convertible Notes accrue interest daily at an annual rate of 8.0%. Details of Convertible Notes outstanding at December 31, 2012 are listed below.
| 8% Convertible Note (Note C) dated October 27, 2010 issued under an agreement with the Angel Investor, in exchange for debt outstanding, maturing October 26, 2015. At December 31, 2012 there is $126,000 interest due on Note C included in accrued expenses. |
$ | 700,000 | ||
| 8% Convertible Note (Note D) dated November 9, 2010, issued under an agreement with a partnership in exchange for cash, maturing November 8, 2015. At December 31, 2012 there is $85,000 interest due on Note D included in accrued expenses. |
500,000 | |||
|
|
|
|||
| Total |
$ | 1,200,000 | ||
|
|
|
F-57
Table of Contents
Long-term debt maturing during the years ending December 31, is as follows:
| Year Ending |
Debt Maturing | |||
| 2014 |
$ | — | ||
| 2015 |
8,157,590 | |||
| 2016 |
— | |||
| 2017 |
— | |||
| Thereafter |
1,255,000 | |||
|
|
|
|||
| $ | 9,412,590 | |||
|
|
|
|||
Note 6—Equity
Membership Units
Equity interests in the membership of Nixle are identified by Units. Each member’s percentage ownership in Nixle is determined by dividing the number of Units owned by the total number of Units issued. Membership Units are broken down into three classes that carry different member rights. No member has the right to act for, on behalf of, or bind Nixle other than the members of the Management Committee.
Class A Units
Class A Units carry rights to purchase Units from a selling member after a first offer is made to purchase Nixle, and drag along rights in connection with the sale of all Nixle Units as indicated in the Agreement. Class A members rank second to receive distributions of net ordinary and capital proceeds until capital contributions reach zero.
There are 943,169 Class A Units issued at December 31, 2012.
Class A Units were originally issued to and held by two individuals who were the founders and original managers of Nixle. In two separate “Membership Interest Pledge Agreements both dated October 1, 2010” these individuals pledged their Class A Units to collateralize the 11.25% Note (Note 5). On September 9, 2011 after the 11.25% Note was defaulted on, the Majority Investor accepted the collateral in satisfaction of outstanding interest payments owed to him.
Class B Units
Class B Units are issued in exchange for capital contributions. Class B unit holders rank first to receive distributions of net ordinary proceeds and net capital proceeds until capital contributions are reduced to zero.
There are 606,755 Class B Units issued at December 31, 2012.
Class C Units
Class C Units are issued in exchange for services rendered to Nixle. Class C Units have a liquidation value of zero when issued and constitute “Profits Interests” in accordance with the provisions of Revenue Procedure 93-27. Class C Units are subject to vesting and forfeiture provisions set forth in separate agreements between Nixle and each Class C Unit Member.
There are 225,183 Class C Units issued and 193,614 Class C Units vested at December 31, 2012.
Note 7—Warrants and Options
Management, has the authority to issue warrants, options or other instruments to purchase Units.
On December 16, 2010 a Warrant was issued to the Majority Investor in exchange for value received. The warrant is exercisable in whole or in part and entitles the Majority Investor to purchase 150,000 Class B Units at $7.01 each until December 16, 2015.
F-58
Table of Contents
On October 6, 2011 a Unit Purchase Warrant was issued to a former founding member for value received. The warrant is exercisable in whole or in part and entitles the holder to purchase 1) 85,991 Class A Units at $1.00 per Unit until December 31, 2012 and 2) 64,009 Class A Units at $2.00 per Unit until December 31, 2013.
Note 8—Retirement Plan
Effective October 1, 2011 Nixle provides retirement benefits through the Nixle 401(k) Plan (the Plan). The Plan allows eligible employees over 18 years of age to defer a portion of their compensation under Section 401(k) of the Internal Revenue Code. The Plan provides Management with a discretionary matching option, allowing Nixle to contribute and allocate to each eligible employees’ account a percentage of their elective deferrals as determined at the end of each Plan year. Nixle made no contribution to the Plan during the year ended December 31, 2012.
Note 9—Operating Leases
Nixle rents office space in Pasadena, California effective through April 1, 2013. Rent expense is $790 a month plus a charge for operating costs. For the year ended December 31, 2012, rent expense incurred under this agreement was approximately $11,750.
Nixle rents office space in San Francisco, California under an “Office Lease” effective October 1, 2011 through December 31, 2013. Rent expense is $3,950 a month plus operating costs, through December 31, 2012. For the year ended December 31, 2012, rent expense incurred under this agreement was approximately $47,400.
Following is a schedule by year of approximate future minimum lease payments required under the above operating lease agreements that have remaining non-cancelable lease terms as of December 31:
| Year ending December 31, |
Payment | |||
| 2013 |
$ | 2,370 | ||
| Thereafter |
— | |||
|
|
|
|||
| Total |
$ | 2,370 | ||
|
|
|
|||
Note 10—Noncash Transactions
Nixle had recorded a $50,000 advance as a capital contribution during 2010. The individual contended that the $50,000 was an addition to a convertible note payable (Note 5). On January 1, 2012 Nixle agreed to recognize the addition to the convertible note payable and reclassified $50,000 of Members’ Equity to a long-term note payable.
Note 11—Risks and Uncertainties
Concentration of Credit Risk
Nixle, at times, maintains cash balances in financial institutions that are in excess of the $250,000 insurance provided by the Federal Deposit Insurance Corporation (FDIC). At December 31, 2012 Nixle’s cash balances did not exceed the FDIC limits. Nixle has not experienced any loss on its cash or cash equivalents. Management believes any significant credit risk on Nixle’s deposits in financial institutions is minimal.
Competition
The market for Nixle’s products and services is highly competitive and the technology is subject to shifts in market preferences. There exists a risk that Nixle’s financial condition and results of operations could be negatively affected if market preferences shift.
F-59
Table of Contents
Litigation
Nixle has complaints pending against them for approximately $3,328,000 from an individual’s estate and an individual who allege loans, accrued interest and legal fees are owed to them. However, $2,760,000 of the claimed amount is without merit. Nixle has included this liability in the financial statements at December 31, 2012.
Note 12—Licensing Agreement
During December 2012 Nixle formed a partnership with Everbridge under a licensing agreement for data hosting, automated communication, mass notification and related services. The renewable license agreement extends for one year and is cancelable with 60 days prior notice by either side. Following this arrangement and subsequent to year end Nixle terminated a license agreement with a similar service provider—GovDelivery (Note 13). For the year ended December 31, 2012 Nixle paid $257,734 to GovDelivery under its licensing agreement.
Note 13—Subsequent Events
Management has evaluated subsequent events through July 15, 2015 which is the date these financial statements were available to be issued.
Asset Purchase Agreement
Subsequent to year end on December 23, 2014 the Director of Nixle entered into an Asset Purchase Agreement (APA) with its service provider—Everbridge. Under the terms of the APA, Everbridge, purchased substantially all of Nixles’s assets and a portion of accounts payable in exchange for cash and stock. Everbridge is planning an initial public offering (IPO) of its stock in late July 2015 and will include pro-forma financial information and other information related to the APA with Nixle.
The effects of Everbridge’s IPO on Nixle are highly speculative and impossible to determine, accordingly these financial statements contain no adjustments for events that may occur as a result of this subsequent event.
Lease Agreements
Subsequent to year end Nixle extended lease agreements for office space in (1) Pasadena, California to September 30, 2013 at a rate of $812 a month and (2) San Francisco, California to December 31, 2014 at a rate of $11,500 a month through December 31, 2013 and $12,000 a month through December 31, 2014. Nixle also entered into a month to month rental agreement for storage space in Pasadena, California at a rate of $149 a month.
Licensing Agreement
Subsequent to year end, Nixle terminated its licensing agreement with GovDelivery for the Nixle Dial data hosting platform.
Litigation
Both complaints were settled for $275,000 subsequent to December 31, 2012 (Note 11).
F-60
Table of Contents
Independent Accountant’s Review Report
To the Management of Everbridge
Burlington, Massachusetts
We have reviewed the accompanying balance sheets of Nixle LLC as of September 30, 2014 and 2013, and the related statements of operations, members’ equity (deficit), and cash flows for the nine months then ended. A review includes primarily applying analytical procedures to management’s financial data and making inquiries of Company management. A review is substantially less in scope than an audit, the objective of which is the expression of an opinion regarding the financial statements as a whole. Accordingly, we do not express such an opinion.
Management is responsible for the preparation and fair presentation of the financial statements in accordance with accounting principles generally accepted in the United States of America and for designing, implementing, and maintaining internal control relevant to the preparation and fair presentation of the financial statements.
Our responsibility is to conduct the review in accordance with Statements on Standards for Accounting and Review Services issued by the American Institute of Certified Public Accountants. Those standards require us to perform procedures to obtain limited assurance that there are no material modifications that should be made to the financial statements. We believe that the results of our procedures provide a reasonable basis for our report.
Based on our review, we are not aware of any material modifications that should be made to the financial statements in order for them to be in conformity with accounting principles generally accepted in the United States of America.
As discussed in Note 2, certain conditions indicate that the Company may be unable to continue as a going concern. The accompanying financial statements do not include any adjustments that might be necessary should the Company be unable to continue as a going concern.
/s/ Werdann Devito LLC
WERDANN DEVITO LLC
Clark, New Jersey
July 15, 2015
F-61
Table of Contents
Balance Sheets
September 30,
| ASSETS | ||||||||
| 2014 | 2013 | |||||||
| Current assets |
||||||||
| Cash |
$ | 19,663 | $ | 59,686 | ||||
| Accounts receivable |
564,017 | 150,605 | ||||||
| Prepaid expenses and other current assets |
39,905 | 37,283 | ||||||
|
|
|
|
|
|||||
| Total current assets |
623,585 | 247,574 | ||||||
|
|
|
|
|
|||||
| Equipment, net |
73,619 | 38,674 | ||||||
|
|
|
|
|
|||||
| Other assets |
||||||||
| Security deposits |
25,225 | 14,548 | ||||||
|
|
|
|
|
|||||
| Total other assets |
25,225 | 14,548 | ||||||
|
|
|
|
|
|||||
| Total assets |
$ | 722,429 | $ | 300,796 | ||||
|
|
|
|
|
|||||
| LIABILITIES AND EQUITY (DEFICIT) | ||||||||
| Current liabilities |
||||||||
| Accounts payable |
$ | 555,336 | $ | 433,455 | ||||
| Accrued expenses and other current liabilities |
7,109,400 | 4,744,274 | ||||||
| Current portion of deferred revenue |
1,141,217 | 433,443 | ||||||
| Note payable—11.25% |
16,915,000 | 12,040,000 | ||||||
|
|
|
|
|
|||||
| Total current liabilities |
25,720,953 | 17,651,172 | ||||||
|
|
|
|
|
|||||
| Long-term liabilities |
||||||||
| Deferred revenue |
46,673 | 20,135 | ||||||
| Note payable—8% |
6,957,590 | 6,957,590 | ||||||
| Convertible promissory notes |
1,200,000 | 1,200,000 | ||||||
| Loans payable |
755,000 | 1,255,000 | ||||||
|
|
|
|
|
|||||
| Total long-term liabilities |
8,959,263 | 9,432,725 | ||||||
|
|
|
|
|
|||||
| Commitments and contingencies |
— | — | ||||||
| Equity (deficit) |
||||||||
| Class A Units |
427,005 | 427,005 | ||||||
| Class B Units |
9,677,100 | 9,677,100 | ||||||
| Class C Units |
— | — | ||||||
| Accumulated deficit |
(44,061,892 | ) | (36,887,206 | ) | ||||
|
|
|
|
|
|||||
| Total equity (deficit) |
(33,957,787 | ) | (26,783,101 | ) | ||||
|
|
|
|
|
|||||
| Total liabilities and equity (deficit) |
$ | 722,429 | $ | 300,796 | ||||
|
|
|
|
|
|||||
See accompanying notes and independent accountant’s review report.
F-62
Table of Contents
Statements of Operations
Nine Months Ended September 30,
| 2014 | 2013 | |||||||
| Revenue |
$ | 1,172,251 | $ | 385,686 | ||||
| Direct costs |
2,533,539 | 931,963 | ||||||
|
|
|
|
|
|||||
| Gross profit (loss) |
(1,361,288 | ) | (546,277 | ) | ||||
|
|
|
|
|
|||||
| Selling and general and administrative expenses |
||||||||
| Selling |
1,083,177 | 1,529,383 | ||||||
| General and administrative |
1,413,842 | 1,181,569 | ||||||
|
|
|
|
|
|||||
| Total |
2,497,019 | 2,710,952 | ||||||
|
|
|
|
|
|||||
| Loss before interest and state tax expense |
(3,858,307 | ) | (3,257,229 | ) | ||||
|
|
|
|
|
|||||
| Other income (expense) |
||||||||
| Interest expense |
(1,896,590 | ) | (1,524,689 | ) | ||||
| Other income |
487,979 | — | ||||||
|
|
|
|
|
|||||
| (1,408,611 | ) | (1,524,689 | ) | |||||
|
|
|
|
|
|||||
| Loss before state tax expense |
(5,266,918 | ) | (4,781,918 | ) | ||||
| State tax expense |
9,292 | 2,570 | ||||||
|
|
|
|
|
|||||
| Net loss |
$ | (5,276,210 | ) | $ | (4,784,488 | ) | ||
|
|
|
|
|
|||||
See accompanying notes and independent accountant’s review report.
F-63
Table of Contents
Statements of Members’ Equity (Deficit)
Nine Months Ended September 30, 2014 and 2013
| Class A | Class B | Class C | Accumulated Deficit |
Total | ||||||||||||||||
| Balance—January 1, 2013 |
427,005 | 9,677,100 | — | $ | (32,102,718 | ) | $ | (21,998,613 | ) | |||||||||||
| Net income (loss) |
— | — | — | (4,784,488 | ) | (4,784,488 | ) | |||||||||||||
| Contributions |
— | — | — | — | — | |||||||||||||||
| Distributions |
— | — | — | — | — | |||||||||||||||
|
|
|
|
|
|
|
|
|
|
|
|||||||||||
| Balance—September 30, 2013 |
427,005 | 9,677,100 | — | (36,887,206 | ) | (26,783,101 | ) | |||||||||||||
|
|
|
|
|
|
|
|
|
|
|
|||||||||||
| Balance—January 1, 2014 |
427,005 | 9,677,100 | — | (38,618,182 | ) | (28,514,077 | ) | |||||||||||||
| Net income (loss) |
— | — | — | (5,276,210 | ) | (5,276,210 | ) | |||||||||||||
| Contributions |
— | — | — | — | — | |||||||||||||||
| Distributions |
— | — | — | (167,500 | ) | (167,500 | ) | |||||||||||||
|
|
|
|
|
|
|
|
|
|
|
|||||||||||
| Balance-September 30, 2014 |
427,005 | 9,677,100 | — | $ | (44,061,892 | ) | (33,957,787 | ) | ||||||||||||
|
|
|
|
|
|
|
|
|
|
|
|||||||||||
See accompanying notes and independent accountant’s review report.
F-64
Table of Contents
Statements of Cash Flows
Nine Months Ended September 30, 2014 and 2013
| 2014 | 2013 | |||||||
| Cash flows from operating activities |
||||||||
| Net (loss) |
$ | (5,276,210 | ) | $ | (4,784,488 | ) | ||
| Adjustments to reconcile net (loss) to net cash used by operating activities |
||||||||
| Depreciation |
18,225 | 20,508 | ||||||
| Other income |
(487,979 | ) | — | |||||
| (Increase) decrease in: |
||||||||
| Accounts receivable |
(253,170 | ) | (105,423 | ) | ||||
| Prepaid expenses and other current assets |
(11,524 | ) | (1,178 | ) | ||||
| Security deposits |
(12,225 | ) | (5,100 | ) | ||||
| Increase (decrease) in: |
||||||||
| Accounts payable |
80,550 | 144,741 | ||||||
| Accrued expenses and other current liabilities |
1,873,712 | 1,484,472 | ||||||
| Deferred revenue |
477,948 | 213,981 | ||||||
|
|
|
|
|
|||||
| Net cash used by operating activities |
(3,590,673 | ) | (3,032,487 | ) | ||||
|
|
|
|
|
|||||
| Cash flows from investing activities |
||||||||
| Acquisition of equipment |
(55,842 | ) | (20,306 | ) | ||||
|
|
|
|
|
|||||
| Net cash used by investing activities |
(55,842 | ) | (20,306 | ) | ||||
|
|
|
|
|
|||||
| Cash flows from financing activities |
||||||||
| Proceeds from notes payable |
3,825,000 | 3,025,000 | ||||||
| Repayment of loans payable |
(250,000 | ) | — | |||||
| Member distributions |
(25,000 | ) | — | |||||
|
|
|
|
|
|||||
| Net cash provided by financing activities |
3,550,000 | 3,025,000 | ||||||
|
|
|
|
|
|||||
| Net decrease in cash |
(96,515 | ) | (27,793 | ) | ||||
| Cash at beginning of year |
116,178 | 87,479 | ||||||
|
|
|
|
|
|||||
| Cash at end of September 2014 and 2013 |
$ | 19,663 | $ | 59,686 | ||||
|
|
|
|
|
|||||
| Supplemental disclosures |
||||||||
| Interest paid |
$ | — | $ | — | ||||
|
|
|
|
|
|||||
| Income taxes paid |
$ | 9,292 | $ | 3,024 | ||||
|
|
|
|
|
|||||
See accompanying notes and independent accountant’s review report.
F-65
Table of Contents
Notes to Financial Statements
September 30, 2014 and 2013
Note 1—Nature of Operations and Summary of Significant Accounting Policies
Nature of Operations
Nixle LLC (Nixle), organized in New Jersey on January 15, 2007, originally under the name “Rockstar Media LLC” to develop, market and operate an information exchange system. The Members of Rockstar Media agreed to change the name to Nixle LLC under an “Amended and Restated Operating Agreement” to coincide with the product name.
Nixle designs, develops and services secure communications systems. The systems let government agencies and other users simultaneously exchange information with residents. Its products, (1) Nixle Connect is a free notification service provided to registered police departments allowing them to connect with residents by text message, e-mail and the internet. (2) Nixle Engage, Nixle 360, and Nixle Connect for Schools are enhanced versions of the Nixle Connect system, offering users registered under paid subscription plans, the ability to participate in the real-time exchange of information with the public.
Summary of Significant Accounting Policies
Estimates
The preparation of financial statements in conformity with generally accepted accounting principles (GAAP) requires management to make estimates and assumptions that affect certain reported amounts and disclosures. Actual results could differ from those estimates.
Cash Equivalents
For the purpose of the statement of cash flows short term investments maturing in three months or less are considered cash equivalents. Nixle had no investments considered cash equivalents at September 30, 2014 and 2013.
Accounts Receivable
Accounts receivable are uncollateralized and non-interest bearing amounts Nixle expects to collect from its customers.
Equipment
Equipment is stated at cost. Depreciation is recorded using straight-line and accelerated methods over the estimated useful life of the equipment (3 to 7 years). Costs for maintenance and repairs are expensed as incurred.
Software Development Costs
Nixle internally develops and acquires software that it uses in providing services to its customers. Nixle accounts for costs of developing software according to Financial Accounting Standards Board (FASB) Accounting Standards Codification (“ASC”) 985-20 “Costs of Software to Be Sold, Leased, or Marketed.” Under ASC 985-20 costs for developing software to be sold, licensed or marketed are expensed until technological feasibility is established. When technological feasibility is reached capitalization of costs begins. Capitalization of costs ends and amortization begins when the application is available for release to customers.
Nixle recognizes technological feasibility when a working model is completed. Under this approach after successful internal quality assurance testing is performed the application is released to the subscriber base or market place. If changes are needed after the software is released Nixle takes care of it in later versions of the product. Modifications made during customer support services or while performing maintenance are expensed. Costs qualifying for capitalization between establishing technological feasibility and introducing the product to the market are minimal and thus expensed as incurred.
F-66
Table of Contents
Capital Accounts
Individual capital accounts are increased by cash investments or the fair market value of property contributed and the distributive shares of profits and separately allocated items of income or gain.
Capital accounts are decreased by cash distributions or the book value of property distributed and the distributive share of losses and separately allocated items of expense or loss. Allocations of losses or deductions that would result in a deficit capital account balance are prohibited as losses are limited to each member’s capital investment.
Revenue Recognition
Nixle earns revenue by providing premium services mostly under one year subscription agreements with customers. Revenue earned under subscription agreements is billed to and due by the customer prior to Nixle granting them access to service. Revenue is recognized over the term of the agreement. Unearned revenue for subscriptions still in effect at the end of a period are included as a liability in deferred revenue.
Financial Instruments
All financial instruments are carried at amounts that approximate fair value.
Advertising
Nixle expenses advertising costs when incurred. Nixle expensed advertising costs of $50,435 and $80,568 during the nine months ended September 30, 2014 and 2013, respectively.
Income Taxes
Nixle was formed as a Limited Liability Company (LLC) electing to be taxed as a partnership under the Internal Revenue Code and applicable state laws. As a partnership, profits and losses pass through to the members and profits are taxed at the individual rather than the partnership level. Accordingly, Nixle has no tax liability, although distributions to members for personal income taxes incurred on partnership profits may be made during the year.
When reporting net income or loss on its tax return, Nixle accounts for certain transactions according to methods required by law. As a result, the net income or loss and members’ capital balances reported on the tax return are usually different from those amounts reported in the financial statements.
Uncertain Tax Positions
Nixle is required to identify, measure, and disclose in the financial statements uncertain tax positions Management takes or expects to take when filing the partnership return. At September 30, 2014 and 2013 Nixle had no uncertain tax positions requiring disclosure. Tax positions taken on partnership returns may be rejected by taxing authorities and result in tax, penalty or interest charges to Nixle or its members.
Tax returns are subject to examination by Federal and State authorities for three years from the date of filing. Nixle’s Federal and State tax returns for 2010, 2011 and 2012 are open to examination by the Internal Revenue Service, New Jersey and other state agencies.
Note 2—Going Concern and Uncertainties
Going Concern
Nixle has reported net losses since inception and an accumulated deficit of $33,957,787. Nixle is unable to pay back debt of $32,870,643, and current liabilities exceed current assets by $12,612,659. Nixle’s financial statements are prepared on a going concern basis, which assumes the business operates without threat of liquidation for at least twelve months from the date that the financial statements were available to be issued.
F-67
Table of Contents
Cash Flow and Funding
Nixle is unable to generate cash flow sufficient to fund operations under its current subscription agreements and service model. As a result Nixle is dependent on an “Angel Investor” to subsidize operations. This funding may end or significantly decrease at any time.
Management’s Plans
Management is working on plans to sell substantially all of Nixle’s assets including accounts receivable, customers, software, Nixle’s name and website, subscribers and other assets for cash and stock according to an asset purchase agreement (APA) with a buyer. After a successfully negotiated APA, Management plans to change Nixle’s name to NXL Holdings. NXL Holdings (a/k/a Nixle) will transfer its assets to the buyer and discontinue all software development projects and public notification services, terminate all employees and restructure the business to operate as a holding company with cash, investment in stock, and debt.
Uncertainties
Funding provided to Nixle by an Angel Investor is winding down. Management is using cash for paying professionals representing Nixle on a sale of its assets, restructuring and to settle claims by two former members. The future of NXL Holdings (a/k/a Nixle) to continue as a going concern will be largely dependent on the final proceeds NXL Holdings (a/k/a Nixle) realizes from the fulfillment of the terms of an APA. However, even if Management is successful in its efforts to sell assets and restructure operations too many variables exist that may affect the results of Management’s plans.
Nixle’s future depends on whether the buyer of its assets achieves success in an initial public offering (IPO) and meets the terms of an APA in effect with Nixle at the time. Due to the uncertainty of the outcome of Management’s plans and risks associated with debt obligations and individual members’ investments on Nixle’s books there remains a substantial doubt about Nixle’s ability to continue as a going concern.
The financial statements do not include any adjustments that may be necessary if Nixle is unable to continue as a going concern.
Note 3—Equipment
Equipment consists of the following at September 30:
| 2014 | 2013 | |||||||
| Computer software |
$ | 289,652 | $ | 289,652 | ||||
| Furniture and fixtures |
71,713 | 62,568 | ||||||
| Equipment |
445,354 | 385,296 | ||||||
|
|
|
|
|
|||||
| Total |
806,719 | 737,516 | ||||||
| Less: accumulated depreciation and amortization |
(733,100 | ) | (698,842 | ) | ||||
|
|
|
|
|
|||||
| $ | 73,619 | $ | 38,674 | |||||
|
|
|
|
|
|||||
Depreciation expense for the nine months ended September 30, 2014 and 2013 was $18,225 and $20,508, respectively.
F-68
Table of Contents
Note 4—Accrued Expenses
Accrued expenses consists of the following at September 30:
| 2014 | 2013 | |||||||
| Due to customer—overpayments |
$ | 6,090 | $ | 6,090 | ||||
| Payroll taxes |
5,257 | 1,752 | ||||||
| Licensing and consulting fees |
55,000 | 60,000 | ||||||
| Accrued interest |
7,043,053 | 4,676,432 | ||||||
|
|
|
|
|
|||||
| $ | 7,109,400 | $ | 4,744,274 | |||||
|
|
|
|
|
|||||
Note 5—Long-Term Debt
Loans Payable
Nixle has loans payable of $755,000 ($1,255,000 at September 30, 2013) to five (six at September 30, 2013) individuals, loaned during the years ended 2007 to 2010 under verbal agreements. Nixle computes simple interest accrued of $190,914 ($233,864 at September 30, 2013) on the principal balance at 5.25%. Nixle considers the balances outstanding to be long-term obligations because repayment is not expected to occur within one year.
Note Payable—11.25%
11.25% Secured Convertible Promissory Note
On October 1, 2010 Nixle and the Angel Investor (Holder) executed a “Secured Convertible Promissory Note Agreement” (Note A) for $7,384,594 as a result of a loan restructure for amounts loaned to Nixle between January 2008 and September 2010. The Holder of Note A is entitled to convert all or part of the outstanding principal and accrued interest into Class B Units at a pre-determined conversion price using a $17.5 million valuation of Nixle.
Note A has accrued interest of $3,592,008 ($2,424,238 at September 30, 2013) accruing daily at an annual rate of 11.25% through October 1, 2015 and is collateralized by a first priority security interest in all of Nixle’s assets.
Note Payable—8%
8% Secured Convertible Promissory Note
On March 31, 2011 Nixle executed a $1,800,000 Secured Convertible Promissory Note Agreement (Note B) with the Angel Investor. Advances made to Nixle during the period increase the principal of Note B. Accrued simple interest of $2,454,228 ($1,308,327 at September 30, 2013) is calculated at 8% on the outstanding principal balance bi-annually and each time an advance is made and the principal balance changes. Note B was due June 30, 2012, but will continue in effect until another note agreement is executed. The balance outstanding on Note B is $16,915,000 and 12,040,000 at September 30, 2014 and 2013 respectively.
Convertible Promissory Notes
Nixle authorized the issuance and sale of Convertible Promissory Notes (the Convertible Notes) up to $5,500,000 in a private offering with each principal unit convertible into one Class B Unit at a price equal to the principal amount subscribed. Upon written notice, holders of the Convertible Notes are entitled to exchange all or part of the outstanding principal and accrued interest into Class B Units each at a price of $14 (the “Conversion Price”). With 30 days of advance written notice Nixle (the Borrower) has the right to convert all or part of the outstanding principal and accrued interest into Class B Units at the “Conversion Price.”
F-69
Table of Contents
The Convertible Notes accrue interest daily at an annual rate of 8.0%. Details of Convertible Notes outstanding at September 30, 2014 and 2013 are listed below.
| 2014 | 2013 | |||||||
| 8% Convertible Note (Note C) dated October 27, 2010 issued under an agreement with the Angel Investor in exchange for debt, maturing October 26, 2015. Accrued interest at September 30, 2014 and 2013 is $223,885 and $136,500, respectively. |
$ | 700,000 | $ | 700,000 | ||||
| 8% Convertible Note (Note D) dated November 9, 2010, issued under an agreement with a partnership in exchange for cash, maturing November 8, 2015. Accrued interest at September 30, 2014 and 2013 is $155,000 and $105,000, respectively. |
500,000 | 500,000 | ||||||
|
|
|
|
|
|||||
| Total |
$ | 1,200,000 | $ | 1,200,000 | ||||
|
|
|
|
|
|||||
Long-term debt maturing during the periods ending September 30, 2014 is as follows:
| Period Ending September 30 |
Amount Maturing | |||
| 2015 |
$ | — | ||
| 2016 |
8,157,590 | |||
| 2017 |
— | |||
| 2018 |
— | |||
| 2019 |
— | |||
| Thereafter |
755,000 | |||
|
|
|
|||
| $ | 8,912,590 | |||
|
|
|
|||
Note 6—Equity
Membership Units
Equity interests in the membership of Nixle are identified by Units. Each member’s percentage ownership in Nixle is determined by dividing the number of Units owned by the total number of Units issued. Membership Units are broken down into three classes that carry different member rights. No member has the right to act for, on behalf of, or bind Nixle other than the members of the Management Committee.
Class A Units
Class A Units carry rights to purchase Units from a selling member after a first offer is made to purchase Nixle, and drag along rights in connection with the sale of all Nixle Units as indicated in the Agreement. Class A members rank second to receive distributions of net ordinary and capital proceeds until capital contributions reach zero.
There are 943,169 Class A Units issued at September 30, 2014 and 2013.
Class A Units were originally issued to and held by two individuals who were the founders and original managers of Nixle. In two separate “Membership Interest Pledge Agreements both dated October 1, 2010” these individuals pledged their Class A Units to collateralize the 11.25% Note (Note 5). On September 9, 2011 after the 11.25% Note was defaulted on, the Majority Investor accepted the collateral in satisfaction of outstanding interest payments owed to him.
Class B Units
Class B Units are issued in exchange for capital contributions. Class B unit holders rank first to receive distributions of net ordinary proceeds and net capital proceeds until capital contributions are reduced to zero.
There are 606,755 Class B Units issued at September 30, 2014 and 2013.
F-70
Table of Contents
Class C Units
Class C Units are issued in exchange for services rendered to Nixle. Class C Units have a liquidation value of zero when issued and constitute “Profits Interests” in accordance with the provisions of Revenue Procedure 93-27. Class C Units are subject to vesting and forfeiture provisions set forth in separate agreements between Nixle and each Class C Unit Member.
There are 225,183 Class C Units issued and 193,614 Class C Units vested at September 30, 2014 and 2013.
Note 7—Warrants and Options
Management, has the authority to issue warrants, options or other instruments to purchase Units.
On December 16, 2010 a Warrant was issued to the Angel Investor in exchange for value received. The warrant is exercisable in whole or in part and entitles the holder to purchase 150,000 Class B Units at $7.01 each until December 16, 2015.
Note 8—Retirement Plan
Effective October 1, 2011 Nixle provides retirement benefits through the Nixle 401(k) Plan (the Plan). The Plan allows eligible employees over 18 years of age to defer a portion of their compensation under Section 401(k) of the Internal Revenue Code. The Plan provides Management with a discretionary matching option, allowing Nixle to contribute and allocate to each eligible employees’ account a percentage of their elective deferrals as determined at the end of each Plan year. Nixle made no contribution to the Plan during the nine months ended September 30, 2014 and 2013.
Note 9—Other Income
Other income of $487,979 includes cancellation of debt of $345,479 and insurance proceeds paid directly to claimants of $142,500 incurred in settling two claims during the period ended September 30, 2014.
Note 10—Operating Leases
Nixle rents office space in San Francisco, California under an amended operating lease agreement effective February 14, 2013 to December 31, 2014. Monthly rent expense is $12,000 plus utility charges. For the nine months ended September 30, 2014 and 2013, rent expense was $121,578 and $104,782, respectively.
Nixle pays $149 a month to rent storage space in San Francisco, California under an agreement which could be cancelled at any time.
Following is a schedule by year of approximate future minimum lease payments required under the above operating lease agreements that have remaining noncancelable lease terms as of September 30:
| Period ending September 30, |
Payment | |||
| 2015 |
$ | 36,000 | ||
| Thereafter |
— | |||
|
|
|
|||
| Total |
$ | 36,000 | ||
|
|
|
|||
Note 11—Noncash Transactions
Nixle recognized other income of $487,979 in a noncash transaction as follows:
| Insurance payments directly to claimants |
$ | 142,500 | ||
| Settlement of debt by claimants |
345,479 |
F-71
Table of Contents
Note 12—Risks and Uncertainties
Concentration of Credit Risk
Nixle, at times, maintains cash balances in financial institutions that are in excess of the $250,000 insurance provided by the Federal Deposit Insurance Corporation (FDIC). At September 30, 2013 Nixle’s cash balances did not exceed the FDIC limits. Nixle has not experienced any loss on its cash or cash equivalents. Management believes any significant credit risk on Nixle’s deposits in financial institutions is minimal.
Competition
The market for Nixle’s products and services is highly competitive and the technology is subject to shifts in market preferences. There exists a risk that Nixle’s financial condition and results of operations could be negatively affected if market preferences shift.
Note 13—Licensing Agreement
Nixle entered into a new licensing agreement effective January 1, 2014 with a telecommunications firm, Shoutpoint, for voice applications solutions. The agreement is standard for one year, automatically renewing each January 1 successively, for two more years unless cancelled with 30 days advance notice. The base licensing fee is $45,000 per quarter with additional Price Per Minute (PPM) and Price Per Contact (PPC) charges. Beginning with the second annual term of the agreement, minimum pricing rules take effect. For the nine months ended September 30, 2014, Nixle paid $120,734 under its licensing agreement with Shoutpoint.
For the nine months ended September 30, 2013 Nixle paid $275,000 under its licensing agreement with Everbridge.
Note 14—Subsequent Events and Future Uncertainties
Management has evaluated subsequent events through July 15, 2015, the date the financial statements were available for release.
Subsequent to year end on December 23, 2014 the Director of Nixle entered into an Asset Purchase Agreement (APA) with its service provider – Everbridge. Under the terms of the APA, Everbridge, purchased substantially all of Nixles’s assets and a portion of accounts payable in exchange for cash and stock. Everbridge is planning an initial public offering (IPO) of its stock in late July 2015 and will include pro-forma financial information and other information related to the APA with Nixle.
The effects of Everbridge’s IPO on Nixle are highly speculative and impossible to determine, accordingly these financial statements contain no adjustments for events that may occur as a result of this subsequent event.
F-72
Table of Contents
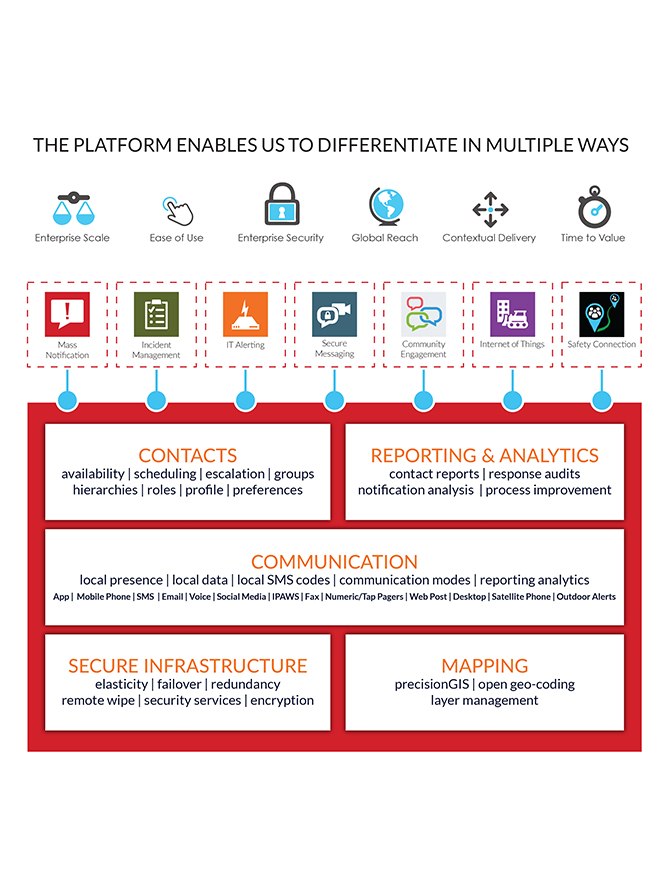
Table of Contents
Table of Contents
PART II
INFORMATION NOT REQUIRED IN PROSPECTUS
| Item 13. | Other Expenses of Issuance and Distribution. |
The following table sets forth all costs and expenses, other than underwriting discounts and commissions, payable by us in connection with the sale of the common stock being registered. All amounts shown are estimates except for the SEC registration fee and the FINRA filing fee.
| Amount to be Paid |
||||
| SEC registration fee |
$ | * | ||
| FINRA filing fee |
14,000 | |||
| NASDAQ Global Market initial listing fee |
125,000 | |||
| Blue sky fees and expenses |
* | |||
| Printing and engraving |
* | |||
| Legal fees and expenses |
* | |||
| Accounting fees and expenses |
* | |||
| Transfer agent and registrar fees |
* | |||
| Miscellaneous fees and expenses |
* | |||
|
|
|
|||
| Total |
* | |||
|
|
|
|||
| * | To be filed by amendment. |
| Item 14. | Indemnification of Directors and Officers. |
We are incorporated under the laws of the State of Delaware. Section 102 of the Delaware General Corporation Law permits a corporation to eliminate the personal liability of directors of a corporation to the corporation or its stockholders for monetary damages for a breach of fiduciary duty as a director, except where the director breached his or her duty of loyalty, failed to act in good faith, engaged in intentional misconduct or knowingly violated a law, authorized the payment of a dividend or approved a stock repurchase in violation of Delaware corporate law or obtained an improper personal benefit.
Section 145 of the Delaware General Corporation Law provides that a corporation has the power to indemnify a director, officer, employee or agent of the corporation and certain other persons serving at the request of the corporation in related capacities against expenses (including attorneys’ fees), judgments, fines and amounts paid in settlements actually and reasonably incurred by the person in connection with an action, suit or proceeding to which he is or is threatened to be made a party by reason of such position, if such person acted in good faith and in a manner he reasonably believed to be in or not opposed to the best interests of the corporation, and, in any criminal action or proceeding, had no reasonable cause to believe his or her conduct was unlawful, except that, in the case of actions brought by or in the right of the corporation, no indemnification shall be made with respect to any claim, issue or matter as to which such person shall have been adjudged to be liable to the corporation unless and only to the extent that the Court of Chancery or other adjudicating court determines that, despite the adjudication of liability but in view of all of the circumstances of the case, such person is fairly and reasonably entitled to indemnity for such expenses which the Court of Chancery or such other court shall deem proper.
As permitted by the Delaware General Corporation Law, our amended and restated certificate of incorporation and amended and restated bylaws will provide that: (1) we are required to indemnify our directors to the fullest extent permitted by the Delaware General Corporation Law; (2) we may, in our discretion, indemnify our officers, employees and agents as set forth in the Delaware General Corporation Law; (3) we are required, upon satisfaction of certain conditions, to advance all expenses incurred by our directors in connection with certain legal proceedings; (4) the rights conferred in the bylaws are not exclusive; and (5) we are authorized to enter into indemnification agreements with our directors, officers, employees and agents.
II-1
Table of Contents
Our policy is to enter into agreements with our directors that require us to indemnify them against expenses, judgments, fines, settlements and other amounts that any such person becomes legally obligated to pay (including with respect to a derivative action) in connection with any proceeding, whether actual or threatened, to which such person may be made a party by reason of the fact that such person is or was a director or officer of us or any of our affiliates, provided such person acted in good faith and in a manner such person reasonably believed to be in, or not opposed to, our best interests. These indemnification agreements also set forth certain procedures that will apply in the event of a claim for indemnification thereunder. At present, no litigation or proceeding is pending that involves any of our directors or officers regarding which indemnification is sought, nor are we aware of any threatened litigation that may result in claims for indemnification.
We maintain a directors’ and officers’ liability insurance policy. The policy insures directors and officers against unindemnified losses arising from certain wrongful acts in their capacities as directors and officers and reimburses us for those losses for which we have lawfully indemnified the directors and officers. The policy contains various exclusions.
In addition, the underwriting agreement filed as Exhibit 1.1 to this registration statement provides for indemnification by the underwriters of us and our officers and directors for certain liabilities arising under the Securities Act, or otherwise. Our amended and restated investors’ rights agreement with certain stockholders also provides for cross-indemnification in connection with the registration of our common stock on behalf of such investors.
| Item 15. | Recent Sales of Unregistered Securities. |
The following list sets forth information regarding all unregistered securities issued by us since January 1, 2013 through the date of the prospectus that is a part of this registration statement:
Issuances of Common Stock and Options to Purchase Common Stock
From January 1, 2013 through the date of this registration statement, we have granted under our 2008 Plan options to purchase an aggregate of 11,543,100 shares of our common stock to employees, consultants and directors, having exercise prices ranging from $0.23 to $2.55 per share. Of these, options to purchase an aggregate of 1,183,373 shares have been cancelled without being exercised. From January 1, 2013 through the date of this registration statement, an aggregate of 4,421,710 shares of our common stock were issued upon the exercise of stock options under the 2008 Plan, at exercise prices between $0.09 and $1.63 per share.
The offers, sales and issuances of the securities described in the preceding paragraph were deemed to be exempt from registration under Rule 701 promulgated under the Securities Act, or Rule 701, in that the transactions were by an issuer not involving any public offering or under Section 4(a)(2) of the Securities Act or under compensatory benefit plans and contracts relating to compensation as provided under Rule 701. The recipients of such securities were our employees, directors or consultants and received the securities under our equity incentive plans. Appropriate legends were affixed to the securities issued in these transactions.
In March 2014, we issued an aggregate of 2,252,451 shares of our common stock to certain stockholders of Vocal Limited in connection with our acquisition of Vocal Limited.
In July 2014, we issued 107,758 shares of common stock to PMC Financial Services Group, LLC upon the exercise of a warrant to purchase shares of common stock.
In December 2014, we issued an aggregate of 693,140 shares of our common stock to Tapestry Telemed LLC in connection with our purchase of certain technology from Tapestry Telemed LLC.
In December 2014, we issued an aggregate of 1,858,275 shares of our common stock to Nixle, LLC in connection with our acquisition of substantially all of the assets of Nixle, LLC.
II-2
Table of Contents
In March 2015, we issued an aggregate of 34,657 shares of our common stock to certain former members of Tapestry Telemed LLC in connection with our purchase of certain technology from Tapestry Telemed LLC in December 2014.
The offers, sales and issuances of the securities described in the preceding paragraphs were deemed to be exempt from registration under the Securities Act in reliance on Section 4(a)(2) of the Securities Act or Rule 506 of Regulation D promulgated thereunder as a transaction by an issuer not involving a public offering. The recipients of securities in each of these transactions acquired the securities for investment only and not with a view to or for sale in connection with any distribution thereof, and appropriate legends were affixed to the securities issued in these transactions. Each of the recipients of securities in these transactions was either an accredited investor within the meaning of Rule 501 of Regulation D under the Securities Act or had adequate access, through employment, business or other relationships, to information about us.
| Item 16. | Exhibits and Financial Statement Schedules. |
(a) Exhibits
| Exhibit Number |
Description of Document | |
| 1.1† | Form of Underwriting Agreement. | |
| 3.1 | Third Amended and Restated Certificate of Incorporation of Everbridge, Inc., as amended and as currently in effect. | |
| 3.2 | Form of Amended and Restated Certificate of Incorporation of Everbridge, Inc. to be effective upon completion of this offering. | |
| 3.3 | Amended and Restated Bylaws of Everbridge, Inc., as currently in effect. | |
| 3.4 | Form of Amended and Restated Bylaws of Everbridge, Inc. to be effective upon completion of this offering. | |
| 4.1† | Form of common stock certificate of Everbridge, Inc. | |
| 4.2 | Third Amended and Restated Investors’ Rights Agreement by and among Everbridge, Inc. and certain of its stockholders, dated September 9, 2011. | |
| 5.1† | Opinion of Cooley LLP. | |
| 10.1 | Sublease Agreement, dated as of March 30, 2016, by and between Everbridge, Inc. and Jacobs Engineering Group, Inc. | |
| 10.2 | Sublease Agreement, dated as of February 27, 2015, by and between Everbridge, Inc. and Acquia Inc. | |
| 10.3+ | 2008 Equity Incentive Plan, as amended and as currently in effect, and Forms of Stock Option Agreement and Notice of Exercise thereunder. | |
| 10.4+† | Form of 2016 Equity Incentive Plan and Forms of Stock Option Agreement, Notice of Exercise and Stock Option Grant Notice thereunder. | |
| 10.5+† | 2016 Employee Stock Purchase Plan. | |
| 10.6+† | Non-Employee Director Compensation Plan to be in effect upon the completion of this offering. | |
| 10.7+ | 2015 Bonus Plan of Everbridge, Inc. | |
| 10.8+ | 2016 Bonus Plan of Everbridge, Inc. | |
| 10.9+ | Form of Indemnification Agreement by and between Everbridge, Inc. and each of its directors and executive officers. | |
| 10.10+ | Offer Letter, dated as of September 6, 2011, by and between Everbridge, Inc. and Jaime Ellertson. | |
| 10.11+ | Offer Letter, dated as of April 13, 2015, by and between Everbridge, Inc. and Kenneth S. Goldman. | |
| 10.12+ | Employment Agreement, dated as of December 1, 2014, by and between Everbridge, Inc. and Nicholas Hawkins. | |
| 10.13+ | Offer Letter, dated as of October 6, 2013, by and between Everbridge, Inc. and Scott Burnett. | |
| 10.14+ | Offer Letter, dated as of July 27, 2012, by and between Everbridge, Inc. and Gary Phillips. | |
| 10.15+ | Offer Letter, dated as of July 26, 2012, by and between Everbridge, Inc. and Imad Mouline. | |
| 10.16+ | Offer Letter, dated as of July 26, 2012, by and between Everbridge, Inc. and Yuan Cheng. |
II-3
Table of Contents
| Exhibit Number |
Description of Document | |
| 10.17+ | Offer Letter, dated as of October 12, 2015, by and between Everbridge, Inc. and Elliot J. Mark. | |
| 10.18+ | Offer Letter, dated as of January 11, 2016, by and between Everbridge, Inc. and Joel Rosen. | |
| 10.19 | Loan and Security Agreement, dated as of June 30, 2015, by and between Everbridge, Inc. and Western Alliance Bank, as amended. | |
| 21.1 | Subsidiaries of Everbridge, Inc. | |
| 23.1 | Consent of KPMG LLP, independent registered public accounting firm. | |
| 23.2 | Consent of Werdann Devito LLC, independent accounting firm. | |
| 23.3† | Consent of Cooley LLP (included in Exhibit 5.1). | |
| 23.4 | Consent of Frost & Sullivan. | |
| 23.5 | Consent of Markets and Markets. | |
| 24.1 | Power of Attorney. Reference is made to the signature page hereto. |
| † | To be filed by amendment. |
| + | Indicates management contract or compensatory plan. |
(b) Financial Statement Schedules
Schedules not listed above have been omitted because the information required to be set forth therein is not applicable or is shown in the financial statements or notes thereto.
| Item 17. | Undertakings. |
The undersigned Registrant hereby undertakes to provide to the underwriters at the closing specified in the underwriting agreement, certificates in such denominations and registered in such names as required by the underwriters to permit prompt delivery to each purchaser.
Insofar as indemnification for liabilities arising under the Securities Act may be permitted to directors, officers and controlling persons of the registrant pursuant to the foregoing provisions, or otherwise, the registrant has been advised that in the opinion of the Securities and Exchange Commission such indemnification is against public policy as expressed in the Securities Act and is, therefore, unenforceable. In the event that a claim for indemnification against such liabilities (other than the payment by the registrant of expenses incurred or paid by a director, officer or controlling person of the registrant in the successful defense of any action, suit or proceeding) is asserted by such director, officer or controlling person in connection with the securities being registered, the registrant will, unless in the opinion of its counsel the matter has been settled by controlling precedent, submit to a court of appropriate jurisdiction the question whether such indemnification by it is against public policy as expressed in the Securities Act and will be governed by the final adjudication of such issue.
The undersigned registrant hereby undertakes that:
(1) For purposes of determining any liability under the Securities Act, the information omitted from the form of prospectus filed as part of this Registration Statement in reliance upon Rule 430A and contained in a form of prospectus filed by the registrant pursuant to Rule 424(b)(1) or (4) or 497(h) under the Securities Act shall be deemed to be part of this Registration Statement as of the time it was declared effective.
(2) For the purpose of determining any liability under the Securities Act, each post-effective amendment that contains a form of prospectus shall be deemed to be a new registration statement relating to the securities offered therein, and the offering of such securities at that time shall be deemed to be the initial bona fide offering thereof.
II-4
Table of Contents
SIGNATURES
Pursuant to the requirements of the Securities Act of 1933, as amended, the Registrant has duly caused this Registration Statement to be signed on its behalf by the undersigned, thereunto duly authorized, in Burlington, Massachusetts, on the 19th day of August, 2016.
| EVERBRIDGE, INC. | ||
| /s/ Jaime Ellertson | ||
| Jaime Ellertson President, Chief Executive
Officer and Chairman |
KNOW ALL BY THESE PRESENTS, that each person whose signature appears below hereby constitutes and appoints Jaime Ellertson, Kenneth S. Goldman and Elliot J. Mark, and each of them, his true and lawful agent, proxy and attorney-in-fact, with full power of substitution and resubstitution, for him and in his name, place and stead, in any and all capacities, to (1) act on, sign and file with the Securities and Exchange Commission any and all amendments (including post-effective amendments) to this registration statement together with all schedules and exhibits thereto and any subsequent registration statement filed pursuant to Rule 462(b) under the Securities Act of 1933, as amended, together with all schedules and exhibits thereto, (2) act on, sign and file such certificates, instruments, agreements and other documents as may be necessary or appropriate in connection therewith, (3) act on and file any supplement to any prospectus included in this registration statement or any such amendment or any subsequent registration statement filed pursuant to Rule 462(b) under the Securities Act of 1933, as amended, and (4) take any and all actions which may be necessary or appropriate to be done, as fully for all intents and purposes as he might or could do in person, hereby approving, ratifying and confirming all that such agent, proxy and attorney-in-fact or any of his substitutes may lawfully do or cause to be done by virtue thereof.
Pursuant to the requirements of the Securities Act of 1933, as amended, this Registration Statement has been signed by the following persons in the capacities and on the dates indicated.
| Signature |
Title |
Date | ||||
| /s/ Jaime Ellertson Jaime Ellertson |
President, Chief Executive Officer and Chairman of the Board of Directors (Principal Executive Officer) |
August 19, 2016 | ||||
| /s/ Kenneth S. Goldman Kenneth S. Goldman |
Senior Vice President and Chief Financial Officer (Principal Financial Officer and Principal Accounting Officer) |
August 19, 2016 | ||||
| /s/ Richard D’Amore Richard D’Amore |
Director | August 19, 2016 | ||||
| /s/ Bruns Grayson Bruns Grayson |
Director | August 19, 2016 | ||||
| /s/ David Henshall David Henshall |
Director | August 19, 2016 | ||||
| /s/ Kent Mathy Kent Mathy |
Director | August 19, 2016 | ||||
| /s/ Cinta Putra Cinta Putra |
Director | August 19, 2016 | ||||
Table of Contents
EXHIBIT INDEX
| Exhibit Number |
Description of Document | |
| 1.1† | Form of Underwriting Agreement. | |
| 3.1 | Third Amended and Restated Certificate of Incorporation of Everbridge, Inc., as amended and as currently in effect. | |
| 3.2 | Form of Amended and Restated Certificate of Incorporation of Everbridge, Inc. to be effective upon completion of this offering. | |
| 3.3 | Amended and Restated Bylaws of Everbridge, Inc., as currently in effect. | |
| 3.4 | Form of Amended and Restated Bylaws of Everbridge, Inc. to be effective upon completion of this offering. | |
| 4.1† | Form of common stock certificate of Everbridge, Inc. | |
| 4.2 | Third Amended and Restated Investors’ Rights Agreement by and among Everbridge, Inc. and certain of its stockholders, dated September 9, 2011. | |
| 5.1† | Opinion of Cooley LLP. | |
| 10.1 | Sublease Agreement, dated as of March 30, 2016, by and between Everbridge, Inc. and Jacobs Engineering Group Inc. | |
| 10.2 | Sublease Agreement, dated as of February 27, 2015, by and between Everbridge, Inc. and Acquia Inc. | |
| 10.3+ | 2008 Equity Incentive Plan, as amended and as currently in effect, and Forms of Stock Option Agreement and Notice of Exercise thereunder. | |
| 10.4+† | Form of 2016 Equity Incentive Plan and Forms of Stock Option Agreement, Notice of Exercise and Stock Option Grant Notice thereunder. | |
| 10.5+† | 2016 Employee Stock Purchase Plan. | |
| 10.6+† | Non-Employee Director Compensation Plan to be in effect upon the completion of this offering. | |
| 10.7+ | 2015 Bonus Plan of Everbridge, Inc. | |
| 10.8+ | 2016 Bonus Plan of Everbridge, Inc. | |
| 10.9+ | Form of Indemnification Agreement by and between Everbridge, Inc. and each of its directors and executive officers. | |
| 10.10+ | Offer Letter, dated as of September 6, 2011, by and between Everbridge, Inc. and Jaime Ellertson. | |
| 10.11+ | Offer Letter, dated as of April 13, 2015, by and between Everbridge, Inc. and Kenneth S. Goldman. | |
| 10.12+ | Employment Agreement, dated as of December 1, 2014, by and between Everbridge, Inc. and Nicholas Hawkins. | |
| 10.13+ | Offer Letter, dated as of October 6, 2013, by and between Everbridge, Inc. and Scott Burnett. | |
| 10.14+ | Offer Letter, dated as of July 27, 2012, by and between Everbridge, Inc. and Gary Phillips. | |
| 10.15+ | Offer Letter, dated as of July 26, 2012, by and between Everbridge, Inc. and Imad Mouline. | |
| 10.16+ | Offer Letter, dated as of July 26, 2012, by and between Everbridge, Inc. and Yuan Cheng. | |
| 10.17+ | Offer Letter, dated as of October 12, 2015, by and between Everbridge, Inc. and Elliot J. Mark. | |
| 10.18+ | Offer Letter, dated as of January 11, 2016, by and between Everbridge, Inc. and Joel Rosen. | |
| 10.19 | Loan and Security Agreement, dated as of June 30, 2015, by and between Everbridge, Inc. and Western Alliance Bank, as amended. | |
| 21.1 | Subsidiaries of Everbridge, Inc. | |
| 23.1 | Consent of KPMG LLP, independent registered public accounting firm. | |
| 23.2 | Consent of Werdann Devito LLC, independent accounting firm. | |
| 23.3† | Consent of Cooley LLP (included in Exhibit 5.1). | |
| 23.4 | Consent of Frost & Sullivan. | |
| 23.5 | Consent of Markets and Markets. | |
| 24.1 | Power of Attorney. Reference is made to the signature page hereto. |
| † | To be filed by amendment. |
| + | Indicates management contract or compensatory plan. |