Attached files
| file | filename |
|---|---|
| 8-K - 8-K - CRAWFORD & CO | crawford_081516x8-k.htm |
August 2016
Investor Presentation

2
• Forward-Looking Statements
—This presentation contains forward-looking statements, including statements about the expected future financial condition, results of operations and earnings outlook of Crawford &
Company. Statements, both qualitative and quantitative, that are not statements of historical fact may be "forward-looking statements" as defined in the Private Securities Litigation
Reform Act of 1995 and other securities laws. Forward-looking statements involve a number of risks and uncertainties that could cause actual results to differ materially from historical
experience or Crawford & Company's present expectations. Accordingly, no one should place undue reliance on forward-looking statements, which speak only as of the date on which
they are made. Crawford & Company does not undertake to update forward-looking statements to reflect the impact of circumstances or events that may arise or not arise after the
date the forward-looking statements are made. Results for any interim period presented herein are not necessarily indicative of results to be expected for the full year or for any other
future period. For further information regarding Crawford & Company, and the risks and uncertainties involved in forward-looking statements, please read Crawford & Company's
reports filed with the Securities and Exchange Commission and available at www.sec.gov or in the Investor Relations section of Crawford & Company's website at
www.crawfordandcompany.com.
—Crawford's business is dependent, to a significant extent, on case volumes. The Company cannot predict the future trend of case volumes for a number of reasons, including the fact
that the frequency and severity of weather-related claims and the occurrence of natural and man-made disasters, which are a significant source of cases and revenue for the Company,
are generally not subject to accurate forecasting.
• Revenues Before Reimbursements ("Revenues")
—Revenues Before Reimbursements are referred to as "Revenues" in both consolidated and segment charts, bullets and tables throughout this presentation.
• Segment and Consolidated Operating Earnings
—Under the Financial Accounting Standards Board's Accounting Standards Codification ("ASC") Topic 280, "Segment Reporting," the Company has defined segment operating earnings
as the primary measure used by the Company to evaluate the results of each of its four operating segments. Segment operating earnings exclude income taxes, interest expense,
amortization of customer-relationship intangible assets, goodwill impairment charges, restructuring and special charges, stock option expense, earnings or loss attributable to non-
controlling interests, and certain unallocated corporate and shared costs and credits. Consolidated operating earnings is the total of segment operating earnings and certain unallocated
and shared costs and credits.
• Earnings Per Share
—The Company's two classes of stock are substantially identical, except with respect to voting rights and the Company's ability to pay greater cash dividends on the non-voting Class A
Common Stock than on the voting Class B Common Stock, subject to certain limitations. In addition, with respect to mergers or similar transactions, holders of Class A Common Stock
must receive the same type and amount of consideration as holders of Class B Common Stock, unless different consideration is approved by the holders of 75% of the Class A Common
Stock, voting as a class.
—In certain periods, the Company has paid a higher dividend on CRDA than on CRDB. This may result in a different earnings per share ("EPS") for each class of stock due to the two-class
method of computing EPS as required by ASC Topic 260 - "Earnings Per Share". The two-class method is an earnings allocation method under which EPS is calculated for each class of
common stock considering both dividends declared and participation rights in undistributed earnings as if all such earnings had been distributed during the period.
• Non-GAAP Financial Information
—For additional information about certain non-GAAP financial information presented herein, see the Appendix following this presentation.
• Total Compensation
—”Total Compensation" includes compensation, payroll taxes, and benefits provided to the employees of the Company, as well as payments to outsourced service providers that
augment our staff. The difference between “Total Compensation” and the total of “Direct Compensation, Fringe Benefits & Non-Employee Labor” of our segments in our
“Management’s Discussion and Analysis” in our Form 10-Q and Form 10-K represents the compensation, payroll taxes and benefits and payment to outsourced service providers that
augment our staff for certain administrative functions performed by central headquarters staff that are included in “Expenses Other Than Direct Compensation, Fringe Benefits & Non-
Employee Labor” of our segments.
FORWARD-LOOKING STATEMENTS AND ADDITIONAL INFORMATION

3
OUR GLOBAL STRENGTH
$1.17 Billion
Revenue Company
70+ Countries 700+ Locations 8,900+
Employees
4
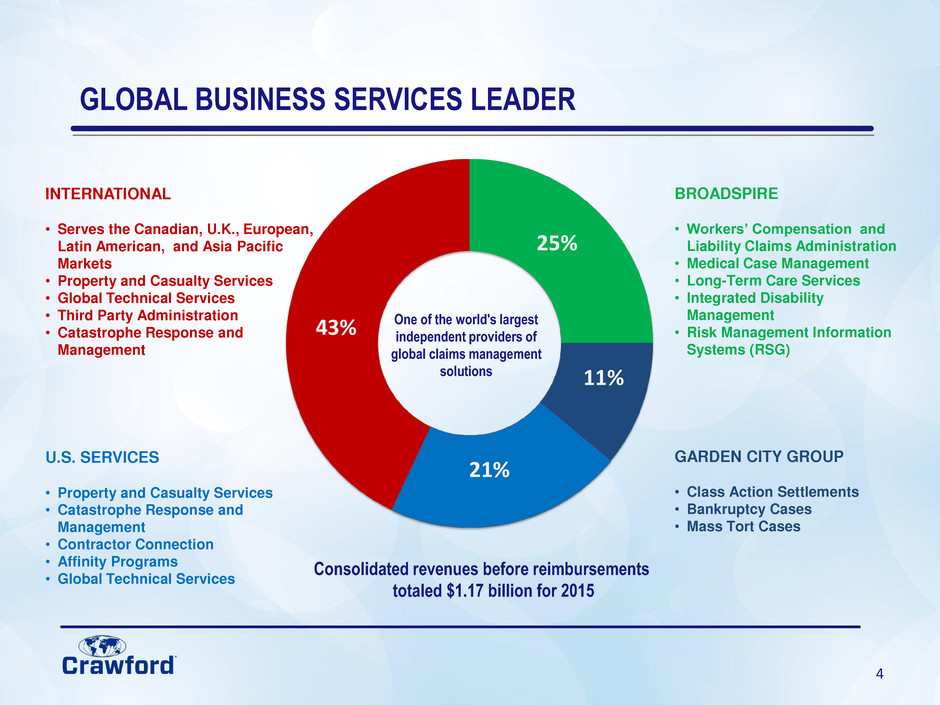
GLOBAL BUSINESS SERVICES LEADER
GARDEN CITY GROUP
• Class Action Settlements
• Bankruptcy Cases
• Mass Tort Cases
INTERNATIONAL
• Serves the Canadian, U.K., European,
Latin American, and Asia Pacific
Markets
• Property and Casualty Services
• Global Technical Services
• Third Party Administration
• Catastrophe Response and
Management
BROADSPIRE
• Workers’ Compensation and
Liability Claims Administration
• Medical Case Management
• Long-Term Care Services
• Integrated Disability
Management
• Risk Management Information
Systems (RSG)
U.S. SERVICES
• Property and Casualty Services
• Catastrophe Response and
Management
• Contractor Connection
• Affinity Programs
• Global Technical Services
Consolidated revenues before reimbursements
totaled $1.17 billion for 2015
One of the world's largest
independent providers of
global claims management
solutions
43%
25%
21%
11%

5
Experienced senior leadership team
Leading independent global claims management business
Instilling an entrepreneurial culture focused on cross selling and growth
Repositioning Crawford to deliver more predictable financial results
Utilizing technology and strategic outsourcing to improve operations and
reduce costs
Goal to deliver ongoing revenue growth beginning in 2017
INVESTMENT HIGHLIGHTS

6
EXECUTIVE MANAGEMENT
Harsha V. Agadi - President and Chief Executive Officer
• On June 21, 2016 Harsha Agadi was named President and CEO after serving as
Interim President and CEO since August 2015
• 30 years of experience in leadership positions at both public and private companies,
including several Fortune 500 companies
• Member of the Crawford Board of Directors since 2010
• Chairman of GHS Holdings, LLC, which has investments in restaurants, hospitality
and other related industries
• Serves on the Boards of Belmond Ltd. and Diversified Foodservice Supply, Inc.
Bruce Swain - EVP and Chief Financial Officer
• 30 years of experience in public and corporate accounting
• Held multiple positions during nearly 25 years at Crawford
• Has served as CFO since 2006
• CPA and a Chartered Global Management Accountant

7
• One of the world’s largest independent providers of claims management solutions
with an unparalleled competitive position and globally recognized brand
• Delivering complex solutions to clients when speed of execution matters
• Integrated approach to managing national and multinational claims programs
• Strong client focus, leadership, consultation and guidance
• Provides services to approximately half of the Fortune 500
• Crawford has helped clients with significant events with large insured losses,
including the following:
• Chilean Earthquake US$ 4.3 billion
• New Zealand Earthquake US$ 410 million
• Japanese Tsunami US$ 485 million
• Thai Floods US$ 3.9 billion
• Superstorm Sandy US$ 1.35 billion
GLOBAL CLAIMS BUSINESS

8
70.3%
68.9%
70.1% 70.1%
68.9%
67.1%
62.0%
64.0%
66.0%
68.0%
70.0%
Ratio of
T
o
ta
l
Com
p
e
ns
a
tion
to
Re
v
e
nue
s
Actual
VIGILANT EXPENSE CONTROL
• $45 million of total costs eliminated in 2015
• Further efficiency opportunities currently being explored
• Goal for total compensation to be under 63% of revenues
-Total Compensation" includes compensation, payroll taxes, and benefits provided to the employees of the Company, as well as payments
to outsourced service providers that augment our staff.
- All periods represent full year results, except for 2016 which is year to date through June 30th
Total Compensation to Revenues

9
0.00%
2.00%
4.00%
6.00%
8.00%
10.00%
12.00%
Q315 Q415 Q116 Q216
T
rai
lin
g
T
we
lv
e
M
o
n
th
N
o
n
-GAA
P
A
d
ju
st
ed
E
BI
T
D
A
M
ar
g
in
s
(1
)
DRIVING ADJUSTED EBITDA MARGIN EXPANSION
10.2%
9.2%
8.6%
• Goal to deliver predictable financial results while reducing weather dependence
10.9%
(1) See Appendix for non-GAAP explanation and reconciliation
Trailing Twelve Month Non-GAAP Adjusted EBITDA Margins (1)
10
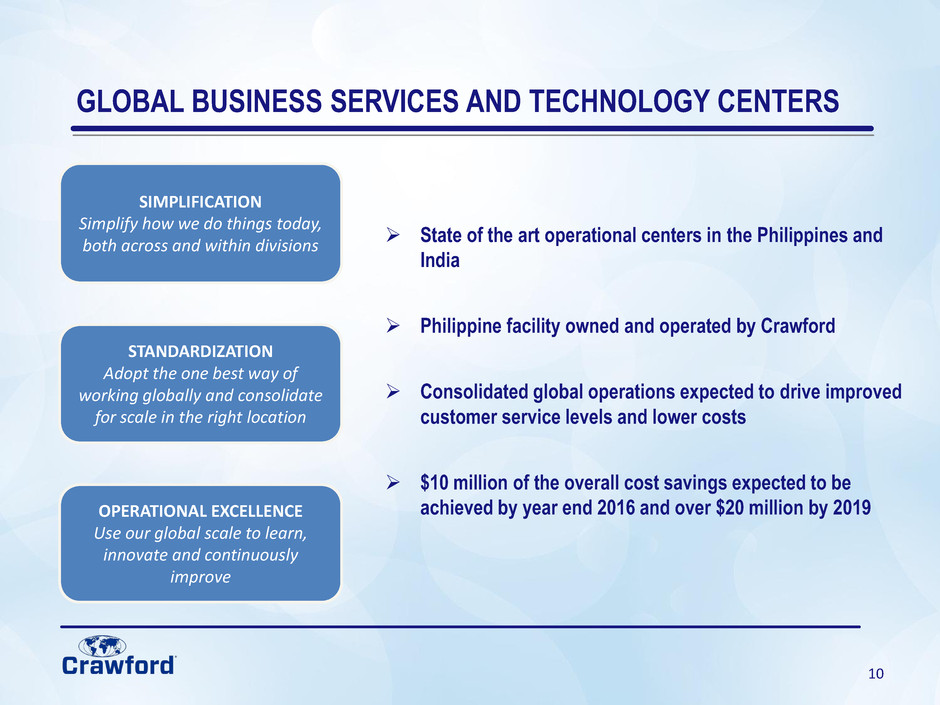
GLOBAL BUSINESS SERVICES AND TECHNOLOGY CENTERS
SIMPLIFICATION
Simplify how we do things today,
both across and within divisions
STANDARDIZATION
Adopt the one best way of
working globally and consolidate
for scale in the right location
OPERATIONAL EXCELLENCE
Use our global scale to learn,
innovate and continuously
improve
State of the art operational centers in the Philippines and
India
Philippine facility owned and operated by Crawford
Consolidated global operations expected to drive improved
customer service levels and lower costs
$10 million of the overall cost savings expected to be
achieved by year end 2016 and over $20 million by 2019

11
FOCUS ON DELIVERING REVENUE GROWTH
Continued expansion of
Contractor Connection
Broadspire’s re-entry into the
U.S. disability market
Global TPA opportunities
Growth in global high end claims
Capitalizing on cross selling
Multiple Avenues of Revenue Growth Available Globally

12
CONTRACTOR CONNECTION – NORTH AMERICA
A technology-enabled, best-in-class industry leader of contractor managed repair networks for
residential and commercial losses
• Network of 5,500 general and specialty contractors
• Year to date 2016 revenue growth rate of 25% over 2015
• 6 of the top 10 insurance carriers rated by J.D. Power for customer satisfaction partner
with Contractor Connection
• Over 300,000 assignments expected in 2016 and growing, with approximately $2.0 billion
in repair estimates expected in 2016
• Expanding into new markets, such as consumer home improvement, real estate and
financial markets, all with global opportunities
• Similar offerings currently operational under Contractor Connection brand name in the
U.K. and Australia
13
BROADSPIRE
A global Third Party Administration (TPA) business specializing in servicing the claims needs of
corporations, brokers and insurers who wish to take a greater control over the claims process,
indemnity spend, and data capture and to access meaningful management information
• Largest global footprint of any third party claims administrator in the world
• Providing an entire range of claims management services, including:
Disability and leave management services
Medical management services
Workers’ compensation and liability claims management services
Risk management information services
• Utilizing data analytics with predictive modelling solutions to impact total loss
costs
• Innovative technology

14
BROADSPIRE – STRONG EXPERIENCE, STRONG PARTNERSHIPS

15
GLOBAL TECHNICAL SERVICES
Global Technical Services (GTS) has the largest, most experienced team of technical adjusters in the
world
• Global footprint
• 500 executive general adjusters
• Industry-specific expertise
• Specialists in providing quality
end to end claims management
• Consultancy services

16
Recognized leader in providing legal administration services for class action settlements,
bankruptcy cases, mass tort and legal noticing programs for over 30 years
• Senior leadership transition successfully completed
• Continuing to manage the expected decline of two large projects
• Second quarter 2016 margins expanded 500bps from first quarter 2016 driven by strong cost
discipline
• New business activity robust with key second quarter wins including:
o Large mass tort involving asbestos
o DOJ U.S. Victims of State Sponsored Terrorism Fund
o Barrick Gold Securities Litigation
• RFP win rates improving year over year with a strong backlog of awarded projects
• Expect Garden City Group to hit their targets in 2016 while returning to growth in 2017
GARDEN CITY GROUP

17
GROWTH INITIATIVES
Expand Contactor Connection in North America and Internationally
Continue to deliver consistent growth and margin expansion at Broadspire in the U.S. and
explore global TPA opportunities
Growth in high end claims services delivered by our GTS adjusters
Garden City Group expected to return to growth in 2017
Reinvigorated culture with a focus on cross selling
New product development
Exploring strategic acquisitions to enhance market position and accelerate growth

18
CRAWFORD IS FOCUSED ON SHAREHOLDER RETURNS
• Crawford continues to deliver shareholder
returns in the form of dividends
• Increased dividends on both the A and B
shares over the last 3 years
*Includes one time special dividend of $0.06 per share in 2012
$0.10
$0.20
$0.18
$0.24
$0.28
$0.08
$0.16
$0.14
$0.18
$0.20
2011 2012 2013 2014 2015
Crawford & Company
Cash Dividends Per Share
Class A Common Stock Common B Common Stock
*
19
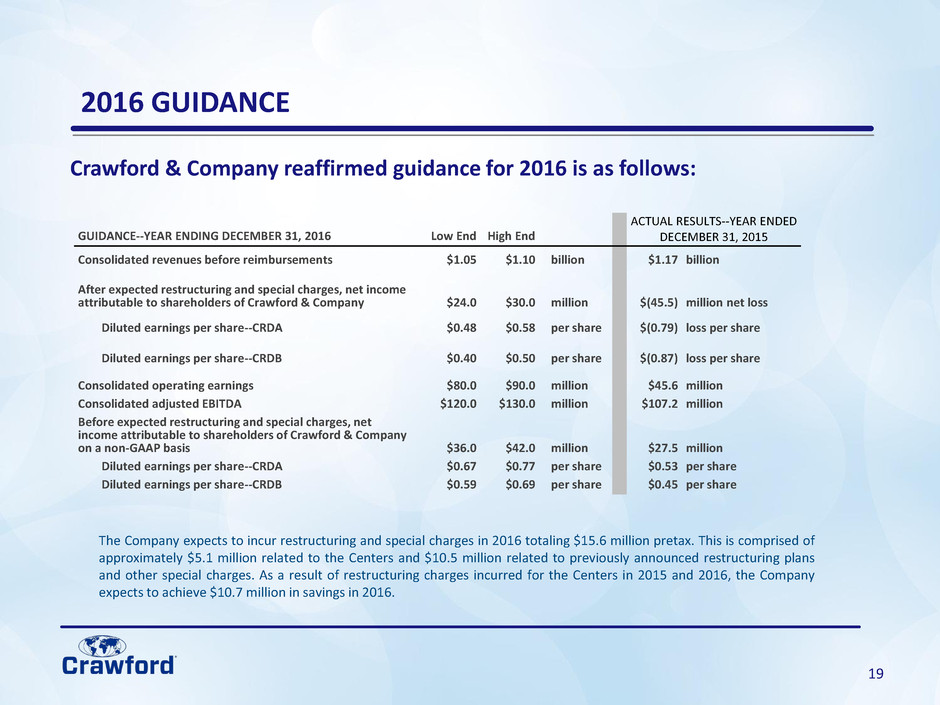
Crawford & Company reaffirmed guidance for 2016 is as follows:
GUIDANCE--YEAR ENDING DECEMBER 31, 2016 Low End High End
ACTUAL RESULTS--YEAR ENDED
DECEMBER 31, 2015
Consolidated revenues before reimbursements $1.05 $1.10 billion $1.17 billion
After expected restructuring and special charges, net income
attributable to shareholders of Crawford & Company $24.0 $30.0 million $(45.5) million net loss
Diluted earnings per share--CRDA $0.48 $0.58 per share $(0.79) loss per share
Diluted earnings per share--CRDB $0.40 $0.50 per share $(0.87) loss per share
Consolidated operating earnings $80.0 $90.0 million $45.6 million
Consolidated adjusted EBITDA $120.0 $130.0 million $107.2 million
Before expected restructuring and special charges, net
income attributable to shareholders of Crawford & Company
on a non-GAAP basis $36.0 $42.0 million $27.5 million
Diluted earnings per share--CRDA $0.67 $0.77 per share $0.53 per share
Diluted earnings per share--CRDB $0.59 $0.69 per share $0.45 per share
2016 GUIDANCE
The Company expects to incur restructuring and special charges in 2016 totaling $15.6 million pretax. This is comprised of
approximately $5.1 million related to the Centers and $10.5 million related to previously announced restructuring plans
and other special charges. As a result of restructuring charges incurred for the Centers in 2015 and 2016, the Company
expects to achieve $10.7 million in savings in 2016.

20
Midpoint of 2016 Non – GAAP Guidance Projects Strong YoY Growth
2016 NON – GAAP GUIDANCE
• 2016E for Non - GAAP Diluted EPS and Adjusted EBITDA is at the midpoint of the guidance range given by Crawford
(1) See Appendix for non-GAAP explanation and reconciliation
0
0.1
0.2
0.3
0.4
0.5
0.6
0.7
CRDB EPS 2015A CRDB EPS 2016E
Non-GAAP Diluted EPS
95
100
105
110
115
120
125
130
2015A 2016E
Non - GAAP Adjusted EBITDA (mm)
$125.0
$107.2
$0.64
$0.45
(1) (1)

21
PRIORITIES FOR REMAINDER OF 2016
Continue to exhibit cost discipline
Be more client centric
• Deliver customized value propositions to clients
• Increase the speed of doing business enterprise wide
Drive additional synergies in strategic initiatives
Capitalize on cross-selling opportunities across the Company
Continue to create robust 2017 sales funnel
• Expand client base
• Develop new products
GOAL TO DELIVER PREDICTABLE FINANCIAL RESULTS

22
Questions & Answers

23
Appendix A: Consolidated Year-to-Date 2016 Financial Information

24
SECOND QUARTER 2016 BUSINESS SUMMARY
(1) See Appendix for non-GAAP explanation and reconciliation
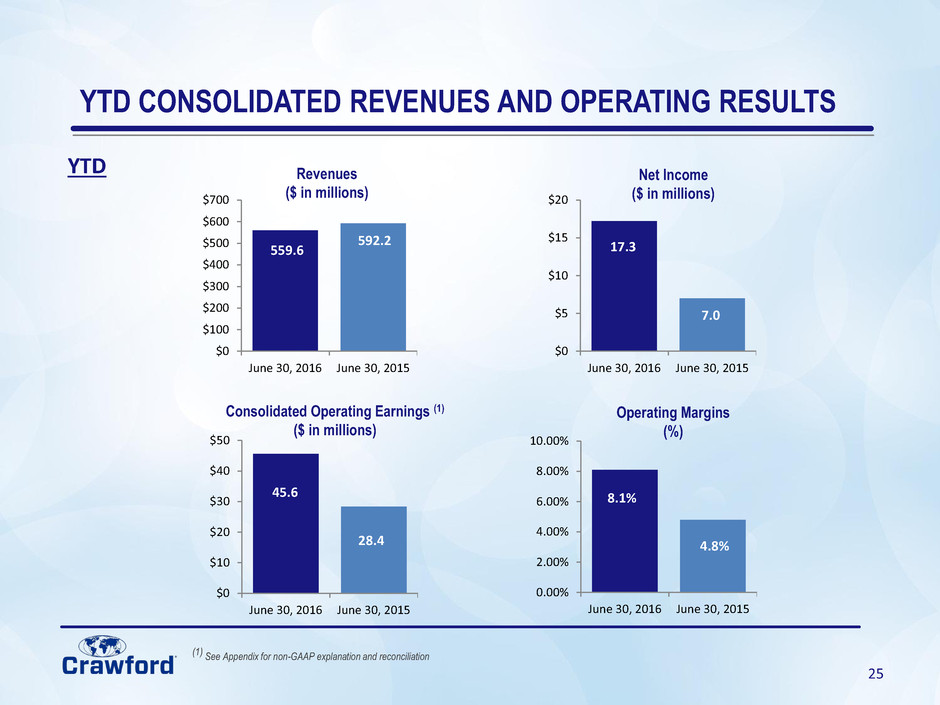
• Revenues for the 2016 period were $559.6 million, down 6% as compared with $592.2 million in the
2015 period due to lower revenues from major projects at GCG which are in run-off, FX headwinds
from a strong U.S. dollar, and lower weather-related claims in U.S. Services
• Net income attributable to shareholders of $17.3 million, more than doubling net income of $7.0
million in the 2015 period
• Year-to-date consolidated operating earnings grew 61% year over year to $45.6 million driven by
expense reduction combined with strength in U.S. Contractor Connection and Broadspire
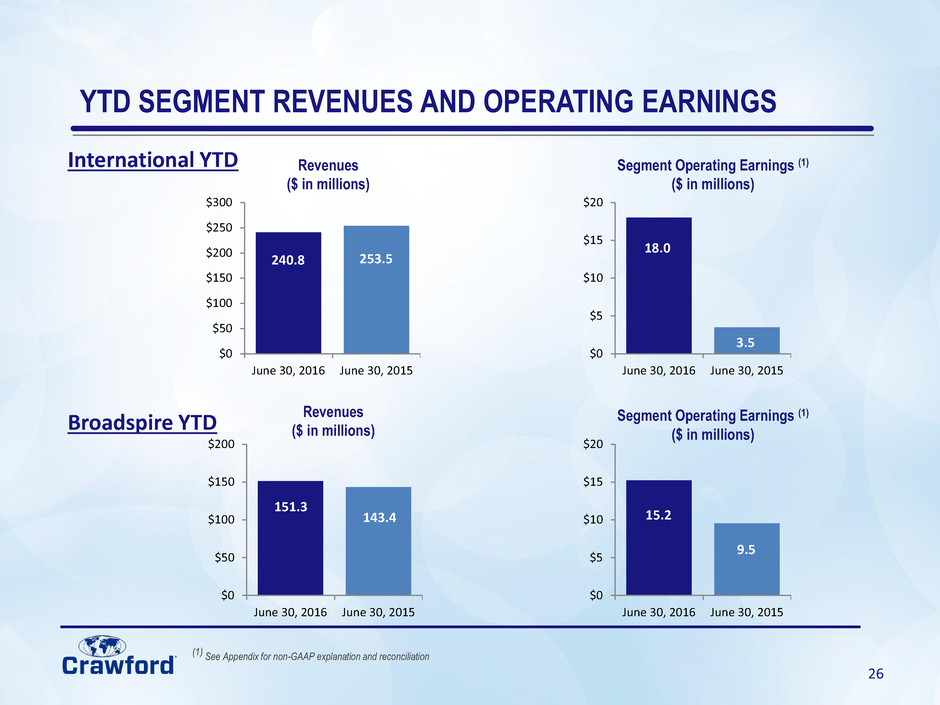
• International segment operating margins increased significantly to 7% from 1% year over year
• U.S. Services operating margins of 16% were driven by U.S. Contractor Connection
• Broadspire delivered steady, consistent results with operating margins of 10%
• Garden City Group executive leadership transition successful
• Consolidated adjusted EBITDA(1) of $62.4 million, or 11.2% of revenues, in the 2016 period increasing
substantially over the $45.9 million, or 7.7% of revenues, in the 2015 period
• Year-to-date cash dividends of $0.14 per CRDA share and $0.10 per CRDB share
25
YTD CONSOLIDATED REVENUES AND OPERATING RESULTS
YTD
(1) See Appendix for non-GAAP explanation and reconciliation
0.00%
2.00%
4.00%
6.00%
8.00%
10.00%
June 30, 2016 June 30, 2015
Operating Margins
(%)
8.1%
4.8%
$0
$100
$200
$300
$400
$500
$600
$700
June 30, 2016 June 30, 2015
Revenues
($ in millions)
559.6
592.2
$0
$5
$10
$15
$20
June 30, 2016 June 30, 2015
17.3
7.0
Net Income
($ in millions)
$0
$10
$20
$30
$40
$50
June 30, 2016 June 30, 2015
Consolidated Operating Earnings (1)
($ in millions)
28.4
45.6
26
$0
$50
$100
$150
$200
June 30, 2016 June 30, 2015
$0
$5
$10
$15
$20
June 30, 2016 June 30, 2015
YTD SEGMENT REVENUES AND OPERATING EARNINGS
International YTD
(1) See Appendix for non-GAAP explanation and reconciliation
631,032
Broadspire YTD
15.2
9.5
253,508
240,757
Revenues
($ in millions)
Segment Operating Earnings (1)
($ in millions)
Segment Operating Earnings (1)
($ in millions)
$0
$5
$10
$15
$20
June 30, 2016 June 30, 2015
18.0
3.5
Revenues
($ in millions)
$0
$50
$100
$150
$200
$250
$300
June 30, 2016 June 30, 2015
253.5 240.8
143.4
151.3

27
$0
$20
$40
$60
$80
June 30, 2016 June 30, 2015
$0
$2
$4
$6
$8
$10
June 30, 2016 June 30, 2015
$0
$20
$40
$60
$80
$100
$120
$140
June 30, 2016 June 30, 2015
$0
$5
$10
$15
$20
June 30, 2016 June 30, 2015
YTD SEGMENT REVENUES AND OPERATING EARNINGS
US Services YTD
(1) See Appendix for non-GAAP explanation and reconciliation
Revenues
($ in millions)
Segment Operating Earnings (1)
($ in millions)
123.6
14.0
Garden City Group YTD
Revenues
($ in millions)
Segment Operating Earnings (1)
($ in millions)
18.6
117.3
4.2
8.7
50.2
71.7

28
STATEMENT OF OPERATIONS HIGHLIGHTS
Unaudited ($ in thousands, except per share amounts)
Year-to-Date Periods Ended June 30, 2016 2015 % Change
Revenues Before Reimbursements $ 559,577 $ 592,175 (6)%
Costs of Services Provided, Before Reimbursements 401,795 451,431 (11)%
Selling, General, and Administrative Expenses 117,857 117,608 0%
Corporate Interest Expense, Net 5,291 3,906 35%
Restructuring and Special Charges 5,943 5,305 12%
Total Costs and Expenses Before Reimbursements 530,886 578,250 (8)%
Other Income 522 484 8%
Income Before Income Taxes 29,213 14,409 103%
Provision for Income Taxes 11,423 6,950 64%
Net Income 17,790 7,459 139%
Net Income Attributable to Noncontrolling Interests (533) (419) 27%
Net Income Attributable to Shareholders of Crawford & Company $ 17,257 $ 7,040 145%
Earnings Per Share - Diluted:
Class A Common Stock $ 0.33 $ 0.14 136%
Class B Common Stock $ 0.29 $ 0.11 164%
Cash Dividends per Share:
Class A Common Stock $ 0.14 $ 0.14 0%
Class B Common Stock $ 0.10 $ 0.10 0%

29
Unaudited ($ in thousands)
June 30,
2016
December 31,
2015 Change
Cash and cash equivalents $59,365 $76,066 ($16,701 )
Accounts receivable, net 170,178 164,596 5,582
Unbilled revenues, net 113,027 98,659 14,368
Total receivables 283,205 263,255 19,950
Goodwill 94,681 95,616 (935 )
Intangible assets arising from business acquisitions, net 97,666 104,861 (7,195 )
Goodwill and intangible assets arising from business acquisitions 192,347 200,477 (8,130 )
Deferred revenues 69,072 73,144 (4,072 )
Pension liabilities 114,510 121,732 (7,222 )
Short-term borrowings and current portion of capital leases 21,128 21,917 (789 )
Long-term debt, less current portion 216,944 225,365 (8,421 )
Total debt 238,072 247,282 (9,210 )
Total stockholders' equity attributable to Crawford & Company 136,481 113,693 22,788
Net debt (1) 178,707 171,216 7,491
Total debt / capitalization 64 % 69 %
(1) See Appendix for non-GAAP explanation and reconciliation
BALANCE SHEET HIGHLIGHTS

30
Unaudited ($ in thousands) 2016 2015 Variance
Net Income Attributable to Shareholders of Crawford & Company $ 17,257 $ 7,040 $ 10,217
Depreciation and Other Non-Cash Operating Items 23,040 23,139 (99 )
Unbilled and Billed Receivables Change (20,743 ) 1,831 (22,574 )
Working Capital Change 977 (12,487 ) 13,464
U.S. and U.K. Pension Contributions (9,072 ) (9,303 ) 231
Cash Flows from Operating Activities 11,459 10,220 1,239
Property & Equipment Purchases, net (4,588 ) (5,333 ) 745
Capitalized Software (internal and external costs) (8,749 ) (10,871 ) 2,122
Free Cash Flow (1) $ (1,878 ) $ (5,984 ) $ 4,106
For the year-to-date periods ended June 30,
OPERATING AND FREE CASH FLOW
(1) See Appendix for non-GAAP explanation
31
Appendix B: Non-GAAP Financial Information

32
Measurements of financial performance not calculated in accordance with GAAP should be considered as supplements to, and not
substitutes for, performance measurements calculated or derived in accordance with GAAP. Any such measures are not necessarily
comparable to other similarly-titled measurements employed by other companies.
Reimbursements for Out-of-Pocket Expenses
In the normal course of our business, our operating segments incur certain out-of-pocket expenses that are thereafter reimbursed by our clients. Under GAAP, these
out-of-pocket expenses and associated reimbursements are required to be included when reporting expenses and revenues, respectively, in our consolidated results
of operations. In this presentation, we do not believe it is informative to include in reported revenues the amounts of reimbursed expenses and related revenues, as
they offset each other in our consolidated results of operations with no impact to our net income or operating earnings (loss). As a result, unless noted in this
presentation, revenue and expense amounts exclude reimbursements for out-of-pocket expenses.
Net Debt
Net debt is computed as the sum of long-term debt, capital leases and short-term borrowings less cash and cash equivalents. Management believes that net debt is
useful because it provides investors with an estimate of what the Company's debt would be if all available cash was used to pay down the debt of the Company. The
measure is not meant to imply that management plans to use all available cash to pay down debt.
Free Cash Flow
Management believes free cash flow is useful to investors as it presents the amount of cash the Company has generated that can be used for other purposes,
including additional contributions to the Company's defined benefit pension plans, discretionary prepayments of outstanding borrowings under our credit
agreement, and return of capital to shareholders, among other purposes. It does not represent the residual cash flow of the Company available for discretionary
expenditures. The reconciliation from Cash Flows from Operating Activities is provided on slide 30.
Segment and Consolidated Operating Earnings
Operating earnings is the primary financial performance measure used by our senior management and chief operating decision maker to evaluate the financial
performance of our Company and operating segments, and make resource allocation and certain compensation decisions. Management believes operating earnings
is useful to others in that it allows them to evaluate segment and consolidated operating performance using the same criteria our management and chief operating
decision maker use. Consolidated operating earnings represent segment earnings including certain unallocated corporate and shared costs, but before net corporate
interest expense, stock option expense, amortization of customer-relationship intangible assets, goodwill impairment charges, restructuring and special charges,
income taxes, and net income or loss attributable to noncontrolling interests.
APPENDIX: NON-GAAP FINANCIAL INFORMATION
33
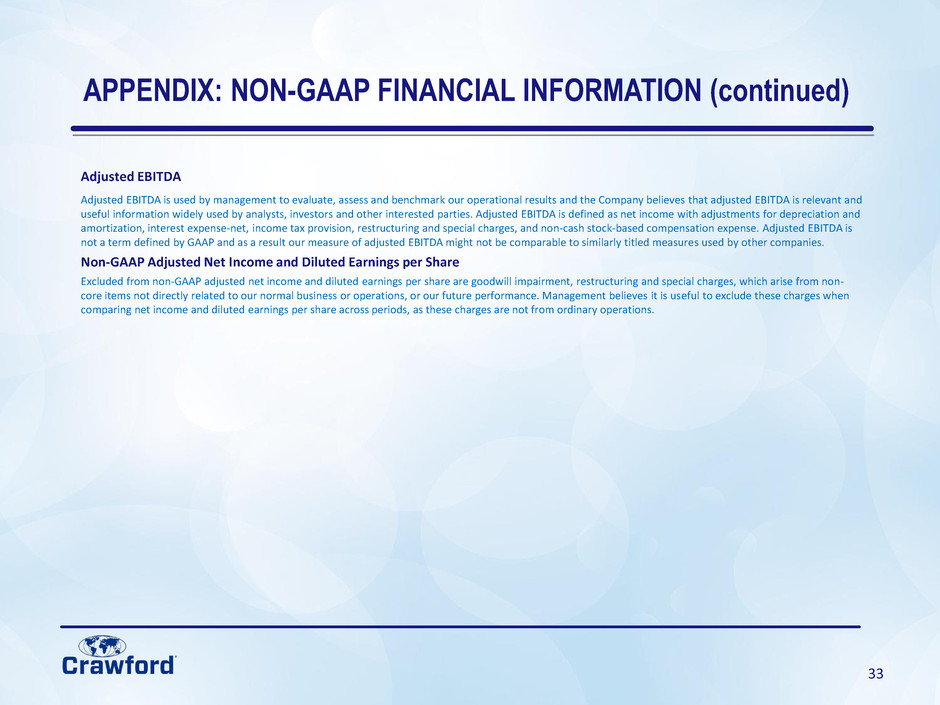
Adjusted EBITDA
Adjusted EBITDA is used by management to evaluate, assess and benchmark our operational results and the Company believes that adjusted EBITDA is relevant and
useful information widely used by analysts, investors and other interested parties. Adjusted EBITDA is defined as net income with adjustments for depreciation and
amortization, interest expense-net, income tax provision, restructuring and special charges, and non-cash stock-based compensation expense. Adjusted EBITDA is
not a term defined by GAAP and as a result our measure of adjusted EBITDA might not be comparable to similarly titled measures used by other companies.
Non-GAAP Adjusted Net Income and Diluted Earnings per Share
Excluded from non-GAAP adjusted net income and diluted earnings per share are goodwill impairment, restructuring and special charges, which arise from non-
core items not directly related to our normal business or operations, or our future performance. Management believes it is useful to exclude these charges when
comparing net income and diluted earnings per share across periods, as these charges are not from ordinary operations.
APPENDIX: NON-GAAP FINANCIAL INFORMATION (continued)

34
RECONCILIATION OF NON-GAAP ITEMS
Revenues and Trailing Twelve Months Adjusted EBITDA Margins
Q414 Q115 Q215 Q315 Q415 Q116 Q216
Unaudited ($ in thousands)
Total revenues $ 305,642 $ 306,616 $ 324,416 $ 309,984 $ 300,504 $ 290,908 $ 297,669
Reimbursements (20,187) (18,839) (20,018) (16,649) (15,629) (13,674) (15,326)
Revenues before reimbursements $ 285,455 $ 287,777 $ 304,398 $ 293,335 $ 284,875 $ 277,234 $ 282,343
Net income attributable to shareholders of
Crawford & Company $ 3,316 $ 2,986 $ 4,054 $ (857) $ (51,671) $ 8,630 $ 8,627
Add:
Depreciation and amortization 9,542 10,815 10,592 10,812 11,279 10,294 10,264
Stock-based compensation (742) 404 876 1,089 860 729 1,228
Net corporate interest expense 1,499 1,864 2,042 2,332 2,145 2,768 2,523
Goodwill impairment charges - - - - 49,314 - -
Restructuring and special charges - 1,063 4,242 11,078 18,012 2,417 3,526
Income taxes 8,286 2,241 4,709 8,385 (1,503) 5,307 6,116
Adjusted EBITDA $ 21,901 $ 19,373 $ 26,515 $ 32,839 $ 28,436 $ 30,145 $ 32,284
Adjusted EBITDA Margins 7.7% 6.7% 8.7% 11.2% 10.0% 10.9% 11.4%
Trailing Twelve Month Adjusted EBITDA Margin 8.6% 9.2% 10.2% 10.9%
35
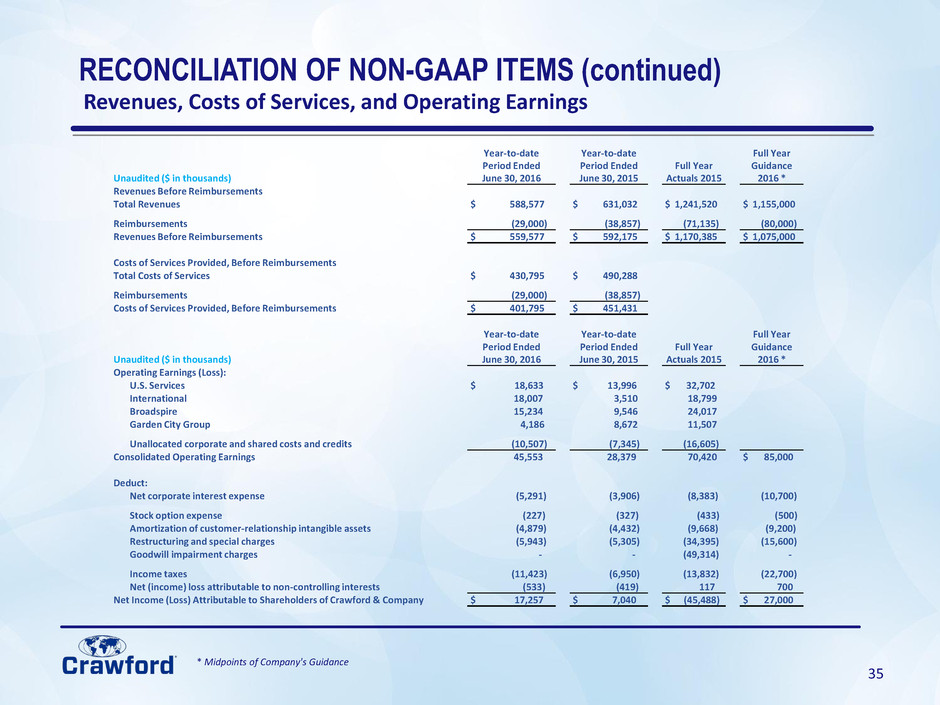
RECONCILIATION OF NON-GAAP ITEMS (continued)
Revenues, Costs of Services, and Operating Earnings
Unaudited ($ in thousands)
Year-to-date
Period Ended
June 30, 2016
Year-to-date
Period Ended
June 30, 2015
Full Year
Actuals 2015
Full Year
Guidance
2016 *
Revenues Before Reimbursements
Total Revenues $ 588,577 $ 631,032 $ 1,241,520 $ 1,155,000
Reimbursements (29,000) (38,857) (71,135) (80,000)
Revenues Before Reimbursements $ 559,577 $ 592,175 $ 1,170,385 $ 1,075,000
Costs of Services Provided, Before Reimbursements
Total Costs of Services $ 430,795 $ 490,288
Reimbursements (29,000) (38,857)
Costs of Services Provided, Before Reimbursements $ 401,795 $ 451,431
Unaudited ($ in thousands)
Year-to-date
Period Ended
June 30, 2016
Year-to-date
Period Ended
June 30, 2015
Full Year
Actuals 2015
Full Year
Guidance
2016 *
Operating Earnings (Loss):
U.S. Services $ 18,633 $ 13,996 $ 32,702
International 18,007 3,510 18,799
Broadspire 15,234 9,546 24,017
Garden City Group 4,186 8,672 11,507
Unallocated corporate and shared costs and credits (10,507) (7,345) (16,605)
Consolidated Operating Earnings 45,553 28,379 70,420 $ 85,000
Deduct:
Net corporate interest expense (5,291) (3,906) (8,383) (10,700)
Stock option expense (227) (327) (433) (500)
Amortization of customer-relationship intangible assets (4,879) (4,432) (9,668) (9,200)
Restructuring and special charges (5,943) (5,305) (34,395) (15,600)
Goodwill impairment charges - - (49,314) -
Income taxes (11,423) (6,950) (13,832) (22,700)
Net (income) loss attributable to non-controlling interests (533) (419) 117 700
Net Income (Loss) Attributable to Shareholders of Crawford & Company $ 17,257 $ 7,040 $ (45,488) $ 27,000
* Midpoints of Company's Guidance

36
RECONCILIATION OF NON-GAAP ITEMS (continued)
Revenues and Adjusted EBITDA
* Midpoints of Company's Guidance
Year-to-date
Period Ended
June 30, 2016
Year-to-date
Period Ended
June 30, 2015
Full Year
Actuals 2015
Full Year
Guidance
2016 *
Unaudited ($ in thousands)
Total revenues $ 588,577 $ 631,032 $ 1,241,520 $ 1,155,000
Reimbursements (29,000) (38,857) (71,135) (80,000)
Revenues before reimbursements $ 559,577 $ 592,175 $ 1,241,520 $ 1,075,000
Net income attributable to shareholders of Crawford & Company $ 17,257 $ 7,040 $ (45,488) $ 27,000
Add:
Depreciation and amortization 20,558 21,407 43,488 45,000
Stock-based compensation 1,957 1,280 3,229 4,000
Net corporate interest expense 5,291 3,906 8,383 10,700
Goodwill impairment charges - - 49,314 -
Restructuring and special charges 5,943 5,305 34,395 15,600
Income taxes 11,423 6,950 13,832 22,700
Adjusted EBITDA $ 62,429 $ 45,888 $ 107,153 $ 125,000

37
RECONCILIATION OF NON-GAAP ITEMS (continued)
Net Debt
June 30, December 31,
Unaudited ($ in thousands) 2016 2015
Net Debt
Short-term borrowings $ 19,371 $ 19,958
Current installments of capital leases 1,757 1,959
Long-term debt and capital leases, less current installments 216,944 225,365
Total debt 238,072 247,282
Less:
Cash and cash equivalents 59,365 76,066
Net debt $ 178,707 $ 171,216
38
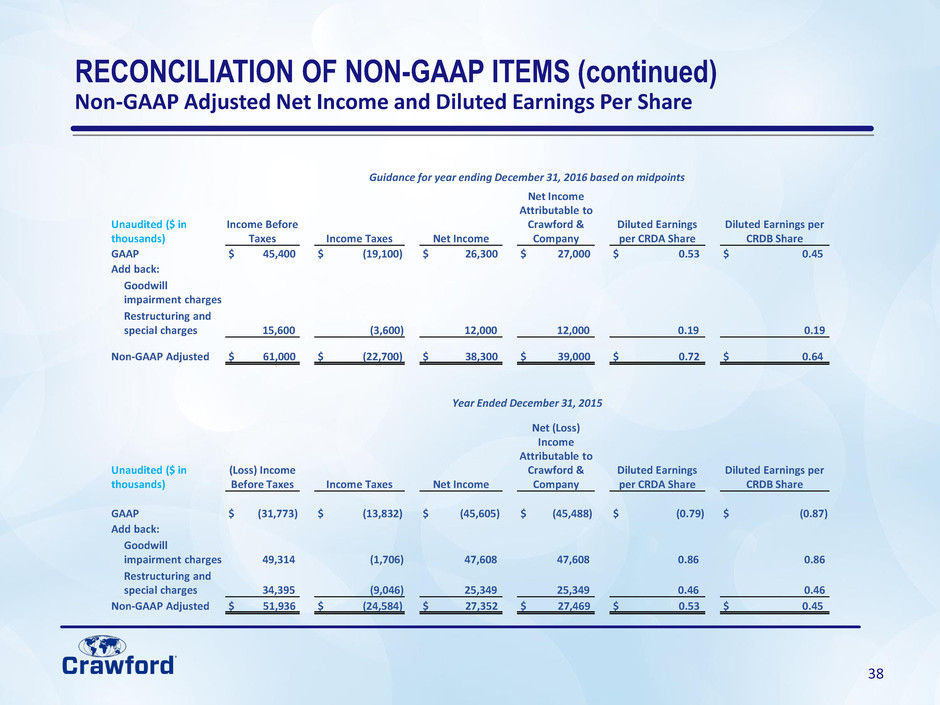
RECONCILIATION OF NON-GAAP ITEMS (continued)
Non-GAAP Adjusted Net Income and Diluted Earnings Per Share
Guidance for year ending December 31, 2016 based on midpoints
Unaudited ($ in
thousands)
Income Before
Taxes Income Taxes Net Income
Net Income
Attributable to
Crawford &
Company
Diluted Earnings
per CRDA Share
Diluted Earnings per
CRDB Share
GAAP $ 45,400 $ (19,100) $ 26,300 $ 27,000 $ 0.53 $ 0.45
Add back:
Goodwill
impairment charges
Restructuring and
special charges 15,600 (3,600) 12,000 12,000 0.19 0.19
Non-GAAP Adjusted $ 61,000 $ (22,700) $ 38,300 $ 39,000 $ 0.72 $ 0.64
Year Ended December 31, 2015
Unaudited ($ in
thousands)
(Loss) Income
Before Taxes Income Taxes Net Income
Net (Loss)
Income
Attributable to
Crawford &
Company
Diluted Earnings
per CRDA Share
Diluted Earnings per
CRDB Share
GAAP $ (31,773) $ (13,832) $ (45,605) $ (45,488) $ (0.79) $ (0.87)
Add back:
Goodwill
impairment charges 49,314 (1,706) 47,608 47,608 0.86 0.86
Restructuring and
special charges 34,395 (9,046) 25,349 25,349 0.46 0.46
Non-GAAP Adjusted $ 51,936 $ (24,584) $ 27,352 $ 27,469 $ 0.53 $ 0.45
