Attached files
| file | filename |
|---|---|
| EX-32.3 - EXHIBIT 32.3 - Medley LLC | v446555_ex32-3.htm |
| EX-32.2 - EXHIBIT 32.2 - Medley LLC | v446555_ex32-2.htm |
| EX-32.1 - EXHIBIT 32.1 - Medley LLC | v446555_ex32-1.htm |
| EX-31.3 - EXHIBIT 31.3 - Medley LLC | v446555_ex31-3.htm |
| EX-31.2 - EXHIBIT 31.2 - Medley LLC | v446555_ex31-2.htm |
| EX-31.1 - EXHIBIT 31.1 - Medley LLC | v446555_ex31-1.htm |
UNITED STATES
SECURITIES AND EXCHANGE COMMISSION
Washington, D.C. 20549
FORM 10-Q
| x | QUARTERLY REPORT PURSUANT TO SECTION 13 OR 15(d) OF THE SECURITIES EXCHANGE ACT OF 1934 |
For the quarterly period ended June 30, 2016
or
| ¨ | TRANSITION REPORT PURSUANT TO SECTION 13 OR 15(d) OF THE SECURITIES EXCHANGE ACT OF 1934 |
For the transition period from to
Commission File Number: 333-212514
Medley LLC
(Exact name of registrant as specified in its charter)
| Delaware | 27-2437343 |
|
(State or other jurisdiction of incorporation or organization) |
(I.R.S. Employer Identification No.) |
280 Park Avenue, 6th Floor East
New York, New York 10017
(Address of principal executive offices)(Zip Code)
(212) 759-0777
(Registrant’s telephone number, including area code)
Indicate by check mark whether the registrant: (1) has filed all reports required to be filed by Section 13 or 15(d) of the Securities Exchange Act of 1934 during the preceding 12 months (or for such shorter period that the registrant was required to file such reports), and (2) has been subject to such filing requirements for the past 90 days. Yes ¨ No x
Indicate by check mark whether the registrant has submitted electronically and posted on its corporate Web site, if any, every Interactive Data File required to be submitted and posted pursuant to Rule 405 of Regulation S-T (§232.405 of this chapter) during the preceding 12 months (or for such shorter period that the registrant was required to submit and post such files). Yes x No ¨
Indicate by check mark whether the registrant is a large accelerated filer, an accelerated filer, a non-accelerated filer or a smaller reporting company. See the definitions of “large accelerated filer,” “accelerated filer” and “smaller reporting company” in Rule 12b-2 of the Exchange Act.
| Large accelerated filer | ¨ | Accelerated filer | ¨ | |||
| Non-accelerated filer | ¨ (Do not check if a smaller reporting company) | Smaller reporting company | x |
Indicate by check mark whether the registrant is a shell company (as defined in Rule 12b-2 of the Exchange Act). Yes ¨ No x
As of August 11, 2016, 29,111,059 units of membership interests of Medley LLC were outstanding. There is no trading market for Medley LLC’s units of membership interests.
TABLE OF CONTENTS
i
FORWARD-LOOKING STATEMENTS
This Quarterly Report on Form 10-Q (“Form 10-Q”) contains forward-looking statements within the meaning of Section 27A of the Securities Act of 1933, as amended (the “Securities Act”), and Section 21E of the Securities Exchange Act of 1934, as amended (the “Exchange Act”) that reflect our current views with respect to, among other things, our operations and financial performance. Forward-looking statements include all statements that are not historical facts. In some cases, you can identify these forward-looking statements by the use of words such as “outlook,” “believes,” “expects,” “potential,” “may,” “should,” “could,” “seeks,” “approximately,” “predicts,” “intends,” “plans,” “estimates,” “anticipates” or the negative version of these words or other comparable words. Such forward-looking statements are subject to various risks and uncertainties. Accordingly, there are or will be important factors that could cause actual outcomes or results to differ materially from those indicated in these statements. We believe these factors include, but are not limited to, those described “Risk Factors,” in our prospectus dated August 4, 2016 (the “Prospectus”), as filed with the Securities and Exchange Commission (the “SEC”) on August 5, 2016 pursuant to Rule 424(b) under the Securities Act available on the SEC’s website at www.sec.gov, which include, but are not limited to, the following:
| · | difficult market and political conditions may adversely affect our business in many ways, including by reducing the value or hampering the performance of the investments made by our funds, each of which could materially and adversely affect our business, results of operations and financial condition; |
| · | we derive a substantial portion of our revenues from funds managed pursuant to advisory agreements that may be terminated or fund partnership agreements that permit fund investors to remove us as the general partner; |
| · | we may not be able to maintain our current fee structure as a result of industry pressure from fund investors to reduce fees, which could have an adverse effect on our profit margins and results of operations; |
| · | a change of control of us or Medley Management Inc. could result in termination of our investment advisory agreements; |
| · | the historical returns attributable to our funds should not be considered as indicative of the future results of our funds or of our future results; |
| · | if we are unable to consummate or successfully integrate development opportunities, acquisitions or joint ventures, we may not be able to implement our growth strategy successfully; |
| · | we depend on third-party distribution sources to market our investment strategies; |
| · | an investment strategy focused primarily on privately held companies presents certain challenges, including the lack of available information about these companies; |
| · | our funds’ investments in investee companies may be risky, and our funds could lose all or part of their investments; |
| · | prepayments of debt investments by our investee companies could adversely impact our results of operations; |
| · | our funds’ investee companies may incur debt that ranks equally with, or senior to, our funds’ investments in such companies; |
| · | subordinated liens on collateral securing loans that our funds make to their investee companies may be subject to control by senior creditors with first priority liens and, if there is a default, the value of the collateral may not be sufficient to repay in full both the first priority creditors and our funds; |
| · | there may be circumstances where our funds’ debt investments could be subordinated to claims of other creditors or our funds could be subject to lender liability claims; |
| · | our funds may not have the resources or ability to make additional investments in our investee companies; |
| · | economic recessions or downturns could impair our investee companies and harm our operating results; |
| · | a covenant breach by our investee companies may harm our operating results; |
| · | the investment management business is competitive; |
ii
| · | our funds operate in a competitive market for lending that has recently intensified, and competition may limit our funds’ ability to originate or acquire desirable loans and investments and could also affect the yields of these assets and have a material adverse effect on our business, results of operations and financial condition; |
| · | dependence on leverage by certain of our funds and by our funds’ investee companies subjects us to volatility and contractions in the debt financing markets and could adversely affect our ability to achieve attractive rates of return on those investments; |
| · | some of our funds may invest in companies that are highly leveraged, which may increase the risk of loss associated with those investments; |
| · | we generally do not control the business operations of our investee companies and, due to the illiquid nature of our investments, may not be able to dispose of such investments; |
| · | a substantial portion of our investments may be recorded at fair value as determined in good faith by or under the direction of our respective funds’ boards of directors or similar bodies and, as a result, there may be uncertainty regarding the value of our funds’ investments; |
| · | we may need to pay “clawback” obligations if and when they are triggered under the governing agreements with respect to certain of our funds and SMAs; |
| · | our funds may face risks relating to undiversified investments; |
| · | third-party investors in our private funds may not satisfy their contractual obligation to fund capital calls when requested, which could adversely affect a fund’s operations and performance; |
| · | our funds may be forced to dispose of investments at a disadvantageous time; |
| · | hedging strategies may adversely affect the returns on our funds’ investments; |
| · | our business depends in large part on our ability to raise capital from investors. If we were unable to raise such capital, we would be unable to collect management fees or deploy such capital into investments, which would materially and adversely affect our business, results of operations and financial condition; |
| · | we depend on our senior management team, senior investment professionals and other key personnel, and our ability to retain them and attract additional qualified personnel is critical to our success and our growth prospects; |
| · | our failure to appropriately address conflicts of interest could damage our reputation and adversely affect our business; |
| · | rapid growth of our business may be difficult to sustain and may place significant demands on our administrative, operational and financial resources; |
| · | we may enter into new lines of business and expand into new investment strategies, geographic markets and business, each of which may result in additional risks and uncertainties in our business; |
| · | extensive regulation affects our activities, increases the cost of doing business and creates the potential for significant liabilities and penalties that could adversely affect our business and results of operations; |
| · | failure to comply with “pay to play” regulations implemented by the SEC and certain states, and changes to the “pay to play” regulatory regimes, could adversely affect our business; |
| · | new or changed laws or regulations governing our funds’ operations and changes in the interpretation thereof could adversely affect our business; |
| · | present and future business development companies for which we serve as investment adviser are subject to regulatory complexities that limit the way in which they do business and may subject them to a higher level of regulatory scrutiny; |
| · | we are subject to risks in using custodians, counterparties, administrators and other agents; |
iii
| · | a portion of our revenue and cash flow is variable, which may impact our ability to achieve steady earnings growth on a quarterly basis and may cause the price of our Class A common stock to decline; |
| · | we may be subject to litigation risks and may face liabilities and damage to our professional reputation as a result; |
| · | employee misconduct could harm us by impairing our ability to attract and retain investors and subjecting us to significant legal liability, regulatory scrutiny and reputational harm, and fraud and other deceptive practices or other misconduct at our investee companies could similarly subject us to liability and reputational damage and also harm our business; |
| · | our substantial indebtedness could adversely affect our financial condition, our ability to pay our debts or raise additional capital to fund our operations, our ability to operate our business and our ability to react to changes in the economy or our industry and could divert our cash flow from operations for debt payments; |
| · | our Senior Secured Credit Facilities impose significant operating and financial restrictions on us and our subsidiaries, which may prevent us from capitalizing on business opportunities; |
| · | operational risks may disrupt our business, result in losses or limit our growth; |
| · | our tax treatment depends on our status as a partnership for United Sates federal and state income tax purposes. If the Internal Revenue Service (“IRS”) were to treat us as a corporation for United States federal income tax purposes, which would subject us to entity-level taxation, or if we were subjected to a material amount of additional entity-level taxation by individual states, then our cash available for payments on the notes and our other debt obligations could be substantially reduced; |
| · | recent legislation could subject us to federal income tax liability. |
These factors should not be construed as exhaustive and should be read in conjunction with the other cautionary statements that are included in this Form 10-Q. Forward-looking statements speak as of the date on which they are made, and we undertake no obligation to publicly update or review any forward-looking statement, whether as a result of new information, future developments or otherwise, except as required by law.
Medley LLC was formed on October 27, 2010 and is the operating company of Medley Management Inc., a public company traded under the symbol “MDLY.” Medley Management Inc. is the sole managing member of Medley LLC. Medley Management Inc. was incorporated on June 13, 2014 and commenced operations on September 29, 2014 upon completion of its initial offering (“IPO”) of its Class A common stock. Medley Management Inc.’s sole operating asset is its investment in Medley LLC.
Unless the context suggests otherwise, references herein to the “Company,” “Medley,” “we,” “us” and “our” refer to Medley LLC and its consolidated subsidiaries.
The “pre-IPO owners” refers to the senior professionals who were the owners of Medley LLC immediately prior to the consummation of Medley Management Inc.’s IPO and subsequent purchase of 6,000,000 newly issued limited liability company units (the “LLC Units”) from Medley LLC, which correspondingly diluted the ownership interests of the pre-IPO owners in Medley LLC and resulted in Medley Management Inc.’s holding a number of LLC Units in Medley LLC equal to the number of shares of Class A common stock it issued in its IPO.
Unless the context suggests otherwise, references herein to:
| · | “AUM” refers to the assets of our funds, which represents the sum of the NAV of such funds, the drawn and undrawn debt (at the fund level, including amounts subject to restrictions) and uncalled committed capital (including commitments to funds that have yet to commence their investment periods); |
| · | “base management fees” refers to fees we earn for advisory services provided to our funds, which are generally based on a defined percentage of fee earning AUM or, in certain cases, a percentage of originated assets in the case of certain of our SMAs; |
| · | “BDC” refers to business development company; |
iv
| · | “fee earning AUM” refers to the assets under management on which we directly earn base management fees; |
| · | “hurdle rates” refers to the rates above which we earn performance fees, as defined in the long-dated private funds’ and SMAs’ applicable investment management or partnership agreements. |
| · | “investee company” refers to a company to which one of our funds lends money or in which one of our funds otherwise makes an investment; |
| · | “long-dated private funds” refers to MOF II, MOF III and any other private funds we may manage in the future; |
| · | “management fees” refers to base management fees and Part I incentive fees; |
| · | “Medley LLC” refers to Medley LLC and its consolidated subsidiaries and, prior to our IPO and the related Reorganization, Medley LLC and Medley GP Holdings LLC and their consolidated subsidiaries; |
| · | “MCOF” refers to Medley Credit Opportunity Fund; |
| · | “MOF II” refers to Medley Opportunity Fund II LP; |
| · | “MOF III” refers to Medley Opportunity Fund III LP; |
| · | “our funds” refers to the funds, alternative asset companies and other entities and accounts that are managed or co-managed by us and our affiliates; |
| · | “our investors” refers to the investors in our permanent capital vehicles, our private funds and our SMAs; |
| · | “Part I incentive fees” refers to fees that we receive from our permanent capital vehicles, which are paid in cash quarterly and are driven primarily by net interest income on senior secured loans subject to hurdle rates. With respect to periods subsequent to January 1, 2016, as it relates to Medley Capital Corporation (NYSE: MCC) (“MCC”), these fees are subject to netting against realized and unrealized losses; |
| · | “Part II incentive fees” refers to fees related to realized capital gains in our permanent capital vehicles; |
| · | “performance fees” refers to incentive allocations in our long-dated private funds and incentive fees from our SMAs, which are typically 15% or 20% of the total return after a hurdle rate, accrued quarterly, but paid after the return of all invested capital and in an amount sufficient to achieve the hurdle rate; |
| · | “permanent capital” refers to capital of funds that do not have redemption provisions or a requirement to return capital to investors upon exiting the investments made with such capital, except as required by applicable law, which funds currently consist of MCC and Sierra Income Corporation (“SIC”). Such funds may be required, or elect, to return all or a portion of capital gains and investment income. In certain circumstances, the investment adviser of such a fund may be removed; and |
| · | “SMA” refers to a separately managed account. |
v
PART 1 – FINANCIAL INFORMATION
| Item 1. | Financial Statements |
Condensed Consolidated Balance Sheets
(Amounts in thousands)
| As of | ||||||||
| June 30, | As of | |||||||
| 2016 | December 31, | |||||||
| (unaudited) | 2015 | |||||||
| Assets | ||||||||
| Cash and cash equivalents | $ | 56,248 | $ | 71,300 | ||||
| Investments, at fair value | 15,064 | 16,360 | ||||||
| Management fees receivable | 16,244 | 16,172 | ||||||
| Performance fees receivable | 2,799 | 2,518 | ||||||
| Other assets | 15,558 | 11,797 | ||||||
| Total assets | $ | 105,913 | $ | 118,147 | ||||
| Liabilities and Equity | ||||||||
| Loans payable | $ | 101,163 | $ | 100,871 | ||||
| Accounts payable, accrued expenses and other liabilities | 35,013 | 34,223 | ||||||
| Performance fee compensation payable | 1,449 | 1,823 | ||||||
| Total liabilities | 137,625 | 136,917 | ||||||
| Commitments and contingencies (Note 7) | ||||||||
| Redeemable Non-controlling Interests | 12,595 | - | ||||||
| Equity | ||||||||
| Non-controlling interests in consolidated subsidiaries | (2,054 | ) | (459 | ) | ||||
| Member's equity (deficit) | (42,253 | ) | (18,311 | ) | ||||
| Total equity (deficit) | (44,307 | ) | (18,770 | ) | ||||
| Total liabilities, redeemable non-controlling interests and equity | $ | 105,913 | $ | 118,147 | ||||
See accompanying notes to unaudited condensed consolidated financial statements
| F-1 |
Condensed Consolidated Statements of Operations (unaudited)
(Amounts in thousands)
| For the Three Months Ended | For the Six Months Ended | |||||||||||||||
| June 30, | June 30, | |||||||||||||||
| 2016 | 2015 | 2016 | 2015 | |||||||||||||
| Revenues | ||||||||||||||||
| Management fees | $ | 18,695 | $ | 20,923 | $ | 34,958 | $ | 38,443 | ||||||||
| Performance fees | 851 | (2,368 | ) | 260 | 3,968 | |||||||||||
| Other revenues and fees | 1,780 | 1,981 | 3,679 | 3,605 | ||||||||||||
| Total revenues | 21,326 | 20,536 | 38,897 | 46,016 | ||||||||||||
| Expenses | ||||||||||||||||
| Compensation and benefits | 8,564 | 6,397 | 14,432 | 13,618 | ||||||||||||
| Performance fee compensation | 45 | (1,030 | ) | (26 | ) | (918 | ) | |||||||||
| General, administrative and other expenses | 8,899 | 4,623 | 16,878 | 9,130 | ||||||||||||
| Total expenses | 17,508 | 9,990 | 31,284 | 21,830 | ||||||||||||
| Other income (expense) | ||||||||||||||||
| Dividend income | 221 | 221 | 443 | 443 | ||||||||||||
| Interest expense | (2,072 | ) | (2,109 | ) | (4,190 | ) | (4,194 | ) | ||||||||
| Other income (expenses), net | (863 | ) | 13 | (1,614 | ) | (249 | ) | |||||||||
| Total other expense, net | (2,714 | ) | (1,875 | ) | (5,361 | ) | (4,000 | ) | ||||||||
| Income before income taxes | 1,104 | 8,671 | 2,252 | 20,186 | ||||||||||||
| Provision for (benefit from) income taxes | 26 | 239 | 61 | 565 | ||||||||||||
| Net income | 1,078 | 8,432 | 2,191 | 19,621 | ||||||||||||
| Net income (loss) attributable to non-controlling interests in consolidated subsidiaries | 405 | (274 | ) | 668 | 1,016 | |||||||||||
| Net income attributable to Medley LLC | $ | 673 | $ | 8,706 | $ | 1,523 | $ | 18,605 | ||||||||
See accompanying notes to unaudited condensed consolidated financial statements
| F-2 |
Medley LLC
Condensed Consolidated Statement of Changes in Equity (unaudited)
(Amounts in thousands)
| Non-controlling | Total Equity | |||||||||||||||||||
| Interests in | Members' | Redeemable | and Redeemable | |||||||||||||||||
| Consolidated | Equity | Total | Non-controlling | Non-controlling | ||||||||||||||||
| Subsidiaries | (Deficit) | Equity | Interest | Interest | ||||||||||||||||
| Balance at December 31, 2015 | $ | (459 | ) | $ | (18,311 | ) | $ | (18,770 | ) | $ | - | $ | (18,770 | ) | ||||||
| Net income | (7 | ) | 1,523 | 1,516 | 675 | 2,191 | ||||||||||||||
| Repurchases of LLC Units | - | (1,198 | ) | (1,198 | ) | - | (1,198 | ) | ||||||||||||
| Contributions | - | 1,784 | 1,784 | - | 1,784 | |||||||||||||||
| Distributions | (1,547 | ) | (13,896 | ) | (15,443 | ) | (276 | ) | (15,719 | ) | ||||||||||
| Reclassification of redeemable non-controlling interest | (41 | ) | (12,155 | ) | (12,196 | ) | 12,196 | - | ||||||||||||
| Balance at June 30, 2016 | $ | (2,054 | ) | $ | (42,253 | ) | $ | (44,307 | ) | $ | 12,595 | $ | (31,712 | ) | ||||||
See accompanying notes to unaudited condensed consolidated financial statements
| F-3 |
Condensed Consolidated Statements of
Cash Flows (unaudited)
(Amounts in thousands)
| For the Six Months Ended | ||||||||
| June 30, | ||||||||
| 2016 | 2015 | |||||||
| Cash flows from operating activities | ||||||||
| Net income | $ | 2,191 | $ | 19,621 | ||||
| Adjustments to reconcile net income to net cash provided by (used in) operating activities: | ||||||||
| Net change in unrealized depreciation (appreciation) on investments | 23 | (29 | ) | |||||
| Loss on disposal of fixed assets | 27 | - | ||||||
| Loss (income) from equity method investments | 417 | (1,122 | ) | |||||
| Non-cash stock-based compensation | 1,784 | 1,619 | ||||||
| Depreciation and amortization | 435 | 232 | ||||||
| Provision for (benefit from) deferred taxes | (22 | ) | (124 | ) | ||||
| Amortization of deferred financing costs | 270 | 265 | ||||||
| Accretion of debt discount | 352 | 381 | ||||||
| Changes in operating assets and liabilities: | ||||||||
| Management fees receivable | (72 | ) | (1,278 | ) | ||||
| Performance fees receivable | (281 | ) | (2,869 | ) | ||||
| Other assets | (39 | ) | (1,670 | ) | ||||
| Accounts payable, accrued expenses and other liabilities | (1,506 | ) | (5,914 | ) | ||||
| Performance fee compensation payable | (374 | ) | (1,929 | ) | ||||
| Net cash provided by (used in) operating activities | 3,205 | 7,183 | ||||||
| Cash flows from investing activities | ||||||||
| Purchases of fixed assets | (1,884 | ) | (125 | ) | ||||
| Distributions received from equity method investments | 909 | - | ||||||
| Net cash provided by (used in) investing activities | (975 | ) | (125 | ) | ||||
| Cash flows from financing activities | ||||||||
| Repayment of loans payable | (312 | ) | (625 | ) | ||||
| Distributions to members and redeemable non-controlling interests | (15,719 | ) | (25,768 | ) | ||||
| Repurchases of LLC Units | (1,198 | ) | - | |||||
| Contributions to equity method investments | (53 | ) | (876 | ) | ||||
| Net cash provided by (used in) financing activities | (17,282 | ) | (27,269 | ) | ||||
| Net increase (decrease) in cash and cash equivalents | (15,052 | ) | (20,211 | ) | ||||
| Cash and cash equivalents, beginning of period | 71,300 | 87,206 | ||||||
| Cash and cash equivalents, end of period | $ | 56,248 | $ | 66,995 | ||||
| Supplemental disclosure of non-cash investing and financing activities | ||||||||
| Reclassification of redeemable non-controlling interest | $ | 12,155 | $ | - | ||||
| Fixed assets | 2,293 | - | ||||||
See accompanying notes to unaudited condensed consolidated financial statements
| F-4 |
Notes to Condensed Consolidated Financial Statements (unaudited)
| 1. | ORGANIZATION AND BASIS OF PRESENTATION |
Medley LLC is an asset management firm offering yield solutions to retail and institutional investors. Medley LLC’s national direct origination franchise provides capital to the middle market in the United States. Medley LLC provides investment management services to permanent capital vehicles, long-dated private funds and separately managed accounts and serves as the general partner to the long dated private funds, which are generally organized as pass-through entities. Medley LLC is headquartered in New York City and has an office in San Francisco.
The Company’s business is currently comprised of only one reportable segment, the investment management segment, and substantially all Company operations are conducted through this segment. The investment management segment provides investment management services to permanent capital vehicles, long-dated private funds and separately managed accounts. The Company conducts its investment management business in the United States, where substantially all its revenues are generated.
Medley LLC was formed on October 27, 2010 and is the operating company of Medley Management Inc., a public company traded under the symbol “MDLY.” Medley Management Inc. is the sole managing member of Medley LLC. Medley Management Inc. was incorporated on June 13, 2014 and commenced operations on September 29, 2014 upon completion of its initial offering (“IPO”) of its Class A common stock. Medley Management Inc.’s sole operating asset is its investment in Medley LLC.
Registered Public Offering of Medley LLC Notes
On August 9, 2016, the Company completed a registered of $25 million in aggregate principal amount of 6.875% notes due 2026 at a public offering price of 100% of the principal amount. The notes mature on August 15, 2026, with interest payable quarterly. The notes will be redeemable in whole or in part at Medley’s option on or after August 15, 2019, at the redemption price of 100% of aggregate principal amount, plus any accrued and unpaid interest. The Company intends to use the net proceeds from the offering to repay a portion of the outstanding indebtedness under the Company’s Term Loan Facility. The notes are expected to be listed on the New York Stock Exchange and to trade thereon within 30 days of the original issue date under the trading symbol “MDLX.”
Medley LLC Reorganization
In connection with the IPO of Medley Management Inc. on September 29, 2014, Medley LLC amended and restated its limited liability agreement to modify its capital structure by reclassifying the 23,333,333 interests held by the pre-IPO members into a single new class of units (“LLC Units”). The pre-IPO members also entered into an exchange agreement under which they (or certain permitted transferees thereof) have the right, subject to the terms of an exchange agreement, to exchange their LLC Units for shares of Medley Management Inc.’s Class A common stock on a one-for-one basis, subject to customary conversion rate adjustments for stock splits, stock dividends and reclassifications. In addition, pursuant to the amended and restated limited liability agreement, Medley Management Inc. became the sole managing member of Medley LLC.
The pre-IPO owners, are, subject to limited exceptions, prohibited from transferring any LLC Units held by them or any shares of Class A common stock received upon exchange of such LLC Units, until the third anniversary of the date of the closing of the IPO of Medley Management Inc. without the consent of the managing member. Thereafter and prior to the fourth and fifth anniversaries of the closing of the IPO of Medley Management Inc., such holders may not transfer more than 33 1/3% and 66 2/3%, respectively, of the number of LLC Units held by them, together with the number of any shares of Class A common stock received by them upon exchange therefor, without the consent of the managing member.
Basis of Presentation
The accompanying condensed consolidated financial statements have been prepared on the accrual basis of accounting in conformity with U.S. generally accepted accounting principles (“GAAP”) and include the accounts of Medley LLC and its consolidated subsidiaries (collectively, “Medley” or the “Company”). Additionally, the accompanying condensed consolidated financial statements of the Company and related financial information have been prepared pursuant to the requirements for reporting on Form 10-Q and Article 10 of Regulation S-X. Accordingly, certain disclosures accompanying annual financial statements prepared in accordance with U.S. GAAP may be omitted. In the opinion of management, the unaudited condensed consolidated financial results included herein contain all adjustments, consisting solely of normal recurring accruals, considered necessary for the fair presentation of financial statements for the interim periods included herein. Therefore, this Form 10-Q should be read in conjunction with the Company’s prospectus, dated August 4, 2016, filed pursuant to Rule 424(b) of the Securities Act on August 5, 2016. The current period’s results of operations will not necessarily be indicative of results that ultimately may be achieved for the full year ending December 31, 2016.
| F-5 |
Medley LLC
Notes to Condensed Consolidated Financial Statements (unaudited)
| 2. | SUMMARY OF SIGNIFICANT ACCOUNTING POLICIES |
Principles of Consolidation
In accordance with Accounting Standards Codification (“ASC”) 810, Consolidation, the Company consolidates those entities where it has a direct and indirect controlling financial interest based on either a variable interest model or voting interest model. As such, the Company consolidates entities that the Company concludes are variable interest entities (“VIEs”), for which the Company is deemed to be the primary beneficiary and entities in which it holds a majority voting interest or has majority ownership and control over the operational, financial and investing decisions of that entity.
In February 2015, the Financial Accounting Standards Board (“FASB”) issued ASU 2015-02, Consolidation (Topic 810) – Amendments to the Consolidation Analysis, which changes the consolidation analysis that a reporting entity must perform to determine whether it should consolidate certain types of legal entities. The Company elected to adopt this new guidance using the modified retrospective method effective January 1, 2015. As a result of the adoption of ASU 2015-02, the Company determined that it is no longer the primary beneficiary of certain funds it manages. Therefore, the Company deconsolidated certain funds that had been consolidated under previous guidance effective January 1, 2015. Restatement of periods prior to January 1, 2015 was not required.
For legal entities evaluated for consolidation, the Company must determine whether the interests that it holds and fees paid to it qualify as a variable interest in an entity. This includes an evaluation of the management fees and performance fees paid to the Company when acting as a decision maker or service provider to the entity being evaluated. Under the new guidance, if (a) fees received by the Company are customary and commensurate with the level of services provided, and (b) the Company does not hold other economic interests in the entity that would absorb more than an insignificant amount of the expected losses or returns of the entity, the interest that the Company holds would not be considered a variable interest. The Company factors in all economic interests including proportionate interests through related parties, to determine if fees are considered a variable interest. Prior to the adoption of the new consolidation guidance, these fees were considered variable interests by the Company.
An entity in which the Company holds a variable interest is a VIE if any one of the following conditions exist: (a) the total equity investment at risk is not sufficient to permit the legal entity to finance its activities without additional subordinated financial support, (b) the holders of equity investment at risk have the right to direct the activities of the entity that most significantly impact the legal entity’s economic performance, (c) the voting rights of some investors are disproportionate to their obligation to absorb losses or rights to receive returns from a legal entity. Under the new guidance, for limited partnerships and other similar entities, non-controlling investors must have substantive rights to either dissolve the fund or remove the general partner (“kick-out rights”) in order to not qualify as a VIE.
For those entities that qualify as a VIE, the primary beneficiary is generally defined as the party who has a controlling financial interest in the VIE. The Company is generally deemed to have a controlling financial interest if it has (a) the power to direct the activities of a VIE that most significantly impact the VIE’s economic performance, and (b) the obligation to absorb losses or receive benefits from the VIE that could potentially be significant to the VIE. The Company determines whether it is the primary beneficiary of a VIE at the time it becomes initially involved with the VIE and reconsiders that conclusion continuously. The primary beneficiary evaluation is generally performed qualitatively on the basis of all facts and circumstances. However, quantitative information may also be considered in the analysis, as appropriate. These assessments require judgments. Each entity is assessed for consolidation on a case-by-case basis.
For those entities evaluated under the voting interest model, the Company consolidates the entity if it has a controlling financial interest. The Company has a controlling financial interest in a voting interest entity (“VOE”) if it owns a majority voting interest in the entity. Prior to the new guidance, the Company consolidated VOE’s where it was the general partner and as such, was presumed to have control.
Consolidated Variable Interest Entity
Medley LLC has one majority owned subsidiary, SIC Advisors LLC, which is a consolidated VIE. This entity was organized as a limited liability company and was legally formed to manage a designated fund and to isolate business risk. As of June 30, 2016 and December 31, 2015 total assets, after eliminating entries, of this VIE reflected in the consolidated balance sheets were $26.5 million and $31.1 million, respectively. Total liabilities, after eliminating entries, of this VIE were $24.6 million and $21.2 million as of June 30, 2016 and December 31, 2015, respectively. Except to the extent of the assets of this VIE that are consolidated, the holders of the consolidated VIE’s liabilities generally do not have recourse to the Company.
| F-6 |
Medley LLC
Notes to Condensed Consolidated Financial Statements (unaudited)
Deconsolidated Funds
Prior to January 1, 2015, the Company had consolidated Medley Opportunity Fund II LP (“MOF II”) in its consolidated financial statements in accordance with ASC 810-20 as the Company was the general partner and the limited partners lacked kick out rights or participating rights. Under the guidance of ASU 2015-02, which the Company adopted effective as of January 1, 2015, the Company reconsidered the consolidation conclusion for MOF II and, as a result of the new guidance, determined that, although MOF II continues to be a VIE, the Company is no longer considered to be the primary beneficiary. Therefore, the Company deconsolidated MOF II at January 1, 2015 and records its investment in the entity under the equity method of accounting. See Note 3, “Equity Method Investments.”
Non-Consolidated Variable Interest Entities
The Company holds interests in certain VIEs that are not consolidated because the Company is not deemed the primary beneficiary. The Company's interest in these entities is in the form of insignificant equity interests and fee arrangements. The maximum exposure to loss represents the potential loss of assets by the Company relating to these non-consolidated entities.
As of June 30, 2016, the Company recorded investments, at fair value attributed to these non-consolidated VIEs of $5.3 million, receivables of $0.9 million included as a component of other assets and a clawback obligation of $7.1 million included as a component of accounts payable, accrued expenses and other liabilities on the Company’s consolidated balance sheets. As of December 31, 2015, the Company recorded investments, at fair value of $5.9 million, receivables of $0.9 million included as a component of other assets and a clawback obligation of $7.1 million included as a component of accounts payable, accrued expenses and other liabilities on the Company’s consolidated balance sheets. As of June 30, 2016, the Company’s maximum exposure to losses from these entities is $6.6 million.
Use of Estimates
The preparation of financial statements in conformity with U.S. GAAP requires management to make estimates and assumptions that affect the reported amounts of assets and liabilities and disclosures of contingent assets and liabilities at the date of the financial statements and the reported amounts of income and expenses during the reporting period. Management’s estimates are based on historical experience and other factors, including expectations of future events that management believes to be reasonable under the circumstances. These assumptions and estimates also require management to exercise judgment in the process of applying the Company’s accounting policies. Significant estimates and assumptions by management affect the carrying value of investments, performance compensation payable and certain accrued liabilities. Actual results could differ from these estimates, and such differences could be material.
Indemnification
In the normal course of business, the Company enters into contractual agreements that provide general indemnifications against losses, costs, claims and liabilities arising from the performance of individual obligations under such agreements. The Company has not experienced any prior claims or payments pursuant to such agreements. The Company’s individual maximum exposure under these arrangements is unknown, as this would involve future claims that may be made against the Company that have not yet occurred. However, based on management’s experience, the Company expects the risk of loss to be remote.
Non-Controlling Interests in Consolidated Subsidiaries
Non-controlling interests in consolidated subsidiaries represent the component of equity in such consolidated entities held by third-parties. These interests are adjusted for contributions to and distributions from Medley entities and are allocated income from Medley entities based on their ownership percentages.
Redeemable non-controlling interests represents a third-party’s interest in certain revenues and expenses of SIC Advisors LLC. The interests are classified outside of permanent equity because the interests are redeemable upon an event outside of Medley’s control.
| F-7 |
Medley LLC
Notes to Condensed Consolidated Financial Statements (unaudited)
Investments
Investments include equity method investments that are not consolidated but in which the Company exerts significant influence. The Company measures the carrying value of its public non-traded equity method investment at NAV per share. The Company measures the carrying value of its privately-held equity method investments by recording its share of the underlying income or loss of these entities.
Unrealized appreciation (depreciation) resulting from changes in fair value of the equity method investments is reflected as a component of other income (expense) in the consolidated statements of operations. The Company evaluates its equity method investments for impairment whenever events or changes in circumstances indicate that the carrying amounts of such investments may not be recoverable.
The carrying amounts of equity method investments are reflected in investments in the consolidated statements of financial condition. As the underlying entities that the Company manages and invests in are, for U.S. GAAP purposes, primarily investment companies which reflect their investments at estimated fair value, the carrying value of the Company’s equity method investments in such entities approximates fair value. The Company evaluates its equity-method investments for impairment whenever events or changes in circumstances indicate that the carrying amounts of such investments may not be recoverable.
Deferred Financing Costs
Deferred financing costs represent direct costs incurred in conjunction with the establishment of credit facilities and debt refinancing. Deferred financing costs, and the related amortization expense, are adjusted when any prepayments of principal are made to the related outstanding debt. These costs are amortized as an adjustment to interest expense over the term of the related debt.
Revenues
Management Fees
Medley provides investment management services to both public and private investment vehicles. Management fees include base management fees, other management fees, and Part I incentive fees, as described below.
Base management fees are calculated based on either (i) the average or ending gross assets balance for the relevant period, (ii) limited partners’ capital commitments to the funds, (iii) invested capital, (iv) NAV or (v) lower of cost or market value of a fund’s portfolio investments. For the private funds, Medley receives base management fees during a specified period of time, which is generally ten years from the initial closing date. However, such termination date may be earlier in certain limited circumstances or later if extended for successive one-year periods, typically up to a maximum of two years. Depending upon the contracted terms of the investment management agreement, management fees are paid either quarterly in advance or quarterly in arrears, and are recognized as earned over the period the services are provided.
Certain management agreements provide for Medley to receive other management fee revenue derived from up front origination fees paid by the portfolio companies of the funds, as well as separately managed accounts. These fees are recognized when Medley becomes entitled to such fees.
Certain management agreements also provide for Medley to receive Part I incentive fee revenue derived from net interest income (excluding gains and losses) above a hurdle rate. Effective January 1, 2016, as it relates to Medley Capital Corporation (“MCC”), these fees are subject to netting against realized and unrealized losses. Part I incentive fees are paid quarterly and are recognized as earned over the period the services are provided.
Performance Fees
Performance fees consist principally of the allocation of profits from certain funds and separately managed accounts, to which Medley provides management services. Medley is generally entitled to an allocation of income as a performance fee after returning the invested capital plus a specified preferred return as set forth in each respective agreement. Medley recognizes revenues attributable to performance fees based upon the amount that would be due pursuant to the respective agreement at each period end as if the funds were terminated at that date. Accordingly, the amount recognized reflects Medley’s share of the gains and losses of the associated funds’ underlying investments measured at their current fair values. Performance fee revenue may include reversals of previously recognized performance fees due to a decrease in the net income of a particular fund that results in a decrease of cumulative performance fees earned to date. Since fund return hurdles are cumulative, previously recognized performance fees also may be reversed in a period of appreciation that is lower than the particular fund’s hurdle rate. For the three months ended June 30, 2016, there was no reversal of previously recognized performance fees. For the six months ended June 30, 2016, the Company reversed $0.7 million of previously recognized performance fees. For each of the three and six months ended June 30, 2015, the Company reversed $4.0 million of previously recognized performance fees. As of June 30, 2016, the Company recognized cumulative performance fees of $4.9 million.
| F-8 |
Medley LLC
Notes to Condensed Consolidated Financial Statements (unaudited)
Performance fees received in prior periods may be required to be returned by Medley in future periods if the funds’ investment performance declines below certain levels. Each fund is considered separately in this regard and, for a given fund, performance fees can never be negative over the life of a fund. If upon a hypothetical liquidation of a fund’s investments, at their then current fair values, previously recognized and distributed performance fees would be required to be returned, a liability is established for the potential clawback obligation. As of June 30, 2016, the Company had not received any performance fee distributions, except for tax distributions related to the Company’s allocation of net income, which included an allocation of performance fees. Pursuant to the organizational documents of each respective fund, a portion of these tax distributions is subject to clawback. As of June 30, 2016, the Company had accrued $7.1 million for clawback obligations that would need to be paid if the funds were liquidated at fair value as of the end of the reporting period. The Company’s actual obligation, however, would not become payable or realized until the end of a fund’s life.
Other Revenues and Fees
Medley provides administrative services to certain affiliated funds and is reimbursed for direct and allocated expenses incurred in providing such administrative services, as set forth in the respective agreement. These fees are recognized as revenue in the period administrative services are rendered.
Performance Fee Compensation
Medley has issued profit interests in certain subsidiaries to select employees. These profit-sharing arrangements are accounted for under ASC 710, Compensation — General, which requires compensation expense to be measured at fair value at the grant date and expensed over the vesting period, which is usually the period over which the service is provided. The fair value of the profit interests are re-measured at each balance sheet date and adjusted for changes in estimates of cash flows and vesting percentages. The impact of such changes is recorded in the consolidated statements of operations as an increase or decrease to performance fee compensation.
Income Taxes
The Company is treated as a partnership for income tax purposes and is therefore not subject to U.S. federal, state and local corporate income taxes. The Company is subject to New York City unincorporated business tax attributable to the Company’s operations apportioned to New York City.
The Company accounts for income taxes using the asset and liability approach, which requires the recognition of tax benefits or expenses for temporary differences between the financial reporting and tax basis of assets and liabilities. A valuation allowance is established when necessary to reduce deferred tax assets to the amounts expected to be realized. The Company also recognizes a tax benefit from uncertain tax positions only if it is “more likely than not” that the position is sustainable based on its technical merits. The Company’s policy is to recognize interest and penalties on uncertain tax positions and other tax matters as a component of income tax expense. For interim periods, the Company accounts for income taxes based on its estimate of the effective tax rate for the year. Discrete items and changes in its estimate of the annual effective tax rate are recorded in the period they occur.
Recent Accounting Pronouncements
In May 2014, the FASB issued ASU 2014-09, Revenue from Contracts with Customers (Topic 606). This guidance outlines a single comprehensive model for entities to use in accounting for revenue arising from contracts with customers and supersedes the most current revenue recognition guidance, including industry-specific guidance. The new standard will become effective for the Company on January 1, 2018. Early application is permitted to the effective date of January 1, 2017. The standard permits the use of either the retrospective or cumulative effect transition method. The Company is evaluating the effect that ASU 2014-09 will have on its consolidated financial statements and related disclosures. The Company has not yet selected a transition method nor has it determined the effect of the standard on its ongoing financial reporting.
| F-9 |
Medley LLC
Notes to Condensed Consolidated Financial Statements (unaudited)
In January 2016, the FASB issued ASU 2016-01, Financial Instruments – Overall: Recognition and Measurement of Financial Assets and Financial Liabilities, which requires that all equity investments (except those accounted for under the equity method of accounting) be measured at fair value with changes in fair value recognized in net income. This ASU eliminated the available-for-sale classification for equity securities with readily determinable fair values. However, companies may elect to measure equity investments that do not have readily determinable fair values at cost minus impairment, if any, plus or minus changes resulting from observable price changes in orderly transactions for the identical or a similar investment of the same issuer. This guidance is effective for fiscal years beginning after December 31, 2017. The Company is currently evaluating the impact of adopting this standard on its consolidated financial statements.
In February 2016, the FASB issued ASU 2016-02, Leases (Topic 842). This guidance requires an entity to recognize assets and liabilities arising from a lease for both financing and operating leases, along with additional qualitative and quantitative disclosures. This guidance is effective for fiscal years beginning after December 15, 2018, with early adoption permitted. The Company is currently evaluating the impact of adopting this standard on its consolidated financial statements.
The Company does not believe any other recently issued, but not yet effective, revisions to authoritative guidance will have a material effect on its consolidated balance sheets, results of operations or cash flows.
| 3. | EQUITY METHOD INVESTMENTS |
Medley measures the carrying value of its public non-traded equity method investments at NAV per share. Unrealized appreciation (depreciation) resulting from changes in NAV per share of the equity method investments is reflected as a component of other income (expense) in the consolidated statements of operations. The carrying value of the Company's privately-held equity method investments is determined based on the amounts invested by the Company, adjusted for the equity in earnings or losses of the investee allocated based on the respective underlying agreements, less distributions received.
The Company evaluates its equity method investments for impairment whenever events or changes in circumstances indicate that the carrying amounts of such investments may not be recoverable. During the three months ended June 30, 2016, the Company assessed that the liquidation value of its investment in CK Pearl Fund was below its carrying value and, that such decline led to an other than temporary impairment. As such, the Company recorded a $0.5 million loss on its investment in CK Pearl Fund which is included as a component of other income (expenses), net on the condensed consolidated statements of operations.
As of June 30, 2016 and December 31, 2015, the Company’s carrying value of its equity method investments was $15.1 million and $16.4 million, respectively. Included in this balance was $9.0 million as of June 30, 2016 and December 31, 2015 from the Company’s investment in publicly-held Sierra Income Corporation (“SIC”). The remaining balance as of June 30, 2016 and December 31, 2015 relates primarily to the Company’s investments in Medley Opportunity Fund I LP (“MOF I”), MOF II and Medley Opportunity Fund III LP (“MOF III”).
| F-10 |
Medley LLC
Notes to Condensed Consolidated Financial Statements (unaudited)
| 4. | OTHER ASSETS |
The components of other assets are as follows:
| As of | ||||||||
| June 30, | As of | |||||||
| 2016 | December 31, | |||||||
| (unaudited) | 2015 | |||||||
| (Amounts in thousands) | ||||||||
| Fixed assets, net of accumulated depreciation of $1,473 and $1,667, respectively | $ | 5,424 | $ | 1,708 | ||||
| Security deposits | 1,975 | 3,034 | ||||||
| Administrative fees receivable (Note 8) | 1,768 | 1,654 | ||||||
| Deferred tax assets | 1,054 | 1,029 | ||||||
| Deferred financing costs, net of accumulated amortization of $65 and $48, respectively | 104 | 122 | ||||||
| Due from affiliates (Note 8) | 1,824 | 1,555 | ||||||
| Prepaid expenses and taxes | 2,118 | 1,636 | ||||||
| Other receivables | 1,291 | 1,059 | ||||||
| Total other assets | $ | 15,558 | $ | 11,797 | ||||
| 5. | LOANS PAYABLE |
The Company’s loans payable consist of the following:
| As of | ||||||||
| June 30, | As of | |||||||
| 2016 | December 31, | |||||||
| (unaudited) | 2015 | |||||||
| (Amounts in thousands) | ||||||||
| Term loans under the Credit Suisse Term Loan Facility, net of unamortized discount of $662 and $777, respectively, and deferred financing costs of $1,461 and $1,712, respectively | $ | 92,877 | $ | 92,511 | ||||
| Non-recourse promissory notes, net of unamortized discount of $1,714 and $1,953, respectively | 8,286 | 8,360 | ||||||
| Total loans payable | $ | 101,163 | $ | 100,871 | ||||
Credit Suisse Term Loan Facility
On August 14, 2014, the Company entered into a $110.0 million senior secured term loan credit facility (as amended, “Term Loan Facility”) with Credit Suisse AG, Cayman Islands Branch, as administrative agent and collateral agent thereunder, Credit Suisse Securities (USA) LLC, as bookrunner and lead arranger, and the lenders from time-to-time party thereto, which will mature on June 15, 2019.
On May 3, 2016, the Term Loan Facility was amended to permit the issuance of additional indebtedness by the Company with proceeds of such indebtedness to be used to prepay loans outstanding under the Term Loan Facility. The amendment also provided for the creation and funding of certain future funds, as well as for certain other technical changes to the Term Loan Facility.
Borrowings under the Term Loan Facility bear interest at the borrower’s option, at a rate equal to either a Eurodollar margin over an adjusted LIBOR (with a “floor” of 1.0%) or a base rate margin over an adjusted base rate determined by reference to the highest of (i) the term loan administrative agent’s prime rate; (ii) the federal funds effective rate in effect on such day plus 0.5%; and (iii) an adjusted LIBOR plus 1.0%. The applicable margins for the Term Loan Facility are 5.5%, in the case of Eurodollar loans and 4.5%, in the case of adjusted base rate loans. Outstanding borrowings under the Term Loan Facility bore interest at a rate of 6.5% as of June 30, 2016 and December 31, 2015. In addition, the Term Loan Facility also provides the borrower with the option to raise incremental credit facilities (including an uncommitted incremental facility that provides the borrower the option to increase the amount available under the Term Loan Credit Facility by an aggregate of up to $15.0 million, subject to additional increases, provided that the net leverage ratio as of the last day of any four-fiscal quarter period, commencing with the four-fiscal quarter period ending December 31, 2014, shall not exceed 2.0 to 1.0). Borrowings are collateralized by substantially all of the equity interests in Medley LLC’s wholly owned subsidiaries.
| F-11 |
Medley LLC
Notes to Condensed Consolidated Financial Statements (unaudited)
The Term Loan Facility requires principal repayments in quarterly installments equal to $1.4 million (which amount may be adjusted as a result of prepayment or incremental term loans drawn) commencing on March 31, 2015, with the remaining amount payable at maturity. The Company can also make voluntary repayments, without penalty, at any time prior to August 14, 2016, not to exceed $33.0 million in the aggregate. As of June 30, 2016 and December 31, 2015, outstanding borrowings under this facility were $92.9 million and $92.5 million, respectively, which is reflected net of unamortized discount of $0.7 million and $0.8 million, respectively, and net of unamortized deferred financing costs of $1.5 million and $1.7 million, respectively. Deferred financing costs and the discount under the term loans are being accreted, using the effective interest method, over the term of the notes. Total interest expense under this Term Loan Facility, including accretion of the note discount and amortization of deferred financing costs, was $1.8 million for each of the three months ended June 30, 2016 and 2015 and $3.5 million for each of the six months ended June 30, 2016 and 2015. The fair value of the outstanding balance of Term Loan Facility approximated its par value as of June 30, 2016.
In October 2014, the Company voluntarily prepaid $15.0 million of outstanding term loans under this facility using a portion of the proceeds received from its initial public offering. The $15.0 million prepayment was applied against the first installment, which was due on March 31, 2015, and the remaining quarterly installments through June 30, 2017.
The Term Loan Facility also contains a financial covenant that requires the Company to maintain a Maximum Net Leverage Ratio of not greater than 3.5 to 1.0, with which the Company is compliant. This ratio is calculated on a trailing twelve months basis and is the ratio of Total Net Debt, as defined, to Core EBITDA, as defined, and is calculated using the Company’s financial results and includes the adjustments made to calculate Core EBITDA. Non-compliance with any of the financial or non-financial covenants without cure or waiver would constitute an event of default under the Term Loan Facility. The Term Loan Facility also contains other customary events of default, including defaults based on events of bankruptcy and insolvency, dissolution, nonpayment of principal, interest or fees when due, breach of specified covenants, change in control and material inaccuracy of representations and warranties. There were no events of default under the Term Loan Facility as of June 30, 2016.
CNB Credit Agreement
On August 19, 2014, the Company entered into a $15.0 million senior secured revolving credit facility with City National Bank (as amended, the "Revolving Credit Facility"). On May 3, 2016, the Revolving Credit Facility was amended to permit issuance of additional indebtedness by the Company. The amendment also provided for the creation and funding of certain future funds, as well as for certain other technical changes to the Revolving Credit Facility. The Company intends to use any proceeds from borrowings under the Revolving Credit Facility for general corporate purposes, including funding of its working capital needs. Borrowings under the Revolving Credit Facility bear interest at the option of the Company, either (i) at an Alternate Base Rate, as defined, plus an applicable margin not to exceed 3.25% or (ii) at an Adjusted LIBOR plus an applicable margin not to exceed 4.0%. As of and during the periods ended June 30, 2016 and December 31, 2015, there were no amounts drawn under the Revolving Credit Facility.
The Revolving Credit Facility also contains a financial covenant that requires the Company to maintain a Maximum Net Leverage Ratio of not greater than 3.5 to 1.0, with which the Company is compliant. This ratio is calculated on a trailing twelve months basis and is the ratio of Total Net Debt, as defined, to Core EBITDA, as defined, and is calculated using the Company’s financial results and includes the adjustments made to calculate Core EBITDA. Non-compliance with any of the financial or non-financial covenants without cure or waiver would constitute an event of default under the Revolving Credit Facility. The Revolving Credit Facility also contains other customary events of default, including defaults based on events of bankruptcy and insolvency, dissolution, nonpayment of principal, interest or fees when due, breach of specified covenants, change in control and material inaccuracy of representations and warranties. There were no events of default under the Revolving Credit Facility as of June 30, 2016.
| F-12 |
Medley LLC
Notes to Condensed Consolidated Financial Statements (unaudited)
Non-Recourse Promissory Notes
In April 2012, the Company borrowed $10.0 million under two non-recourse promissory notes. Proceeds from the borrowings were used to purchase 1,108,033 shares of common stock of SIC, which were pledged as collateral for the obligations. Interest on the notes is paid monthly and is equal to the dividends received by the Company related to the pledged shares. The Company may prepay the notes in whole or in part at any time without penalty and the lenders may call the notes if certain conditions are met. The notes are scheduled to mature in March 2019. The proceeds from the notes were recorded net of issuance costs of $3.8 million and are being accreted, using the effective interest method, over the term of the non-recourse promissory notes. Total interest expense under these non-recourse promissory notes, including accretion of the note discount, was $0.3 million and $0.4 million, respectively, for the three months ended June 30, 2016 and 2015 and $0.7 million for each of the six months ended June 30, 2016 and 2015. The fair value of the outstanding balance of the notes was $10.2 million and $10.1 million as of June 30, 2016 and December 31, 2015, respectively.
In March 2014, the Company issued a promissory note in the amount of $2.5 million to a former Medley member in connection with the purchase of his membership interests. The promissory note carries no interest, has quarterly amortization payments of $312,500, and matured in March 2016. As of December 31, 2015, the balance under this note was $0.3 million.
Contractual Maturities of Loans Payable
As of June 30, 2016, future principal payments due under the loans payable are as follows (in thousands):
| Remaining 2016 | $ | - | ||
| 2017 | 2,875 | |||
| 2018 | 5,500 | |||
| 2019 | 96,625 | |||
| $ | 105,000 |
| 6. | ACCOUNTS PAYABLE, ACCRUED EXPENSES AND OTHER LIABILITIES |
The components of accounts payable, accrued expenses and other liabilities are as follows:
| As of | ||||||||
| June 30, | As of | |||||||
| 2016 | December 31, | |||||||
| (unaudited) | 2015 | |||||||
| (Amounts in thousands) | ||||||||
| Accounts payable, accrued expenses and other liabilities: | ||||||||
| Accrued compensation and benefits | $ | 4,813 | $ | 9,107 | ||||
| Due to affiliates (Note 8) | 16,774 | 13,634 | ||||||
| Revenue share payable (Note 7) | 7,274 | 6,774 | ||||||
| Accrued interest | 223 | 1,304 | ||||||
| Professional fees | 542 | 529 | ||||||
| Deferred rent | 2,984 | 285 | ||||||
| Deferred tax liabilities | 134 | 127 | ||||||
| Accounts payable and other accrued expenses | 2,269 | 2,463 | ||||||
| Total accounts payable, accrued expenses and other liabilities | $ | 35,013 | $ | 34,223 | ||||
| F-13 |
Medley LLC
Notes to Condensed Consolidated Financial Statements (unaudited)
| 7. | COMMITMENTS AND CONTINGENCIES |
Operating Leases
Medley leases office space in New York City and San Francisco under non-cancelable lease agreements that expire at various times through September 2023. Rent expense was $0.6 million for each of the three months ended June 30, 2016 and 2015 and $1.3 million for each of the six months ended June 30, 2016 and 2015.
Future minimum rental payments under non-cancelable leases are as follows as of June 30, 2016 (in thousands):
| Remaining 2016 | $ | 1,335 | ||
| 2017 | 2,683 | |||
| 2018 | 2,704 | |||
| 2019 | 2,710 | |||
| 2020 | 2,833 | |||
| Thereafter | 6,684 | |||
| Total future minimum lease payments | $ | 18,949 |
Capital Commitments to Funds
As of June 30, 2016 and December 31, 2015, the Company had aggregate unfunded commitments of $0.4 million and $0.3 million, respectively, to certain long-dated private funds.
Other Commitments
In April 2012, the Company entered into an obligation to pay a fixed percentage of management and incentive fees received by the Company from SIC. The agreement was entered into contemporaneously with the $10 million non-recourse promissory notes that were issued to the same parties (Note 5). The two transactions were deemed to be related freestanding contracts and the $10 million of loan proceeds were allocated to the contracts using their relative fair values. At inception, the Company recognized an obligation of $4.4 million representing the present value of the future cash flows expected to be paid under this agreement. As of June 30, 2016 and December 31, 2015, this obligation amounted to $7.3 million and $6.8 million, respectively, and is recorded as revenue share payable, a component of accounts payable, accrued expenses and other liabilities on the consolidated balance sheets. The change in the estimated cash flows for this obligation is recorded in other income (expense) on the consolidated statements of operations.
Legal Proceedings
One of the Company’s subsidiaries, MCC Advisors LLC, was named as a defendant in a lawsuit on May 29, 2015, by Moshe Barkat and Modern VideoFilm Holdings, LLC (“MVF Holdings”) against MCC, MOF II, MCC Advisors LLC, Deloitte Transactions and Business Analytics LLP A/K/A Deloitte ERG (“Deloitte”), Scott Avila (“Avila”), Charles Sweet, and Modern VideoFilm, Inc. (“MVF”). The lawsuit is pending in the California Superior Court, Los Angeles County, Central District, as Case No. BC 583437. The lawsuit was filed after MCC, as agent for the lender group, exercised remedies following a series of defaults by MVF and MVF Holdings on a secured loan with an outstanding balance at the time in excess of $65 million. The lawsuit seeks damages in excess of $100 million. Deloitte and Avila have settled the claims against them in exchange for payment of $1.5 million in aggregate. On June 6, 2016, the court granted MCC and the other defendants’ demurrers on several counts and dismissed Mr. Barkat’s claims, except with respect to the intentional interference with contract claim. MCC and the other defendants continue to dispute the remaining claims and are vigorously defending the lawsuit while pursuing affirmative counterclaims against Mr. Barkat and MVF Holdings.
From time to time, the Company is involved in litigation and legal proceedings arising out of the ordinary course of its business. The Company believes that it is not presently a party to any such matters that would have a material adverse effect on its financial condition, results of operations, or cash flows.
| F-14 |
Medley LLC
Notes to Condensed Consolidated Financial Statements (unaudited)
| 8. | RELATED PARTY TRANSACTIONS |
Substantially all of Medley’s revenue is earned through agreements with its consolidated and non-consolidated funds for which it collects management and performance fees for providing investment and management services.
In June 2012, Medley entered into an Expense Support and Reimbursement Agreement (“ESA”) with SIC. Under the ESA, until September 30, 2016, unless extended, Medley will pay up to 100% of SIC’s operating expenses in order for SIC to achieve a reasonable level of expenses relative to its investment income. Pursuant to the ESA, SIC has a conditional obligation to reimburse Medley for any amounts they funded under the ESA if, within three years of the date on which Medley funded such amounts, SIC meets certain financial levels. For the three months ended June 30, 2016 and 2015, Medley recorded $5.5 million and $2.0 million, respectively, for ESA expenses under this agreement. For the six months ended June 30, 2016 and 2015, Medley recorded $10.7 million and $4.2 million, respectively, for ESA expenses under this agreement. The ESA expenses are recorded within general, administrative, and other expense in the consolidated statements of operations. Medley recorded a liability of $9.2 million and $7.2 million as of June 30, 2016 and December 31, 2015, respectively, for ESA expenses related to this agreement. These amounts are included in accounts payable, accrued expenses and other liabilities as due to affiliates on the consolidated balance sheets.
In January 2011, Medley entered into an administration agreement with MCC (the “MCC Admin Agreement”), whereby Medley agreed to provide administrative services necessary for the operations of MCC. MCC agreed to pay Medley for the costs and expenses incurred in providing such administrative services, including an allocable portion of Medley’s overhead expenses and an allocable portion of the cost of MCC’s officers and their respective staffs. Medley records these administrative fees as revenue in the period when the services are provided and are included in other revenues and fees on the consolidated statement of operations. For the three months ended June 30, 2016 and 2015, the Company recorded $0.9 million and $1.0 million, respectively of revenue related to the MCC Admin Agreement. For the six months ended June 30, 2016 and 2015, the Company recorded $2.0 million and $2.1 million, respectively, of revenue related to the MCC Admin Agreement. The administrative fees receivable under the MCC Admin Agreement was $1.0 million and $0.9 million as of June 30, 2016 and December 31, 2015, respectively, and is included as a component of other assets on the consolidated balance sheets.
In April 2012, Medley entered into an administration agreement with SIC (the “SIC Admin Agreement”), whereby Medley agreed to provide administrative services necessary for the operations of SIC. SIC agreed to pay Medley for the costs and expenses incurred in providing such administrative services including an allocable portion of Medley’s overhead expenses and an allocable portion of the cost of SIC’s officers and their respective staffs. Medley records these administrative fees as revenue in the period when the services are provided and are included in other revenues and fees on the consolidated statement of operations. For the three months ended June 30, 2016 and 2015, the Company recorded $0.6 million and $0.5 million, respectively, of revenue related to the SIC Admin Agreement. For the six months ended June 30, 2016 and 2015, the Company recorded $1.2 million and $1.1 million, respectively, of revenue related to the SIC Admin Agreement. The administrative fees receivable under the SIC Admin Agreement was $0.6 million and $0.5 million, respectively, as of June 30, 2016 and December 31, 2015, and is included as a component of other assets on the consolidated balance sheets.
In March 2015, Medley entered into an administration agreement with MCC Senior Loan Strategy JV I LLC (“MCC SLS JV,” the “MCC SLS JV Admin Agreement”), whereby Medley agreed to provide administrative services necessary for the operations of MCC SLS JV. MCC SLS JV agreed to pay Medley for the costs and expenses incurred in providing such administrative services, including an allocable portion of Medley’s overhead expenses and an allocable portion of the cost of MCC SLS JV’s officers and their respective staffs. Medley records these administrative fees as revenue in the period when the services are provided and are included in other revenues and fees on the consolidated statement of operations. For the three and six months ended June 30, 2016, the Company recorded $0.1 million and $0.2 million, respectively, of revenue related to the MCC SLS JV Admin Agreement. The administrative fees receivable under the MCC SLS JV Admin Agreement was $0.1 million as of June 30, 2016 and December 31, 2015, and is included as a component of other assets on the consolidated balance sheets.
In March 2015, Medley entered into an administration agreement with SIC Senior Loan Strategy JV I LLC (“SIC SLS JV,” the “SIC SLS JV Admin Agreement”), whereby Medley agreed to provide administrative services necessary for the operations of SIC SLS JV. SIC SLS JV agreed to pay Medley for the costs and expenses incurred in providing such administrative services, including an allocable portion of Medley’s overhead expenses and an allocable portion of the cost of SIC SLS JV’s officers and their respective staffs. Medley records these administrative fees as revenue in the period when the services are provided and are included in other revenues and fees on the consolidated statement of operations. For the three and six months ended June 30, 2016, the Company recorded $0.1 million and $0.2 million, respectively, of revenue related to the SIC SLS JV Admin Agreement. The administrative fees receivable under the SIC SLS JV Admin Agreement was $0.1 million as of June 30, 2016 and December 31, 2015, and is included as a component of other assets on the consolidated balance sheets.
| F-15 |
Medley LLC
Notes to Condensed Consolidated Financial Statements (unaudited)
In connection with the amended and restated limited liability agreement of Medley LLC, Medley LLC agreed to, at the sole discretion of the managing member, reimburse Medley Management Inc. for all expenses incurred other than expenses incurred in connection with its income tax obligations. From time to time, the Company may also advance funds to Medley Management Inc. to cover its operating needs. For the three months ended June 30, 2016 and 2015, the Company recorded expense reimbursements of $0.6 million and $0.4 million, respectively. For the six months ended June 30, 2016 and 2015, the Company recorded expense reimbursements of $0.9 million and $0.6 million, respectively. The expense reimbursements were recorded as a component of general, administrative and other expenses on the consolidated statements of operations. As of June 30, 2016, the amount due to Medley Management Inc. was $0.5 million and was recorded as a component of accounts payable, accrued expenses and other liabilities on the consolidated balance sheets. As of December 31, 2015, the amount due from Medley Management Inc. was $0.1 million and was recorded as a component of other assets on the consolidated balance sheets.
Pursuant to the organizational agreement between Medley Management Inc. and Medley LLC, Medley Management Inc. may from time to time make grants of restricted stock units or other awards providing the holder with a right to obtain shares of Class A common stock in the future and/or grants of phantom stock or other awards providing the holder with the contractual right to receive cash payments pursuant to an equity plan to employees, advisors or other persons, as defined, in respect of Medley LLC and its subsidiaries. These awards may entitle the holder thereof to receive dividends paid with respect to the shares of Class A common stock underlying such awards as if such holder were a holder of record of the underlying shares of Class A common stock. Medley LLC has agreed that it assumes any obligation to pay such dividend equivalent amounts to the holders of the respective awards. Additionally, pursuant to this agreement, the number of LLC Units held by Medley Management Inc., shall, at all times, equal the number of shares of Class A common stock outstanding.
Equity Method Investments
The Company holds equity method investments in SIC, MOF I, MOF II and MOF III. As of June 30, 2016 and December 31, 2015, the Company’s carrying value of its equity method investments was $15.1 million and $16.4 million, respectively. Included in this balance was $9.0 million as of June 30, 2016 and December 31, 2015, from the Company’s investment in SIC.
The Company typically pays certain operating costs incurred by the funds that it manages. These costs are normally reimbursed by such funds and are included as a component of other assets on the consolidated balance sheets. As of June 30, 2016 and December 31, 2015, the Company recorded $0.8 million, as a receivable balance from MOF II and $0.1 million at the end of each period as a balance receivable from MOF III. The Company accrued $7.1 million as of June 30, 2016 and December 31, 2015 for clawback obligations relating to MOF II that would need to be paid if the fund was liquidated at fair value as of the end of the reporting period. The Company’s actual obligation, however, would not become payable or realized until the end of a fund’s life. The Company did not record any receivable or payable balance on its statement of consolidated balance sheets relating to MOF I.
Promissory Note
In March 2014, the Company issued a promissory note in the amount of $2.5 million to a former Medley member in connection with the purchase of his membership interests. The promissory note carried no interest, had quarterly amortization payments of $312,500 and was paid in full in March 2016.
Exchange Agreement
Prior to the completion of the IPO of Medley Management Inc., the Medley LLC Agreement was restated among other things, to modify its capital structure by reclassifying the interests held by its existing owners (i.e. the members of Medley prior to the IPO of Medley Management Inc.) into the LLC Units. Medley’s existing owners also entered into an exchange agreement under which they (or certain permitted transferees thereof) have the right (subject to the terms of the exchange agreement as described therein), to exchange their LLC Units for shares of Medley Management Inc.’s Class A common stock on a one-for-one basis at fair value, subject to customary conversion rate adjustments for stock splits, stock dividends and reclassifications.
| F-16 |
Medley LLC
Notes to Condensed Consolidated Financial Statements (unaudited)
| 9. | INCOME TAXES |
Deferred income taxes reflect the net effect of temporary differences between the tax basis of an asset or liability and its reported amount on the Company’s consolidated balance sheets. These temporary differences result in taxable or deductible amounts in future years. As of June 30, 2016 and December 31, 2015, the Company had total deferred tax assets of $1.1 million and $1.0 million, respectively, which consists primarily of temporary differences relating to certain accrued expenses, stock compensation and a tax benefit relating to tax goodwill. Total deferred tax liabilities were $0.1 million as of June 30, 2016 and December 31, 2015 which consists primarily of temporary differences relating to accrued fee income and accumulated net unrealized losses. The tax provision for deferred income taxes results from temporary differences arising principally from certain accrued expenses, deferred rent, fee income accruals and depreciation.
The Company’s effective tax rate was 2.4% and 2.8% for the three months ended June 30, 2016 and 2015, respectively, and 2.7% and 2.8% for the six months ended June 30, 2016 and 2015, respectively. The quarterly provision for income taxes is determined based on the Company’s estimated full year effective tax rate adjusted by the amount of tax attributable to infrequent or unusual items that are separately recognized on a discrete basis in the income tax provision in the quarter in which they occur. The Company is subject to New York City unincorporated business tax attributable to its operations apportioned to New York City.
Interest expense and penalties related to income tax matters are recognized as a component of the provision for income taxes. There were no such amounts incurred during the three and six months ended June 30, 2016 and 2015. As of June 30, 2016 and December 31, 2015 and during the three and six months ended June 30, 2016 and 2015, there were no uncertain tax positions taken that were not more likely than not to be sustained. Certain subsidiaries of the Company are no longer subject to tax examinations by taxing authorities for tax years prior to 2011 and, presently, have no open examination for tax years before 2013.
| 10. | COMPENSATION EXPENSE |
Compensation generally includes salaries, bonuses, and profit sharing awards. Bonuses and profit sharing awards are accrued over the service period to which they relate. Guaranteed payments made to our senior professionals who are members of Medley LLC are recognized as compensation expense. The payments to the Company’s Co-Chief Executive Officers are performance based and periodically set subject to maximums based on the Company’s total assets under management. Such maximums aggregated to $1.3 million for each of the three months ended June 30, 2016 and 2015 and $2.5 million for each of the six months ended June 30, 2016 and 2015. For the three and six months ended June 30, 2016 and 2015, neither of the Company’s Co-Chief Executive Officers received any guaranteed payments.
Performance Fee Compensation
In October 2010, the Company granted shares of vested profits interests in certain subsidiaries to select employees. These awards are viewed as a profit-sharing arrangement and are accounted for under ASC 710, which requires compensation expense to be recognized over the vesting period, which is usually the period over which service is provided. The shares were vested at grant date, subject to a divestiture percentage based on percentage of service completed from the award grant date to the employee’s termination date. The Company adjusts the related liability quarterly based on changes in estimated cash flows for the profit interests.
In January 2014, the Company granted additional shares of profit interests in certain subsidiaries to select employees. The shares were fully vested at grant date and were not subject to a divestiture percentage.
In February 2015 and March 2016, the Company granted incentive cash bonus awards to select employees. These awards entitle employees to receive cash compensation based on distributed performance fees received by the Company from certain institutional funds. Eligibility to receive payments pursuant to these incentive awards is based on continued employment and ceases automatically upon termination of employment. Performance compensation expense is recorded based on the fair value of the incentive awards at the date of grant and is recognized on a straight-line basis over the expected requisite service period. The performance compensation liability is subject to re-measurement at the end of each reporting period and any changes in the liability are recognized in the then current reporting period.
For the three and six months ended June 30, 2016, performance fee compensation was less than $0.1 million. For the three and six months ended June 30, 2015, performance fee compensation was $(1.0) million and $(0.9) million, respectively. As of June 30, 2016 and December 31, 2015, the total performance fee compensation payable for these awards was $1.4 million and $1.8 million, respectively.
| F-17 |
Medley LLC
Notes to Condensed Consolidated Financial Statements (unaudited)
Retirement Plan
The Company sponsors a defined-contribution 401(k) retirement plan that covers all employees. Employees are eligible to participate in the plan immediately, and participants are 100% vested from the date of eligibility. The Company makes contributions to the Plan of 3% of an employee’s eligible wages, up to a maximum limit as determined by the Internal Revenue Service. The Company also pays all administrative fees related to the plan. For the three months ended June 30, 2016 and 2015, the Company’s accrued contributions to the plan were $0.2 million and $0.1 million, respectively. For the six months ended June 30, 2016 and 2015, the Company’s accrued contributions to the plan were $0.3 million and $0.2 million, respectively.
Stock-Based Compensation
In connection with the IPO of Medley Management Inc., Medley Management Inc. and Medley LLC adopted the Medley Management Inc. 2014 Omnibus Incentive Plan (the “Plan”). The purpose of the Plan is to provide a means through which the Company may attract and retain key personnel and to provide a means whereby directors, officers, employees, consultants and advisors (and prospective directors, officers, employees, consultants and advisors) of the Company can acquire and maintain an equity interest in the managing member of the Company, Medley Management Inc., or be paid incentive compensation, including incentive compensation measured by reference to the value of Medley Management Inc.’s class A common stock or Medley LLC’s unit interests, thereby strengthening their commitment to the welfare of the Company and aligning their interests with those of Medley Management Inc.’s stockholders. The Plan provides for the issuance of incentive stock options (“ISOs”), nonqualified stock options, stock appreciation rights (“SARs”), restricted stock, restricted stock units (“RSUs”), stock bonuses, other stock-based awards and cash awards. As the grant of these awards are primarily for the benefit of the employees of Medley LLC, stock compensation is recognized in Medley LLC’s separate consolidated financial statements through a corresponding credit to members’ equity, representing a capital contribution by Medley Management Inc. For the three months ended June 30, 2016 and 2015, stock-based compensation was $0.9 million and $0.8 million, respectively. For the six months ended June 30, 2016 and 2015, stock-based compensation was $1.8 million and $1.6 million, respectively. Stock-based compensation was recorded as compensation and benefits on the consolidated statements of operations and contributions on the consolidated statements of changes in equity.
| 11. | REDEEMABLE NON-CONTROLLING INTERESTS |
In January 2016, the Company executed an amendment to SIC Advisors' operating agreement which provided the Company with the right to redeem membership units owned by the minority interest holder. The Company’s redemption right is triggered by the termination of the dealer manager agreement between SIC and SC Distributors LLC, an affiliate of the minority interest holder. As a result of this redemption feature, the Company reclassified the non-controlling interest in SIC Advisors from the equity section to redeemable non-controlling interests in the mezzanine section of the balance sheet based on its fair value as of the amendment date. The fair value of the non-controlling interest was determined to be $12.2 million on the date of the amendment and was adjusted through a charge to members’ capital.
On June 3, 2016, the Company entered into a Master Investment Agreement with DB MED Investor I LLC and DB MED Investor II LLC (the ‘‘Investors’’) to invest up to $50 million in new and existing Medley managed funds (the ‘‘Joint Venture’’). The Company will contribute up to $10 million, and an interest in STRF Advisors LLC, the investment advisor to Sierra Total Return Fund, in exchange for common equity interests in the Joint Venture. The Investors will invest up to $40 million in exchange for preferred equity interests in the Joint Venture. On account of the preferred equity interests, the Investors will receive an 8% preferred distribution, 15% of the Joint Venture’s profits, and all of the profits from the contributed interest in STRF Advisors LLC. Medley has the option, subject to certain conditions, to cause the Joint Venture to redeem the Investors’ interest in exchange for repayment of the outstanding investment amount at the time of redemption, plus certain other considerations. The Investors have the right, after seven years, to redeem their interests in the Joint Venture. As such, the Investors’ interest in the Joint Venture is included as a component of redeemable non-controlling interests on the Company’s consolidated balance sheets. There was no balance as of June 30, 2016.
| 12. | MARKET AND OTHER RISK FACTORS |
Due to the nature of the Medley funds’ investment strategy, their portfolio of investments has significant market and credit risk. As a result, the Company is subject to market and other risk factors, including, but not limited to the following:
| F-18 |
Medley LLC
Notes to Condensed Consolidated Financial Statements (unaudited)
Market Risk
The market price of investments may significantly fluctuate during the period of investment. Investments may decline in value due to factors affecting securities markets generally or particular industries represented in the securities markets. The value of an investment may decline due to general market conditions that are not specifically related to such investment, such as real or perceived adverse economic conditions, changes in the general outlook for corporate earnings, changes in interest or currency rates or adverse investor sentiment generally. They may also decline due to factors that affect a particular industry or industries, such as labor shortages or increased production costs and competitive conditions within an industry.
Credit Risk
There are no restrictions on the credit quality of the investments the Company intends to make. Investments may be deemed by nationally recognized rating agencies to have substantial vulnerability to default in payment of interest and/or principal. Some investments may have low-quality ratings or be unrated. Lower rated and unrated investments have major risk exposure to adverse conditions and are considered to be predominantly speculative. Generally, such investments offer a higher return potential than higher rated investments, but involve greater volatility of price and greater risk of loss of income and principal.
In general, the ratings of nationally recognized rating organizations represent the opinions of agencies as to the quality of the securities they rate. Such ratings, however, are relative and subjective; they are not absolute standards of quality and do not evaluate the market value risk of the relevant securities. It is also possible that a rating agency might not change its rating of a particular issue on a timely basis to reflect subsequent events. The Company may use these ratings as initial criteria for the selection of portfolio assets for the Company but is not required to utilize them.
Limited Liquidity of Investments
The Company intends to invest in investments that may not be readily marketable. Illiquid investments may trade at a discount from comparable, more liquid investments and, at times there may be no market at all for such investments. Subordinate investments may be less marketable, or in some instances illiquid, because of the absence of registration under federal securities laws, contractual restrictions on transfer, the small size of the market or the small size of the issue (relative to issues of comparable interests). As a result, the Company may encounter difficulty in selling its investments or may, if required to liquidate investments to satisfy redemption requests of its investors or debt service obligations, be compelled to sell such investments at less than fair value.
Counterparty Risk
Some of the markets in which the Company may affect its transactions are “over-the-counter” or “interdealer” markets. The participants in such markets are typically not subject to credit evaluation and regulatory oversight, unlike members of exchange-based markets. This exposes the Company to the risk that a counterparty will not settle a transaction in accordance with its terms and conditions because of a dispute over the terms of the applicable contract (whether or not such dispute is bona fide) or because of a credit or liquidity problem, causing the Company to suffer loss. Such “counterparty risk” is accentuated for contracts with longer maturities where events may intervene to prevent settlement, or where the Company has concentrated its transactions with a single or small group of counterparties.
| 13. | SUBSEQUENT EVENTS |
On August 9, 2016, the Company completed a registered public offering of $25 million in aggregate principal amount of 6.875% notes due 2026 at a public offering price of 100% of the principal amount. The notes mature on August 15, 2026, with interest payable quarterly. The notes will be redeemable in whole or in part at Medley’s option on or after August 15, 2019, at the redemption price of 100% of aggregate principal amount, plus any accrued and unpaid interest. The Company intends to use the net proceeds from the offering to repay a portion of the outstanding indebtedness under the Term Loan Facility. The notes are expected to be listed on the New York Stock Exchange and to trade thereon within 30 days of the original issue date under the trading symbol “MDLX.”
| F-19 |
| Item 2. | Management's Discussion and Analysis of Financial Condition and Results of Operations |
The following discussion and analysis should be read in conjunction with our unaudited condensed consolidated financial statements and related notes included elsewhere in this Form 10-Q and our financial statements for the years ended December 31, 2015, 2014 and 2013 included in our prospectus, dated August 4, 2016, filed pursuant to Rule 424(b) of the Securities Act on August 5, 2016 (the “Prospectus”).
Overview
We are an asset management firm offering yield solutions to retail and institutional investors. We focus on credit-related investment strategies, primarily originating senior secured loans to private middle market companies in the United States that have revenues between $50 million and $1 billion. We generally hold these loans to maturity. Our national direct origination franchise, with over 80 people, provides capital to the middle market in the U.S. As of June 30, 2016, we had over $5 billion of AUM in two business development companies, MCC and SIC, as well as private investment vehicles. Over the past 14 years, we have provided in excess of $6 billion of capital to over 300 companies across 35 industries in North America.
We manage two permanent capital vehicles, both of which are BDCs, as well as long-dated private funds and SMAs, focusing on senior secured credit. Our year over year AUM growth as of June 30, 2016 was 25%, driven in large part by the growth of our SMAs, and our compounded annual growth rate from December 31, 2010 through June 30, 2016 was 34% driven in large part by the growth of our permanent capital vehicles.
| · | Permanent capital vehicles: MCC and SIC, have a total AUM of $2.6 billion as of June 30, 2016. |
| · | Long-dated private funds and SMAs: MOF II, MOF III and SMAs, have a total AUM of $2.5 billion as of June 30, 2016. |
For the three and six months ended June 30, 2016, 92% and 91%, respectively, of our revenues were generated from management fees and performance fees derived primarily from net interest income on senior secured loans.
Direct origination, careful structuring and active monitoring of the loan portfolios we manage are important success factors in our business, which can be adversely affected by difficult market and political conditions, such as the turmoil in the global capital markets from 2007 to 2009. Since our inception in 2006, we have adhered to a disciplined investment process that employs these principles with the goal of delivering strong risk-adjusted investment returns while protecting investor capital. We believe that our ability to directly originate, structure and lead deals enables us to consistently lend at higher yields with better terms. In addition, the loans we manage generally have a contractual maturity of between three and seven years and are typically floating rate, which we believe positions our business well for rising interest rates.
Our senior management team has, on average, over 20 years of experience in credit, including originating, underwriting, principal investing and loan structuring. We have made significant investments in our corporate infrastructure and have over 80 employees, including over 40 investment, origination and credit management professionals, and over 40 operations, accounting, legal, compliance and marketing professionals, each with extensive experience in their respective disciplines.
The significant majority of our revenue is derived from management fees, which include base management fees earned on all of our investment products as well as Part I incentive fees earned from our permanent capital vehicles. Our base management fees are generally calculated based upon fee earning assets and paid quarterly in cash. Our Part I incentive fees from our permanent capital vehicles are typically calculated based upon net investment income, subject to a hurdle rate, and are also paid quarterly in cash.
We also earn performance fees from our long-dated private funds and SMAs. Typically, these performance fees are 15% or 20% of the total return above a hurdle rate. These performance fees are accrued quarterly and paid after return of all invested capital and an amount sufficient to achieve the hurdle rate of return.
We also receive incentive fees related to realized capital gains in our permanent capital vehicles that we refer to as Part II incentive fees. Part II incentive fees are payable annually and are calculated at the end of each applicable year by subtracting (i) the sum of cumulative realized capital losses and unrealized capital depreciation from (ii) cumulative aggregate realized capital gains. If the amount calculated is positive, then the Part II incentive fee for such year is equal to 20% of such amount, less the aggregate amount of Part II incentive fees paid in all prior years. If such amount is negative, then no Part II incentive fee will be payable for such year. As our investment strategy is focused on generating yield from senior secured credit, historically we have not generated Part II incentive fees.
| 1 |
Our primary expenses are compensation to our employees, performance fee compensation and general, administrative and other expenses. Compensation includes salaries, discretionary bonuses, stock-based compensation expenses and benefits paid and payable to our employees. Performance fee compensation is related to performance fees, generally consisting of incentive allocations in our long-dated private funds that we grant to certain of our professionals. General and administrative expenses include costs primarily related to professional services, office rent and related expenses, expense support agreement expenses related to SIC, depreciation and amortization, travel and related expenses, information technology, communication and information services, placement fees and third-party marketing expenses and other general operating items.
Registered Public Offering of Medley LLC Notes
On August 9, 2016, Medley LLC completed a registered public offering of $25 million in aggregate principal amount of 6.875% notes due 2026 at a public offering price of 100% of the principal amount. The notes mature on August 15, 2026, with interest payable quarterly. The notes will be redeemable in whole or in part at our option on or after August 15, 2019, at the redemption price of 100% of aggregate principal amount, plus any accrued and unpaid interest. We may in the future issue up to a total of $100 million aggregate principal amount of public debt to repay all of the outstanding indebtedness under the Term Loan Facility. We intend to use the net proceeds from the offering to repay a portion of the outstanding indebtedness under our Term Loan Facility. The 6.875% notes due 2026 are expected to be listed on the New York Stock Exchange and to trade thereon within 30 days of the original issue date under the trading symbol “MDLX.”
Medley LLC Reorganization
In connection with the IPO of Medley Management Inc. on September 29, 2014, Medley LLC amended and restated its limited liability agreement to modify its capital structure by reclassifying the 23,333,333 interests held by the pre-IPO members into a single new class of units (“LLC Units”). The pre-IPO members also entered into an exchange agreement under which they (or certain permitted transferees thereof) have the right, subject to the terms of an exchange agreement, to exchange their LLC Units for shares of Medley Management Inc.’s Class A common stock on a one-for-one basis, subject to customary conversion rate adjustments for stock splits, stock dividends and reclassifications. In addition, pursuant to the amended and restated limited liability agreement, Medley Management Inc. became the sole managing member of Medley LLC.
The pre-IPO owners, are, subject to limited exceptions, prohibited from transferring any LLC Units held by them or any shares of Class A common stock received upon exchange of such LLC Units, until the third anniversary of the date of the closing of the IPO of Medley Management Inc. without the consent of the managing member. Thereafter and prior to the fourth and fifth anniversaries of the closing of the IPO of Medley Management Inc., such holders may not transfer more than 33 1/3% and 66 2/3%, respectively, of the number of LLC Units held by them, together with the number of any shares of Class A common stock received by them upon exchange therefor, without the consent of the managing member.
Our Structure
Medley LLC is a partially owned subsidiary of Medley Management Inc., a holding company whose sole asset is its controlling equity interest in Medley LLC. Medley Management Inc. operates and controls all of the business and affairs and consolidates the financial results of Medley LLC and its subsidiaries. Medley Management Inc. owns 100% of the voting equity interests in Medley LLC and 19.85% of the issued and outstanding LLC Units of Medley LLC. The remaining LLC Units (80.15%) are held by Brook Taube, Seth Taube, and other members of senior management (“Senior Management Owners”). The LLC Units do not have voting rights. Medley Management Inc. and the Senior Management Owners have also entered into an exchange agreement under which the Senior Management Owners (or certain permitted transferees) have the right (subject to the terms of the exchange agreement), to exchange their equity interests in Medley LLC for shares of Medley Management Inc.’s Class A common stock on a one-for-one basis, subject to customary conversion rate adjustments for stock splits, stock dividends and reclassifications.
Holders of equity interests in Medley LLC (other than Medley Management Inc.), were, subject to limited exceptions, prohibited from transferring any such equity interests that were held by them as of September 23, 2014 (the date of consummation of the initial public offering (the “IPO”) of Medley Management Inc.), or any shares of Medley Management Inc.’s Class A common stock received upon exchange of such equity interests, until September 23, 2017 without Medley Management Inc.’s consent. Thereafter and prior to September 23, 2018 and September 23, 2019, such holders may not transfer more than 33⅓% and 66⅔%, respectively, of the number of Medley LLC’s equity interests held by them as of September 23, 2014 (the date of consummation of Medley Management Inc.’s IPO), together with the number of any shares of Medley Management Inc.’s Class A common stock received by them upon exchange therefor, without our consent. While this agreement could be amended or waived by Medley Management Inc., the holders of the equity interests in Medley LLC (other than Medley Management Inc.) have advised us that they do not intend to seek any waivers of these restrictions.
| 2 |
The diagram below depicts our organizational structure (excluding those operating subsidiaries with no material operations or assets) as of August 11, 2016:
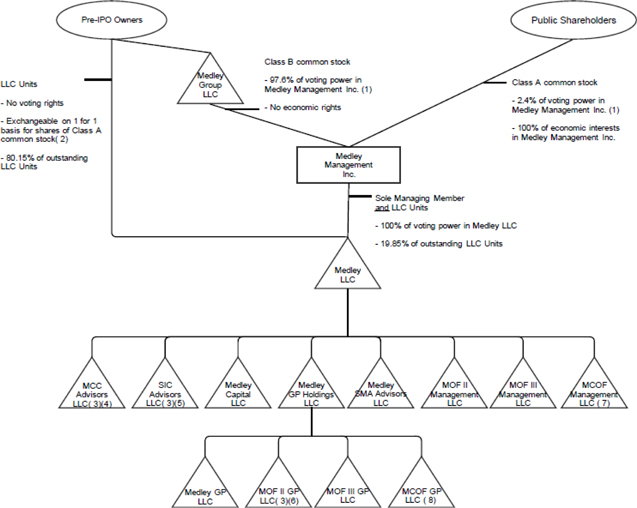
| (1) | The Class B common stock provides Medley Group LLC with a number of votes that is equal to 10 times the aggregate number of LLC Units held by all non-managing members of Medley LLC. From and after the time that the Substantial Ownership Requirement is no longer satisfied, the Class B common stock will provide Medley Group LLC with a number of votes that is equal to the aggregate number of LLC Units held by all non-managing members of Medley LLC that do not themselves hold shares of Class B common stock. |
| (2) | If our pre-IPO owners exchanged all of their LLC Units for shares of Class A common stock, they would hold 80.15% of the outstanding shares of Class A common stock, entitling them to an equivalent percentage of economic interests and voting power in Medley Management Inc., Medley Group LLC would hold no voting power or economic interests in Medley Management Inc. and Medley Management Inc. would hold 100% of outstanding LLC Units and 100% of the voting power in Medley LLC. |
| (3) | Certain individuals, entities and other partners engaged in our business continue to own interests directly in selected operating subsidiaries, including, in certain instances, entities that receive management, performance and incentive fees from funds that we advise. For additional information concerning these interests, see “Business — Fee Structure” included in our Prospectus. |
| (4) | An entity controlled by a former employee holds limited liability company interests in MCC Advisors LLC that entitles it to approximately 5.75% of the net incentive fee income through August 20, 2016 from MCC Advisors LLC. |
| (5) | SC Distributors LLC owns 20% of SIC Advisors LLC and is entitled to receive distributions of up to 20% of the gross cash proceeds received by SIC Advisors LLC from the management and incentive fees payable by Sierra Income Corporation to SIC Advisors LLC, net of certain expenses, as well as 20% of the returns of the investments held at SIC Advisors LLC. |
| (6) | Certain former employees and former members of Medley LLC hold approximately 40% of the limited liability company interests in MOF II GP LLC, the entity that serves as general partner of MOF II, entitling the holders to share the performance fees earned from MOF II. |
| 3 |
| (7) | Medley LLC holds 96.5% of the Class B economic interests in MCOF Management LLC. |
| (8) | Medley GP Holdings LLC holds 96.5% of the Class B economic interests in MCOF GP LLC. |
Trends Affecting Our Business
We believe that our disciplined investment philosophy contributes to the stability of our firm’s performance. Our results of operations, including the fair value of our AUM, are affected by a variety of factors, including conditions in the global financial markets as well as economic and political environments, particularly in the United States.
During fiscal year 2015, concerns over declines in commodity markets, increasing interest rates and slow economic expansion in non U.S. economies, all highlight the fact that economic conditions were unpredictable and volatile for the year. The ongoing volatility in commodity prices, especially of crude oil, and the uncertainty regarding the stability of the oil and gas markets resulted in a tightening of credit across multiple sectors. Mark to market losses on commodity related debt caused volatility on credit returns and increased financing costs for business across most sectors.
In general, these market and economic conditions continued into the first fiscal quarter of 2016. During the second quarter of 2016, broad economic markets showed stability and loan volumes across the lending spectrum improved. Whether markets continue to stabilize or re-enter a period of volatility, our ability to lend across the capital structure and at varying interest rates should provide our firm access to a larger borrower subset over time; especially as traditional lending sources, including banks, continue to pull away from non-investment grade borrowers.
In addition to these macroeconomic trends and market factors, our future performance is dependent on our ability to attract new capital. We believe the following factors will influence our future performance:
| · | The extent to which investors favor directly originated private credit investments. Our ability to attract additional capital is dependent on investors’ views of directly originated private credit investments relative to traditional assets. We believe fundraising efforts will continue to be impacted by certain fundamental asset management trends that include: (i) the increasing importance of directly originated private credit investment strategies for institutional investors; (ii) increasing demand for directly originated private credit investments from retail investors; (iii) recognition by the consultant channel, which serves endowment and pension fund investors, that directly originated private credit is an important component of asset allocation; (iv) increasing demand from insurance companies seeking alternatives to investing in the liquid credit markets; and (v) de-leveraging of the global banking system, bank consolidation and increased bank regulatory requirements. |
| · | Our ability to generate strong, stable returns and retain investor capital throughout market cycles. The capital we are able to attract and retain drives the growth of our AUM, fee earning AUM and management fees. We believe we are well positioned to invest through market cycles given our AUM is in either permanent capital vehicles or long-dated private funds and SMAs. |
| · | Our ability to source investments with attractive risk-adjusted returns. Our ability to grow our revenue is dependent on our continued ability to source attractive investments and deploy the capital that we have raised. We believe that the current economic environment provides attractive investment opportunities. Our ability to identify attractive investments and execute on those investments is dependent on a number of factors, including the general macroeconomic environment, valuation, size and the liquidity of these investment opportunities. A significant decrease in the quality or quantity of investment opportunities in the directly originated private credit market, a substantial increase in corporate default rates, an increase in competition from new entrants providing capital to the private debt market and a decrease in recovery rates of directly originated private credit could adversely affect our ability to source investments with attractive risk-adjusted returns. |
| · | The attractiveness of our product offering to investors. We believe defined contribution plans, retail investors, public institutional investors, pension funds, endowments, sovereign wealth funds and insurance companies are increasing exposure to directly originated private credit investment products to seek differentiated returns and current yield. Our permanent capital vehicles benefit from this demand by offering institutional and retail investors the ability to invest in our private credit investment strategy. We believe that the breadth, diversity and number of investment vehicles we offer allow us to maximize our reach with investors. |
| · | The strength of our investment process, operating platform and client servicing capabilities. Following the most recent financial crisis, investors in alternative investments, including those managed by us, have heightened their focus on matters such as manager due diligence, reporting transparency and compliance infrastructure. Since inception, we have invested heavily in our investment monitoring systems, compliance and enterprise risk management systems to proactively address investor expectations and the evolving regulatory landscape. We believe these investments in operating infrastructure will continue to support our growth in AUM. |
| 4 |
Consolidated Variable Interest Entity
Medley LLC has one majority owned subsidiary, SIC Advisors LLC, that is a consolidated VIE. This entity was organized as a limited liability company and was legally formed to manage a designated fund and to isolate business risk. Except to the extent of the assets of this VIE that are consolidated, the holders of the consolidated VIE’s liabilities generally do not have recourse to us.
Consolidation and Deconsolidation of Medley Funds
Prior to January 1, 2015, we consolidated MOF II in our consolidated financial statements in accordance with ASC 810, Consolidation, as we were the general partner and the limited partners lacked kick out rights or participating rights. Under the guidance of ASU 2015-02, which we adopted on January 1, 2015, we reconsidered the consolidation conclusion for MOF II and, as a result of the new guidance, determined that although MOF II continues to be a VIE, we are no longer considered to be the primary beneficiary. Therefore, we deconsolidated MOF II at January 1, 2015 and recorded our investment in the entity under the equity method of accounting.
Joint Venture
On June 3, 2016, we entered into a Master Investment Agreement with DB MED Investor I LLC and DB MED Investor II LLC (the ‘‘Investors’’) to invest up to $50 million in new and existing Medley managed funds (the ‘‘Joint Venture’’). We will contribute up to $10 million, and an interest in STRF Advisors LLC, the investment advisor to Sierra Total Return Fund, in exchange for common equity interests in the Joint Venture. The Investors will invest up to $40 million in exchange for preferred equity interests in the Joint Venture. On account of the preferred equity interests, the Investors will receive an 8% preferred distribution, 15% of the Joint Venture’s profits, and all of the profits from the contributed interest in STRF Advisors LLC. We have the option, subject to certain conditions, to cause the Joint Venture to redeem the Investors’ interest in exchange for repayment of the outstanding investment amount at the time of redemption, plus certain other considerations. The Investors have the right, after seven years, to redeem their interests in the Joint Venture. As such, the Investors’ interest in the Joint Venture is included as a component of redeemable non-controlling interests on our consolidated balance sheets. There was no balance as of June 30, 2016.
Components of Our Results of Operations
Management Fees. Management fees include both base management fees as well as Part I incentive fees.
| · | Base Management Fees. Base management fees are generally based on a defined percentage of (i) average or total gross assets, including assets acquired with leverage, (ii) total commitments, (iii) net invested capital, (iv) NAV or (v) lower of cost or market value of a fund’s portfolio investments. These fees are calculated quarterly and are paid in cash in advance or in arrears depending on each specific fund. Base management fees are recognized as revenue in the period advisory services are rendered, subject to our assessment of collectability. |
| In addition, we also receive non asset-based management fees that may include special fees such as origination fees, transaction fees and similar fees paid to us in connection with portfolio investments of our funds. These fees are specific to particular transactions and the contractual terms of the portfolio investments, and are recognized when earned. |
| · | Part I Incentive Fees. We also include Part I incentive fees that we receive from our permanent capital vehicles in Management Fees. Part I incentive fees are paid quarterly, in cash, and are driven primarily by net interest income on senior secured loans. Effective January 1, 2016, as it relates to MCC, these fees are subject to netting against realized and unrealized losses. We are primarily an asset manager of yield-oriented products and our incentive fees are primarily derived from spread income rather than trading or capital gains. In addition, we also carefully manage interest rate risk. We are generally positioned to benefit from a raising rate environment, which should benefit fees paid to us from our vehicles and funds. |
| Beginning January 1, 2016, MCC Advisors LLC’s base management fee is calculated at an annual rate of 1.75% on MCC’s gross assets up to $1.0 billion and 1.50% on MCC’s gross assets above $1.0 billion. In addition, MCC Advisors LLC’s Part I incentive fees are equal to 17.5% on pre-incentive fee net investment income, subject to a fixed hurdle rate of 6% per year with a catch-up. Moreover, the incentive fee includes a netting mechanism and is subject to a rolling three-year look back from January 1, 2016 forward. For details of the new MCC fee structure, please see “Business — Fee Structure” included in our Prospectus. Under no circumstances will the new fee structure result in higher fees to MCC Advisors LLC. |
| 5 |
For the three and six months ended June 30, 2015, MCC Part I incentive fees were equal to 20.0% of net investment income (before MCC Part I incentive fees and MCC Part II incentive fees), subject to a fixed hurdle rate of 2.0% per quarter, calculated on the prior quarter NAV. No fee was earned until MCC’s net investment income exceeded the 2.0% hurdle rate. There was a catch-up provision that allocated to us all investment income above the hurdle rate but below a 2.5% return on the prior quarter NAV. Thereafter, we receive 20.0% of MCC’s net investment income above a 2.5% return on the prior quarter NAV. MCC Part I incentive fees are not subject to repayment (or clawback), and are paid quarterly in cash.
SIC Part I incentive fees are equal to 20.0% of its net investment income (before SIC Part I incentive fees and SIC Part II incentive fees), subject to a fixed hurdle rate of 1.75% per quarter, calculated on the prior quarter NAV. No fee is earned until SIC’s net investment income exceeds the 1.75% hurdle rate. There is a catch-up provision that allocates to us all investment income above the hurdle rate but below a 2.1875% return on the prior quarter NAV. Thereafter, we receive 20.0% of SIC’s net investment income above a 2.1875% return on the prior quarter net assets value. SIC Part I incentive fees are not subject to repayment (or clawback) and are paid quarterly in cash.
Performance Fees. Our long-dated private funds and SMAs may have industry standard carried interest performance fee structures and are typically 15% to 20% of the total return over a 6.0% to 8.0% annualized preferred return. We record these fees on an accrual basis, to the extent such amounts are contractually due but not paid, and we present this revenue as a separate line item on our consolidated statements of operations. These fees are subject to clawbacks, and netted against unrealized and realized losses.
The timing and amount of performance fees generated by our funds is uncertain. If we were to have a realization event in a particular quarter or year, it may have a significant impact on our results for that particular quarter or year that may not be replicated in subsequent periods. Refer to “Risk Factors – Risks Related to Our Business and Industry” included in our Prospectus.
Generally, if at the termination of a fund (and sometimes at interim points in the life of a fund), the fund has not achieved investment returns that (in most cases) exceed the preferred return threshold or (in all cases) the general partner receives net profits over the life of the fund in excess of its allocable share under the applicable partnership agreement, we will be obligated to repay an amount equal to the extent to which carried interest that was previously distributed to us exceeds the amounts to which we are ultimately entitled. Medley had not received any distributions of performance fees through June 30, 2016, other than tax distributions, a portion of which is subject to clawback. As of June 30, 2016, we accrued $7.1 million for clawback obligations that would need to be paid if the funds were liquidated at fair value as of the end of the reporting period. Our actual obligation, however, would not become payable or realized until the end of a fund’s life.
For any given period, performance fee revenue on our consolidated statements of operations may include reversals of previously recognized performance fees due to a decrease in the value of a particular fund that results in a decrease of cumulative performance fees earned to date. Since fund return hurdles are cumulative, previously recognized fees also may be reversed in a period of appreciation that is lower than the particular fund's hurdle rate. For the three months ended June 30, 2016, there was no reversal of previously recognized performance fees. For the six months ended June 30, 2016, we reversed $0.7 million of previously recognized performance fees. For each of the three and six months ended June 30, 2015, we reversed $4.0 million of previously recognized performance fees. As of June 30, 2016, we recognized cumulative performance fees of $4.9 million.
| · | Part II Incentive Fees. For our permanent capital vehicles, Part II incentive fees generally represent 20.0% of each fund’s cumulative realized capital gains (net of realized capital losses and unrealized capital depreciation). We have not received these fees historically, and do not expect such fees to be material in the future given our focus on senior secured lending. |
Other Revenues and Fees. We provide administrative services to certain of our affiliated funds that are reported as other revenues and fees. Such fees are recognized as revenue in the period that administrative services are rendered. These fees are generally based on expense reimbursements for the portion of overhead and other expenses incurred by certain professionals directly attributable to each respective fund. These fees are reported within total revenues in our unaudited condensed consolidated financial statements included in this Form 10-Q.
In certain cases, the entities that receive management and incentive fees from our funds are owned by Medley LLC together with other persons. See “Critical Accounting Policies” and Note 2, “Summary of Significant Accounting Policies,” to our unaudited condensed consolidated financial statements included in this Form 10-Q for additional information regarding the manner in which management fees, performance fees and other fees are generated.
| 6 |
Expenses
Compensation and Benefits. Compensation and benefits generally includes salaries, discretionary bonuses and benefits paid and payable to our employees. Compensation also includes stock-based compensation associated with the grants of equity-based awards to our employees. Compensation expenses relating to restricted stock units are measured at fair value as of the grant date, taking into consideration expected forfeitures, and are expensed over the vesting period on a straight-line basis. Bonuses are accrued over the service period to which they relate.
Guaranteed payments made to our senior professionals who are members of Medley LLC are recognized as compensation expense. The payments to our Co-Chief Executive Officers are performance based and periodically set subject to maximums based on our total assets under management. Such maximums aggregated to $1.3 million for each of the three months ended June 30, 2016 and 2015 and $2.5 million for each of the six months ended June 30, 2016 and 2015. For the three and six months ended June 30, 2016 and 2015, neither of our Co-Chief Executive Officers received any guaranteed payments.
Performance Fee Compensation. Performance fee compensation includes compensation related to performance fees, which generally consists of profit interests that we grant to our employees. Depending on the nature of each fund, the performance fee participation is generally structured as a fixed percentage or as an annual award. The liability is recorded subject to the vesting of the profit interests granted and is calculated based upon the net present value of the projected performance fees. Payments to profit interest holders are payable when the performance fees are paid to Medley LLC by the respective fund. It is possible that we may record performance fee compensation during a period in which we do not record any performance fee revenue or we have a reversal of previously recognized performance fee revenue. We have an obligation to pay our employees a portion of the performance fees earned from certain funds.
General, Administrative and Other Expenses. General and administrative expenses include costs primarily related to professional services, office rent, depreciation and amortization, general insurance, recruiting, travel and related expenses, information technology, communication and information services, placement fees, SIC expenses under an investment advisory and expense support and reimbursement agreements and other general operating items.
Other Income (Expense)
Dividend Income. Dividend income consists of dividends associated with our equity method investment in SIC. Dividends are recognized on an accrual basis to the extent that such amounts are declared and expected to be collected.
Interest Expense. Interest expense consists primarily of interest expense relating to debt incurred by us.
Other Income (Expenses), Net. Other income (expenses), net consists primarily of expenses associated with our revenue share payable, equity income (loss) and unrealized gains (losses) associated with our equity method investments.
Provision for Income Taxes. We are treated as a partnership for income tax purposes and are therefore not subject to U.S. federal, state and local corporate income taxes. We are subject to New York City unincorporated business tax attributable to taxable income allocable to New York City.
Deferred tax assets and liabilities are recognized for the future tax consequences attributable to differences between the financial statements carrying amounts of existing assets and liabilities and their respective tax basis. Deferred tax assets and liabilities are measured using enacted tax rates expected to apply to taxable income in the years in which those temporary differences are expected to be recovered or settled. To the extent it is more likely than not that the deferred tax assets will not be recognized, a valuation allowance is provided to offset their benefit.
We recognize the benefit of an income tax position only if it is more likely than not that the tax position will be sustained upon tax examination, based solely on the technical merits of the tax position. Otherwise, no benefit is recognized. The tax benefits recognized are measured based on the largest benefit that has a greater than 50% percent likelihood of being realized upon ultimate settlement. Interest expense and penalties related to income tax matters are recognized as a component of the provision for income taxes.
Net Income (Loss) Attributable to Non-Controlling Interests in Consolidated Subsidiaries. Net income (loss) attributable to non-controlling interests in consolidated subsidiaries represents the ownership interests that third parties hold in our consolidated subsidiaries.
| 7 |
Our private funds are closed-end funds, and accordingly do not permit investors to redeem their interests other than in limited circumstances that are beyond our control, such as instances in which retaining the limited partnership interest could cause the limited partner to violate a law, regulation or rule. In addition, separately managed accounts for a single investor may allow such investor to terminate the investment management agreement at the discretion of the investor pursuant to the terms of the applicable documents. We manage assets for MCC and SIC, both of which are BDCs. The capital managed by MCC and SIC is permanently committed to these funds and cannot be redeemed by investors.
Managing Business Performance
Non-GAAP Financial Information
In addition to analyzing our results on a GAAP basis, management also makes operating decisions and assesses business performance based on the financial and operating metrics and data that are presented without the consolidation of any funds. Core Net Income, Core EBITDA and Core Net Income Margin are non-GAAP financial measures that are used by management to assess the performance of our business. There are limitations associated with the use of non-GAAP financial measures as compared to the use of the most directly comparable U.S. GAAP financial measure and these measures supplement and should be considered in addition to and not in lieu of the results of operations discussed further under ‘‘— Results of Operations,’’ which are prepared in accordance with U.S. GAAP. Furthermore, such measures may be inconsistent with measures presented by other companies. For a reconciliation of these measures to the most comparable measure in accordance with U.S. GAAP, see ‘‘— Reconciliation of Certain Non-GAAP Performance Measures to Consolidated U.S. GAAP Financial Measures.’’
Core Net Income. Core Net Income is an income measure that is used by management to assess the performance of our business through the removal of non-core items, as well as non-recurring expenses associated with the IPO of Medley Management Inc. It is calculated by adjusting net income attributable to Medley LLC to exclude reimbursable expenses associated with the launch of funds, amortization of stock-based compensation expense associated with grants of restricted stock units at the time of the IPO of Medley Management Inc. and other non-core items and the income tax impact of these adjustments.
Core Earnings Before Interest, Income Taxes, Depreciation and Amortization (Core EBITDA). Core EBITDA is an income measure also used by management to assess the performance of our business. Core EBITDA is calculated as Core Net Income before interest expense, income taxes, depreciation and amortization.
Core Net Income Margin. Core Net Income Margin equals Core Net Income divided by total revenue.
| 8 |
Key Performance Indicators
When we review our performance we focus on the indicators described below:
| For the Three Months Ended | For the Six Months Ended | |||||||||||||||
| June 30, | June 30, | |||||||||||||||
| (unaudited) | (unaudited) | |||||||||||||||
| 2016 | 2015 | 2016 | 2015 | |||||||||||||
| (Amounts in thousands, except AUM) | ||||||||||||||||
| Consolidated Financial Data: | ||||||||||||||||
| Net income attributable to Medley LLC | $ | 673 | $ | 8,706 | $ | 1,523 | $ | 18,605 | ||||||||
| Net Income Margin (1) | 3.2 | % | 42.4 | % | 3.9 | % | 40.4 | % | ||||||||
| Non-GAAP Data: | ||||||||||||||||
| Core Net Income | $ | 7,204 | $ | 11,317 | $ | 13,751 | $ | 24,171 | ||||||||
| Core EBITDA | 9,752 | 13,858 | 18,819 | 29,320 | ||||||||||||
| Core Net Income Margin | 33.8 | % | 55.1 | % | 35.4 | % | 52.5 | % | ||||||||
| Other Data (at period end, in millions): | ||||||||||||||||
| AUM | $ | 5,025 | $ | 4,017 | $ | 5,025 | $ | 4,017 | ||||||||
| Fee Earning AUM | 3,158 | 3,350 | 3,158 | 3,350 | ||||||||||||
| (1) | Net Income Margin equals Net income attributable to Medley LLC divided by total revenue. |
AUM
AUM refers to the assets of our funds. We view AUM as a metric to measure our investment and fundraising performance as it reflects assets generally at fair value plus available uncalled capital. For our funds, our AUM equals the sum of the following:
| · | Gross asset values or NAV of such funds; |
| · | the drawn and undrawn debt (at the fund-level, including amounts subject to restrictions); and |
| · | uncalled committed capital (including commitments to funds that have yet to commence their investment periods). |
| 9 |
The table below provides the roll forward of AUM for the three months ended June 30, 2016.
| Permanent Capital Vehicles | Long-dated Private Funds and SMAs | Total | Permanent Capital Vehicles | Long-dated Private Funds and SMAs | ||||||||||||||||
| (Dollars in millions) | ||||||||||||||||||||
| Ending balance, March 31, 2016 | $ | 2,518 | $ | 2,494 | $ | 5,012 | 50 | % | 50 | % | ||||||||||
| Commitments (1) | 27 | 3 | 30 | |||||||||||||||||
| Capital reduction (2) | - | - | - | |||||||||||||||||
| Distributions (3) | (34 | ) | (29 | ) | (63 | ) | ||||||||||||||
| Change in fund value (4) | 40 | 6 | 46 | |||||||||||||||||
| Ending balance, June 30, 2016 | $ | 2,551 | $ | 2,474 | $ | 5,025 | 51 | % | 49 | % | ||||||||||
| (1) | With respect to permanent capital vehicles, represents increases during the period through equity and debt offerings, subject to restrictions, as well as any increases in available undrawn borrowings or capital commitments. With respect to long-dated private funds and SMAs, represents new commitments or gross inflows, respectively, as well as any increases in available undrawn borrowings. |
| (2) | Represents the permanent reduction in equity or leverage during the period. |
| (3) | With respect to permanent capital vehicles, represents distributions of income. With respect to long-dated private funds and SMAs, represents return of capital, given our funds’ stage in their respective life cycle and the prioritization of capital distributions. |
| (4) | Includes interest income, realized and unrealized gains (losses), fees and/or expenses. |
AUM remained consistent at $5.0 billion as of June 30, 2016 compared to AUM as of March 31, 2016. Our permanent capital vehicles increased AUM by $32.4 million, primarily associated with new equity issuances at SIC during the period. Our long-dated private funds and SMAs decreased AUM by $20.1 million, primarily associated with investment paydowns from our SMAs as some of our SMAs are no longer in the investment period.
The table below provides the roll forward of AUM for the six months ended June 30, 2016.
| % of AUM | ||||||||||||||||||||
| Permanent | Long-dated | Permanent | Long-dated | |||||||||||||||||
| Capital | Private Funds | Capital | Private Funds | |||||||||||||||||
| Vehicles | and SMAs | Total | Vehicles | and SMAs | ||||||||||||||||
| (Dollars in millions) | ||||||||||||||||||||
| Ending balance, December 31, 2015 | $ | 2,546 | $ | 2,233 | $ | 4,779 | 53 | % | 47 | % | ||||||||||
| Commitments (1) | 36 | 365 | 401 | |||||||||||||||||
| Capital reduction (2) | (10 | ) | - | (10 | ) | |||||||||||||||
| Distributions (3) | (67 | ) | (128 | ) | (195 | ) | ||||||||||||||
| Change in fund value (4) | 46 | 4 | 50 | |||||||||||||||||
| Ending balance, June 30, 2016 | $ | 2,551 | $ | 2,474 | $ | 5,025 | 51 | % | 49 | % | ||||||||||
| (1) | With respect to permanent capital vehicles, represents increases during the period through equity and debt offerings, subject to restrictions, as well as any increases in available undrawn borrowings or capital commitments. With respect to long-dated private funds and SMAs, represents new commitments or gross inflows, respectively, as well as any increases in available undrawn borrowings. |
| (2) | Represents the permanent reduction in equity or leverage during the period. |
| (3) | With respect to permanent capital vehicles, represents distributions of income. With respect to long-dated private funds and SMAs, represents return of capital, given our funds’ stage in their respective life cycle and the prioritization of capital distributions. |
| (4) | Includes interest income, realized and unrealized gains (losses), fees and/or expenses. |
| 10 |
AUM increased by $245.4 million, or 5%, to $5.0 billion as of June 30, 2016 compared to AUM as of December 31, 2015. Our permanent capital vehicles remained consistent at $2.6 billion as of June 30, 2016. Our long-dated private funds and SMAs increased AUM by $241.4 million, or 11%, primarily associated with new capital commitments from our SMAs, partly offset by distributions by our long-dated private funds and SMAs as some of our vehicles are no longer in the investment period.
Fee Earning AUM
Fee earning AUM refers to assets under management on which we directly earn base management fees. We view fee earning AUM as a metric to measure changes in the assets from which we earn management fees. Our fee earning AUM is the sum of all the individual fee earning assets of our funds that contribute directly to our management fees and generally equals the sum of:
| · | for our permanent capital vehicles, the average or total gross asset value, including assets acquired with the proceeds of leverage (see “Fee earning AUM based on gross asset value” in the “Components of Fee Earning AUM” table below for the amount of this component of fee earning AUM as of each period); |
| · | for certain funds within the investment period in the long-dated private funds, the amount of limited partner capital commitments (see “Fee earning AUM based on capital commitments” in the “Components of Fee Earning AUM” table below for the amount of this component of fee earning AUM as of each period); and |
| · | for the aforementioned funds beyond the investment period, certain managed accounts within their investment period, the amount of limited partner invested capital or the NAV of the fund (see “Fee earning AUM based on invested capital or NAV” in the “Components of Fee Earning AUM” table below for the amount of this component of fee earning AUM as of each period). |
Our calculations of fee earning AUM and AUM may differ from the calculations of other asset managers and, as a result, this measure may not be comparable to similar measures presented by others. In addition, our calculations of fee earning AUM and AUM may not be based on any definition of fee earning AUM or AUM that is set forth in the agreements governing the investment funds that we advise.
Components of Fee Earning AUM
| As of | As of | |||||||
| June 30, | December 31, | |||||||
| 2016 | 2015 | |||||||
| (Amounts in millions) | ||||||||
| Fee earning AUM based on gross asset value | $ | 2,199 | $ | 2,238 | ||||
| Fee earning AUM based on capital commitments | 113 | 113 | ||||||
| Fee earning AUM based on invested capital or NAV | 846 | 951 | ||||||
| Total fee earning AUM | $ | 3,158 | $ | 3,302 | ||||
As of June 30, 2016, fee earning AUM based on gross asset value decreased by $38.9 million, compared to December 31, 2015. The decrease in fee earning AUM based on gross asset value was due primarily to a decrease at MCC that resulted from lower leverage capacity and share repurchases, partly offset by new equity issuances at SIC.
As of June 30, 2016, fee earning AUM based on capital commitments remained consistent compared to December 31, 2015.
As of June 30, 2016, fee earning AUM based on invested capital or NAV decreased by $105.4 million, or 11%, compared to December 31, 2015. The decrease in fee earning AUM based on invested capital or NAV was due primarily to distributions of income and return of capital by our long-dated private funds and SMAs as some of our vehicles are no longer in the investment period.
| 11 |
The table below presents the roll forward of Fee Earning AUM for the three months ended June 30, 2016.
| % of AUM | ||||||||||||||||||||
| Permanent Capital Vehicles | Long-dated Private Funds and SMAs | Total | Permanent Capital Vehicles | Long-dated Private Funds and SMAs | ||||||||||||||||
| (Dollars in millions) | ||||||||||||||||||||
| Beginning balance, March 31, 2016 | $ | 2,159 | $ | 1,010 | $ | 3,169 | 68 | % | 32 | % | ||||||||||
| Commitments (1) | 34 | 2 | 36 | |||||||||||||||||
| Capital reduction (2) | - | - | - | |||||||||||||||||
| Distributions (3) | (34 | ) | (51 | ) | (85 | ) | ||||||||||||||
| Change in fund value (4) | 40 | (2 | ) | 38 | ||||||||||||||||
| Ending balance, June 30, 2016 | $ | 2,199 | $ | 959 | $ | 3,158 | 70 | % | 30 | % | ||||||||||
| (1) | With respect to permanent capital vehicles, represents increases or temporary reductions during the period through equity and debt offerings, as well as any increases in capital commitments. With respect to long-dated private funds and SMAs, represents new commitments or gross inflows, respectively. |
| (2) | Represents the permanent reduction in equity or leverage during the period. |
| (3) | Represents distributions of income, return of capital and return of portfolio investment capital to the fund. |
| (4) | Includes interest income, realized and unrealized gains (losses), fees and/or expenses. |
Total fee earning AUM remained consistent at $3.2 billion as of June 30, 2016 compared to total fee earning AUM as of March 31, 2016.
The table below presents the roll forward of Fee Earning AUM for the six months ended June 30, 2016.
| % of AUM | ||||||||||||||||||||
| Permanent | Long-dated | Permanent | Long-dated | |||||||||||||||||
| Capital | Private Funds | Capital | Private Funds | |||||||||||||||||
| Vehicles | and SMAs | Total | Vehicles | and SMAs | ||||||||||||||||
| (Dollars in millions) | ||||||||||||||||||||
| Ending balance, December 31, 2015 | $ | 2,238 | $ | 1,064 | $ | 3,302 | 68 | % | 32 | % | ||||||||||
| Commitments (1) | (7 | ) | 34 | 27 | ||||||||||||||||
| Capital reduction (2) | (10 | ) | - | (10 | ) | |||||||||||||||
| Distributions (3) | (68 | ) | (127 | ) | (195 | ) | ||||||||||||||
| Change in fund value (4) | 46 | (12 | ) | 34 | ||||||||||||||||
| Ending balance, June 30, 2016 | $ | 2,199 | $ | 959 | $ | 3,158 | 70 | % | 30 | % | ||||||||||
| (1) | With respect to permanent capital vehicles, represents increases or temporary reductions during the period through equity and debt offerings, as well as any increases in capital commitments. With respect to long-dated private funds and SMAs, represents new commitments or gross inflows, respectively. |
| (2) | Represents the permanent reduction in equity or leverage during the period. |
| (3) | Represents distributions of income, return of capital and return of portfolio investment capital to the fund. |
| (4) | Includes interest income, realized and unrealized gains (losses), fees and/or expenses. |
Total fee earning AUM decreased by $144.3 million, or 4%, to $3.2 billion as of June 30, 2016 compared to total fee earning AUM as of December 31, 2015 and was due primarily to distributions of income and return of capital by our long-dated private funds and SMAs as some of our vehicles are no longer in the investment period.
| 12 |
Returns
The following section sets forth historical performance for our active funds.
Sierra Income Corporation (SIC)
We launched SIC, our first public non-traded permanent capital vehicle, in April 2012. SIC primarily focuses on direct lending to middle market borrowers in the United States. Since inception, we have provided capital for a total of 215 investments and have invested a total of $1.4 billion. As of June 30, 2016, the fee earning AUM was $1.1 billion. The performance for SIC as of June 30, 2016 is summarized below:
| Annualized Net Total Return(1): | 6.1 | % | ||
| Annualized Realized Losses on Invested Capital: | 0.1 | % | ||
| Average Recovery: | 86.5 | % |
Medley Capital Corporation (MCC)
We launched MCC, our first permanent capital vehicle in January 2011. MCC primarily focuses on direct lending to private middle market borrowers in the United States. Since inception, we have provided capital for a total of 153 investments and have invested a total of $1.8 billion. As of June 30, 2016, excluding Medley SBIC LP, the fee earning AUM was $832 million. The performance for MCC as of June 30, 2016 is summarized below:
| Annualized Net Total Return(2): | 7.2 | % | ||
| Annualized Realized Losses on Invested Capital: | 1.1 | % | ||
| Average Recovery(3): | NM |
Medley SBIC LP (Medley SBIC)
We launched Medley SBIC in March 2013 as a wholly owned subsidiary of MCC. Medley SBIC lends to smaller middle market private borrowers that we otherwise would not target in our other funds, due primarily to size. Since inception, we have provided capital for a total of 26 investments and have invested a total of $312 million. As of June 30, 2016, the fee earning AUM was $235 million. The performance for Medley SBIC fund as of June 30, 2016 is summarized below:
| Gross Internal Rate of Return(4): | 14.6 | % | ||
| Net Internal Rate of Return(5): | 16.0 | % | ||
| Annualized Realized Losses on Invested Capital: | 0.0 | % | ||
| Average Recovery: | N/A |
Medley Opportunity Fund II LP (MOF II)
MOF II is a long-dated private investment fund that we launched in December 2010. MOF II lends to middle market private borrowers, with a focus on providing senior secured loans. Since inception, we have provided capital for a total of 66 investments and have invested a total of $902 million. As of June 30, 2016, the fee earning AUM was $451 million. MOF II is currently fully invested and actively managing its assets. The performance for MOF II as of June 30, 2016 is summarized below:
| Gross Internal Rate of Return(4): | 12.0 | % | ||
| Net Internal Rate of Return(6): | 6.5 | % | ||
| Annualized Realized Losses on Invested Capital: | 1.3 | % | ||
| Average Recovery(3): | NM |
| 13 |
Medley Opportunity Fund III LP (MOF III)
MOF III is a long-dated private investment fund that we launched in December 2014. MOF III lends to middle market private borrowers in the U.S., with a focus on providing senior secured loans. Since inception, we have provided capital for a total of 15 investments and have invested a total of $103 million. As of June 30, 2016, the fee earning AUM was $113 million. The performance for MOF III as of June 30, 2016 is not meaningful given the fund’s limited operations and capital invested to date.
Separately Managed Accounts (SMAs)
In the case of our separately managed accounts, the investor, rather than us, may control the assets or investment vehicle that holds or has custody of the related investments. Certain subsidiaries of Medley LLC serve as the investment adviser for our SMAs. Since inception, we have provided capital for a total of 81 investments and have invested a total of $591 million. As of June 30, 2016, the fee earning AUM in our SMAs was $395 million. The aggregate performance of our SMAs as of June 30, 2016 is summarized below:
| Gross Internal Rate of Return(4): | 8.9 | % | ||
| Net Internal Rate of Return(7): | 7.5 | % | ||
| Annualized Realized Losses on Invested Capital: | 0.2 | % | ||
| Average Recovery(3): | NM |
Medley Credit Opportunity Fund (MCOF)
We launched MCOF in July 2016 to meet the current demand for equity capital solutions in the traditional corporate debt-backed collateralized loan obligation market. Its investment objective is to generate high current income, and also to generate capital appreciation through investing in CLO equity, as well as, equity and junior debt tranches trading in the secondary market. As of June 30, 2016, MCOF did not have any committed or invested capital.
| (1) | Annualized Net Total Return for SIC represents the annualized return assuming an investment at the initial public offering price, reinvestments of all dividends and distributions at prices obtained under SIC’s dividend reinvestment plan and selling at the NAV as of the measurement date. |
| (2) | Annualized Net Total Return for MCC, including Medley SBIC, represents the annualized return assuming an investment at the initial public offering price, reinvestments of all dividends and distributions at prices obtained under MCC's dividend reinvestment plan and selling at NAV as of the measurement date. |
| (3) | Average Recovery includes only those realized investments in which we experience a loss of principal on a cumulative cash flow basis and is calculated by dividing the total actual cash inflows for each respective investment, including all interest, principal and fee note repayments, dividends and transactions fees, if applicable, by the total actual cash outflows for each respective investment. For MCC, MOF II and the SMAs, we have presented the Average Recovery as “NM” or “Not Meaningful” because we believe the number of realized losses for each respective vehicle is not sufficient to provide an accurate representation of the expected Average Recovery for each vehicle. |
| (4) | For MOF II, SMAs and Medley SBIC, the Gross Internal Rate of Return represents the cumulative investment performance from inception of each respective fund through June 30, 2016. The Gross Internal Rate of Return includes both realized and unrealized investments and excludes the impact of base management fees, incentive fees and other fund related expenses. For realized investments, the investment returns were calculated based on the actual cash outflows and inflows for each respective investment and include all interest, principal and fee note repayments, dividends and transactions fees, if applicable. For unrealized investments, the investment returns were calculated based on the actual cash outflows and inflows for each respective investment and include all interest, principal and fee note repayments, dividends and transactions fees, if applicable. The investment return assumes that the remaining unrealized portion of the investment is realized at the investment’s most recent fair value, as calculated in accordance with U.S. GAAP. There can be no assurance that the investments will be realized at these fair values and actual results may differ significantly. |
| (5) | Earnings from Medley SBIC are paid to MCC. The Net Internal Rate of Return for Medley SBIC was calculated based upon i) the actual cash contribution and distributions to/from MCC and Medley SBIC ii) an allocable portion of MCC’s management and incentive fees and general fund related expenses and iii) assumes the NAV as of the measurement date is distributed to MCC. As of June 30, 2016, Medley SBIC Net Internal Rate of Return as described above assuming only the inclusion of management fees was 19.2%. |
| 14 |
| (6) | Net Internal Rate of Return for MOF II was calculated using the Gross Internal Rate of Return, as described in note 4, and includes the actual management fees, incentive fees and general fund related expenses. |
| (7) | Net Internal Rate of Return for our SMAs was calculated using the Gross Internal Rate of Return, as described in note 4, and includes the actual management fees, incentive fees and general fund related expenses. |
Results of Operations
The following table and discussion sets forth information regarding our consolidated results of operations for the three and six months ended June 30, 2016 and 2015. The unaudited condensed consolidated financial statements of Medley LLC have been prepared on substantially the same basis for all historical periods presented.
| For the Three Months Ended | For the Six Months Ended | |||||||||||||||
| June 30, | June 30, | |||||||||||||||
| (unaudited) | (unaudited) | |||||||||||||||
| 2016 | 2015 | 2016 | 2015 | |||||||||||||
| (Amounts in thousands, except AUM data) | ||||||||||||||||
| Revenues | ||||||||||||||||
| Management fees | $ | 18,695 | $ | 20,923 | $ | 34,958 | $ | 38,443 | ||||||||
| Performance fees | 851 | (2,368 | ) | 260 | 3,968 | |||||||||||
| Other revenues and fees | 1,780 | 1,981 | 3,679 | 3,605 | ||||||||||||
| Total revenues | 21,326 | 20,536 | 38,897 | 46,016 | ||||||||||||
| Expenses | ||||||||||||||||
| Compensation and benefits | 8,564 | 6,397 | 14,432 | 13,618 | ||||||||||||
| Performance fee compensation | 45 | (1,030 | ) | (26 | ) | (918 | ) | |||||||||
| General, administrative and other expenses | 8,899 | 4,623 | 16,878 | 9,130 | ||||||||||||
| Total expenses | 17,508 | 9,990 | 31,284 | 21,830 | ||||||||||||
| Other income (expense) | ||||||||||||||||
| Dividend income | 221 | 221 | 443 | 443 | ||||||||||||
| Interest expense | (2,072 | ) | (2,109 | ) | (4,190 | ) | (4,194 | ) | ||||||||
| Other income (expenses), net | (863 | ) | 13 | (1,614 | ) | (249 | ) | |||||||||
| Total other expense, net | (2,714 | ) | (1,875 | ) | (5,361 | ) | (4,000 | ) | ||||||||
| Income before income taxes | 1,104 | 8,671 | 2,252 | 20,186 | ||||||||||||
| Provision for (benefit from) income taxes | 26 | 239 | 61 | 565 | ||||||||||||
| Net income | 1,078 | 8,432 | 2,191 | 19,621 | ||||||||||||
| Net income (loss) attributable to non-controlling interests in consolidated subsidiaries | 405 | (274 | ) | 668 | 1,016 | |||||||||||
| Net income attributable to Medley LLC | $ | 673 | $ | 8,706 | $ | 1,523 | $ | 18,605 | ||||||||
| Other data (at period end, in millions): | ||||||||||||||||
| AUM | $ | 5,025 | $ | 4,017 | $ | 5,025 | $ | 4,017 | ||||||||
| Fee earning AUM | $ | 3,158 | $ | 3,350 | $ | 3,158 | $ | 3,350 | ||||||||
| 15 |
Three Months Ended June 30, 2016 Compared to Three Months Ended June 30, 2015
Revenues
Management Fees. Total management fees decreased by $2.2 million, or 11%, to $18.7 million for the three months ended June 30, 2016 compared to the three months ended June 30, 2015.
| · | Our management fees from permanent capital vehicles decreased by $0.5 million for the three months ended June 30, 2016 compared to the same period in 2015. Management fees from SIC increased $1.8 million due to an increase in Part I incentive fees and a 17% increase in fee earning AUM for the three months ended June 30, 2016 compared to the same period in 2015. Management fees from MCC decreased $2.3 million due to a decrease in Part I incentive fees and a 16% decrease in average fee earning AUM for the three months ended June 30, 2016 compared to the same period in 2015. |
| · | Our management fees from long-dated private funds and SMAs decreased by $1.8 million for the three months ended June 30, 2016 compared to the same period in 2015. The decrease was primarily due to a decrease in origination fees, partly offset by an increase in base management fees across all funds. |
Performance Fees. Performance fees increased to $0.9 million for the three months ended June 30, 2016 compared to a reversal of performance fees of $2.4 million for the same period in 2015. The increase was due to an increase in underlying fund valuations for the three months ended June 30, 2016 compared to the three months June 30, 2015 as well as the reversal of MOF II performance fees during the three months ended June 30, 2015.
Other Revenues and Fees. Other revenues and fees decreased by $0.2 million, or 10%, to $1.8 million for the three months ended June 30, 2016 compared to the same period in 2015. The decrease was due primarily to a decrease in transaction fees for the three months ended June 30, 2016 compared to the same period in 2015.
Expenses
Compensation and Benefits. Compensation and benefits increased by $2.2 million, or 34% to $8.6 million for the three months ended June 30, 2016 compared to the same period in 2015. The increase was due primarily to an increase in discretionary compensation.
Performance Fee Compensation. Performance fee compensation increased by $1.1 million to a nominal expense for the three months ended June 30, 2016 compared to an expense reversal of $1.0 million for the same period in 2015. The $1.0 million expense reversal for the three months ended June 30, 2015 was due primarily to a mark to market adjustment to our performance fee compensation payable that resulted from a decrease in the projected future payments.
General, Administrative and Other Expenses. General, administrative and other expenses increased by $4.3 million, or 92%, to $8.9 million for the three months ended June 30, 2016 compared to the same period in 2015. The increase was due primarily to an increase in expense support agreement expenses related to SIC.
Other Income (Expense)
Dividend income of $0.2 million remained consistent during the three months ended June 30, 2016 compared to the same period in 2015.
Interest expense of $2.1 million remained consistent for the three months ended June 30, 2016 compared to the same period in 2015. Average debt outstanding during the three months ended June 30, 2016 and 2015 was $105.0 million and $106.1 million, respectively.
Other expenses, net increased by $0.9 million to $0.9 million for the three months ended June 30, 2016 compared to the same period in 2015. The increase was due primarily to an increase in expense associated with our revenue share payable and an impairment charge on our investment in CK Pearl Fund.
Provision for Income Taxes
Our effective income tax rate was 2.4% and 2.8% for the three months ended June 30, 2016 and 2015, respectively. The decrease in the effective income tax rate is due primarily to the impact of the receipt of a tax refund during three months June 30, 2016. We are treated as a partnership for income tax purposes and are therefore not subject to U.S. federal, state and local corporate income taxes. We are subject to New York City unincorporated business tax attributable to taxable income allocable to New York City.
| 16 |
Non-Controlling Interests
Net income attributable to non-controlling interests in consolidated subsidiaries increased by $0.7 million to $0.4 million for the three months ended June 30, 2016 compared to the same period in 2015. The increase was due to no performance fees being recorded for the three months ended June 30, 2016 compared to a reversal of MOF II performance fees for the three months ended June 30, 2015.
Six Months Ended June 30, 2016 Compared to Six Months Ended June 30, 2015
Revenues
Management Fees. Total management fees decreased by $3.5 million, or 9%, to $35.0 million for the six months ended June 30, 2016 compared to the six months ended June 30, 2015.
| · | Our management fees from permanent capital vehicles decreased by $1.5 million for the six months ended June 30, 2016 compared to the same period in 2015. Management fees from SIC increased $4.9 million due to an increase in Part I incentive fees and a 22% increase in average fee earning AUM for the six months ended June 30, 2016 compared to the same period in 2015. Management fees from MCC decreased $6.3 million due to a decrease in Part I incentive fees and a 14% decrease in average fee earning AUM for the six months ended June 30, 2016 compared to the same period in 2015. |
| · | Our management fees from long-dated private funds and SMAs decreased by $2.0 million for the six months ended June 30, 2016, compared to the same period in 2015. The decrease was primarily due to a decrease in origination fees, partly offset by an increase in base management fees across all funds. |
Performance Fees. Performance fees decreased by $3.7 million to $0.3 million for the six months ended June 30, 2016 compared to the same period in 2015. The decrease was due to a decrease in SMA performance fees accruals for the six months ended June 30, 2016 compared to the six months ended June 30, 2015.
Other Revenues and Fees. Other revenues and fees increased by $0.1 million, or 2%, to $3.7 million for the six months ended June 30, 2016 compared to the same period in 2015. The increase was due primarily to an increase in administrative fees from our permanent capital vehicles.
Expenses
Compensation and Benefits. Compensation and benefits increased by $0.8 million, or 6% to $14.4 million for the six months ended June 30, 2016 compared to the same period in 2015. The increase was due primarily to an increase in salaries during the six months ended June 30, 2016 that resulted from an increase in headcount.
Performance Fee Compensation. Performance fee compensation decreased by $0.9 million to a nominal reversal for the six months ended June 30, 2016 compared to the same period in 2015. The variance in performance fee compensation was due primarily to a decrease in reversals of performance fee compensation. For the six months ended June 30, 2015, our performance fee compensation payable decreased due to a mark to market adjustment to our performance fee compensation payable that resulted from a decrease in the projected future payments that resulted from changes in certain projection assumptions.
General, Administrative and Other Expenses. General, administrative and other expenses increased by $7.7 million, or 85%, to $16.9 million for the six months ended June 30, 2016 compared to the same period in 2015. The increase was due primarily to an increase in expense support agreement expenses related to SIC.
Other Income (Expense)
Dividend income of $0.4 million remained consistent during the six months ended June 30, 2016 compared to the same period in 2015.
Interest expense of $4.2 million remained consistent for the six months ended June 30, 2016 compared to the same period in 2015. Average debt outstanding during the six months ended June 30, 2016 and 2015 was $105.1 million and $106.3 million, respectively.
| 17 |
Other expenses, net increased by $1.4 million to $1.6 million for the six months ended June 30, 2016 compared to the same period in 2015. The increase was due primarily to an increase in expense associated with our revenue share payable and an impairment charge on our investment in CK Pearl Fund.
Provision for Income Taxes
Our effective income tax rate was 2.7% and 2.8% for the six months ended June 30, 2016 and 2015, respectively. The decrease in the effective income tax rate is due primarily to the impact of the receipt of a tax refund during the three months ended June 30, 2016 offset by an increase in the annual effective tax rate used to calculate our provision for income taxes. The increase in the annual effective tax rate is attributed to an increase in taxable income allocable to New York City. We are treated as a partnership for income tax purposes and are therefore not subject to U.S. federal, state and local corporate income taxes. We are subject to New York City unincorporated business tax attributable to taxable income allocable to New York City.
Non-Controlling Interests
Net income attributable to non-controlling interests in consolidated subsidiaries decreased by $0.3 million to $0.7 million for the six months ended June 30, 2016 compared to the same period in 2015. The decrease was due to a decrease in performance fees of MOF II.
Reconciliation of Certain Non-GAAP Performance Measures to Consolidated U.S. GAAP Financial Measures
In addition to analyzing our results on a GAAP basis, management also makes operating decisions and assesses business performance based on the financial and operating metrics and data that are presented without the consolidation of any funds. Management believes that these measures provide analysts, investors and management with helpful information regarding our underlying operating performance and our business, as they remove the impact of items management believes are not reflective of underlying operating performance. These non-GAAP measures are also used by management for planning purposes, including the preparation of internal budgets; and for evaluating the effectiveness of operational strategies. Additionally, we believe these non-GAAP measures provide another tool for investors to use in comparing our results with other companies in our industry, many of whom use similar non-GAAP measures. There are limitations associated with the use of non-GAAP financial measures as compared to the use of the most directly comparable U.S. GAAP financial measure and these measures supplement and should be considered in addition to and not in lieu of the results of operations discussed below. Furthermore, such measures may be inconsistent with measures presented by other companies.
Net income attributable to Medley LLC is the U.S. GAAP financial measure most comparable to Core Net Income or Core EBITDA. The following table is a reconciliation of net income attributable to Medley LLC on a consolidated basis to Core Net Income and Core EBITDA.
| For the Three Months Ended | For the Six Months Ended | |||||||||||||||
| June 30, | June 30, | |||||||||||||||
| (unaudited) | (unaudited) | |||||||||||||||
| 2016 | 2015 | 2016 | 2015 | |||||||||||||
| (Amounts in thousands, except share and per share amounts) | ||||||||||||||||
| Net income attributable to Medley LLC | $ | 673 | $ | 8,706 | $ | 1,523 | $ | 18,605 | ||||||||
| Reimbursable fund startup expenses | 5,541 | 1,995 | 10,744 | 4,169 | ||||||||||||
| Stock-based compensation (1) | 673 | 688 | 1,346 | 1,418 | ||||||||||||
| Other non-core items (2) | 521 | - | 521 | 137 | ||||||||||||
| Income tax expense on adjustments | (204 | ) | (72 | ) | (383 | ) | (158 | ) | ||||||||
| Core Net Income | $ | 7,204 | $ | 11,317 | $ | 13,751 | $ | 24,171 | ||||||||
| Interest expense | 2,072 | 2,109 | 4,190 | 4,194 | ||||||||||||
| Income taxes | 229 | 311 | 443 | 723 | ||||||||||||
| Depreciation and amortization | 247 | 121 | 435 | 232 | ||||||||||||
| Core EBITDA | $ | 9,752 | $ | 13,858 | $ | 18,819 | $ | 29,320 | ||||||||
| (1) | Represents a pro-forma adjustment for the amortization of stock-based compensation expense associated with grants of restricted stock units at the time of the IPO of Medley Management Inc. |
| 18 |
| (2) | For the three and six months ended June 30, 2016, other non-core items consists of a $0.5 million impairment loss on our investment in CK Pearl Fund. For the six months ended June 30, 2015, other non-core items consists of a one-time $0.1 million severance cost to former employees. |
Net Income Margin is the U.S. GAAP financial measure most comparable to Core Net Income Margin. Net Income Margin is equal to Net income attributable to Medley LLC divided by total revenue. The following table is a reconciliation of Net Income Margin to Core Net Income Margin.
| For the Three Months Ended | For the Six Months Ended | |||||||||||||||
| June 30, | June 30, | |||||||||||||||
| (unaudited) | (unaudited) | |||||||||||||||
| 2016 | 2015 | 2016 | 2015 | |||||||||||||
| (Amounts in thousands, except share and per share amounts) | ||||||||||||||||
| Net Income Margin | 3.2 | % | 42.4 | % | 3.9 | % | 40.4 | % | ||||||||
| Reimbursable fund startup expenses (1) | 26.0 | % | 9.8 | % | 27.6 | % | 9.2 | % | ||||||||
| Stock-based compensation (1) | 3.2 | % | 3.5 | % | 3.5 | % | 3.2 | % | ||||||||
| Other non-core items (1)(2) | 2.4 | % | 0.0 | % | 1.3 | % | 0.3 | % | ||||||||
| Income tax expense on adjustments | (1.0 | )% | (0.6 | )% | (0.9 | )% | (0.6 | )% | ||||||||
| Core Net Income Margin | 33.8 | % | 55.1 | % | 35.4 | % | 52.5 | % | ||||||||
| (1) | Adjustments to Net income attributable to Medley LLC to calculate Core Net Income are presented as a percentage of total revenue. |
| (2) | For the three and six months ended June 30, 2016, other non-core items consists of a $0.5 million impairment loss on our investment in CK Pearl Fund. For the six months ended June 30, 2015, other non-core items consists of a one-time $0.1 million severance cost to former employees. |
Liquidity and Capital Resources
Our primary cash flow activities involve: (i) generating cash flow from operations, which largely includes management fees; (ii) funding capital commitments that we have made to our funds; (iii) making distributions to our owners; and (iv) borrowings, interest payments and repayments under our debt facilities. As of June 30, 2016, our cash and cash equivalents were $56.2 million.
Our material sources of cash from our operations include: (i) management fees, which are collected quarterly; (ii) performance fees, which can be less predictable as to amount and timing; and (iii) fund distributions received from our investments in products that we manage. We primarily use cash flows from operations to pay compensation and benefits, general, administrative and other expenses, federal, state and local income taxes, debt service, capital expenditures and distributions. Our cash flows, together with the proceeds from equity and debt issuances, are also used to fund investments in limited partnerships, fixed assets and other capital items. If cash flow from operations were insufficient to fund distributions, we expect that we would suspend paying such distributions.
Debt Instruments
Senior Secured Credit Facilities
On August 14, 2014, we entered into a $110.0 million senior secured term loan credit facility (as amended, the “Term Loan Facility”) with Credit Suisse AG, Cayman Islands Branch, as administrative agent and collateral agent thereunder, Credit Suisse Securities (USA) LLC, as bookrunner and lead arranger, and the lenders from time to time party thereto, which will mature on June 15, 2019.
On May 3, 2016, the Term Loan Facility was amended to permit us to issue additional indebtedness with proceeds of such indebtedness to be used to prepay loans outstanding under the Term Loan Facility. The amendment also provided for the creation and funding of certain future funds, as well as for certain other technical changes to the Term Loan Facility.
| 19 |
On August 19, 2014, we entered into a $15.0 million senior secured revolving credit facility with City National Bank (as amended, the "Revolving Credit Facility" and, together with the Term Loan Facility, the "Senior Secured Credit Facilities"), as administrative agent and collateral agent thereunder, and the lenders from time to time party thereto, which will mature on August 19, 2017, with a one-year extension at the option of the borrower, provided certain conditions are met. On May 3, 2016, the Revolving Credit Facility was amended to permit us to issue additional indebtedness. The amendment also provided for the creation and funding of certain future funds, as well as for certain other technical changes to the Revolving Credit Facility. We intend to use any proceeds of borrowings under the Revolving Credit Facility for general corporate purposes, including funding our working capital needs. We have not incurred any borrowings under the Revolving Credit Facility through the date of this filing.
Medley LLC is the borrower under the Senior Secured Credit Facilities. In addition, the Term Loan Facility also provides us with the option to raise incremental credit facilities (including an uncommitted incremental facility that provides the borrower the option to increase the amount available under the Term Loan Credit Facility by an aggregate of up to $15.0 million, subject to additional increases, provided that the net leverage ratio as of the last day of any four-fiscal quarter period commencing with the four-fiscal quarter period ending December 31, 2014, shall not exceed 2.0 to 1.0).
Interest Rate and Fees
Borrowings under the Term Loan Facility bear interest, at our option, at a rate equal to either (i) a Eurodollar margin over an adjusted LIBOR rate (with a “floor” of 1.0%) or (ii) a base rate margin over an adjusted base rate determined by reference to the highest of (a) the term loan administrative agent’s prime rate; (b) the federal funds effective rate in effect on such day plus 0.5%; and (c) an adjusted LIBOR rate plus 1.0%. The applicable margins for the Term Loan Facility are 5.5%, in the case of Eurodollar loans and 4.5%, in the case of adjusted base rate loans.
Borrowings under the Revolving Credit Facility bear interest, at our option, at a rate equal to either (1) a Eurodollar margin over an adjusted LIBOR rate or (2) a base rate margin over an adjusted base rate determined by reference to the highest of (a) the term loan administrative agent’s prime rate; (b) the federal funds effective rate in effect on such day plus 0.5%; and (c) an adjusted LIBOR rate plus 1.0%. The applicable margins for the Revolving Credit Facility are (i) if the ratio of net debt to Core EBITDA is less than 1.0 to 1.0, 1.5% in the case of adjusted base rate loans, and, in the case of Eurodollar loans, (x) 3.0% until maturity; and (ii) if the ratio of net debt to Core EBITDA is greater than or equal to 1.0 to 1.0, 2.50% in the case of adjusted base rate loans, and, in the case of Eurodollar loans, (x) 3.25% until maturity.
In addition to paying interest on outstanding principal under the Senior Secured Credit Facilities, (i) on the closing date of the Term Loan Facility we were required to pay commitment fees to the lenders under the Term Loan Facility in an amount equal to 1% of the aggregate amount of term loans borrowed on the closing date of the Term Loan Facility; and (ii) in respect of the Revolving Credit Facility, we are required to pay an unused line fee of 0.25% per annum of the unused portion of the commitments.
Prepayments
The Senior Secured Credit Facilities require us to prepay outstanding term loans, subject to certain exceptions, with:
| · | 100% of the net cash proceeds (including insurance and condemnation proceeds) of all nonpermitted asset sales or other dispositions of property by the borrower and its subsidiaries, subject to de minimis thresholds, if those net cash proceeds are not reinvested in like assets, financial assets, or other financial services investment strategies within 12 months of the receipt of such net cash proceeds; |
| · | 100% of the net proceeds of any incurrence of debt by the borrower or any of its restricted subsidiaries, other than debt permitted to be incurred or issued under the senior secured credit facilities; and |
| · | 100% of the amount of any equity contributions made to the borrower for the purpose of causing the borrowing to be in compliance with the financial maintenance covenant set forth in the Term Loan Facility. |
The foregoing mandatory prepayments will be applied, first, to the next succeeding four scheduled installments due in respect of the term loans in direct order of maturity and, thereafter, pro rata to the remaining scheduled installments of the term loans.
We have the ability to voluntarily repay outstanding loans at any time without premium or penalty, other than customary “breakage” costs with respect to LIBOR rate loans and a make-whole premium on voluntary prepayments of term loans on or prior to August 14, 2016 to the extent such prepayments exceed $33.0 million in the aggregate, which make-whole premium will be in an amount equal to the then present value of the required interest payments not yet made (assuming an interest rate equal to the adjusted LIBOR rate with a one month interest period made on the date of such prepayment or assignment plus the applicable Eurodollar margin with respect thereto) on the principal amount of the term loan so prepaid that but for such prepayment would have been payable through June 15, 2019 using a discount rate equal to the treasury rate as of the date of such prepayment or assignment plus 50 basis points.
| 20 |
In October 2014, we voluntarily prepaid $15.0 million of the outstanding term loans under this facility using a portion of the proceeds received from our IPO. The $15.0 million prepayment was applied against the first quarterly installment which was due on March 31, 2015, as well as the remaining quarterly installments through June 30, 2017.
Amortization
The Term Loan Facility requires principal repayments in quarterly installments equal to $1,375,000 (which amount may be adjusted as a result of prepayment or incremental term loans drawn), with the remaining amount payable on the applicable maturity date with respect to such term loans.
Guarantees and Collateral
The obligations under the Senior Secured Credit Facilities are unconditionally and irrevocably guaranteed by certain of Medley LLC’s subsidiaries, including Medley Capital LLC, MOF II Management LLC, MOF III Management LLC, Medley SMA Advisors LLC, Medley GP Holdings LLC, and Medley GP LLC (the “credit agreement guarantors”). In addition, the Senior Secured Credit Facilities are collateralized by first priority or equivalent security interests in (i) all the capital stock of, or other equity interests in, the borrower and each of the borrower’s and credit agreement guarantors’ direct or indirect domestic subsidiaries and 65% of the capital stock of, or other equity interests in, each of the borrower’s or any subsidiary guarantors’ direct wholly owned first-tier restricted foreign subsidiaries, and (ii) certain tangible and intangible assets of the borrower and the credit agreement guarantors (subject to certain exceptions and qualifications).
None of our non-wholly owned domestic subsidiaries are obligated to guarantee the Term Loan Facility or Revolving Credit Facility. Such subsidiaries include MCC Advisors LLC, SIC Advisors LLC, MOF II GP LLC and MOF III GP LLC.
Certain Covenants and Events of Default
The Senior Secured Credit Facilities contain a number of significant affirmative and negative covenants and customary events of default. Such covenants, among other things, will limit or restrict, subject to certain exceptions, the ability of the borrower and its restricted subsidiaries to:
| · | incur additional indebtedness, make guarantees and enter into hedging arrangements; |
| · | create liens on assets; |
| · | enter into sale and leaseback transactions; |
| · | engage in mergers or consolidations; |
| · | make fundamental changes; |
| · | pay dividends and distributions or repurchase our capital stock; |
| · | make investments, loans and advances, including acquisitions; |
| · | engage in certain transactions with affiliates; |
| · | make changes in the nature of their business; and |
| · | make prepayments of junior debt. |
In addition, the credit agreements governing our Senior Secured Credit Facilities contain a financial covenant that requires us to maintain, with respect to each four quarter period, a ratio of net debt to Core EBITDA not greater than 3.5 to 1.0. The ratio of net debt to Core EBITDA in respect of the Senior Secured Credit Facilities is calculated using our financial results and includes the adjustments made to calculate Core EBITDA.
| 21 |
Our Senior Secured Credit Facilities contain certain customary representations and warranties, affirmative covenants and events of default. If an event of default occurs, the lenders under the Senior Secured Credit Facilities will be entitled to take various actions, including the acceleration of amounts due under the Senior Secured Credit Facilities and all actions permitted to be taken by a secured creditor.
Medley LLC Notes
On August 9, 2016, Medley LLC completed a registered public offering of $25 million in aggregate principal amount of 6.875% notes due 2026 at a public offering price of 100% of the principal amount. The notes mature on August 15, 2026, with interest payable quarterly. The notes will be redeemable in whole or in part at our option on or after August 15, 2019, at the redemption price of 100% of aggregate principal amount, plus any accrued and unpaid interest. We intend to use the net proceeds from the offering to repay a portion of the outstanding indebtedness under our Term Loan Facility. Medley LLC may in the future issue up to a total of $100 million aggregate principal amount of public debt to repay all of the outstanding indebtedness under the Term Loan Facility. The 6.875% notes due 2026 are expected to be listed on the New York Stock Exchange and to trade thereon within 30 days of the original issue date under the trading symbol “MDLX.”
Non-Recourse Promissory Notes
In April 2012, we borrowed $5.0 million under a non-recourse promissory note with a foundation, and $5.0 million under a non-recourse promissory note with a trust. Proceeds from the borrowings were used to purchase 1,108,033 shares of common stock of SIC, which were pledged as collateral for the obligations. Interest on the notes is paid monthly and is equal to the dividends received by us related to the pledged shares. We may prepay the notes in whole or in part at any time without penalty. The notes are scheduled to mature in March 2019. The proceeds from the notes were recorded net of issuance costs of $3.8 million and are being accrued, using the effective interest method, over the term of the non-recourse promissory notes.
Notes Payable
In March 2014, we issued a promissory note in the amount of $2.5 million to a former Medley member in connection with the purchase of his membership interests. The promissory note carried no interest, had quarterly amortization payments of $0.3 million and matured in March 2016. As of December 31, 2015, $0.3 million was outstanding in respect of this note.
Cash Flows
The significant captions and amounts from our consolidated financial statements are summarized below. Negative amounts represent a net outflow, or use of cash.
| For the Six Months Ended | ||||||||
| June 30, | ||||||||
| (unaudited) | ||||||||
| 2016 | 2015 | |||||||
| (Amounts in thousands) | ||||||||
| Statements of cash flows data | ||||||||
| Net cash provided by (used in) operating activities | $ | 3,205 | $ | 7,183 | ||||
| Net cash provided by (used in) investing activities | (975 | ) | (125 | ) | ||||
| Net cash provided by (used in) financing activities | (17,282 | ) | (27,269 | ) | ||||
| Net increase (decrease) in cash and cash equivalents | $ | (15,052 | ) | $ | (20,211 | ) | ||
Operating Activities
Our net cash flow provided by (used in) operating activities was $3.2 million and $7.2 million for the six months ended June 30, 2016 and 2015, respectively. For the six months ended June 30, 2016 and 2015, net cash flow provided by operating activities was due to net income of $2.2 million and $19.6 million, respectively, non-cash adjustments of $3.3 million and $1.2 million, respectively, and changes in operating assets and liabilities of $(2.3) million and $(13.7) million, respectively.
| 22 |
Investing Activities
Our investing activities generally reflect cash used for acquisitions of fixed assets and distributions received from our equity method investments. Purchases of fixed assets were $1.9 million and $0.1 million, respectively, for the six months ended June 30, 2016 and 2015. Distributions received from equity method investments were $0.9 million for the six months ended June 30, 2016. There were no distributions received from equity method investments for the six months ended June 30, 2015.
Financing Activities
Distributions to members and redeemable non-controlling interests are presented as a use of cash from financing activities and were $15.7 million and $25.8 million, respectively, for the six months ended June 30, 2016 and 2015. Repayments of debt obligations resulted in an outflow of cash of $0.3 million and $0.6 million, respectively, for the six months ended June 30, 2016 and 2015. Repurchases of LLC Units represented a use of cash from financing activities of $1.2 million for the six months ended June 30, 2016. There were no repurchases of LLC Units for the six months ended June 30, 2015.
Sources and Uses of Liquidity
Our sources of liquidity are (i) cash on hand, (ii) net working capital, (iii) cash flows from operations, including performance fees, (iv) realizations on our investments, (v) net proceeds from borrowings under the Senior Secured Credit Facilities and (vi) other potential financings. We believe that these sources of liquidity will be sufficient to fund our working capital requirements and to meet our commitments in the foreseeable future. We expect that our primary liquidity needs will be comprised of cash to (i) provide capital to facilitate the growth of our existing investment management business, (ii) fund our commitments to funds that we advise, (iii) provide capital to facilitate our expansion into business that are complementary to our existing investment management business, (iv) pay operating expenses, including cash compensation to our employees and payments under the TRA, (v) fund capital expenditures, (vi) pay income taxes, and (vii) make distributions to our unitholders.
We intend to use a portion of our available liquidity to fund cash distributions to our unitholders on a quarterly basis. Our ability to fund cash distributions to our unitholders is dependent on a myriad of factors, including among others: general economic and business conditions; our strategic plans and prospects; our business and investment opportunities; timing of capital calls by our funds in support of our commitments; our financial condition and operating results; working capital requirements and other anticipated cash needs; contractual restrictions and obligations; legal, tax and regulatory restrictions; restrictions on the payment of distributions by our subsidiaries to us; and other relevant factors.
Critical Accounting Policies
We prepare our condensed consolidated financial statements in accordance with U.S. GAAP. In applying many of these accounting principles, we need to make assumptions, estimates or judgments that affect the reported amounts of assets, liabilities, revenues and expenses in our consolidated financial statements. We base our estimates and judgments on historical experience and other assumptions that we believe are reasonable under the circumstances. These assumptions, estimates or judgments, however, are both subjective and subject to change, and actual results may differ from our assumptions and estimates. If actual amounts are ultimately different from our estimates, the revisions are included in our results of operations for the period in which the actual amounts become known. We believe the following critical accounting policies could potentially produce materially different results if we were to change underlying assumptions, estimates or judgments. See Note 2, “Summary of Significant Accounting Policies,” to our unaudited condensed consolidated financial statements included in this Form 10-Q for a summary of our significant accounting policies.
Principles of Consolidation
In accordance with ASC 810, Consolidation, we consolidate those entities where we have a direct and indirect controlling financial interest based on either a variable interest model or voting interest model. As such, we consolidate entities that we conclude are VIEs, for which we are deemed to be the primary beneficiary and entities in which we are deemed to be a the primary beneficiary and we hold a majority voting interest or have majority ownership and control over the operational, financial and investing decisions of that entity.
In February 2015, the Financial Accounting Standards Board (“FASB”) issued ASU 2015-02, Consolidation (Topic 810) – Amendments to the Consolidation Analysis, which changes the consolidation analysis that a reporting entity must perform to determine whether it should consolidate certain types of legal entities. We elected to early adopt this new guidance using the modified retrospective method effective January 1, 2015. As a result of the adoption of ASU 2015-02, we determined that it is no longer the primary beneficiary of the funds. Therefore, we deconsolidated certain funds that had been previously consolidated under previous guidance effective January 1, 2015. Restatement of periods prior to January 1, 2015 was not required.
| 23 |
For legal entities evaluated for consolidation, we must determine whether the interests that it holds and fees paid to it qualify as a variable interest in an entity. This includes an evaluation of the management fees and performance fees paid to us when acting as a decision maker or service provider to the entity being evaluated. Under the new guidance, (1) fees received by us that are customary and commensurate with the level of services provided, and (2) we don’t hold other economic interests in the entity that would absorb more than an insignificant amount of the expected losses or returns of the entity, would not be considered a variable interest. We factor in all economic interests including proportionate interests through related parties, to determine if fees are considered a variable interest. Prior to the adoption of the new consolidation guidance, these fees were considered variable interests by us.
An entity in which we hold a variable interest is a VIE if any one of the following conditions exist: (a) the total equity investment at risk is not sufficient to permit the legal entity to finance its activities without additional subordinated financial support, (b) the holders of equity investment at risk have the right to direct the activities of the entity that most significantly impact the legal entity’s economic performance, (c) the voting rights of some investors are disproportionate to their obligation to absorb losses or rights to receive returns from a legal entity. Under the new guidance, for limited partnerships and other similar entities, non-controlling investors must have substantive rights to either dissolve the fund or remove the general partner (“kick-out rights”) in order to qualify as a VIE.
For those entities that qualify as a VIE, the primary beneficiary is generally defined as the party who has a controlling financial interest in the VIE. We are generally deemed to have a controlling financial interest if we have (a) the power to direct the activities of a VIE that most significantly impact the VIE’s economic performance, and (b) the obligation to absorb losses or receive benefits from the VIE that could potentially be significant to the VIE. We determine whether we are the primary beneficiary of a VIE at the time we become initially involved with the VIE and we reconsider that conclusion continuously. The primary beneficiary evaluation is generally performed qualitatively on the basis of all facts and circumstances. However, quantitative information may also be considered in the analysis, as appropriate. These assessments require judgments. Each entity is assessed for consolidation on a case-by-case basis.
For those entities evaluated under the voting interest model, we consolidate the entity if we have a controlling financial interest. We have a controlling financial interest in a voting interest entity (“VOE”) if we own a majority voting interest in the entity. Prior to the new guidance, we consolidated VOE’s where we were the general partner and as such, were presumed to have control.
Performance Fees
Performance fees are based on certain specific hurdle rates as defined in the funds’ applicable investment management or partnership agreements. Performance fees are recorded on an accrual basis to the extent such amounts are contractually due.
We have elected to adopt Method 2 of ASC 605, Revenue Recognition, for revenue based on a formula. Under this method, we are entitled to performance-based fees that can amount to as much as 20.0% of a fund's profits, subject to certain hurdles. Performance-based fees are assessed as a percentage of the investment performance of the funds. The performance fee for any period is based upon an assumed liquidation of the fund's net assets on the reporting date, and distribution of the net proceeds in accordance with the fund 's income allocation provisions. The performance fees may be subject to reversal to the extent that the performance fees recorded exceeds the amount due to the general partner or investment manager based on a fund's cumulative investment returns.
Performance fees receivable is presented separately in our unaudited condensed consolidated statements of financial condition included in this Form 10-Q and represents performance fees recognized but not yet collected. The timing of the payment of performance fees due to the general partner or investment manager varies depending on the terms of the applicable fund agreements.
If applicable, we record an accrual for the potential repayment of previously received performance fees which represents amounts that would need to be repaid to the underlying funds if these funds were to be liquidated based on the current fair value of the underlying funds’ investments as of the reporting date. Our actual obligation, however, would not become payable or realized until the end of a fund’s life.
Performance Fee Compensation Payable
We have an obligation to pay our professionals a portion of the performance fees earned from certain funds. These amounts are accounted for as compensation expense in conjunction with the recognition of the related performance fee revenue and, until paid, are recognized as performance fee compensation payable. Performance fee compensation is recognized in the same period that the related performance fees are recognized. Performance fee compensation can be reversed during periods when there is a decline in performance fees that were previously recognized.
| 24 |
Income Taxes
We are treated as a partnership for income tax purposes and are therefore not subject to U.S. federal, state and local corporate income taxes. We are subject to New York City unincorporated business tax attributable to taxable income allocable to New York City.
We account for income taxes using the asset and liability approach, which requires the recognition of tax benefits or expenses for temporary differences between the financial reporting and tax basis of assets and liabilities. A valuation allowance is established when necessary to reduce deferred tax assets to the amounts expected to be realized. We also recognize a tax benefit from uncertain tax positions only if it is “more likely than not” that the position is sustainable based on its technical merits. Our policy is to recognize interest and penalties on uncertain tax positions and other tax matters as a component of income tax expense. For interim periods, we account for income taxes based on our estimate of the effective tax rate for the year. Discrete items and changes in our estimate of the annual effective tax rate are recorded in the period they occur.
We analyze our tax filing positions in all of the U.S. federal, state and local tax jurisdictions where we are required to file income tax returns, as well as for all open tax years in these jurisdictions. If, based on this analysis, we determine that uncertainties in tax positions exist, a liability is established.
Recent Accounting Pronouncements
Information regarding recent accounting pronouncements and their impact on us can be found in Note 2, “Summary of Significant Accounting Policies,” to our unaudited condensed consolidated financial statements included in this Form 10-Q.
Off-Balance Sheet Arrangements
In the normal course of business, we may engage in off-balance sheet arrangements, including transactions in guarantees, commitments, indemnifications and potential contingent repayment obligations.
See Note 7, “Commitments and Contingencies,” to our unaudited condensed consolidated financial statements included in this Form 10-Q for a discussion of our commitments and contingencies.
Contractual Obligations
As of June 30, 2016, there were no material changes to our contractual obligations, commitments and contingencies since March 31, 2016. Refer to our Prospectus for additional information regarding our contractual obligations and commercial commitments.
Indemnifications
In the normal course of business, we enter into contracts that contain indemnities for our affiliates, persons acting on our behalf or such affiliates and third parties. The terms of the indemnities vary from contract to contract and the maximum exposure under these arrangements, if any, cannot be determined and has neither been recorded in our consolidated financial statements. As of June 30, 2016, we have not had prior claims or losses pursuant to these contracts and expect the risk of loss to be remote.
Contingent Obligations
The partnership documents governing our funds generally include a clawback provision that, if triggered, may give rise to a contingent obligation that may require the general partner to return amounts to the fund for distribution to investors. Therefore, performance fee revenue, generally, is subject to reversal in the event that the funds incur future losses. These losses are limited to the extent of the cumulative performance fee revenue recognized in income to date, net of a portion of taxes paid. Due in part to our investment performance and the fact that our performance fee revenue is generally determined on a liquidation basis, as of June 30, 2016, we accrued $7.1 million for clawback obligations that would need to be paid had the funds been liquidated as of that date. There can be no assurance that we will not incur additional clawback obligations in the future. If all of the existing investments were valued at $0, the amount of cumulative performance fee revenue that have been recognized would be reversed. We believe that the possibility of all of the existing investments becoming worthless is remote. At June 30, 2016, had we assumed all existing investments were valued at $0, the net amount of performance fee revenue subject to additional reversal would have been approximately $2.1 million.
| 25 |
Performance fee revenue is also affected by changes in the fair values of the underlying investments in the funds that we advise. Valuations, on an unrealized basis, can be significantly affected by a variety of external factors including, but not limited to, bond yields and industry trading multiples. Under the governing agreements of certain of our funds, we may have to fund additional amounts on account of clawback obligations beyond what we received in performance fee compensation on account of distributions of performance fee payments made to current or former professionals from such funds if they do not fund their respective shares of such clawback obligations. We will generally retain the right to pursue any remedies that we have under such governing agreements against those carried interest recipients who fail to fund their obligations.
Additionally, at the end of the life of the funds, there could be a payment due to a fund by us if we have recognized more performance fee revenue than was ultimately earned. The general partner obligation amount, if any, will depend on final realized values of investments at the end of the life of the fund.
| Item 3. | Quantitative and Qualitative Disclosures About Market Risk |
Our primary exposure to market risk is related to our role as general partner or investment adviser to our investment funds and the sensitivity to movements in the fair value of their investments, including the effect on management fees, performance fees and investment income.
The market price of investments may significantly fluctuate during the period of investment. Investments may decline in value due to factors affecting securities markets generally or particular industries represented in the securities markets. The value of an investment may decline due to general market conditions which are not specifically related to such investment, such as real or perceived adverse economic conditions, changes in the general outlook for corporate earnings, changes in interest or currency rates or adverse investor sentiment generally. They may also decline due to factors that affect a particular industry or industries, such as labor shortages or increased production costs and competitive conditions within an industry.
Effect on Management Fees
Management fees are generally based on a defined percentage of gross asset values, total committed capital, net invested capital and NAV of the investment funds managed by us as well as a percentage of net interest income over a performance hurdle. Management fees calculated based on fair value of assets or net investment income are affected by short-term changes in market values.
The overall impact of a short-term change in market value may be mitigated by fee definitions that are not based on market value including invested capital and committed capital, market value definitions that exclude the impact of realized and/or unrealized gains and losses, market value definitions based on beginning of the period values or a form of average market value including daily, monthly or quarterly averages, as well as monthly or quarterly payment terms.
As such, based on an incremental 10% short-term increase in fair value of the investments in our permanent capital vehicles, long-dated private funds and SMAs’ as of June 30, 2016, we calculated a $0.8 million increase in management fees for the three and six months ended June 30, 2016. In the case of a 10% short-term decline in fair value of the investments in our permanent capital, long-dated funds and SMAs’ as of June 30, 2016, we calculated a $1.0 million decrease in management fees for the three and six months ended June 30, 2016.
Effect on Performance Fees
Performance fees are based on certain specific hurdle rates as defined in the funds' applicable investment management or partnership agreements. The performance fees for any period are based upon an assumed liquidation of the fund's net assets on the reporting date, and distribution of the net proceeds in accordance with the fund's income allocation provisions, which can result in a performance-based fee to us, subject to certain hurdles and benchmarks. The performance fees may be subject to reversal to the extent that the performance fees recorded exceed the amount due to the general partner or investment manager based on a fund's cumulative investment returns.
Short-term changes in the fair values of funds' investments may materially impact accrued performance fees depending on the respective funds' performance relative to applicable hurdles. The overall impact of a short-term change in market value may be mitigated by a number of factors including, but not limited to, the way in which carried interest performance fees are calculated, which is not ultimately dependent on short-term moves in fair market value, but rather realize cumulative performance of the investments through the end of the long-dated private funds and SMAs’ lives. However, short-term moves can meaningfully impact our ability to accrue performance fees and receive cash payments in any given period.
| 26 |
As such, based on an incremental 10% short-term increase in fair value of the investments in our long-dated private funds and SMAs’ as of June 30, 2016, we calculated a $34.7 million and $34.9 million increase in performance fees for the three and six months ended June 30, 2016, respectively. In the case of a 10% short-term decline in fair value of investments in our long-dated private funds and SMAs’ as of June 30, 2016, we calculated a $1.0 million and $0.8 million decrease in performance fees for the three and six months ended June 30, 2016, respectively.
Effect on Part I and Part II Incentive Fees
Incentive fees are based on certain specific hurdle rates as defined in our permanent capital vehicles' applicable investment management agreements. The Part II incentive fees are based upon realized gains netted against cumulative realized and unrealized losses. The Part I incentive fees are not subject to clawbacks as our carried interest performance fees are.
Short-term changes in the fair values of the investments of our permanent capital vehicles may materially impact Part II incentive fees depending on the respective vehicle's performance relative to applicable hurdles to the extent there were realized gains that we would otherwise earn Part II incentive fees on.
As such, based on an incremental 10% short-term increase in fair value of the investments in our permanent capital vehicles as of June 30, 2016, we calculated a $5.5 million increase in Part I and II incentive fees for the three and six months ended June 30, 2016. In the case of a 10% short-term decline in fair value of the investments in our permanent capital vehicles as of June 30, 2016, we calculated a nominal increase of less than $0.1 million in Part I incentive fees for the three and six months ended June 30, 2016, respectively.
Interest Rate Risk
As of June 30, 2016, we had $101.2 million of debt outstanding, presented as loans payable on our unaudited condensed consolidated financial statements included elsewhere in this Form 10-Q. The annual interest rate on the loans was 6.50% as of June 30, 2016.
Based on the floating rate component of our debt obligations payable as of June 30, 2016, we estimate that in the event of a change of 100 basis point in interest rates and the outstanding balance as of June 30, 2016, interest expense related to variable rates would increase or decrease by 15% or $0.2 million and $0.5 million for the three and six months ended June 30, 2016, respectively.
As credit-oriented investors, we are also subject to interest rate risk through the securities we hold in our funds. A 100 basis point increase in interest rates would be expected to negatively affect prices of securities that accrue interest income at fixed rates and therefore negatively impact net change in unrealized appreciation on the funds' investments. The actual impact is dependent on the average duration of such holdings. Conversely, securities that accrue interest at variable rates would be expected to benefit from a 100 basis points increase in interest rates because these securities would generate higher levels of current income and therefore positively impact interest and dividend income, subject to LIBOR. In the cases where our funds pay management fees based on NAV, we would expect management fees to experience a change in direction and magnitude corresponding to that experienced by the underlying portfolios.
Credit Risk
We are party to agreements providing for various financial services and transactions that contain an element of risk in the event that the counterparties are unable to meet the terms of such agreements. In such agreements, we depend on the respective counterparty to make payment or otherwise perform. We generally endeavor to minimize our risk of exposure by limiting to reputable financial institutions the counterparties with which we enter into financial transactions. In other circumstances, availability of financing from financial institutions may be uncertain due to market events, and we may not be able to access these financing markets.
| 27 |
| Item 4. | Controls and Procedures |
Evaluation of Disclosure Controls and Procedures
We maintain disclosure controls and procedures (as that term is defined in Rules 13a-15(e) and 15d-15(e) under the Exchange Act) that are designed to ensure that information required to be disclosed in our reports under the Exchange Act is recorded, processed, summarized and reported within the time periods specified in the SEC’s rules and forms, and that such information is accumulated and communicated to our management, including our co-principal executive officers and principal financial officer, as appropriate, to allow timely decisions regarding required disclosures. The design of any disclosure controls and procedures is based in part upon certain assumptions about the likelihood of future events, and there can be no assurance that any design will succeed in achieving its stated goals under all potential future conditions. Any controls and procedures, no matter how well designed and operated, can provide only reasonable, not absolute, assurance of achieving the desired control objectives. Our management, with the participation of our Co-Chief Executive Officers and our Chief Financial Officer, has evaluated the effectiveness of the design and operation of our disclosure controls and procedures as of the end of the period covered by this report. Based upon that evaluation, and subject to the foregoing, our Co-Chief Executive Officers and our Chief Financial Officer have concluded that, as of the end of the period covered by this report, the design and operation of our disclosure controls and procedures were effective to accomplish their objectives at the reasonable assurance level.
Changes in Internal Control over Financial Reporting
There have been no changes in our internal control over financial reporting (as that term is defined in Rules 13a-15(f) and 15d-15(f) under the Exchange Act) during the quarter ended June 30, 2016, that have materially affected, or are reasonably likely to materially affect, our internal control over financial reporting.
| Item 1. | Legal Proceedings |
From time to time, we are involved in various legal proceedings, lawsuits and claims incidental to the conduct of our business. Our business are also subject to extensive regulation, which may result in regulatory proceedings against us. Except as described below, we are not currently party to any material legal proceedings.
One of our subsidiaries, MCC Advisors LLC, was named as a defendant in a lawsuit on May 29, 2015, by Moshe Barkat and Modern VideoFilm Holdings, LLC (“MVF Holdings”) against MCC, MOF II, MCC Advisors LLC, Deloitte Transactions and Business Analytics LLP A/K/A Deloitte ERG (“Deloitte”), Scott Avila (“Avila”), Charles Sweet, and Modern VideoFilm, Inc. (“MVF”). The lawsuit is pending in the California Superior Court, Los Angeles County, Central District, as Case No. BC 583437. The lawsuit was filed after Medley Capital Corporation, as agent for the lender group, exercised remedies following a series of defaults by MVF and MVF Holdings on a secured loan with an outstanding balance at the time in excess of $65 million. The lawsuit seeks damages in excess of $100 million. Deloitte and Avila have settled the claims against them in exchange for payment of $1.5 million. On June 6, 2016, the court granted MCC and the other defendant’s demurrers on several counts and dismissed Mr. Barkat’s claims, except with respect to the intentional interference with contract claim. MCC and the other defendants continue to dispute the remaining claims and are vigorously defending the lawsuit while pursuing affirmative counterclaims against Mr. Barkat and MVF Holdings.
| Item 1A. | Risk Factors |
For a discussion of our potential risks and uncertainties, see the information under the heading “Risk Factors” in Part I., Item 1A. of our Prospectus, which is accessible on the SEC’s website at www.sec.gov.
| Item 2. | Unregistered Sales of Equity Securities and Use of Proceeds |
None.
| Item 3. | Defaults Upon Senior Securities |
None.
| 28 |
| Item 4. | Mine Safety Disclosures |
Not Applicable.
| Item 5. | Other Information |
None.
| Item 6. | Exhibits |
The required exhibits are listed in the Exhibit Index and are incorporated herein by reference.
| 29 |
Pursuant to the requirements of the Securities Exchange Act of 1934, the Registrant has duly caused this report to be signed on its behalf by the undersigned thereunto duly authorized.
| MEDLEY LLC | ||
| (Registrant) | ||
| Date: August 11, 2016 | By: | /s/ Richard T. Allorto, Jr. |
| Richard T. Allorto Jr. | ||
| Chief Financial Officer | ||
| (Principal Financial Officer and Authorized Signatory) | ||
| 30 |
EXHIBIT INDEX
| Exhibit No. | Description | |
| 10.1 | First Amendment dated as of May 3, 2016 to the Credit Agreement, dated as of August 14, 2014, among Medley LLC, the lenders party thereto and Credit Suisse AG, Cayman Islands Branch (incorporated by reference to Exhibit 10.2 to Medley Management Inc.’s Quarterly Report on Form 10-Q for the quarter ended June 30, 2016) | |
| 10.2 | Amendment Number One and Consent dated as of August 12, 2015 to the Credit Agreement, dated as of August 19, 2014, among Medley LLC, the lenders party thereto and City National Bank (incorporated by reference to Exhibit 10.3 to Medley Management Inc.’s Quarterly Report on Form 10-Q for the quarter ended June 30, 2016) | |
| 10.3 | Amendment Number Two dated as of May 3, 2016 2015 to the Credit Agreement, dated as of August 19, 2014, among Medley LLC, the lenders party thereto and City National Bank (incorporated by reference to Exhibit 10.4 to Medley Management Inc.’s Quarterly Report on Form 10-Q for the quarter ended June 30, 2016) | |
| 31.1* | Certification by Co-Chief Executive Officer under Section 302 of the Sarbanes-Oxley Act of 2002 | |
| 31.2* | Certification by Co-Chief Executive Officer under Section 302 of the Sarbanes-Oxley Act of 2002 | |
| 31.3* | Certification by Chief Financial Officer under Section 302 of the Sarbanes-Oxley Act of 2002 | |
| 32.1* | Certification of Co-Chief Executive Officer Pursuant to 18 U.S.C. Section 1350 as Adopted Pursuant to Section 906 of the Sarbanes-Oxley Act of 2002 | |
| 32.2* | Certification of Co-Chief Executive Officer Pursuant to 18 U.S.C. Section 1350 as Adopted Pursuant to Section 906 of the Sarbanes-Oxley Act of 2002 | |
| 32.3* | Certification of Chief Financial Officer Pursuant to 18 U.S.C. Section 1350 as Adopted Pursuant to Section 906 of the Sarbanes-Oxley Act of 2002 | |
| 101.INS* | XBRL Instance Document | |
| 101.SCH* | XBRL Taxonomy Extension Schema Document | |
| 101.CAL* | XBRL Taxonomy Extension Calculation Linkbase Document | |
| 101.DEF* | XBRL Taxonomy Extension Definition Linkbase Document | |
| 101.LAB* | XBRL Taxonomy Extension Label Linkbase Document | |
| 101.PRE* | XBRL Taxonomy Extension Presentation Linkbase Document | |
* Filed herewith
The agreements and other documents filed as exhibits to this report are not intended to provide factual information or other disclosure other than with respect to the terms of the agreements or other documents themselves, and you should not rely on them for that purpose. In particular, any representations and warranties made by us in these agreements or other documents were made solely within the specific context of the relevant agreement or document and may not describe the actual state of affairs as of the date they were made or at any other time.
| 31 |