Attached files
| file | filename |
|---|---|
| 8-K - 8-K - Gogo Inc. | d208352d8k.htm |

August 11, 2016 Investor Presentation Exhibit 99.1
SAFE HARBOR STATEMENT This presentation contains “forward-looking statements” within the meaning of Section 27A of the Securities Act of 1933 and Section 21E of the Securities Exchange Act of 1934 that are based on management’s beliefs and assumptions and on information currently available to management. Most forward-looking statements contain words that identify them as forward-looking, such as “anticipates,” “believes,” “continues,” “could,” “seeks,” “estimates,” “expects,” “intends,” “may,” “plans,” “potential,” “predicts,” “projects,” “should,” “will,” “would” or similar expressions and the negatives of those terms that relate to future events. Forward-looking statements involve known and unknown risks, uncertainties and other factors that may cause Gogo’s actual results, performance or achievements to be materially different from any projected results, performance or achievements expressed or implied by the forward-looking statements. Forward-looking statements represent the beliefs and assumptions of Gogo only as of the date of this presentation and Gogo undertakes no obligation to update or revise publicly any such forward-looking statements, whether as a result of new information, future events or otherwise. As such, Gogo’s future results may vary from any expectations or goals expressed in, or implied by, the forward-looking statements included in this presentation, possibly to a material degree. Gogo cannot assure you that the assumptions made in preparing any of the forward-looking statements will prove accurate or that any long-term financial or operational goals and targets will be realized. In particular, the availability and performance of certain technology solutions yet to be implemented by the Company set forth in this presentation represent aspirational long-term goals based on current expectations. For a discussion of some of the important factors that could cause Gogo’s results to differ materially from those expressed in, or implied by, the forward-looking statements included in this presentation, investors should refer to the disclosure contained under the headings “Risk Factors” and “Cautionary Note Regarding Forward-Looking Statements” in the Company’s Annual Report on Form 10-K and Quarterly Reports on Form 10-Q. Note to Certain Operating and Financial Data In addition to disclosing financial results that are determined in accordance with U.S. generally accepted accounting principles (“GAAP”), Gogo also discloses in this presentation certain non-GAAP financial information, including Adjusted EBITDA and Cash CAPEX. These financial measures are not recognized measures under GAAP, and when analyzing our performance or liquidity, as applicable, investors should (i) use Adjusted EBITDA in addition to, and not as an alternative to, net loss attributable to common stock as a measure of operating results, and (ii) use Cash CAPEX in addition to, and not as an alternative to, consolidated capital expenditures when evaluating our liquidity. In addition, this presentation contains various customer metrics and operating data, including numbers of aircraft or units online, that are based on internal company data, as well as information relating to the commercial and business aviation market, and our position within those markets. While management believes such information and data are reliable, they have not been verified by an independent source and there are inherent challenges and limitations involved in compiling data across various geographies and from various sources.
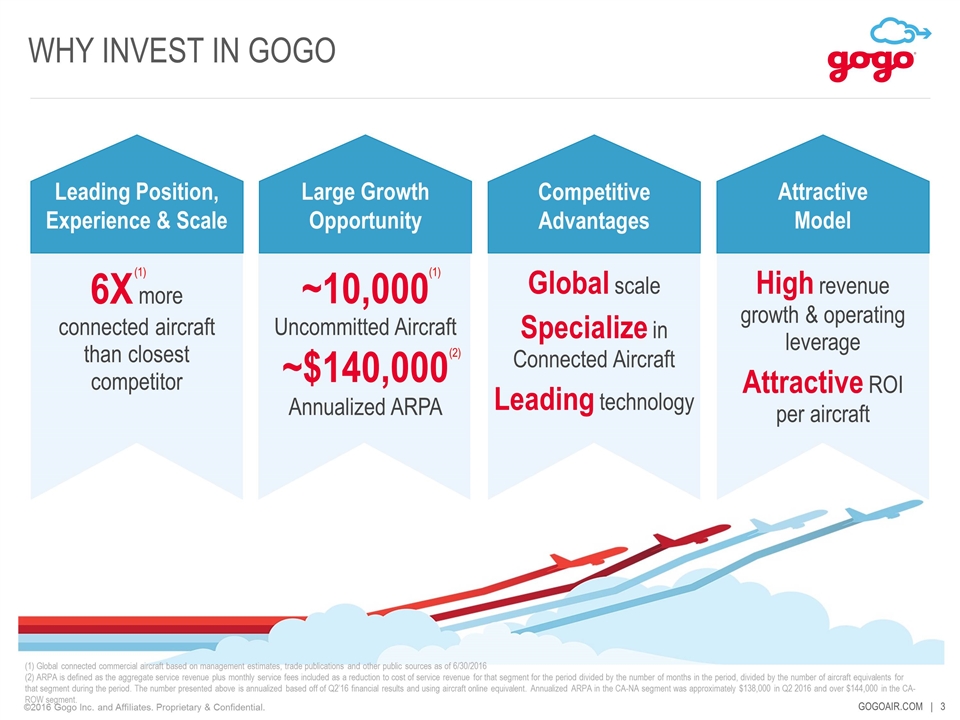
High revenue growth & operating leverage Attractive ROI per aircraft ~10,000 Uncommitted Aircraft ~$140,000 Annualized ARPA Global scale Specialize in Connected Aircraft Leading technology WHY INVEST IN GOGO Leading Position, Experience & Scale Large Growth Opportunity Attractive Model Competitive Advantages (1) (1) Global connected commercial aircraft based on management estimates, trade publications and other public sources as of 6/30/2016 (2) ARPA is defined as the aggregate service revenue plus monthly service fees included as a reduction to cost of service revenue for that segment for the period divided by the number of months in the period, divided by the number of aircraft equivalents for that segment during the period. The number presented above is annualized based off of Q2’16 financial results and using aircraft online equivalent. Annualized ARPA in the CA-NA segment was approximately $138,000 in Q2 2016 and over $144,000 in the CA-ROW segment. 6X more connected aircraft than closest competitor (2) (1)
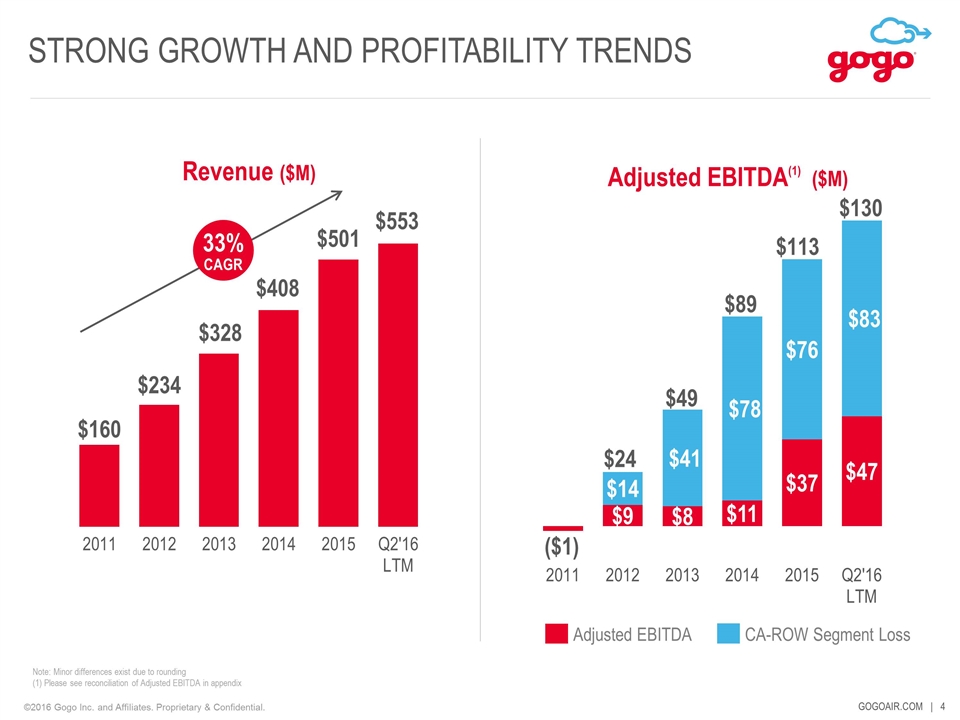
STRONG GROWTH AND PROFITABILITY TRENDS Note: Minor differences exist due to rounding (1) Please see reconciliation of Adjusted EBITDA in appendix Adjusted EBITDA(1) ($M) $49 Revenue ($M) 33% CAGR $89 CA-ROW Segment Loss Adjusted EBITDA $113 $24 $130
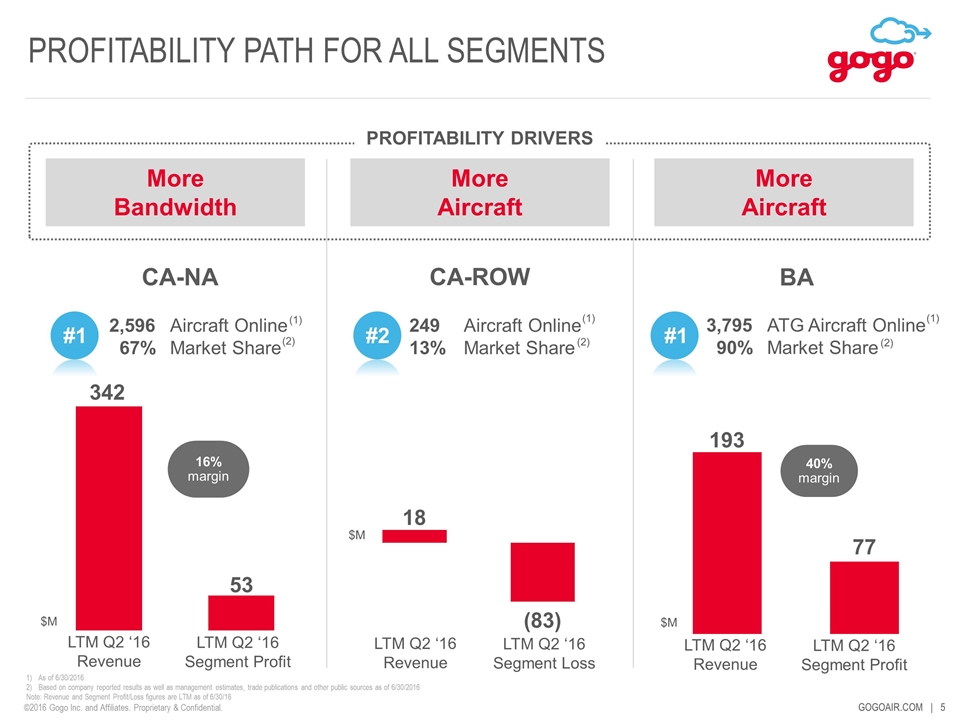
More Bandwidth GOGOAIR.COM | PROFITABILITY PATH FOR ALL SEGMENTS 16% margin 40% margin $M As of 6/30/2016 Based on company reported results as well as management estimates, trade publications and other public sources as of 6/30/2016 Note: Revenue and Segment Profit/Loss figures are LTM as of 6/30/16 $M $M CA-NA CA-ROW BA #2 #1 2,596 Aircraft Online 67% Market Share 249 Aircraft Online 13% Market Share 3,795 ATG Aircraft Online 90% Market Share More Aircraft More Aircraft #1 Profitability Drivers (1) (1) (1) (2) (2) (2) LTM Q2 ‘16 Revenue LTM Q2 ‘16 Segment Profit LTM Q2 ‘16 Revenue LTM Q2 ‘16 Segment Loss LTM Q2 ‘16 Revenue LTM Q2 ‘16 Segment Profit
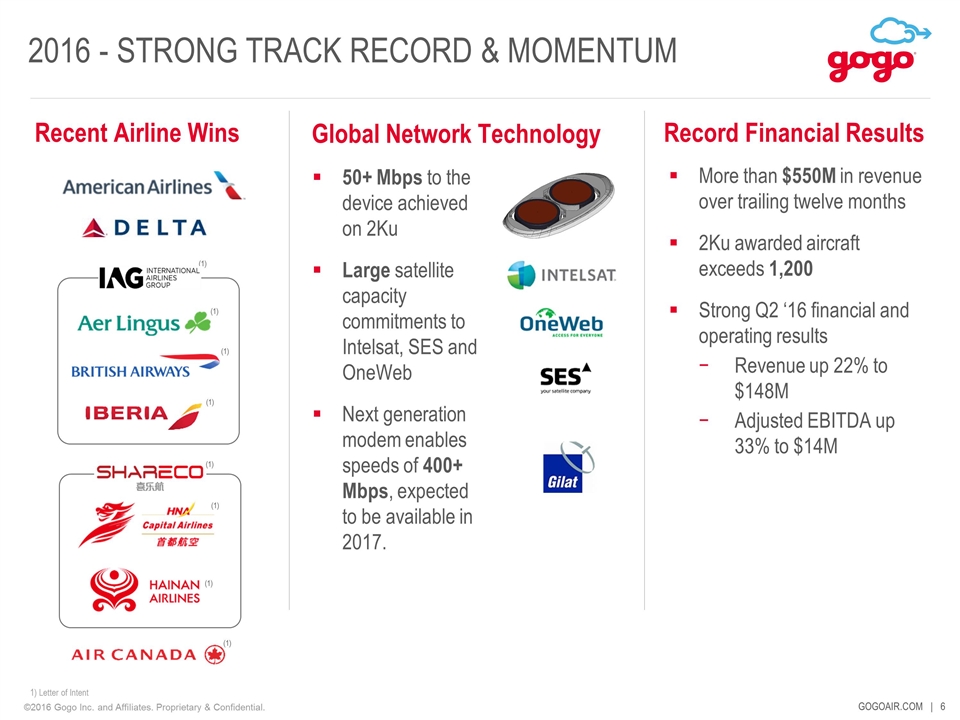
Global Network Technology Record Financial Results 2016 - STRONG TRACK RECORD & MOMENTUM Recent Airline Wins 50+ Mbps to the device achieved on 2Ku Large satellite capacity commitments to Intelsat, SES and OneWeb Next generation modem enables speeds of 400+ Mbps, expected to be available in 2017. More than $550M in revenue over trailing twelve months 2Ku awarded aircraft exceeds 1,200 Strong Q2 ‘16 financial and operating results Revenue up 22% to $148M Adjusted EBITDA up 33% to $14M (1) (1) (1) (1) (1) (1) (1) 1) Letter of Intent (1)
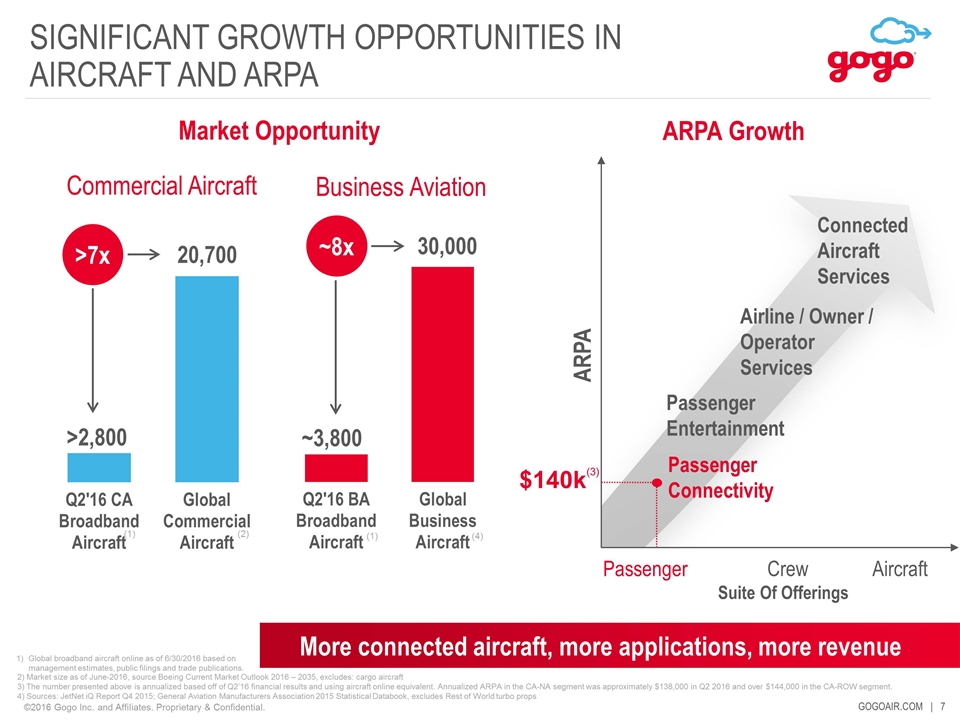
SIGNIFICANT GROWTH OPPORTUNITIES IN AIRCRAFT AND ARPA ARPA Growth ARPA Suite Of Offerings Passenger Crew Aircraft Passenger Connectivity Airline / Owner / Operator Services Connected Aircraft Services More connected aircraft, more applications, more revenue $140k(3) Global broadband aircraft online as of 6/30/2016 based on management estimates, public filings and trade publications. Market Opportunity Commercial Aircraft >7x Business Aviation ~8x >2,800 20,700 ~3,800 30,000 (2) (1) (4) (1) Passenger Entertainment 2) Market size as of June-2016, source Boeing Current Market Outlook 2016 – 2035, excludes: cargo aircraft 3) The number presented above is annualized based off of Q2’16 financial results and using aircraft online equivalent. Annualized ARPA in the CA-NA segment was approximately $138,000 in Q2 2016 and over $144,000 in the CA-ROW segment. 4) Sources: JetNet iQ Report Q4 2015; General Aviation Manufacturers Association 2015 Statistical Databook, excludes Rest of World turbo props
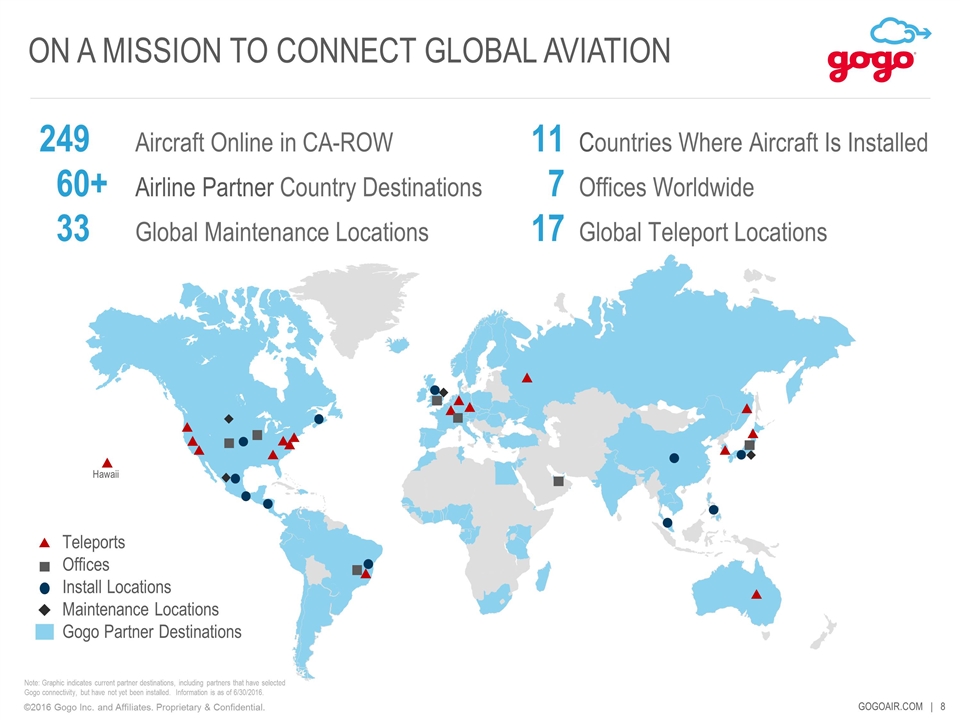
ON A MISSION TO CONNECT GLOBAL AVIATION 249 Aircraft Online in CA-ROW 60+ Airline Partner Country Destinations 33 Global Maintenance Locations Teleports Offices Install Locations Maintenance Locations Gogo Partner Destinations 11 Countries Where Aircraft Is Installed 7 Offices Worldwide 17 Global Teleport Locations Note: Graphic indicates current partner destinations, including partners that have selected Gogo connectivity, but have not yet been installed. Information is as of 6/30/2016. Hawaii
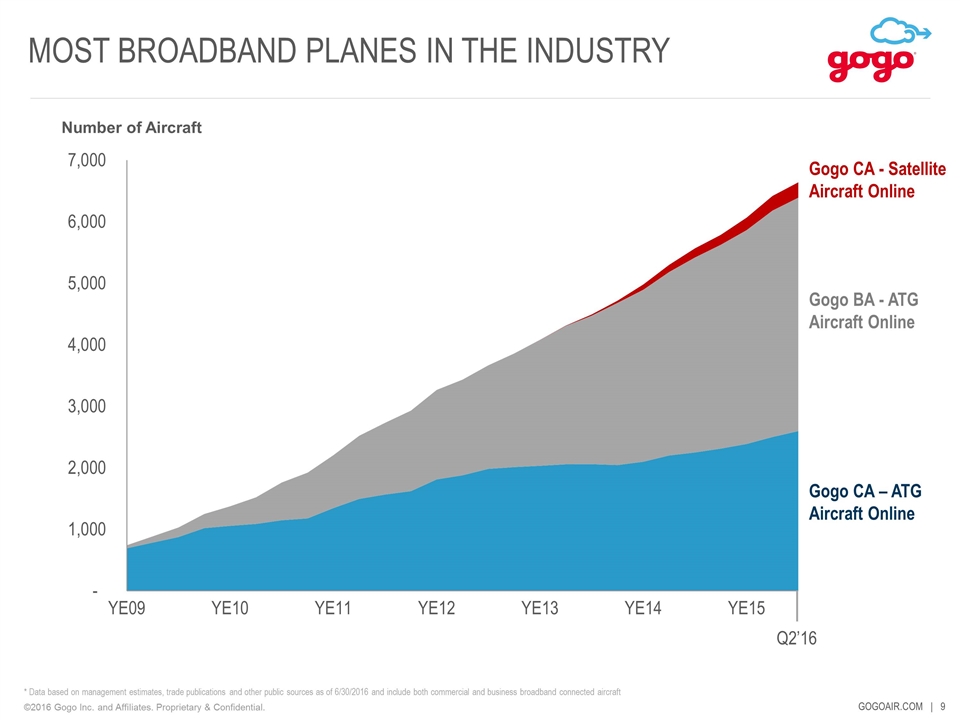
MOST BROADBAND PLANES IN THE INDUSTRY Gogo CA - Satellite Aircraft Online Gogo BA - ATG Aircraft Online Gogo CA – ATG Aircraft Online * Data based on management estimates, trade publications and other public sources as of 6/30/2016 and include both commercial and business broadband connected aircraft Number of Aircraft Q2’16
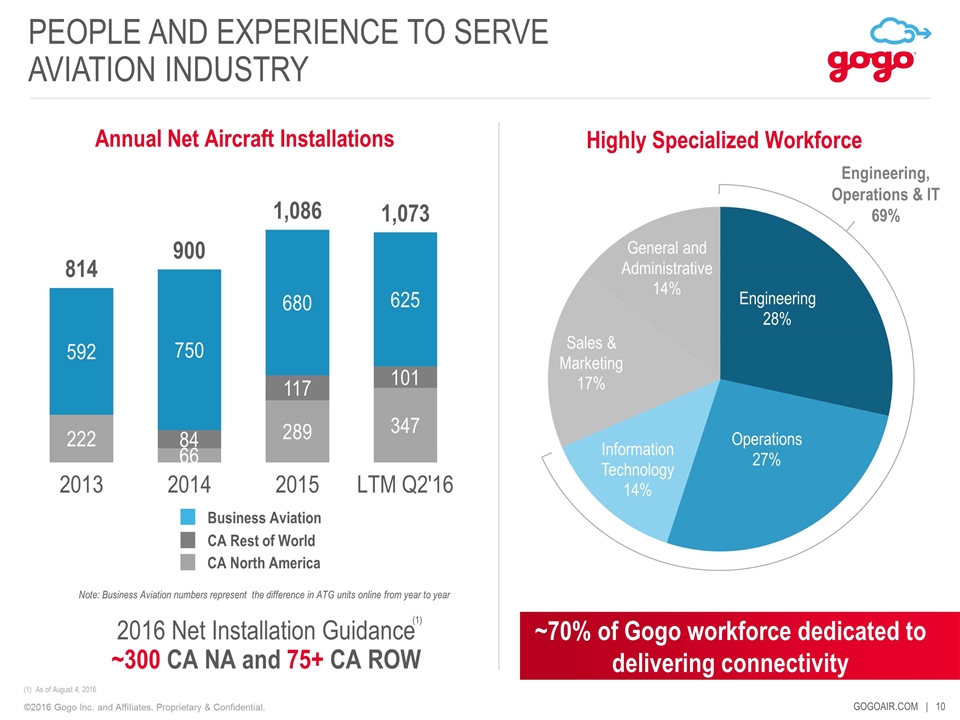
PEOPLE AND EXPERIENCE TO SERVE AVIATION INDUSTRY Highly Specialized Workforce Note: Business Aviation numbers represent the difference in ATG units online from year to year 2016 Net Installation Guidance ~300 CA NA and 75+ CA ROW Annual Net Aircraft Installations (1) As of August 4, 2016 (1) Business Aviation CA Rest of World CA North America Engineering, Operations & IT 69% ~70% of Gogo workforce dedicated to delivering connectivity
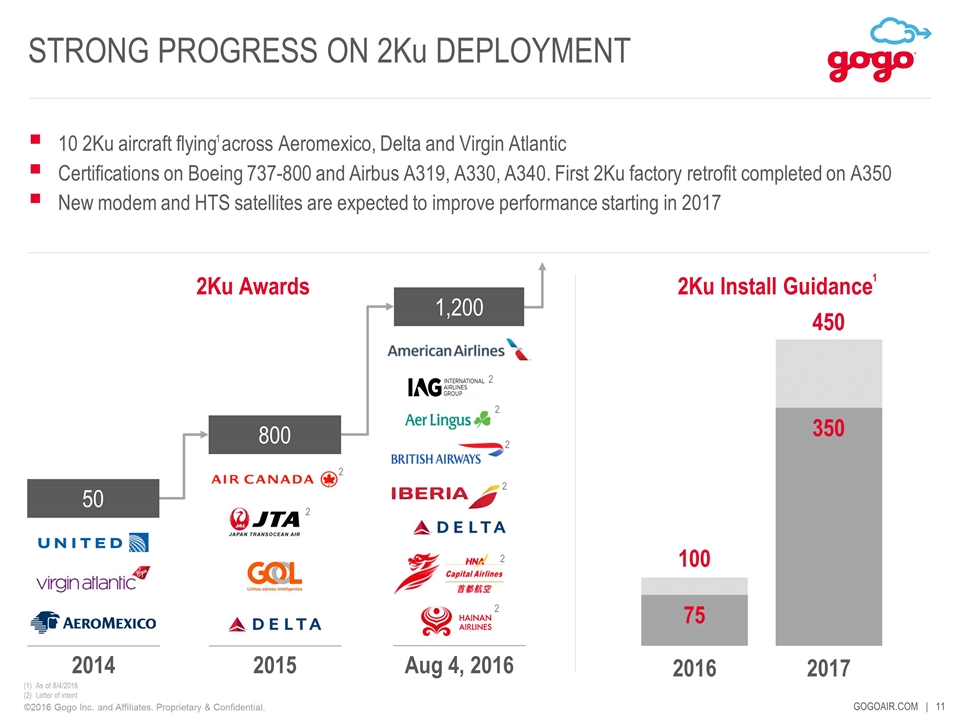
10 2Ku aircraft flying across Aeromexico, Delta and Virgin Atlantic Certifications on Boeing 737-800 and Airbus A319, A330, A340. First 2Ku factory retrofit completed on A350 New modem and HTS satellites are expected to improve performance starting in 2017 STRONG PROGRESS ON 2Ku DEPLOYMENT 2Ku Awards 2 2 2 As of 8/4/2016 Letter of intent 2015 Aug 4, 2016 2014 2Ku Install Guidance 2 2 2 50 800 2 1,200 1 1 2
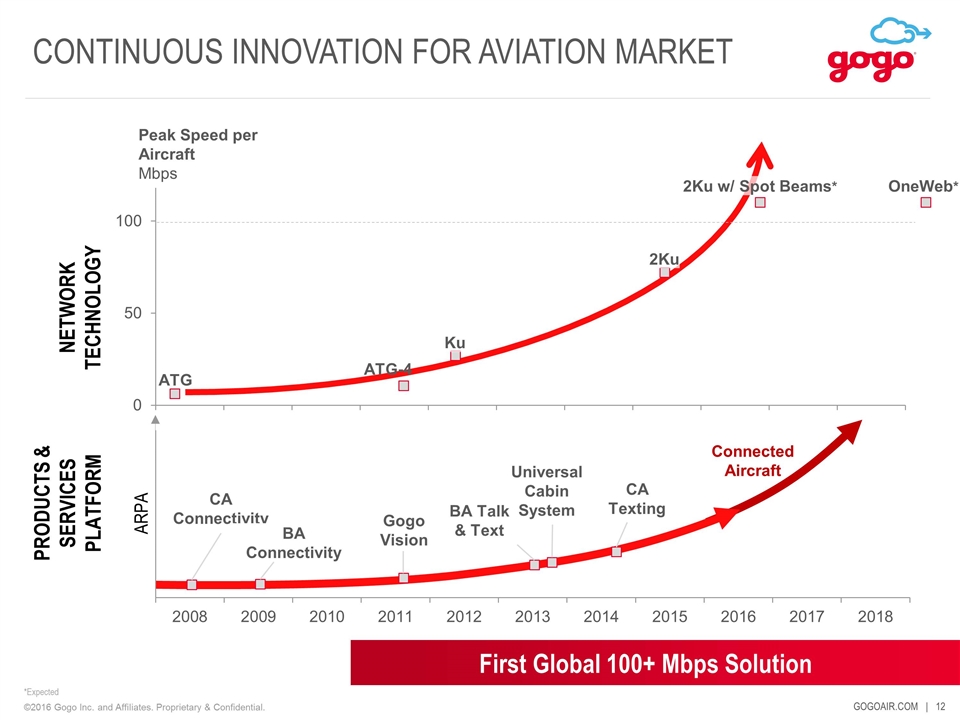
Connected Aircraft Peak Speed per Aircraft Mbps CONTINUOUS INNOVATION FOR AVIATION MARKET NETWORK TECHNOLOGY PRODUCTS & SERVICES PLATFORM CA Connectivity BA Connectivity ARPA Gogo Vision BA Talk & Text Universal Cabin System CA Texting First Global 100+ Mbps Solution ATG ATG-4 Ku 2Ku 2Ku w/ Spot Beams* OneWeb* *Expected
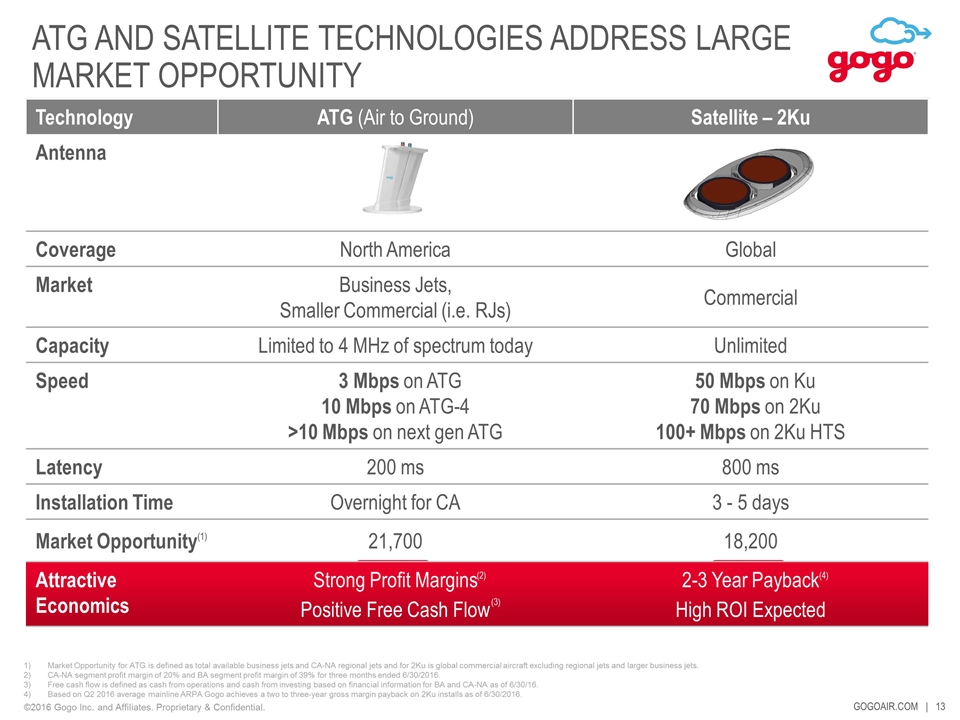
ATG AND SATELLITE TECHNOLOGIES ADDRESS LARGE MARKET OPPORTUNITY Market Opportunity for ATG is defined as total available business jets and CA-NA regional jets and for 2Ku is global commercial aircraft excluding regional jets and larger business jets. CA-NA segment profit margin of 20% and BA segment profit margin of 39% for three months ended 6/30/2016. Free cash flow is defined as cash from operations and cash from investing based on financial information for BA and CA-NA as of 6/30/16. Based on Q2 2016 average mainline ARPA Gogo achieves a two to three-year gross margin payback on 2Ku installs as of 6/30/2016. Technology ATG (Air to Ground) Satellite – 2Ku Antenna Coverage North America Global Market Business Jets, Smaller Commercial (i.e. RJs) Commercial Capacity Limited to 4 MHz of spectrum today Unlimited Speed 3 Mbps on ATG 10 Mbps on ATG-4 >10 Mbps on next gen ATG 50 Mbps on Ku 70 Mbps on 2Ku 100+ Mbps on 2Ku HTS Latency 200 ms 800 ms Installation Time Overnight for CA 3 - 5 days Market Opportunity(1) 21,700 18,200 Attractive Economics Strong Profit Margins Positive Free Cash Flow 2-3 Year Payback High ROI Expected (4) (2) (3)
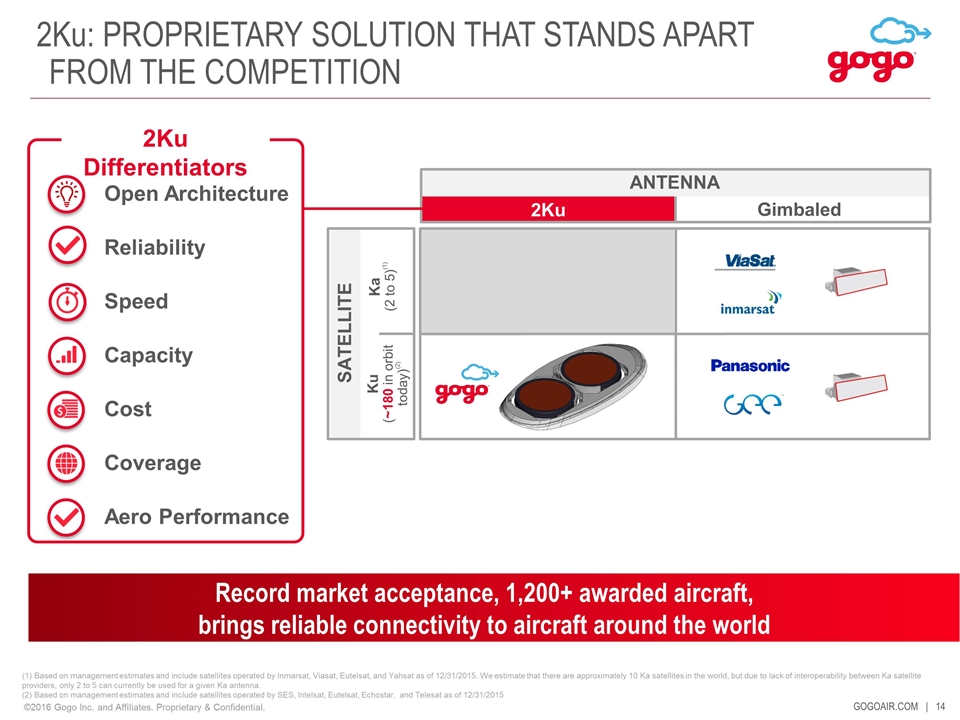
(1) Based on management estimates and include satellites operated by Inmarsat, Viasat, Eutelsat, and Yahsat as of 12/31/2015. We estimate that there are approximately 10 Ka satellites in the world, but due to lack of interoperability between Ka satellite providers, only 2 to 5 can currently be used for a given Ka antenna. (2) Based on management estimates and include satellites operated by SES, Intelsat, Eutelsat, Echostar, and Telesat as of 12/31/2015 Ka (2 to 5)(1) 2Ku Gimbaled Record market acceptance, 1,200+ awarded aircraft, brings reliable connectivity to aircraft around the world Ku (~180 in orbit today)(2) SATELLITE ANTENNA 2Ku: PROPRIETARY SOLUTION THAT STANDS APART FROM THE COMPETITION Open Architecture Reliability Speed Capacity Cost Coverage Aero Performance 2Ku Differentiators
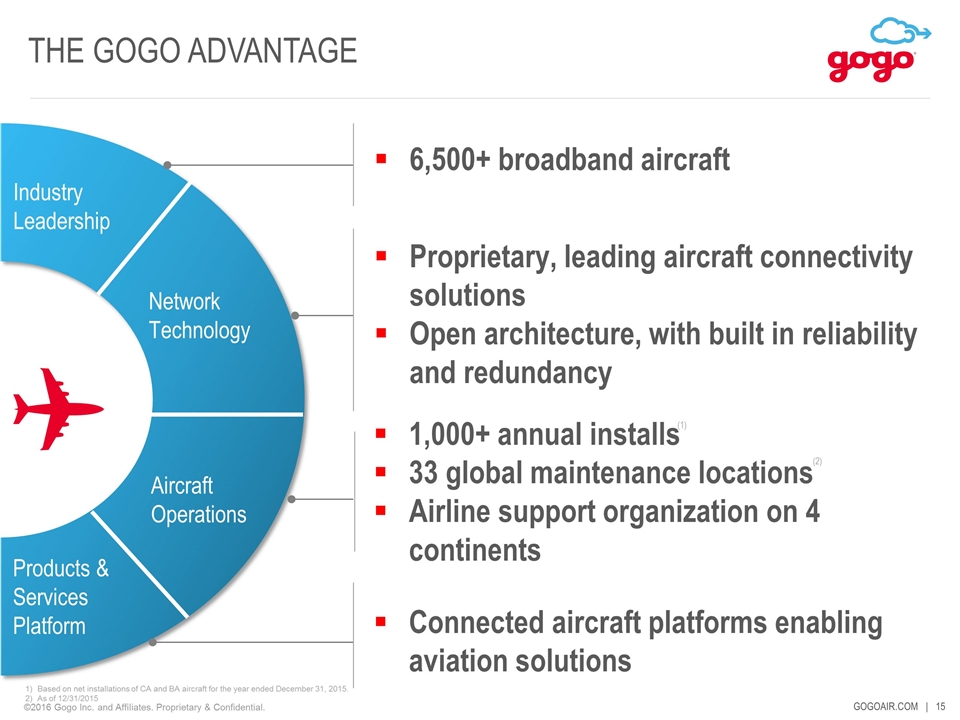
THE GOGO ADVANTAGE GOGOAIR.COM | Connected aircraft platforms enabling aviation solutions 6,500+ broadband aircraft Proprietary, leading aircraft connectivity solutions Open architecture, with built in reliability and redundancy 1,000+ annual installs 33 global maintenance locations Airline support organization on 4 continents Industry Leadership Network Technology Products & Services Platform Aircraft Operations Based on net installations of CA and BA aircraft for the year ended December 31, 2015. As of 12/31/2015 (1) (2)
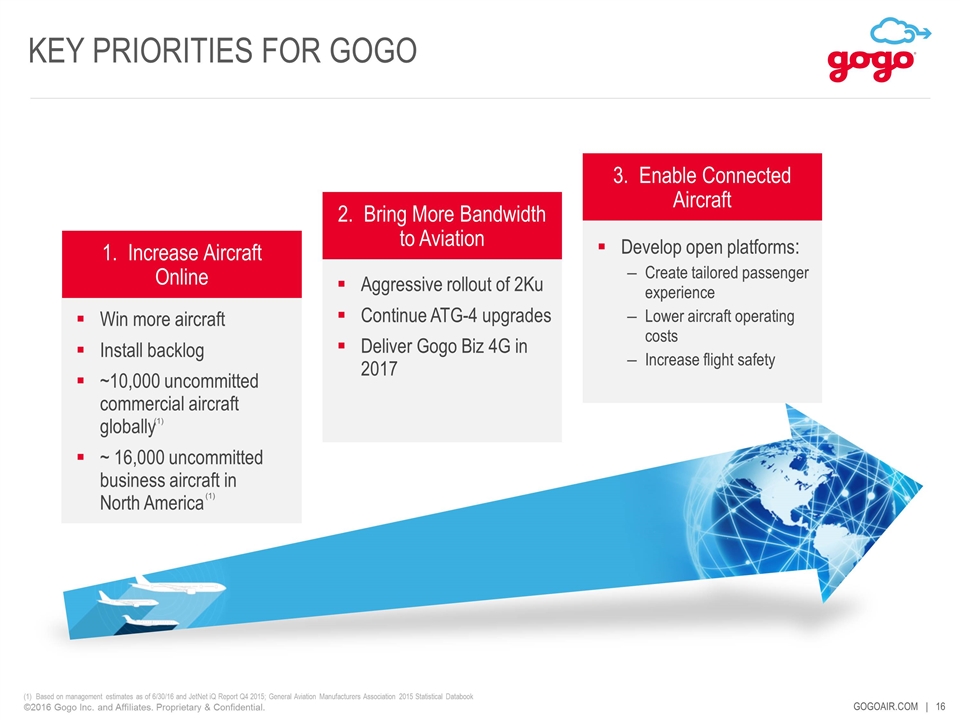
KEY PRIORITIES FOR GOGO Win more aircraft Install backlog ~10,000 uncommitted commercial aircraft globally ~ 16,000 uncommitted business aircraft in North America Develop open platforms: Create tailored passenger experience Lower aircraft operating costs Increase flight safety Aggressive rollout of 2Ku Continue ATG-4 upgrades Deliver Gogo Biz 4G in 2017 1. Increase Aircraft Online 3. Enable Connected Aircraft 2. Bring More Bandwidth to Aviation (1) (1) Based on management estimates as of 6/30/16 and JetNet iQ Report Q4 2015; General Aviation Manufacturers Association 2015 Statistical Databook

Q&A
Appendix
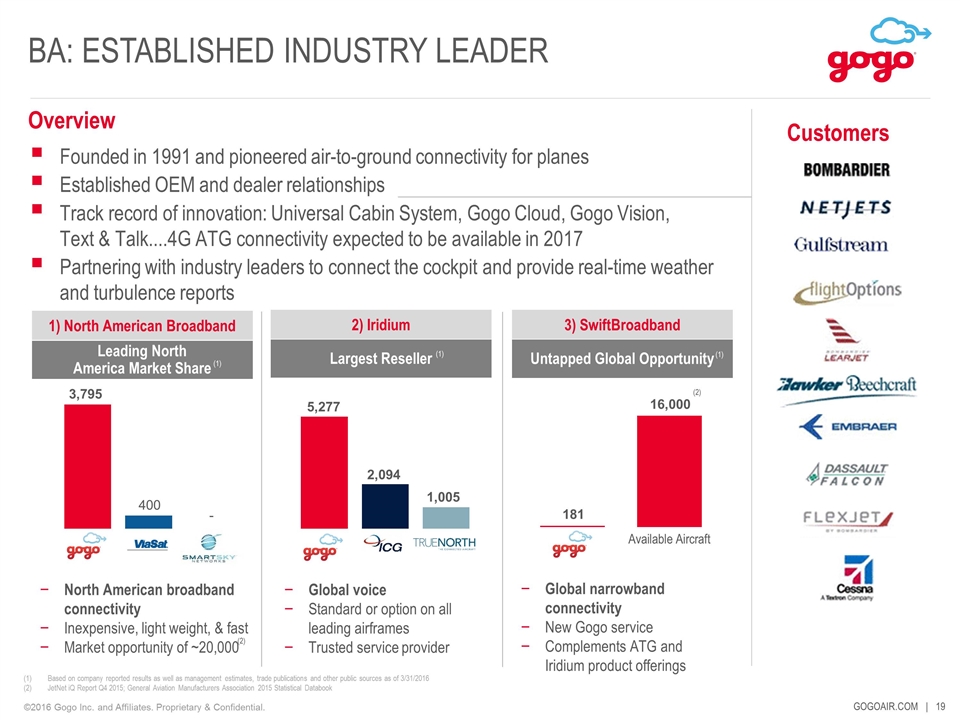
BA: ESTABLISHED INDUSTRY LEADER Founded in 1991 and pioneered air-to-ground connectivity for planes Established OEM and dealer relationships Track record of innovation: Universal Cabin System, Gogo Cloud, Gogo Vision, Text & Talk....4G ATG connectivity expected to be available in 2017 Partnering with industry leaders to connect the cockpit and provide real-time weather and turbulence reports North American broadband connectivity Inexpensive, light weight, & fast Market opportunity of ~20,000 Leading North America Market Share Untapped Global Opportunity (1) Largest Reseller (1) Global voice Standard or option on all leading airframes Trusted service provider Global narrowband connectivity New Gogo service Complements ATG and Iridium product offerings 1) North American Broadband 3) SwiftBroadband 2) Iridium Overview (1) Customers Based on company reported results as well as management estimates, trade publications and other public sources as of 3/31/2016 JetNet iQ Report Q4 2015; General Aviation Manufacturers Association 2015 Statistical Databook (2) (2) 1,005 2,094 5,277 16,000 3,795
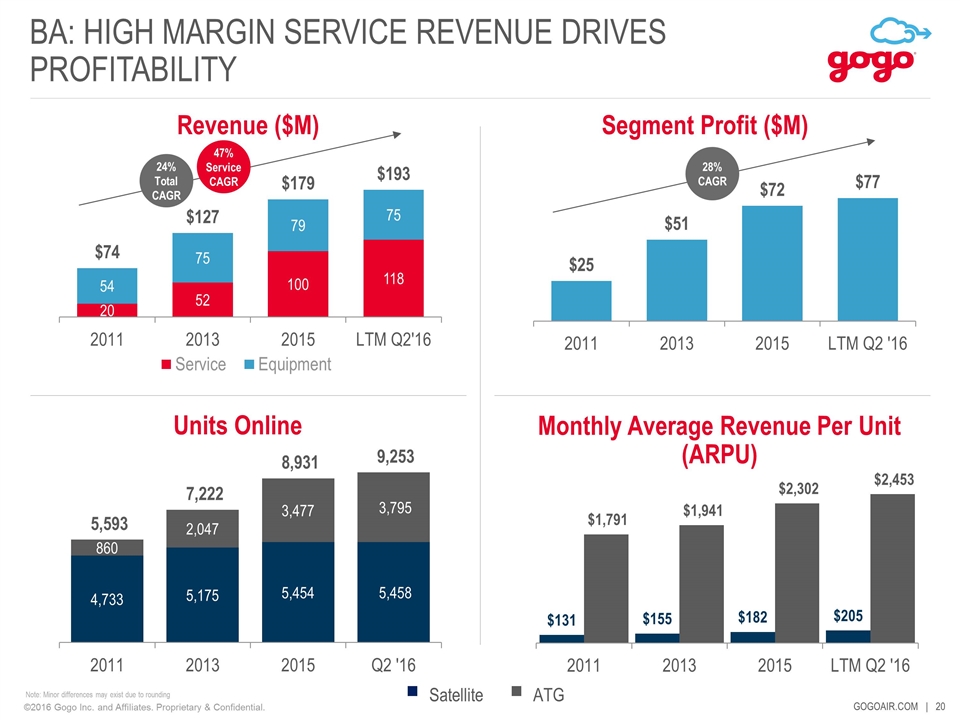
Segment Profit ($M) Revenue ($M) 24% Total CAGR Satellite ATG BA: HIGH MARGIN SERVICE REVENUE DRIVES PROFITABILITY Units Online Monthly Average Revenue Per Unit (ARPU) 47% Service CAGR 28% CAGR Note: Minor differences may exist due to rounding
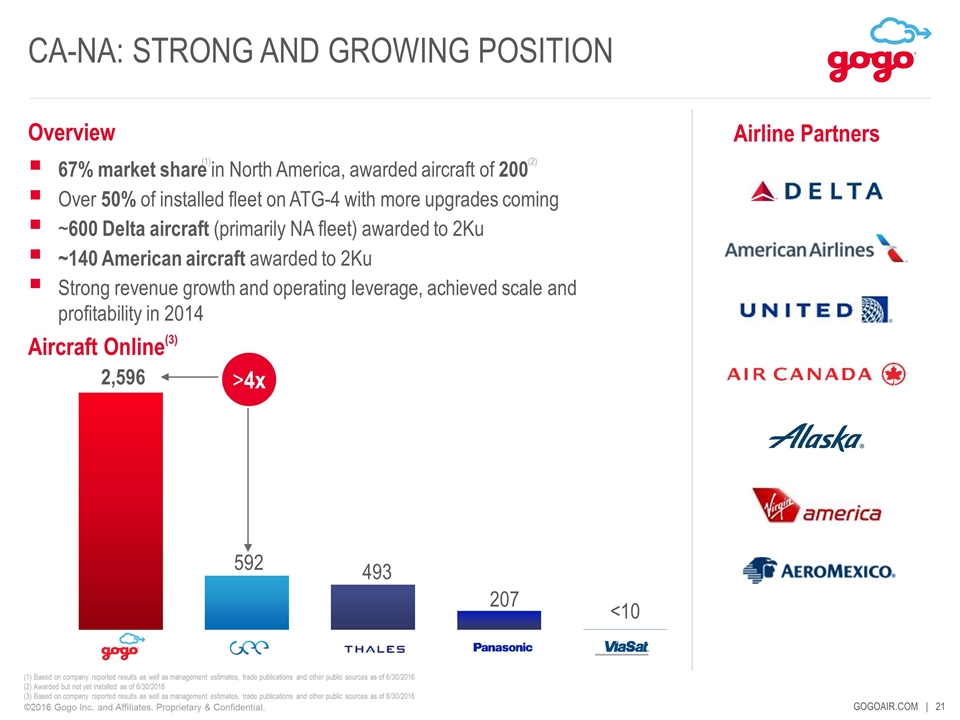
CA-NA: STRONG AND GROWING POSITION 67% market share in North America, awarded aircraft of 200 Over 50% of installed fleet on ATG-4 with more upgrades coming ~600 Delta aircraft (primarily NA fleet) awarded to 2Ku ~140 American aircraft awarded to 2Ku Strong revenue growth and operating leverage, achieved scale and profitability in 2014 Overview Airline Partners Aircraft Online(3) >4x (1) Based on company reported results as well as management estimates, trade publications and other public sources as of 6/30/2016 (2) Awarded but not yet installed as of 6/30/2016 (3) Based on company reported results as well as management estimates, trade publications and other public sources as of 6/30/2016 (1) (2) GOGOAIR.COM |
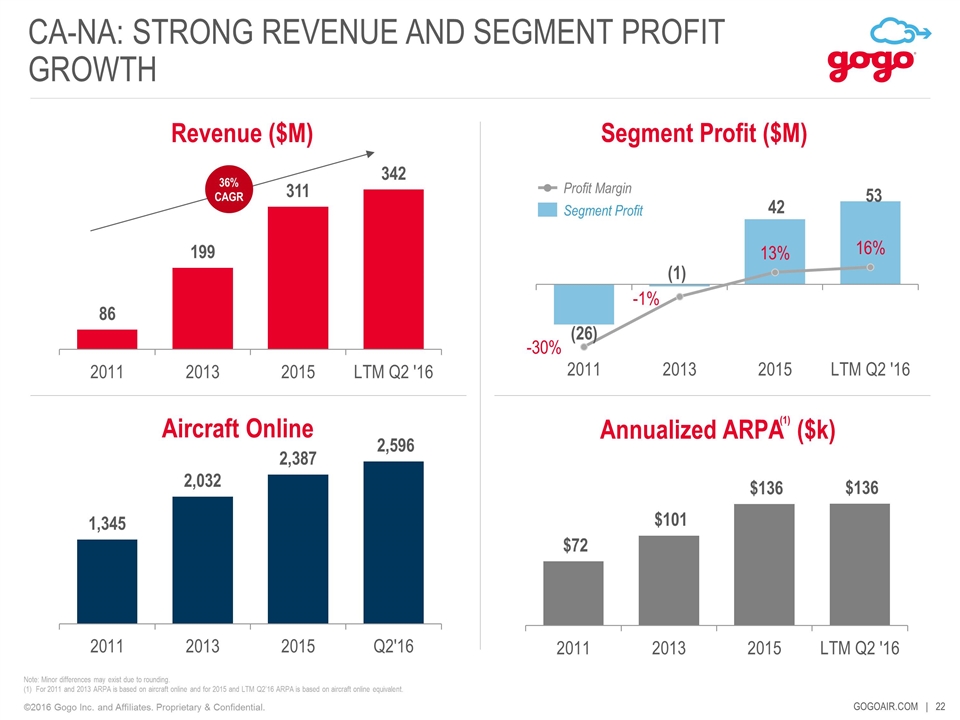
Segment Profit ($M) Revenue ($M) 36% CAGR Note: Minor differences may exist due to rounding. For 2011 and 2013 ARPA is based on aircraft online and for 2015 and LTM Q2’16 ARPA is based on aircraft online equivalent. Aircraft Online Annualized ARPA ($k) CA-NA: STRONG REVENUE AND SEGMENT PROFIT GROWTH (1) Profit Margin Segment Profit
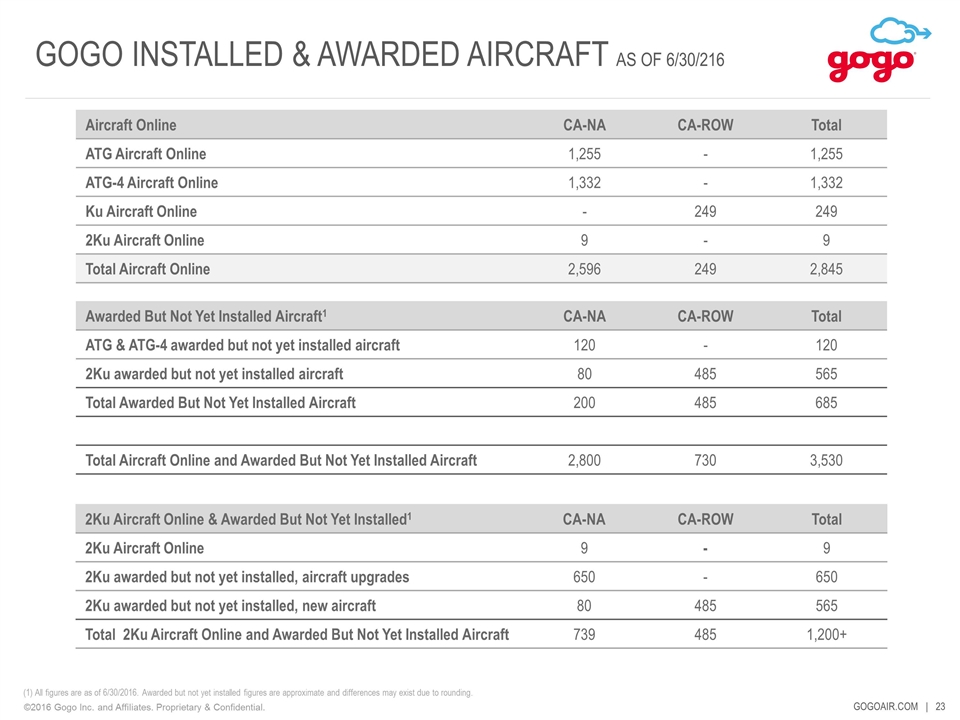
GOGO INSTALLED & AWARDED AIRCRAFT AS OF 6/30/216 Aircraft Online CA-NA CA-ROW Total ATG Aircraft Online 1,255 - 1,255 ATG-4 Aircraft Online 1,332 - 1,332 Ku Aircraft Online - 249 249 2Ku Aircraft Online 9 - 9 Total Aircraft Online 2,596 249 2,845 Awarded But Not Yet Installed Aircraft1 CA-NA CA-ROW Total ATG & ATG-4 awarded but not yet installed aircraft 120 - 120 2Ku awarded but not yet installed aircraft 80 485 565 Total Awarded But Not Yet Installed Aircraft 200 485 685 Total Aircraft Online and Awarded But Not Yet Installed Aircraft 2,800 730 3,530 (1) All figures are as of 6/30/2016. Awarded but not yet installed figures are approximate and differences may exist due to rounding. 2Ku Aircraft Online & Awarded But Not Yet Installed1 CA-NA CA-ROW Total 2Ku Aircraft Online 9 - 9 2Ku awarded but not yet installed, aircraft upgrades 650 - 650 2Ku awarded but not yet installed, new aircraft 80 485 565 Total 2Ku Aircraft Online and Awarded But Not Yet Installed Aircraft 739 485 1,200+
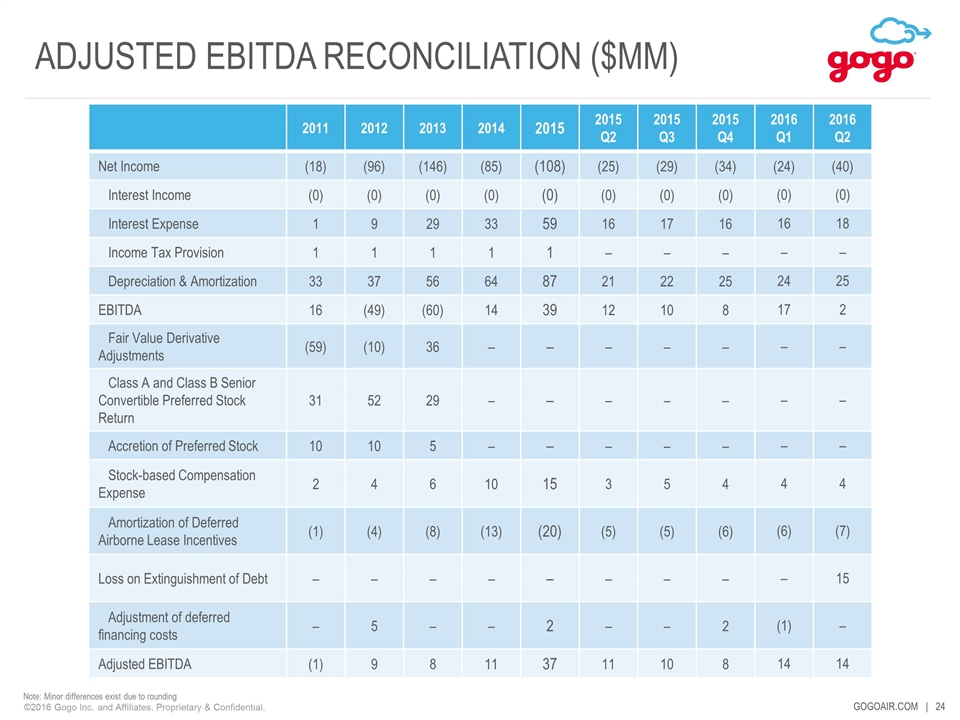
ADJUSTED EBITDA RECONCILIATION ($MM) 2011 2012 2013 2014 2015 2015 Q2 2015 Q3 2015 Q4 2016 Q1 2016 Q2 Net Income (18) (96) (146) (85) (108) (25) (29) (34) (24) (40) Interest Income (0) (0) (0) (0) (0) (0) (0) (0) (0) (0) Interest Expense 1 9 29 33 59 16 17 16 16 18 Income Tax Provision 1 1 1 1 1 – – – – – Depreciation & Amortization 33 37 56 64 87 21 22 25 24 25 EBITDA 16 (49) (60) 14 39 12 10 8 17 2 Fair Value Derivative Adjustments (59) (10) 36 – – – – – – – Class A and Class B Senior Convertible Preferred Stock Return 31 52 29 – – – – – – – Accretion of Preferred Stock 10 10 5 – – – – – – – Stock-based Compensation Expense 2 4 6 10 15 3 5 4 4 4 Amortization of Deferred Airborne Lease Incentives (1) (4) (8) (13) (20) (5) (5) (6) (6) (7) Loss on Extinguishment of Debt – – – – – – – – – 15 Adjustment of deferred financing costs – 5 – – 2 – – 2 (1) – Adjusted EBITDA (1) 9 8 11 37 11 10 8 14 14 Note: Minor differences exist due to rounding
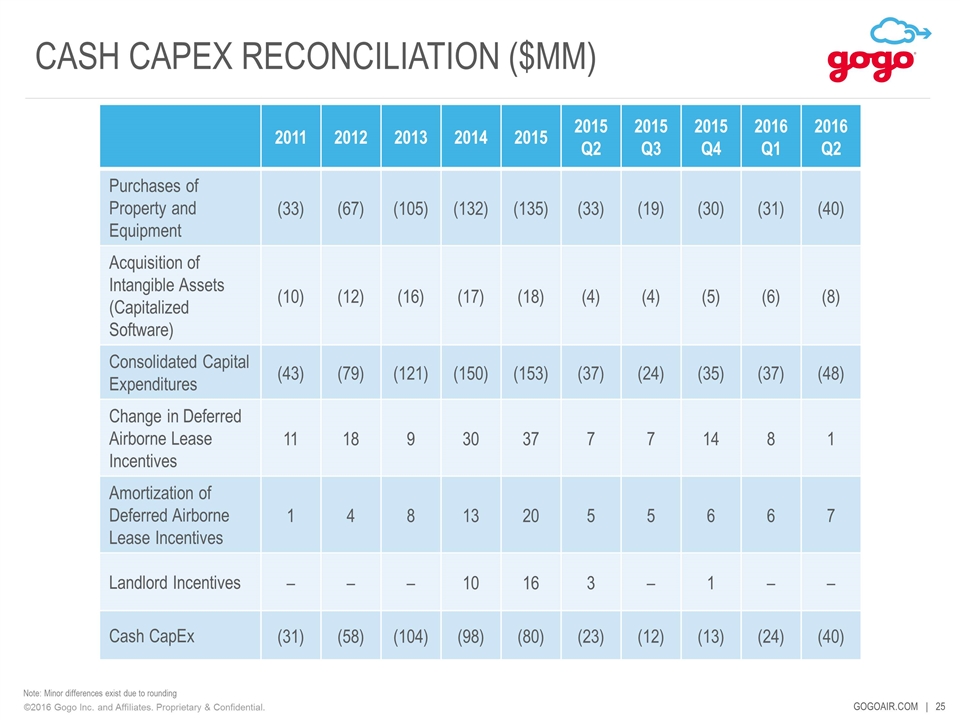
CASH CAPEX RECONCILIATION ($MM) 2011 2012 2013 2014 2015 2015 Q2 2015 Q3 2015 Q4 2016 Q1 2016 Q2 Purchases of Property and Equipment (33) (67) (105) (132) (135) (33) (19) (30) (31) (40) Acquisition of Intangible Assets (Capitalized Software) (10) (12) (16) (17) (18) (4) (4) (5) (6) (8) Consolidated Capital Expenditures (43) (79) (121) (150) (153) (37) (24) (35) (37) (48) Change in Deferred Airborne Lease Incentives 11 18 9 30 37 7 7 14 8 1 Amortization of Deferred Airborne Lease Incentives 1 4 8 13 20 5 5 6 6 7 Landlord Incentives – – – 10 16 3 – 1 – – Cash CapEx (31) (58) (104) (98) (80) (23) (12) (13) (24) (40) Note: Minor differences exist due to rounding
