Attached files
| file | filename |
|---|---|
| 8-K - 8-K - LCNB CORP | form8-kinvestorconference8.htm |

Line
0.00
Left Margin
2.90
Right Margin
5.00
LCNB Investment Highlights
August 2016

MS Margin
3.45
Text Margin
2.90
MS Margin
5.00
MS Margin
5.00
Footnote Margin
4.60
Colors
FBR Sky
178
210
224
FBR Forest
0
72
70
FBR Cream
222
215
170
FBR Burgundy
110
0
50
FBR Silver
178
178
178
FBR Blue
5
5
80
FBR Sage
122
178
175
FBR Tan
184
155
104
FBR Brick
200
100
100
FBR Charcoal
51
51
51
FBR Steel
45
55
125
FBR Brown
87
61
17
Shading
234
234
234
3.65
3.10
2.70
2.90
2.20
3.00
3.85
Forward-Looking Statements
1
This presentation, as well as other written or oral communications made from time to time by us, contains certain forward-looking information within the meaning of the
Securities Act of 1933, as amended, and the Securities Exchange Act of 1934, as amended. These statements relate to future events or future predictions, including
events or predictions relating to our future financial performance, and are generally identifiable by the use of forward-looking terminology such as “believes,” “expects,”
“may,” “will,” “should,” “plan,” “intend,” “target,” or “anticipates” or the negative thereof or comparable terminology, or by discussion of strategy or goals or other future
events, circumstances or effects. These forward-looking statements regarding future events and circumstances involve known and unknown risks, including those risk
factors set forth in our Annual Report on Form 10-K for the year ended December 31, 2015, and other SEC filings, uncertainties and other factors that may cause our
actual results, levels of activity, financial condition, performance or achievements to be materially different from any future results, levels of activity, financial condition,
performance or achievements expressed or implied by such forward-looking statements. This information is based on various assumptions, estimates or judgments by
us that may not prove to be correct. Important factors to consider and evaluate in such forward-looking statements include:
· changes in competitive and market factors that might affect our results of operations;
· changes in laws and regulations, including without limitation changes in capital requirements under the Basel III capital standards;
· changes in our business strategy or an inability to execute our strategy due to the occurrence of unanticipated events;
· our ability to identify potential candidates for, and consummate, acquisition or investment transactions;
· the timing of acquisition or investment transactions;
· our failure to complete any or all of the transactions described herein on the terms currently contemplated;
· local, regional and national economic conditions and events and the impact they may have on us and our customers;
· targeted or estimated returns on assets and equity, growth rates and future asset levels;
· our ability to attract deposits and other sources of liquidity and capital;
· changes in the financial performance and/or condition of our borrowers;
· changes in the level of non-performing and classified assets and charge-offs;
· changes in estimates of future loan loss reserve requirements based upon the periodic review thereof under relevant regulatory and accounting requirements, as well
as changes in borrowers payment behavior and creditworthiness;
· changes in our capital structure resulting from future capital offerings or acquisitions;
· inflation, interest rate, securities market and monetary fluctuations;
· the affects on our mortgage warehouse lending and retail mortgage businesses of changes in the mortgage origination markets, including changes due to changes in
monetary policies, interest rates and the regulation of mortgage originators, services and securitizers;

MS Margin
3.45
Text Margin
2.90
MS Margin
5.00
MS Margin
5.00
Footnote Margin
4.60
Colors
FBR Sky
178
210
224
FBR Forest
0
72
70
FBR Cream
222
215
170
FBR Burgundy
110
0
50
FBR Silver
178
178
178
FBR Blue
5
5
80
FBR Sage
122
178
175
FBR Tan
184
155
104
FBR Brick
200
100
100
FBR Charcoal
51
51
51
FBR Steel
45
55
125
FBR Brown
87
61
17
Shading
234
234
234
3.65
3.10
2.70
2.90
2.20
3.00
3.85
Forward-Looking Statements
2
· timely development and acceptance of new banking products and services and perceived overall value of these products and services by users;
· changes in consumer spending, borrowing and saving habits;
· technological changes;
· our ability to grow, increase market share and control expenses, and maintain sufficient liquidity;
· volatility in the credit and equity markets and its effect on the general economy;
· the potential for customer fraud;
· effects of changes in accounting policies and practices, as may be adopted by the regulatory agencies, as well as the Public Company Accounting Oversight
Board, the Financial Accounting Standards Board and other accounting standard setters;
· the businesses of the Bank and any acquisition targets or merger partners and subsidiaries not integrating successfully or such integration being more difficult,
time-consuming or costly than expected;
· our ability to integrate currently contemplated and future acquisition targets may be unsuccessful, or may be more difficult, time-consuming or costly than
expected; and
· material differences in the actual financial results of merger and acquisition activities compared with expectations.
These forward-looking statements are subject to significant uncertainties and contingencies, many of which are beyond our control. Although we believe that the
expectations reflected in the forward-looking statements are reasonable, we cannot guarantee future results, levels of activity, financial condition, performance or
achievements. Accordingly, there can be no assurance that actual results will meet our expectations or will not be materially lower than the results contemplated in this
presentation. You are cautioned not to place undue reliance on these forward-looking statements, which speak only as of the date of this document or, in the case of
documents referred to or incorporated by reference, the dates of those documents. We do not undertake any obligation to release publicly any revisions to these
forward-looking statements to reflect events or circumstances after the date of this document or to reflect the occurrence of unanticipated events, except as may be
required under applicable law.
MS Margin
3.45
Text Margin
2.90
MS Margin
5.00
MS Margin
5.00
Footnote Margin
4.60
Colors
FBR Sky
178
210
224
FBR Forest
0
72
70
FBR Cream
222
215
170
FBR Burgundy
110
0
50
FBR Silver
178
178
178
FBR Blue
5
5
80
FBR Sage
122
178
175
FBR Tan
184
155
104
FBR Brick
200
100
100
FBR Charcoal
51
51
51
FBR Steel
45
55
125
FBR Brown
87
61
17
Shading
234
234
234
3.65
3.10
2.70
2.90
2.20
3.00
3.85
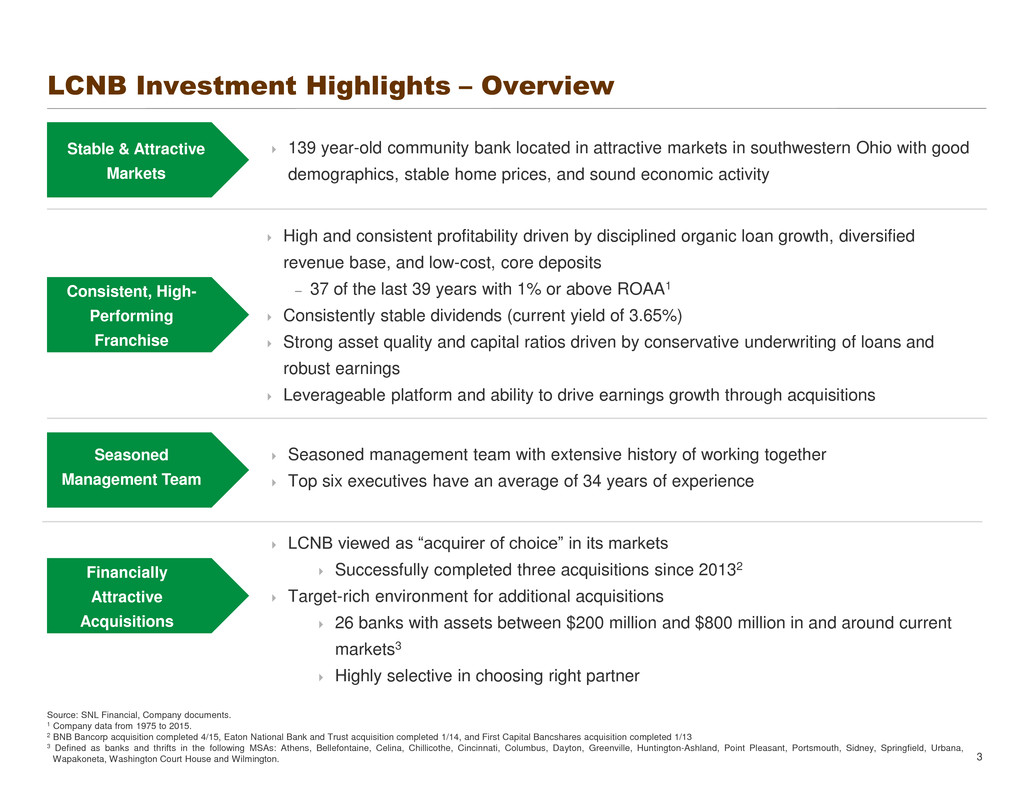
High and consistent profitability driven by disciplined organic loan growth, diversified
revenue base, and low-cost, core deposits
– 37 of the last 39 years with 1% or above ROAA1
Consistently stable dividends (current yield of 3.65%)
Strong asset quality and capital ratios driven by conservative underwriting of loans and
robust earnings
Leverageable platform and ability to drive earnings growth through acquisitions
LCNB Investment Highlights – Overview
3
Stable & Attractive
Markets
Consistent, High-
Performing
Franchise
Seasoned
Management Team
Financially
Attractive
Acquisitions
139 year-old community bank located in attractive markets in southwestern Ohio with good
demographics, stable home prices, and sound economic activity
Seasoned management team with extensive history of working together
Top six executives have an average of 34 years of experience
Source: SNL Financial, Company documents.
1 Company data from 1975 to 2015.
2 BNB Bancorp acquisition completed 4/15, Eaton National Bank and Trust acquisition completed 1/14, and First Capital Bancshares acquisition completed 1/13
3 Defined as banks and thrifts in the following MSAs: Athens, Bellefontaine, Celina, Chillicothe, Cincinnati, Columbus, Dayton, Greenville, Huntington-Ashland, Point Pleasant, Portsmouth, Sidney, Springfield, Urbana,
Wapakoneta, Washington Court House and Wilmington.
LCNB viewed as “acquirer of choice” in its markets
Successfully completed three acquisitions since 20132
Target-rich environment for additional acquisitions
26 banks with assets between $200 million and $800 million in and around current
markets3
Highly selective in choosing right partner

MS Margin
3.45
Text Margin
2.90
MS Margin
5.00
MS Margin
5.00
Footnote Margin
4.60
Colors
FBR Sky
178
210
224
FBR Forest
0
72
70
FBR Cream
222
215
170
FBR Burgundy
110
0
50
FBR Silver
178
178
178
FBR Blue
5
5
80
FBR Sage
122
178
175
FBR Tan
184
155
104
FBR Brick
200
100
100
FBR Charcoal
51
51
51
FBR Steel
45
55
125
FBR Brown
87
61
17
Shading
234
234
234
3.65
3.10
2.70
2.90
2.20
3.00
3.85
LCNB Investment Highlights – Recent Events
4
Highlights of 2Q 2016
Acquisition of BNB Bancorp, Inc.
Closed acquisition of BNB Bancorp in April 2015
– Added approximately $109 million in assets, $36 million in loans, $99 million in deposits and two branches
– Purchase price of $12.6 million, equal to 1.27x tangible book value
LCNB reported quarterly core EPS of $0.28.
Net interest income continued to increase, growing from $9.8 million in 1Q 2016 to $10.1 million in 2Q 2016.
Quarterly core ROAA and ROATCE remained strong at 0.89% and 11.30%, respectively.
Asset quality remained strong with 2Q 2016 NPAs/assets (excluding TDRs) of 0.26%, decreased charge-off
ratio from 0.35% in 2Q 2015 to 0.09% in 2Q 2016.
LCNB continued to be well capitalized, with 2Q 2016 tangible common equity to tangible assets of 8.7%.
Source: SNL Financial, Company documents
Acquisition of Eaton National Bank and Trust Co.
Closed acquisition of Eaton National Bank and Trust Co. in January 2014
– Added approximately $183 million in assets, $124 million in loans, $134 million in deposits and five branches
– Purchase price of $24.8 million (100% cash), equal to 1.42x tangible book value
– Completed a $28.8 million equity offering to strengthen pro forma capital levels

MS Margin
3.45
Text Margin
2.90
MS Margin
5.00
MS Margin
5.00
Footnote Margin
4.60
Colors
FBR Sky
178
210
224
FBR Forest
0
72
70
FBR Cream
222
215
170
FBR Burgundy
110
0
50
FBR Silver
178
178
178
FBR Blue
5
5
80
FBR Sage
122
178
175
FBR Tan
184
155
104
FBR Brick
200
100
100
FBR Charcoal
51
51
51
FBR Steel
45
55
125
FBR Brown
87
61
17
Shading
234
234
234
3.65
3.10
2.70
2.90
2.20
3.00
3.85
$1.3 billion in assets and $1.1 billion in deposits
headquartered in Lebanon, OH (Warren County)
36 branches in southwestern Ohio, primarily in and around
the attractive Cincinnati MSA
11th largest bank in the Cincinnati MSA by deposits
– Warren County, inside Cincinnati MSA, is the third
fastest growing county of the 88 counties in Ohio with
a 3.47% projected population growth rate
– Warren County also possesses the second highest
median household income in Ohio at $88,921,
compared to the national average of $59,865
LCNB’s major business lines serving that market include:
– Retail
– Commercial
– Trust and Investments with $284 million under
management and an Investment Services Division with
$164 million
LCNB Investment Highlights – The Franchise
5
LCNB Branch Map
LCNB Deposits in Top Three Markets
Source: SNL Financial, Company documents. Deposit data and rankings as of 6/30/15
Market Branches 2015 Rank
Deposits
($000)
Percent of
Franchise (%)
Cincinnati 20 11 671,793 62.0%
Dayton 4 11 131,348 12.1%
Chillicothe 5 4 106,577 9.8%
Total in Top 3 29 909,718 83.9%

MS Margin
3.45
Text Margin
2.90
MS Margin
5.00
MS Margin
5.00
Footnote Margin
4.60
Colors
FBR Sky
178
210
224
FBR Forest
0
72
70
FBR Cream
222
215
170
FBR Burgundy
110
0
50
FBR Silver
178
178
178
FBR Blue
5
5
80
FBR Sage
122
178
175
FBR Tan
184
155
104
FBR Brick
200
100
100
FBR Charcoal
51
51
51
FBR Steel
45
55
125
FBR Brown
87
61
17
Shading
234
234
234
3.65
3.10
2.70
2.90
2.20
3.00
3.85
LCNB Investment Highlights – Management Team
6
Experienced management team with an average of 34 years of banking experience and many executives have
worked together for over 20 years
Name
Years of
Banking
Experience Title Background
Stephen P. Wilson 41 Chairman
Joined LCNB in 1975 and LCNB Board of Directors in 1982. Former
CEO of LCNB, Chairman of the American Bankers Association (2010 -
2011), and a former Board Member of the Federal Reserve Bank of
Cleveland.
Steve P. Foster 42 CEO
Joined LCNB in 1977 and has served as Internal Auditor, Branch
Manager, Loan Officer, and CFO. He was elected to the LCNB Board of
Directors in 2005.
Robert C. Haines 24
Chief Financial
Officer
Joined LCNB in 1992 and has served as Internal Auditor, Assistant Trust
Officer, Vice President of IT, and CFO. He also serves as LCNB's
primary contact with its transfer agent.
Leroy F. McKay 30
Executive Vice
President
Joined LCNB in 1996 and serves as Head of the Trust Department,
Investment Officer for the bank's investment portfolio.
Eric J. Meilstrup 28
Executive Vice
President
Joined LCNB in 1988 and has served in Item Processing and various
positions in Operations. Currently runs LCNB Operations.
Matthew P. Layer 34
Executive Vice
President
Joined LCNB in 1982 and has served as Branch Manager, Head of
Secondary Markets, Head of Real Estate Lending, and Chief Lending
Officer.

MS Margin
3.45
Text Margin
2.90
MS Margin
5.00
MS Margin
5.00
Footnote Margin
4.60
Colors
FBR Sky
178
210
224
FBR Forest
0
72
70
FBR Cream
222
215
170
FBR Burgundy
110
0
50
FBR Silver
178
178
178
FBR Blue
5
5
80
FBR Sage
122
178
175
FBR Tan
184
155
104
FBR Brick
200
100
100
FBR Charcoal
51
51
51
FBR Steel
45
55
125
FBR Brown
87
61
17
Shading
234
234
234
3.65
3.10
2.70
2.90
2.20
3.00
3.85
LCNB Investment Highlights – Financial Performance
7 Source: SNL Financial, Company documents
LCNB Corp. Calendar Year Ended LTM Quarter Ended
LCNB 2011 2012 2013 2014 2015 6/30/16 9/30/15 12/31/15 3/31/16 6/30/16
Total Assets 791,570 788,637 932,338 1,108,066 1,280,531 1,312,635 1,275,171 1,280,531 1,285,922 1,312,635
Gross Loans 461,262 453,783 574,354 698,956 770,938 800,465 762,833 770,938 778,714 800,465
Reserves 2,931 3,437 3,588 3,121 3,129 3,373 2,958 3,129 3,150 3,373
Deposits 663,562 671,471 785,761 946,205 1,087,160 1,124,698 1,103,513 1,087,160 1,120,208 1,124,698
Total Equity 77,960 82,006 118,873 125,695 140,108 145,710 140,851 140,108 142,933 145,710
Common Equity 77,960 82,006 118,873 125,695 140,108 145,710 140,851 140,108 142,933 145,710
Loans / Deposits 69.51 67.58 73.10 73.87 70.91 71.17 69.13 70.91 69.52 71.17
Total Equity / Assets 9.85 10.40 12.75 11.34 10.94 11.10 11.05 10.94 11.12 11.10
Tangible Equity / Tangible Assets 9.16 9.71 11.18 8.72 8.43 8.69 8.51 8.43 8.64 8.69
Common Equity / Assets 9.85 10.40 12.75 11.34 10.94 11.10 11.05 10.94 11.12 11.10
Tangible Common Equity / Tangible Assets 9.16 9.71 11.18 8.72 8.43 8.69 8.51 8.43 8.64 8.69
Tier 1 Capital Ratio 13.93 15.13 18.03 13.92 13.46 12.89 13.54 13.46 13.13 12.89
Total Risk-Based Capital Ratio 14.54 15.86 18.65 14.38 13.85 13.29 13.92 13.85 13.52 13.29
Leverage Ratio 8.51 8.98 11.10 8.53 8.62 8.56 8.60 8.62 8.60 8.56
Net Income ($000) 8,115 8,270 8,780 9,869 11,474 11,449 2,633 2,884 2,964 2,968
Core ROAA 0.85 0.89 0.98 0.99 0.98 0.89 0.88 0.90 0.89 0.89
Core ROAE 9.05 8.84 9.49 9.01 8.83 8.07 8.02 8.19 7.99 8.07
ROATCE 11.90 11.08 10.96 11.06 11.68 11.18 10.63 11.29 11.49 11.30
Net Interest Margin 3.70 3.52 3.57 3.66 3.64 3.40 3.40 3.50 3.47 3.39
Efficiency Ratio 63.35 62.85 63.10 61.77 60.60 63.74 64.03 63.11 64.94 62.91
NPAs / Assets 2.53 2.26 2.10 1.92 1.27 1.31 1.36 1.27 1.41 1.31
NPAs-Ex-TDRs / Assets 0.67 0.57 0.47 0.63 0.20 0.26 0.27 0.20 0.32 0.26
NPLs / Loans 3.99 3.44 3.15 2.84 2.00 2.07 2.12 2.00 2.22 2.07
NCOs / Average Loans 0.39 0.18 0.08 0.21 0.18 0.08 0.08 0.11 0.04 0.09
Reserves / Gross Loans 0.64 0.76 0.62 0.45 0.41 0.42 0.39 0.41 0.40 0.42
Reserves / NPLs 15.92 22.00 19.81 15.71 20.26 20.39 18.33 20.26 18.23 20.39
Common Shares Outstanding 6,704,723 6,731,900 9,287,536 9,311,318 9,925,547 9,937,262 9,903,294 9,925,547 9,931,788 9,937,262
Book Value Per Share 11.63 12.18 12.80 13.50 14.12 14.66 14.22 14.12 14.39 14.66
Tangible Book Value Per Share 10.73 11.29 11.02 10.08 10.58 11.17 10.66 10.58 10.88 11.17
EPS after Extra 1.20 1.22 1.10 1.05 1.17 1.14 0.26 0.29 0.30 0.29
Dividends Paid 0.64 0.64 0.64 0.64 0.64 0.64 0.16 0.16 0.16 0.16
Dividend Payout Ratio 53.33 52.46 58.18 60.95 54.70 56.14 61.54 55.17 53.33 55.17
Pe
r S
ha
re
D
ata
($)
Ba
lan
ce
S
he
et
($0
00
)
Ca
pit
al
Ra
tio
s
(%
)
Pr
of
ita
bil
ity
(%
)
As
se
t Q
ua
lity
(%
)
MS Margin
3.45
Text Margin
2.90
MS Margin
5.00
MS Margin
5.00
Footnote Margin
4.60
Colors
FBR Sky
178
210
224
FBR Forest
0
72
70
FBR Cream
222
215
170
FBR Burgundy
110
0
50
FBR Silver
178
178
178
FBR Blue
5
5
80
FBR Sage
122
178
175
FBR Tan
184
155
104
FBR Brick
200
100
100
FBR Charcoal
51
51
51
FBR Steel
45
55
125
FBR Brown
87
61
17
Shading
234
234
234
3.65
3.10
2.70
2.90
2.20
3.00
3.85
LCNB Investment Highlights – ROATCE
8 Source: SNL Financial; Peers defined as public banks and thrifts with assets $500M - $5B
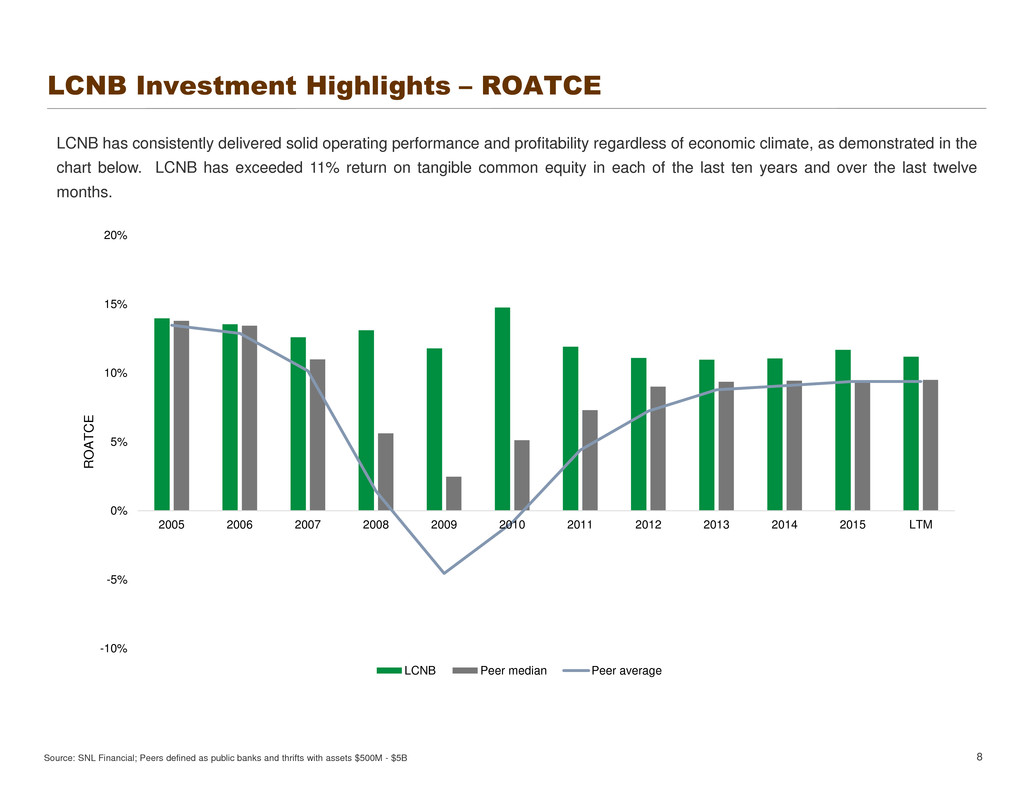
LCNB has consistently delivered solid operating performance and profitability regardless of economic climate, as demonstrated in the
chart below. LCNB has exceeded 11% return on tangible common equity in each of the last ten years and over the last twelve
months.
-10%
-5%
0%
5%
10%
15%
20%
2005 2006 2007 2008 2009 2010 2011 2012 2013 2014 2015 LTM
R
O
A
T
C
E
LCNB Peer median Peer average

MS Margin
3.45
Text Margin
2.90
MS Margin
5.00
MS Margin
5.00
Footnote Margin
4.60
Colors
FBR Sky
178
210
224
FBR Forest
0
72
70
FBR Cream
222
215
170
FBR Burgundy
110
0
50
FBR Silver
178
178
178
FBR Blue
5
5
80
FBR Sage
122
178
175
FBR Tan
184
155
104
FBR Brick
200
100
100
FBR Charcoal
51
51
51
FBR Steel
45
55
125
FBR Brown
87
61
17
Shading
234
234
234
3.65
3.10
2.70
2.90
2.20
3.00
3.85
0.00%
2.00%
4.00%
6.00%
8.00%
10.00%
12.00%
14.00%
16.00%
18.00%
20.00%
1
9
7
5
1
9
7
7
1
9
7
9
1
9
8
1
1
9
8
3
1
9
8
5
1
9
8
7
1
9
8
9
1
9
9
1
1
9
9
3
1
9
9
5
1
9
9
7
1
9
9
9
2
0
0
1
2
0
0
3
2
0
0
5
2
0
0
7
2
0
0
9
2
0
1
1
2
0
1
3
2
0
1
5
0.00%
0.20%
0.40%
0.60%
0.80%
1.00%
1.20%
1.40%
1.60%
1.80%
1
9
7
5
1
9
7
7
1
9
7
9
1
9
8
1
1
9
8
3
1
9
8
5
1
9
8
7
1
9
8
9
1
9
9
1
1
9
9
3
1
9
9
5
1
9
9
7
1
9
9
9
2
0
0
1
2
0
0
3
2
0
0
5
2
0
0
7
2
0
0
9
2
0
1
1
2
0
1
3
2
0
1
5
LCNB has had an average ROAA of 1.24% and an average ROAE of 12.98% for the last 41 years, including
the duration of the last financial crisis
LCNB Investment Highlights – Consistent Profitability
9
ROAA ROAE
LCNB 41-Yr. Avg.: 1.24%
LCNB 41-Yr. Avg.: 12.98%
Avg. of U.S. public banks:
0.60%
Avg. of U.S. public banks:
6.18%
107%
Higher
110%
Higher
Source: SNL Financial, Company documents.
1 Average calculated from 1990-2016Q1, the longest time period for which public data are available.

MS Margin
3.45
Text Margin
2.90
MS Margin
5.00
MS Margin
5.00
Footnote Margin
4.60
Colors
FBR Sky
178
210
224
FBR Forest
0
72
70
FBR Cream
222
215
170
FBR Burgundy
110
0
50
FBR Silver
178
178
178
FBR Blue
5
5
80
FBR Sage
122
178
175
FBR Tan
184
155
104
FBR Brick
200
100
100
FBR Charcoal
51
51
51
FBR Steel
45
55
125
FBR Brown
87
61
17
Shading
234
234
234
3.65
3.10
2.70
2.90
2.20
3.00
3.85
Transaction
9.6%
[CATEGORY
NAME]
[PERCENTAG
E]
[CATEGORY
NAME]
[PERCENTAG
E]
Time > $100k
6.7%
LCNB Investment Highlights – Deposits and Loans
10
Deposit Composition at 6/30/16 Loan Breakdown at 6/30/16
YTD Cost of Deposits: 0.30% YTD Yield on Loans: 4.50%
1-4 Family
29.1%
Multifamily +
CRE
49.6%
C&I
5.6%
Other
Consumer
2.3%
HELOC
4.3%
Construction
2.3%
Farm + Ag.
Production
[PERCENTAG
E]
Source: SNL Financial
Note: Regulatory filings capture some transaction accounts as MMDA

MS Margin
3.45
Text Margin
2.90
MS Margin
5.00
MS Margin
5.00
Footnote Margin
4.60
Colors
FBR Sky
178
210
224
FBR Forest
0
72
70
FBR Cream
222
215
170
FBR Burgundy
110
0
50
FBR Silver
178
178
178
FBR Blue
5
5
80
FBR Sage
122
178
175
FBR Tan
184
155
104
FBR Brick
200
100
100
FBR Charcoal
51
51
51
FBR Steel
45
55
125
FBR Brown
87
61
17
Shading
234
234
234
3.65
3.10
2.70
2.90
2.20
3.00
3.85
LCNB Investment Highlights – NCOs / Avg. Loans
11 Source: SNL Financial; Peers defined as public banks and thrifts with assets $500M - $5B; LTM as of 6/30/16
0.0%
0.2%
0.4%
0.6%
0.8%
1.0%
1.2%
1.4%
2005 2006 2007 2008 2009 2010 2011 2012 2013 2014 2015 LTM
LCNB Peer median Peer average
LCNB has achieved consistently strong profitability without reaching for growth or compromising its credit standards. On the
contrary, LCNB’s intimate knowledge of its communities and its customers has resulted in minimal credit losses throughout and since
the recession.
MS Margin
3.45
Text Margin
2.90
MS Margin
5.00
MS Margin
5.00
Footnote Margin
4.60
Colors
FBR Sky
178
210
224
FBR Forest
0
72
70
FBR Cream
222
215
170
FBR Burgundy
110
0
50
FBR Silver
178
178
178
FBR Blue
5
5
80
FBR Sage
122
178
175
FBR Tan
184
155
104
FBR Brick
200
100
100
FBR Charcoal
51
51
51
FBR Steel
45
55
125
FBR Brown
87
61
17
Shading
234
234
234
3.65
3.10
2.70
2.90
2.20
3.00
3.85
LCNB Investment Highlights – Stable Common Dividends
12
LCNB Common Dividend Payments Per Share
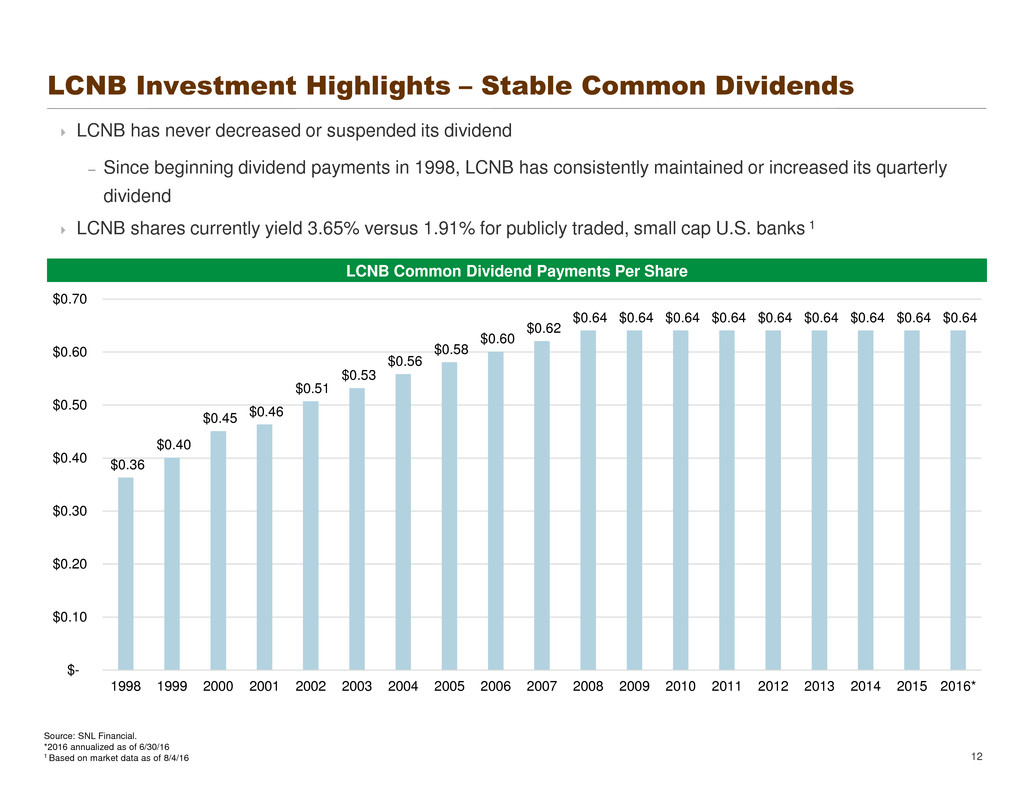
LCNB has never decreased or suspended its dividend
– Since beginning dividend payments in 1998, LCNB has consistently maintained or increased its quarterly
dividend
LCNB shares currently yield 3.65% versus 1.91% for publicly traded, small cap U.S. banks 1
$0.36
$0.40
$0.45 $0.46
$0.51
$0.53
$0.56
$0.58
$0.60
$0.62
$0.64 $0.64 $0.64 $0.64 $0.64 $0.64 $0.64 $0.64 $0.64
$-
$0.10
$0.20
$0.30
$0.40
$0.50
$0.60
$0.70
1998 1999 2000 2001 2002 2003 2004 2005 2006 2007 2008 2009 2010 2011 2012 2013 2014 2015 2016*
Source: SNL Financial.
*2016 annualized as of 6/30/16
1 Based on market data as of 8/4/16
MS Margin
3.45
Text Margin
2.90
MS Margin
5.00
MS Margin
5.00
Footnote Margin
4.60
Colors
FBR Sky
178
210
224
FBR Forest
0
72
70
FBR Cream
222
215
170
FBR Burgundy
110
0
50
FBR Silver
178
178
178
FBR Blue
5
5
80
FBR Sage
122
178
175
FBR Tan
184
155
104
FBR Brick
200
100
100
FBR Charcoal
51
51
51
FBR Steel
45
55
125
FBR Brown
87
61
17
Shading
234
234
234
3.65
3.10
2.70
2.90
2.20
3.00
3.85
LCNB Investment Highlights – Dividend Payout Ratio
13 Source: SNL Financial; Peers defined as public banks and thrifts with assets $500M - $5B; LTM as of 6/30/16
0%
10%
20%
30%
40%
50%
60%
70%
80%
90%
2005 2006 2007 2008 2009 2010 2011 2012 2013 2014 2015 LTM
LCNB Peer median Peer average
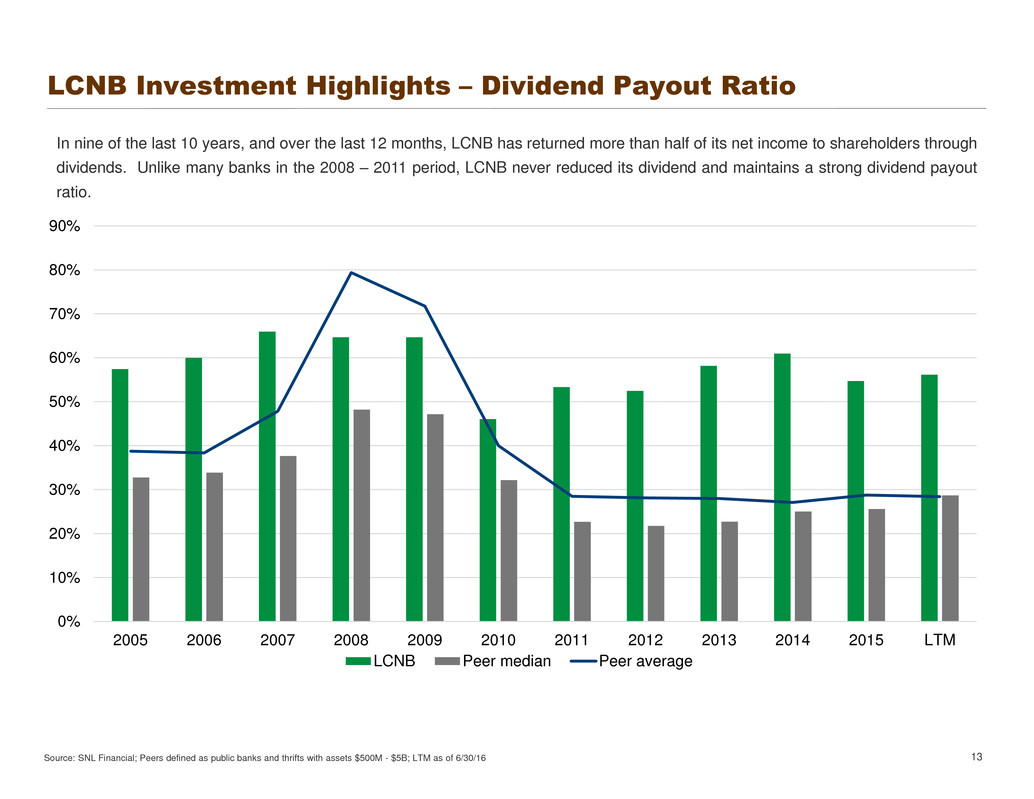
In nine of the last 10 years, and over the last 12 months, LCNB has returned more than half of its net income to shareholders through
dividends. Unlike many banks in the 2008 – 2011 period, LCNB never reduced its dividend and maintains a strong dividend payout
ratio.

MS Margin
3.45
Text Margin
2.90
MS Margin
5.00
MS Margin
5.00
Footnote Margin
4.60
Colors
FBR Sky
178
210
224
FBR Forest
0
72
70
FBR Cream
222
215
170
FBR Burgundy
110
0
50
FBR Silver
178
178
178
FBR Blue
5
5
80
FBR Sage
122
178
175
FBR Tan
184
155
104
FBR Brick
200
100
100
FBR Charcoal
51
51
51
FBR Steel
45
55
125
FBR Brown
87
61
17
Shading
234
234
234
3.65
3.10
2.70
2.90
2.20
3.00
3.85
LCNB Investment Highlights – Ownership Profile
14
Stakeholder/Insider Ownership Information Institutional Ownership Information
Holder % Owned Options Holder % Owned
LCNB National Bank 6.92 0 FMR LLC 8.21
John H. Kochensparger III 1.49 0 Kennedy Capital Management Inc. 4.77
Spencer S. Cropper 0.80 0 Jacobs Asset Management LLC 3.31
William H. Kaufman 0.73 0 American Money Management Corp. 1.18
Stephen P. Wilson 0.66 0 Cardinal Capital Management L.L.C. 0.91
George L. Leasure 0.35 0 Frank Russell Co. 0.70
Steve P. Foster 0.33 0 Clearwater Management Co. Inc 0.62
Jacobs Seymour Murray 0.23 0 Robert W. Baird & Co. Inc. 0.56
Eric J. Meilstrup 0.14 0 Renaissance Technologies LLC 0.50
Leroy F. McKay 0.10 0 Geode Capital Management LLC 0.37
Matthew P. Layer 0.09 0 Commonwealth Equity Services Inc. 0.34
Anne E. Krehbiel 0.04 0 UBS Group AG 0.32
Robert C. Haines II 0.02 0 Credit Suisse Group AG 0.32
BlackRock Inc. 0.28
Company Statistics BNY Asset Management 0.25
Ticker LCNB Regions Investment Management Inc. 0.23
Price ($) as of 8/4/16 17.43 California Public Employees' Retirement System 0.21
Total Assets (Most Recent Quarter) 1,312,635 Goldman Sachs Group Inc. 0.20
Total Float 8,755,653 Cutter & Co. Brokerage Inc. 0.19
Float (%) 88.11 California State Teachers' Retirement System 0.19
Stakeholder/Insider Ownership (%) 11.89 Millennium Management LLC 0.18
Institutional Ownership (%) 25.73
Top 10 Insider Holders (%) 11.73
Source: SNL Financial, Company documents as of 8/4/16
MS Margin
3.45
Text Margin
2.90
MS Margin
5.00
MS Margin
5.00
Footnote Margin
4.60
Colors
FBR Sky
178
210
224
FBR Forest
0
72
70
FBR Cream
222
215
170
FBR Burgundy
110
0
50
FBR Silver
178
178
178
FBR Blue
5
5
80
FBR Sage
122
178
175
FBR Tan
184
155
104
FBR Brick
200
100
100
FBR Charcoal
51
51
51
FBR Steel
45
55
125
FBR Brown
87
61
17
Shading
234
234
234
3.65
3.10
2.70
2.90
2.20
3.00
3.85
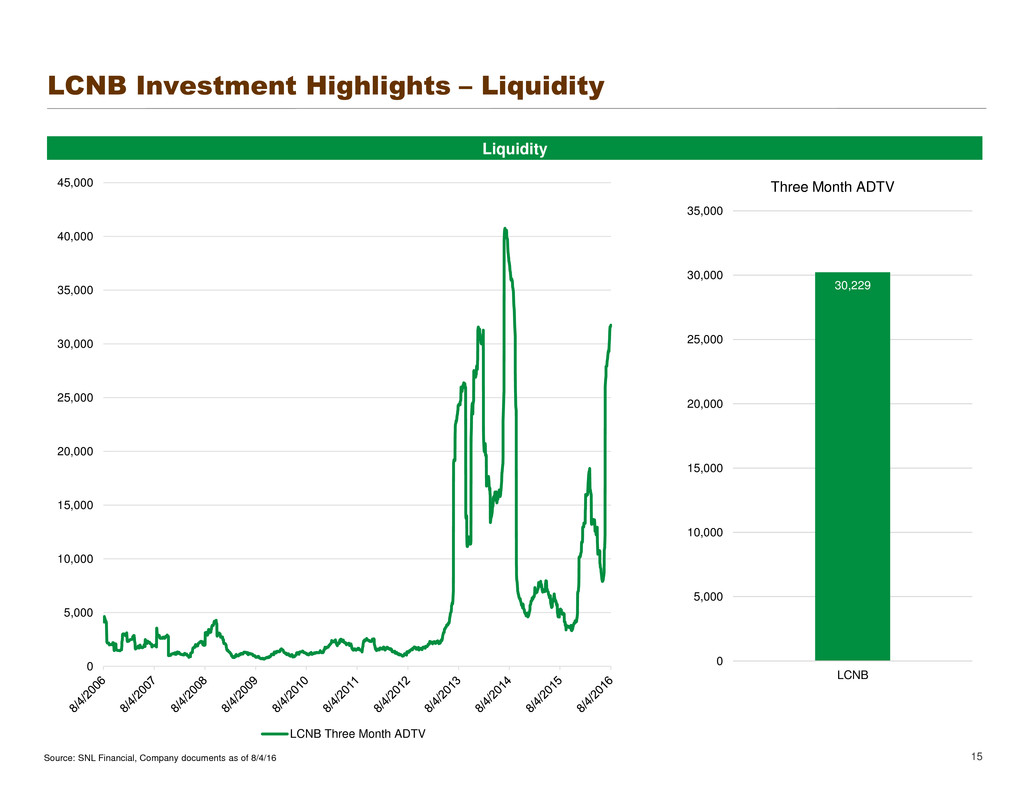
LCNB Investment Highlights – Liquidity
15
Liquidity
0
5,000
10,000
15,000
20,000
25,000
30,000
35,000
40,000
45,000
LCNB Three Month ADTV
30,229
0
5,000
10,000
15,000
20,000
25,000
30,000
35,000
LCNB
Three Month ADTV
Source: SNL Financial, Company documents as of 8/4/16

MS Margin
3.45
Text Margin
2.90
MS Margin
5.00
MS Margin
5.00
Footnote Margin
4.60
Colors
FBR Sky
178
210
224
FBR Forest
0
72
70
FBR Cream
222
215
170
FBR Burgundy
110
0
50
FBR Silver
178
178
178
FBR Blue
5
5
80
FBR Sage
122
178
175
FBR Tan
184
155
104
FBR Brick
200
100
100
FBR Charcoal
51
51
51
FBR Steel
45
55
125
FBR Brown
87
61
17
Shading
234
234
234
3.65
3.10
2.70
2.90
2.20
3.00
3.85
LCNB Investment Highlights – 10-Year Total Return
16 Source: SNL Financial as of 8/4/16
-100%
-50%
0%
50%
100%
150%
Aug-06 Aug-07 Aug-08 Aug-09 Aug-10 Aug-11 Aug-12 Aug-13 Aug-14 Aug-15
LCNB SNL U.S. Bank and Thrift
51.3%
–21.1%

MS Margin
3.45
Text Margin
2.90
MS Margin
5.00
MS Margin
5.00
Footnote Margin
4.60
Colors
FBR Sky
178
210
224
FBR Forest
0
72
70
FBR Cream
222
215
170
FBR Burgundy
110
0
50
FBR Silver
178
178
178
FBR Blue
5
5
80
FBR Sage
122
178
175
FBR Tan
184
155
104
FBR Brick
200
100
100
FBR Charcoal
51
51
51
FBR Steel
45
55
125
FBR Brown
87
61
17
Shading
234
234
234
3.65
3.10
2.70
2.90
2.20
3.00
3.85
LCNB Investment Highlights – Attractive Relative Valuation
17
Selected Peer Midwest Bank Comparison (Sorted by Market Capitalization)
Metric PRK FFBC FRME PEBO FDEF UCFC LCNB
LTM ROAA (%) 1.08 1.01 1.06 0.70 1.20 0.86 0.89
LT ROATCE (%) 12.27 13.23 12.24 9.14 13.01 6.96 11.18
LT Net Interest Margin (%) 3.45 3.68 3.82 3.56 3.76 3.17 3.40
LTM Efficiency Ratio (%) 61.55 58.55 58.86 65.76 61.70 63.42 63.74
Tang Common Equity/ Tang Assets (%) 9.07 7.86 9.43 9.18 9.52 12.15 8.69
NPA Ex-TDRs/ Total Assets (%) 1.73 0.38 0.68 0.49 0.74 1.06 0.26
Market Capitalization ($M) 1,372.6 1,311.7 1,074.8 408.4 379.6 310.6 173.2
Price/ Tangible Book (%) 205.6 206.0 171.5 144.7 170.0 123.0 156.1
Price/ LTM EPS (x) 17.3 16.3 15.1 18.1 14.0 18.5 15.3
Dividend Yield (%) 4.2 3.0 2.1 2.8 2.1 1.8 3.7
Source: SNL Financial; LTM as of 6/30/16, pricing data as of 8/4/16
