Attached files
| file | filename |
|---|---|
| 8-K - 8-K - Inuvo, Inc. | form8-kxxirdeck8x10x16.htm |

NYSE MKT: INUV
Richard Howe, CEO
Wally Ruiz, CFO
A Digital Publishing and
Advertising Technology
Company

Safe Harbor Statement
This presentation includes or incorporates by reference statements that constitute forward-looking statements within the
meaning of Section 27A of the Securities Act of 1933, as amended, and Section 21E of the Securities Exchange Act of
1934, as amended. These statements relate to future events or to our future financial performance, and involve known and
unknown risks, uncertainties and other factors that may cause the Company’s actual results, levels of activity,
performance, or achievements to be materially different from any future results, levels of activity, performance or
achievements expressed or implied by these forward‐looking statements. These statements include, but are not limited to,
information or assumptions about expenses, capital and other expenditures, financing plans, capital structure, cash flow,
liquidity, management’s plans, goals and objectives for future operations and growth. In some cases, you can identify
forward‐looking statements by the use of words such as “may,” “could,” “expect,” “intend,” “plan,” “seek,” “anticipate,”
“believe,” “estimate,” “predict,” “potential,” “continue,” or the negative of these terms or other comparable terminology. You
should not place undue reliance on forward‐looking statements since they involve known and unknown risks, uncertainties
and other factors which are, in some cases, beyond our control and which could cause actual performance or results to
differ materially from those expressed in or suggested by forward-looking statements. These statements are based on the
current expectations or beliefs of the Company’s management and are subject to various known and unknown risks that
could cause actual results to differ materially from those described in the forward-looking statements, including, but not
limited to, product demand, pricing, market acceptance, changing economic conditions, risks in product and technology
development, the effect of the Company's accounting policies, increasing competition, the Company’s ability to integrate
companies and businesses acquired by it and certain other risk factors, including those that are set forth from time to time
in the Company's filings with the United States Securities and Exchange Commission, which may cause the actual results,
performance and achievements of the Company to be materially different from any future results, performance and
achievements implied by such forward-looking statements.
Information in this presentation is considered Confidential and Proprietary to INUVO and should not be disclosed or shared with others without INUVO’s permission.

• Scalable TTM Revenue $75m, Non-GAAP Net Inc* $3m, GAAP Net Inc $1.1m
• Simple Cap Structure - 24.8m fully diluted shares, no bank debt and $4m cash
• Fast growing – 42% in 2015, 27% on Q2-2016 TTM basis
• Delivering profits since 2013 and cash flow since 2012
• With proprietary content, ad-tech, marketing tech assets
• Where IP is protected through patents and barriers to entry
• Long standing contracts with Yahoo! & Google
• NOL carry forward of $78 million
• Stock traded between $1.05 - $3.25 ($26M - $81M), insiders own ~ 20%
An internet advertising technology & digital publishing business
Who is Inuvo? (NYSE MKT: INUV)
Information in this presentation is considered Confidential and Proprietary to INUVO and should not be disclosed or shared with others without INUVO’s permission.
* Please see appendix for reconciliation of Non-GAAP Net Income

Mi
lli
o
n
s
of
D
o
llar
s
Strong Revenue Growth
Strategic objective to get to $100M run rate by Q4 – 2017, a 27% CAGR off Q1-2014
Have been and expect to be profitable on GAAP basis annually throughout.
Information in this presentation is considered Confidential and Proprietary to INUVO and should not be disclosed or shared with others without INUVO’s permission.
$0.0
$5.0
$10.0
$15.0
$20.0
$25.0
$30.0
27% CAGR
Actual Performance
Linear Trend Line
Seasonality
Seasonality
&
Demand Weakness
Upwards Trend
$100m Annual
Run Rate
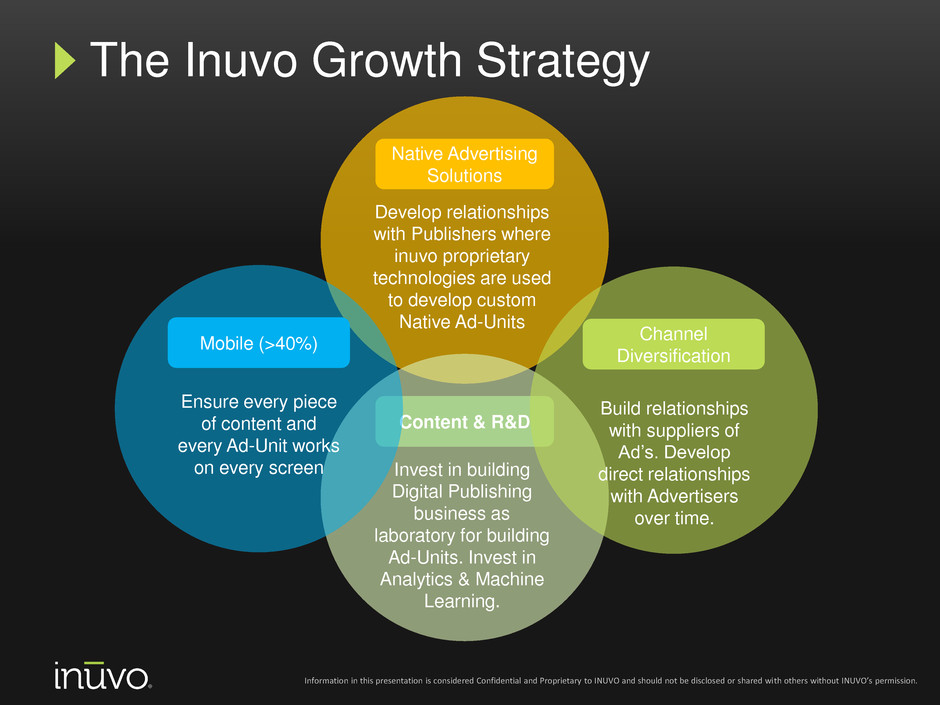
Develop relationships
with Publishers where
inuvo proprietary
technologies are used
to develop custom
Native Ad-Units
Native Advertising
Solutions
Invest in building
Digital Publishing
business as
laboratory for building
Ad-Units. Invest in
Analytics & Machine
Learning.
Content & R&D
Ensure every piece
of content and
every Ad-Unit works
on every screen
Mobile (>40%)
Channel
Diversification
Build relationships
with suppliers of
Ad’s. Develop
direct relationships
with Advertisers
over time.
The Inuvo Growth Strategy
Information in this presentation is considered Confidential and Proprietary to INUVO and should not be disclosed or shared with others without INUVO’s permission.
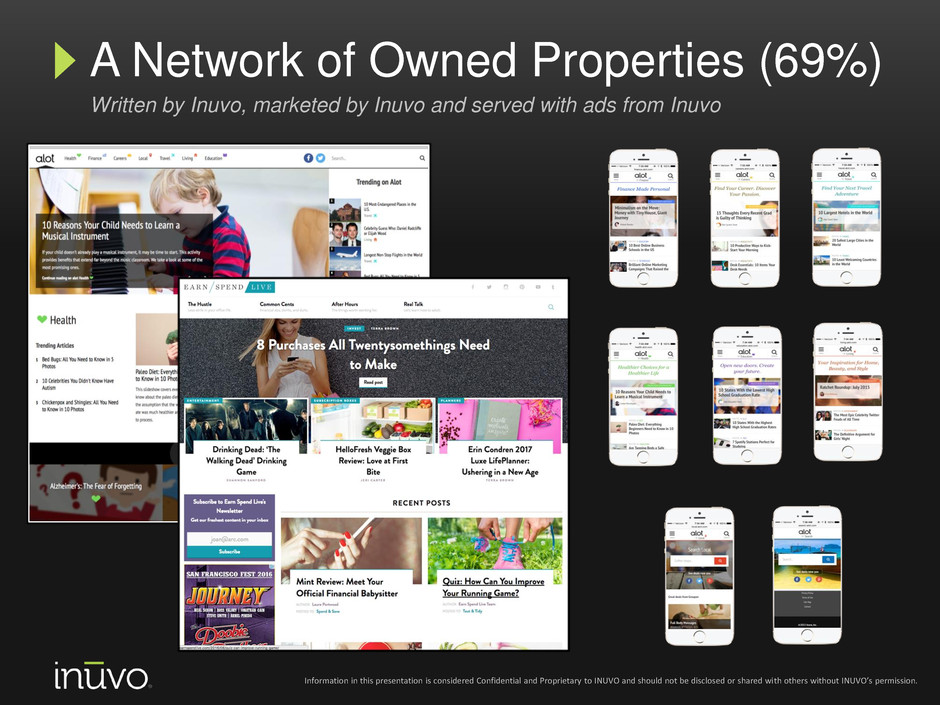
A Network of Owned Properties (69%)
Written by Inuvo, marketed by Inuvo and served with ads from Inuvo
Information in this presentation is considered Confidential and Proprietary to INUVO and should not be disclosed or shared with others without INUVO’s permission.
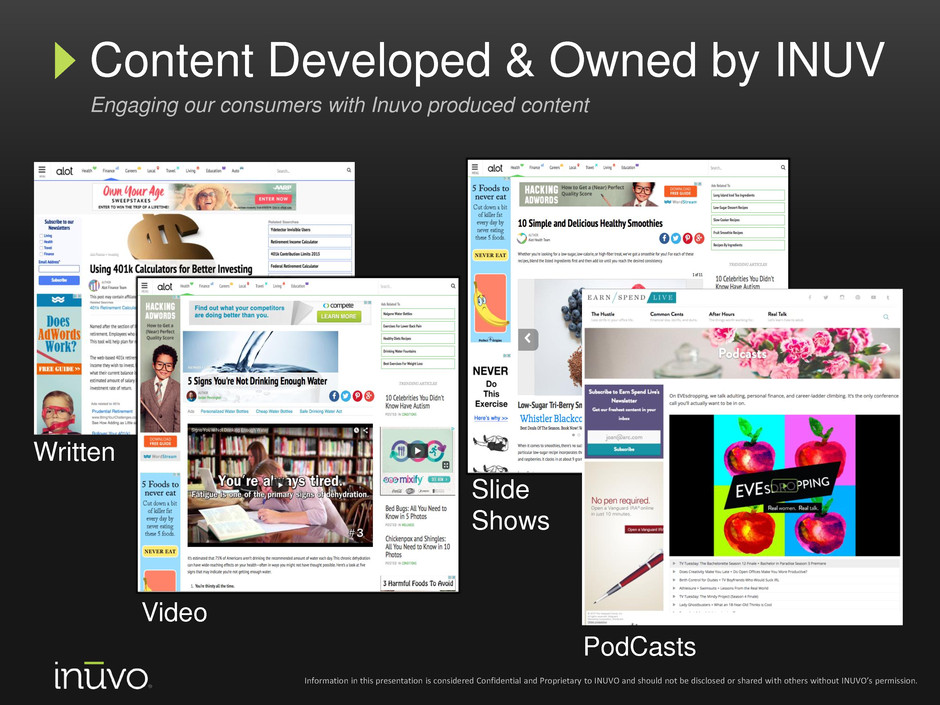
Content Developed & Owned by INUV
Engaging our consumers with Inuvo produced content
Video
Slide
Shows
Information in this presentation is considered Confidential and Proprietary to INUVO and should not be disclosed or shared with others without INUVO’s permission.
Written
PodCasts

A Network of Publishing Partners (31%)
Web properties that display INUV Ad-Tech
Information in this presentation is considered Confidential and Proprietary to INUVO and should not be disclosed or shared with others without INUVO’s permission.
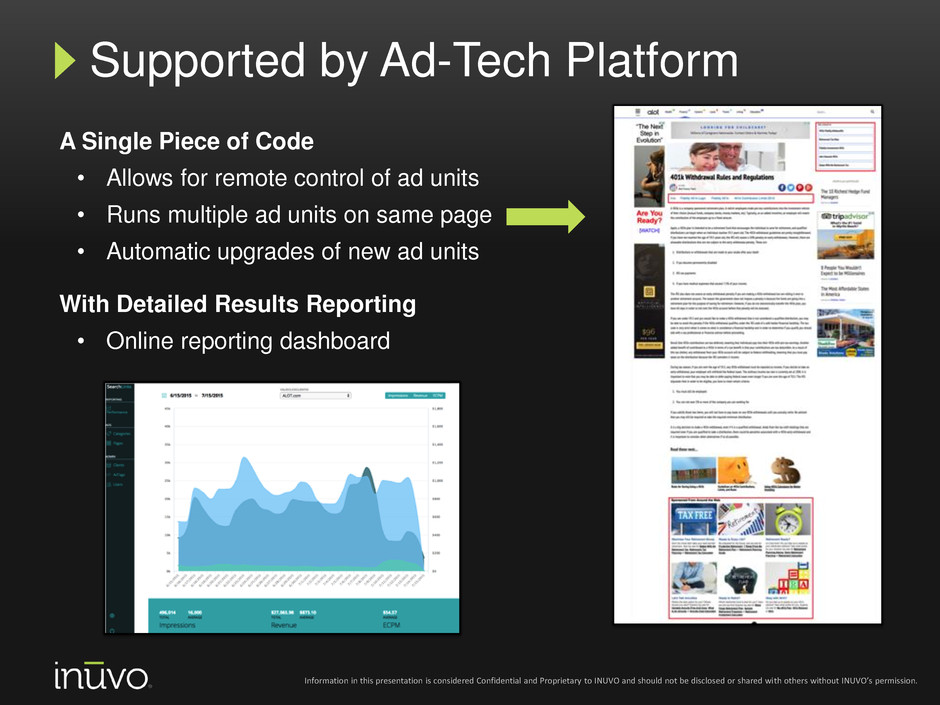
A Single Piece of Code
• Allows for remote control of ad units
• Runs multiple ad units on same page
• Automatic upgrades of new ad units
With Detailed Results Reporting
• Online reporting dashboard
Supported by Ad-Tech Platform
Information in this presentation is considered Confidential and Proprietary to INUVO and should not be disclosed or shared with others without INUVO’s permission.

A Strategy That Leverages Digital
Publishing to Develop Ad-Tech and
Ad-Tech to Drive Traffic to Digital
Publishing
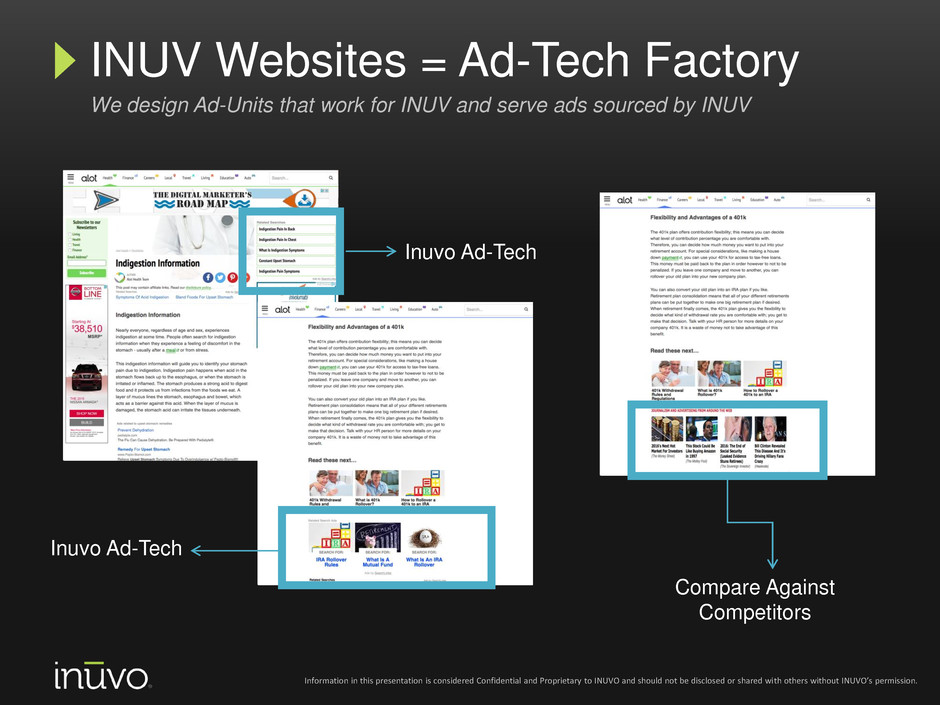
Compare Against
Competitors
Inuvo Ad-Tech
INUV Websites = Ad-Tech Factory
We design Ad-Units that work for INUV and serve ads sourced by INUV
Information in this presentation is considered Confidential and Proprietary to INUVO and should not be disclosed or shared with others without INUVO’s permission.
Inuvo Ad-Tech
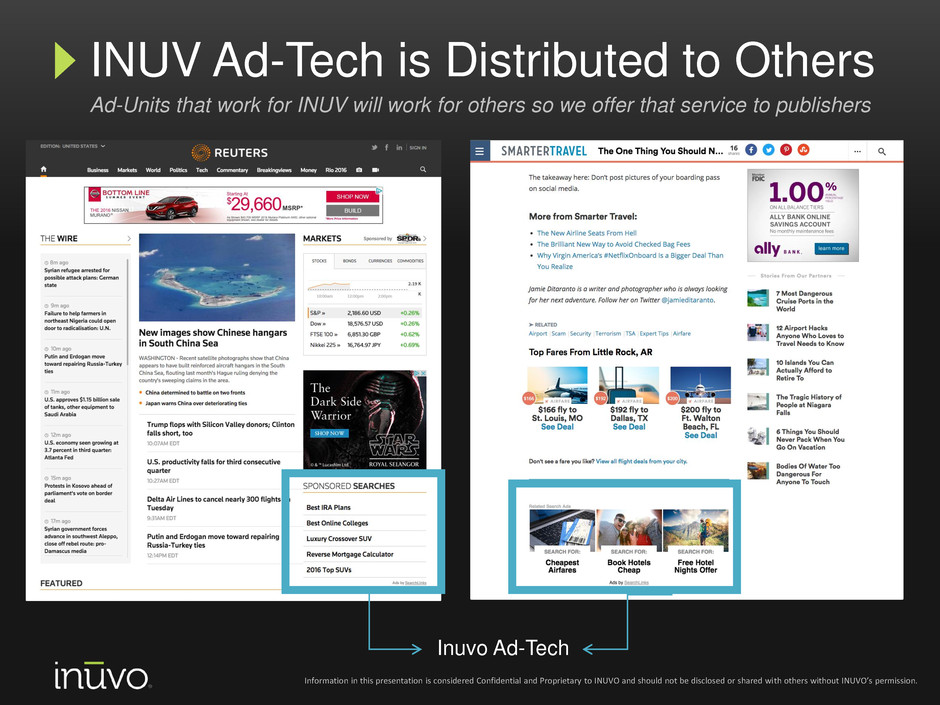
Inuvo Ad-Tech
INUV Ad-Tech is Distributed to Others
Ad-Units that work for INUV will work for others so we offer that service to publishers
Information in this presentation is considered Confidential and Proprietary to INUVO and should not be disclosed or shared with others without INUVO’s permission.
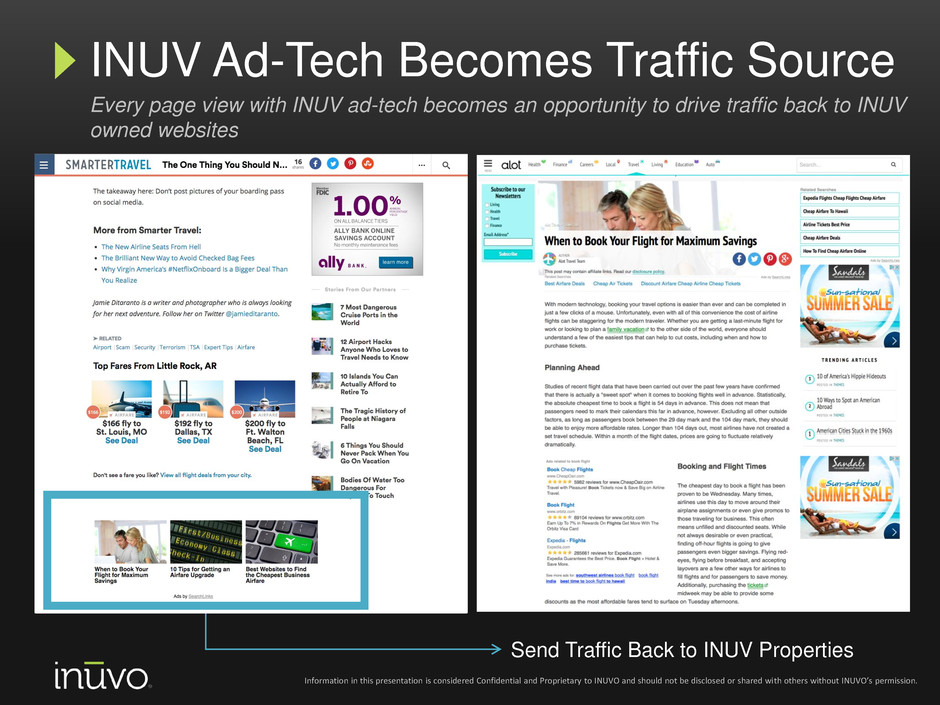
Send Traffic Back to INUV Properties
INUV Ad-Tech Becomes Traffic Source
Every page view with INUV ad-tech becomes an opportunity to drive traffic back to INUV
owned websites
Information in this presentation is considered Confidential and Proprietary to INUVO and should not be disclosed or shared with others without INUVO’s permission.
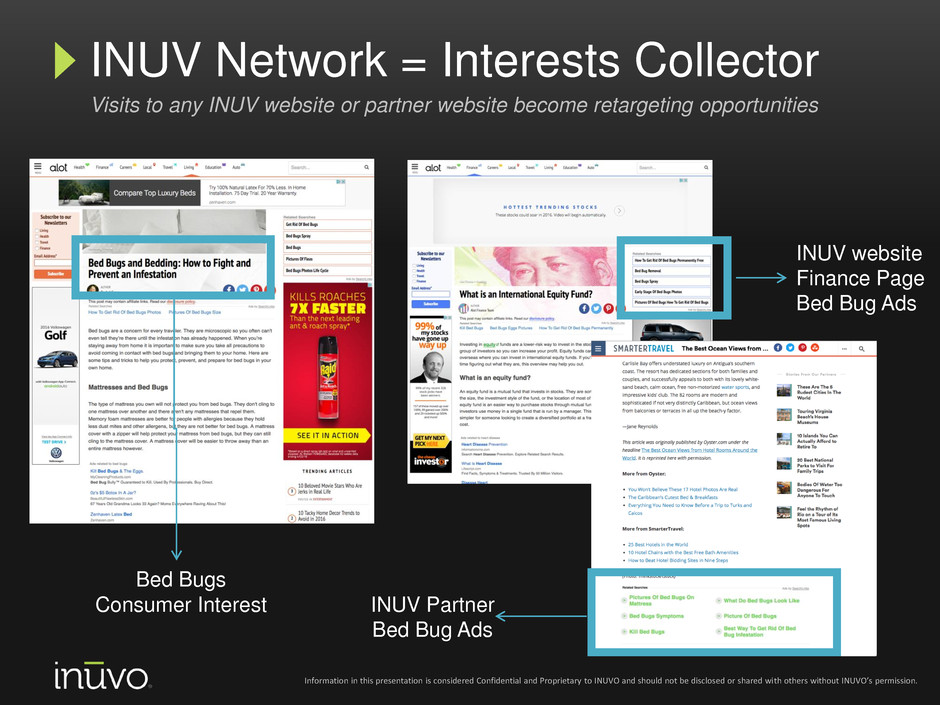
INUV Partner
Bed Bug Ads
Bed Bugs
Consumer Interest
INUV Network = Interests Collector
Visits to any INUV website or partner website become retargeting opportunities
Information in this presentation is considered Confidential and Proprietary to INUVO and should not be disclosed or shared with others without INUVO’s permission.
INUV website
Finance Page
Bed Bug Ads

• Profitable $75m TTM microcap technology company.
• Network of owned properties with >8m unique visitors monthly.
• Network of thousands of published pages using INUV ad-technology.
• Proprietary content and patented technology platforms.
• Scaling already to hundreds of millions of ads served annually.
• Collecting data and building analytics for better ad-targeting.
• Serving a large ad-supported marketplace.
A Business With Significant Scale
A family of proprietary digital properties and a network of publishing partners
using INUV ad-tech
Information in this presentation is considered Confidential and Proprietary to INUVO and should not be disclosed or shared with others without INUVO’s permission.

Sending Visitors to Leading Brands
Every day, INUV sends visitors to thousands of recognizable merchants
Information in this presentation is considered Confidential and Proprietary to INUVO and should not be disclosed or shared with others without INUVO’s permission.

Relative to peers, INUV is outperforming
Despite smaller scale, Inuvo is still outperforming its peer group financially
Information in this presentation is considered Confidential and Proprietary to INUVO and should not be disclosed or shared with others without INUVO’s permission.
Median TTM Fundamentals INUV * PEERS
Revenues $75m $171m
Growth Rates 27% 6%
Net Income % 1.5% (11.8%)
EBITDA % 4.3% (1.3%)
Revenue / Employee $1m $0.4m
Average TTM Valuation INUV * PEERS
EV / Revenue 0.39 1.56
EV / EBITDA 6.4 13.5
* Based on set of 18 public company financials

Contact Us

Go to inuvo.com/investor-email to sign up today
Investor Newsletter: Keeping Up with Inuvo
Download the Inuvo App!
Information in this presentation is considered Confidential and Proprietary to INUVO and should not be disclosed or shared with others without INUVO’s permission.
Appendix
In addition to disclosing financial results in accordance with United States generally accepted accounting principles (“GAAP”), our
presentation contains the non-GAAP financial measure “Non-GAAP net income”.
Non-GAAP net income is not a measure of performance defined in accordance with GAAP. However, management believes that Non-
GAAP net income is useful to investors in evaluating the Company’s performance because they are commonly used financial analysis tools
for measuring and comparing companies in the Company’s industry in areas of operating performance.
Management believes that the disclosure of Non-GAAP net income offers an additional view of the Company’s operations that, when
coupled with the GAAP results and the reconciliation to GAAP net income, provides a more complete understanding of the Company’s
results of operations and the factors and trends affecting the Company’s business.
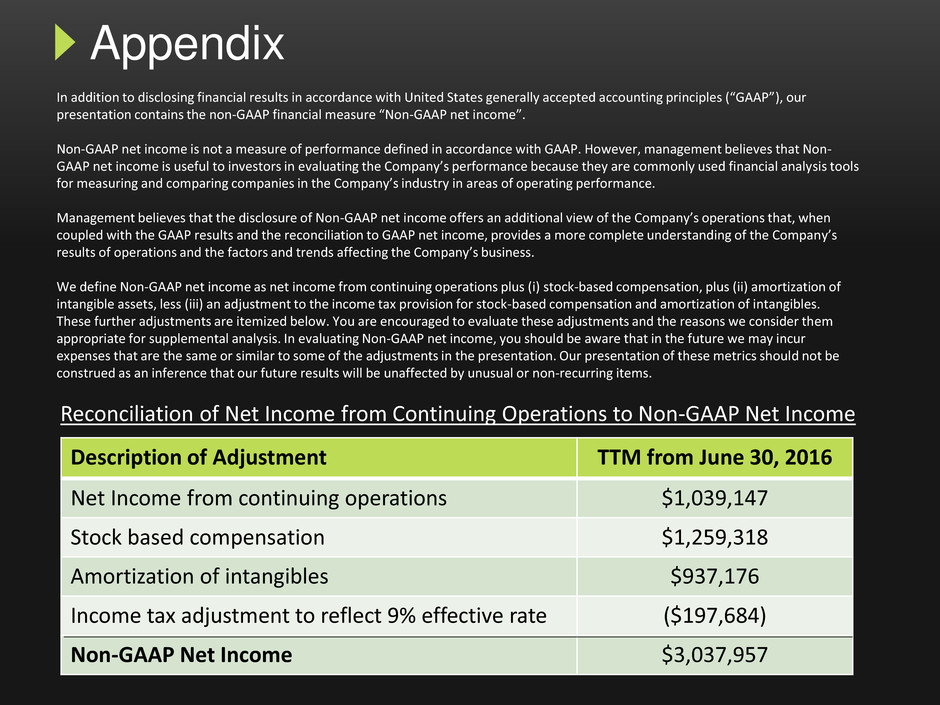
We define Non-GAAP net income as net income from continuing operations plus (i) stock-based compensation, plus (ii) amortization of
intangible assets, less (iii) an adjustment to the income tax provision for stock-based compensation and amortization of intangibles.
These further adjustments are itemized below. You are encouraged to evaluate these adjustments and the reasons we consider them
appropriate for supplemental analysis. In evaluating Non-GAAP net income, you should be aware that in the future we may incur
expenses that are the same or similar to some of the adjustments in the presentation. Our presentation of these metrics should not be
construed as an inference that our future results will be unaffected by unusual or non-recurring items.
Reconciliation of Net Income from Continuing Operations to Non-GAAP Net Income
Description of Adjustment TTM from June 30, 2016
Net Income from continuing operations $1,039,147
Stock based compensation $1,259,318
Amortization of intangibles $937,176
Income tax adjustment to reflect 9% effective rate ($197,684)
Non-GAAP Net Income $3,037,957
