Attached files
| file | filename |
|---|---|
| 8-K - 8-K - FRANKLIN FINANCIAL SERVICES CORP /PA/ | fraf-20160810x8k.htm |
 Forward Looking Statements In order for you to better understand the business of the Company – where we have been and where we want to go – our remarks today (those of the Company officers who will speak or respond to questions) will include forward looking statements related to anticipated financial performance, future operating results, business prospects, new products, and similar matters. These statements represent our best judgment, based upon present circumstances and the information now available to us, of what we think may occur in the future – and, of course, it is possible that actual results may differ materially from those we envision today. For a more complete discussion on the subject of forward looking statements, including a list of some of the risk factors that might adversely affect future operating results, we refer you to the section entitled “Forward Looking Statements” which appears in our annual report on Form 10-K as filed with the Securities and Exchange Commission. 2
 Company Profile •F&M Trust founded in 1906 •Franklin Financial formed in 1983 •Headquartered in Chambersburg, PA •22 offices throughout Cumberland, Franklin, Fulton and Huntingdon Counties •$1.084 billion in assets at June 30, 2016 •$725.5 million in brokerage and trust assets under management 3
 Market Share •#1 Deposit Market Share in Chambersburg (49.0%) •#1 Deposit Market Share in Franklin County (31.3%) •#1 Deposit Market Share in Fulton County (34.8%) •#7 Deposit Market Share in Carlisle (5.2%) •#9 Deposit Market Share in Cumberland County (3.3%) Source: SNL Financial; bank deposits as of June 30, 2015 4
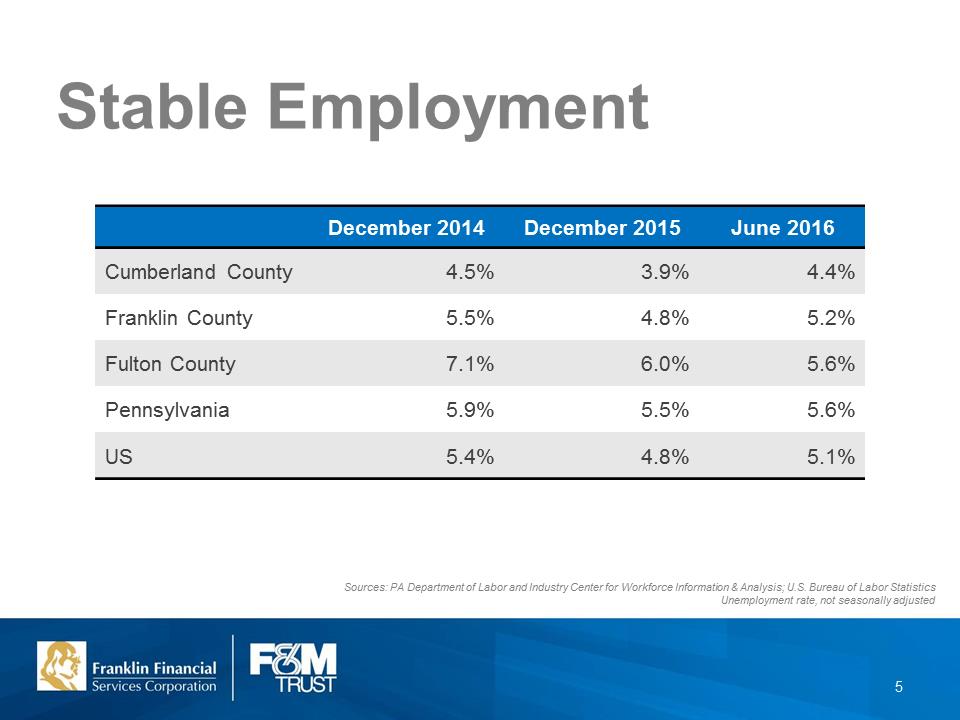 Stable Employment Sources: PA Department of Labor and Industry Center for Workforce Information & Analysis; U.S. Bureau of Labor Statistics Unemployment rate, not seasonally adjusted 5
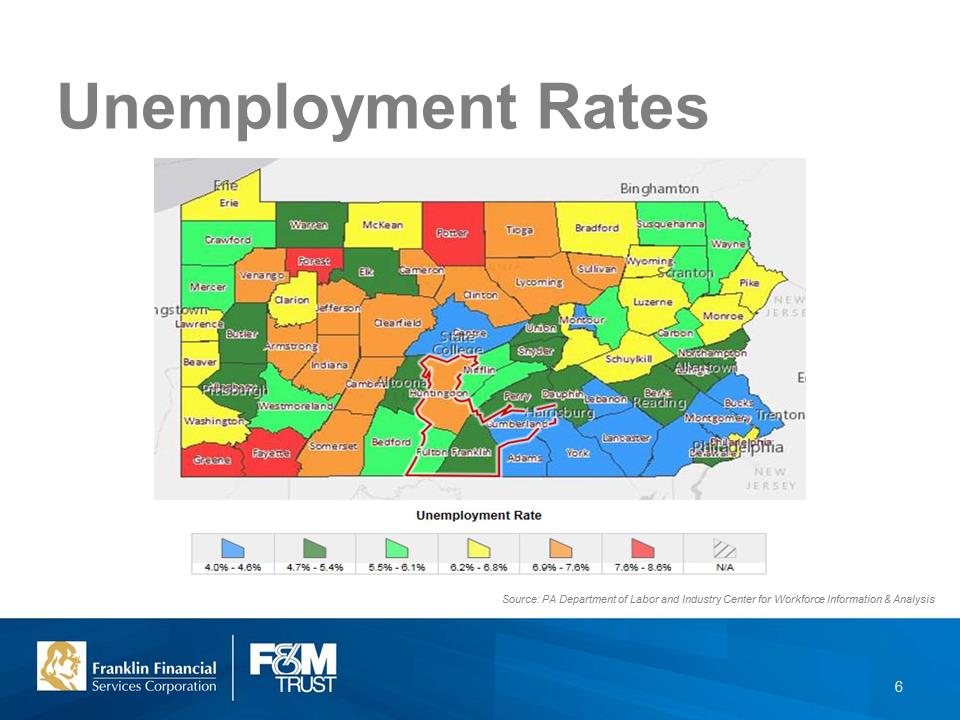 Unemployment Rates 6
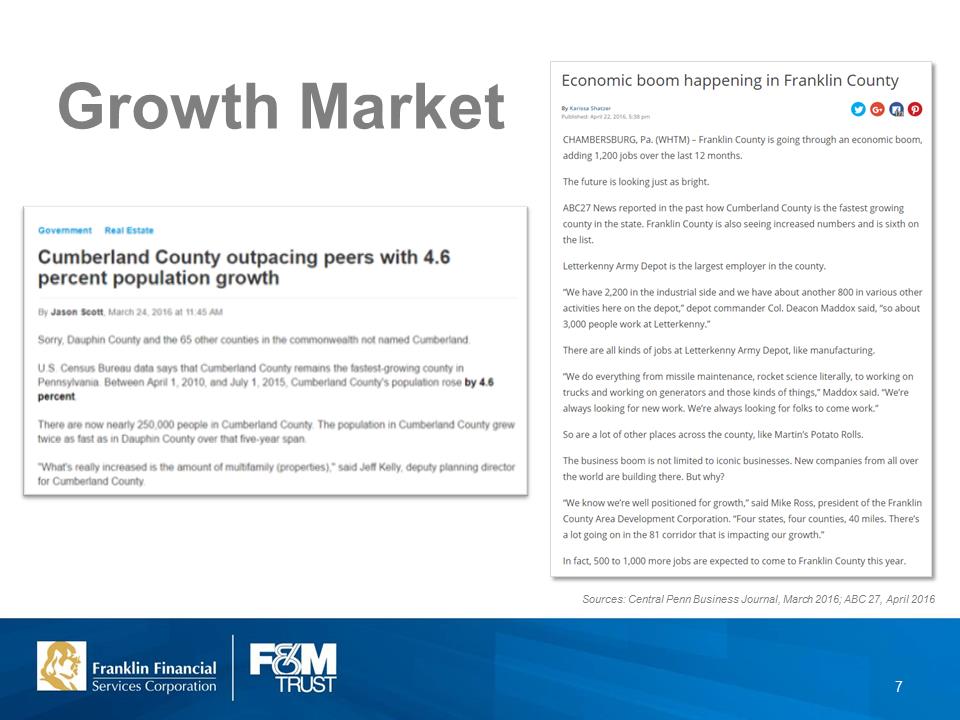 Growth Market Sources: Central Penn Business Journal, March 2016; ABC 27, April 2016 7
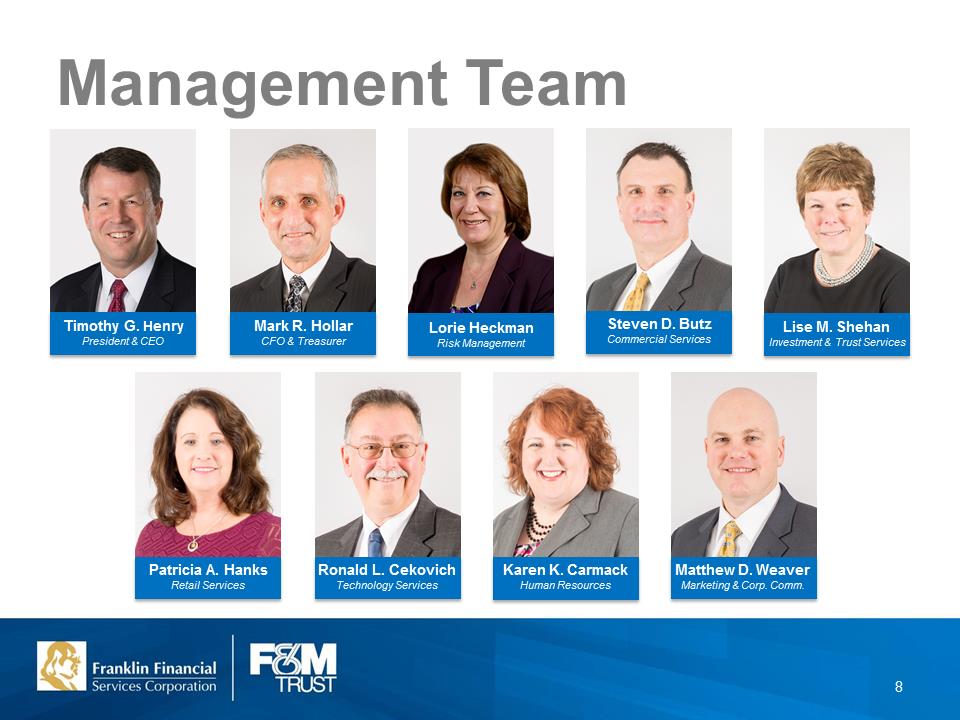 Management Team 8
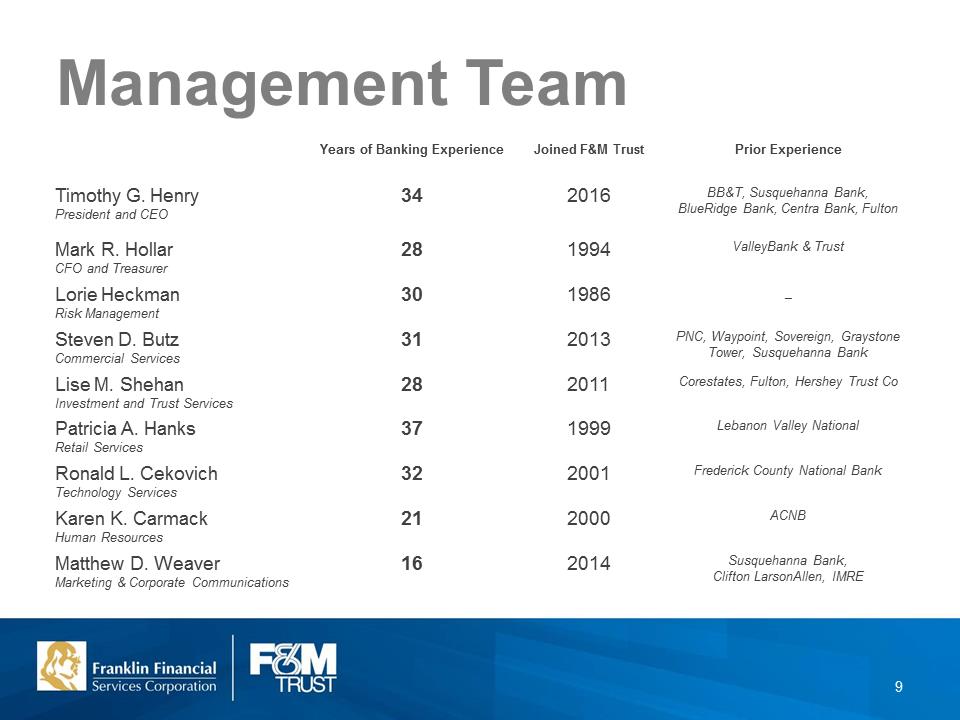 Management Team 9
 Strategic Plan Focus •Continue Pace of Loan Growth •Increasing Fee-Based Lines of Business •Further Development of Sales Culture •Maintain Expense Control •Continue to Improve Overall Loan Quality 10
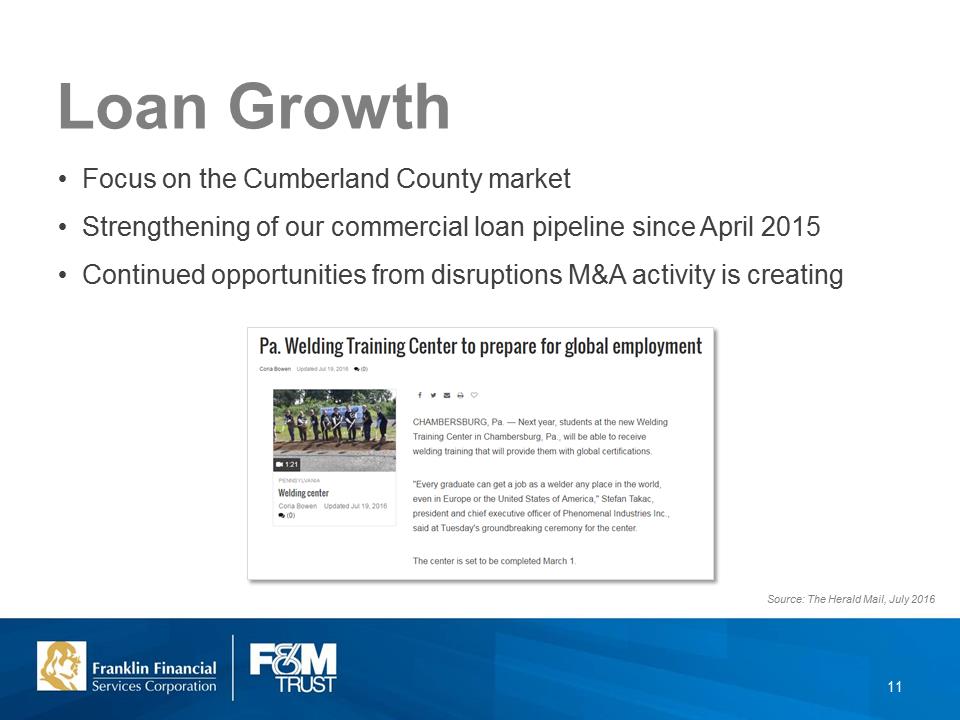 Loan Growth Source: The Herald Mail, July 2016 •Focus on the Cumberland County market •Strengthening of our commercial loan pipeline since April 2015 •Continued opportunities from disruptions M&A activity is creating 11
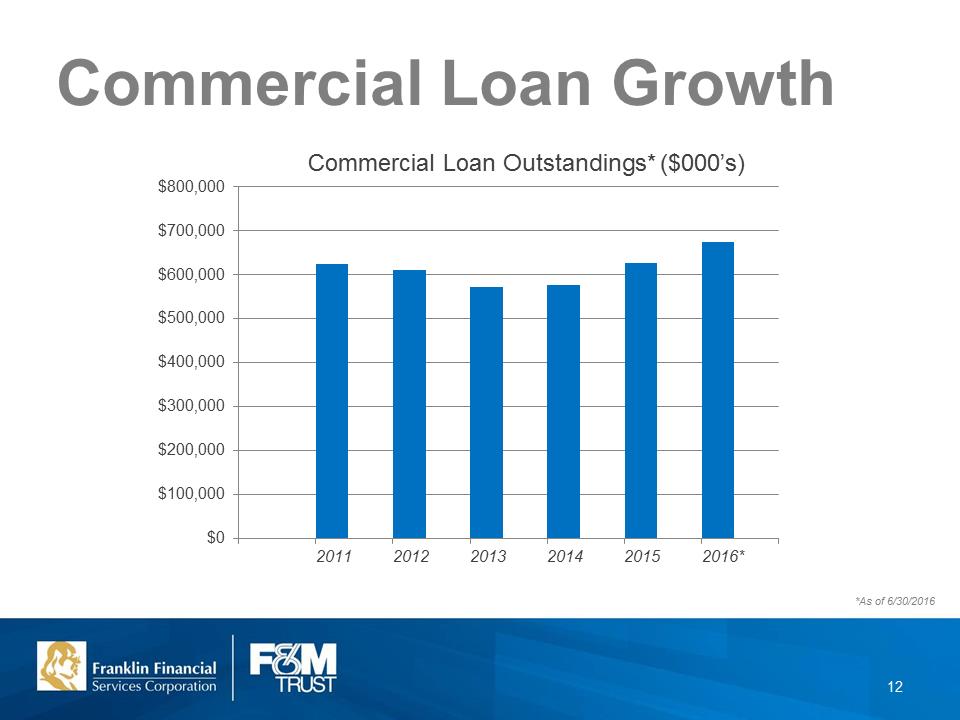 Commercial Loan Outstandings* ($000’s) Commercial Loan Growth *As of 6/30/2016 12
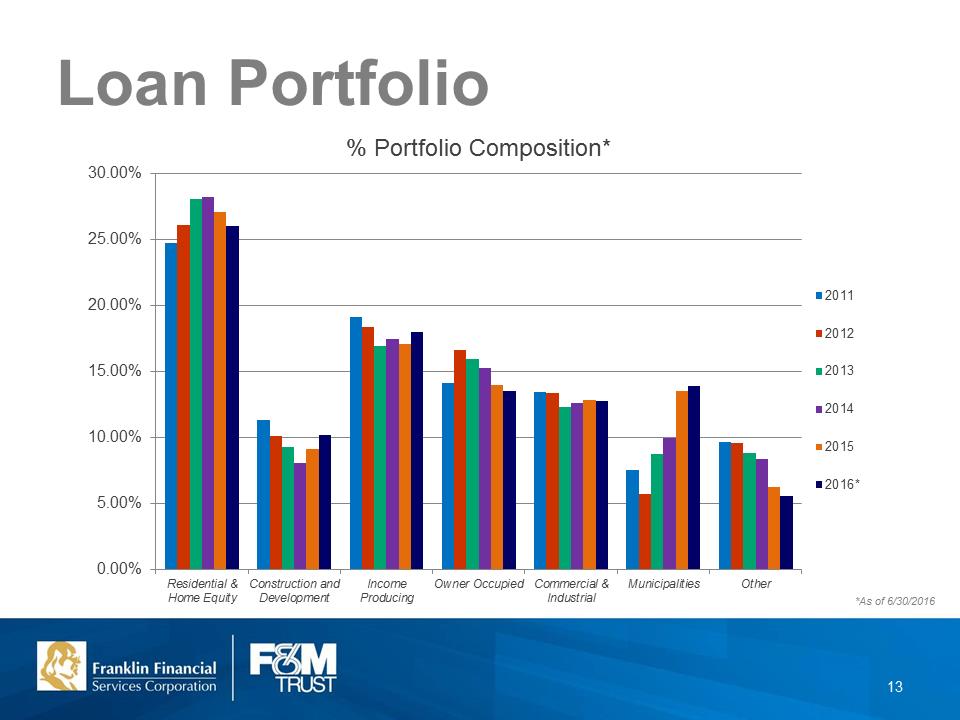 Loan Portfolio% Portfolio Composition13
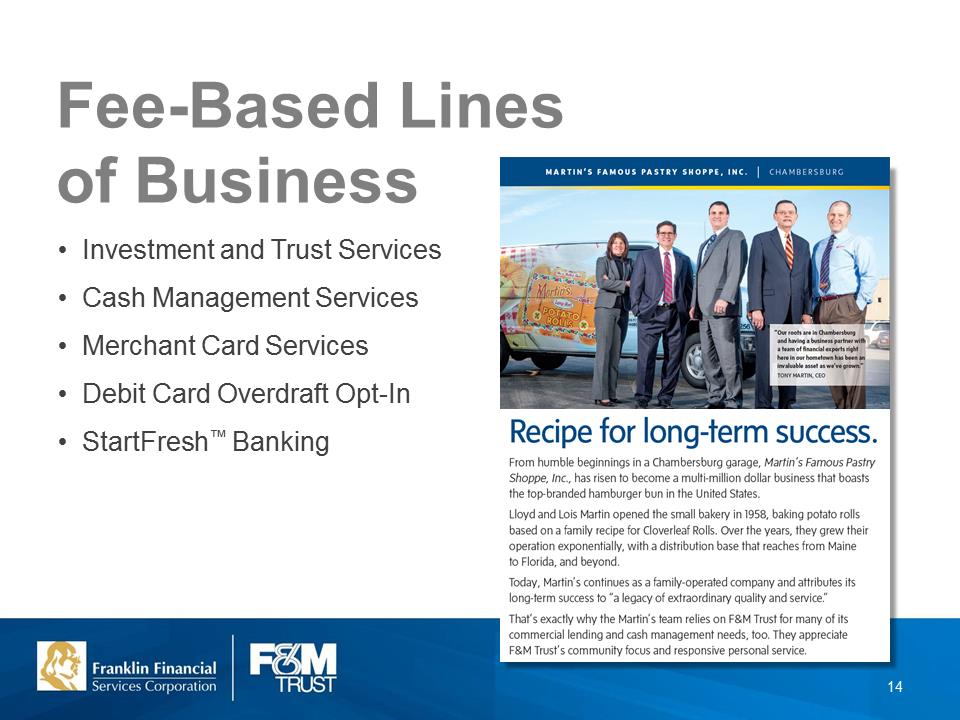 Fee-Based Lines of Business •Investment and Trust Services •Cash Management Services •Merchant Card Services •Debit Card Overdraft Opt-In •StartFresh™ Banking 14
 Investment & Trust Services •Trust powers since our incorporation in 1906 •Fully integrated trust, investment, insurance and brokerage services, focused exclusively on client needs •Fee income increased by 10.1% for 2015 •Designated Market Managers housed in and focused on growth in Cumberland, Franklin and Fulton Counties 15
 Investment & Trust Services •Over 300 years of combined financial services experience among our professional staff members •Professional designations include: –CFPs (Certified Financial Planner) –CFA (Chartered Financial Analyst) –JD (Juris Doctor) –CTFA (Certified Trust and Financial Advisor) –AAMS (Accredited Asset Management Specialist) –CISP (Certified IRA Services Professional) –RFC (Registered Financial Consultant) –CASL (Chartered Advisor for Senior Living) –QKA (Qualified 401K Administrator) –QPA (Qualified Pension Administrator) –CFIRS (Certified Fiduciary and Investment Risk Specialist) –MBAs 16
 Sales Culture Development •Plan to continue relationship with the Anthony Cole Training Group in 2017 •Positive changes in the sales culture being recognized in 2016 •Plan to marry sales process with service standards to continue the evolution of our sales and service culture 17
 Expense Control •Completed a comprehensive delivery channel study –Analyzed community office network and self-service delivery channels –Objective to increase market penetration and profitability –Closed three community offices in January 2015; reduction of $500,000 per year in operating expenses –Continue to monitor performance of other community offices •Controlling operating expenses –Noninterest expense increased 2.5% year-over-year 18
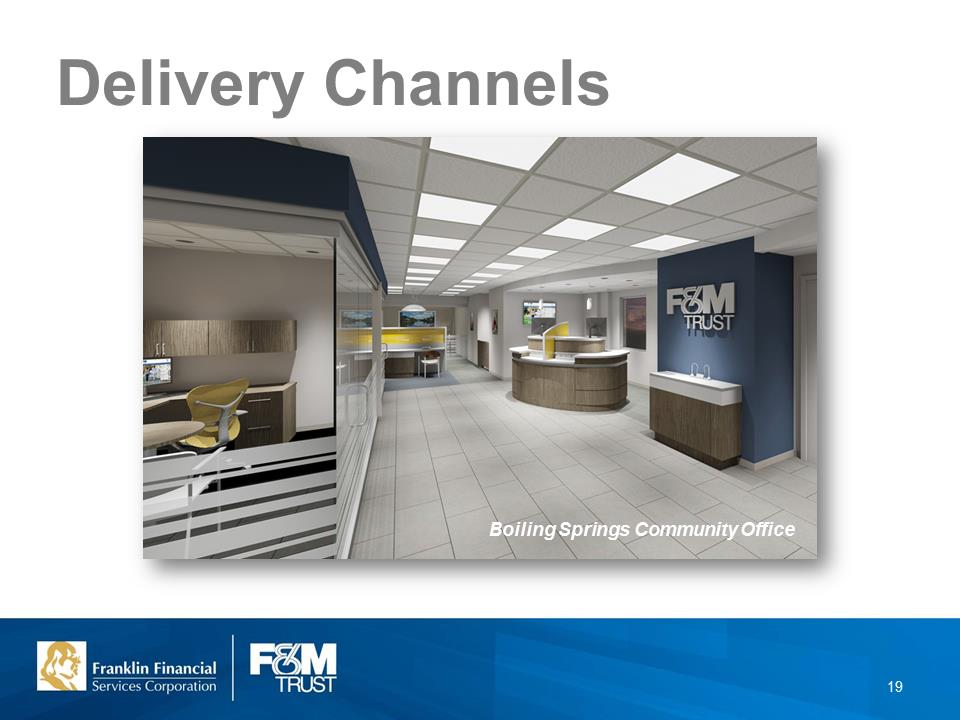 Delivery Channels Boiling Springs Community Office 19
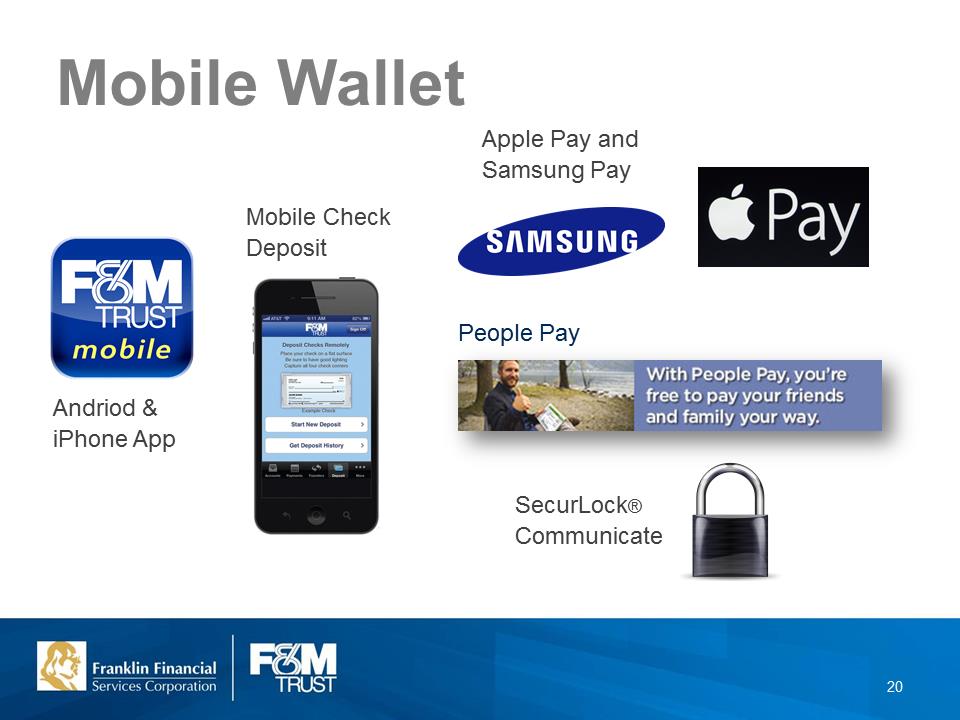 http://uploads.webflow.com/54d241baa59e05340ae1f500/552e7ce78f4602c87dfca1ab_Samsung.pnghttp://mobileidworld.com/assets/Apple-Pay-1.jpgApple Pay and Samsung Pay People Pay Mobile Check Deposit SecurLock® Communicate Andriod & iPhone App Mobile Wallet 20
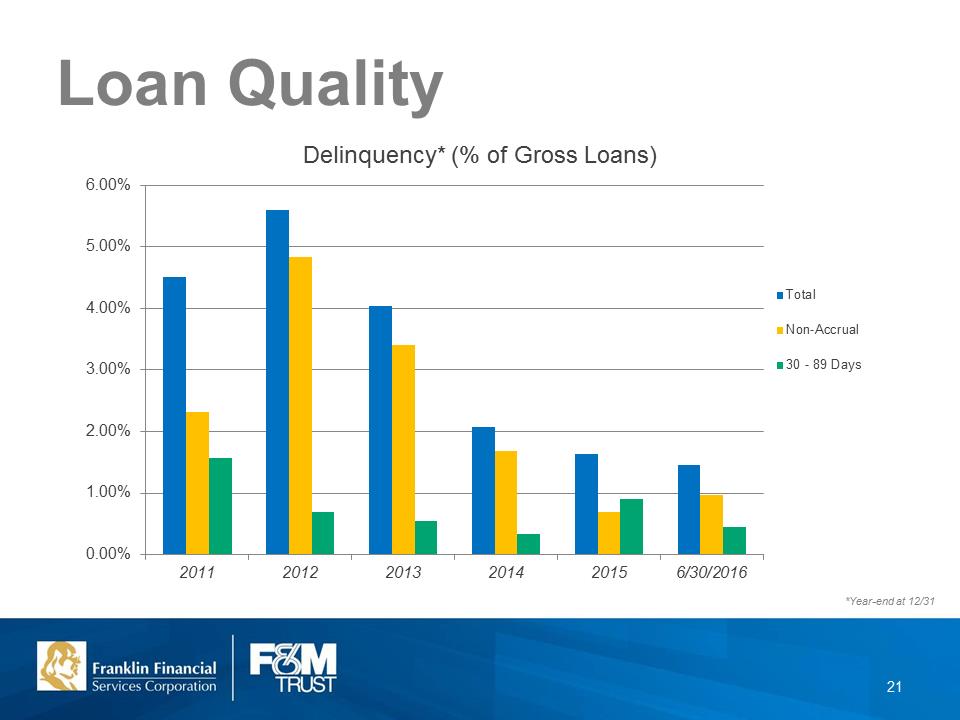 Loan QualityDelinquency* (% of Gross Loans)21
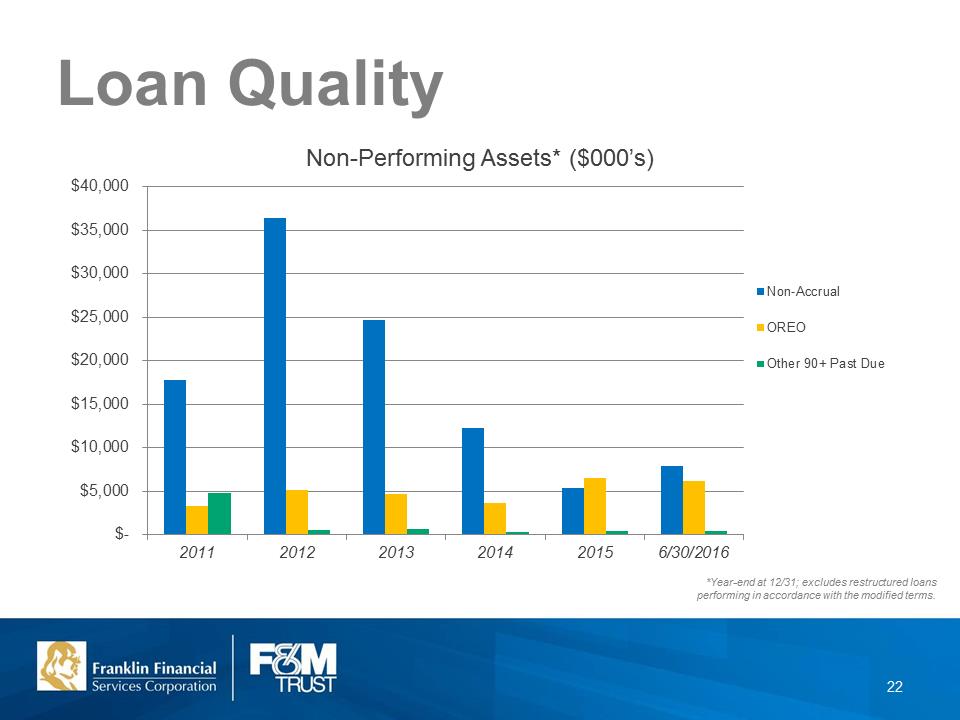 Loan Quality Non-Performing Assets* ($000’s)22
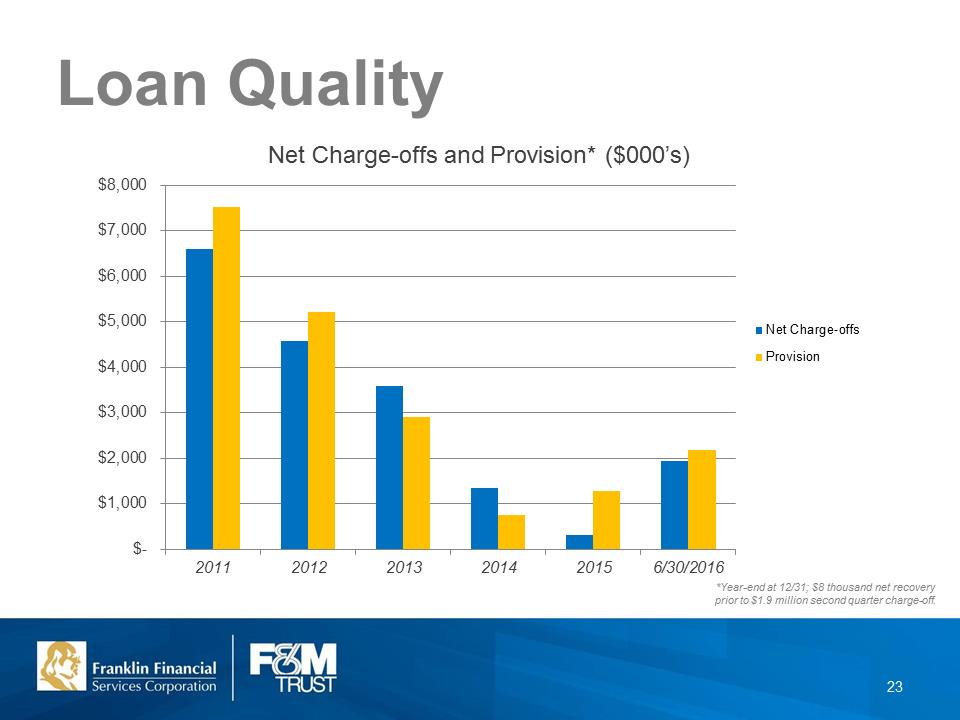 Loan Quality Net Charge-offs and Provision* ($000’s)23
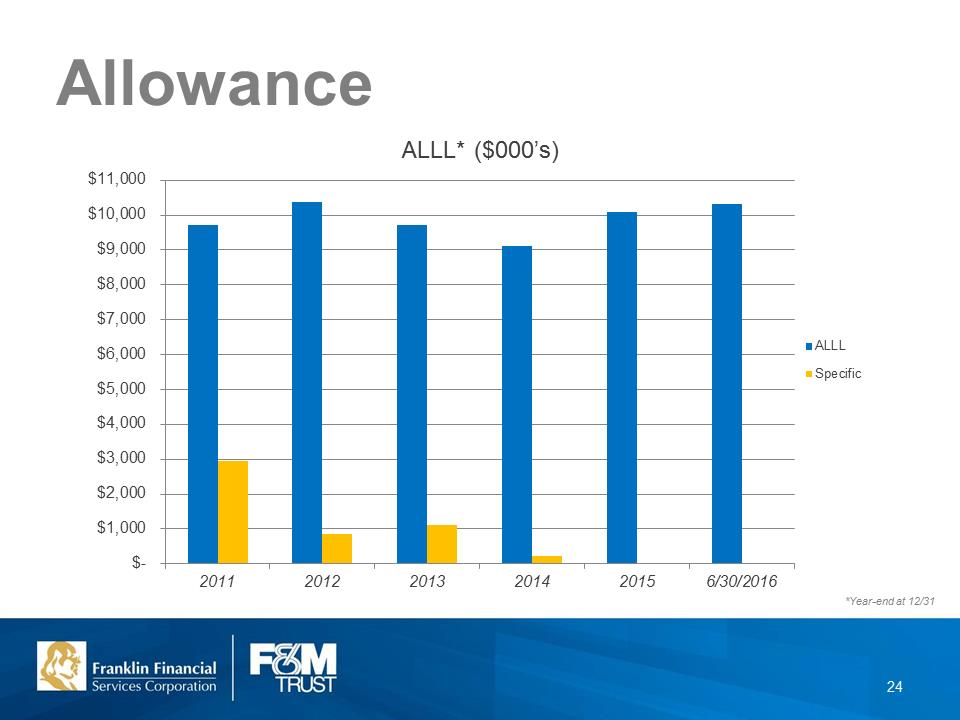 ALLL* ($000’s) 24
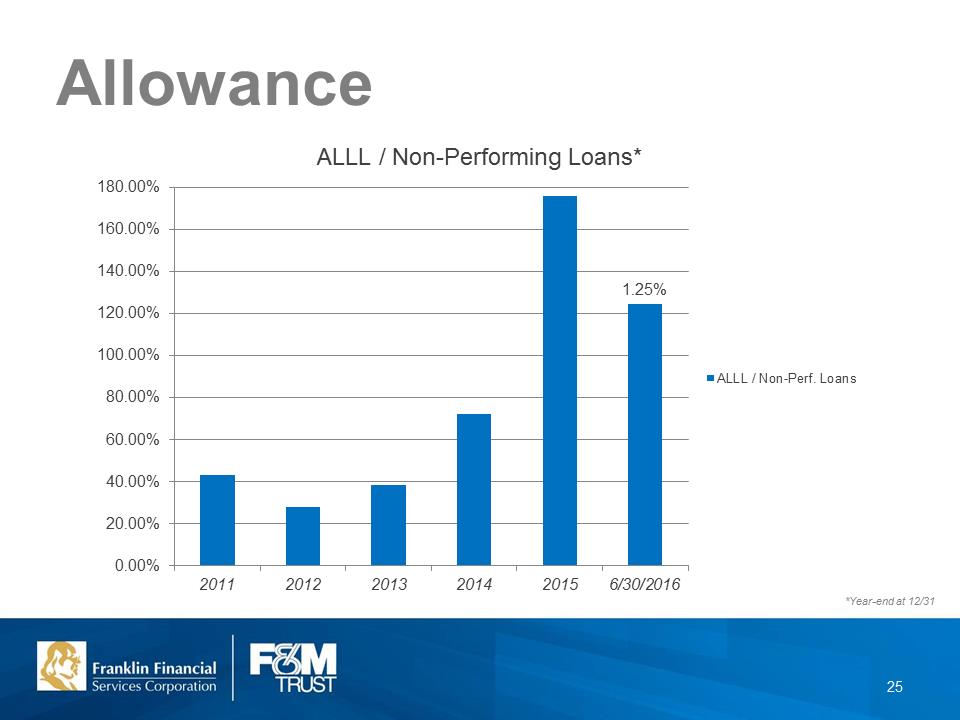 ALLL / Non-Performing Loans* 25
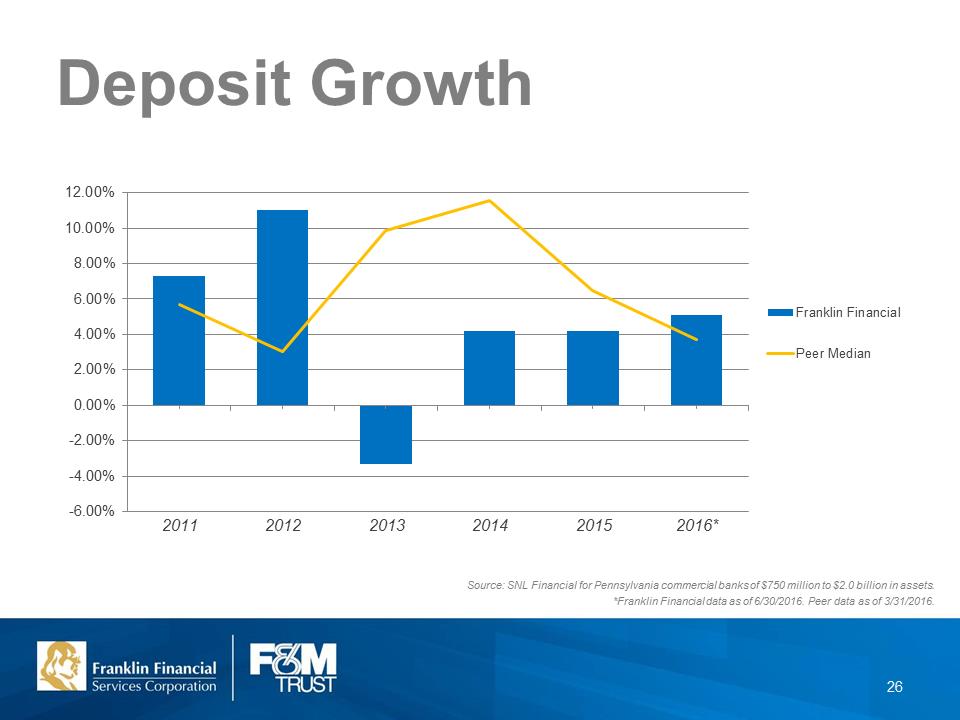 Deposit Growth Source: SNL Financial for Pennsylvania commercial banks of $750 million to $2.0 billion in assets. *Franklin Financial data as of 6/30/2016. Peer data as of 3/31/2016. 26
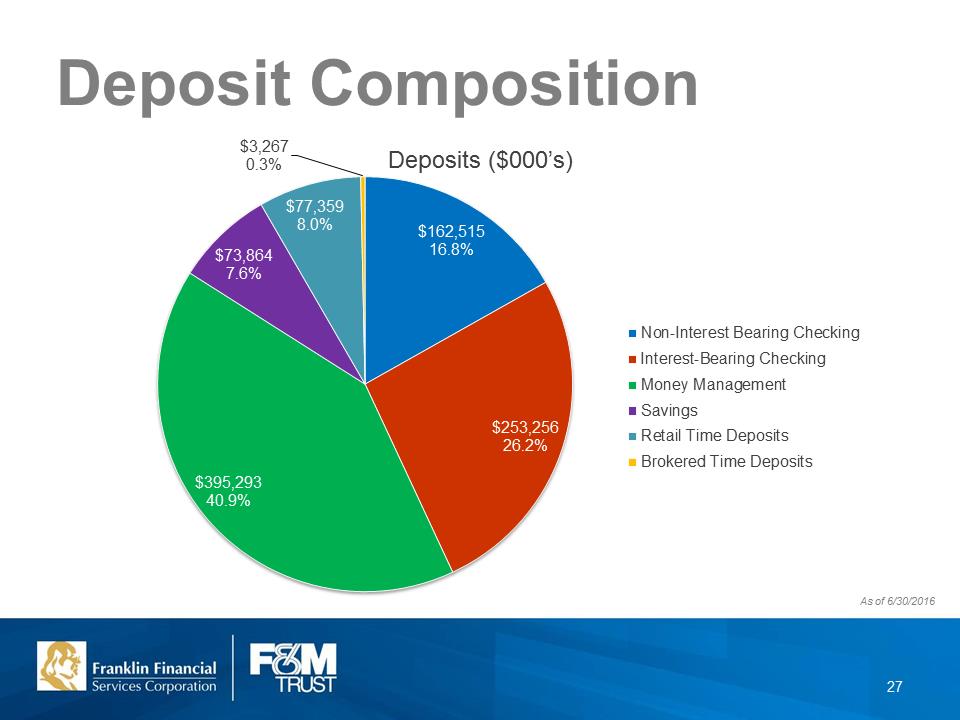 Deposit Composition As of 6/30/2016 27
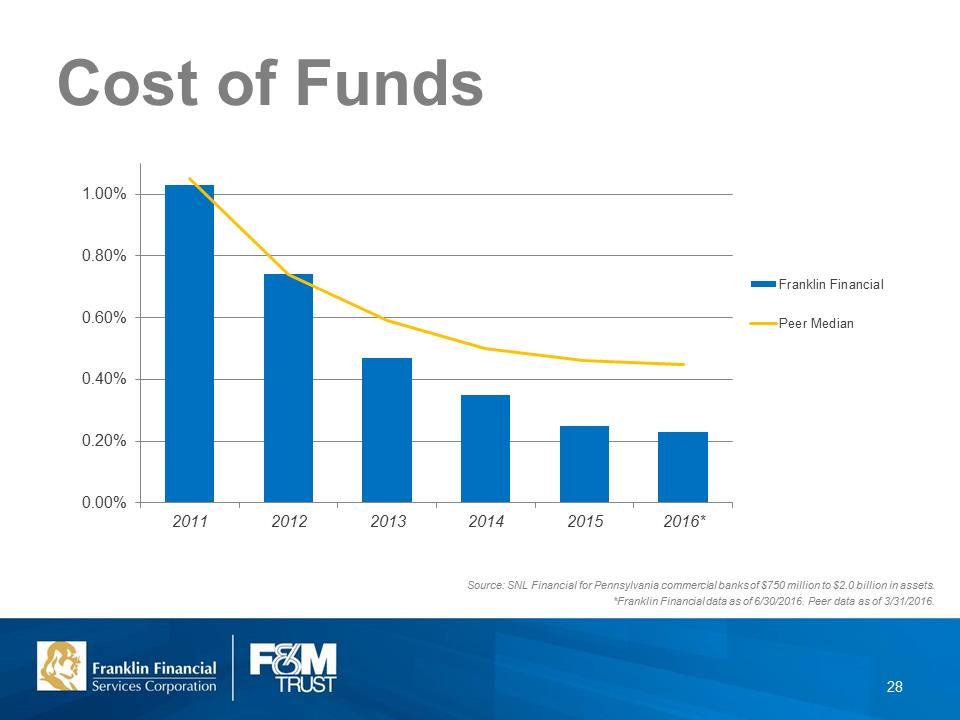 Cost of Funds Source: SNL Financial for Pennsylvania commercial banks of $750 million to $2.0 billion in assets. *Franklin Financial data as of 6/30/2016. Peer data as of 3/31/2016. 28
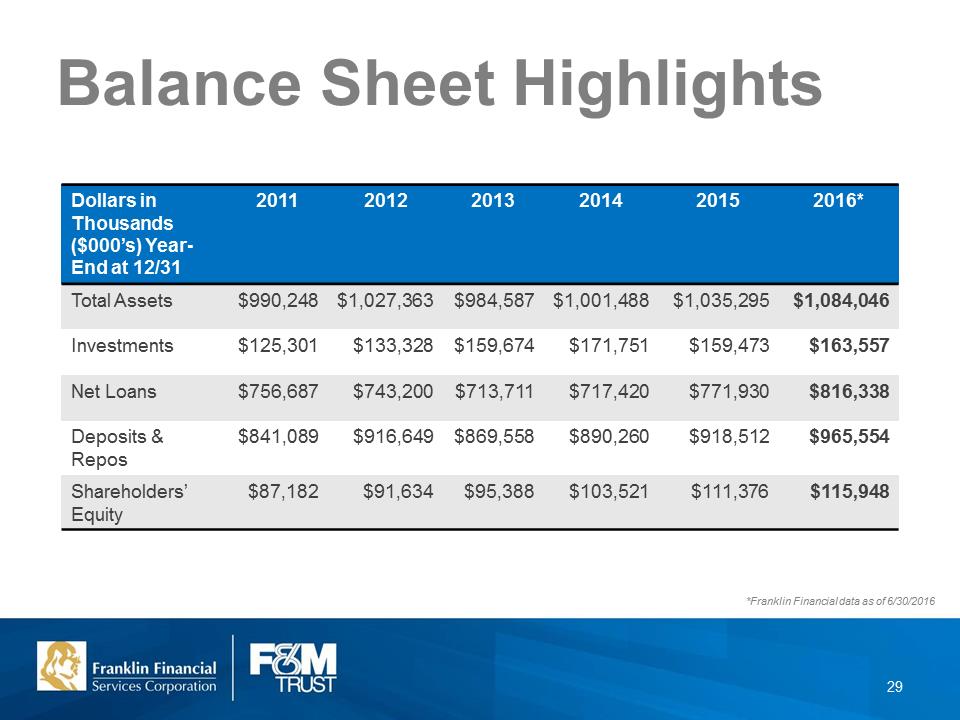 Balance Sheet Highlights *Franklin Financial data as of 6/30/2016 29
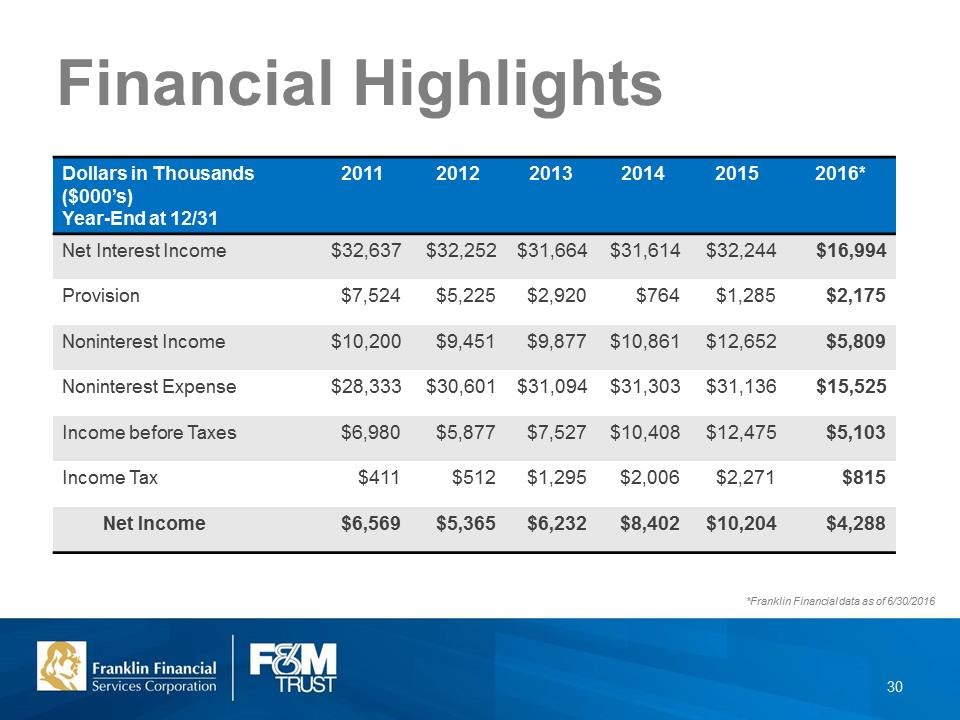 Financial Highlights *Franklin Financial data as of 6/30/2016 30
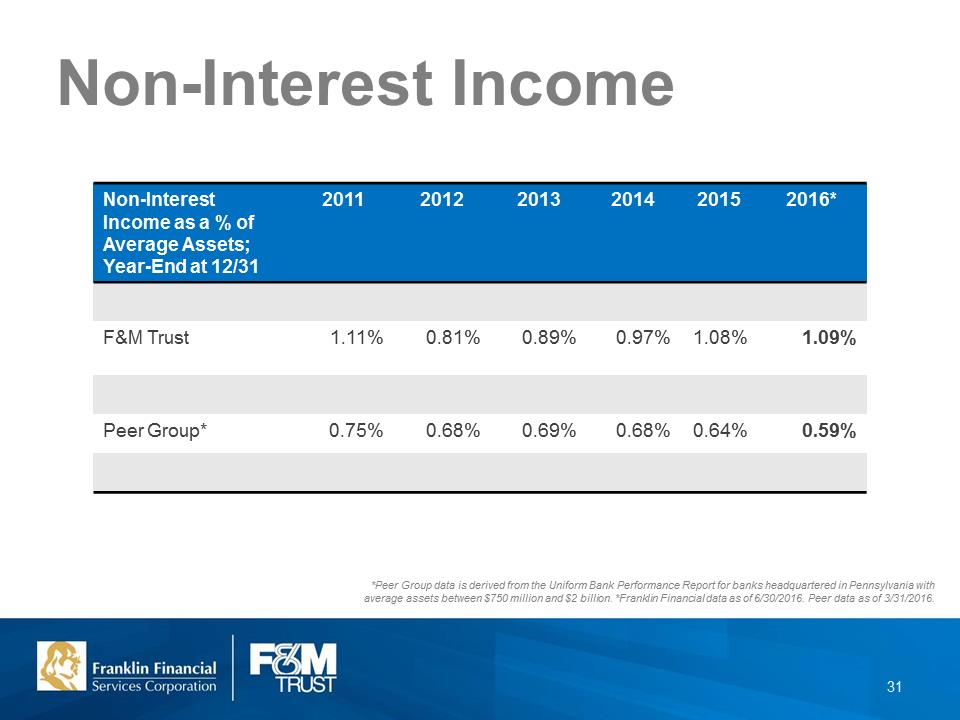 Non-Interest Income *Peer Group data is derived from the Uniform Bank Performance Report for banks headquartered in Pennsylvania with average assets between $750 million and $2 billion. *Franklin Financial data as of 6/30/2016. Peer data as of 3/31/2016. 31
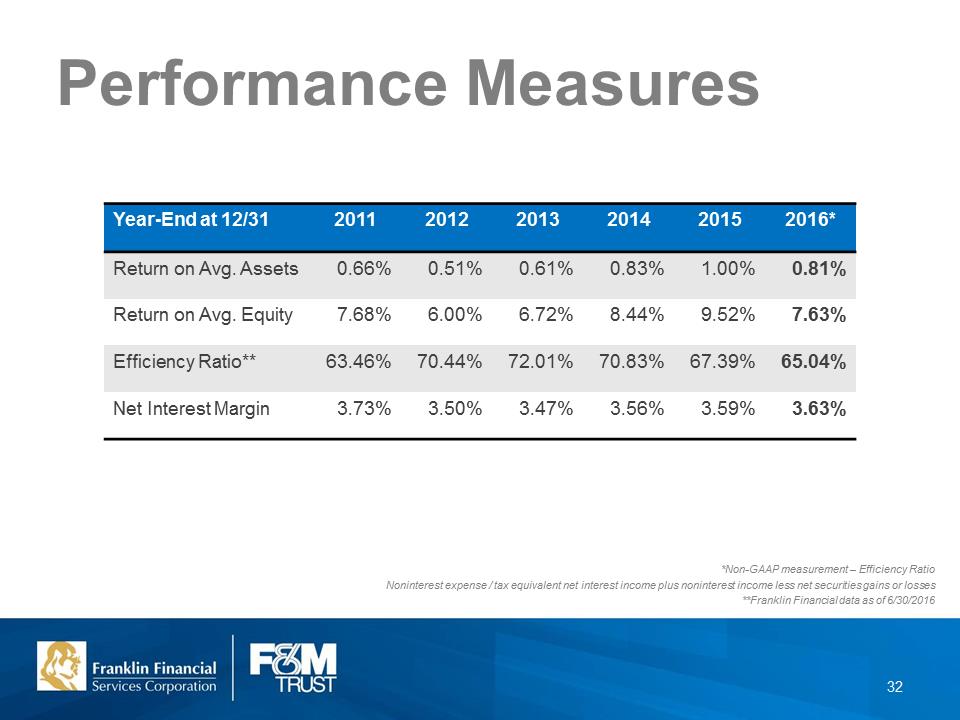 Performance Measures *Non-GAAP measurement – Efficiency Ratio Noninterest expense / tax equivalent net interest income plus noninterest income less net securities gains or losses **Franklin Financial data as of 6/30/2016 32
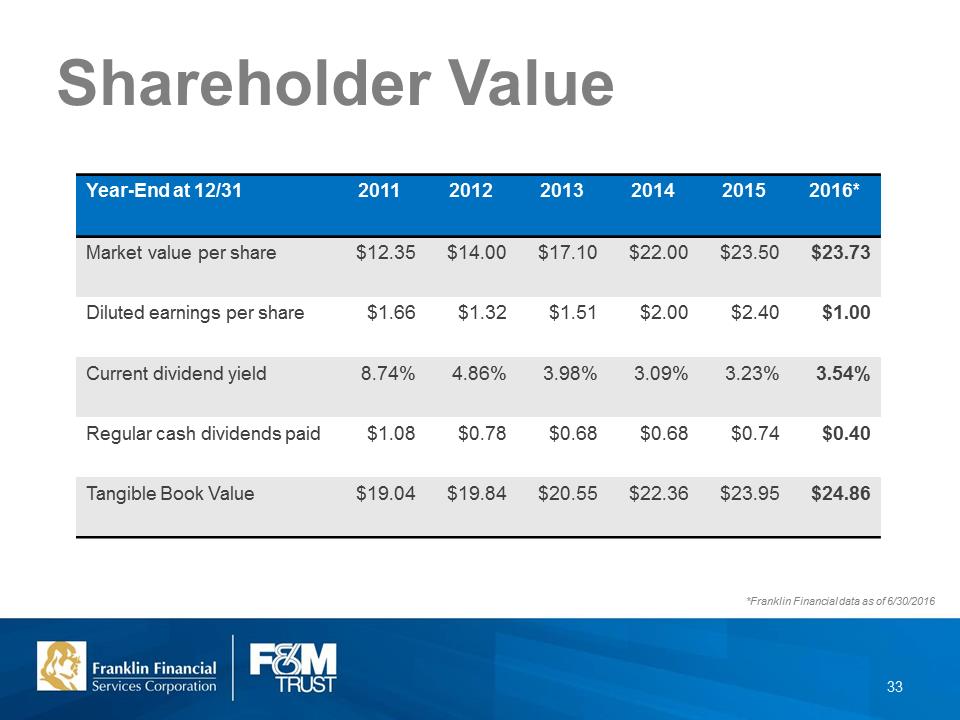 Shareholder Value *Franklin Financial data as of 6/30/2016 33
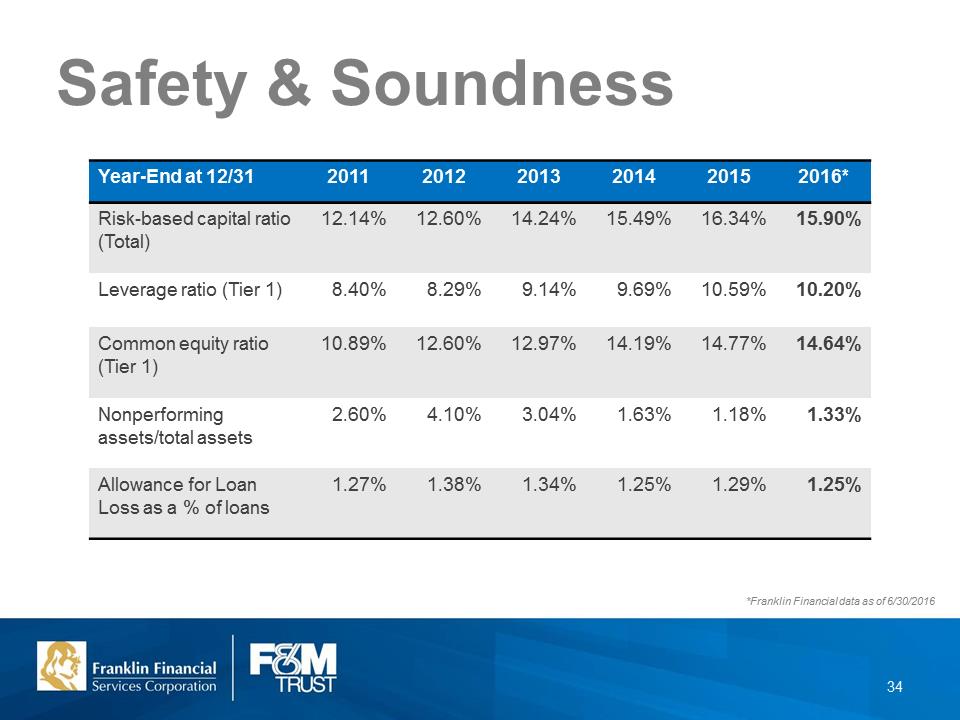 Safety & Soundness *Franklin Financial data as of 6/30/2016 34
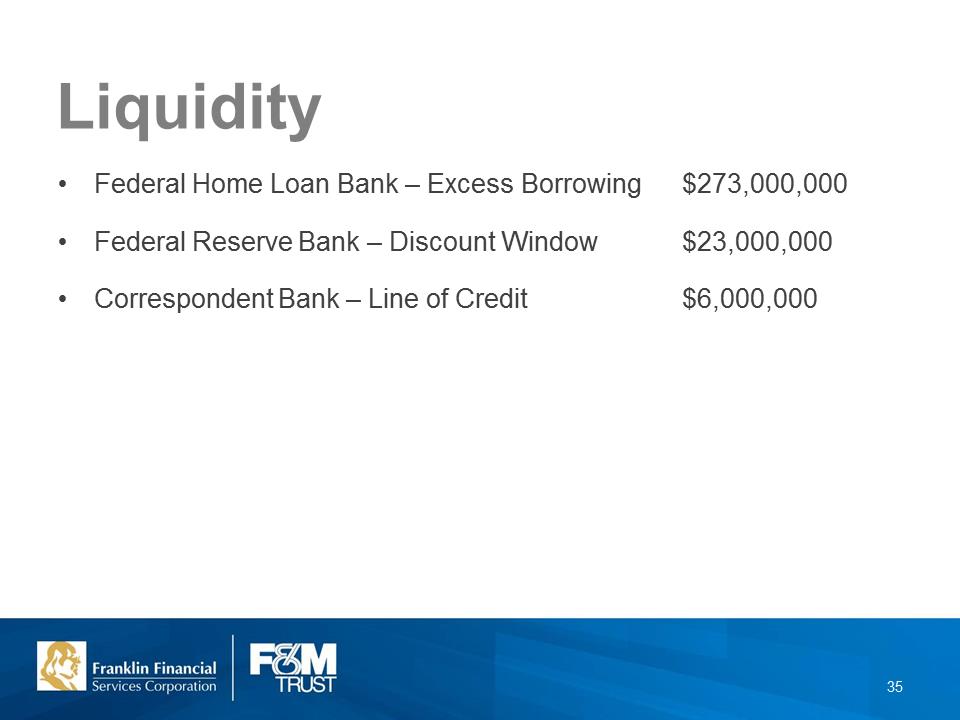 Liquidity •Federal Home Loan Bank – Excess Borrowing $273,000,000 •Federal Reserve Bank – Discount Window $23,000,000 •Correspondent Bank – Line of Credit $6,000,000 35
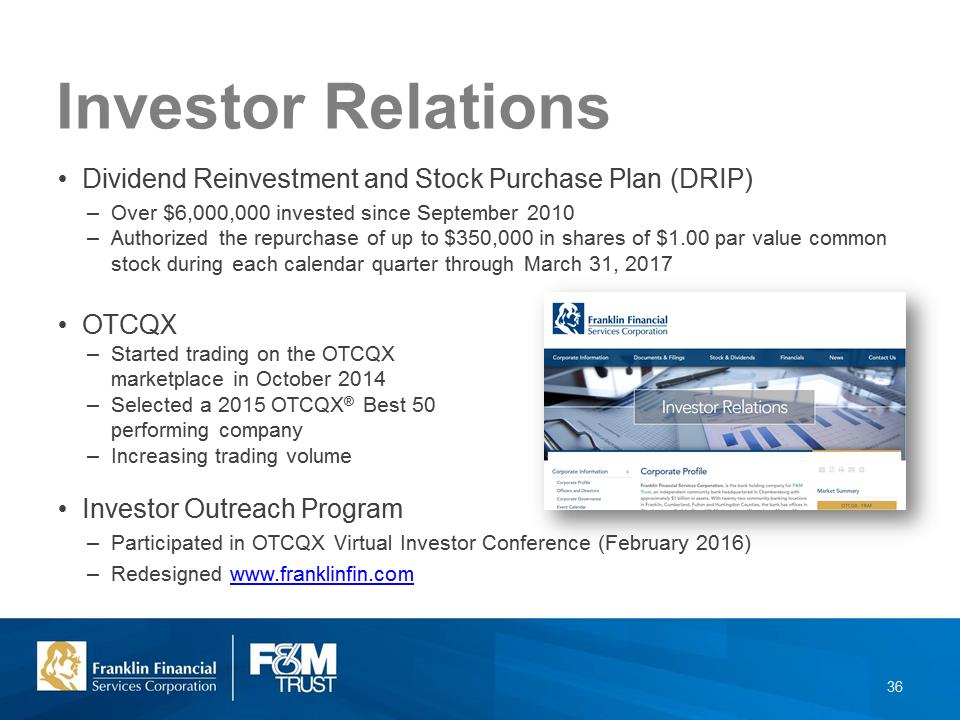 Investor Relations •Dividend Reinvestment and Stock Purchase Plan (DRIP) –Over $6,000,000 invested since September 2010 –Authorized the repurchase of up to $350,000 in shares of $1.00 par value common stock during each calendar quarter through March 31, 2017 •OTCQX –Started trading on the OTCQX marketplace in October 2014 –Selected a 2015 OTCQX® Best 50 performing company –Increasing trading volume •Investor Outreach Program –Participated in OTCQX Virtual Investor Conference (February 2016) –Redesigned www.franklinfin.com 36
 Stock Symbol: FRAF (OTCQX) www.franklinfin.com www.fmtrustonline.com 37