Attached files
| file | filename |
|---|---|
| EX-99.1 - EXHIBIT 99.1 - Advanced Emissions Solutions, Inc. | a991pressrelease8916.htm |
| 8-K - 8-K - Advanced Emissions Solutions, Inc. | a8-k81016.htm |

EVENT TITLE
Q2’16 Earnings Call
© 2016 Advanced Emissions Solutions, Inc.
All rights reserved. Confidential and Proprietary.August 10, 2016

© 2016 Advanced Emissions Solutions, Inc. All rights reserved. Confidential and Proprietary.
Safe Harbor
This presentation includes forward-looking statements within the meaning of Section 21E of the Securities Exchange Act of 1934, which provides a "safe harbor" for such statements in certain
circumstances. The forward-looking statements include statements or expectations regarding future growth, strategic review of alternatives for our EC business, amount and timing of production of RC,
CCS and CCSS cash flow and ability to make distributions; future revenues, expenses, cash flow, liquidity, and other financial and accounting measures; timing and outcome of our restructuring and cost
containment efforts; expectation regarding settlement of litigation and associated costs; and related matters. These statements are based on current expectations, estimates, projections, beliefs and
assumptions of our management. Such statements involve significant risks and uncertainties. Actual events or results could differ materially from those discussed in the forward-looking statements as a
result of various factors, including but not limited to, changes and timing in laws, regulations, IRS interpretations or guidance, accounting rules and any pending court decisions, legal challenges to or
repeal of them; changes in prices, economic conditions and market demand; the ability of the RC facilities to produce coal that qualifies for tax credits; the timing, terms and changes in contracts for RC
facilities, or failure to lease or sell RC facilities; impact of competition; availability, cost of and demand for alternative tax credit vehicles and other technologies; technical, start-up and operational
difficulties; availability of raw materials; loss of key personnel; reductions in operating costs may be less than expected; inability to comply with the terms of loan agreements; intellectual property
infringement claims from third parties; the outcome of pending litigation; seasonality and other factors discussed in greater detail in our filings with the SEC. You are cautioned not to place undue reliance
on such statements and to consult our SEC filings for additional risks and uncertainties that may apply to our business and the ownership of our securities. Our forward-looking statements are presented
as of the date made, and we disclaim any duty to update such statements unless required by law to do so.
-2-

© 2016 Advanced Emissions Solutions, Inc. All rights reserved. Confidential and Proprietary. -3-
Second Quarter & Recent Highlights
▪ Solid execution against strategic goals
▪ Distributions from the Refined Coal (“RC”) business increased year-over-year and were in-line with
expectations
▪ Transitioned an existing investor from a lower tonnage, non-royalty producing RC facility
to a higher tonnage, royalty producing RC facility, resulting in an anticipated increase of
4.1 million tons per year of RC produced compared to the previous RC facility
▪ Expect to close on a new royalty bearing RC facility with a tax equity investor during the
current month, which will replace the previously announced investor cancellation
▪ Emissions Control (“EC”) business momentum is improving with sales of M-ProveTM Technology
and continued completion and delivery of equipment
▪ EC business continued to reduce expenses and drove higher positive operating income
during the period
▪ Review of strategic alternatives for EC business remains ongoing
▪ Paid off short-term borrowing and have eliminated all debt from the Company's balance sheet
▪ Completed listing on NASDAQ Reached agreements in principle to settle the SEC Inquiry and the
shareholder and derivative lawsuits
© 2016 Advanced Emissions Solutions, Inc. All rights reserved. Confidential and Proprietary.
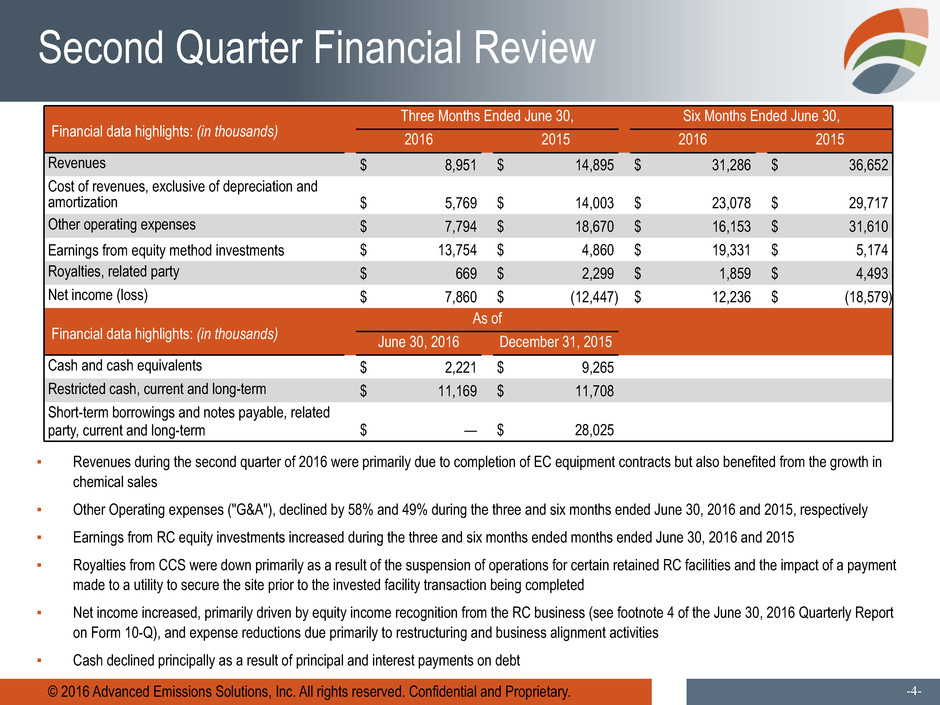
Financial data highlights: (in thousands)
Three Months Ended June 30, Six Months Ended June 30,
2016 2015 2016 2015
Revenues $ 8,951 $ 14,895 $ 31,286 $ 36,652
Cost of revenues, exclusive of depreciation and
amortization $ 5,769 $ 14,003 $ 23,078 $ 29,717
Other operating expenses $ 7,794 $ 18,670 $ 16,153 $ 31,610
Earnings from equity method investments $ 13,754 $ 4,860 $ 19,331 $ 5,174
Royalties, related party $ 669 $ 2,299 $ 1,859 $ 4,493
Net income (loss) $ 7,860 $ (12,447) $ 12,236 $ (18,579)
Financial data highlights: (in thousands)
As of
June 30, 2016 December 31, 2015
Cash and cash equivalents $ 2,221 $ 9,265
Restricted cash, current and long-term $ 11,169 $ 11,708
Short-term borrowings and notes payable, related
party, current and long-term $ — $ 28,025
-4-
Second Quarter Financial Review
▪ Revenues during the second quarter of 2016 were primarily due to completion of EC equipment contracts but also benefited from the growth in
chemical sales
▪ Other Operating expenses ("G&A"), declined by 58% and 49% during the three and six months ended June 30, 2016 and 2015, respectively
▪ Earnings from RC equity investments increased during the three and six months ended months ended June 30, 2016 and 2015
▪ Royalties from CCS were down primarily as a result of the suspension of operations for certain retained RC facilities and the impact of a payment
made to a utility to secure the site prior to the invested facility transaction being completed
▪ Net income increased, primarily driven by equity income recognition from the RC business (see footnote 4 of the June 30, 2016 Quarterly Report
on Form 10-Q), and expense reductions due primarily to restructuring and business alignment activities
▪ Cash declined principally as a result of principal and interest payments on debt

© 2016 Advanced Emissions Solutions, Inc. All rights reserved. Confidential and Proprietary. -5-
Select Components of Net Income (Loss)
Select Components of Net Income (Loss)
(In millions)
Three Months Ended June 30, Six Months Ended June 30,
2016 2015 2016 2015
Consolidated Net Income (Loss) $ 7,860 $ (12,447) $ 12,236 $ (18,579)
RC Segment Operating income (loss) $ 14,199 $ 5,175 $ 22,061 $ 5,835
EC Segment Operating income (loss) 2,118 (5,458) 6,700 (4,909)
Segment income (loss) 16,317 (283) 28,761 926
Corporate and other adjustments to reconcile to net income (loss)
attributable to ADES (8,457) (12,164) (16,525) (19,505)
Consolidated Net Income (Loss) $ 7,860 $ (12,447) $ 12,236 $ (18,579)
▪ Overview of components of three and six months ended June 30, 2016 and 2015 consolidated net
income (loss)
Select Components of Net Income (Loss) (1)
(In millions)
Three Months Ended June 30, Six Months Ended June 30,
2016 2015 2016 2015
Non-cash items, as disclosed (or derived) on the Consolidated
Statement of Cash Flows $ (2,133) $ (5,753) $ (2,681) $ (7,779)
Restructuring expense, exclusive of stock-based compensation,
included in non-cash item, above $ (694) $ (2,608) $ (850) $ (2,971)
Research and development expense, net $ 345 $ (1,860) $ 143 $ (3,110)
Restatement expense $ (300) $ (2,700) $ (1,700) $ (5,300)
Corporate interest (expense) income, net (2) $ (1,214) $ 6 $ (2,121) $ 18
SEC Inquiry expense $ (500) $ — $ (500) $ —
▪ Select components impacting the three and six months ended June 30, 2016 and 2015 consolidated
results
(1) See Appendix A for additional details
(2) See slide 17 for additional details

Refined Coal

© 2016 Advanced Emissions Solutions, Inc. All rights reserved. Confidential and Proprietary. -7-
RC Facilities Today and Tomorrow
POTENTIAL
28 RC facilities
(~100 MT/year)
9 RC facilities - installed
(31.0 MT/year)
2016 2021RC Facility information as of June 30, 2016
13 RC facilities leased/sold
(39.9 MT/year)
Operating (1)
Not Operating(2)
3 RC facilities - identified
(12.4 MT/year)
Full-time Operations Roadmap
(1) All tonnage based on trailing 12 months (TTM) as of June 30, 2016 based on actual tonnage burned
(2) Non operating tonnage is per US Energy Information Administration – TTM ended May 31, 2016
3 RC facilities - unidentified

© 2016 Advanced Emissions Solutions, Inc. All rights reserved. Confidential and Proprietary. -8-
Current RC Environment
▪ Refined Coal has been around for many years and many large corporations have benefited; such
as Goldman Sachs, WW Grainer, Waste Management, DTE Energy, Arthur Gallagher, Capital
One, Fidelity Investments and many others publicly and not publicly disclosed
▪ Although the benefits are significant to companies (primarily large corporations), many companies
do not clear one or more of the hurdles
▪ Relatively recent sales approach at CCS has helped clear the hurdles

© 2016 Advanced Emissions Solutions, Inc. All rights reserved. Confidential and Proprietary. -9-
Refined Coal: Components of Earnings
Components of RC Segment Earnings
(In thousands)
Three Months Ended June 30, Six Months Ended June 30,
2016 2015 2016 2015
RC Segment Revenue
CCS $ 12,832 $ 4,630 $ 18,275 $ 4,730
CCSS 922 1,150 1,613 2,172
RCM6 — (920) (557) (1,728)
Total equity method revenue 13,754 4,860 19,331 5,174
Consulting — 34 — 55
Royalties, related party 669 2,299 1,859 4,493
Total RC Revenue $ 14,423 $ 7,193 $ 21,190 $ 9,722
Segment Operating Income $ 14,199 $ 5,175 $ 22,061 $ 5,835
Significant components of RC segment
expenses and other income:
RCM6 note payable interest expense $ — $ 609 $ 263 $ 1,214
453A interest expense $ 354 $ 1,116 $ 1,145 $ 2,272
RCM6 gain on sale $ — $ — $ 2,078 $ —

© 2016 Advanced Emissions Solutions, Inc. All rights reserved. Confidential and Proprietary. -10-
Operating Tons: Invested vs. Retained
Note: Numbers within bar graph and the "Count" row within the tables represent the number of facilities per category as of the end of each quarter presented.
(1) Tonnage information is based upon RC production for the three and six months ended June 30, 2016 (in thousands)
16
14
12
10
8
6
4
2
0
To
nn
ag
e(
MM
)
Q1 2014 Q2 2014 Q3 2014 Q4 2014 Q1 2015 Q2 2015 Q3 2015 Q4 2015 Q1 2016 Q2 2016
Three Months
Ended June 30,
2016
Invested Retained QTD - Total
Six Months
Ended June 30,
2016
Invested Retained YTD - Total
Tonnage (1) 9,352 40 9,392 Tonnage (1) 18,300 843 19,143
Count (#) 13 — 13 Count (#) 13 — 13
3
3
9 9
10
12 11 12
12
12 13
13
4
6
5 7 5
5
5
0

© 2016 Advanced Emissions Solutions, Inc. All rights reserved. Confidential and Proprietary. -11-
Operating Tons: Royalty vs. Non-Royalty
Note: Numbers within bar graph and the "Count" row within the tables represent the number of facilities per category as of the end of each quarter presented.
(1) Tonnage information is based upon RC production for the three and six months ended June 30, 2016 (in thousands)
(2) Counts are based upon the number of facilities of which a royalty has been earned during the period
16
14
12
10
8
6
4
2
0
To
nn
ag
e(
MM
)
Q1 2014 Q2 2014 Q3 2014 Q4 2014 Q1 2015 Q2 2015 Q3 2015 Q4 2015 Q1 2016 Q2 2016
Three Months
Ended June 30,
2016
Operating Tons
QTD - Total
Six Months
Ended June 30,
2016
Operating Tons
YTD - Total
Royalty Non-Royalty Royalty Non-Royalty
Tonnage(1) 2,932 6,461 9,393 Tonnage(1) 6,262 12,882 19,144
Count (#) (2) 7 6 13 Count (#) (2) 7 6 13
3
9
9
10 11
8
6
8
7
5 6
4
6
6
10 11
9
10
8 7

© 2016 Advanced Emissions Solutions, Inc. All rights reserved. Confidential and Proprietary. -12-
Future Rent Payments – CCS Invested
Facilities
▪ As of June 30, 2016, remaining payments to all
CCS members from CCS’s current RC facilities
leased or sold to tax equity investors are
projected to be an aggregate of ~$639 million
from Q3, 2016 through 2021; assuming no
modifications of contracts, non-renewals or
early terminations
▪ Remaining payments to all CCS
members were $626 million as of March
31, 2016. During Q2 2016, cash
collections of $37 million were offset by
additional future cash flows from the
addition of new facilities and/or
modifications to existing lease provisions
CCS Expected Payments
as of June 30, 2016
(in millions)
2016 (Q3 through Q4) $ 57
2017 121
2018 128
2019 125
2020 123
2021 85
$ 639
Note: ADES receives 42.5% of these amounts, after
applicable deductions related to CCS operating and
general and administrative expenses

© 2016 Advanced Emissions Solutions, Inc. All rights reserved. Confidential and Proprietary. -13-
Non-Operating Tons(5)
Note: Numbers within bar graph and the "Count" row within the tables represent the number of facilities per category as of the end of each quarter presented.
(1) Based on actual tonnage produced
(2) Q2 2016 is estimated based on an average of May QTD actuals
(3) Tonnage information is based upon RC production for the two and five months ended May 31, 2016 (in thousands)
(4) Unidentified facilities potential tonnage is estimated to be 4 million per facility on an annual basis
(5) Non operating tonnage is per US Energy Information Administration - TTM ended May 31, 2016
16
14
12
10
8
6
4
2
0
To
nn
ag
e(
MM
)
Q1 2015 Q2 2015 Q3 2015 Q4 2015 Q1 2016 Q2 2016
Three Months
Ended June 30,
2016
Non-Operating QTD - Total
Identified Unidentified Construction Installed
Tonnage(3) (4) 2,554 3,000 — 6,621 12,175
Count (#) 3 3 — 9 15
9
1
6
5 5
3
3
5
5
1
9
3
10
3
(1)(1)(1) (1)(1) (2)
Six Months
Ended June 30,
2016
Non-Operating YTD - Total
Identified Unidentified Construction Installed
Tonnage(3) (4) 6,014 5,000 — 14,703 25,717
Count (#) 3 3 — 9 15

Emissions Control
© 2016 Advanced Emissions Solutions, Inc. All rights reserved. Confidential and Proprietary. -15-
IP Portfolio
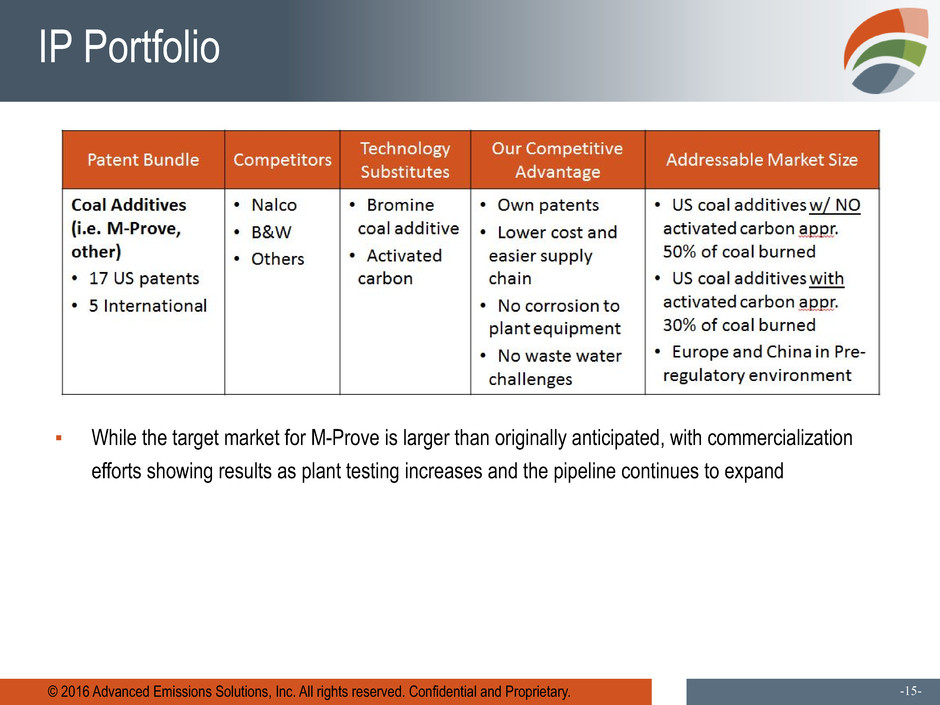
▪ While the target market for M-Prove is larger than originally anticipated, with commercialization
efforts showing results as plant testing increases and the pipeline continues to expand
© 2016 Advanced Emissions Solutions, Inc. All rights reserved. Confidential and Proprietary. -16-
Emissions Control: Components of Earnings
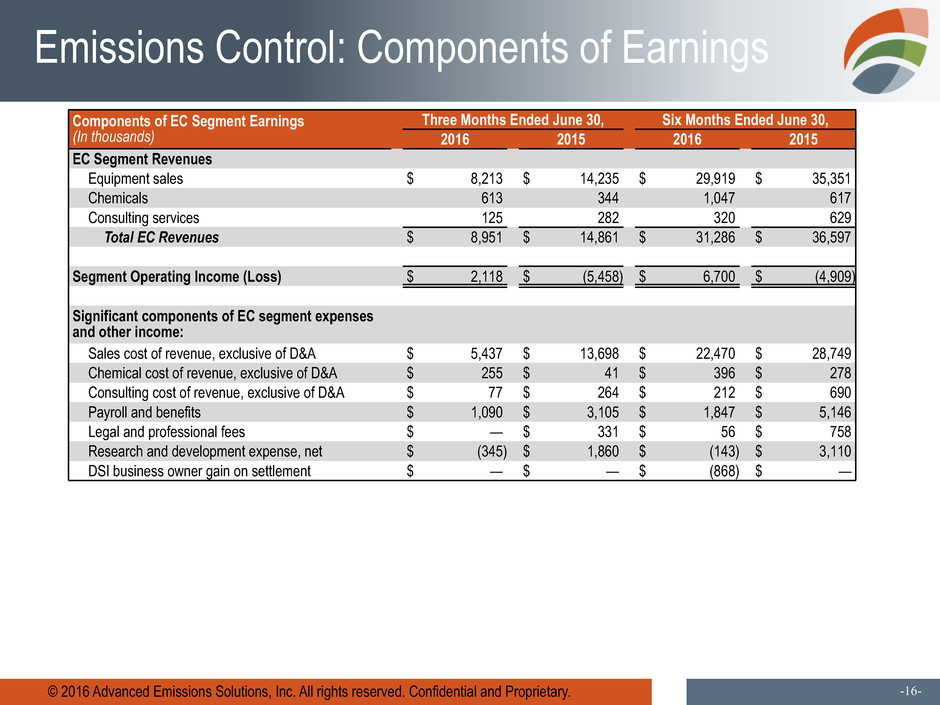
Components of EC Segment Earnings
(In thousands)
Three Months Ended June 30, Six Months Ended June 30,
2016 2015 2016 2015
EC Segment Revenues
Equipment sales $ 8,213 $ 14,235 $ 29,919 $ 35,351
Chemicals 613 344 1,047 617
Consulting services 125 282 320 629
Total EC Revenues $ 8,951 $ 14,861 $ 31,286 $ 36,597
Segment Operating Income (Loss) $ 2,118 $ (5,458) $ 6,700 $ (4,909)
Significant components of EC segment expenses
and other income:
Sales cost of revenue, exclusive of D&A $ 5,437 $ 13,698 $ 22,470 $ 28,749
Chemical cost of revenue, exclusive of D&A $ 255 $ 41 $ 396 $ 278
Consulting cost of revenue, exclusive of D&A $ 77 $ 264 $ 212 $ 690
Payroll and benefits $ 1,090 $ 3,105 $ 1,847 $ 5,146
Legal and professional fees $ — $ 331 $ 56 $ 758
Research and development expense, net $ (345) $ 1,860 $ (143) $ 3,110
DSI business owner gain on settlement $ — $ — $ (868) $ —

© 2016 Advanced Emissions Solutions, Inc. All rights reserved. Confidential and Proprietary. -17-
Corporate and Other: Summary
Adjustments to reconcile to net loss attributable to
ADES
(In thousands)
Three Months Ended June 30, Six Months Ended June 30,
2016 2015 2016 2015
RC segment operating income $ 14,199 $ 5,175 $ 22,061 $ 5,835
EC segment operating income (loss) 2,118 (5,458) 6,700 (4,909)
Total segment income (loss) 16,317 (283) 28,761 926
Adjustments to reconcile to net income (loss)
attributable to ADES
Corporate payroll and benefits (2,866) (6,641) (5,912) (9,511)
Corporate rent and occupancy (272) (163) (501) (301)
Corporate legal and professional fees (1,982) (4,056) (4,909) (7,364)
Corporate general and administrative (1,373) (1,085) (2,146) (1,991)
Corporate depreciation and amortization (128) (156) (258) (306)
Corporate interest (expense) income, net (1) (1,214) 6 (2,121) 18
Other (expense) income, net (523) (6) (526) 57
Income tax expense (99) (63) (152) (107)
Net income (loss) $ 7,860 $ (12,447) $ 12,236 $ (18,579)
▪ Reduction in corporate payroll and benefits in connection with restructuring actions taken during the latter half of 2015 and during the second
quarter of 2016; included within these costs are payroll related restructuring charges of $0.3 million and $3.8 million during the three months
ended June 30, 2016 and 2015, respectively and $0.6 million and $4.2 million during the six months ended June 30, 2016 and 2015, respectively
▪ Legal and professional fees decreased, most significantly due to the completion of the most material aspects of the Restatement process during
the first quarter of 2016; Restatement expenses were $0.3 million and $2.7 million during the three months ended June 30, 2016 and 2015,
respectively and $1.7 million and $5.3 million during the six months ended June 30, 2016 and 2015, respectively
▪ During the second quarter of 2016, the Company reached preliminary settlement agreements related to the SEC Inquiry, Shareholder Lawsuit and
Derivative Lawsuit. The Company has recorded an accrual of $0.5 million related to the SEC Inquiry and the Shareholder Lawsuit and Derivative
Lawsuit settlements are expected to be settled within the insurance limits of the Company
(1) The Credit Agreement, discussed in Note 8 of the Condensed Consolidated Financial Statements was paid off on June 30, 2016
© 2016 Advanced Emissions Solutions, Inc. All rights reserved. Confidential and Proprietary. -18-
CCS and ADES: Cash Flow Update
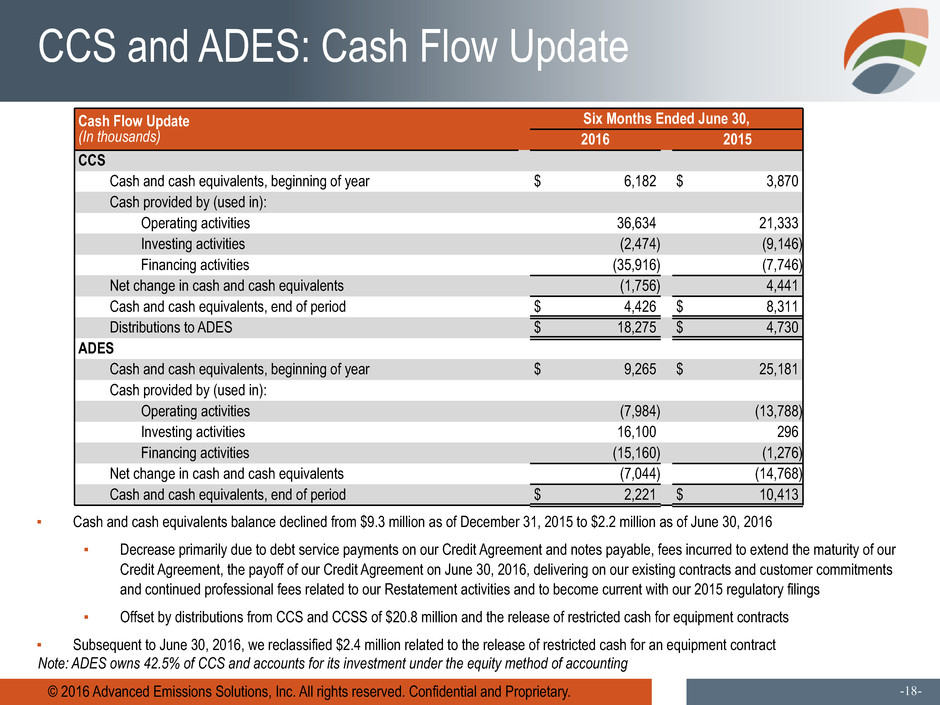
Cash Flow Update
(In thousands)
Six Months Ended June 30,
2016 2015
CCS
Cash and cash equivalents, beginning of year $ 6,182 $ 3,870
Cash provided by (used in):
Operating activities 36,634 21,333
Investing activities (2,474) (9,146)
Financing activities (35,916) (7,746)
Net change in cash and cash equivalents (1,756) 4,441
Cash and cash equivalents, end of period $ 4,426 $ 8,311
Distributions to ADES $ 18,275 $ 4,730
ADES
Cash and cash equivalents, beginning of year $ 9,265 $ 25,181
Cash provided by (used in):
Operating activities (7,984) (13,788)
Investing activities 16,100 296
Financing activities (15,160) (1,276)
Net change in cash and cash equivalents (7,044) (14,768)
Cash and cash equivalents, end of period $ 2,221 $ 10,413
▪ Cash and cash equivalents balance declined from $9.3 million as of December 31, 2015 to $2.2 million as of June 30, 2016
▪ Decrease primarily due to debt service payments on our Credit Agreement and notes payable, fees incurred to extend the maturity of our
Credit Agreement, the payoff of our Credit Agreement on June 30, 2016, delivering on our existing contracts and customer commitments
and continued professional fees related to our Restatement activities and to become current with our 2015 regulatory filings
▪ Offset by distributions from CCS and CCSS of $20.8 million and the release of restricted cash for equipment contracts
▪ Subsequent to June 30, 2016, we reclassified $2.4 million related to the release of restricted cash for an equipment contract
Note: ADES owns 42.5% of CCS and accounts for its investment under the equity method of accounting

© 2016 Advanced Emissions Solutions, Inc. All rights reserved. Confidential and Proprietary. -19-
2016 Strategic Priorities
▪ We have made noticeable progress against many of the strategic priorities that we outlined on the
2015 10-K conference call
▪ Looking ahead, we continue to focus on closing new tax equity investors while further enhancing
the profile of the business through execution on cost reduction initiatives
Appendix

© 2016 Advanced Emissions Solutions, Inc. All rights reserved. Confidential and Proprietary. -21-
Appendix A: Supplemental Disclosure ADES Select Cash and Non-cash
Components of the three and six months ended 2016 and 2015 Net Income
(Loss)
(in thousands) Three Months Ended June 30, Six Months Ended June 30,
Ref. 2016 Ref. 2015 Ref. 2016 Ref. 2015
Net Income (Loss) (1) $ 7,860 (1) $ (12,447) (1) $ 12,236 (1) $ (18,579)
RC segment operating income (loss) (2) 14,199 (2) 5,175 (2) 22,061 (2) 5,835
EC Segment income (loss) (2) 2,118 (2) (5,458) (2) 6,700 (2) (4,909)
(2) 16,317 (2) (283) (2) 28,761 (2) 926
Corporate and other adjustments to reconcile to net income (loss)
attributable to ADES (2) (8,457) (2) (12,164) (2) (16,525) (2) (19,505)
Total of Select Components of Net Income (Loss) (2) 7,860 (2) (12,447) (2) 12,236 (2) (18,579)
Non-Cash Charges:
Depreciation and Amortization (4) (223) (4) (573) (3) (454) (3) (1,104)
Amortization of Debt discount/issuance costs (4) (579) (4) (25) (3) (1,152) (3) (50)
Gain on settlement of note payable and licensed technology (4) 150 (4) — (3) 1,019 (3) —
Impairment of Property, Equipment, Intangibles (4) (517) (4) 2 (3) (517) (3) (46)
Loss on disposal of assets (4) — (4) — (3) — (3) —
Interest Costs Added to Principal Balance of Notes Payable (4) — (4) (432) (3) — (3) (432)
Share Based Compensation Expense (4) (907) (4) (4,505) (3) (1,543) (3) (5,459)
Other (4) (57) (4) (220) (3) (34) (3) (688)
Total Non-Cash Items (2,133) (5,753) (2,681) (7,779)
Significant Cash Items:
Restructuring Expenses (net of non-cash charges) (5) (784) (5) (5,563) (5) (1,067) (5) (6,031)
Less non-cash Share Based Compensation (6) 90 (6) 2,955 (6) 217 (6) 3,060
Restructuring Expenses--Cash (694) (2,608) (850) (2,971)
Research and Development Expenses (excluding non-cash impairment
charges) (1) 345 (1) (1,860) (1) 143 (1) (3,110)
Restatement Expenses (7) (300) (7) (2,700) (7) (1,700) (7) (5,300)
Footnotes :
(1) Agrees to ADES Condensed Consolidated Statement of Operations in the 2016 Q2
Form 10-Q filing
(2) Agrees to ADES Note 12 in the 2016 Q2 Form 10-Q filing
(3) Agrees to ADES Condensed Consolidated Statement of Cash Flows in the 2016 Q2
Form 10-Q filing
(4) Derived from ADES Condensed Consolidated Statement of Cash Flows in the 2016
Q2 Form 10-Q filing
(5) Agrees to ADES Note 2 in the 2016 Q2 Form 10-Q filing
(6) Derived from ADES Note 2 in the 2016 Q2 Form 10-Q filing
(7) Agrees to ADES "Management Discussion and Analysis" in Item 2 in the 2016 Q2
Form 10-Q filing
© 2016 Advanced Emissions Solutions, Inc. All rights reserved. Confidential and Proprietary. -22-
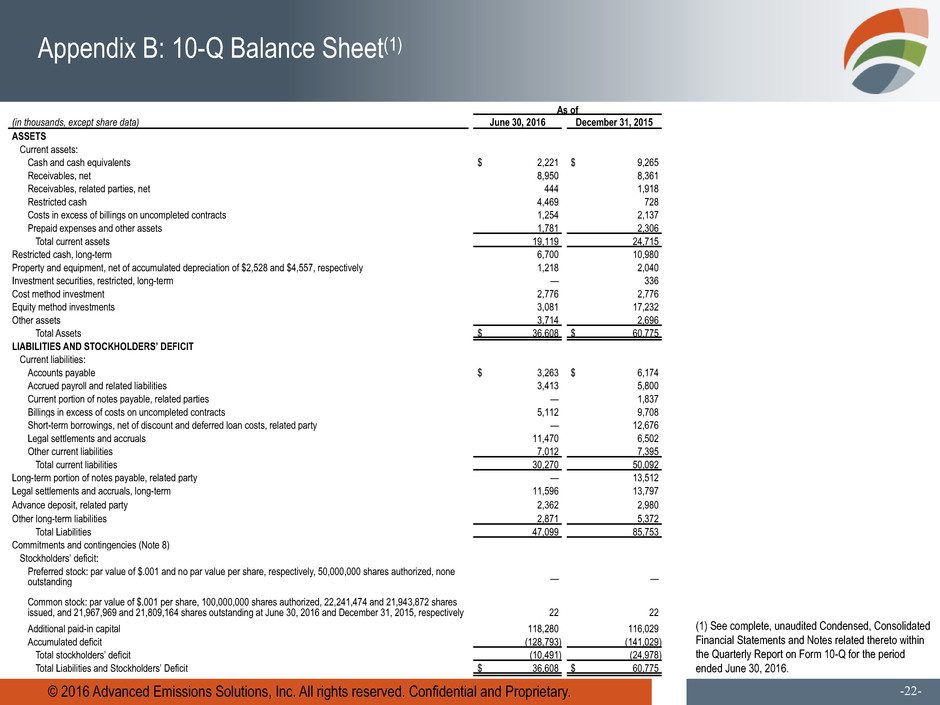
Appendix B: 10-Q Balance Sheet(1)
(1) See complete, unaudited Condensed, Consolidated
Financial Statements and Notes related thereto within
the Quarterly Report on Form 10-Q for the period
ended June 30, 2016.
As of
(in thousands, except share data) June 30, 2016 December 31, 2015
ASSETS
Current assets:
Cash and cash equivalents $ 2,221 $ 9,265
Receivables, net 8,950 8,361
Receivables, related parties, net 444 1,918
Restricted cash 4,469 728
Costs in excess of billings on uncompleted contracts 1,254 2,137
Prepaid expenses and other assets 1,781 2,306
Total current assets 19,119 24,715
Restricted cash, long-term 6,700 10,980
Property and equipment, net of accumulated depreciation of $2,528 and $4,557, respectively 1,218 2,040
Investment securities, restricted, long-term — 336
Cost method investment 2,776 2,776
Equity method investments 3,081 17,232
Other assets 3,714 2,696
Total Assets $ 36,608 $ 60,775
LIABILITIES AND STOCKHOLDERS’ DEFICIT
Current liabilities:
Accounts payable $ 3,263 $ 6,174
Accrued payroll and related liabilities 3,413 5,800
Current portion of notes payable, related parties — 1,837
Billings in excess of costs on uncompleted contracts 5,112 9,708
Short-term borrowings, net of discount and deferred loan costs, related party — 12,676
Legal settlements and accruals 11,470 6,502
Other current liabilities 7,012 7,395
Total current liabilities 30,270 50,092
Long-term portion of notes payable, related party — 13,512
Legal settlements and accruals, long-term 11,596 13,797
Advance deposit, related party 2,362 2,980
Other long-term liabilities 2,871 5,372
Total Liabilities 47,099 85,753
Commitments and contingencies (Note 8)
Stockholders’ deficit:
Preferred stock: par value of $.001 and no par value per share, respectively, 50,000,000 shares authorized, none
outstanding — —
Common stock: par value of $.001 per share, 100,000,000 shares authorized, 22,241,474 and 21,943,872 shares
issued, and 21,967,969 and 21,809,164 shares outstanding at June 30, 2016 and December 31, 2015, respectively 22 22
Additional paid-in capital 118,280 116,029
Accumulated deficit (128,793) (141,029)
Total stockholders’ deficit (10,491) (24,978)
Total Liabilities and Stockholders’ Deficit $ 36,608 $ 60,775

© 2016 Advanced Emissions Solutions, Inc. All rights reserved. Confidential and Proprietary. -23-
Appendix C: 10-Q Income Statement(1)
(1) See complete, unaudited
Condensed, Consolidated Financial
Statements and Notes related
thereto within the Quarterly Report
on Form 10-Q for the period ended
June 30, 2016.
Three Months Ended June 30, Six Months Ended June 30,
(in thousands, except per share data and percentages) 2016 2015 2016 2015
Revenues:
Equipment sales 8,213 14,236 29,919 35,351
Chemicals 613 343 1,047 617
Consulting services and other 125 316 320 684
Total revenues 8,951 14,895 31,286 36,652
Operating expenses:
Equipment sales cost of revenue, exclusive of depreciation and amortization 5,437 13,698 22,470 28,749
Chemicals cost of revenue, exclusive of depreciation and amortization 255 41 396 278
Consulting services cost of revenue, exclusive of depreciation and amortization 77 264 212 690
Payroll and benefits 3,956 9,746 7,759 14,657
Rent and occupancy 632 601 1,026 1,232
Legal and professional fees 1,982 4,387 4,965 8,122
General and administrative 1,346 1,503 2,092 3,385
Research and development, net (345) 1,860 (143) 3,110
Depreciation and amortization 223 573 454 1,104
Total operating expenses 13,563 32,673 39,231 61,327
Operating loss (4,612) (17,778) (7,945) (24,675)
Other income (expense):
Earnings from equity method investments 13,754 4,860 19,331 5,174
Royalties, related party 669 2,299 1,859 4,493
Interest income 95 6 118 18
Interest expense (1,573) (1,794) (3,537) (3,569)
Gain on sale of equity method investment — — 2,078 —
Gain on settlement of note payable and licensed technology 151 — 1,019 —
Other (525) 23 (535) 87
Total other income 12,571 5,394 20,333 6,203
Income (loss) before income tax expense 7,959 (12,384) 12,388 (18,472)
Income tax expense 99 63 152 107
Net income (loss) 7,860 (12,447) 12,236 (18,579)
Earnings (loss) per common share (Note 1):
Basic 0.36 (0.57) 0.55 (0.85)
Diluted 0.35 (0.57) 0.55 (0.85)
Weighted-average number of common shares outstanding:
Basic 21,875 21,715 21,895 21,728
Diluted 22,187 21,715 22,204 21,728

© 2016 Advanced Emissions Solutions, Inc. All rights reserved. Confidential and Proprietary. -24-
Appendix D: 10-Q Cash Flow(1)
(1) See complete, unaudited Condensed, Consolidated
Financial Statements and Notes related thereto within
the Quarterly Report on Form 10-Q for the period
ended June 30, 2016.
Six Months Ended June 30,
(in thousands) 2016 2015
Cash flows from operating activities
Net income (loss) $ 12,236 $ (18,579)
Adjustments to reconcile net income (loss) to net cash used in operating activities:
Depreciation and amortization 454 1,104
Amortization of debt issuance costs 1,152 50
Impairment of property and equipment and inventory 517 46
Interest costs added to principal balance of notes payable — 432
Share-based compensation expense 1,543 5,459
Earnings from equity method investments (19,331) (5,174)
Gain on sale of equity method investment (2,078) —
Gain on settlement of note payable and licensed technology (1,019) —
Other non-cash items, net 34 688
Changes in operating assets and liabilities, net of effects of acquired businesses:
Receivables (627) 7,625
Related party receivables 1,473 (226)
Prepaid expenses and other assets 806 (460)
Costs incurred on uncompleted contracts 17,201 2,363
Restricted cash 1,089 (709)
Other long-term assets (2,630) 231
Accounts payable (2,910) 2,713
Accrued payroll and related liabilities (1,596) 1,651
Other current liabilities (101) 1,348
Billings on uncompleted contracts (20,910) (9,420)
Advance deposit, related party (618) (1,496)
Other long-term liabilities (1,336) 19
Legal settlements and accruals 2,767 (1,472)
Distributions from equity method investees, return on investment 5,900 19
Net cash used in operating activities (7,984) (13,788)
© 2016 Advanced Emissions Solutions, Inc. All rights reserved. Confidential and Proprietary. -25-
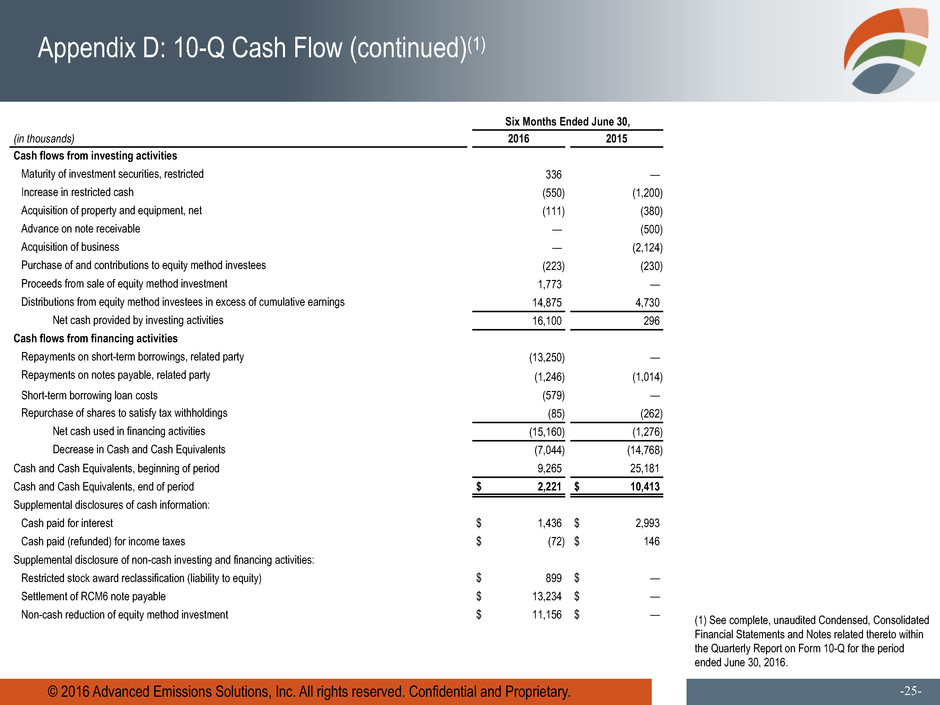
Appendix D: 10-Q Cash Flow (continued)(1)
(1) See complete, unaudited Condensed, Consolidated
Financial Statements and Notes related thereto within
the Quarterly Report on Form 10-Q for the period
ended June 30, 2016.
Six Months Ended June 30,
(in thousands) 2016 2015
Cash flows from investing activities
Maturity of investment securities, restricted 336 —
Increase in restricted cash (550) (1,200)
Acquisition of property and equipment, net (111) (380)
Advance on note receivable — (500)
Acquisition of business — (2,124)
Purchase of and contributions to equity method investees (223) (230)
Proceeds from sale of equity method investment 1,773 —
Distributions from equity method investees in excess of cumulative earnings 14,875 4,730
Net cash provided by investing activities 16,100 296
Cash flows from financing activities
Repayments on short-term borrowings, related party (13,250) —
Repayments on notes payable, related party (1,246) (1,014)
Short-term borrowing loan costs (579) —
Repurchase of shares to satisfy tax withholdings (85) (262)
Net cash used in financing activities (15,160) (1,276)
Decrease in Cash and Cash Equivalents (7,044) (14,768)
Cash and Cash Equivalents, beginning of period 9,265 25,181
Cash and Cash Equivalents, end of period $ 2,221 $ 10,413
Supplemental disclosures of cash information:
Cash paid for interest $ 1,436 $ 2,993
Cash paid (refunded) for income taxes $ (72) $ 146
Supplemental disclosure of non-cash investing and financing activities:
Restricted stock award reclassification (liability to equity) $ 899 $ —
Settlement of RCM6 note payable $ 13,234 $ —
Non-cash reduction of equity method investment $ 11,156 $ —
