Attached files
| file | filename |
|---|---|
| EX-99.1 - EXHIBIT 99.1 - Nexeo Solutions, Inc. | a20160809ex991.htm |
| 8-K - 8-K - Nexeo Solutions, Inc. | a2016q38k.htm |

Nexeo Quarterly Earnings Webcast
Q3 – FY16
August 9, 2016
Please stand by…
We will begin momentarily

Welcome to Nexeo’s
Third Quarter of Fiscal Year 2016
Investor Teleconference
and Webcast
August 9, 2016
10:00 AM Eastern Time
9:00 AM Central Time
2

3
Agenda and Management Introductions
1 INTRODUCTIONS AND SAFE HARBOR
2 BUSINESS COMMENTARY
3 FINANCIAL PERFORMANCE
4 WRAP UP
Michael Everett
VP, Treasurer, FP&A, Investor Relations
David Bradley
President & Chief Executive Officer
Ross Crane
Executive VP & Chief Financial Officer
David Bradley
President & Chief Executive Officer
5 CLOSING REMARKS Michael EverettVP, Treasurer, FP&A, Investor Relations

Non-GAAP Financial Measures and Safe Harbor
4
Non-GAAP Financial Measures
Certain financial measures presented herein, including EBITDA, Adjusted EBITDA, and net debt were derived based on methodologies other than in accordance
with generally accepted accounting principles (GAAP). We have included these measures because we believe they are indicative of our operating performance, are
used by investors and analysts to evaluate us and can facilitate comparisons across periods. As presented by us, these measures may not be comparable to
similarly titled measures reported by other companies. EBITDA, Adjusted EBITDA and net debt should be considered in addition to, not as substitutes for, financial
measures presented in accordance with GAAP. For a reconciliation of EBITDA, Adjusted EBITDA and net debt to the nearest GAAP measures, see appendix slides.
Safe Harbor
Forward Looking Statements: This presentation contains statements related to Nexeo Solutions, Inc.’s (“Nexeo” or the “Company”) future plans and expectations
and, as such, includes “forward-looking statements” within the meaning of the Private Securities Litigation Reform Act of 1995, Section 27A of the Securities Act of
1933, as amended, and Section 21E of the Securities Exchange Act of 1934, as amended. Forward-looking statements are those statements that are based upon
management’s current plans and expectations as opposed to historical and current facts and are often identified in this presentation by use of words including but
not limited to “may,” “believe,” “will,” “project,” “expect,” “estimate,” “anticipate,” and “plan.” Although the forward-looking statements contained in this
presentation reflect management’s current assumptions based upon information currently available to management and based upon that which management
believes to be reasonable assumptions, the Company cannot be certain that actual results will be consistent with these forward-looking statements. Forward-
looking statements necessarily involve significant known and unknown risks, assumptions and uncertainties that may cause the Company’s actual results,
performance prospects and opportunities in future periods to differ materially from those expressed or implied by such forward-looking statements. These risks
and uncertainties include, among other things: the Company’s ability to achieve projected cost savings; consolidation of the Company’s competitors; increased
costs of products the Company purchases and its ability to pass on cost increases to its customers; disruptions to the supply of chemicals and plastics that the
Company distributes or in the operations of the Company’s customers; the Company’s significant working capital requirements and the risks associated with
maintaining large inventories; any disruptions to the Company’s ERP system; the Company’s ability to meet the demands of the Company’s customers on a timely
basis; risks and costs related with operating as a stand-alone company; risks related to the Company’s supplier and customer contracts; risks related to the
Company’s substantial indebtedness; changes in state, federal or foreign laws affecting the industries in which we operate; the Company’s ability to comply with
any new and existing environmental and other laws and regulations; and general business and economic trends in the United States and other countries, including
uncertainty as to changes and trends. Our future results will depend upon various other risks and uncertainties, including the risks and uncertainties discussed in
our SEC filings, including in the sections entitled “Risk Factors” in such SEC filings. These and other important factors may cause our actual results, performance or
achievements to differ materially from any future results, performance or achievements expressed or implied by these forward-looking statements.
Ongoing Disclosure: The Company does not intend to provide all information enclosed herein on an ongoing basis.

Business Commentary
David Bradley
President and Chief Executive Officer
5

Fiscal Third Quarter Operating Overview
6
Merger completed June 9, 2016(1)
Revenue down 13% driven by continued deflationary pricing and weak industrial demand
Gross profit margin up 40 bps excluding merger-related costs
Net income affected by transaction costs and purchase price accounting
Adjusted EBITDA margin improved 70 bps
Productivity initiatives ahead of expectations
Stagnant pricing environment results in gross profit compression
(1) As a result of the business combination, the Company’s financial information for the quarter is split into
successor and predecessor periods
(2) West Texas Intermediate crude oil spot prices sourced from U.S. Energy Information Administration
Average Selling Prices
Total ASP
WTI Crude Oil(2)

Financial Performance
Ross Crane
Chief Financial Officer
7

Successor Predecessor Predecessor
3 Months Ended
Jun-16
April 1 Through
June 8, 2016
3 Months Ended
Jun-15
Q3-FY16 Q3-FY16 Q3-FY15
Sales and operating revenues 214.3$ 650.2$ 988.8$
Cost of sales and operating expenses 195.5 574.8 877.5
Gross profit 18.8 75.4 111.3
Gross profit margin 8.8% 11.6% 11.3%
Selling, general and administrative expenses 19.1 57.5 82.9
Transaction related costs 15.9 26.1 -
Change in fair value related to contingent
consideration (2.3) - -
Operating income (loss) (13.9) (8.2) 28.4
Other income - 0.3 8.4
Interest expense, net (2.9) (11.2) (16.2)
Income (loss) before income taxes (16.8) (19.1) 20.6
Income tax expense (benefit) (1.3) 1.1 1.8
Net income (loss) (15.5)$ (20.2)$ 18.8$
Adjusted EBITDA 14.5$ 32.3$ 54.4$
Adjusted EBITDA % of sales 6.8% 5.0% 5.5%
P&L Summary: Year-over-Year Comparison
8
(1) Includes $7.3 million related to the step up in inventory and additional depreciation expense
(2) Includes $0.8 million for D&A expense for intangible items related to the transaction as well as $0.2 million for administrative
expenses incurred prior to the closing of the merger
(3) Adjusted EBITDA is a non-GAAP measure. See appendix slides for a reconciliation of adjusted EBITDA to net income
(1)
(2)
Revenue down 13%
Volumes down 4%
Average selling prices down 10%
Gross profit margin up 40 bps, excluding
impact of inventory step up and
additional depreciation expense
totaling $7.3 million
SG&A improved 9%, excluding $1.0
million merger related expenses
Total transaction costs of $51 million
with $42 million in the 3rd fiscal quarter
of 2016
Excluding CSD escrow settlement of $8
million in prior year, adjusted EBITDA up
1% and adjusted EBITDA margin up
70bps
(3)

Segment Revenue and Gross Profit: Year over Year Comparison
9
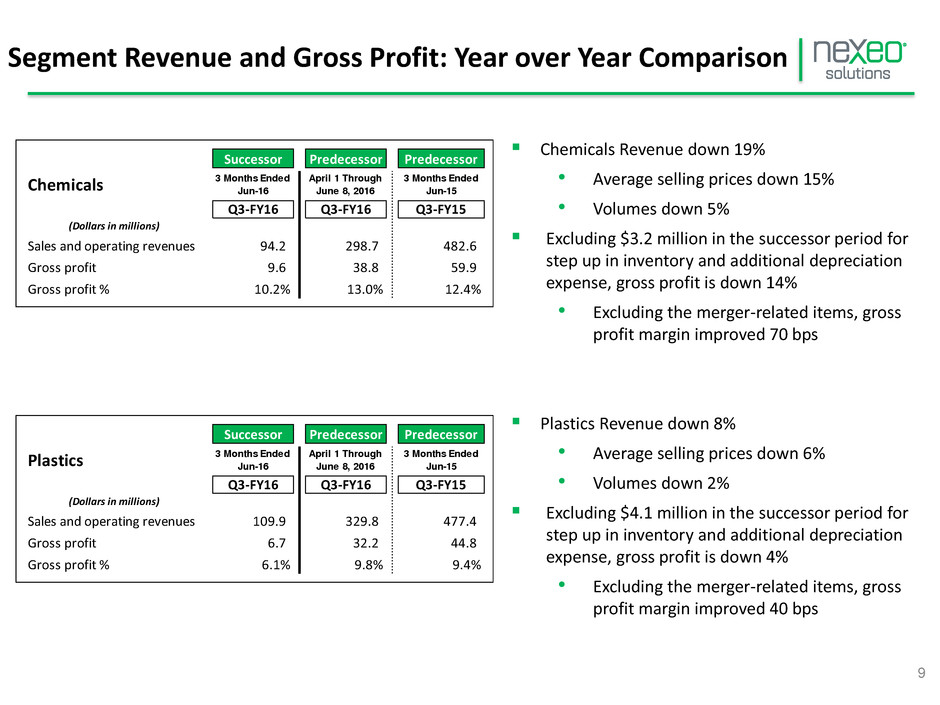
Chemicals Revenue down 19%
• Average selling prices down 15%
• Volumes down 5%
Excluding $3.2 million in the successor period for
step up in inventory and additional depreciation
expense, gross profit is down 14%
• Excluding the merger-related items, gross
profit margin improved 70 bps
Plastics Revenue down 8%
• Average selling prices down 6%
• Volumes down 2%
Excluding $4.1 million in the successor period for
step up in inventory and additional depreciation
expense, gross profit is down 4%
• Excluding the merger-related items, gross
profit margin improved 40 bps
Successor Predecessor Predecessor
Plastics 3 Months EndedJun-16
April 1 Through
June 8, 2016
3 Months Ended
Jun-15
Q3-FY16 Q3-FY16 Q3-FY15
(Dollars in millions)
Sales and ope ating revenues 109.9 329.8 477.4
Gross profit 6.7 32.2 44.8
Gross profit % 6.1% 9.8% 9.4%
Successor Predecessor Predecessor
Chemicals 3 Months EndedJun-16
April 1 Through
June 8, 2016
3 Months Ended
Jun-15
Q3-FY16 Q3-FY16 Q3-FY15
(Dollars in millions)
Sales and ope ating revenues 94.2 298.7 482.6
Gross profit 9.6 38.8 59.9
Gross profit % 10.2% 13.0% 12.4%

$543.3
$483.2 $483.8
13.0%
13.4%
13.9%
Q3-FY15 Q2-FY16 Q3-FY16
Working Capital(3)
($ millions)
Working Capital Working Capital % LTM Sales
$852.3
$786.0 $792.0
Q3-FY15 Q2-FY16 Q3-FY16
Net Debt(2)
($ millions)
$89.0
$59.7
$38.6
Q3-FY15 Q2-FY16 Q3-FY16
Cash
($ millions)
$941.3
$845.7 $830.6
Q3-FY15 Q2-FY16 Q3-FY16
Total Debt
($ millions)
Key Balance Sheet Metrics
10
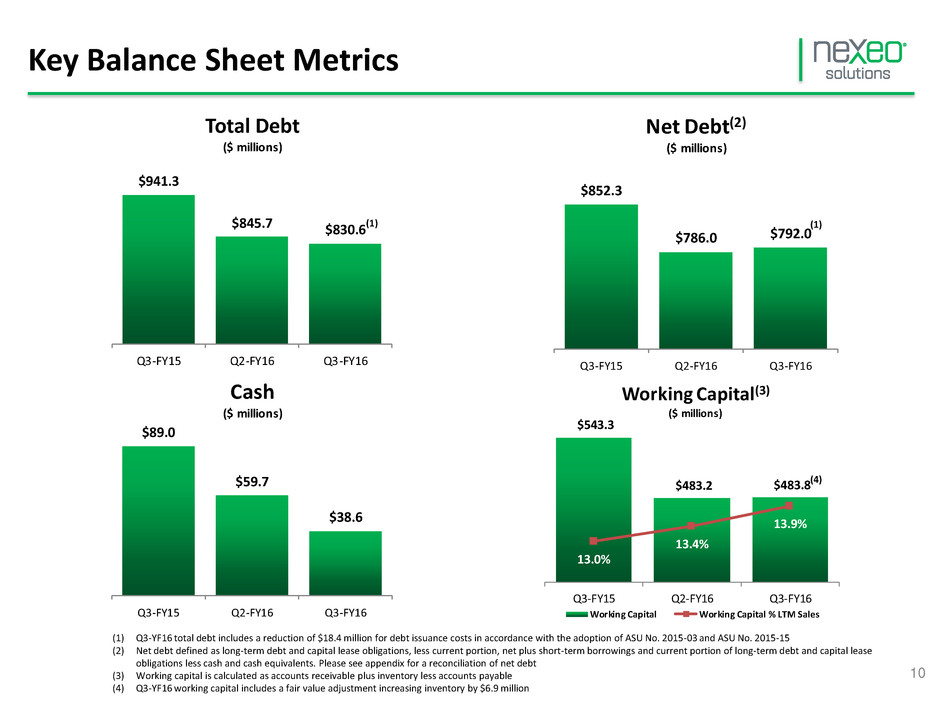
(1) Q3-YF16 total debt includes a reduction of $18.4 million for debt issuance costs in accordance with the adoption of ASU No. 2015-03 and ASU No. 2015-15
(2) Net debt defined as long-term debt and capital lease obligations, less current portion, net plus short-term borrowings and current portion of long-term debt and capital lease
obligations less cash and cash equivalents. Please see appendix for a reconciliation of net debt
(3) Working capital is calculated as accounts receivable plus inventory less accounts payable
(4) Q3-YF16 working capital includes a fair value adjustment increasing inventory by $6.9 million
(1)
(4)
(1)

$152
$157
$151
$162
$176
$184
$189
$182
$885
$982
$906
$852
$808 $808
$786 $792
9/30/2014 12/31/2014 3/31/2015 6/30/2015 9/30/2015 12/31/2015 3/31/2016 6/30/2016
LTM Adjusted EBITDA ($M) Net Debt ($M)
LTM Adjusted EBITDA, Net Debt & Leverage(1)
5.8x 6.3x 6.0x 5.3x 4.6x
11
(1) Prior periods adjusted to reflect the impact of discontinued operations
(2) Adjusted EBITDA and net debt are non-GAAP measure. See appendix slides for a reconciliation
(3) Q3-FY16 net debt includes a reduction of $18.4 million for debt issuance costs in accordance with the adoption of ASU No. 2015-03 and ASU No. 2015-15. Net debt is
defined as long-term debt and capital lease obligations, less current portion, net plus short-term borrowings and current portion of long-term debt and capital lease
obligations less cash and cash equivalents. See reconciliation of net debt in the appendix
4.4x 4.4x4.2xLeverage
(2) (3)

Closing Remarks
David Bradley
President and Chief Executive Officer
12

Full Year Adjusted EBITDA(1) Guidance
13
Predecessor Predecessor Predecessor Successor Estimated Estimated Estimated
(in millions)
3 Months Ended
Dec-15
3 Months Ended
Mar-16
3 Months Ended
Jun-16 (2)
3 Months Ended
Jun-16 (3)
3 Months Ended
Sep-16
12 Months
Ended Sep-16
12 Months
Ended Sep-17
Q1-FY16 Q2-FY16 Q3-FY16 Q3-FY16 Q4-FY16 FY 2016 FY 2017
Net income (loss) 4 2 (20) (16) 11 - 16 50 - 65
Interest expense, net 16 15 11 3 13 50
Income tax expense (benefit) 1 2 1 (1) 2 28
Depreciation and amortization 14 14 10 4 17 72
EBITDA from continuing operations 35 33 2 (10) 43 - 48 200 - 215
Adjustments (4) 4 8 30 25 - -
Adjusted EBITDA 39$ 41$ 32$ 15$ $43 - $48 $170 - $175 $200 - $215
(1) Adjusted EBITDA is a non-GAAP measure. See appendix slides for a reconciliation of adjusted EBITDA to net income
(2) Includes 69 days of operating activities
(3) Includes 22 days of the acquired business’ operating activities
(4) For additional detail regarding adjustments, please see adjusted EBITDA reconciliation slide in appendix

QUESTION & ANSWER SESSION
To ask a question live over the phone please press * then the
number 1 on your telephone keypad to queue our operator.
14

THANK YOU FOR ATTENDING.
We look forward to hosting you next
quarter!
Closing Remarks
Please feel free to contact
Nexeo’s Investor Relations Personnel at:
Investor.relations@nexeosolutions.com
281-297-0856
15

APPENDIX
16

Adjusted EBITDA Reconciliation
17
(1) Management adjustments associated with integration, restructuring and transformational activities
(2) Special one-time compensation incentive approved by the Compensation Committee for fiscal year 2015 performance
(3) Includes the impact of net realized and unrealized foreign exchange gains and losses related to transactions in currencies other than the functional currency of the
respective legal entity for the purpose of evaluating company performance and facilitate more meaningful comparisons of performance to other fiscal periods
(4) Management, monitoring, consulting, reimbursable fees and leverage fees, per the agreement with TPG Capital, L.P. In connection with the Business Combination this
agreement was terminated
(5) Includes professional and transaction costs related to the Merger, potential acquisitions and other one-time items. Management believes these are primarily one-time
adjustments related to the Business Combination
(6) Includes 69 days of operating activities
(7) On June 9, 2016, the Board of Directors approved a change in fiscal year end of the Company from December 31 to September 30. The periods above reflect a
September 30 fiscal year end of the Successor
(8) Includes 22 days of the acquired business’ operating activities
Nexeo Solutions, Inc.
Adjusted EBITDA Reconciliation
(in millions)
Q3-FY15 Q4-FY15 Q1-FY16 Q2-FY16 Q3-FY16
(6)
Q1-FY16
(7)
Q2-FY16
(7)
Q3-FY16
(8)
Net income (loss) 18.8$ 9.7$ 4.3$ 2.1$ (20.2)$ (0.1)$ (1.5)$ (15.5)$
Net (income) loss from discontinued operations - - - (0.1) - - - -
Interest expense, net 16.2 15.9 15.6 15.4 11.2 (0.2) (0.4) 2.9
Income tax expense (benefit) 1.8 1.2 1.3 1.8 1.1 - - (1.3)
Depreciation and amortization 13.1 13.1 13.6 13.8 10.3 - - 4.3
EBITDA from continuing operations 49.9 39.9 34.8 33.0 2.4 (0.3) (1.9) (9.6)
Management add-backs (1) 2.6 2.9 1.6 1.3 1.9 - 0.1 0.6
FY 2015 special one-time compensation incentives (2) - 8.9 - - - - - -
Foreign exchange (gains) losses, net (3) 0.4 1.3 0.5 (0.3) 1.3 - - 0.4
Management fees (4) 1.3 1.1 0.9 0.8 0.5 - - -
Compensation expense related to management equity
plan (non-cash)
0.3 0.3 0.3 0.3 0.1 - - 0.3
Inventory step up - - - - - - - 6.9
Transaction and other one-time items (5) (0.1) - 1.0 6.3 26.1 0.3 1.8 15.9
Adjusted EBITDA from continuing operations 54.4$ 54.4$ 39.1$ 41.4$ 32.3$ -$ -$ 14.5$
Predecessor Successor

LTM Adjusted EBITDA Reconciliation
18
(1) Management adjustments associated with integration, restructuring and transformational activities
(2) Special one-time compensation incentive approved by the Compensation Committee for fiscal year 2015 performance
(3) Includes the impact of net realized and unrealized foreign exchange gains and losses related to transactions in currencies other than the
functional currency of the respective legal entity for the purpose of evaluating company performance and facilitate more meaningful comparisons
of performance to other fiscal periods
(4) Management, monitoring, consulting, reimbursable fees and leverage fees, per the agreement with TPG Capital, L.P. In connection with the
Business Combination this agreement was terminated
(5) Includes professional and transaction costs related to the Merger, potential acquisitions and other one-time items. Management believes these
are primarily one-time adjustments related to the Business Combination
(6) Reflects certain expenses incurred to terminate activity and relationships associated with these operations
Nexeo Solutions, Inc.
Adjusted EBITDA Reconciliation
(in millions)
3/ 31/ 2015
LT M
6/ 30/ 2015
LT M
9/ 30/ 2015
LT M
12/ 31/ 2015
LT M
3/ 31/ 2016
LT M
6/ 30/ 2016
LT M
Net income (loss) attributable to Nexeo Solutions, Inc. 8.3$ 19.8$ 20.4$ 32.2$ 34.9$ (21.2)$
Net loss attributable to noncontrolling interest (0.2) (0.1) - - - -
Net (income) loss from discontinued operations (14.6) (12.5) 0.8 - (0.1) (0.1)
Interest expense, net 66.2 65.3 64.7 63.9 63.1 60.4
Income tax expense 5.0 6.0 3.9 6.1 6.1 4.1
Depreciation and amortization 54.4 53.0 52.6 53.3 53.6 55.1
EBITDA from continuing operations 119.1$ 131.5$ 142.4$ 155.5$ 157.6$ 98.3$
Management add-backs (1) 24.2 21.8 16.2 11.3 8.4 8.4
FY 2015 special one-time compensation incentives (2) - - 8.9 8.9 8.9 8.9
Foreign exchange (gains) losses, net (3) (0.1) 0.7 2.2 1.5 1.9 3.2
Management fees (4) 4.7 4.8 4.7 4.2 4.1 3.3
Compensation expense related to management equity plan (non-cash) 1.0 1.0 1.2 1.2 1.2 1.3
Inventory step up - - - - - 6.9
Transacti n and other one-time items (5) 1.8 2.2 0.9 1.2 7.2 51.4
Adjusted EBITDA from continuing operations 150.7$ 162.0$ 176.5$ 183.8$ 189.3$ 181.7$
Adjustments associated with discontinued operations:
Pretax gain on Composites Sale 15.5 15.5 - - - -
Adjusted EBITDA from discontinued operations (6) 1.0 (2.0) (1.0) (0.2) - -
Adjusted EBITDA 167.2$ 175.5$ 175.5$ 183.6$ 189.3$ 181.7$

Net Debt Reconciliation
19
Predecessor Predecessor Predecessor Predecessor Predecessor Predecessor Predecessor Successor
(in millions)
3 Months Ended
Sep-14
3 Months Ended
Dec-14
3 Months Ended
Mar-15
3 Months Ended
Jun-15
3 Months Ended
Sep-15
3 Months Ended
Dec-15
3 Months Ended
Mar-16
3 Months Ended
Jun-16
Q4-FY14 Q1-FY15 Q2-FY15 Q3-FY15 Q4-FY15 Q1-FY16 Q2-FY16 Q3-FY16
Long-term debt and capital lease
obligations, less current portion,
net 918.4 973.7 911.9 897.6 863.5 825.5 805.0 780.6
Short-term borrowings and current
port n of long-term debt and
capital lease obligations 54.4 50.0 45.1 43.7 72.4 39.8 40.7 50.0
Total Debt 972.8 1,023.7 957.0 941.3 935.9 865.3 845.7 830.6
Cash and cash equivalents 88.2 41.5 51.4 89.0 127.7 57.8 59.7 38.6
Net Debt 884.6$ 982.2$ 905.6$ 852.3$ 808.2$ 807.5$ 786.0$ 792.0$

Full Year Adjusted EBITDA(1) Guidance
20
Predecessor Predecessor Predecessor Successor Estimated Estimated Estimated
(in millions)
3 Months Ended
Dec-15
3 Months Ended
Mar-16
3 Months Ended
Jun-16 (2)
3 Months Ended
Jun-16 (3)
3 Months Ended
Sep-16
12 Months
Ended Sep-16
12 Months
Ended Sep-17
Q1-FY16 Q2-FY16 Q3-FY16 Q3-FY16 Q4-FY16 FY 2016 FY 2017
Net income (loss) 4 2 (20) (16) 11 - 16 50 - 65
Interest expense, net 16 15 11 3 13 50
Income tax expense (benefit) 1 2 1 (1) 2 28
Depreciation and amortization 14 14 10 4 17 72
EBITDA from continuing operations 35 33 2 (10) 43 - 48 200 - 215
Adjustments (4) 4 8 30 25 - -
Adjusted EBITDA 39$ 41$ 32$ 15$ $43 - $48 $170 - $175 $200 - $215
(1) Adjusted EBITDA is a non-GAAP measure. See appendix slides for a reconciliation of adjusted EBITDA to net income
(2) Includes 69 days of operating activities
(3) Includes 22 days of the acquired business’ operating activities
(4) For additional detail regarding adjustments, please see adjusted EBITDA reconciliation slide in appendix
