Attached files
| file | filename |
|---|---|
| 8-K - 8-K - INVENTIV HEALTH INC | d217263d8k.htm |
inVentiv Health Second Quarter 2016 Earnings Presentation August 12, 2016 Exhibit 99.1
This presentation contains forward-looking statements. These forward-looking statements reflect our current views about future events and are subject to risks, uncertainties and assumptions. We caution readers that certain important factors may have affected and could in the future affect our actual results and could cause actual results to differ significantly from those expressed in or implied by the forward looking statement and such forward-looking statements should not be unduly relied upon. Factors that could prevent us from achieving our goals, and cause the assumptions underlying forward-looking statements and the actual results to differ materially from those expressed in or implied by those forward-looking statements include, but are not limited to, the following: •the impact of client project delays, cancellations and terminations, including the impact on our backlog; •the failure to convert backlog into net revenues; •our ability to accurately price our contracts and forecast costs; •our ability to achieve operational efficiencies or grow our net revenues faster than expenses; •the risks related to our relationships with existing or potential clients who are in competition with each other; •our ability to recruit suitable willing investigators and patients for clinical trials; •our ability to maintain insurance coverage for our operations and indemnification obligations; •the impact of a loss of our access to certain data assets; •the potential liability associated with injury to clinical trial participants; •the risk of client concentration or concentration in therapeutic areas; •our ability to successfully develop and market new services and enter new markets; •the impact of any downgrade in our current credit ratings; •our history of losses and our ability to achieve and sustain profitability in the future; •changes in outsourcing expenditures for clinical development and commercialization services by companies in the biopharmaceutical industry; •the impact of government regulators or clients limiting a prescription’s scope or withdrawing an approved product from the market; •the potential impact of healthcare reform initiatives or from changes in the reimbursement policies of third-party payers; •the impact on our clients of lower cost generic and other competing products; •the impact of costs, liability and reputational harm from failing to perform our services in accordance with contractual requirements, regulatory standards and ethical considerations; •the risks associated with an industry-wide reduction in demand for CRO services; •the effect of covenant restrictions in our debt agreements on our ability to operate our business; and •our ability to service our substantial indebtedness. Readers are referred to the “Risk Factors” discussion in Item 1A of our Annual Report on Form 10-K for the year ended December 31, 2015 and item 1A of our Quarterly Report on Form 10-Q for the three months ended March 31, 2016, each on file with the Securities and Exchange Commission, for a further description of these risks and other factors that could prevent us from achieving our goals and cause the assumptions underlying forward-looking statements and the actual results to differ materially from those expressed in or implied by those forward-looking statements. This presentation contains the non-GAAP financial measures “EBITDA”, “Adjusted EBITDA” and “Adjusted Free Cash Flow.” These non-GAAP measures are not in accordance with, or an alternative for, generally accepted accounting principles and may be different from non-GAAP measures used by other companies. In addition, these non-GAAP measures are not based on any comprehensive set of accounting rules or principles. Non-GAAP measures have limitations in that they do not reflect all of the amounts associated with our results of operations as determined in accordance with GAAP. Management believes that the non-GAAP financial measures included herein, when shown in conjunction with the corresponding GAAP measures, are useful in order to (i) present financial information on a comparable period-to-period basis without giving effect to the impact of our capital structure, (ii) enhance investors’ overall understanding of our past financial performance and our planning and forecasting of future periods; and (iii) allow investors to assess our financial performance using management’s analytical approach. We have included in the appendices to this presentation the most directly comparable GAAP financial measures and a reconciliation between the non-GAAP and GAAP financial measures. Disclaimer
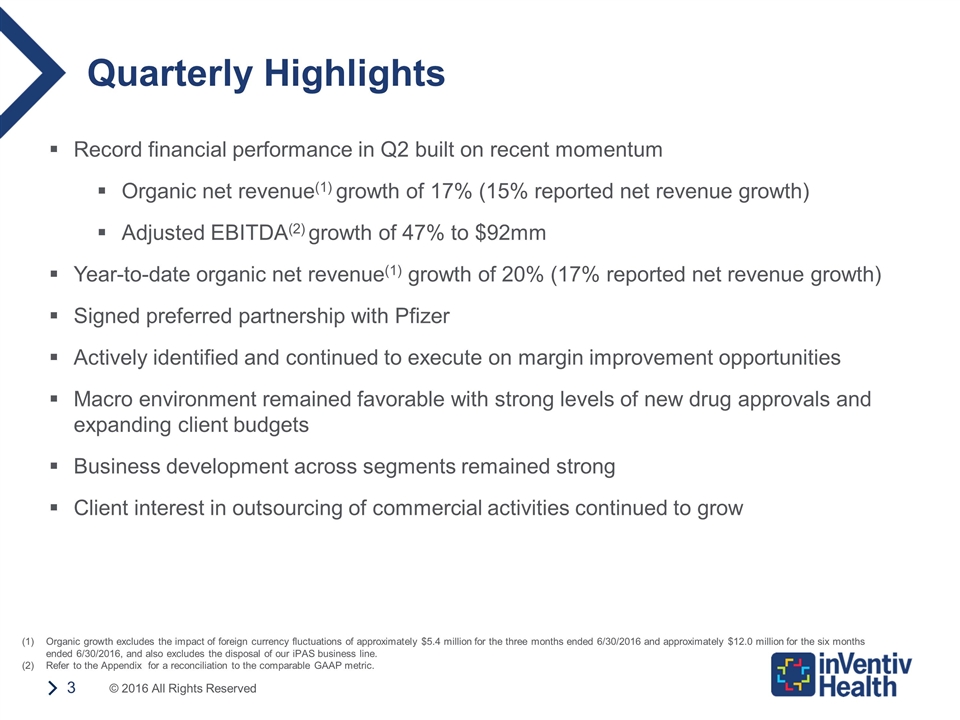
Quarterly Highlights Record financial performance in Q2 built on recent momentum Organic net revenue(1) growth of 17% (15% reported net revenue growth) Adjusted EBITDA(2) growth of 47% to $92mm Year-to-date organic net revenue(1) growth of 20% (17% reported net revenue growth) Signed preferred partnership with Pfizer Actively identified and continued to execute on margin improvement opportunities Macro environment remained favorable with strong levels of new drug approvals and expanding client budgets Business development across segments remained strong Client interest in outsourcing of commercial activities continued to grow Organic growth excludes the impact of foreign currency fluctuations of approximately $5.4 million for the three months ended 6/30/2016 and approximately $12.0 million for the six months ended 6/30/2016, and also excludes the disposal of our iPAS business line. Refer to the Appendix for a reconciliation to the comparable GAAP metric.
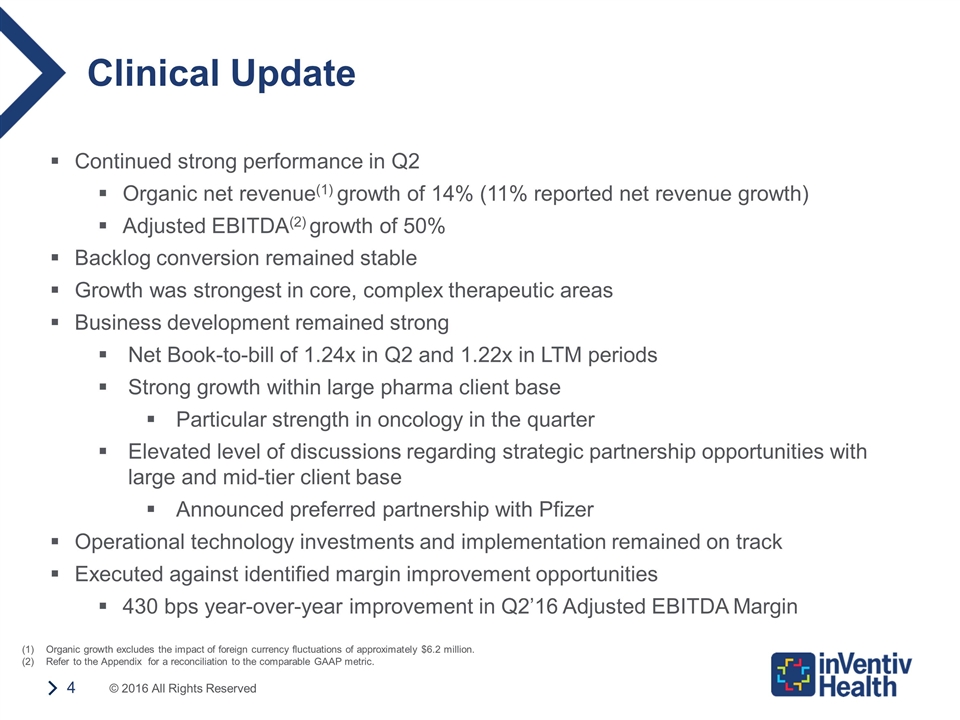
Clinical Update Continued strong performance in Q2 Organic net revenue(1) growth of 14% (11% reported net revenue growth) Adjusted EBITDA(2) growth of 50% Backlog conversion remained stable Growth was strongest in core, complex therapeutic areas Business development remained strong Net Book-to-bill of 1.24x in Q2 and 1.22x in LTM periods Strong growth within large pharma client base Particular strength in oncology in the quarter Elevated level of discussions regarding strategic partnership opportunities with large and mid-tier client base Announced preferred partnership with Pfizer Operational technology investments and implementation remained on track Executed against identified margin improvement opportunities 430 bps year-over-year improvement in Q2’16 Adjusted EBITDA Margin Organic growth excludes the impact of foreign currency fluctuations of approximately $6.2 million. Refer to the Appendix for a reconciliation to the comparable GAAP metric.
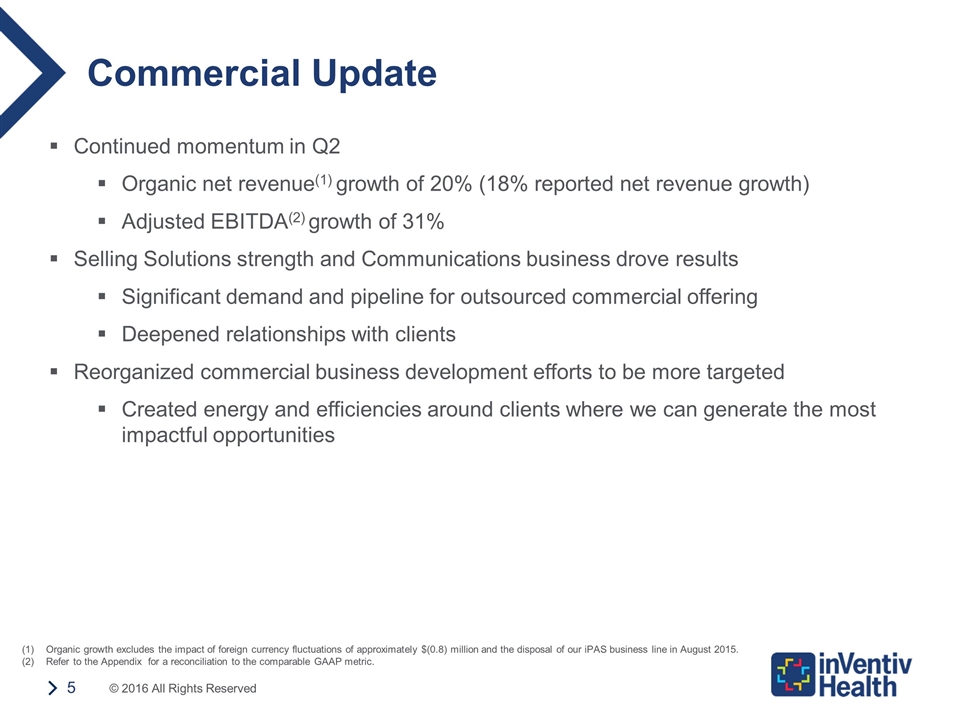
Commercial Update Continued momentum in Q2 Organic net revenue(1) growth of 20% (18% reported net revenue growth) Adjusted EBITDA(2) growth of 31% Selling Solutions strength and Communications business drove results Significant demand and pipeline for outsourced commercial offering Deepened relationships with clients Reorganized commercial business development efforts to be more targeted Created energy and efficiencies around clients where we can generate the most impactful opportunities Organic growth excludes the impact of foreign currency fluctuations of approximately $(0.8) million and the disposal of our iPAS business line in August 2015. Refer to the Appendix for a reconciliation to the comparable GAAP metric.
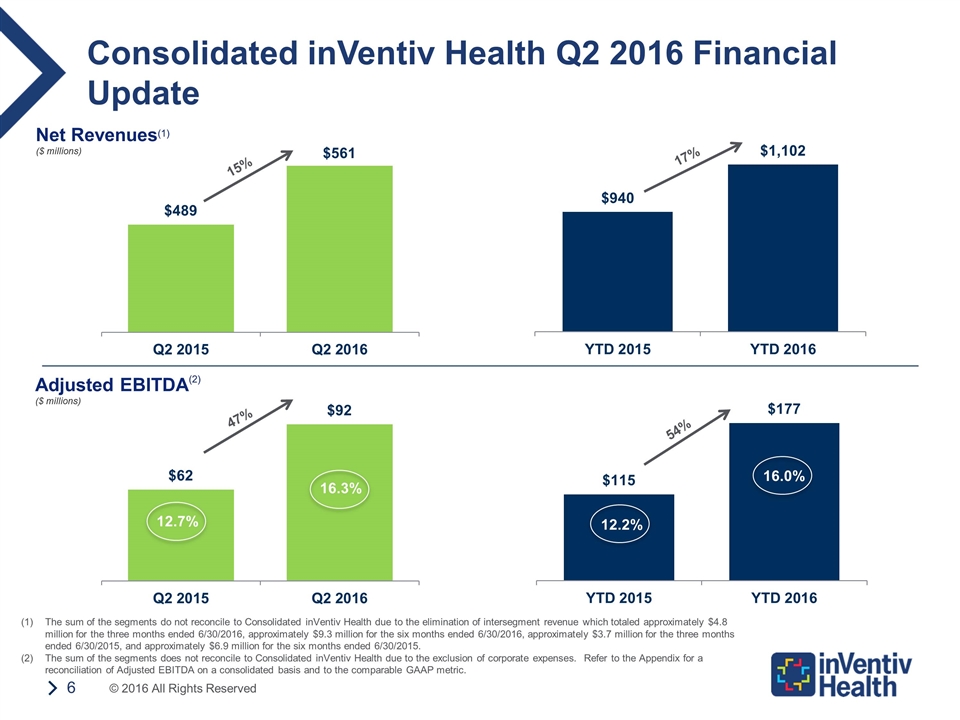
Consolidated inVentiv Health Q2 2016 Financial Update The sum of the segments do not reconcile to Consolidated inVentiv Health due to the elimination of intersegment revenue which totaled approximately $4.8 million for the three months ended 6/30/2016, approximately $9.3 million for the six months ended 6/30/2016, approximately $3.7 million for the three months ended 6/30/2015, and approximately $6.9 million for the six months ended 6/30/2015. The sum of the segments does not reconcile to Consolidated inVentiv Health due to the exclusion of corporate expenses. Refer to the Appendix for a reconciliation of Adjusted EBITDA on a consolidated basis and to the comparable GAAP metric. Net Revenues(1) ($ millions) Adjusted EBITDA(2) ($ millions) 15% 17% 54% 47% 12.7% 16.3% 12.2% 16.0%
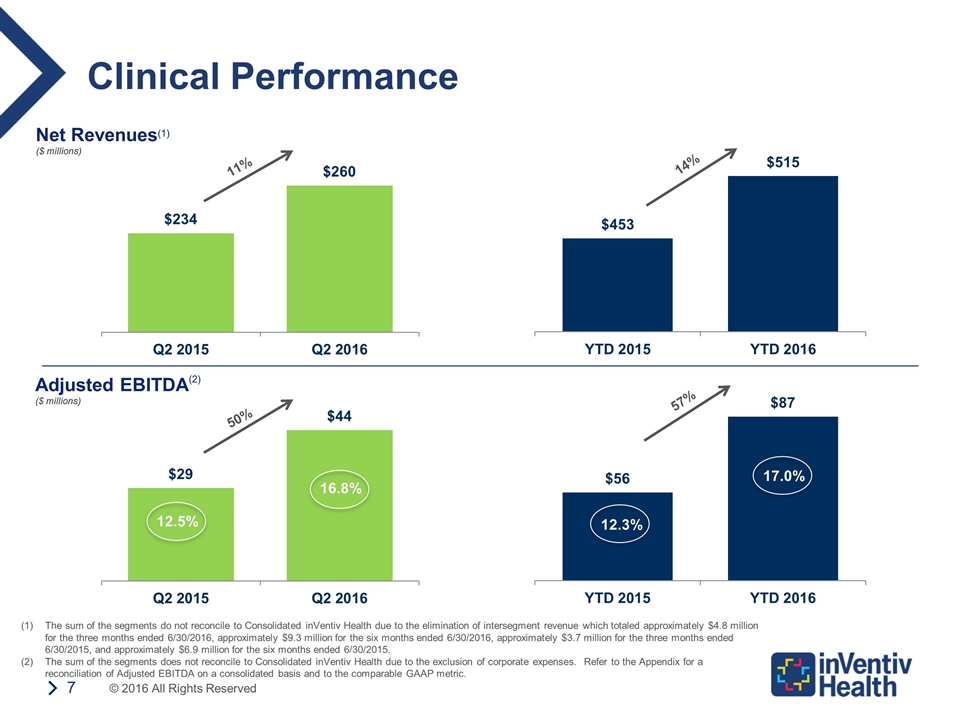
Clinical Performance The sum of the segments do not reconcile to Consolidated inVentiv Health due to the elimination of intersegment revenue which totaled approximately $4.8 million for the three months ended 6/30/2016, approximately $9.3 million for the six months ended 6/30/2016, approximately $3.7 million for the three months ended 6/30/2015, and approximately $6.9 million for the six months ended 6/30/2015. The sum of the segments does not reconcile to Consolidated inVentiv Health due to the exclusion of corporate expenses. Refer to the Appendix for a reconciliation of Adjusted EBITDA on a consolidated basis and to the comparable GAAP metric. Net Revenues(1) ($ millions) Adjusted EBITDA(2) ($ millions) 11% 14% 57% 50% 12.5% 16.8% 12.3% 17.0%
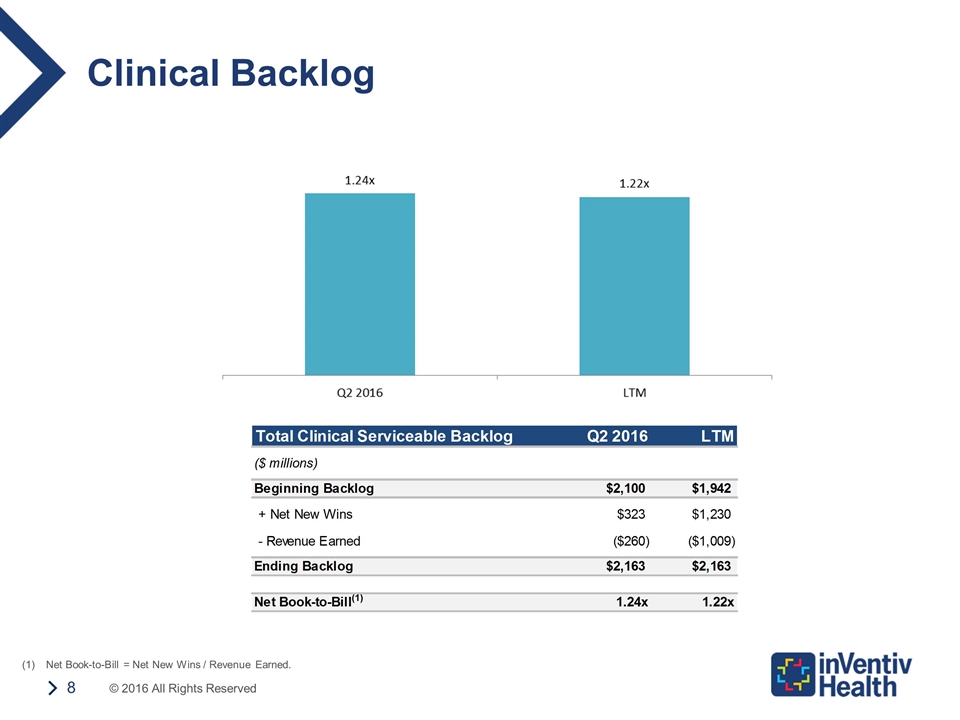
Clinical Backlog Net Book-to-Bill = Net New Wins / Revenue Earned. (1)
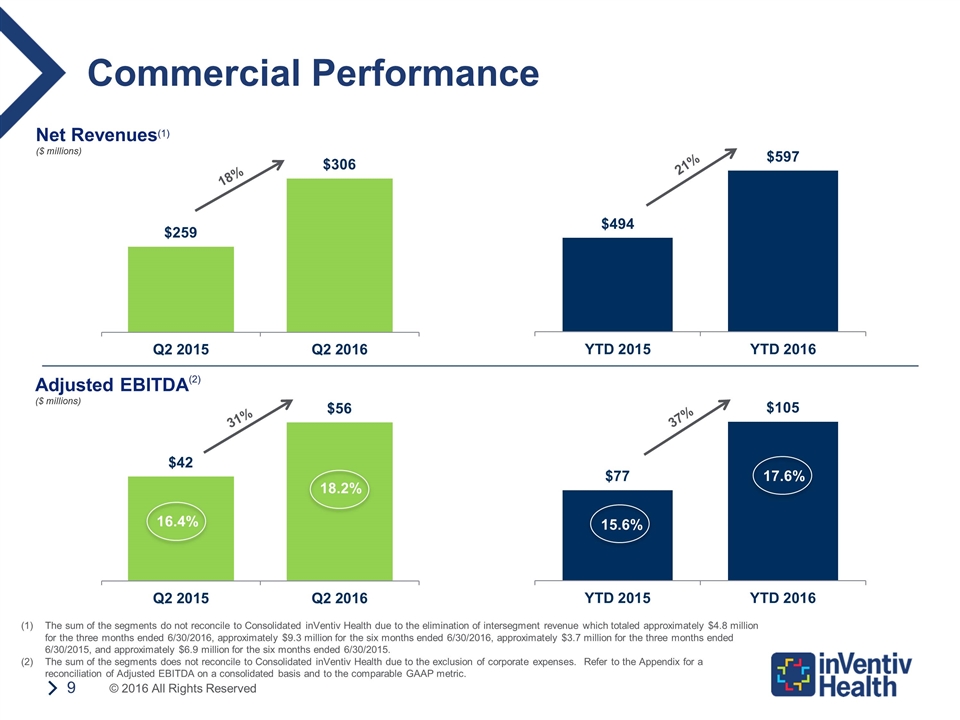
Commercial Performance Net Revenues(1) ($ millions) Adjusted EBITDA(2) ($ millions) 18% 21% 37% 31% 16.4% 18.2% 15.6% 17.6% The sum of the segments do not reconcile to Consolidated inVentiv Health due to the elimination of intersegment revenue which totaled approximately $4.8 million for the three months ended 6/30/2016, approximately $9.3 million for the six months ended 6/30/2016, approximately $3.7 million for the three months ended 6/30/2015, and approximately $6.9 million for the six months ended 6/30/2015. The sum of the segments does not reconcile to Consolidated inVentiv Health due to the exclusion of corporate expenses. Refer to the Appendix for a reconciliation of Adjusted EBITDA on a consolidated basis and to the comparable GAAP metric.
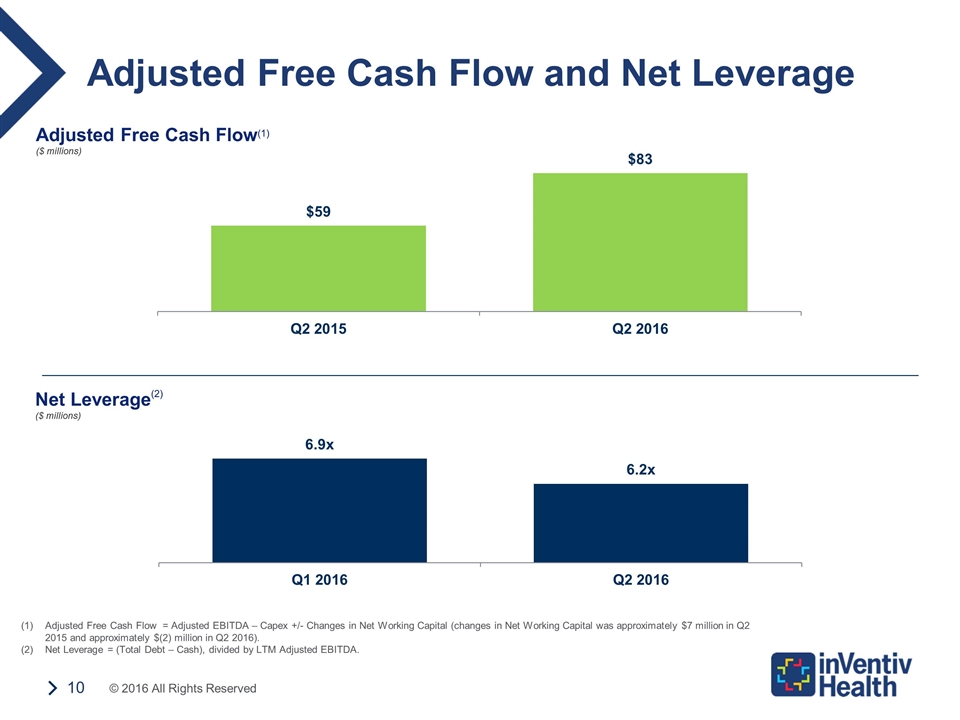
Adjusted Free Cash Flow and Net Leverage Adjusted Free Cash Flow(1) ($ millions) Net Leverage(2) ($ millions) Adjusted Free Cash Flow = Adjusted EBITDA – Capex +/- Changes in Net Working Capital (changes in Net Working Capital was approximately $7 million in Q2 2015 and approximately $(2) million in Q2 2016). Net Leverage = (Total Debt – Cash), divided by LTM Adjusted EBITDA.
Appendix
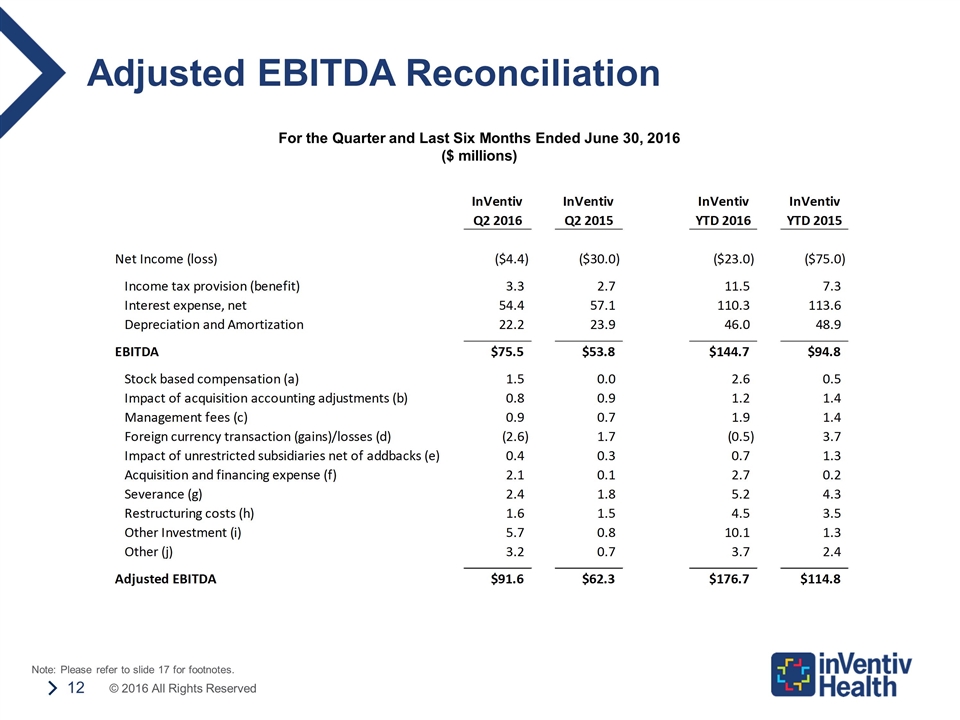
For the Quarter and Last Six Months Ended June 30, 2016 ($ millions) Adjusted EBITDA Reconciliation Note: Please refer to slide 17 for footnotes.
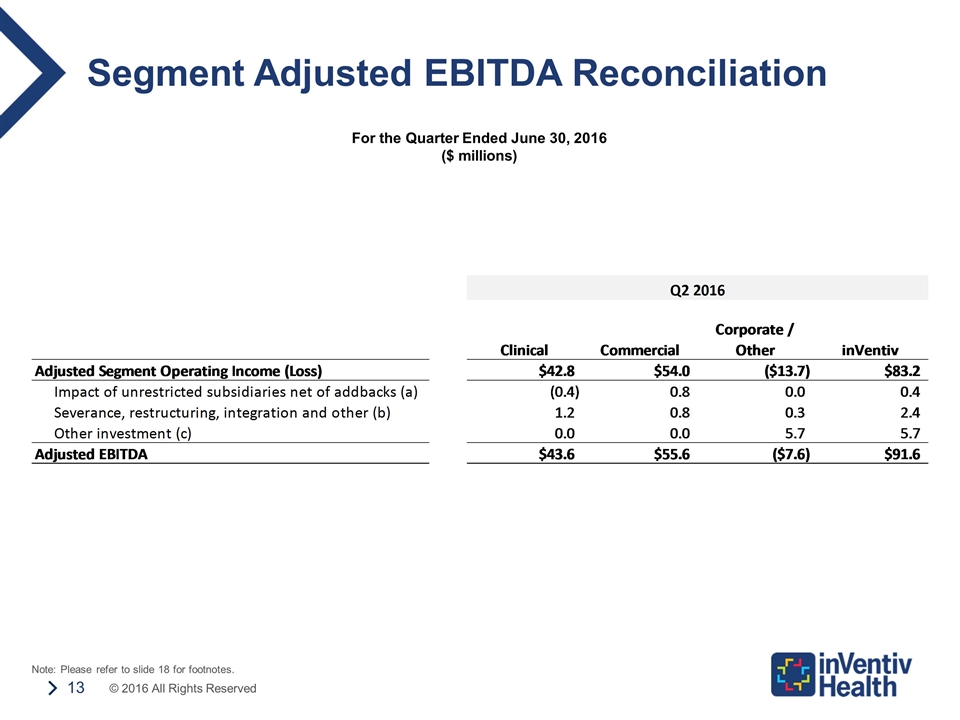
For the Quarter Ended June 30, 2016 ($ millions) Segment Adjusted EBITDA Reconciliation Note: Please refer to slide 18 for footnotes.
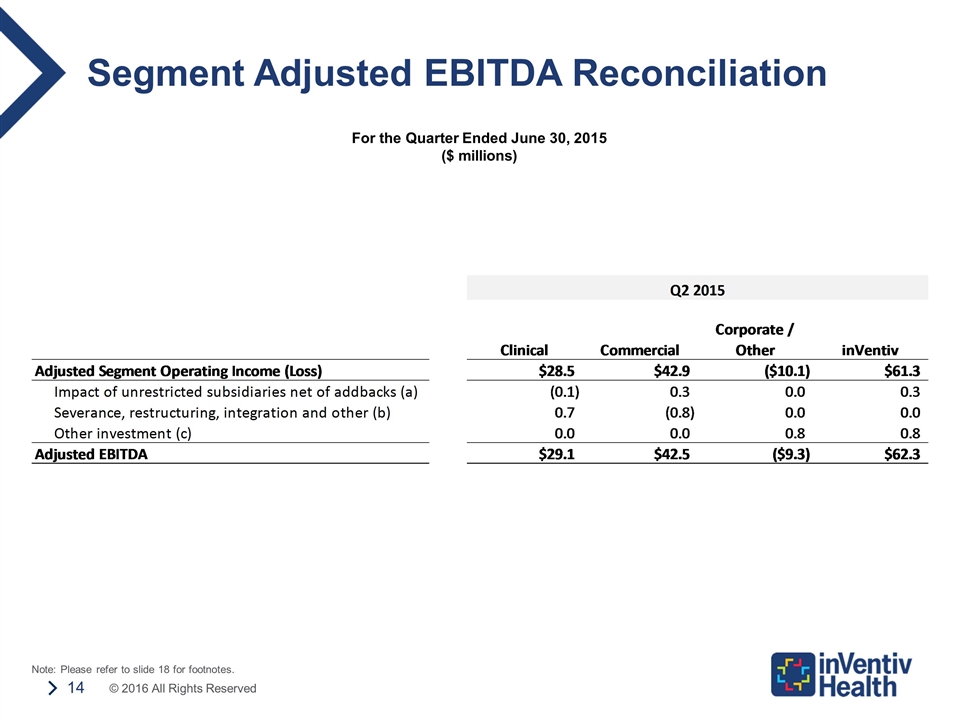
Segment Adjusted EBITDA Reconciliation Note: Please refer to slide 18 for footnotes. For the Quarter Ended June 30, 2015 ($ millions)
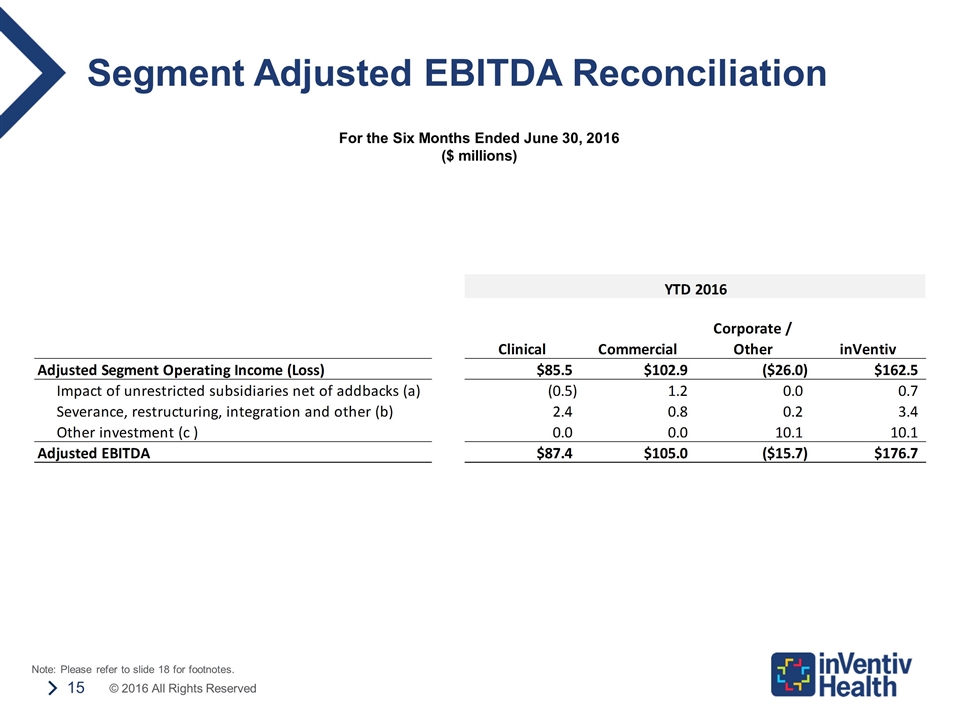
For the Six Months Ended June 30, 2016 ($ millions) Segment Adjusted EBITDA Reconciliation Note: Please refer to slide 18 for footnotes.
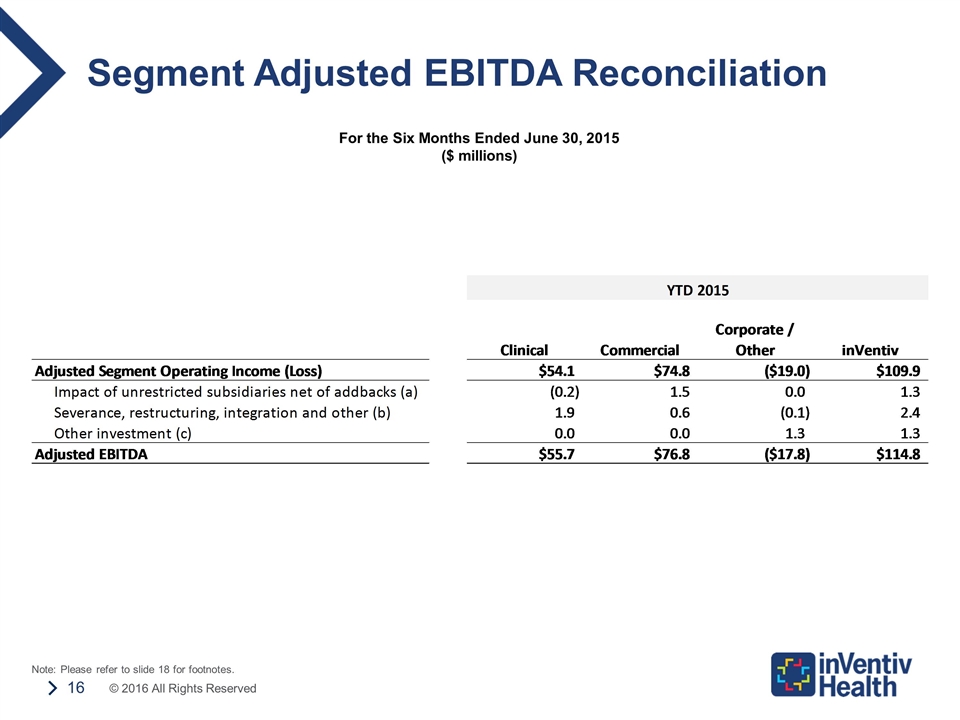
Segment Adjusted EBITDA Reconciliation Note: Please refer to slide 18 for footnotes. For the Six Months Ended June 30, 2015 ($ millions)
Adjusted EBITDA Footnotes (a) Represents non-cash compensation charges. (b) Represents non-cash adjustments resulting from the revaluation of certain items such as deferred revenue and deferred rent recognized in connection with our prior acquisitions. (c) Represents the annual sponsor management fee paid pursuant to the THL Management Agreement described in our consolidated financial statements with our quarterly report on Form 10-Q for the quarter ended June 30, 2016. (d) Represents the net gain or loss resulting from currency remeasurements. (e) Represents the loss from continuing operations of certain subsidiaries that we have designated as unrestricted for purposes of our debt instruments. We are permitted to exclude the impact of these unrestricted subsidiaries when calculating Adjusted EBITDA in accordance with our debt instruments. (f) Represents legal and advisory fees incurred in connection with our acquisitions that do not relate to and are not indicative of our core on-going operations. (g) Represents employee termination costs. We are permitted to exclude these costs when calculating Adjusted EBITDA in accordance with our debt instruments. (h) Represents costs in connection with facility closures, relocations, integrations and business optimization. We are permitted to exclude these costs when calculating Adjusted EBITDA in accordance with our debt instruments. (i) Represents costs incurred in connection with the Aprecia Agreement. We are permitted to exclude these costs when calculating Adjusted EBITDA in accordance with our debt instruments. (j) Represents third party costs for tax services, franchise taxes, certain non-cash items, one time costs from third party advisors, gain (loss) on extinguishment of debt, gain (loss) on the divestiture of iPAS in the third quarter of 2015, and equity investment income.
Segment Adjusted EBITDA Footnotes (a) Represents the loss from continuing operations of certain subsidiaries that we have designated as unrestricted for purposes of our debt instruments. We are permitted to exclude the impact of these unrestricted subsidiaries when calculating Adjusted EBITDA in accordance with our debt instruments. (b) Represents the impact of certain employee severance, restructuring and integration costs, as well as the impact from a number of other items including franchise taxes, non-cash items and one-time costs from third party advisors. This adjustment is a component of the severance and restructuring adjustments to net loss to arrive at Adjusted EBITDA on a consolidated basis. This adjustment does not equal the employee severance and related costs and facilities-related costs presented in our consolidated financial statements because such adjustment excludes certain severance costs for which the segments are not provided a benefit for purposes of reporting Segment Adjusted Operating Income and includes other costs described above which are not reported as restructuring costs under GAAP. (c) Represents costs incurred in connection with the Aprecia Agreement. We are permitted to exclude these costs when calculating Adjusted EBITDA in accordance with our debt instruments and these costs are not indicative of our core business.
