Attached files
| file | filename |
|---|---|
| 8-K - 8-K - Cornerstone Building Brands, Inc. | v446143_8k.htm |
Exhibit 99.1

Our Mission & Vision INVESTOR PRESENTATION August 8, 2016

Our Mission & Vision Cautionary Statement Regarding Forward - Looking Statements 2 This presentation includes statements concerning the Company’s expectations, beliefs, plans, objectives, goals, strategies, future events or performance and underlying assumptions and other statements that are not historical facts . These statements are “forward - looking statements” within the meaning of the Private Securities Litigation Reform Act of 1995 . In some cases, the Company’s forward - looking statements can be identified by the words “anticipate,” “believe,” “continue,” “could,” “estimate,” “expect,” “forecast,” “goal,” “intend,” “may,” “objective,” “plan,” “potential,” “predict,” “projection,” “should,” “will” or other similar words . The Company has based its forward - looking statements on management’s beliefs and assumptions based on information available to management at the time the statements are made . The Company cautions you that assumptions, beliefs, expectations, intentions and projections about future events may and often do vary materially from actual results . Therefore, the Company cannot assure you that actual results will not differ materially from those expressed or implied by its forward - looking statements . Accordingly, investors are cautioned not to place undue reliance on any forward - looking information . Although the Company believes that the expectations reflected in the forward - looking statements are reasonable, these expectations and the related statements are subject to risks, uncertainties and other factors that could cause the actual results to differ materially from those projected . These risks, uncertainties and other factors include, but are not limited to : industry cyclicality and seasonality and adverse weather conditions ; challenging economic conditions affecting the nonresidential construction industry ; volatility in the U . S . economy and abroad, generally, and in the credit markets ; substantial indebtedness and the Company’s ability to incur substantially more indebtedness ; the Company’s ability to generate significant cash flow required to service or refinance its existing debt and obtain future financing ; the Company’s ability to comply with the financial tests and covenants in its existing and future debt obligations ; operational limitations or restrictions in connection with the Company’s debt ; increases in interest rates ; recognition of asset impairment charges ; commodity price increases and/or limited availability of raw materials, including steel ; the Company’s ability to make strategic acquisitions accretive to earnings ; retention and replacement of key personnel ; enforcement and obsolescence of intellectual property rights ; fluctuations in customer demand ; costs related to environmental clean - ups and liabilities ; competitive activity and pricing pressure ; increases in energy prices ; volatility of the Company’s stock price ; dilutive effect on the Company’s common stockholders of potential future sales of the Company’s common stock held by the selling stockholders ; substantial governance and other rights held by the selling stockholders ; breaches of the Company’s information system security measures and damage to its major information management systems ; hazards that may cause personal injury or property damage, thereby subjecting the Company to liabilities and possible losses, which may not be covered by insurance ; changes in laws or regulations, including the Dodd – Frank Act ; the Company’s ability to integrate the acquisition of CENTRIA with its business and to realize the anticipated benefits of such acquisition ; costs and other effects of legal and administrative proceedings, settlements, investigations, claims and other matters ; and timing and amount of the Company’s stock repurchases . See also the “Risk Factors” included in the Company’s annual report or 10 - K for the fiscal year ended November 1 , 2015 , which identifies other important factors, though not necessarily all such factors, that could cause future outcomes to differ materially from those set forth in the forward - looking statements . The Company expressly disclaims any obligation to release publicly any updates or revisions to these forward - looking statements, whether as a result of new information, future events or otherwise . This presentation contains non - GAAP financial information . The Company’s management uses this information in its internal analysis of results and believes that this information may be informative to investors in gauging the quality of the Company’s financial performance, identifying trends in the Company’s results and providing meaningful period - to - period comparisons . For additional information regarding these non - GAAP measures, including reconciliations to the most directly comparable financial measure calculated according to GAAP, see the Appendix to this presentation .

Our Mission & Vision 3 http:// www.ncibuildingsystems.com/NCI - Advantage.html

Our Mission & Vision 4 NCI Building Systems at a Glance ▪ Leading integrated manufacturer of building products for the low - rise nonresidential construction industry ▪ Three vertically integrated market segments • Metal Coil Coatings • Metal Components • Engineered Building Systems ▪ Strong national and regional brands marketed through a broad network of builders and distributors ▪ Large end - markets provide broad customer diversification • Commercial and Industrial • Institutional • Agricultural ▪ Diverse manufacturing footprint strategically located to serve key markets ▪ Headquartered in Houston, TX with ~ 5,300 employees globally Metal Components Engineered Building Systems Metal Coil Coating

Our Mission & Vision Business Segments 5 Key segments Metal Coil Coating Metal Components Engineered Building Systems Focus Cleaning, treating and painting flat rolled metal coil substrates. The segment is base - loaded with internal demand, creating strong plant utilization rates that provide production flexibility and capture efficiencies. Manufactures and distributes i nsulated metal panels (IMP), metal roof and wall systems, metal partitions, and metal doors. The IMP market is highly consolidated with two key players in the U.S., and the rest of the Components segment is a highly fragmented market. Manufacturers and distributes custom e ngineered building systems for low rise nonresidential markets. Buildings are custom designed and engineered to meet specific building codes and end - user requirements and are shipped ready for assembly. Key products End Markets (1) Revenue FY2015 $101 million $815 million $648 million (1) Source : Management estimates; internal order data Industrial 7 % 55 % 18 % 15 % 3% 1% Commercial Agricultural Institutional Other Residential 49 % 18 % 14 % 9 % 9 % 1 % Commercial Institutional Agricultural Industrial Residential Other 41% 18 % 15 % 13 % 7 % 7 % Commercial Agricultural Other Institutional Industrial Residential

Our Mission & Vision 6 The NCI Platform

Our Mission & Vision 1 Platform for profitable growth and value creation 7 2 3 4 5 6 Taking market share in a fundamentally attractive industry Strategic insulated metal panel platform Impressive financial momentum Significantly improved business Early innings of cyclical recovery Structurally advantaged platform
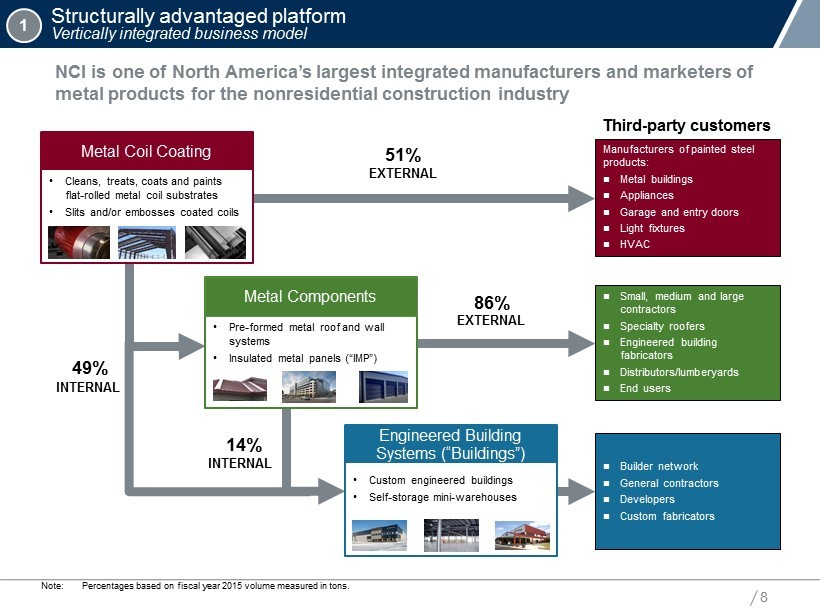
Our Mission & Vision Structurally advantaged platform Vertically integrated business model 8 Engineered Building Systems (“Buildings”) 51% 49% Third - party customers 86% 14% Manufacturers of painted steel products: Metal buildings Appliances Garage and entry doors Light fixtures HVAC Small, medium and large contractors Specialty roofers Engineered building fabricators Distributors/lumberyards End users Builder network General contractors Developers Custom fabricators EXTERNAL EXTERNAL INTERNAL INTERNAL Note: Percentages based on fiscal year 2015 volume measured in tons. NCI is one of North America’s largest integrated manufacturers and marketers of metal products for the nonresidential construction industry Metal Coil Coating Metal Components • Cleans, treats, coats and paints flat - rolled metal coil substrates • Slits and/or embosses coated coils • Pre - formed metal roof and wall systems • Insulated metal panels (“IMP”) • Custom engineered buildings • Self - storage mini - warehouses 1

Our Mission & Vision Structurally advantaged platform Leading market positions 9 Metal Components Light gauge coil coating Heavy gauge hot rolled steel coating ▪ High - margin, highly consolidated industry ▪ Top 4 heavy gauge participants control approximately 85% of market ▪ Advantaged through internal consumption and vertical integration ▪ High - end specialty coating capabilities enhanced through CENTRIA acquisition ▪ Metal Components market is highly fragmented ▪ Significant breadth of geography, end - market applications, and customers ▪ Fast - growing, high - margin products ▪ CENTRIA acquisition enhances IMP leadership position Engineered Building Systems (1) ▪ Highly consolidated industry with top 3 players representing ~70% of the market (1) ▪ Well - respected brands marketed through a broad network of builders and distributors Insulated m etal panels Note: Market position and market share based on management estimates. (1) Represents the portion of the market served by the Metal Building Manufacturers Association (“MBMA”) based on shipment tons. NCI, Bluescope and Nucor are members of MBMA, and members serve the majority of the Engineered Building Systems market . (2) Heavy gauge, light gauge and Engineered Building Systems market shares are based on tons shipped. Metal Components and Insul ated metal panels market shares are based on revenue. 1 NCI 39% NCI 14% Precoat Metals ~40% NCI 22% Nucor 27% Bluescope 22% Market share (2) #1 #2 #1 #2 #1 NCI 11% NCI 49% Kingspan 45%

Our Mission & Vision 10 Buildings Group Builders IMP Top 200 Dealers - Customers Metal Components Top 500 Customers Network of ~ 3,200 affiliated builders ~1,000 dealer partners associated with IMP product line Relationship with ~5,500 architects who influence end users through specification of our products 1 Structurally advantaged platform Supported by powerful sales channe l

Our Mission & Vision 11 Institutional Hangers Schools Hospitals Commercial/Industrial Offices Warehouses Banks Hotels Manufacturing Agricultural Arenas Farms Equestrian Centers Religious 1 Structurally advantaged platform Large End Markets Provides Broad Diversification A wide range of industry segments, with no single customer accounting for more than 2% of sales

Our Mission & Vision 12 Note: Data shown based on NCI fiscal year end. NCI steel inventory is managed using FIFO. 1,071 1,036 976 599 598 599 689 767 812 900 969 24.4% 24.8% 24.9% 22.4% 19.6% 21.0% 22.2% 21.0% 21.3% 23.8% 24.9% 2006 2007 2008 2009 2010 2011 2012 2013 2014 2015 Q2-16 TTM NCI volume (thousands of tons) NCI gross margin Historical NCI volume vs. NCI gross margin 157 148 236 152 156 182 165 171 177 127 174 24.4% 24.8% 24.9% 22.4% 19.6% 21.0% 22.2% 21.0% 21.3% 23.8% 24.9% 2006 2007 2008 2009 2010 2011 2012 2013 2014 2015 Q2-16 TTM CRU Steel Price Index NCI gross margin Historical CRU Steel Price Index vs. NCI gross margin Correlation = 0.855 Correlation = 0.112 1 Structurally advantaged platform Gross margin is more correlated to volume changes than to steel price changes
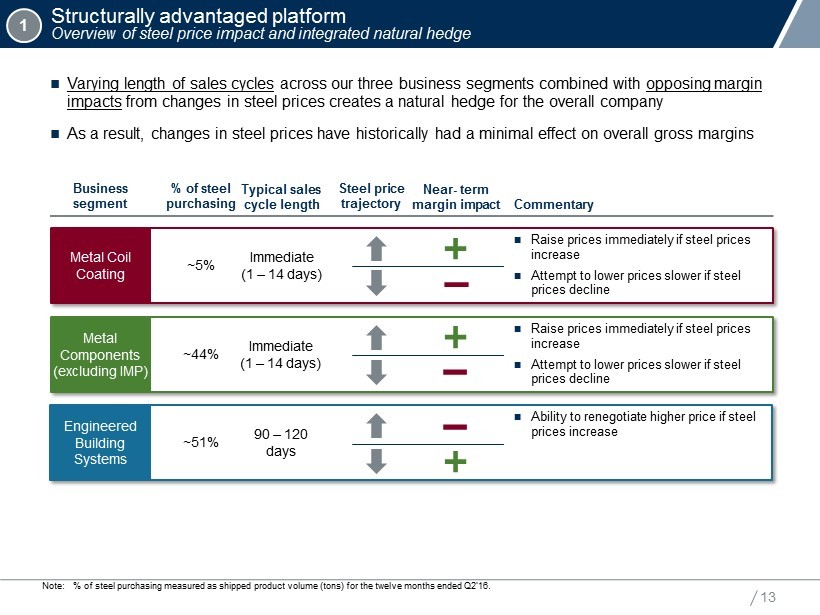
Our Mission & Vision 13 Business segment % of steel purchasing Typical sales cycle length Steel price trajectory Near - term margin impact Varying length of sales cycles across our three business segments combined with opposing margin impacts from changes in steel prices creates a natural hedge for the overall company As a result, changes in steel prices have historically had a minimal effect on overall gross margins Commentary Engineered Building Systems ~51% 90 – 120 days Ability to renegotiate higher price if steel prices increase Metal Components (excluding IMP) ~44% Immediate (1 – 14 days) Raise prices immediately if steel prices increase Attempt to lower prices slower if steel prices decline Metal Coil Coating ~5% Immediate (1 – 14 days) Raise prices immediately if steel prices increase Attempt to lower prices slower if steel prices decline 1 Structurally advantaged platform Overview of steel price impact and integrated natural hedge Note: % of steel purchasing measured as shipped product volume (tons) for the twelve months ended Q2’16.

Our Mission & Vision 10% 20% 13% 5% 14% 13% 1% 9% 10% 12% (0%) (5%) 2011 2012 2013 2014 2015 Q2-16 TTM NCI revenue Low-rise nonresidential construction (sq. ft.) 1.06 1.27 1.00 1.05 1.10 1.15 1.20 1.25 1.30 1.35 1.40 2007 2015 Taking market share in a fundamentally attractive industry 14 Source: Dodge Data and Analytics; Metal Building Manufacturers Association. Note: Data shown based on NCI fiscal year end . (1) Dodge nonresidential starts data for prior 18 months is subject to upward revision. MBMA tons shipped / low - rise nonres . construction starts (1) Tons / 1,000 sq. ft. 3 - year rolling average Metal building industry has gained share in the low - rise nonresidential construction market Increased cost - efficiency and lower maintenance Architecturally pleasing structures Sustainability / recycled materials / LEED Technological advancements 2 +1,824 bps +1,447 bps – 762 bps +310 bps +1,157 bps +953 bps Y - o - Y % growth – NCI revenue vs. low - rise nonresidential construction (sq. ft.) growth (1) Metal building key drivers NCI revenue vs. low - rise nonres . (sq. ft.)

Our Mission & Vision Strategic insulated metal panel platform Continued expansion of IMP product line 15 Expanding mix of IMP products sales (2) Note: Data shown based on NCI fiscal year end. (1) Management estimates. (2) Acquisitions included from the date of acquisition. Metl - Span and CENTRIA were acquired in FY2012 and FY2015, respectively. 3 Q2 - 16 TTM (IMP sales as a % of total NCI sales) 97% 3% 76% 24% 2014 2011 82% 18% $30 $245 $382 2011 2014 Q2'16 TTM IMP revenue growth (2) ($ in millions) Metl - Span : IMP : Brooklyn, N.Y. CENTRIA : IMP : East Lansing, MI Polyisocyanurate Insulation Exterior Metal Skin Interior Metal Skin Focused strategy to expand high growth, high - margin IMP product line • Simultaneously provides high performance insulation with interior/exterior wall structures • Wide range of market and construction applications • Ability to leverage and cross - sell through existing legacy sales network Attractive demand dynamics • High - end aesthetic appeal • Among the lowest installed cost combined with ease of installation • Energy efficient, supporting green building initiatives • IMP penetration of total nonresidential construction is only ~3% in North America (approximately 1/5 th the penetration in Europe) (1) • Expected increase in the use of IMP products due to the adoption of stricter standards and codes by numerous states Impressive financial momentum • Significant margin enhancement potential

Our Mission & Vision 16 Balletto Vineyards and Winery ▪ A custom - engineered metal building representing the regional demand for aesthetic, functional, green buildings ▪ Metallic supplied the project’s complete primary and secondary framing ▪ Met’l - Span helped the winery achieve LEED certification by integrating multiple green attributes including IMP panels for optimizing roof and wall insulation “The insulated metal panels have the exterior, the insulation and the finished interior face. It was a time and money saver.” Edwin Wilson, AIA, CSI Principal O’Malley, Wilson and Westphal Metallic : Balletto Vineyards & Winery : Sebastopol, CA Insulated Metal Panels Metl - Span CF Fluted Wall Panel Primary Framing Single Slope Exposed Fastener Roof Panel MBCI PBD Panel Primary Framing Gable Symmetrical Exposed Fastener Roof Panel MBCI PBU Panel Strategic insulated metal panel platform An Integrated Business – The Complete Building Solution 3

Our Mission & Vision 6% 10% 2014 Q2-16 TTM 11% 12% 2014 Q2-16 TTM Significantly improved business Streamlined organizational structure 17 4 R. Dan Ronchetto Vice President, Chief Procurement Officer John L. Kuzdal President of Group Manufacturing Segment Donald R. Riley President Manufacturing Supply Chain Commercial Metal Coil Coating Metal Components Engineered Building Systems Removed layer of segment presidents and refocused strategy on commercial , manufacturing and supply chain coordination and execution across all segments Promoted in Jan 2016 Hired as President of Group Business Segment in Dec 2014 Promoted in Nov 2013 Prior President of Metal Coil Coatings Promoted in Nov 2015 to newly created position Coordinated focus across all business segments to improve efficiency and execution $27 $27 2014 Q2-16 TTM $43 $69 2014 Q2-16 TTM $53 $ 111 2014 Q2-16 TTM Adj. EBITDA margin Adj. EBITDA margin Adj. EBITDA margin Adj. EBITDA Adj. EBITDA Adj. EBITDA 8% 11% 2014 Q2-16 TTM +70 bps 0% +362 bps +111% +411 bps +62% Note: Data shown based on NCI fiscal year end. Adjusted EBITDA is a non - GAAP measure. See Appendix for reconciliation .

Our Mission & Vision Significantly improved business Commercial execution to drive profitable growth 18 National Metal Coil Coating Metal Components Engineered Building Systems Regional Metal Components segment benefiting from improved focus on sales performance – volume and Adj. EBITDA margins up 65% and 363 bps (1 ) “ Express Plus” experiencing significant growth, leveraging an online solution across all Buildings brands (booking sales up 44% YTD 2016) 36% of large Buildings orders included IMP products YTD in 2016 (2) vs 23% in 2015 Brand repositioning • Portfolio of brands with multi - generational customer relationships • Wide range of customer solutions with “Good , Better, Best” product portfolio • Diverse customer base enables brands to pivot to end - markets experiencing highest growth Product penetration • “Push ” strategy of IMP through existing builder network, leading to “pull” opportunities Sales channel integration • Orchestrating sales channels across all segments to increase differentiation and minimize conflict • Integrating acquired brands and products into existing sales channels • Focusing on higher growth opportunities 4 National and regional brand strength and strategy Note: Data shown based on NCI fiscal year end. Adjusted EBITDA is a non - GAAP measure. See Appendix for reconciliation . ( 1) Calculation based on comparison of FY2014 to TTM Q2’16. (2) Includes bookings through June 2016.

Our Mission & Vision Significantly improved business Manufacturing and supply chain optimization 19 Continuing rationalization of manufacturing facilities is estimated to result in annual cost savings ranging from $15 million to $20 million by fiscal 2018 Eliminated certain fixed and indirect ESG&A costs primarily through: • Automation and consolidation in engineering • SG&A savings Procurement savings stemming from centralized and improved steel, paint and foam purchasing and other supply chain improvements 21.3% 24.9% 2014 Q2-16 TTM Manufacturing • Automation and lean manufacturing processes • Plant utilization managed on a holistic basis to provide flexibility and efficiency • Ability to manufacture all products across different facilities • Improved fixed - cost footprint through facility realignment and consolidation Supply chain / procurement • Streamlined supply chain and back office functions • Improved steel buying • Reduced transportation costs • Leveraged volume to drive efficiencies throughout the cost structure 4 Significant gross margin improvement Note: Data shown based on NCI fiscal year end . +356 bps
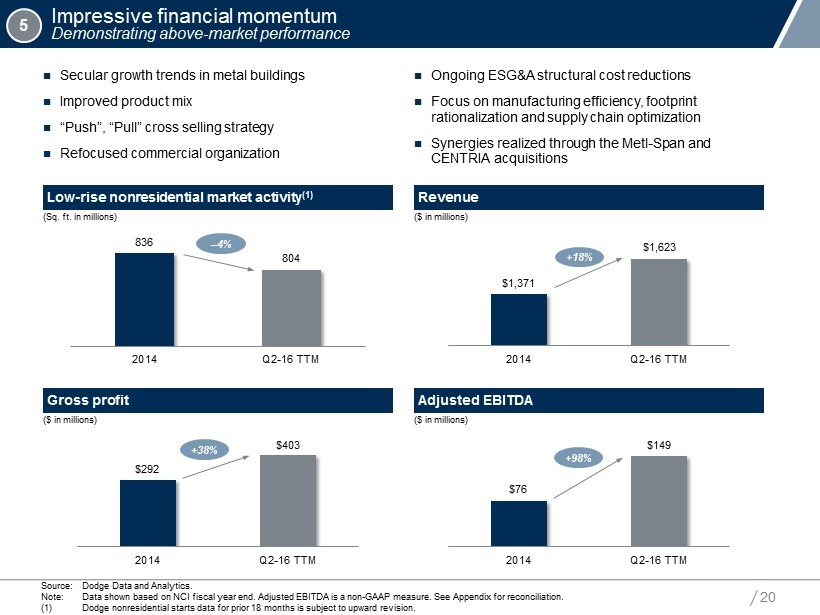
Our Mission & Vision 20 5 Impressive financial momentum Demonstrating above - market performance Source: Dodge Data and Analytics. Note: Data shown based on NCI fiscal year end . Adjusted EBITDA is a non - GAAP measure. See Appendix for reconciliation . (1) Dodge nonresidential starts data for prior 18 months is subject to upward revision. 836 804 2014 Q2-16 TTM Low - rise nonresidential market activity (1) Revenue Gross profit Adjusted EBITDA (Sq. ft. in millions) $1,371 $1,623 2014 Q2-16 TTM ($ in millions) ($ in millions) ($ in millions) $76 $149 2014 Q2-16 TTM – 4% +18% +98% Ongoing ESG&A structural cost reductions Focus on manufacturing efficiency, footprint rationalization and supply chain optimization Synergies realized through the Metl - Span and CENTRIA acquisitions Secular growth trends in metal buildings Improved product mix “Push ”, “Pull” cross selling strategy Refocused commercial organization $292 $403 2014 Q2-16 TTM +38%

Our Mission & Vision Early innings of cyclical recovery Significant upside remains in our core markets 21 6 Source: Dodge Data and Analytics. Note: Data shown based on calendar year end. (1) Dodge nonresidential starts data for prior 18 months is subject to upward revision. New nonresidential starts – low - rise (5 stories or less) (1) 600 800 1,000 1,200 1,400 1,600 1,800 2,000 '67 '73 '79 '85 '91 '97 '03 '09 '15 (Sq. ft. in millions) Avg. 1967 – 2015 Avg. trough 1967 – 2015 (excl. 2010) Avg. peak 1967 – 2015 (Sq. ft. in millions) Sq. ft. Percentage Low-rise nonresidential starts (1) Sq. ft. 2015 difference difference Average trough 1967 – 2015 (ex. 2010) 995 826 169 20% Average 1967 – 2015 1,149 826 323 39% Average peak 1967 – 2015 1,415 826 589 71%

Our Mission & Vision 2000 2004 2008 2012 2016 CBRE Vacancy Rate (inverted) Dodge Data nonres. (sq. ft.) 500 700 900 1,100 1,300 1,500 1,700 1,900 2,100 6.0% 8.0% 10.0% 12.0% 14.0% 16.0% Early innings of cyclical recovery Key leading indicators are positive 22 0 40 80 120 160 200 2010 2011 2012 2013 2014 2015 2016 Thousands 35 40 45 50 55 60 2010 2011 2012 2013 2014 2015 2016 Architectural activity (ABI Mixed Practice Index) Single family residential square footage 6 80 90 100 110 120 130 2010 2011 2012 2013 2014 2015 2016 Conference Board Leading Economic Index LEI continues to show growth in index of economic predictors Single family residential activity has shown y - o - y growth in 21 of the last 24 months ABI Mixed Practice Index has indicated growth in 15 of the last 24 months Industrial vacancy rates Vacancy rates have improved significantly over the past several years (Sq. ft. in millions) Source: American Institute of Architects and Dodge Data and Analytics. Note: Data shown based on calendar year end. (Sq. ft. in millions) Billings index (greater than 50 = expansion)

Our Mission & Vision 23 Financial Overview

Our Mission & Vision Historical financial performance (fiscal year) 24 Note: Data shown based on NCI fiscal year end. Adjusted EBITDA is a non - GAAP measure. See Appendix for reconciliation . (1) Acquisitions included from the date of acquisition. Metl - Span and CENTRIA were acquired in FY2012 and FY2015, respectively. ( 2 ) Excludes unusual items as presented on the face of the consolidated statements of operations. External sales (1) Gross profit (1)(2) ESG&A (1 )(2) Adjusted EBITDA (1) ($ in millions) ($ in millions) ($ in millions) ($ in millions) $1,625 $1,763 $965 $871 $960 $1,154 $1,308 $1,371 $1,564 $1,623 3% (45)% (10)% 9% 10% 20% 13% 5% 14% 2007 2008 2009 2010 2011 2012 2013 2014 2015 Q2-16 TTM External sales % growth 404 440 216 171 202 256 276 292 372 403 25% 25% 22% 20% 21% 22% 21% 21% 24% 25% 2007 2008 2009 2010 2011 2012 2013 2014 2015 Q2-16 TTM Volume % margin $272 $281 $211 $191 $202 $219 $253 $258 $287 $295 17% 16% 22% 22% 21% 19% 19% 19% 18% 18% 2007 2008 2009 2010 2011 2012 2013 2014 2015 Q2-16 TTM ESG&A % of external sales $176 $201 $45 $16 $36 $77 $71 $76 $130 $149 11% 11% 5% 2% 4% 7% 5% 6% 8% 9% 2007 2008 2009 2010 2011 2012 2013 2014 2015 Q2-16 TTM Adjusted EBITDA % margin

Our Mission & Vision Impressive financial momentum 25 2.6% 6.1% 7.9% 2.1% 4.4% 6.8% 6.9% 9.1% NA 9.2% 12.3% NA $8 $20 $29 $6 $16 $25 $25 $38 NA $36 $56 NA Q1 Q2 Q3 Q4 145% 49% 151% 61% 53% 56% Q1 Q2 Q3 Q4 +350 bps +180 bps +235 bps +245 bps +220 bps +310 bps 2014 2015 2016 Adjusted EBITDA and y - o - y growth rate (1) ($ in millions) Adjusted EBITDA margin and y - o - y margin improvement (1) Note: Data shown based on NCI fiscal year end. Adjusted EBITDA is a non - GAAP measure. See Appendix for reconciliation . (1) Acquisitions included from date of acquisition. CENTRIA was acquired in January 2015. y - o - y % growth / margin change

Our Mission & Vision $149M NCI TTM Q2'16 Adjusted EBITDA Illustrative market recovery to 50- year average Mid-cycle Adjusted EBITDA opportunity BEFORE growth and productivity initiatives Incremental opportunity from growth and productivity intiatives Mid-cycle Adjusted EBITDA opportunity WITH growth and productivity initiatives Opportunity to drive meaningful long - term Adjusted EBITDA improvement 26 Focus on improved pricing and commercial execution Cross - selling of IMP products through existing builder network and components distribution network Actions underway to improve fixed cost structure • Plant reorganization, automation and lean manufacturing • ESG&A efficiencies Continued focus on procurement savings and supply chain optimization Continued structural changes to sales support structure in Buildings and Metal Components Business segment Future margin expansion potential Metal Components Metal Coil Coating Engineered Building Systems Strong operating leverage as low - rise nonresidential starts return to historical averages NCI illustrative Adjusted EBITDA growth opportunity Source: Management estimates. Note: Analysis is illustrative. Actual results may vary. Adjusted EBITDA is a non - GAAP measure. See Appendix for reconciliation . Potential upside from key initiatives NCI TTM Q2’16 Adjusted EBITDA Incremental opportunity from growth and productivity initiatives Mid - cycle Adjusted EBITDA opportunity WITH growth and productivity initiatives Illustrative market recovery to 50 - year average Mid - cycle Adjusted EBITDA opportunity BEFORE growth and productivity initiatives

Our Mission & Vision Strong cash flow and balance sheet to support future growth 27 $15 $48 $47 $58 $109 $128 41% 63% 66% 76% 84% 85% 2011 2012 2013 2014 2015 Q2-16 TTM Free cash flow FCF conversion rate ($ in millions) Note: Data shown based on NCI fiscal year end. Adjusted EBITDA is a non - GAAP measure. See Appendix for reconciliation . (1) Acquisitions included from the date of acquisition. Metl - Span and CENTRIA were acquired in FY2012 and FY2015, respectively . (2) Free cash flow defined as Adjusted EBITDA less capex. (3) FCF conversion rate defined as Adjusted EBITDA less capex divided by Adjusted EBITDA. (4) Assumes use of available cash to fund concurrent share repurchase. NCI may use other available liquidity, including liquidit y under its revolving credit facility, to fund the share repurchase. Flexible balance sheet Strong unlevered pre - tax free cash flow generation (1) Commentary Operating leverage continues to drive improved free cash flow and increasing conversion rate Manufacturing efficiency and footprint rationalization to drive additional savings Minimal maintenance capex as a % of sales Ample liquidity to support future investments (M&A and capital projects with attractive returns) Demonstrated commitment to debt reduction History of returning cash to investors (2) (3) ($ in millions) Pro forma for share 5/1/16A repurchase (4) Maturity Cash $78 $33 Revolver ($150mm) – – Nov-19 Senior secured term loan 174 174 Jun-19 Total secured debt $174 $174 Senior unsecured notes 250 250 Jan-23 Total debt $424 $424 Net debt $346 $391 LTM 5/1/16 Adjusted EBITDA $149 $149 Net debt / LTM Adjusted EBITDA 2.3x 2.6x

Our Mission & Vision 28 ▪ Ability to deliver growth and margin expansion in a slow growth economy as a result of commercial, manufacturing and supply chain initiatives ▪ Diverse customer base • Three unique business sales cycles that balance the cyclicality of the non - residential market ▪ Hub and spoke manufacturing network promotes efficiencies and cost control ▪ Significant organic growth opportunities in • Insulated metal panels • Legacy businesses ▪ Differentiated national sales footprint with multiple brands to serve a wide range of markets and end - users ▪ Impressive financial momentum CENTRIA : IMP : Detroit , MI Metl - Span : IMP : East Meadow, NY MBCI : BattenLok : Cypress, TX NCI Investment Highlights

Our Mission & Vision 29 Appendix

Our Mission & Vision 30 Reconciliation of Adjusted EBITDA Consolidated Note : Data shown based on NCI fiscal year end. ( 1) Adjusted EBITDA is defined as net income (loss) before interest expense, income tax expense (benefit) and depreciation and am ort ization, adjusted for items broadly consisting of selected items which management does not consider representative of ongoing operations and certain non - cash items of the Company , including charges for goodwill and other asset impairment and stock compensation. As such, the historical information is presented above in accordance with this definition. The Company discloses Adjusted EBITDA, which is a non - GAAP measure, because it is used by management and provided to investors to provide comparability of underlying operational results . ($ in millions) TTM 2007 2008 2009 2010 2011 2012 2013 2014 2015 Q2'16 Net income (loss) $58.6 $73.3 ($750.8) ($26.9) ($10.0) $4.9 ($12.9) $11.2 $17.8 $33.9 Income taxes 37.9 48.0 (56.9) (13.3) (6.4) 4.1 (8.9) 1.5 9.0 17.2 Interest expense, net 36.5 31.5 28.9 17.8 15.6 16.7 20.9 12.3 28.4 31.8 Depreciation & amortization 34.7 34.8 32.0 29.8 28.4 29.6 36.0 35.9 51.4 49.4 Stock-based compensation 8.6 9.5 4.8 5.0 6.9 9.3 14.9 10.2 9.4 9.3 Goodwill & other intangible asset impairment – – 622.6 – – – – – – – Restructuring and impairment charges – 1.2 15.3 4.6 0.8 (0.0) – – 11.4 10.8 Transaction costs – – 108.7 (0.1) – 6.4 – – – – Lower of cost or market adjustment – 2.7 40.0 – – – – – – – Executive retirement – – – – – 0.5 – – – – Debt extinguishment costs, net – – – – – – 21.5 – – – Gain on insurance recovery – – – – – – (1.0) (1.3) – – Secondary offering costs – – – – – – – 0.8 – – Strategic development and acquisition related costs – – – – – 5.0 – 5.0 4.2 3.1 Unreimbursed business interruption costs – – – – – – 0.5 – – – Embedded derivative – – – (0.9) (0.0) (0.0) (0.1) – – – Pre-acquisition contingency adjustment – – – 0.2 0.3 – – – – – Fair value adjustment of acquired inventory – – – – – – – – 2.4 1.0 Gain from legal settlements – – – – – – – – (3.8) (3.8) Gain on bargain purchase – – – – – – – – – (1.9) Gain on sale of assets and asset recovery – – – – – – – – – (1.7) Adjusted EBITDA (1) $176.2 $201.0 $44.6 $16.1 $35.6 $76.5 $70.9 $75.5 $130.1 $149.2

Our Mission & Vision 31 Reconciliation of Adjusted EBITDA (quarterly) Consolidated ($ in millions) Q1'14 Q2'14 Q3'14 Q4'14 Q1'15 Q2'15 Q3'15 Q4'15 Q1'16 Q2'16 Net income (loss) ($4.3) ($4.9) $6.1 $14.3 ($0.3) ($7.5) $7.2 $18.4 $5.9 $2.4 Income taxes (2.5) (3.1) 2.8 4.2 (0.5) (4.1) 3.5 10.0 2.5 1.2 Interest expense, net 3.1 3.0 3.1 3.1 4.0 8.3 8.1 8.0 7.8 7.8 Depreciation & amortization 8.8 8.9 9.0 9.2 9.7 13.8 14.5 13.4 10.7 10.8 Stock-based compensation 3.2 2.6 2.4 2.0 2.9 2.2 2.6 1.7 2.6 2.5 Restructuring and impairment charges – – – – 1.5 1.8 0.5 7.6 1.5 1.1 Gain on insurance recovery (1.0) (0.3) – – – – – – – – Secondary offering costs 0.7 0.1 – – – – – – – – Strategic development and acquisition related costs – – 1.5 3.5 1.7 0.6 0.7 1.1 0.7 0.6 Fair value adjustment of acquired inventory – – – – 0.6 0.8 1.0 – – – Gain from legal settlements – – – – – – – (3.8) – – Gain on bargain purchase – – – – – – – – (1.9) – Gain on sale of assets and asset recovery – – – – – – – – (0.7) (0.9) Adjusted EBITDA (1) $8.0 $6.3 $25.0 $36.3 $19.6 $15.8 $38.2 $56.4 $29.1 $25.5 Note : Data shown based on NCI fiscal year end. ( 1) Adjusted EBITDA is defined as net income (loss) before interest expense, income tax expense (benefit) and depreciation and am ort ization, adjusted for items broadly consisting of selected items which management does not consider representative of ongoing operations and certain non - cash items of the Company , including charges for goodwill and other asset impairment and stock compensation. As such, the historical information is presented above in accordance with this definition. The Company discloses Adjusted EBITDA, which is a non - GAAP measure, because it is used by management and provided to investors to provide comparability of underlying operational results .

Our Mission & Vision 32 Reconciliation of Adjusted EBITDA (segment breakout) Metal Coil Coating Metal Components Engineered Building Systems ($ in millions) TTM 2014 2015 Q2'16 Income (loss) from operations $24.0 $19.1 $22.2 Depreciation and amortization 4.0 4.4 4.6 Restructuring charges (recoveries) – 0.3 – Gain on insurance recovery (1.3) – – Adjusted EBITDA (1) $26.7 $23.8 $26.8 ($ in millions) TTM 2014 2015 Q2'16 Income (loss) from operations $33.3 $50.5 $69.3 Depreciation and amortization 19.6 35.7 33.6 Restructuring charges (recoveries) - 2.0 2.1 Asset impairments (recoveries) – 5.8 5.8 Fair value adjustment of acquired inventory – 2.4 1.0 Other income (loss) – (0.2) (0.4) Adjusted EBITDA (1) $52.9 $96.2 $111.4 Note : Data shown based on NCI fiscal year end. ( 1) Adjusted EBITDA on a segment basis is defined as income (loss) from operations before depreciation and amortization, adjusted fo r items broadly consisting of selected items which management does not consider representative of ongoing operations and certain non - cash items. As such, the historical information is presented above in accordance with this definition. The Company discloses Adjusted EBITDA, which is a non - GAAP measure, because it is used by management and provided to investors to provide comparability of underlying operational results . ($ in millions) TTM 2014 2015 Q2'16 Income (loss) from operations $32.5 $51.4 $59.5 Depreciation and amortization 10.9 10.3 10.1 Restructuring charges (recoveries) – 2.8 1.7 Gain on sale of assets and asset recovery – – (1.7) Other income (loss) (0.6) (1.6) (0.2) Adjusted EBITDA (1) $42.8 $62.8 $69.4

Our Mission & Vision K. DARCEY MATTHEWS Vice President, Investor Relations E: darcey.matthews@ncigroup.com 10943 N. Sam Houston Pkwy W. Houston, Texas 77064 P.O. Box 692055 Houston, Texas 77269 - 2055 281.897.7788 ncibuildingsystems.com