Attached files
| file | filename |
|---|---|
| 8-K - 8-K - HYSTER-YALE MATERIALS HANDLING, INC. | d205443d8k.htm |
 Solutions to
ENHANCE Performance Investor Presentation August 8, 2016 Solutions to
ENHANCE Performance Exhibit 99 |
 2 Solutions to
ENHANCE Performance Safe Harbor Statement & Disclosure This presentation includes forward-looking comments subject to important risks
and uncertainties.
It may also contain financial measures that do not conform
with accounting principles generally accepted in the United States of America
(GAAP). Refer to Hyster-Yale’s reports filed on Forms
8-K (current), 10-Q (quarterly), and 10-K (annual)
for information on factors that could cause actual results to differ materially from information in this presentation and for information reconciling
financial measures to GAAP. Past performance may not be representative of future results. Guidance noted in the following slides was effective as of the company’s most
recent earnings release and conference call (August 8, 2016). Nothing in
this presentation should be construed as reaffirming or
disaffirming such guidance. This presentation is not an offer to
sell or a solicitation of offers to buy any of Hyster-
Yale’s securities. |
 3 Solutions to
ENHANCE Performance Hyster-Yale Snapshot Hyster-Yale Materials Handling, Inc. (NYSE:HY) designs, engineers, manufactures, sells and services a comprehensive line of lift trucks and aftermarket parts. Separate lift truck, attachments and fuel cell power solutions segments. Headquartered in Cleveland, Ohio Approximately 6,300 employees globally LTM 6/30/16: Revenue – $2.5 billion Net income – $56.4 million EBITDA (1) – $112.7 million ROTCE (1) of 13.5% (Net cash basis) Net debt at 6/30/16 – $99.1 million (1) EBITDA and ROTCE are non-GAAP measures and should not be considered in isolation or as a substitute for GAAP measures.
For discussion of non-GAAP items and the related
reconciliations to GAAP measures, see information in the Appendix starting on page 33. |
 4 Solutions to
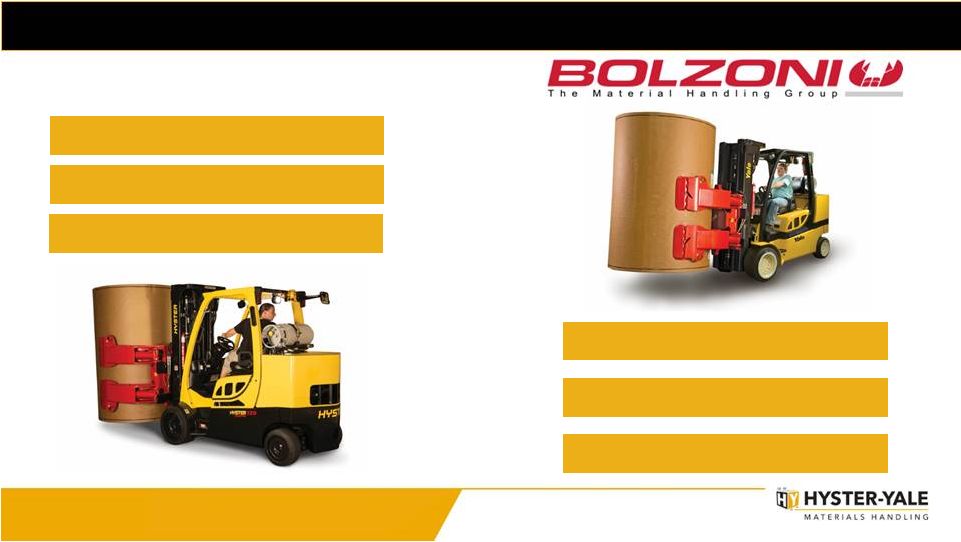
ENHANCE Performance Bolzoni Transaction • Q2 2016 - HY acquired an approximately 94% ownership stake in Bolzoni S.p.A., a leading worldwide producer of
attachments, forks and lift tables under the Bolzoni Auramo and Meyer brand names
• Early July 2016 - remaining interest in Bolzoni acquired and Bolzoni delisted from the Italian stock exchange on 7/6/16 • Aggregate Purchase Price – €108.9 million (approximately $123.1 million) • Primary market is attachments for Class 1 and Class 5 products – currently the majority of revenues are generated in the EMEA market, primarily Eastern & Western Europe. Secondary presence in North America.
• Continuing to operate as a stand-alone business with its own management team and Board of Directors
Helps ensure the integrity of OEM, dealer and customer information is
maintained •
Reported as a separate segment of the business
• Implementation teams put in place to identify additional opportunities to increase revenue and profitability
• Acquisition expected to be accretive to consolidated earnings, after excluding immediate costs of acquisition, estimated
integration costs and non-recurring purchase accounting adjustments
Q2 2016 Revenues -
$38.9 million and net income -
$0.1 million |
 5 Solutions to
ENHANCE Performance Bolzoni Aquisition – Rationale Expand global reach Expand global reach Enhance solutions capabilities Enhance solutions capabilities Leverage excess capacity Leverage excess capacity Insource components Insource components Closer to our customers Closer to our customers Accretive to earnings Accretive to earnings External Internal |
 6 Solutions to
ENHANCE Performance Our Businesses Our Core Lift Truck Business Organic growth through market share gain Our Hydrogen Power Business Rapid growth in emissions free customer applications Our Attachment Business Growth through targeting new markets |
 7 Solutions to
ENHANCE Performance Hyster-Yale Is a Full-Line Lift Truck Supplier… Electric Counterbalanced Rider Trucks Electric Narrow Aisle Trucks Electric Hand Trucks Internal Combustion Engine (cushion tire) Internal Combustion Engine (pneumatic tire) Electric CB 3 wheel Electric 4 wheel Electric Pallet Trucks Stackers Very Narrow Aisle Trucks Order Pickers Reach Trucks Internal Combustion Engine ICE CB Laden Container Handlers Big Trucks Empty Container Handlers Forklifts Reach Stackers CLASS 1 CLASS 2 CLASS 3 CLASS 4 CLASS 5 1.0T to 5.5T 1.5T to 6.0T 1.5T to 8.0T 1.0T to 7.0T 1.0T to 52.0T Warehouse Equipment Over 260 different truck models available |
 8 Solutions to
ENHANCE Performance …with a Full Range of Power Options, and… Electric Counterbalanced Rider Trucks Electric Narrow Aisle Trucks Electric Hand Trucks Internal Combustion Engine (cushion tire) Internal Combustion Engine (pneumatic tire) CLASS 1 CLASS 2 CLASS 3 CLASS 4 CLASS 5 Lead Acid Battery Fuel Cell Engine LPG & Bi-fuel Diesel Tier 3 / Stage III LPG & CNG Diesel Tier 4 / Stage IV Lithium Ion Battery |
 9 Solutions to
ENHANCE Performance … with a Broad Range of Attachments Clamps Multipallets Rotators Sideshifters Fork Positioners Push Pulls Lifting Tables Forks |
 10 Solutions to
ENHANCE Performance Europe 34% China 22% Americas 25% Japan 7% Asia-Pacific 8% Middle East & Africa 4% Lift Truck Industry Overview 872 547 794 975 944 1,010 1,094 1,100 1,115 0 300 600 900 1,200 2008 2009 2010 2011 2012 2013 2014 2015 LTM Q2 2016 (units in thousands) Global Lift Truck Industry Size _____________________ Trend line represents 4.1% long-term CAGR Average Industry Size. Source: WITS. Represents order intake.
Global Lift Truck Industry Breakdown (Units)
Long-term CAGR (2004 –
2015) = 4.1% Global Lift Truck Industry
Size _____________________
Source: WITS. LTM 6/30/16 and LTM 6/30/15 order
intake. Change over Prior Year
Total Americas Brazil EMEA JAPIC 0% +1% -46% +8% -5% Lift Truck Industry – Unit Distribution by Class Class 1 Electric 18% Class 2 Electric 10% Class 3 Electric 34% Class 4 ICE 3% Class 5 ICE 35% _____________________ Source: WITS. LTM 6/30/16 Orders Reports. ICE = Internal Combustion Engine Total Industry = 1,115k Units Class 4 ICE 5% Market Size - $ _____________________ Source: Internal Company estimates Market Size - Size Class 5 ICE 55% Class 1 Electric 19% Class 2 Electric 12% Class 3 Electric 9% Estimated Industry Revenue Mix _____________________ Source: WITS. LTM 6/30/16 Orders Reports. |
 11 Solutions to
ENHANCE Performance Lift Truck Business Target Economics Goal and Gap to Target 7% Goal Achieve minimum operating profit margin of 7% at the peak of the current market cycle and 7% at mid-cycle of the next market cycle Target Economics gap closure can be achieved with unit volume… Stronger Industry + Share Growth = Volume Leverage LTM 6/30/16 Gap to Target Economics Actual Lift Truck Operating Profit Margin % 4.1% Margin Variances (0.5%) Unit margin (0.5%) Parts/other (0.0%) Volume Variances 3.4% Manufacturing variances/other 1.5% Operating Expenses 1.9% Lift Truck Operating Profit Margin % Gap 2.9% Lift Truck Operating Profit Margin % Target 7.0% |
 12 Solutions to
ENHANCE Performance Leverage Gained from Moving Volume to Full Manufacturing Capacity 28,500 units of additional volume $700 - $800 million of additional revenue & $80 million of operating profit $30 - $35 million fixed cost absorption by moving from current capacity utilization to full utilization of our manufacturing capacity $40-$45 million by meeting target economics in standard margin net of increased SG&A spread over more units At Full Capacity: 115,000 units / year Expected over next 3 – 4 years 76% 24% Capacity Used Unused |
 13 Solutions to
ENHANCE Performance 13 Over the Remainder of this Market Cycle, Target Volumes Driven by…
Share growth of approx. 1.9% pts
> Strategic initiatives
> Share growth is expected to be
approximately 70% of volume
increase required
> Market and product mix may be headwinds
100 200 300 400 500 2009 2010 2011 2012 2013 2014 2015 2016* EMEA Industry 50 100 150 200 250 300 2009 2010 2011 2012 2013 2014 2015 2016* Americas Industry Growth of 10-15% by 2019-2020** Growth of 5-10% by 2019-2020** 150 250 350 450 2009 2010 2011 2012 2013 2014 2015 2016* Asia Industry Growth of 10-15% by 2019-2020** * First 6 months of 2016 Annualized **Growth is from 2015 levels Actual Actual Actual Prior Peak Prior Peak Prior Peak |
 14 Solutions to
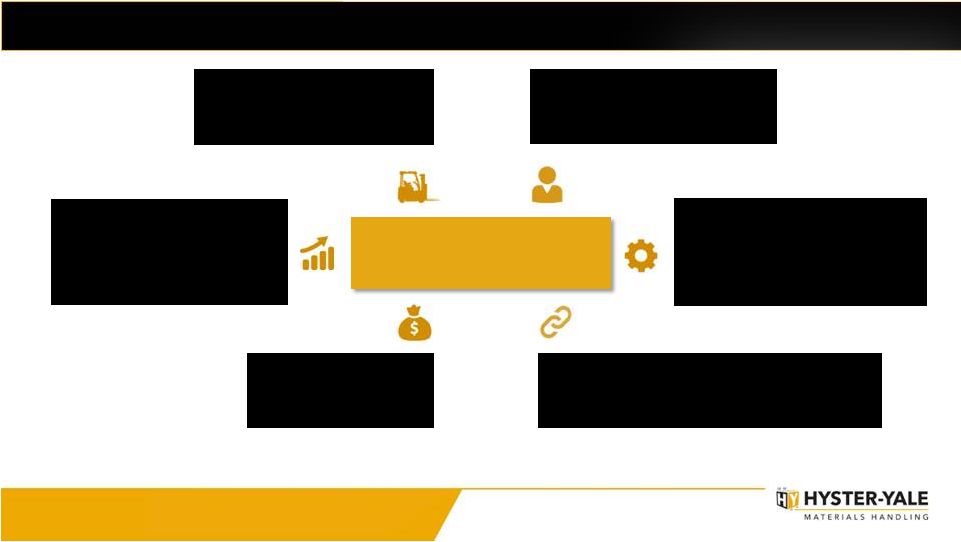
ENHANCE Performance Hyster-Yale’s Economic Engine & Core Strategic Initiatives
Basic Business Areas Our strategies are designed to drive increased share, which in turn increases the lift truck population, which drives parts and service volumes. Geographic and Product Balance Worldwide Distribution Strength to Drive Market Share Parts and Service Volume Large Lift Truck Population in Service Volume Economies of Scale Design Component Commonality Supply Chain Manufacturing Quality Marketing Parts Infrastructure Capital Requirements Improve Warehouse Position Enhance Independent Distribution Succeed in Asia Enhance Big Truck Market Position Strengthen the Sales and Marketing Organization Low Cost of Ownership Understand Customer Needs Hyster-Yale’s economic engine is driven by increasing unit volume and economies of scale. Core strategic initiatives were
designed to drive the economic engine by increasing
share... Commercialize
Nuvera’s
Technology
A large lift truck population base drives parts and service volume
resulting in enhanced profitability for dealers and Hyster-Yale |
 15 Solutions to
ENHANCE Performance Early Stage Mid-Stage Achieved Breakthrough Understand Customer Needs Low Cost of Ownership Enhance Independent Distribution Improve Warehouse Position Succeed in Asia Enhance Big Truck Market Position Strengthen Sales and Marketing Organization Commercialize Nuvera’s Fuel Cell Technology Our core strategic initiatives are in various stages of maturity. Share gain is expected
to take place as they gain
momentum… Core Strategic Initiatives – Stages of Momentum |
 16 Solutions to
ENHANCE Performance Core Lift Truck Strategic Initiatives Update Strategic Objective Implementation Highlights • Provide the right product and solution to meet the specific needs of different customers across multiple industries • Increasing penetration of the Metals, Trucking and Paper segments • Gained conquest business at several large trucking accounts • Introduced efficient battery extraction solutions for electric truck products in Europe • Strengthening competency for special engineered solutions through dedicated resources Initiative Understand Customer Needs Strategic Objective Implementation Highlights • Deliver lowest cost of ownership for all of our customers based on their specific application Initiative Low Cost of Ownership • Launching XT/MX Series 2-3 Ton ICE standard truck • Acquisition of global distribution rights, excluding Australia, of telematics solution • Strategic partnerships for enhanced automated solutions • Introduced industry's first UL rated Lithium-ion battery for pedestrian pallet trucks Outcome: Win in Targeted Major Accounts and Applications Outcome: Competitive Advantage across Product Segments Key Elements • Segmentation of products and industries • Development of Utility, Standard and Premium products • Range of options to match needs of different industries • Targeted sales and marketing effort Key Elements • Understand major cost drivers: Direct (truck price, fuel, service, operator, uptime) Indirect (safety, litigation, pollution) • Implement right solutions for lower costs • Automated product solutions |
 17 Solutions to
ENHANCE Performance Core Lift Truck Strategic Initiatives Update Strategic Objective Implementation Highlights • Develop the strongest independent, exclusive dealer network Initiative Enhance Independent Distribution Strategic Objective Implementation Highlights • Strengthen penetration of the growing warehouse segment Initiative Improve Warehouse Position • Completed a major restructuring of part of the North America network that included a competitor dealer conversion • Growth of our dual brand coverage in North America • 6 new dealers appointed in EMEA since the beginning of 2015 and 3 new dealers appointed since the beginning of 2016 • Resources: Adding industry-focused direct salespeople
and solutions and application center expertise
• Capability: New products, enhanced selling tools and trained dealers • Products: Targeted solutions for retail applications to
enhance productivity and operations
• Results: Winning business in 5 out of the top 10 US
retailers’ distribution centers
Outcome: Best Distribution Channels in the Industry
Outcome: Be a Top Tier Global Competitor in Warehouse
Key Elements
• Develop all dealers • Appoint / convert successful dealers • Expand number of dual line dealers • Enhance dealer value proposition • Combine dealer entrepreneurship with OEM support Key Elements • Enhance product ranges • Unique innovations • Continuous quality improvement • Develop stronger direct sales capabilities • Develop dealer resources and specialization • Enhance marketing services and support |
 18 Solutions to
ENHANCE Performance Core Lift Truck Strategic Initiatives Update Strategic Objective Implementation Highlights Initiative Succeed in Asia Strategic Objective Implementation Highlights Initiative Enhance Big Truck Market Position • 2 new dealers appointed in China since the beginning of 2016 • Direct sales support on large accounts • Additional Big Truck sales by leveraging global metals industry expertise • Launched additional UTILEV products in 2015 • Conquest accounts won • Customer driver experience and demonstration center fully operational • Record year in 2015 for overall Big Truck shipments • In EMEA, continued growth in 2016 in container handler and forklift bookings with strong performance in Empty Container Handlers • Expand market penetration throughout Asia • Increase leading market position and become vendor of choice in Big Truck segment Outcome: Increase Share and Strengthen Distribution at Accelerated Pace
Outcome: Enhance leading market position in Big Trucks
Key Elements
• Organic growth through development of dealer network and direct selling capabilities • Development of long-term strategic partnerships • Development of right products • Development of support infrastructure Key Elements • New products • Business unit concept in each region • Global team coordination • Focus on industry and solutions • Success with large port operators • Comprehensive Tier 4 offering |
 19 Solutions to
ENHANCE Performance Core Lift Truck Strategic Initiatives Update Strategic Objective Implementation Highlights Initiative Strengthen Sales and Marketing Organization • Recruited experienced individuals with deep knowledge of the lift truck business • Added expertise in dealer management, account identification and coverage, financial merchandising and solutions development • Added expertise to focus on implementing standard sales processes in our independent dealers • Expanded investment in National and Major Account sales and support - winning conquest accounts • Increased global collaboration to maximize efficiencies and effectiveness • Strengthen and align sales and marketing organization in all geographic regions Outcome: Gain momentum leading to higher unit volumes and enhanced market share
Key Elements
• Greater accountability for results through smaller sales management areas • Leaders provided with new tools and enhanced reporting capabilities • Solutions Organization integrates Engineering and Special Product Engineering (SPED) function with Sales and improves Technical Sales Support • Major focus on account identification and coverage • Implementing new sales approach with appropriate tools to enhance solutions selling skills |
 20 Solutions to
ENHANCE Performance 20 Nuvera Hydrogen Power Business Strategic Objective Key Elements Initiative Commercialize Nuvera’s Fuel Cell Technology • Enables active participation in the growing hydrogen and fuel cell market • Integration of Nuvera’s technology into HY’s lift truck product range • Adds another power solution to robust complement of power solutions • Reinforces core strategies: provides opportunity to meet customers’ needs, drives market share, enhances margins and offers low overall cost of ownership alternative Outcome: Successfully create an integrated fuel cell power solution option for customers
• Commercialize Nuvera’s technology through introduction of new fuel cell and improved hydrogen generation products to enhance our lift truck business value proposition and to support other share gain initiatives • Expand power solution options for customers • Develop fuel cell engine family allowing integrated solutions for lift trucks and other OEMs Implementation Highlights • Secured first total power solution agreement in Q4 2015 • Shipment of PowerEdge ® units, lift trucks and PowerTap ® system began in mid-2016 • Completed several successful PowerEdge ® proof-of-performance tests at customer facilities • Exploring fuel cell engine integration with multiple OEMs. Synergies identified with Hyster-Yale requirements. |
 21 Solutions to
ENHANCE Performance Hydrogen Power for Lift Trucks Hyster-Yale acquired Nuvera in December 2014 and intends to use the technology to offer
its customers a unique and value-creating packaged total power
solution. Advantages and Opportunities
Limited Maintenance
Emissions Free
Scalable Solution
Constant Power
Rapid Refueling
Emerging Market
Adoption by Major
Users |
 22 Solutions to
ENHANCE Performance The Hydrogen Power Market 25-50% N. America Lift Truck Market electric trucks sold per year 150,000+
Estimated up to
can benefit from
Fuel Cell solutions
Source: David Greene et. al., Status and
Outlook for the U.S. Non-Automotive Fuel Cell Industry: Impacts of Government Policies and Assessment of Future Opportunities, Oak Ridge National Laboratory, May 2011 (ORNL/TM-2011/101). Fuel Cell Power penetration projected to triple by 2025 ling and changing batteries * Depending on application Economics Significant ROI* Productivity Increase Time saved refueling and changing batteries Asset Utilization Convert charging room to usable space & improve truck utilization Constant Power Power throughout shift and improved truck electronic life Environmentally Clean Minimal carbon footprint and zero indoor emissions Global Lift Truck Market 650,000+
electric trucks sold
per year |
 23 Solutions to
ENHANCE Performance The Nuvera Total Power Solution PowerTap ® Hydrogen Generation PowerEdge ® Fuel Cell Orion ® Fuel Cell Engine Total Power Solution Hydrogen Refueling Low fixed costs ideal for small to medium size fleets Scalable Onsite generation Current: ideally suited to lift truck customer Next Generation: Leap in power density & efficiency opens opportunities Engine |
 24 Solutions to
ENHANCE Performance Capturing More Lifecycle Value Truck Truck Hyster-Yale Maint Maint HY/Dealer Energy Energy Utility Company Fuel (PowerTap®) Fuel (PowerTap®) Energy Energy Utility Company Nuvera/Dealer PowerEdge® PowerEdge® Nuvera Maint Maint HY/Dealer Truck Truck Hyster-Yale Lead Acid Battery* PowerEdge ® Solution* *Representative Total Cost of Operation based on NREL 2013 report Batteries & Charger Batteries & Charger Battery Supplier Eligible for 30% US Tax Credit (1) Eligible for 30% US Tax Credit (1) _____________________ (1) Currently set to expire on 1/1/17 Batteries $18-20k lifetime spend ($12k for 3 batteries / $6- 8k for 1 charger) |
 25 Solutions to
ENHANCE Performance The Nuvera Story Our Hydrogen Power Business Why Hydrogen • Purchased for a small investment • Investing pre-tax expense dollars to commercialize fuel-cell technology • Solutions span Hydrogen Value Chain • Strong IP / Patent portfolio • Pipeline of new technologies • Rapid usage development in major user fleets • Provides strong base for entry into other industries • Growing interest from OEM’s • Nuvera’s association with HY provides: Industry and customer expertise Leverage strong distribution channels Financial stability Financing options through HYG Financial Services Product validation process Supply chain leverage and expertise Simplified transaction – single supplier • No longer one player niche market • Growing core power source alternative for lift trucks |
 26 Solutions to
ENHANCE Performance The Nuvera Plan • Develop PowerEdge ® units for electric lift trucks • Build commercial capabilities • Build strong links to HY distribution • First PowerEdge ® units shipped mid- 2016 • Mean time between failure (MTBF) improvements to PowerTap ® PT 50 • Hercules TM and Orion ® 2 technology development • Financing package through HYG Financial Services • Customer’s receptive to Hyster-Yale competitive strengths • Hyster-Yale dealer engagement (launched to sales force in April 2016) • Proof of Performance PowerEdge ® programs • Turnkey Total Power Solution • Build customer-based industry and application solutions • Strengthening supply chain • Cost reduction engineering • Hercules TM and Orion ® 2 product development • Development of increased capacity PowerTap ® concept Phase 1 2016 Phase 1 2016 Phase 3 2017 – 2018 Phase 3 2017 – 2018 Phase 2 2016 – 2017 Phase 2 2016 – 2017 • Break-even operating profit at 700 PowerEdge ® and 10 PowerTap ® units per quarter at target margins • Develop synergistic OEM partner opportunities • Launch Hercules TM and Orion ®
2 • Integrated fuel cell engines for full range of Hyster-Yale products • Capture full aftermarket potential • Launch increased capacity PowerTap ® |
 27 Solutions to
ENHANCE Performance 2016 Second Quarter Highlights • Acquisition of 100% of Bolzoni S.p.A completed on July 6, 2016 • Gains made in warehouse market strategic initiative but shift in mix of products reduced revenues • Weak Brazil market performance and weakening North America and Asia Big Truck markets negatively affected revenues and operating profit • Bolzoni reported revenues of $38.9 million and net income of $0.1 million for Q2 2016 2016 Second Quarter Highlights Short-term Outlook 2016 Second Quarter LTM 6/30/16 Consolidated Revenue $645.6 100.0% $2,546.9 100.0% Lift Truck Operating Profit 19.0 2.9% 102.7 4.1% Bolzoni Operating Profit 0.7 0.1% 0.7 - Nuvera Operating Loss (8.3) (1.3)% (27.1) (1.1)% Consolidated Operating Profit $11.4 1.7% $76.3 3.0% Consolidated Net Income $8.3 1.3% $56.4 2.2% EBITDA $23.3 3.6% $112.7 4.4% ($ in millions) • Global lift truck market in H2 2016 expected to be comparable to H2 2015
• H2 2016 lift truck revenues expected to be comparable to H2 2015 • Lift truck net income in H2 2016, especially Q3 2016, expected to be lower than H2 2015 - increase in volumes more than offset by shift in sales mix to lift trucks with lower average profit margins, higher SG&A
expenses and unfavorable manufacturing variances.
• Bolzoni net income expected to gradually increase in Q3 and Q4 2016 compared with Q2 2016 • Nuvera H2 2016 operating loss expected to be $14 - $16 million |
 28 Solutions to
ENHANCE Performance 28 Valuation Approach By Business Lift Truck and Attachment Businesses Lift Truck and Attachment Businesses Hydrogen Power Business Hydrogen Power Business Board Oversight as Separate Businesses Incentives Tied to Individual Businesses Strong Operating Cash Generation Market Leading Products and Position Mature Cyclical Industry Value using Traditional Valuation Model of EBITDA Multiple on a Net Debt Basis Developing / Technology Industry Distinct Technology / Patents in Fuel Cell and Hydrogen Generation Operating Cash Invested in New Product Commercialization / Ramp Up Value as Venture Business with Developed Technology |
 29 Solutions to
ENHANCE Performance Our Competitive Advantages • Able to meet customers needs globally • Global economies of scale • Young/ fresh product line • Broad array of power options • Fuel cell power options • Source of aftermarket profitability • Barrier to entry Global Full Product Line Field Population Dealer Relationships • Independent distribution model • Exclusive distribution • Combine OEM excellence with entrepreneurial distribution focused on customer • Long relationships • Able to meet most needs • National Account programs Customer Relationships • High performance metrics • Large fleet program Aftermarket Support Employee Relationships • Engaged workforce • Experienced leadership • Equal treatment • High return for our stockholders • Low capital employed structure • Partnership relationships to limit capital needs Strong Return on Capital |
 30 Solutions to
ENHANCE Performance 30 HYSTER-YALE HYSTER-YALE A Solid Investment Option Strong Balance Sheet Cash Generation & Commitment to Shareholder Return Investment & Growth in Game Changing Technologies Leading Products & Market Position Strategies to Gain Share in Growth Segments & Markets Customer Focused & Solutions Oriented |
 31 Solutions to
ENHANCE Performance Hyster-Yale Use of Cash Priorities Return Cash to Stockholders Investments in Adjacent or Complementary Businesses Investments in Hydrogen Power Business Investments in Share Gain Programs Investments in Core Lift Truck Business Strategic initiatives to accelerate growth or enhance margins Acquisitions of technologies and other forklift-related businesses 2014 2015 2016 Annual Dividends (1) $17.8m $1.10/share $18.4m $1.14/share $9.5m YTD $1.18/share 2012 to 2014 Share Buyback $49.8m / 694,653 shares of Class A common stock Investments to commercialize Nuvera’s technology (1) Dollars represent total dividends paid during calendar year, while dividend per share represents the annualized dividend rate after each
May increase in 2014, 2015 and 2016 |
 Solutions to
ENHANCE Performance Appendix |
 33 Solutions to
ENHANCE Performance Non-GAAP Disclosure Adjusted Lift Truck Business Operating Profit, EBITDA and return on total capital employed are not measurements under U.S. GAAP, should not be considered in isolation or as a substitute for GAAP measures, and are not necessarily comparable with similarly titled measures of other companies. Hyster-Yale defines each as the following: Adjusted Lift Truck Business Operating Profit is defined as Lift Truck Operating Profit, as reported, adjusted for the pre-tax effect of the $17.7 million gain on sale from the Brazil land and facility in 2014; EBITDA is defined as income before income taxes and noncontrolling interest income (loss) plus net interest expense and depreciation and amortization expense; Return on total capital employed (“ROTCE”) is defined as net income before interest expense, after tax, divided by average capital employed. Average capital employed is defined as average stockholders’ equity plus average debt less average cash. For reconciliations from GAAP measurements to non-GAAP measurements, see the following pages. |
 34 Solutions to
ENHANCE Performance Non-GAAP Reconciliation _____________________ ($ in millions) Year Ended December 31 Qtr. 2012 2013 2014 2015 6/30/2016 6/30/2016 Reconciliation of EBITDA Net income attributable to stockholders $ 98.0 $ 110.0 $ 109.8 $ 74.7 8.3 $ $ 56.4 Noncontrolling interest income 0.1 0.2 0.4 0.4 - 0.1 Income taxes provision 7.0 17.2 39.9 29.4 3.5 21.6 Interest expense 12.4 9.0 3.9 4.7 2.0 5.5 Interest income (1.5) (1.8) (1.1) (1.5) (0.7) (2.0) Depreciation and amortization expense 28.0 30.2 29.7 28.9 10.2 31.1 EBITDA $ 144.0 $ 164.8 $ 182.6 $ 136.6 23.3 $ $ 112.7 Trailing 12 Months Note: EBITDA in this investor presentation is provided solely as a supplemental disclosure with respect to operating results.
EBITDA does not represent net income, as defined by U.S. GAAP and should not be considered as a substitute for net income or net loss, or as an indicator of operating performance. The Company defines EBITDA as income before income taxes and noncontrolling interest income
(loss) plus net interest expense and depreciation and amortization expense. EBITDA is not a measurement under U.S. GAAP and is not necessarily comparable with similarly titled measures of other companies. |
 35 Solutions to
ENHANCE Performance Non-GAAP Reconciliation (continued) _____________________ Note: Return on capital employed is provided solely as a supplemental disclosure with respect to income generation because
management believes it provides useful information with respect to earnings in a form that is comparable to the Company’s cost of capital employed, which includes both equity and debt securities, net of cash. ($ in millions) Reconciliation of Return on Total Capital Employed (ROTCE) LTM 6/30/16 Average Stockholders' Equity (6/30/16, 3/31/16, 12/31/15, 9/30/15, and 6/30/15)
$472.2
Average Debt (6/30/16, 3/31/16, 12/31/15, 9/30/15, and
6/30/15) 73.5
Average Cash (6/30/16, 3/31/16, 12/31/15, 9/30/15, and
6/30/15) 111.8
Average capital employed
$433.9 Net income $56.4 Plus: Interest expense, net 3.5 Less: Income taxes on interest expense, net at 38% (1.3) Actual return on capital employed = actual net income before interest expense, net, after tax
$58.6 Actual return on capital employed percentage 13.5% |
 36 Solutions to
ENHANCE Performance Cash Flow before Financing Calculation Trailing 12 Months ($ in millions) Year Ended December 31 2011 2012 2013 2014 2015 6/30/2016 Reconciliation of Cash Flow before Financing Net cash provided by operations $54.6 $128.7 $152.9 $100.0 $89.4 $69.3 Net cash used for investing activities (15.9) (19.5) (26.1) (44.4) (31.3) (137.8) Cash Flow before Financing $38.7 $109.2 $126.8 $55.6 $58.1 ($68.5) |
 Supplemental Information Solutions to
ENHANCE Performance |
 38 Solutions to
ENHANCE Performance The History of Hyster-Yale and its brands Hyster founded in Portland, Oregon as the Willamette Ersted Company 1929 1944 Company name officially changed to Hyster Company 1875 Yale Lock Mfg. broadens its scope into materials handling 1963 Yale forklift truck business merges with Eaton Mfg. Industrial Truck Division 1971 Yale forges a partnership with Sumitomo Ltd 1989 1989 Hyster and Yale merge to form NACCO Materials Handling Group (NMHG) 2012 2012 1985 Yale acquired by NACCO Industries 1989 Hyster acquired by NACCO Industries Hyster-Yale formed as independent public company following spin-off by NACCO
2011 2011 NMHG introduces the UTILEV lift truck for the utility segment of the market 2014 2014 NMHG, HY’s operating company, acquires Nuvera to enter the fast-growing hydrogen fuel
cell market 2016 2016 2016 2016 NMHG renamed Hyster-Yale Group HY completed acquisition of 100% of Bolzoni S.p.A. |
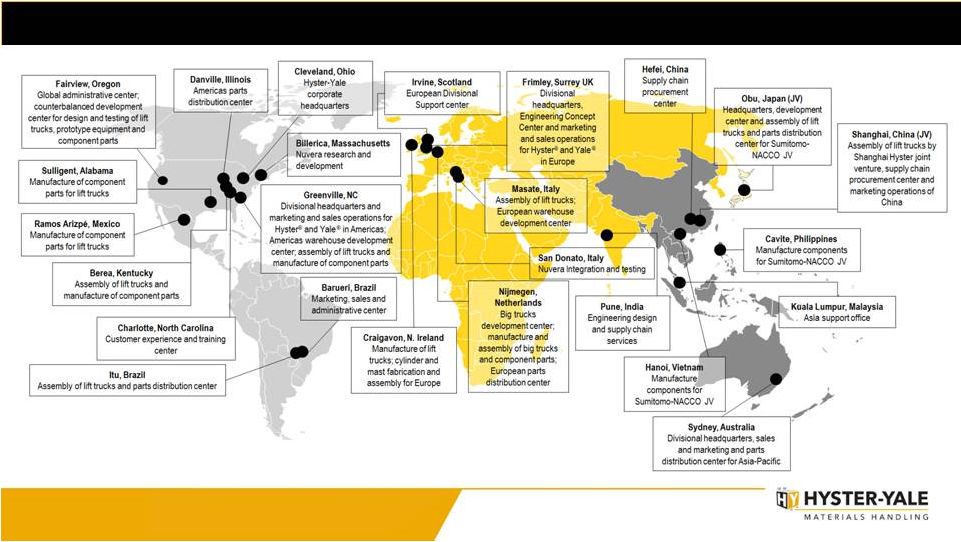 39 Hyster-Yale Global Footprint (excludes Bolzoni locations) Solutions to
ENHANCE Performance |
 40 Solutions to
ENHANCE Performance Bolzoni Global Footprint 7 Manufacturing plants 11 Commercial branches 1 Financial Holding 3 affiliated company …. and more than 20 distributors |
 41 Solutions to
ENHANCE Performance Historical Consolidated Revenue $2,057 $2,400 $2,489 $2,720 $2,824 $1,475 $1,802 $2,541 $2,469 $2,666 $2,767 $2,578 $2,547 $0 $1,000 $2,000 $3,000 2004 2005 2006 2007 2008 2009 2010 2011 2012 2013 2014 2015 LTM 2016 ($ in millions) |
 42 Solutions to
ENHANCE Performance _____________________ (1) Lift Truck Segment Operating Profit, as reported (2) Adjusted Lift Truck Segment Operating Profit, which excludes a $17.7 million pre-tax gain on the sale of the Brazil land and
facility, is a non-GAAP measure and should not be considered in isolation or as a substitute for the GAAP measure. Management believes that this measure assists the investor in understanding the results of operations. For discussion
of non-GAAP items and the related reconciliations to GAAP measures, see information in the Appendix starting on page 33. ($ in millions) 2.9% Gap Closure Prior Cycle Market Peak Mid-Cycle Market Lift Truck Business Operating Profit Trends and % of Sales 7% TARGET $57.5 $111.7 $134.4 $133.3 $128.1 $102.7 2.1% 4.5% 5.0% 4.8% 5.0% 4.1% 2.0% 3.0% 4.0% 5.0% 6.0% 7.0% $25.0 $50.0 $75.0 $100.0 $125.0 $150.0 2007 2012 2013 2014 2015 LTM 2016 $151.0 (1) (2) 5.5% |
 43 Solutions to
ENHANCE Performance Our Business Has Been Transformed Comprehensive, updated product line Average product age since last upgrade – less than 4 years Designed to meet customer needs and provide low overall cost of ownership Multiple power solutions to meet performance, cost, and environmental needs Product Range Product Range Manufacturing Manufacturing Globally integrated, lean operations with economies of scale Assembled in market of sale Continuous efficiency improvements DFT implementation globally |
 44 Solutions to
ENHANCE Performance Our Business Has Been Transformed Centralized supply chain management Highly flexible low cost supply chain 30%+ low cost country sourcing Concentrated supplier base Intense focus on supplier quality Supply Chain Supply Chain Aftermarket Aftermarket Quality Quality Customer driven programs North America’s product quality has steadily improved over the last five years Model Year upgrades High first time fill % Comprehensive all makes parts program Strong Fleet management program Telematics solutions across product line |
 45 Solutions to
ENHANCE Performance Manufacturing 23% Wholesale Distribution 13% Food & Beverage 12% Rental 9% Home Centers/ Retail 18% Freight & Logistics 11% Paper 5% Other 9% Lift Truck Overview and Sources of Revenue • Leading global lift truck manufacturer in terms of units sold – #3 globally in 2015 – Large installed base that drives parts sales Over 830,000 units worldwide – Sales of 86,900 units in 2015 – Sales of >4,700 units at SN JV in 2015 2015 Worldwide Sales by Product 2015 Sales by Geography Americas 69% Europe, Africa & Middle East 24% Asia-Pacific 8% Internal Combustion Engine Units (2) 52% Electric Units 30% Parts 13% Other 5% 2015 Retail Shipments by End Market (1) _____________________ (1) Represents Hyster-Yale North American unit shipments by industry. (2) Includes Big Truck sales that represent 12.3% of total sales. Key Highlights Key Highlights • Diverse customer and application base • Global independent dealer network • Comprehensive, updated global product line • Globally integrated operations with economies of scale • Experienced management team |
 Distribution Channel Strength and Diverse Customer Base
Blue Chip Customer Base
Blue Chip Customer Base
Over 1,100
global dealer
locations More than 2,800 application consultants Over 11,500 service technicians National Accounts Profile National Accounts Profile Independent Dealer Network Independent Dealer Network • Focused on strategic customers with centralized purchasing and geographically dispersed operations across dealer territories • Fleet Management Program provides customers with value-added services that include service, aftermarket parts and comprehensive management of materials handling needs • Two brand network strategy optimizes local presence and customer reach • Key differentiating factors: • Long-term relationships with dealers • Territorial exclusivity encourages strong, long-term relationships with customers • Brand exclusivity ensures dealers’ selling efforts focused on Hyster-Yale products Independent Dealers 84% National Accounts 16% Distribution Mix 46 Solutions to
ENHANCE Performance |
 47 Solutions to
ENHANCE Performance Our Long-Term Philosophy Long-term growth Long-term shareholders Shareholder protection Senior management incentivized as long-term shareholders Increase shareholder value Return on Capital Employed and Market Share Increase focus |