Attached files
| file | filename |
|---|---|
| 8-K - 8-K - Clifton Bancorp Inc. | d238506d8k.htm |
Clifton Bancorp Inc. “Taking The Stage” Annual Meeting of Stockholders August 10, 2016 Exhibit 99.1
AGENDA CSBK Mission Fiscal Year 2016 Accomplishments CSBK Performance Trends Strategic Road Map
CSBK COMPANY MISSION We all have the same job: Ensuring CSBK is the choice our employees, customers and stockholders would enthusiastically make again.
FY 2016 ACCOMPLISHMENTS Commercial loan growth and overall portfolio diversification Deposit gathering success through focus on existing customers, digital millennials, small and midsize businesses and expanding commercial loan relationships Completion of new concept Banking Center in Hoboken, NJ; deposit growth on-track Branch Transformation Sales training provided for Banking Center staff Performance metrics identified and goals established “Teller” position eliminated, replaced with “Client Service Specialist”
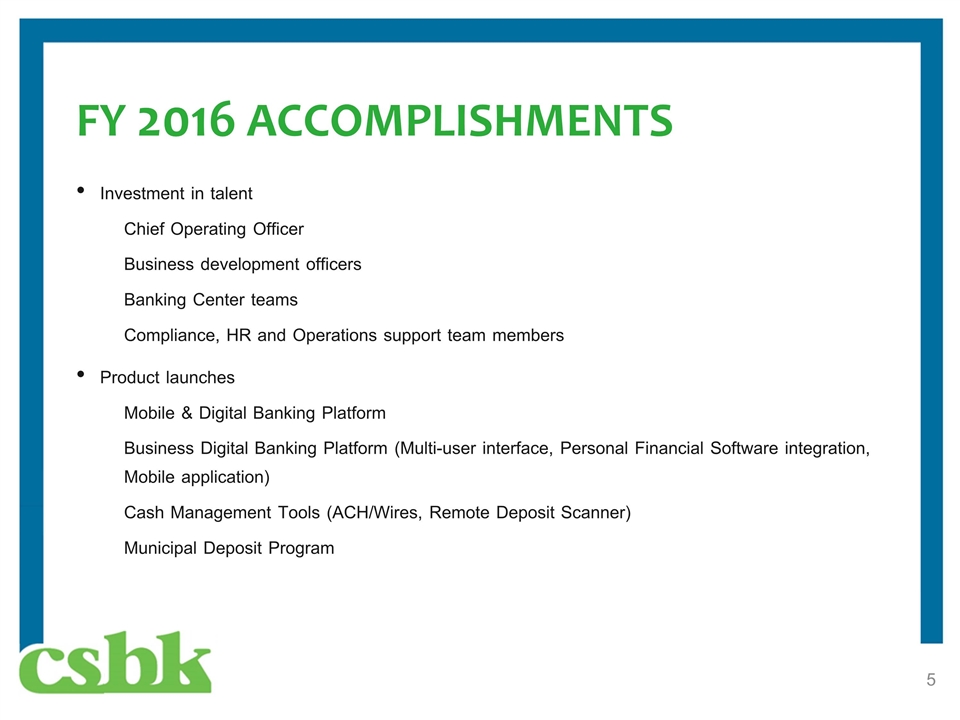
FY 2016 ACCOMPLISHMENTS Investment in talent Chief Operating Officer Business development officers Banking Center teams Compliance, HR and Operations support team members Product launches Mobile & Digital Banking Platform Business Digital Banking Platform (Multi-user interface, Personal Financial Software integration, Mobile application) Cash Management Tools (ACH/Wires, Remote Deposit Scanner) Municipal Deposit Program
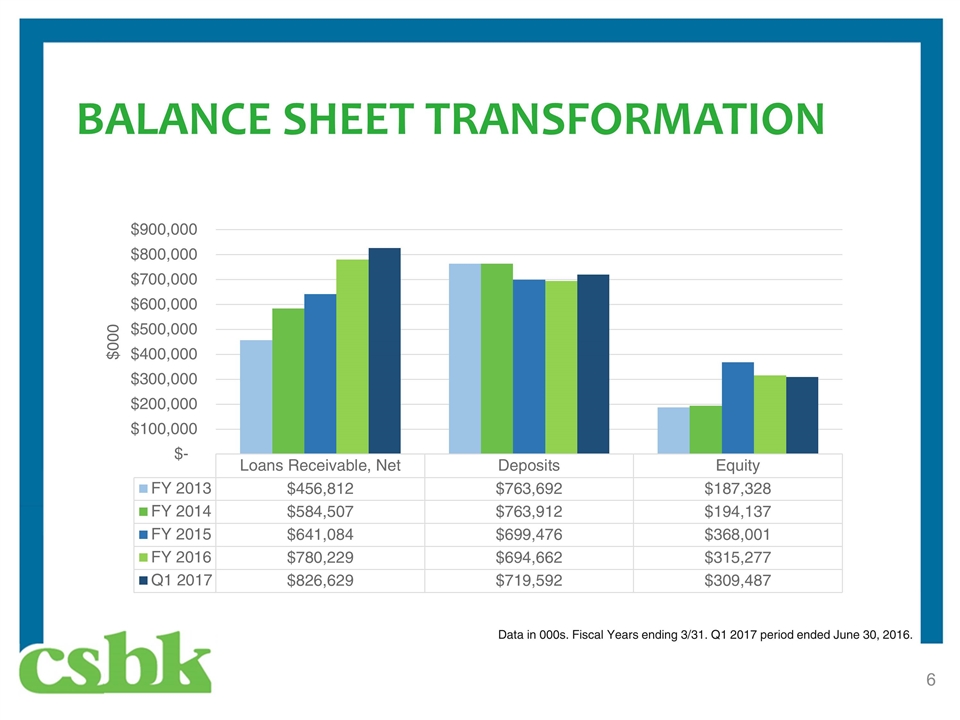
BALANCE SHEET TRANSFORMATION Data in 000s. Fiscal Years ending 3/31. Q1 2017 period ended June 30, 2016.
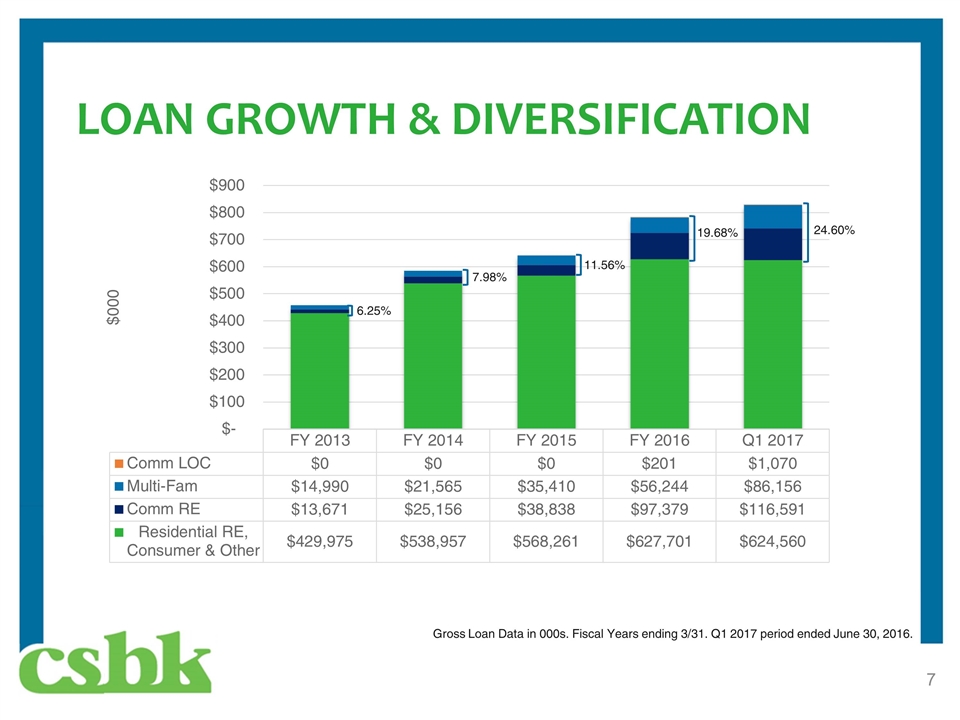
LOAN GROWTH & DIVERSIFICATION Gross Loan Data in 000s. Fiscal Years ending 3/31. Q1 2017 period ended June 30, 2016. 24.60% 19.68% 11.56% 7.98% 6.25%
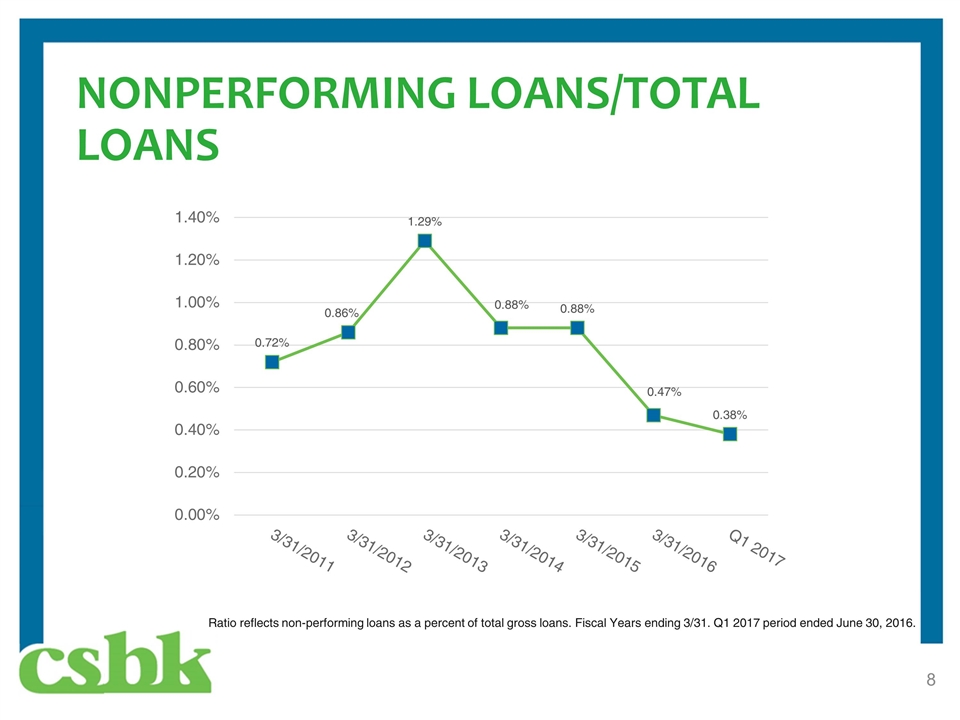
NONPERFORMING LOANS/TOTAL LOANS Ratio reflects non-performing loans as a percent of total gross loans. Fiscal Years ending 3/31. Q1 2017 period ended June 30, 2016.
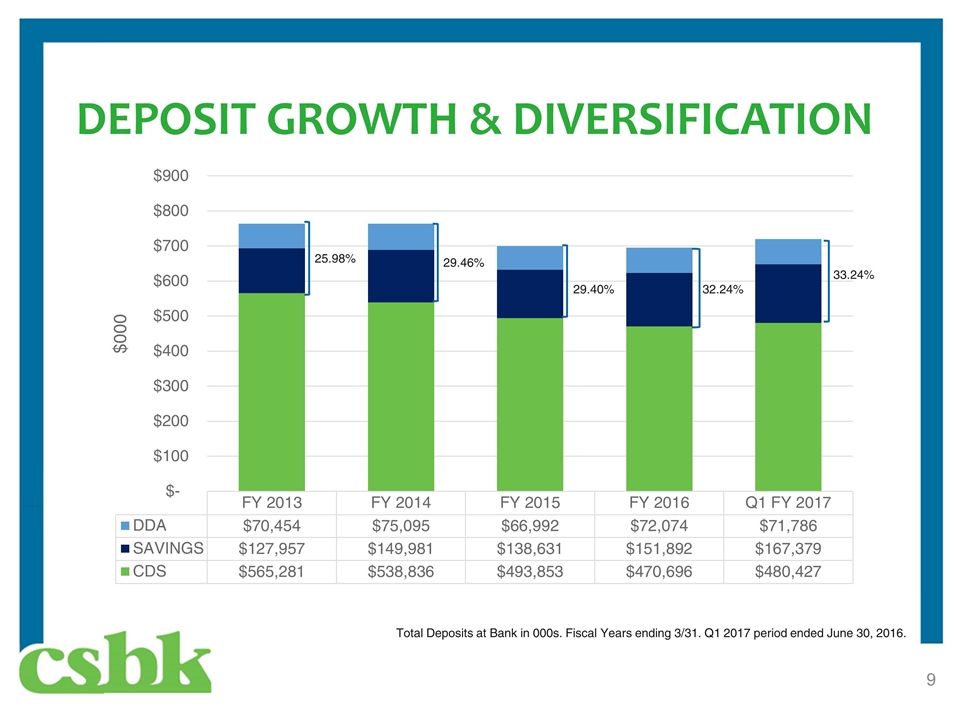
DEPOSIT GROWTH & DIVERSIFICATION Total Deposits at Bank in 000s. Fiscal Years ending 3/31. Q1 2017 period ended June 30, 2016. 33.24% 32.24% 29.40% 29.46% 25.98%
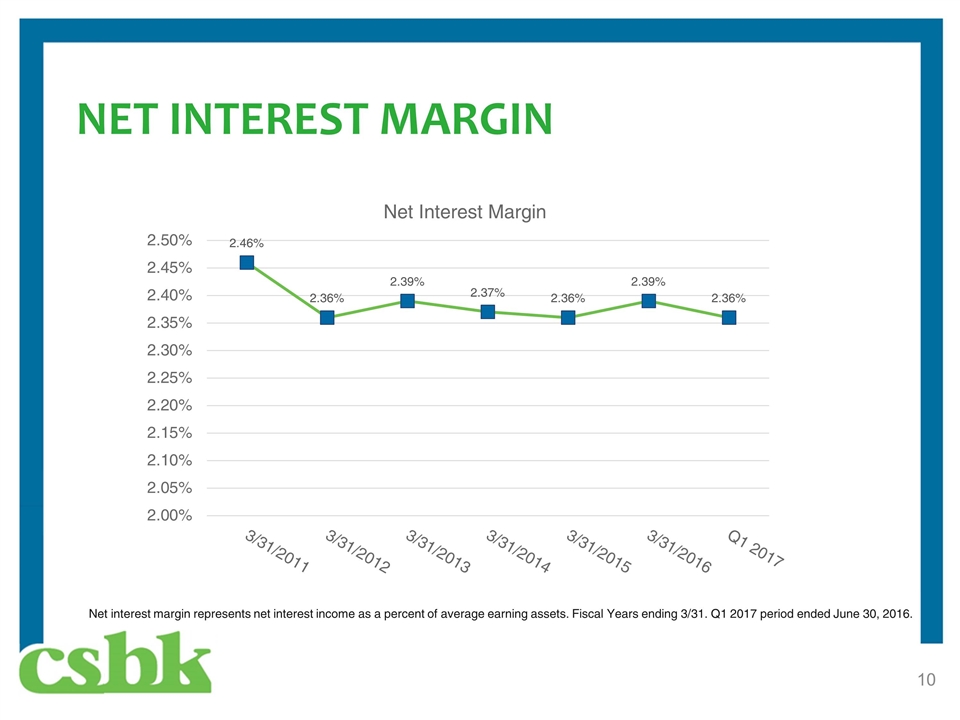
NET INTEREST MARGIN Net interest margin represents net interest income as a percent of average earning assets. Fiscal Years ending 3/31. Q1 2017 period ended June 30, 2016.
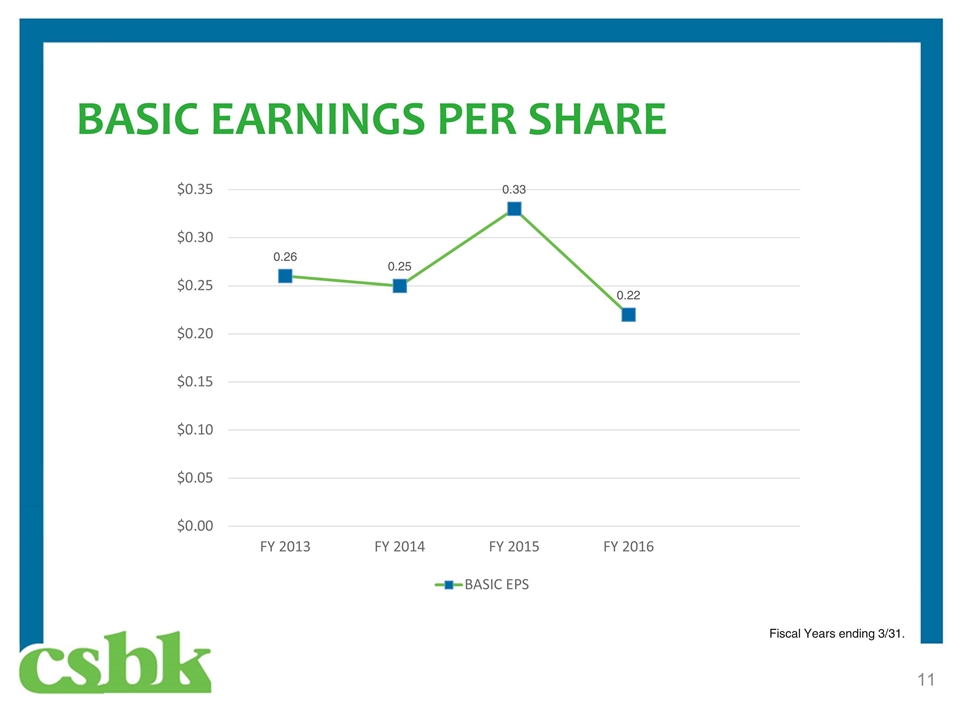
BASIC EARNINGS PER SHARE Fiscal Years ending 3/31.
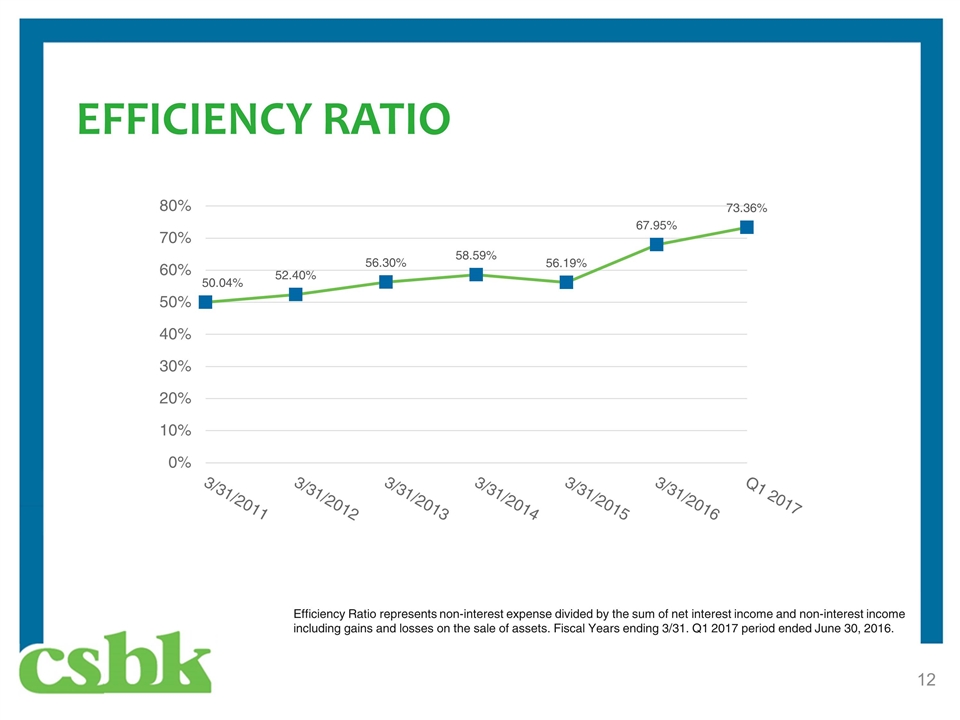
EFFICIENCY RATIO Efficiency Ratio represents non-interest expense divided by the sum of net interest income and non-interest income including gains and losses on the sale of assets. Fiscal Years ending 3/31. Q1 2017 period ended June 30, 2016.
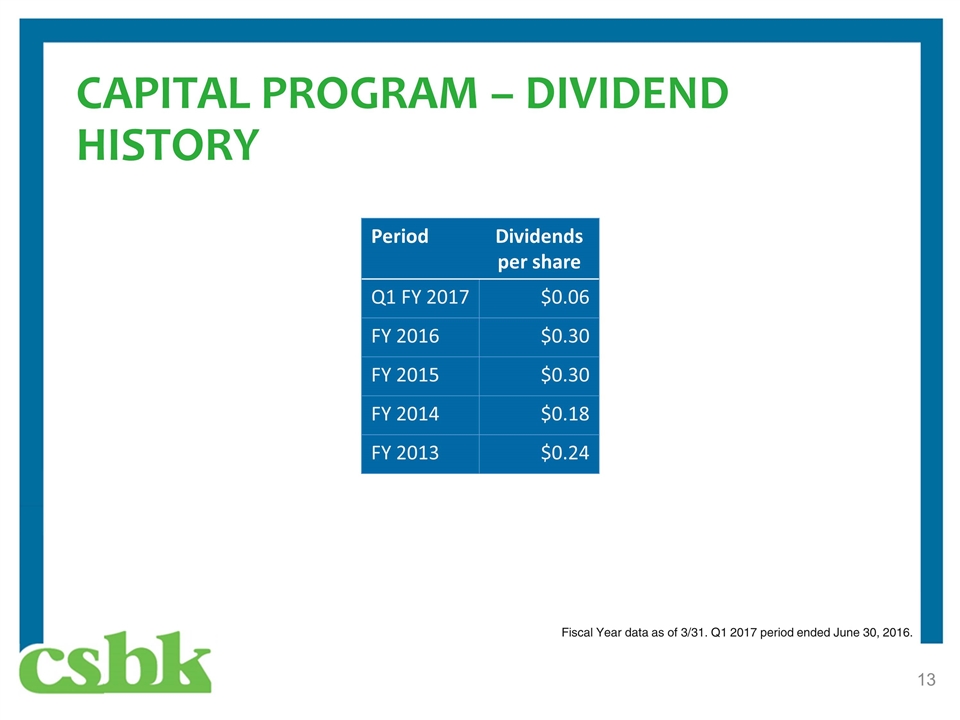
CAPITAL PROGRAM – DIVIDEND HISTORY Period Dividends per share Q1 FY 2017 $0.06 FY 2016 $0.30 FY 2015 $0.30 FY 2014 $0.18 FY 2013 $0.24 Fiscal Year data as of 3/31. Q1 2017 period ended June 30, 2016.
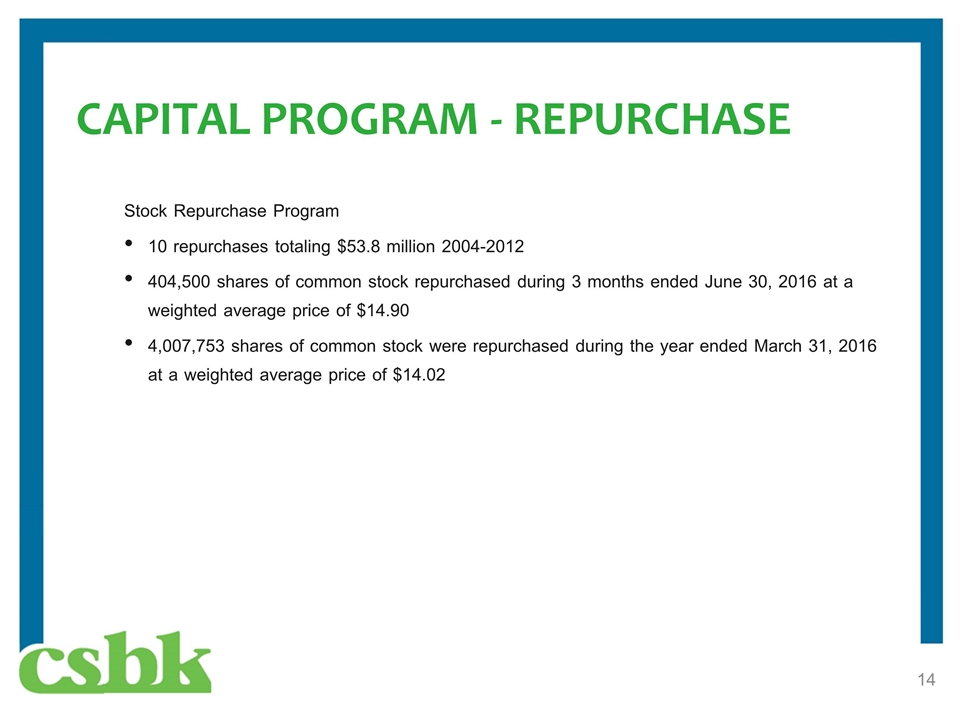
CAPITAL PROGRAM - REPURCHASE Stock Repurchase Program 10 repurchases totaling $53.8 million 2004-2012 404,500 shares of common stock repurchased during 3 months ended June 30, 2016 at a weighted average price of $14.90 4,007,753 shares of common stock were repurchased during the year ended March 31, 2016 at a weighted average price of $14.02
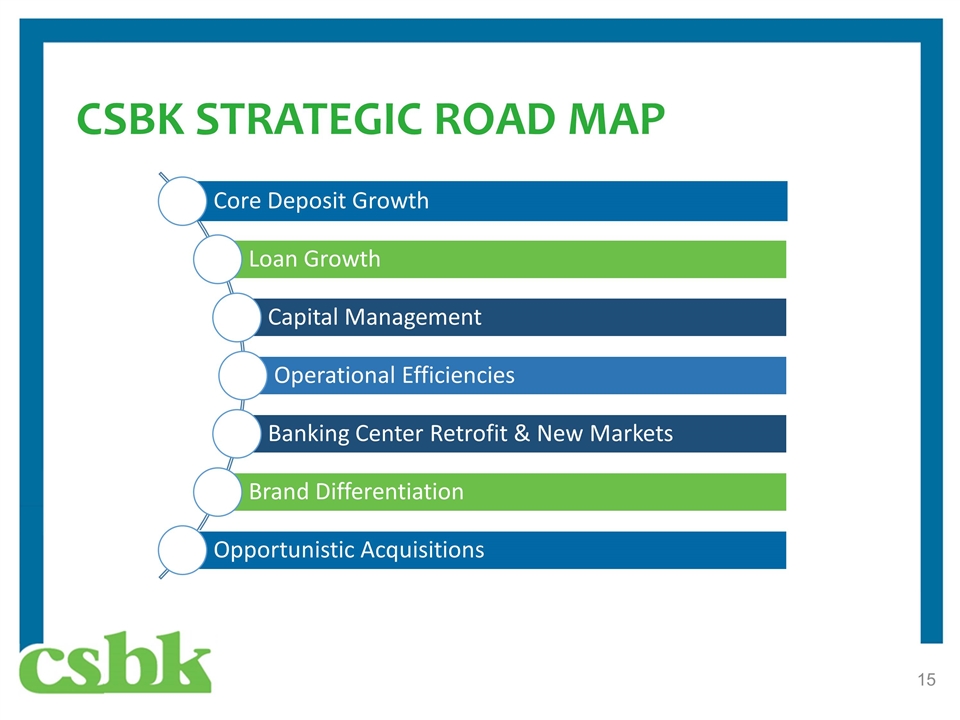
CSBK STRATEGIC ROAD MAP Core Deposit Growth Loan Growth Capital Management Operational Efficiencies Banking Center Retrofit & New Markets Brand Differentiation Opportunistic Acquisitions

Thank you for your continued support.
