Attached files
| file | filename |
|---|---|
| EX-99.1 - EX-99.1 - CENTURY CASINOS INC /CO/ | c147-20160805xex99_1.htm |
| 8-K - 8-K - CENTURY CASINOS INC /CO/ | c147-20160805x8k.htm |
 Financial Results Q2 2016
 Forward-Looking Statements, Business Environment and Risk FactorsThispresentationmaycontain“forward-lookingstatements”withinthemeaningofSection27AoftheSecuritiesActof1933,asamended,Section21EoftheSecuritiesExchangeActof1934,asamended(the“ExchangeAct”),andthePrivateSecuritiesLitigationReformActof1995.Inaddition,CenturyCasinos,Inc.(togetherwithitssubsidiaries,the“Company”)maymakeotherwrittenandoralcommunicationsfromtimetotimethatcontainsuchstatements.Forward-lookingstatementsincludestatementsastoindustrytrendsandfutureexpectationsoftheCompanyandothermattersthatdonotrelatestrictlytohistoricalfactsandarebasedoncertainassumptionsbymanagementatthetimesuchstatementsaremade.Forward-lookingstatementsinthispresentationincludestatementsrelatingtoouracquisitionoftheApexCasinoinEdmonton,Alberta,Canada,whichisexpectedtocloseinthefourthquarterof2016.Thesestatementsareoftenidentifiedbytheuseofwordssuchas“may,”“will,”“expect,”“believe,”“anticipate,”“intend,”“could,”“estimate,”or“continue,”andsimilarexpressionsorvariations.ThesestatementsarebasedonthebeliefsandassumptionsofthemanagementoftheCompanybasedoninformationcurrentlyavailabletomanagement.Suchforward-lookingstatementsaresubjecttorisks,uncertaintiesandotherfactorsthatcouldcauseactualresultstodiffermateriallyfromfutureresultsexpressedorimpliedbysuchforward-lookingstatements.Importantfactorsthatcouldcauseactualresultstodiffermateriallyfromtheforward-lookingstatementsinclude,amongothers,therisksdescribedinthesectionentitled“RiskFactors”underItem1AinourAnnualReportonForm10-KfortheyearendedDecember31,2015.Wecautionthereadertocarefullyconsidersuchfactors.Furthermore,suchforward-lookingstatementsspeakonlyasofthedateonwhichsuchstatementsaremade.Weundertakenoobligationtoupdateanyforward-lookingstatementstoreflecteventsorcircumstancesafterthedateofsuchstatements.Inthispresentationtheterm“USD”referstoUSdollars,theterm“CAD”referstoCanadiandollarsandtheterm“PLN”referstoPolishzloty.AdjustedEBITDAandAdjustedEBITDAmarginarenon-GAAPfinancialmeasures.SeeAppendixAforthedefinitionandreconciliationofAdjustedEBITDAandAdjustedEBITDAmargin.Amountspresentedarerounded.Assuch,roundingdifferencescouldoccurinperiodoverperiodchangesandpercentagesreportedthroughoutthispresentation.
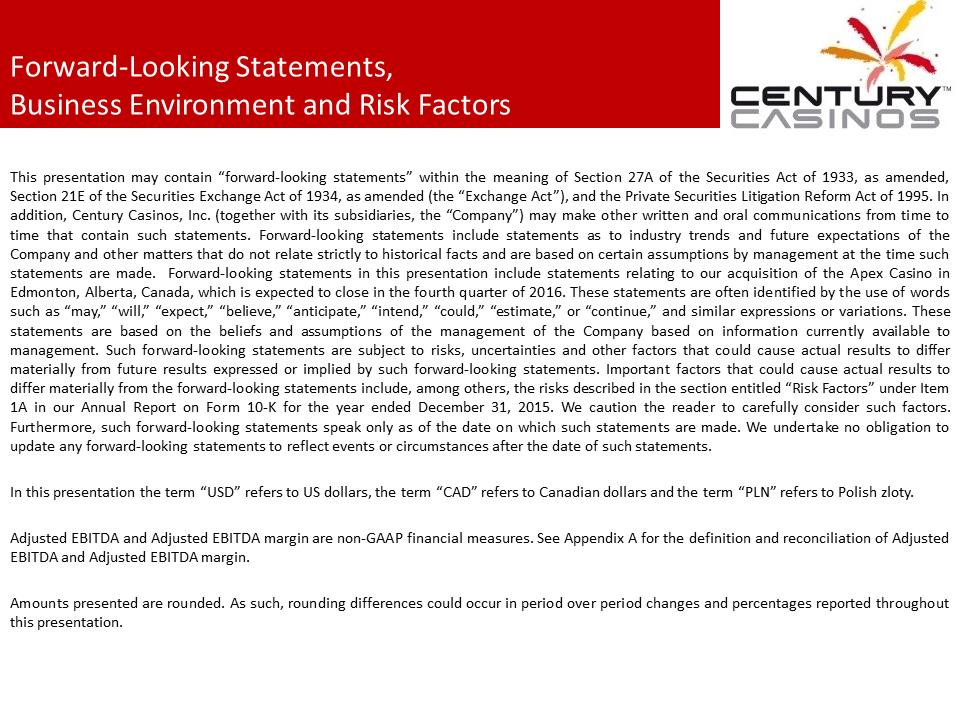
 Q2 2016 Results by Segment (in USD)
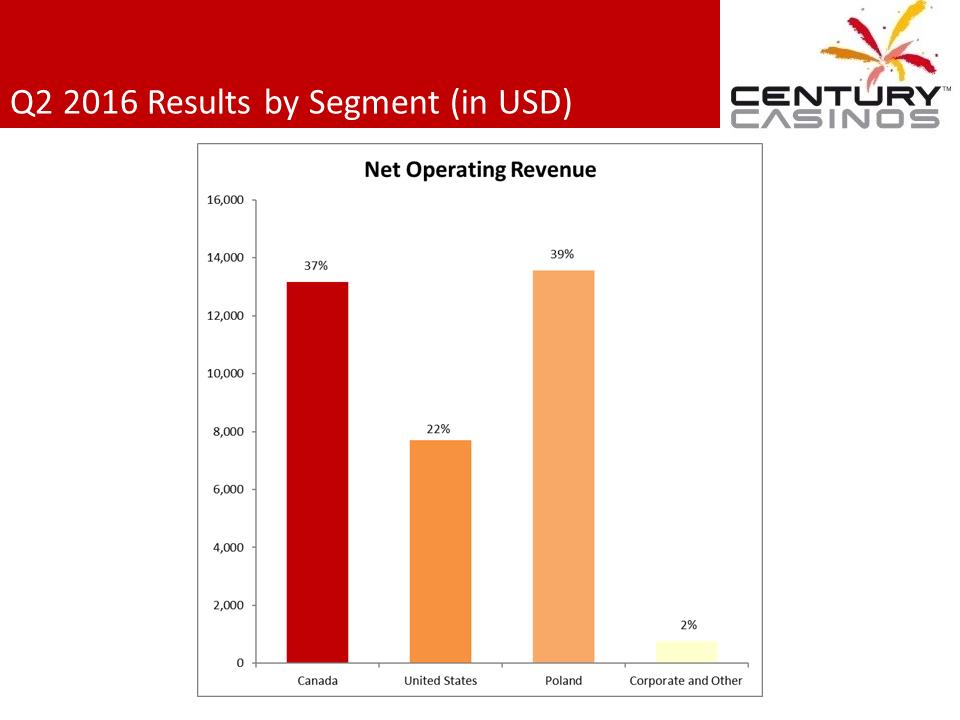
 Q2 2016 Results by Segment (in USD)
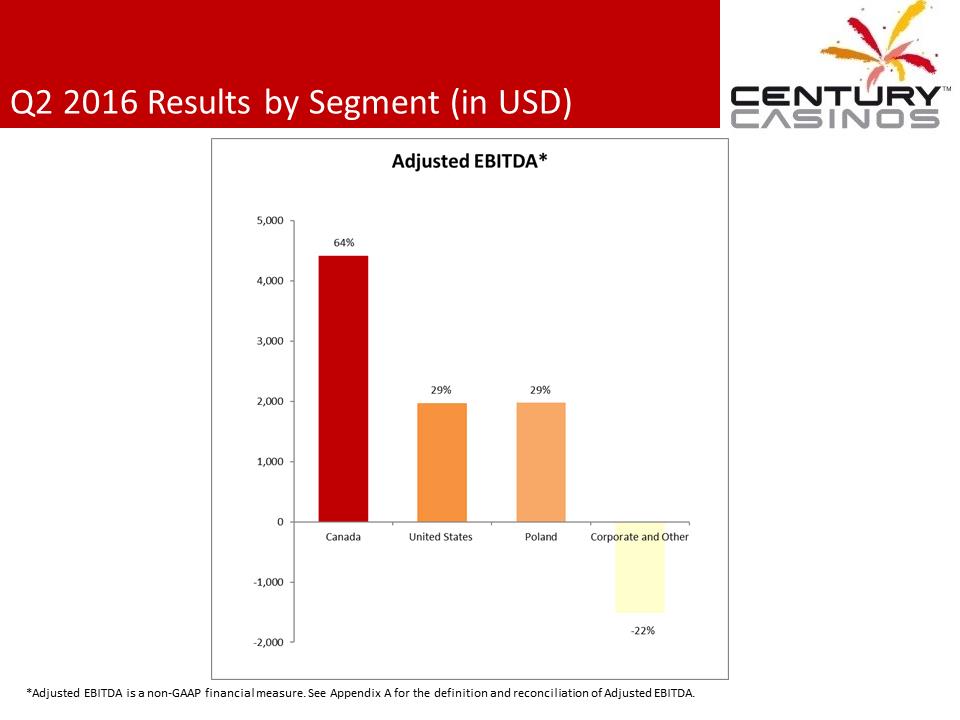 Q2 2016 Results by Segment (in USD) *Adjusted EBITDA is a non-GAAP financial measure. See Appendix A for the definition and reconciliation of Adjusted EBITDA.
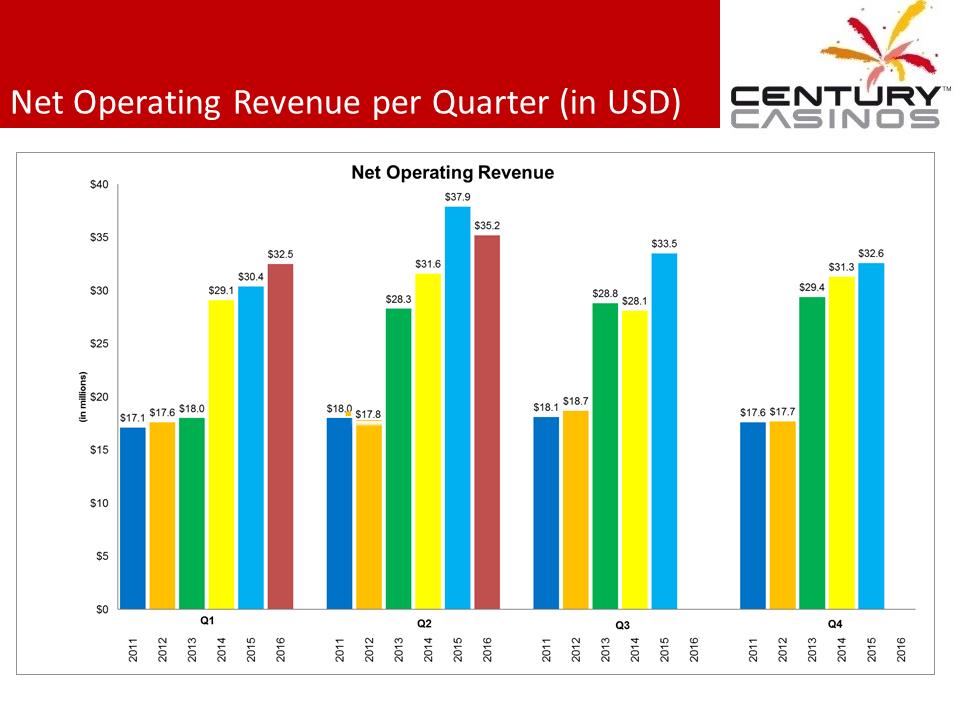 Net Operating Revenue per Quarter (in USD)
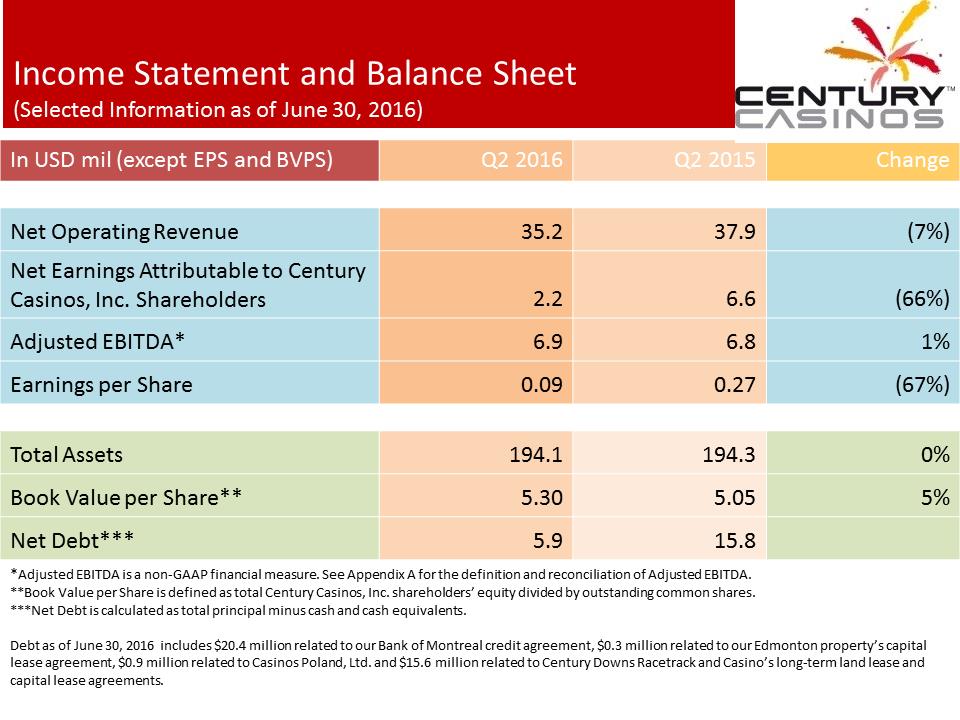 Income Statement and Balance Sheet(Selected Information as of June 30, 2016)InUSD mil (except EPS and BVPS)Q2 2016Q2 2015ChangeNet OperatingRevenue35.237.9(7%)Net Earnings Attributable to Century Casinos, Inc.Shareholders2.26.6(66%)Adjusted EBITDA*6.96.81%Earnings per Share0.090.27(67%)TotalAssets194.1194.30%Book Value per Share**5.305.055%Net Debt***5.915.8*AdjustedEBITDA is a non-GAAP financial measure. See Appendix A for the definition and reconciliation of Adjusted EBITDA.**Book Valueper Share is defined as total Century Casinos, Inc. shareholders’ equity divided by outstanding common shares.***Net Debt is calculated as total principal minus cash and cash equivalents. Debt as of June 30, 2016 includes $20.4 million related to our Bank of Montreal credit agreement, $0.3 million related to our Edmonton property’s capital lease agreement, $0.9million related to Casinos Poland, Ltd. and $15.6 million related to Century Downs Racetrack and Casino’s long-term land lease and capital lease agreements.
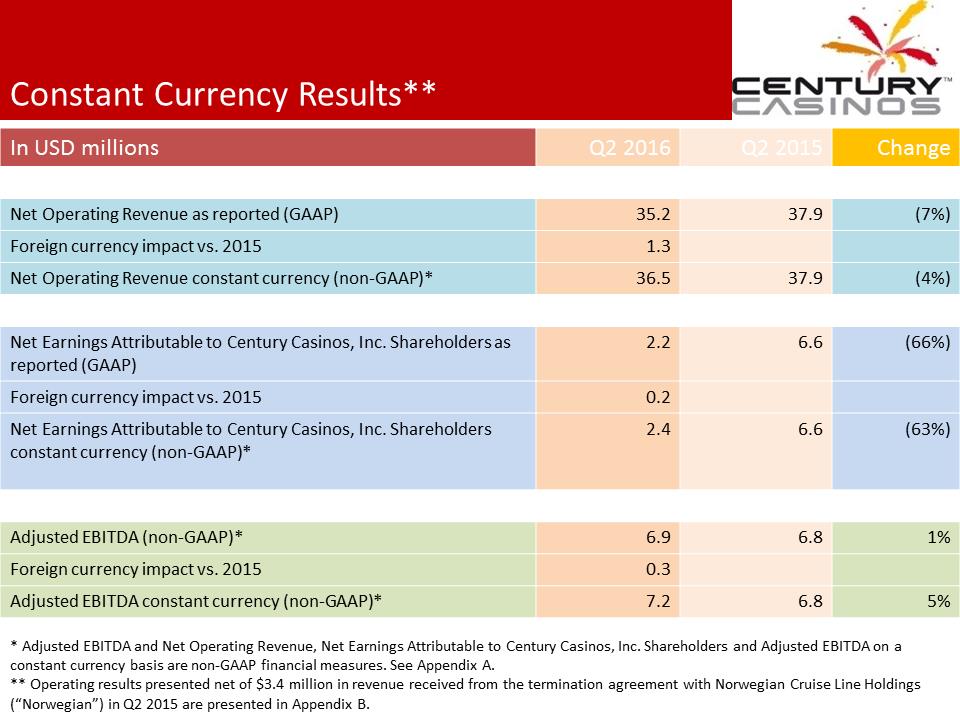 Constant Currency Results**In USD millionsQ2 2016Q2 2015ChangeNet OperatingRevenue as reported (GAAP)35.237.9(7%)Foreign currency impact vs. 20151.3Net Operating Revenue constant currency (non-GAAP)*36.537.9(4%)Net Earnings Attributable to CenturyCasinos, Inc. Shareholders as reported (GAAP)2.26.6(66%)Foreign currency impact vs. 20150.2Net Earnings Attributable to CenturyCasinos, Inc. Shareholders constant currency (non-GAAP)*2.46.6(63%)Adjusted EBITDA (non-GAAP)*6.96.81%Foreign currency impact vs. 20150.3Adjusted EBITDA constant currency (non-GAAP)*7.26.85%* Adjusted EBITDA and Net Operating Revenue, Net Earnings Attributable to Century Casinos, Inc. Shareholders and Adjusted EBITDAon a constant currency basis are non-GAAP financial measures. See Appendix A.** Operating results presented net of $3.4 million in revenue received from the termination agreement with Norwegian Cruise LineHoldings (“Norwegian”) in Q2 2015 are presented in Appendix B.
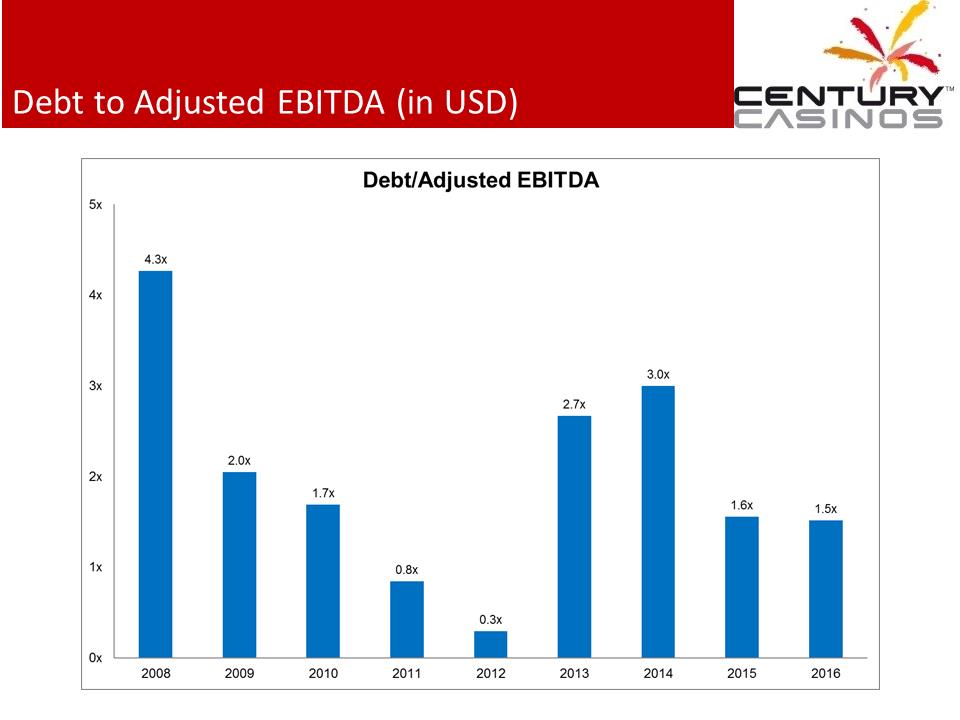 Debt to Adjusted EBITDA (in USD)
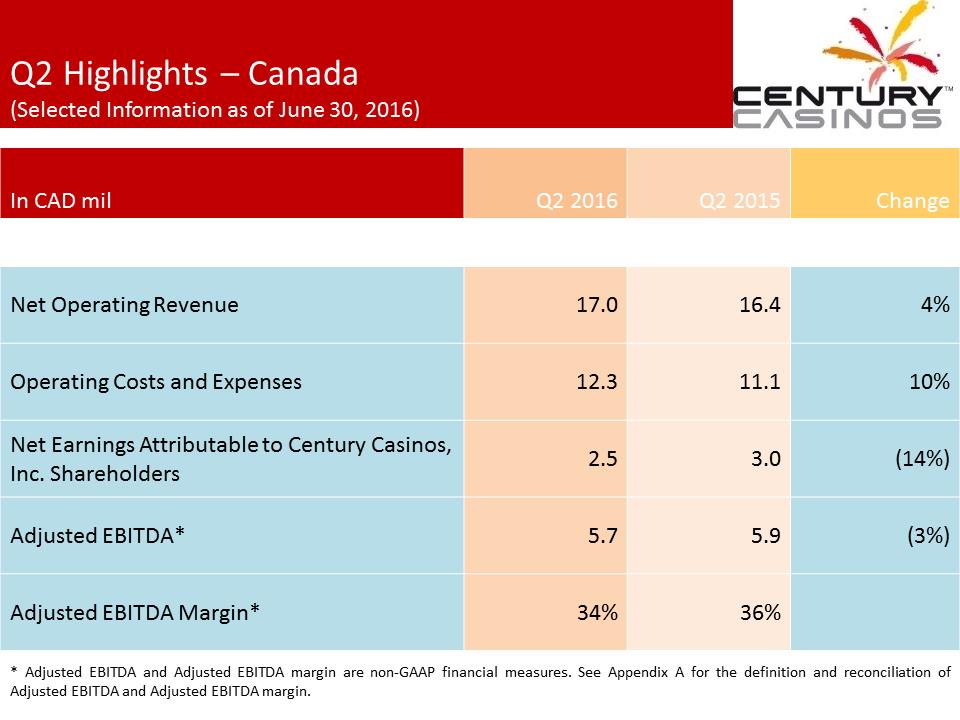 Q2 Highlights –Canada(Selected Information as of June 30, 2016)InCAD milQ2 2016Q2 2015ChangeNet Operating Revenue17.016.44%Operating Costs andExpenses12.311.110%Net Earnings Attributable to CenturyCasinos, Inc. Shareholders2.53.0(14%)Adjusted EBITDA*5.75.9(3%)Adjusted EBITDA Margin*34%36%*AdjustedEBITDAandAdjustedEBITDAmarginarenon-GAAPfinancialmeasures.SeeAppendixAforthedefinitionandreconciliationofAdjustedEBITDAandAdjustedEBITDAmargin.
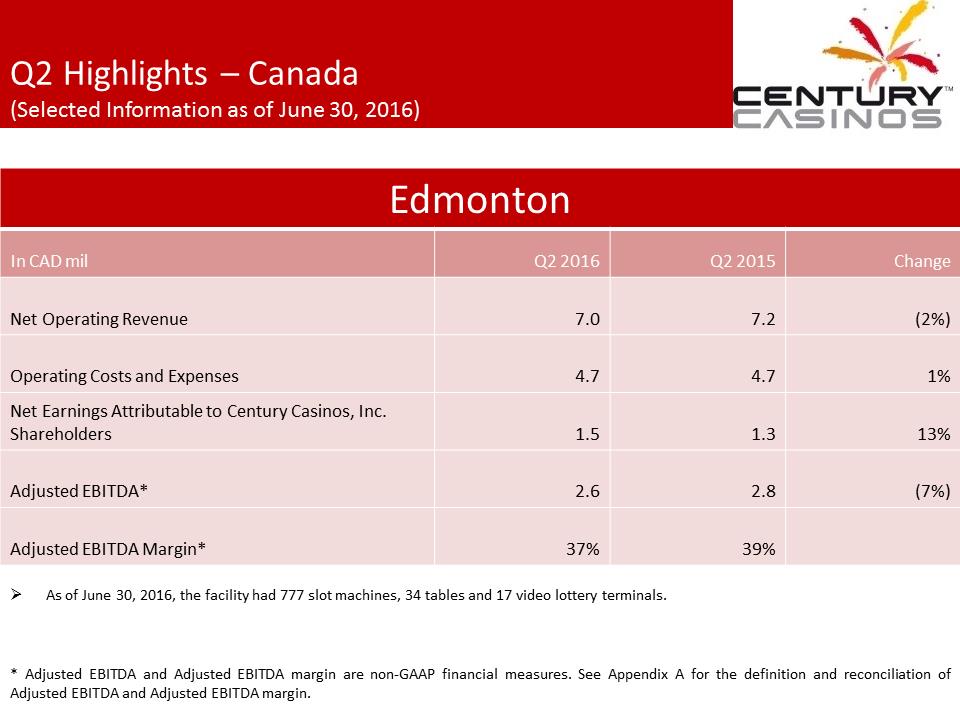 Q2 Highlights –Canada(Selected Information as of June 30, 2016)EdmontonIn CADmilQ2 2016Q2 2015ChangeNet Operating Revenue7.07.2(2%)Operating Costs and Expenses4.74.71%Net EarningsAttributable to Century Casinos, Inc. Shareholders1.51.313%Adjusted EBITDA*2.62.8(7%)Adjusted EBITDA Margin*37%39%.As of June 30, 2016, the facility had 777 slot machines, 34 tables and 17 video lottery terminals.*AdjustedEBITDAandAdjustedEBITDAmarginarenon-GAAPfinancialmeasures.SeeAppendixAforthedefinitionandreconciliationofAdjustedEBITDAandAdjustedEBITDAmargin.
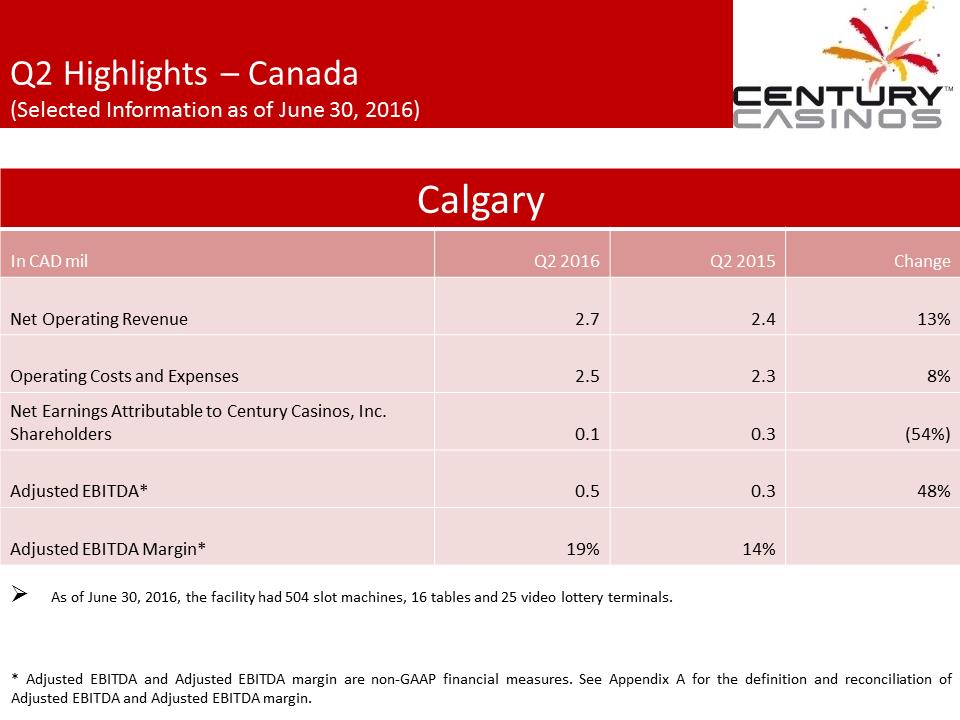 Q2 Highlights –Canada(Selected Information as of June 30, 2016)CalgaryIn CADmilQ2 2016Q2 2015ChangeNet Operating Revenue2.72.413%Operating Costs and Expenses2.52.38%Net Earnings Attributable to Century Casinos, Inc. Shareholders0.10.3(54%)AdjustedEBITDA*0.50.348%Adjusted EBITDA Margin*19%14%.As of June 30, 2016, the facility had 504 slot machines, 16 tables and 25 video lottery terminals.*AdjustedEBITDAandAdjustedEBITDAmarginarenon-GAAPfinancialmeasures.SeeAppendixAforthedefinitionandreconciliationofAdjustedEBITDAandAdjustedEBITDAmargin.
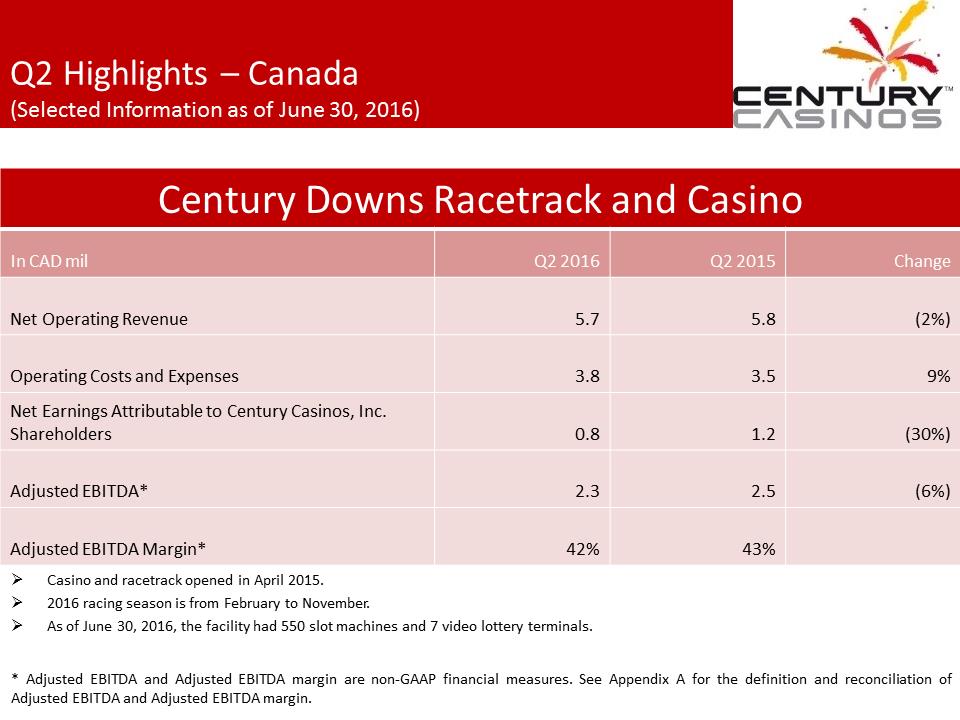 Q2 Highlights –Canada(Selected Information as of June 30, 2016)CenturyDowns Racetrack and CasinoIn CADmilQ2 2016Q2 2015ChangeNet Operating Revenue5.75.8(2%)Operating Costs and Expenses3.83.59%Net Earnings Attributable to Century Casinos, Inc. Shareholders0.81.2(30%)AdjustedEBITDA*2.32.5(6%)Adjusted EBITDA Margin*42%43%.Casino and racetrack opened in April 2015..2016 racing season is from February to November..As of June 30, 2016, the facility had 550 slot machines and 7 video lottery terminals. *AdjustedEBITDAandAdjustedEBITDAmarginarenon-GAAPfinancialmeasures.SeeAppendixAforthedefinitionandreconciliationofAdjustedEBITDAandAdjustedEBITDAmargin.
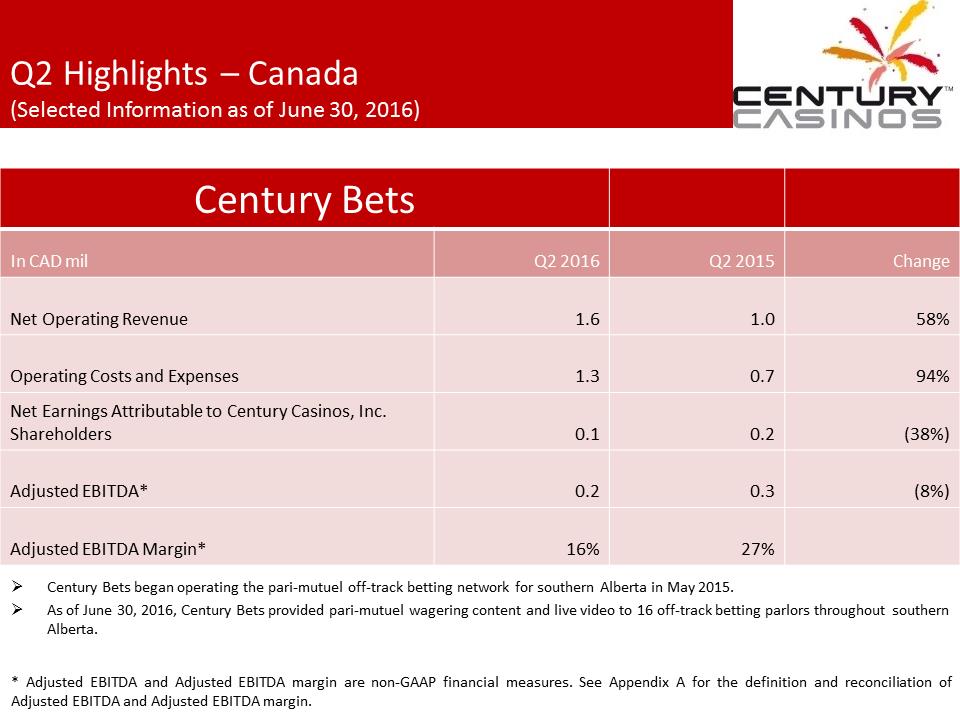 Q2 Highlights –Canada(Selected Information as of June 30, 2016)CenturyBetsIn CADmilQ2 2016Q2 2015ChangeNet Operating Revenue1.61.058%Operating Costs and Expenses1.30.794%Net Earnings Attributableto Century Casinos, Inc. Shareholders0.10.2(38%)Adjusted EBITDA*0.20.3(8%)Adjusted EBITDA Margin*16%27%.Century Bets began operating the pari-mutuel off-track betting network for southern Alberta in May 2015..As of June 30, 2016, Century Bets provided pari-mutuel wagering content and live video to 16 off-track betting parlors throughout southern Alberta.*AdjustedEBITDAandAdjustedEBITDAmarginarenon-GAAPfinancialmeasures.SeeAppendixAforthedefinitionandreconciliationofAdjustedEBITDAandAdjustedEBITDAmargin.
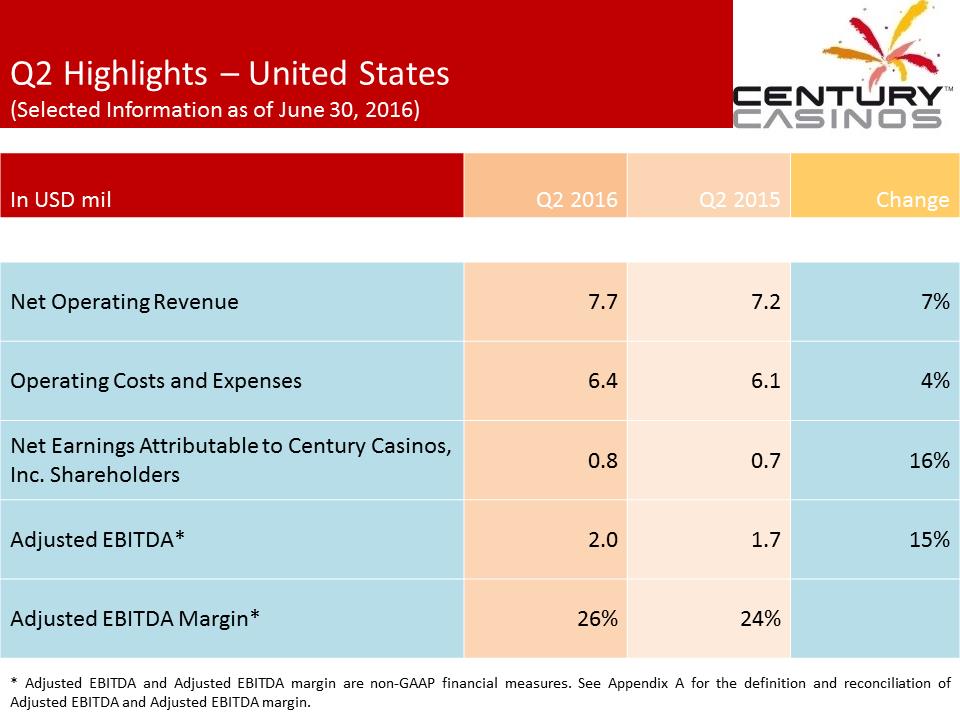 Q2 Highlights –United States(Selected Information as of June 30, 2016)InUSD milQ2 2016Q2 2015ChangeNet Operating Revenue7.77.27%Operating Costs andExpenses6.46.14%Net EarningsAttributable to Century Casinos, Inc. Shareholders0.80.716%Adjusted EBITDA*2.01.715%Adjusted EBITDA Margin*26%24%*AdjustedEBITDAandAdjustedEBITDAmarginarenon-GAAPfinancialmeasures.SeeAppendixAforthedefinitionandreconciliationofAdjustedEBITDAandAdjustedEBITDAmargin.
 Q2 Highlights –United States(Selected Information as of June 30, 2016)Central CityIn USDmilQ2 2016Q2 2015ChangeNet Operating Revenue4.74.310%Operating Costs and Expenses3.93.67%Net Earnings Attributable to Century Casinos, Inc. Shareholders0.50.428%Adjusted EBITDA*1.21.018%Adjusted EBITDA Margin*25%23%.Central City market increased by 4% for the quarter ended June 30, 2016 compared to the quarter ended June 30, 2015..Our share of the Central City market was 29% for Q2 2016, an increase of 1% as compared to Q2 2015..As of June 30, 2016, the facility had 495 slot machines and 7 tables.*AdjustedEBITDAandAdjustedEBITDAmarginarenon-GAAPfinancialmeasures.SeeAppendixAforthedefinitionandreconciliationofAdjustedEBITDAandAdjustedEBITDAmargin.
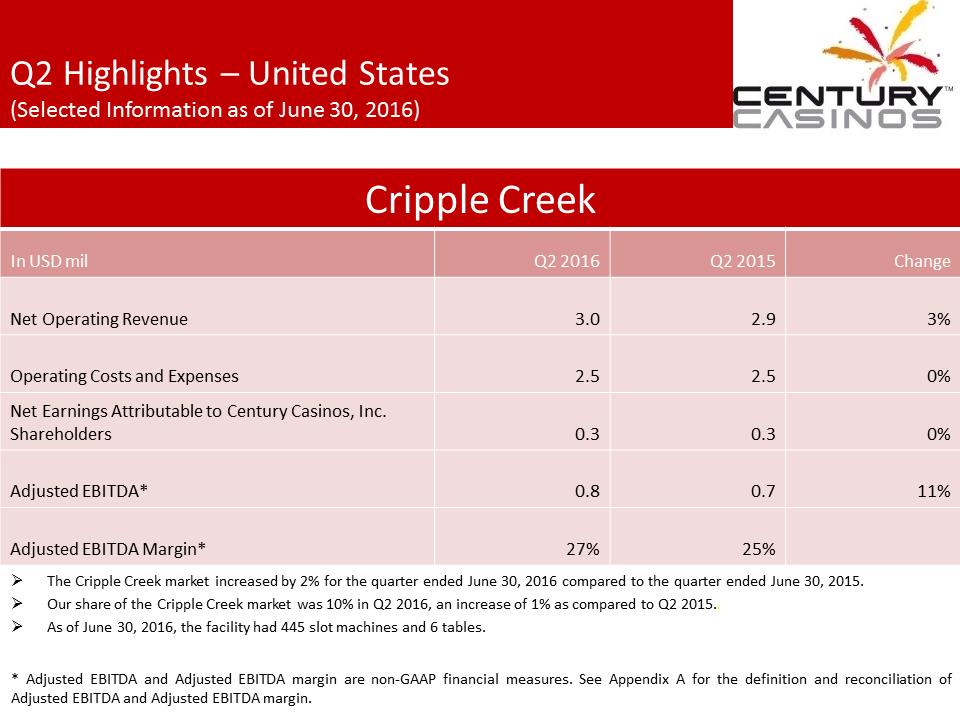 Q2 Highlights –United States(Selected Information as of June 30, 2016)CrippleCreekIn USDmilQ2 2016Q2 2015ChangeNet Operating Revenue3.02.93%Operating Costs and Expenses2.52.50%Net Earnings Attributableto Century Casinos, Inc. Shareholders0.30.30%Adjusted EBITDA*0.80.711%Adjusted EBITDA Margin*27%25%.The Cripple Creek market increased by 2% for the quarter ended June 30, 2016 compared to the quarter ended June 30, 2015..Our share of the Cripple Creek market was 10% in Q2 2016, an increase of 1% as compared to Q2 2015...As of June 30, 2016, the facility had 445 slot machines and 6 tables.*AdjustedEBITDAandAdjustedEBITDAmarginarenon-GAAPfinancialmeasures.SeeAppendixAforthedefinitionandreconciliationofAdjustedEBITDAandAdjustedEBITDAmargin.
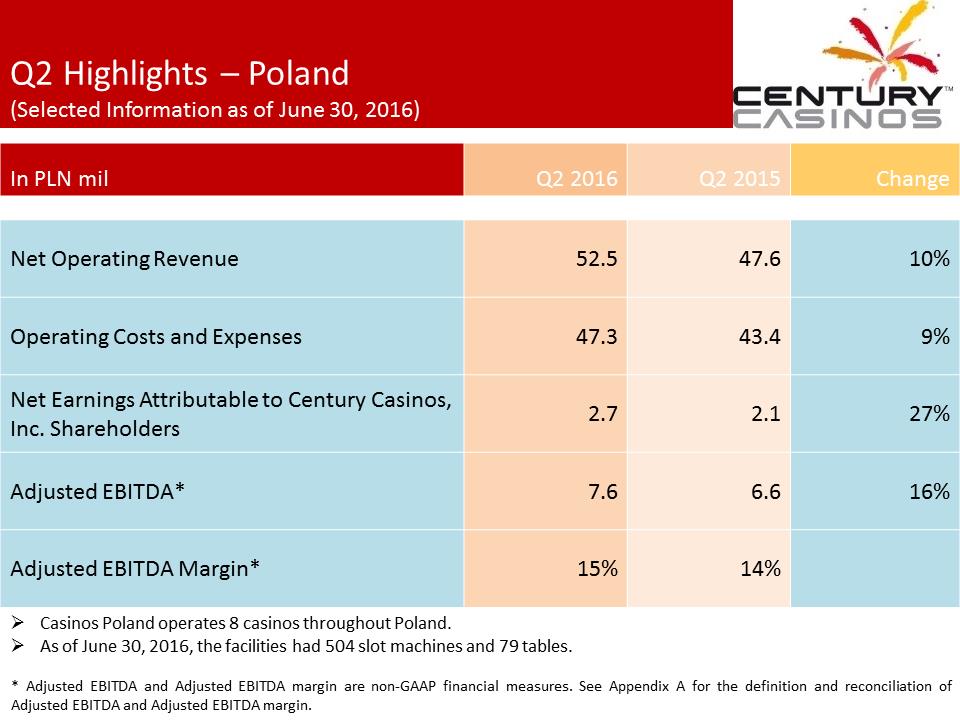 Q2 Highlights –Poland(Selected Information as of June 30, 2016)InPLN milQ2 2016Q2 2015ChangeNet Operating Revenue52.547.610%Operating Costs andExpenses47.343.49%Net Earnings Attributableto Century Casinos, Inc. Shareholders2.72.127%AdjustedEBITDA*7.66.616%Adjusted EBITDA Margin*15%14%.Casinos Poland operates 8 casinos throughout Poland..As of June 30, 2016, the facilities had 504 slot machines and 79 tables.*AdjustedEBITDAandAdjustedEBITDAmarginarenon-GAAPfinancialmeasures.SeeAppendixAforthedefinitionandreconciliationofAdjustedEBITDAandAdjustedEBITDAmargin.
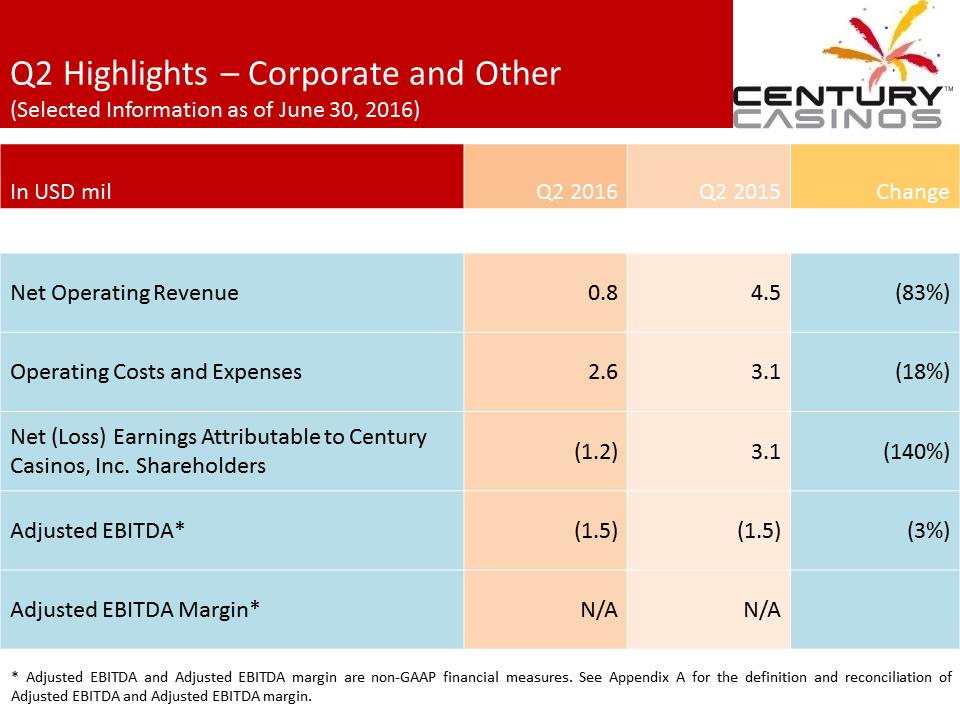 Q2 Highlights –Corporate and Other(Selected Information as of June 30, 2016)InUSD milQ2 2016Q2 2015ChangeNet Operating Revenue0.84.5(83%)Operating Costs andExpenses2.63.1(18%)Net (Loss) Earnings Attributable to Century Casinos, Inc. Shareholders(1.2)3.1(140%)AdjustedEBITDA*(1.5)(1.5)(3%)Adjusted EBITDA Margin*N/AN/A*AdjustedEBITDAandAdjustedEBITDAmarginarenon-GAAPfinancialmeasures.SeeAppendixAforthedefinitionandreconciliationofAdjustedEBITDAandAdjustedEBITDAmargin.
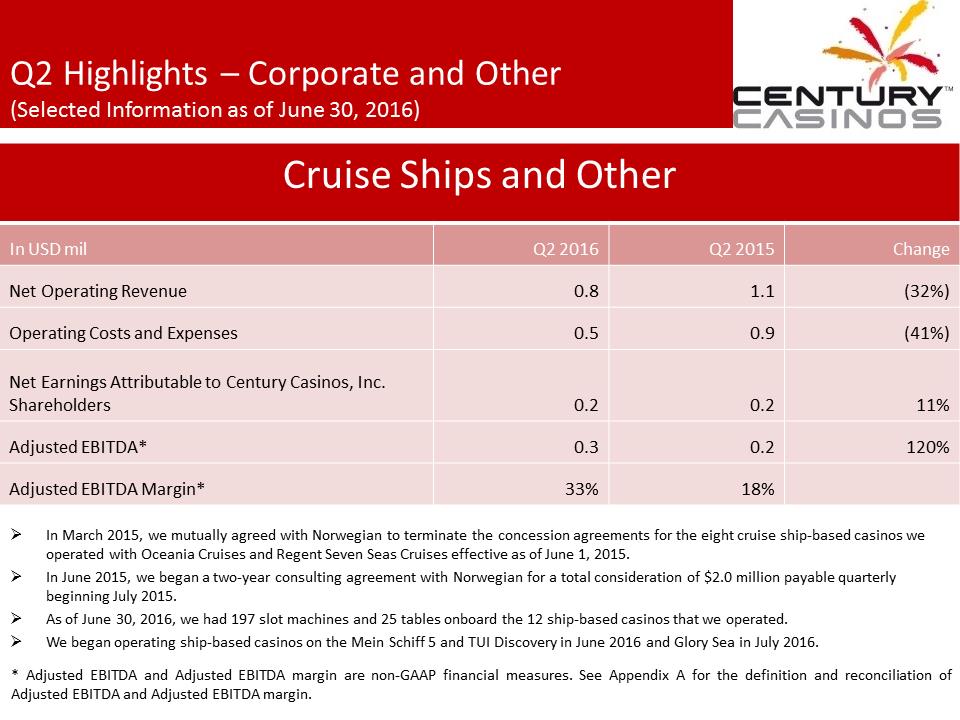 Q2 Highlights –Corporate and Other(Selected Information as of June 30, 2016)Cruise Ships and OtherIn USDmilQ2 2016Q2 2015ChangeNet Operating Revenue0.81.1(32%)Operating Costs and Expenses0.50.9(41%)Net Earnings Attributable to Century Casinos, Inc. Shareholders0.20.211%Adjusted EBITDA*0.30.2120%Adjusted EBITDA Margin*33%18%.In March 2015, we mutually agreed with Norwegian to terminate the concession agreements for the eight cruise ship-based casinos we operated with Oceania Cruises and Regent Seven Seas Cruises effective as of June 1, 2015..In June 2015, we began a two-year consulting agreement with Norwegian for a total consideration of $2.0 million payable quarterly beginning July 2015..As of June 30, 2016, we had 197 slot machines and 25 tables onboard the 12 ship-based casinos that we operated..We began operating ship-based casinos on the Mein Schiff 5 and TUI Discovery in June 2016 and Glory Sea in July 2016.*AdjustedEBITDAandAdjustedEBITDAmarginarenon-GAAPfinancialmeasures.SeeAppendixAforthedefinitionandreconciliationofAdjustedEBITDAandAdjustedEBITDAmargin.
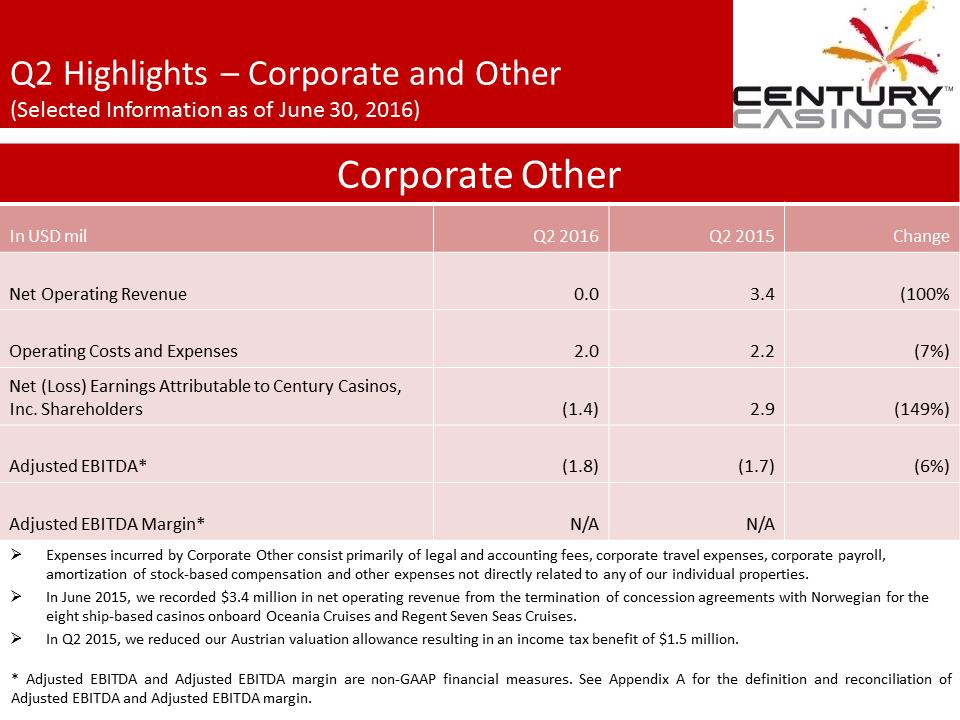 Q2 Highlights –Corporate and Other(Selected Information as of June 30, 2016)Corporate OtherIn USDmilQ2 2016Q2 2015ChangeNet Operating Revenue0.03.4(100%Operating Costs and Expenses2.02.2(7%)Net (Loss)EarningsAttributable to Century Casinos, Inc. Shareholders(1.4)2.9(149%)AdjustedEBITDA*(1.8)(1.7)(6%)Adjusted EBITDA Margin*N/AN/A.Expenses incurred by Corporate Other consist primarily of legal and accounting fees, corporate travel expenses, corporate payroll, amortization of stock-based compensation and other expenses not directly related to any of our individual properties..In June 2015, we recorded $3.4 million in net operating revenue from the termination of concession agreements with Norwegian forthe eight ship-based casinos onboard Oceania Cruises and Regent Seven Seas Cruises..In Q2 2015, we reduced our Austrian valuation allowance resulting in an income tax benefit of $1.5 million.*AdjustedEBITDAandAdjustedEBITDAmarginarenon-GAAPfinancialmeasures.SeeAppendixAforthedefinitionandreconciliationofAdjustedEBITDAandAdjustedEBITDAmargin.
 Additional Projects Under DevelopmentIn June 2016, the Company announced that its subsidiary Century Casinos Europe GmbH (“CCE”) had entered into an agreement to acquire 100% of the issued and outstanding shares and related land of entities operating the Apex Casino (“Apex”) in suburban Edmonton, Alberta, Canada. Apex is a 34,500 square foot casino facility located on approximately seven acres of land. The casino facility includes 382 slotmachines, 11 live table games, a restaurant, a bar, a lounge and a banquet facility that can accommodate up to 175 guests. The transaction, which is expected to close in the fourth quarter of 2016, is subject to, among other things, financing for the acquisition and customary closing conditions, including the receipt of necessary regulatory and governmental approvals as well as the completionof due diligence by the Company. The total consideration for the transaction is CAD 29.9 million subject to adjustment for the closing date working capital of Apex. Payments are to be made according to the following schedule: A CAD 0.6 million deposit was paid in two equal parts on April 25, 2016 and June 29, 2016. This is reported as deposits and other on the Company’s condensed consolidated balance sheet for the quarter ended June 30, 2016..CAD 29.3 million will be paid at closing. The working capital of Apex will be held in an escrow account until completion of the closing working capital statement.SeeAppendixCforunauditedfinancialresultsforApex.
 Appendix A –Non-GAAP Financial MeasuresTheCompanysupplementsitscondensedconsolidatedfinancialstatementspreparedinaccordancewithU.S.generallyacceptedaccountingprinciples(“USGAAP”)byusingthefollowingnon-GAAPfinancialmeasures,whichmanagementbelievesareusefulinproperlyunderstandingtheCompany’sshort-termandlong-termfinancialtrends.Managementusesthesenon-GAAPfinancialmeasurestoforecastandevaluatetheoperationalperformanceoftheCompanyaswellastocompareresultsofcurrentperiodstopriorperiodsonaconsolidatedbasis..AdjustedEBITDA.AdjustedEBITDAmargin.ConstantcurrencyresultsManagementbelievespresentingthenon-GAAPfinancialmeasuresusedinthispresentationprovidesinvestorsgreatertransparencytotheinformationusedbymanagementforfinancialandoperationaldecision-makingandallowsinvestorstoseetheCompany’sresults“throughtheeyes”ofmanagement.ManagementalsobelievesprovidingthisinformationbetterenablesourinvestorstounderstandtheCompany’soperatingperformanceandevaluatethemethodologyusedbymanagementtoevaluateandmeasuresuchperformance.TheadjustmentsmadetoU.S.GAAPfinancialmeasuresresultfromfactsandcircumstancesthatvaryinfrequencyandimpactontheCompany’sresultsofoperations.Thefollowingisanexplanationofeachoftheadjustmentsthatmanagementexcludesincalculatingitsnon-GAAPfinancialmeasures.
 Appendix A –Non-GAAP Financial MeasuresTheCompanydefinesAdjustedEBITDAasnetearnings(loss)attributabletoCenturyCasinos,Inc.shareholdersbeforeinterestexpense(income),net,incometaxes(benefit),depreciation,amortization,non-controllinginterest(earnings)lossesandtransactions,pre-openingexpenses,acquisitioncosts,non-cashstock-basedcompensationcharges,assetimpairmentcosts,(gain)lossondispositionoffixedassets,discontinuedoperations,(gain)lossonforeigncurrencytransactionsandother,gainonbusinesscombinationandcertainotherone-timeitems.Intercompanytransactionsconsistingprimarilyofmanagementandroyaltyfeesandinterest,alongwiththeirrelatedtaxeffects,areexcludedfromthepresentationofnetearnings(loss)andAdjustedEBITDAreportedforeachsegmentandproperty.Notalloftheaforementioneditemsoccurineachreportingperiod,buthavebeenincludedinthedefinitionbasedonhistoricalactivity.TheseadjustmentshavenoeffectontheconsolidatedresultsasreportedunderUSGAAP.AdjustedEBITDAisnotconsideredameasureofperformancerecognizedunderUSGAAP.ManagementbelievesthatAdjustedEBITDAisavaluablemeasureoftherelativeperformanceoftheCompanyanditsproperties.ThegamingindustrycommonlyusesAdjustedEBITDAasamethodofarrivingattheeconomicvalueofacasinooperation.ManagementusesAdjustedEBITDAtocomparetherelativeoperatingperformanceofseparateoperatingunitsbyeliminatingtheabovementioneditemsassociatedwiththevaryinglevelsofcapitalexpendituresforinfrastructurerequiredtogeneraterevenue,andtheoftenhighcostofacquiringexistingoperations.AdjustedEBITDAisusedbytheCompany’slendinginstitutiontogaugeoperatingperformance.TheCompany’scomputationofAdjustedEBITDAmaybedifferentfrom,andthereforemaynotbecomparableto,similarmeasuresusedbyothercompanieswithinthegamingindustry.PleaseseethereconciliationofAdjustedEBITDAtonetearnings(loss)attributabletoCenturyCasinos,Inc.shareholdersbelow.TheCompanydefinesAdjustedEBITDAmarginasAdjustedEBITDAdividedbynetoperatingrevenue.ManagementusesthismarginasoneofseveralmeasurestoevaluatetheefficiencyoftheCompany’scasinooperations.Theimpactofforeignexchangeratesishighlyvariableanddifficulttopredict.TheCompanyusesaConstantCurrencybasistoshowtheimpactfromforeignexchangeratesoncurrentperiodrevenuecomparedtopriorperiodrevenueusingthepriorperiod’sforeignexchangerates.InordertoproperlyunderstandtheunderlyingbusinesstrendsandperformanceoftheCompany’songoingoperations,managementbelievesthatinvestorsmayfinditusefultoconsidertheimpactofexcludingchangesinforeignexchangeratesfromtheCompany’snetoperatingrevenue,netearnings(loss)attributabletoCenturyCasinos,Inc.ShareholdersandAdjustedEBITDA.
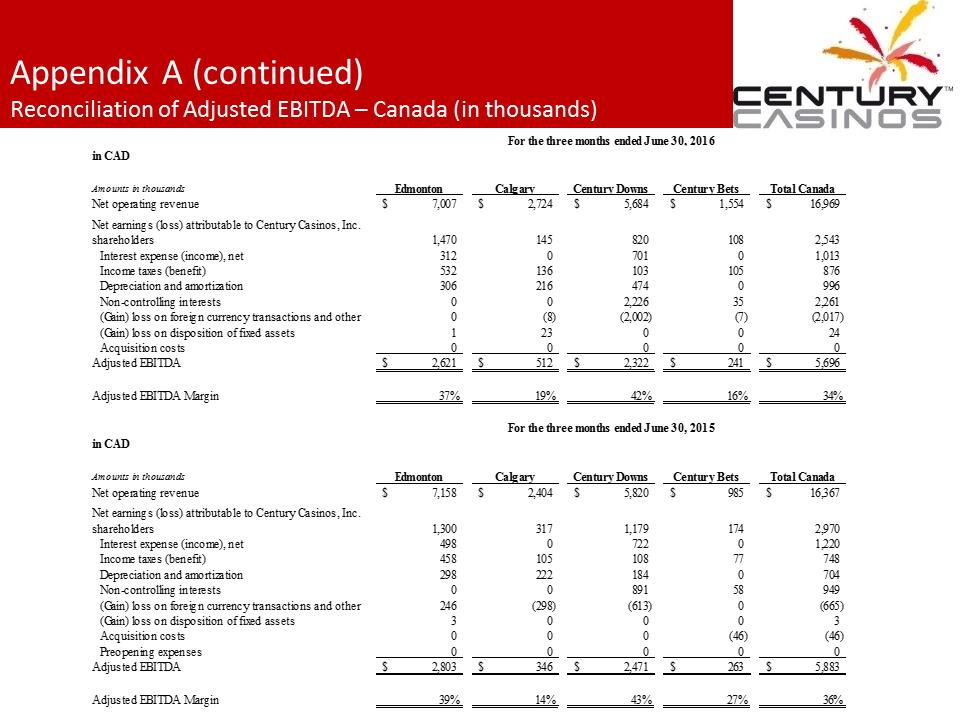 Appendix A (continued)Reconciliation of Adjusted EBITDA –Canada (in thousands)
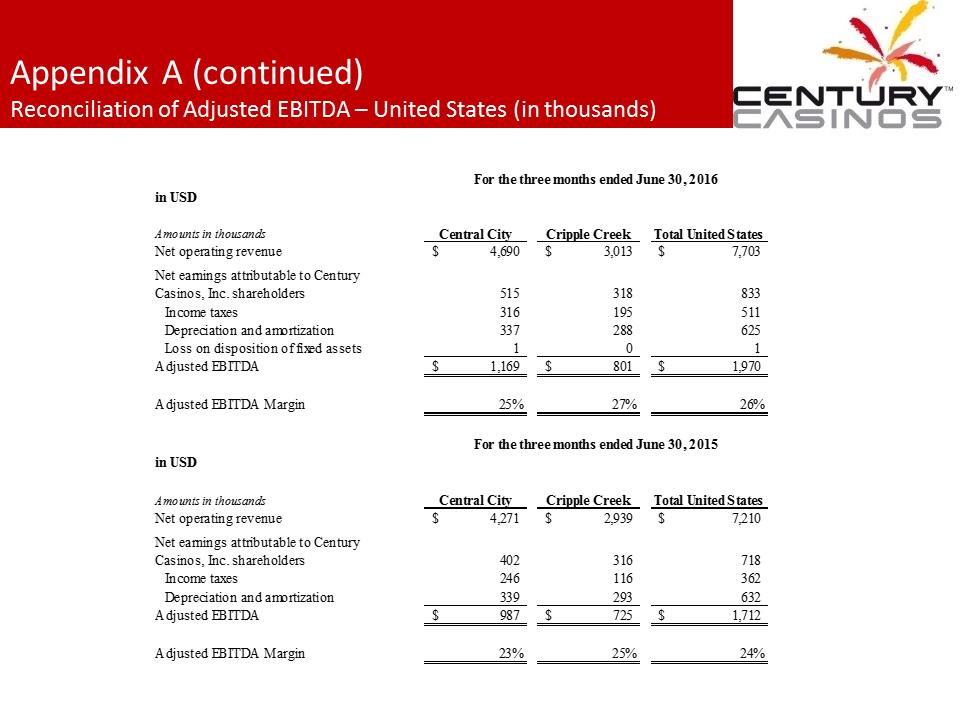 Reconciliation of Adjusted EBITDA –United States (in thousands)
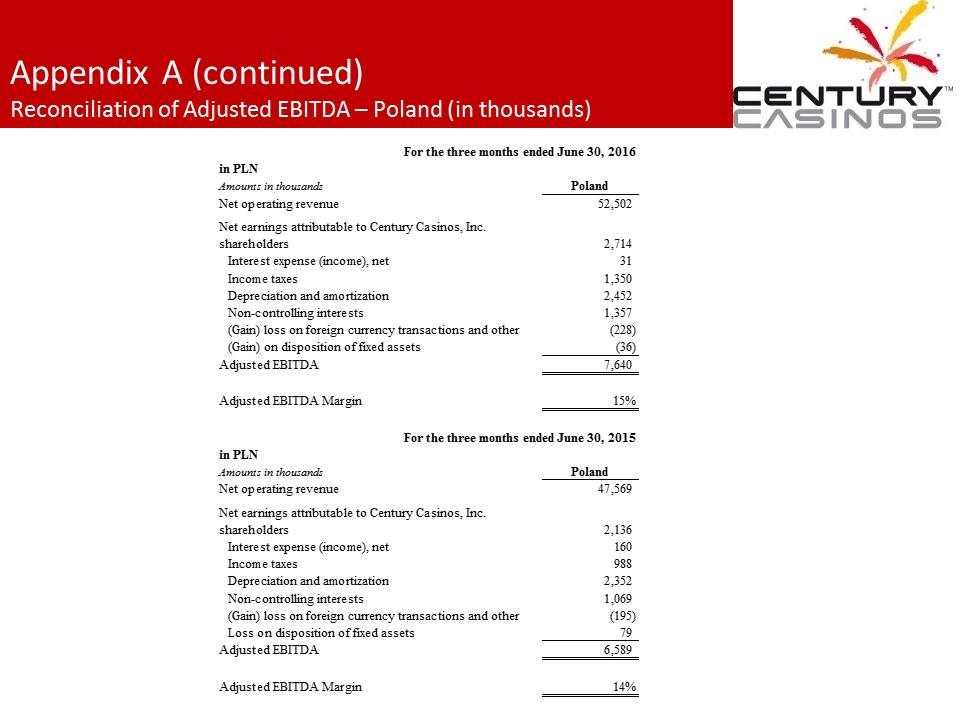 Reconciliation of Adjusted EBITDA –Poland (in thousands)
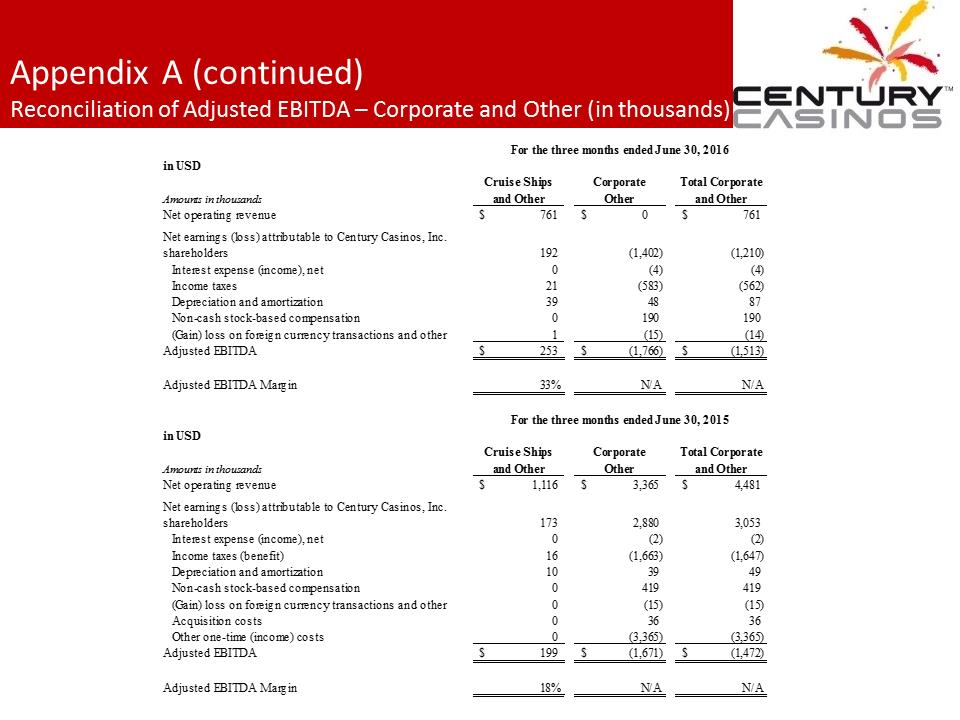 Reconciliation of Adjusted EBITDA –Corporate and Other (in thousands)
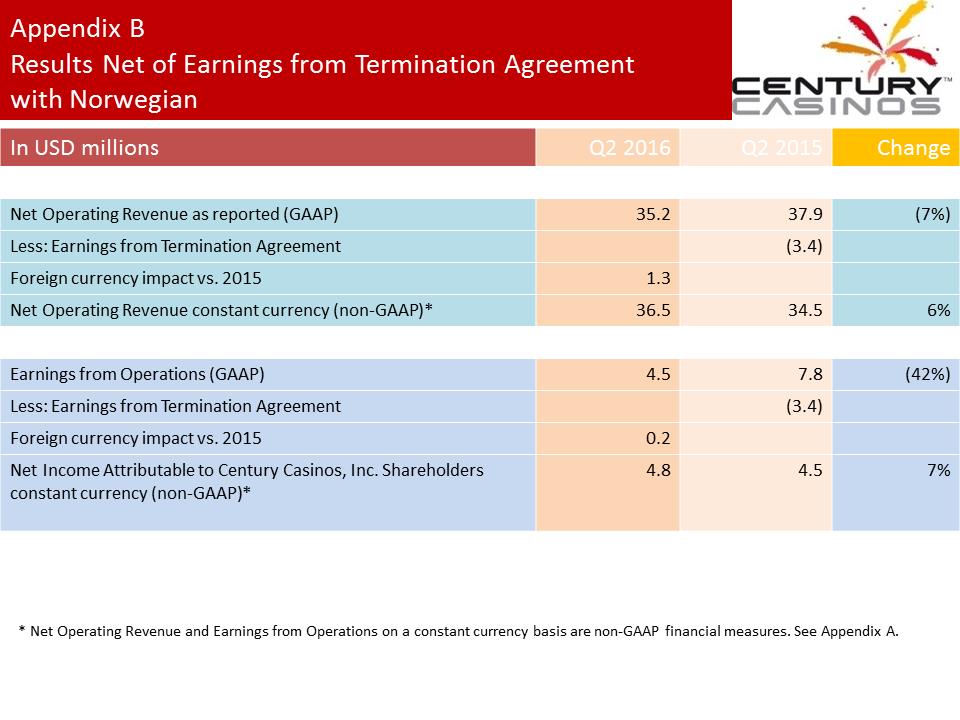 Appendix BResults Net of Earnings from Termination Agreementwith NorwegianIn USD millionsQ2 2016Q2 2015ChangeNet OperatingRevenue as reported (GAAP)35.237.9(7%)Less: Earnings from TerminationAgreement(3.4)Foreign currency impact vs. 20151.3Net Operating Revenue constant currency (non-GAAP)*36.534.56%Earnings from Operations(GAAP)4.57.8(42%)Less: Earnings from Termination Agreement(3.4)Foreign currency impact vs. 20150.2Net Income Attributable to CenturyCasinos, Inc. Shareholders constant currency (non-GAAP)*4.84.57%* Net Operating Revenue and Earnings from Operations on a constant currency basis are non-GAAP financial measures. See Appendix A.
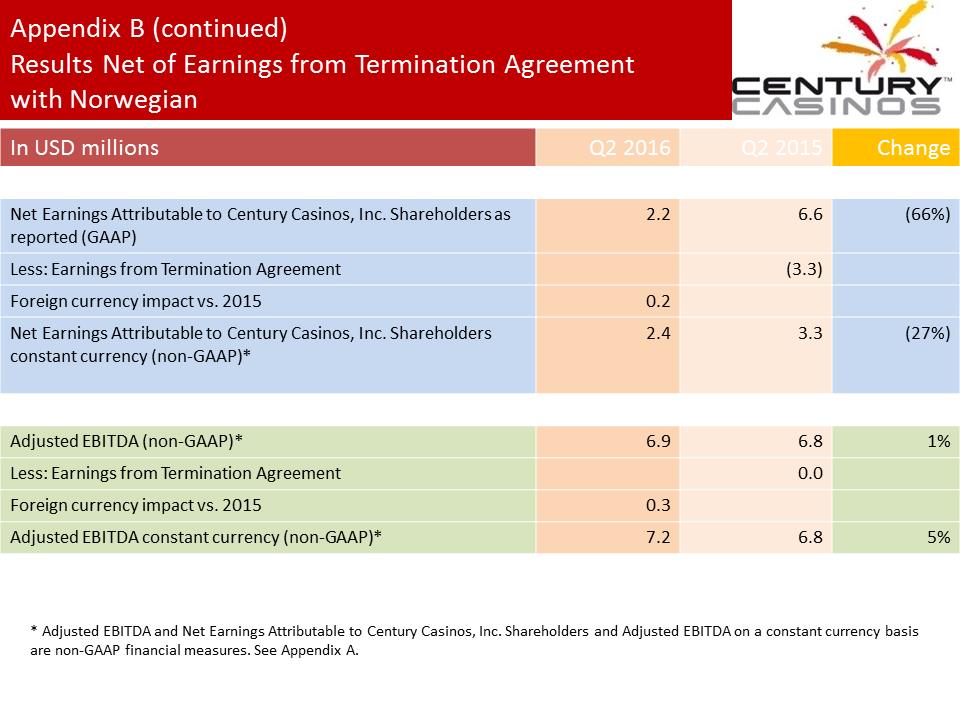 Appendix B (continued)Results Net of Earnings from Termination Agreementwith NorwegianIn USD millionsQ2 2016Q2 2015ChangeNet Earnings Attributable to CenturyCasinos, Inc. Shareholders as reported (GAAP)2.26.6(66%)Less: Earnings from Termination Agreement(3.3)Foreign currency impact vs. 20150.2Net Earnings Attributable to CenturyCasinos, Inc. Shareholders constant currency (non-GAAP)*2.43.3(27%)Adjusted EBITDA (non-GAAP)*6.96.81%Less: Earnings from Termination Agreement0.0Foreign currency impact vs. 20150.3Adjusted EBITDA constant currency (non-GAAP)*7.26.85%* Adjusted EBITDA and Net Earnings Attributable to Century Casinos, Inc. Shareholders and Adjusted EBITDA on a constant currencybasis are non-GAAP financial measures. See Appendix A.
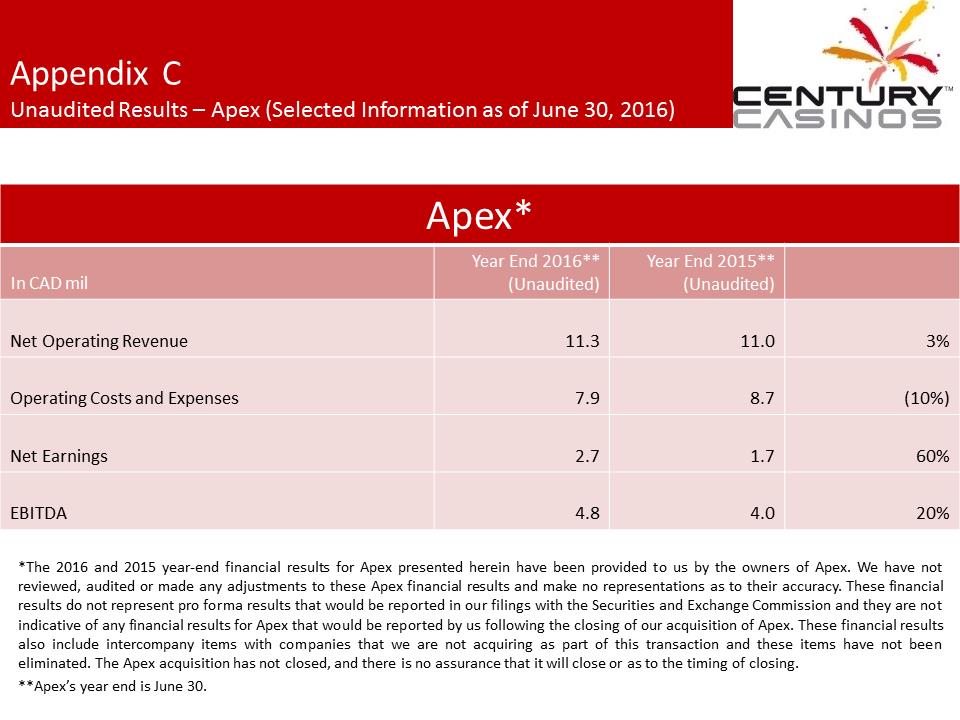 Appendix CUnaudited Results –Apex (Selected Information as of June 30, 2016)Apex*In CADmilYearEnd 2016** (Unaudited)YearEnd 2015** (Unaudited)Net Operating Revenue11.311.03%Operating Costs and Expenses7.98.7(10%)Net Earnings2.71.760%EBITDA4.84.020%*The2016and2015year-endfinancialresultsforApexpresentedhereinhavebeenprovidedtousbytheownersofApex.Wehavenotreviewed,auditedormadeanyadjustmentstotheseApexfinancialresultsandmakenorepresentationsastotheiraccuracy.ThesefinancialresultsdonotrepresentproformaresultsthatwouldbereportedinourfilingswiththeSecuritiesandExchangeCommissionandtheyarenotindicativeofanyfinancialresultsforApexthatwouldbereportedbyusfollowingtheclosingofouracquisitionofApex.Thesefinancialresultsalsoincludeintercompanyitemswithcompaniesthatwearenotacquiringaspartofthistransactionandtheseitemshavenotbeeneliminated.TheApexacquisitionhasnotclosed,andthereisnoassurancethatitwillcloseorastothetimingofclosing.**Apex’syearendisJune30.
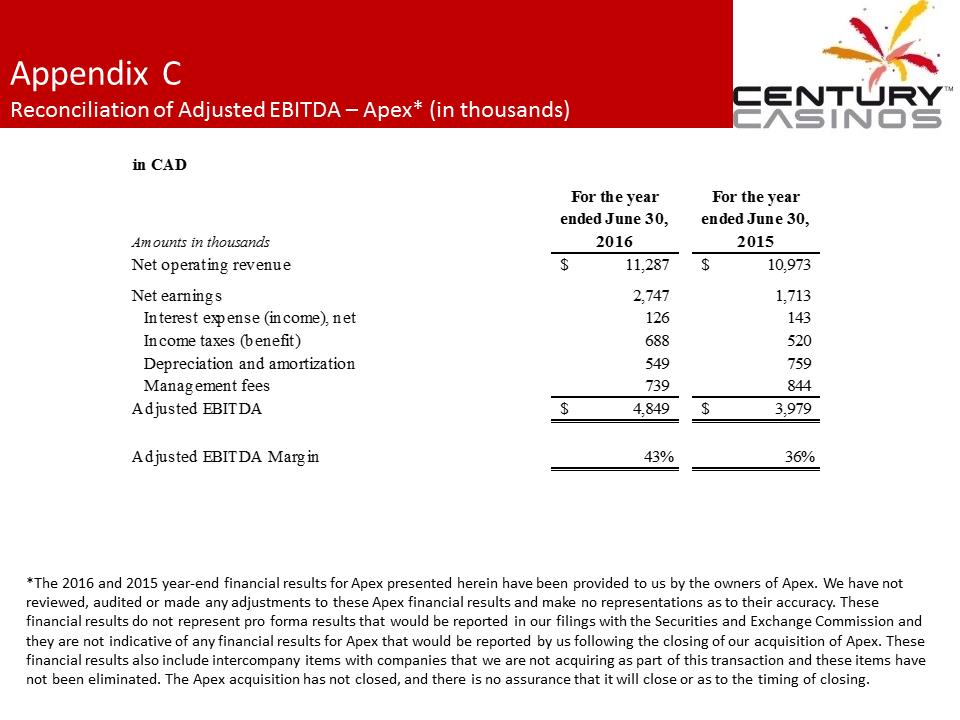 Appendix CReconciliation of Adjusted EBITDA –Apex* (in thousands) *The 2016 and 2015 year-end financial results for Apex presented herein have been provided to us by the owners of Apex. We have not reviewed, audited or made any adjustments to these Apex financial results and make no representations as to their accuracy. These financial results do not represent pro forma results that would be reported in our filings with the Securities and Exchange Commission and they are not indicative of any financial results for Apex that would be reported by us following the closing of our acquisition of Apex. These financial results also include intercompany items with companies that we are not acquiring as part of this transaction and theseitems have not been eliminated. The Apex acquisition has not closed, and there is no assurance that it will close or as to the timing ofclosing.