Attached files
| file | filename |
|---|---|
| EX-99.1 - EXHIBIT 99.1 - Shutterstock, Inc. | a2016-q2_exx991.htm |
| 8-K - 8-K - Shutterstock, Inc. | a2016-q2_8xkdocument.htm |
Second Quarter 2016 Summary
August 4, 2016
2
This presentation contains “forward-looking” statements within the meaning of the Private Securities Litigation Reform Act
of 1995 that are based on our management’s beliefs and assumptions and on information currently available to
management. Forward-looking statements include information concerning our possible or assumed future results of
operations, business strategies, financing plans, competitive position, industry environment, potential growth opportunities,
potential market opportunities and the effects of competition.
Forward-looking statements include all statements that are not historical facts and can be identified by terms such as
“anticipates,” “believes,” “could,” “seeks,” “estimates,” “intends,” “may,” “plans,” “potential,” “predicts,” “projects,” “should,”
“will,” “would” or similar expressions and the negatives of those terms. Forward-looking statements involve known and
unknown risks, uncertainties and other factors that may cause our actual results, performance or achievements to be
materially different from any future results, performance or achievements expressed or implied by the forward-looking
statements. Forward-looking statements represent our management’s beliefs and assumptions only as of the date of our
most recent public filings. You should read our public filings, including the Risk Factors set forth therein and the documents
that we have filed as exhibits to those filings, completely and with the understanding that our actual future results may be
materially different from what we currently expect. Except as required by law, we assume no obligation to update these
forward-looking statements publicly, or to update the reasons actual results could differ materially from those anticipated in
the forward-looking statements, even if new information becomes available in the future.
Safe Harbor Statement
3
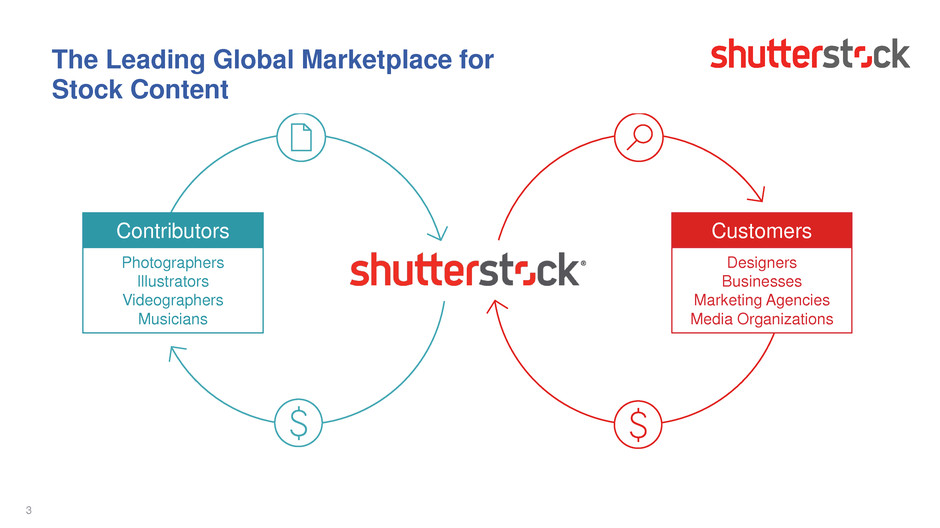
The Leading Global Marketplace for
Stock Content
Contributors
Photographers
Illustrators
Videographers
Musicians
Customers
Designers
Businesses
Marketing Agencies
Media Organizations
4
- Revenue increased 19% to $124.4 million
- Revenue increased approximately 22% excluding the impact of currency primarily driven by new
customers, an increase in paid downloads and higher activity from enterprise clients
- Income from Operations increased 8% to $10.5 million and Adjusted EBITDA increased 9% to
$22.5 million
- Adjusted EBITDA increased approximately 15% excluding the impact of currency; revenue growth
was partially offset by higher operating expenses due primarily to royalty costs associated with
the increase in paid downloads as well as higher personnel expenses to support growth initiatives
- GAAP Net Income available to common stockholders increased 36% to $7.2 million
- Non-GAAP net income during the quarter increased 13% to $12.7 million
- Cash, cash equivalents and short term investments of $266 million at quarter end; generated $9.3
million of free cash flow during the quarter
- Repurchased $16.3 million of stock under the $100 million share repurchase program
Q2’16 Financial Highlights
5
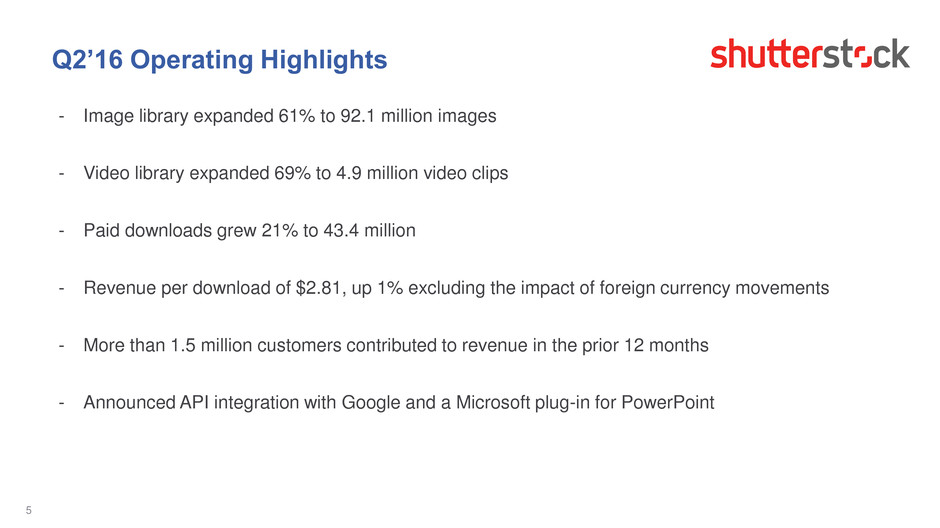
- Image library expanded 61% to 92.1 million images
- Video library expanded 69% to 4.9 million video clips
- Paid downloads grew 21% to 43.4 million
- Revenue per download of $2.81, up 1% excluding the impact of foreign currency movements
- More than 1.5 million customers contributed to revenue in the prior 12 months
- Announced API integration with Google and a Microsoft plug-in for PowerPoint
Q2’16 Operating Highlights
Consolidated Financial Results
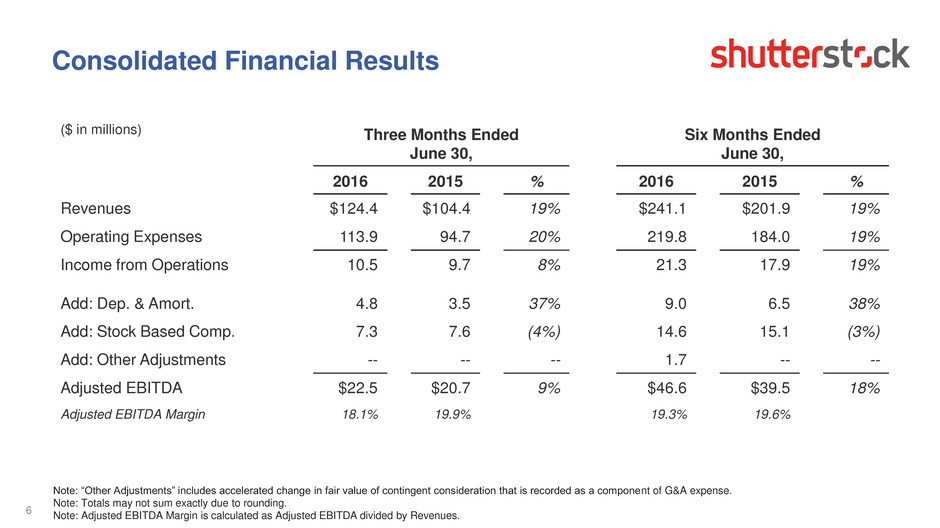
($ in millions) Three Months Ended
June 30,
Six Months Ended
June 30,
2016 2015 % 2016 2015 %
Revenues $124.4 $104.4 19% $241.1 $201.9 19%
Operating Expenses 113.9 94.7 20% 219.8 184.0 19%
Income from Operations 10.5 9.7 8% 21.3 17.9 19%
Add: Dep. & Amort. 4.8 3.5 37% 9.0 6.5 38%
Add: Stock Based Comp. 7.3 7.6 (4%) 14.6 15.1 (3%)
Add: Other Adjustments -- -- -- 1.7 -- --
Adjusted EBITDA $22.5 $20.7 9% $46.6 $39.5 18%
Adjusted EBITDA Margin 18.1% 19.9% 19.3% 19.6%
6
Note: “Other Adjustments” includes accelerated change in fair value of contingent consideration that is recorded as a component of G&A expense.
Note: Totals may not sum exactly due to rounding.
Note: Adjusted EBITDA Margin is calculated as Adjusted EBITDA divided by Revenues.
Key Financial Results
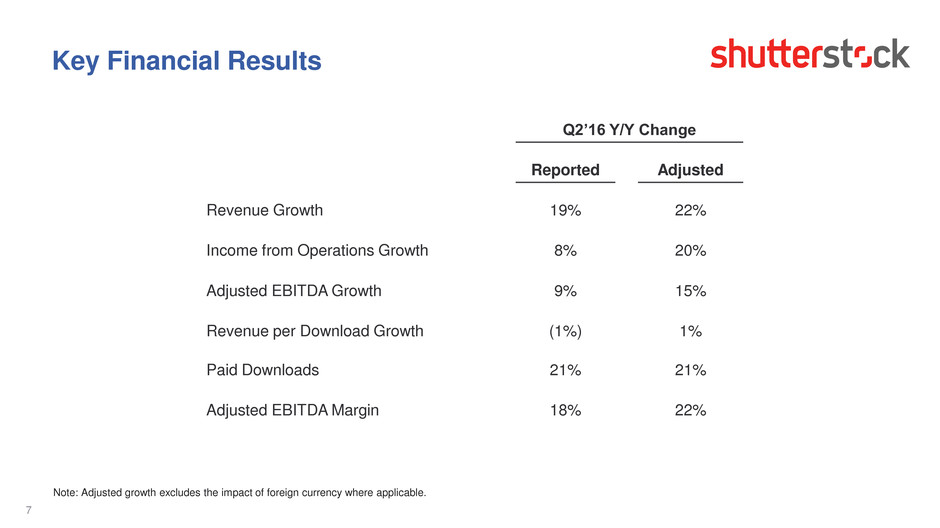
Q2’16 Y/Y Change
Reported Adjusted
Revenue Growth 19% 22%
Income from Operations Growth 8% 20%
Adjusted EBITDA Growth 9% 15%
Revenue per Download Growth (1%) 1%
Paid Downloads 21% 21%
Adjusted EBITDA Margin 18% 22%
Note: Adjusted growth excludes the impact of foreign currency where applicable.
7
Free Cash Flow
8
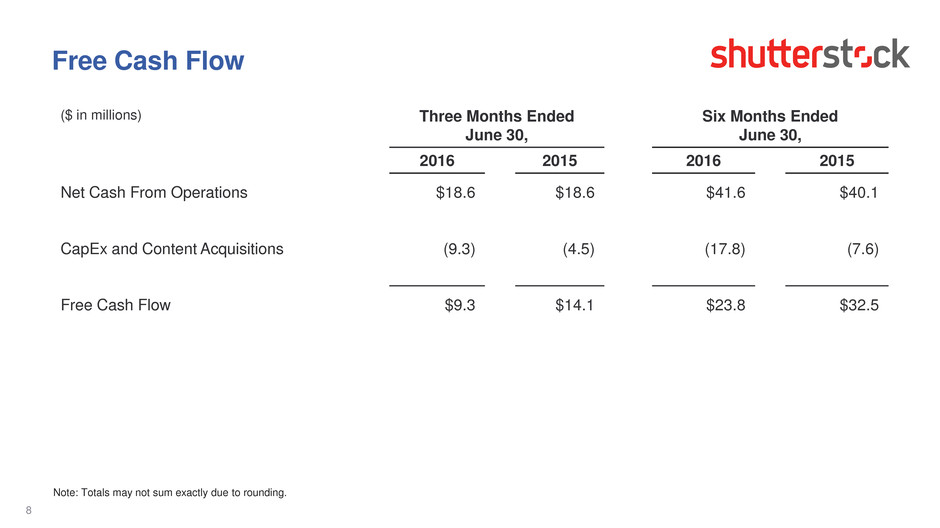
($ in millions)
Three Months Ended
June 30,
Six Months Ended
June 30,
2016 2015 2016 2015
Net Cash From Operations $18.6 $18.6 $41.6 $40.1
CapEx and Content Acquisitions (9.3) (4.5) (17.8) (7.6)
Free Cash Flow $9.3 $14.1 $23.8 $32.5
Note: Totals may not sum exactly due to rounding.
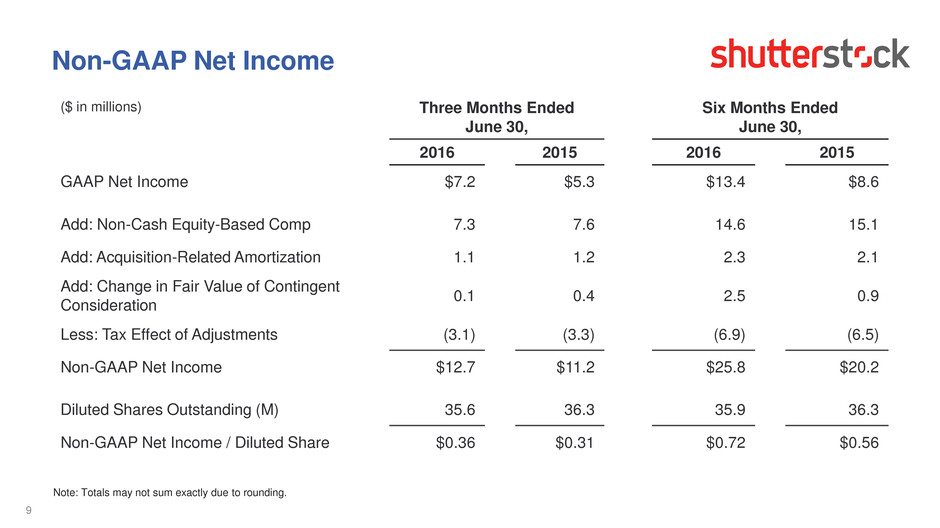
Non-GAAP Net Income
9
($ in millions)
Three Months Ended
June 30,
Six Months Ended
June 30,
2016 2015 2016 2015
GAAP Net Income $7.2 $5.3 $13.4 $8.6
Add: Non-Cash Equity-Based Comp 7.3 7.6 14.6 15.1
Add: Acquisition-Related Amortization 1.1 1.2 2.3 2.1
Add: Change in Fair Value of Contingent
Consideration
0.1 0.4 2.5 0.9
Less: Tax Effect of Adjustments (3.1) (3.3) (6.9) (6.5)
Non-GAAP Net Income $12.7 $11.2 $25.8 $20.2
Diluted Shares Outstanding (M) 35.6 36.3 35.9 36.3
Non-GAAP Net Income / Diluted Share $0.36 $0.31 $0.72 $0.56
Note: Totals may not sum exactly due to rounding.
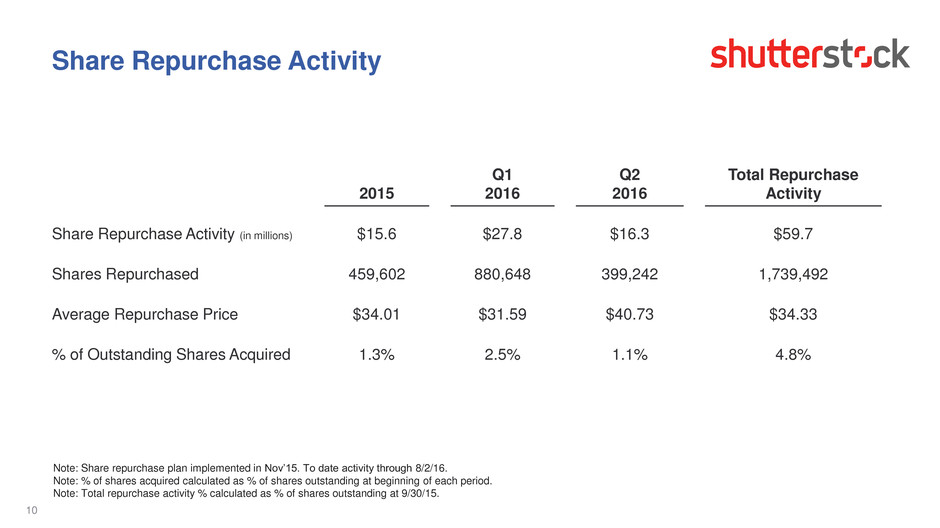
Share Repurchase Activity
10
Note: Share repurchase plan implemented in Nov’15. To date activity through 8/2/16.
Note: % of shares acquired calculated as % of shares outstanding at beginning of each period.
Note: Total repurchase activity % calculated as % of shares outstanding at 9/30/15.
2015
Q1
2016
Q2
2016
Total Repurchase
Activity
Share Repurchase Activity (in millions) $15.6 $27.8 $16.3 $59.7
Shares Repurchased 459,602 880,648 399,242 1,739,492
Average Repurchase Price $34.01 $31.59 $40.73 $34.33
% of Outstanding Shares Acquired 1.3% 2.5% 1.1% 4.8%
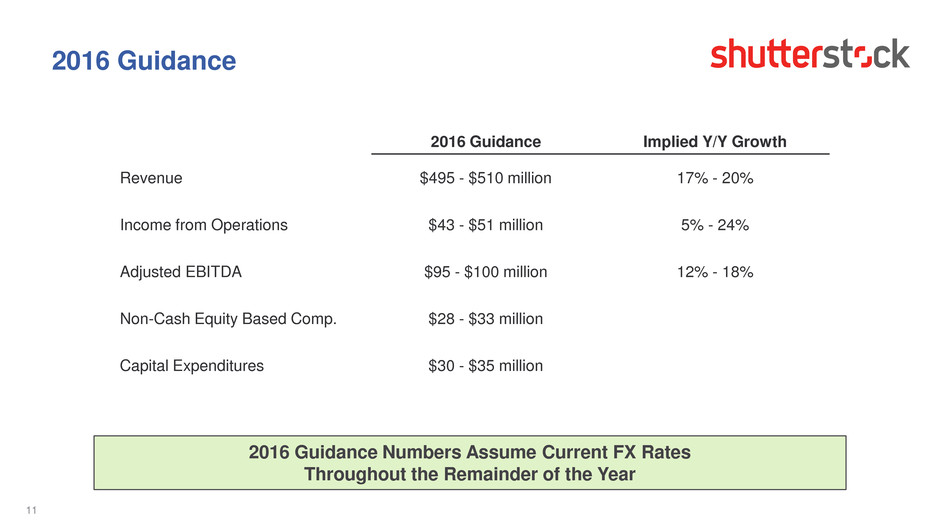
2016 Guidance
2016 Guidance Implied Y/Y Growth
Revenue $495 - $510 million 17% - 20%
Income from Operations $43 - $51 million 5% - 24%
Adjusted EBITDA $95 - $100 million 12% - 18%
Non-Cash Equity Based Comp. $28 - $33 million
Capital Expenditures $30 - $35 million
11
2016 Guidance Numbers Assume Current FX Rates
Throughout the Remainder of the Year
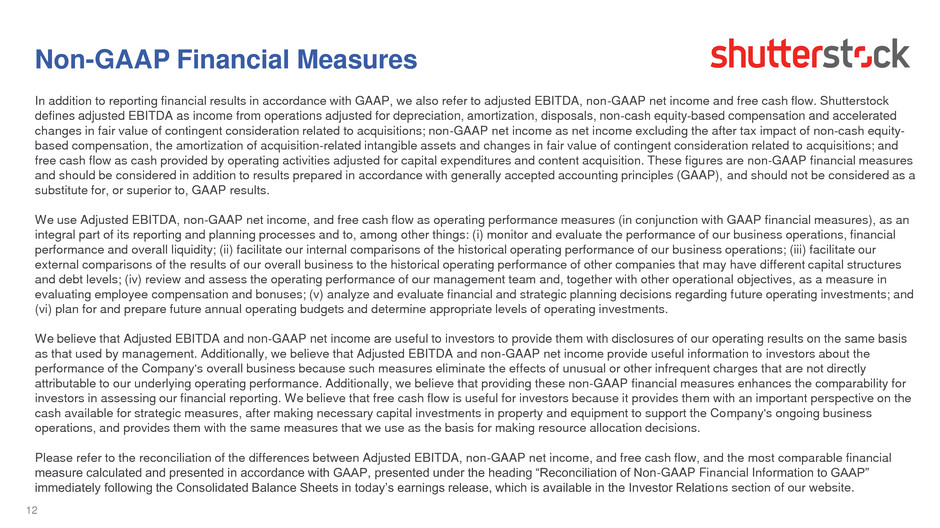
In addition to reporting financial results in accordance with GAAP, we also refer to adjusted EBITDA, non-GAAP net income and free cash flow. Shutterstock
defines adjusted EBITDA as income from operations adjusted for depreciation, amortization, disposals, non-cash equity-based compensation and accelerated
changes in fair value of contingent consideration related to acquisitions; non-GAAP net income as net income excluding the after tax impact of non-cash equity-
based compensation, the amortization of acquisition-related intangible assets and changes in fair value of contingent consideration related to acquisitions; and
free cash flow as cash provided by operating activities adjusted for capital expenditures and content acquisition. These figures are non-GAAP financial measures
and should be considered in addition to results prepared in accordance with generally accepted accounting principles (GAAP), and should not be considered as a
substitute for, or superior to, GAAP results.
We use Adjusted EBITDA, non-GAAP net income, and free cash flow as operating performance measures (in conjunction with GAAP financial measures), as an
integral part of its reporting and planning processes and to, among other things: (i) monitor and evaluate the performance of our business operations, financial
performance and overall liquidity; (ii) facilitate our internal comparisons of the historical operating performance of our business operations; (iii) facilitate our
external comparisons of the results of our overall business to the historical operating performance of other companies that may have different capital structures
and debt levels; (iv) review and assess the operating performance of our management team and, together with other operational objectives, as a measure in
evaluating employee compensation and bonuses; (v) analyze and evaluate financial and strategic planning decisions regarding future operating investments; and
(vi) plan for and prepare future annual operating budgets and determine appropriate levels of operating investments.
We believe that Adjusted EBITDA and non-GAAP net income are useful to investors to provide them with disclosures of our operating results on the same basis
as that used by management. Additionally, we believe that Adjusted EBITDA and non-GAAP net income provide useful information to investors about the
performance of the Company's overall business because such measures eliminate the effects of unusual or other infrequent charges that are not directly
attributable to our underlying operating performance. Additionally, we believe that providing these non-GAAP financial measures enhances the comparability for
investors in assessing our financial reporting. We believe that free cash flow is useful for investors because it provides them with an important perspective on the
cash available for strategic measures, after making necessary capital investments in property and equipment to support the Company's ongoing business
operations, and provides them with the same measures that we use as the basis for making resource allocation decisions.
Please refer to the reconciliation of the differences between Adjusted EBITDA, non-GAAP net income, and free cash flow, and the most comparable financial
measure calculated and presented in accordance with GAAP, presented under the heading “Reconciliation of Non-GAAP Financial Information to GAAP”
immediately following the Consolidated Balance Sheets in today’s earnings release, which is available in the Investor Relations section of our website.
Non-GAAP Financial Measures
12
