Attached files
| file | filename |
|---|---|
| EX-99.1 - Q2 2016 EARNINGS RELEASE - CINCINNATI BELL INC | earningsreleaseq22016.htm |
| 8-K - CINCINNATI BELL INC. 8-K - CINCINNATI BELL INC | a8-kearningsreleaseshellq2.htm |

Cincinnati Bell
Second Quarter 2016 Results
August 4, 2016

Today's Agenda
Highlights, Segment Results and Financial Overview
Ted Torbeck, President & Chief Executive Officer
Question & Answer
2

Safe Harbor
This presentation and the documents incorporated by reference herein contain forward-looking statements regarding
future events and our future results that are subject to the “safe harbor” provisions of the Private Securities
Litigation Reform Act of 1995. All statements, other than statements of historical facts, are statements that could be
deemed forward-looking statements. These statements are based on current expectations, estimates, forecasts, and
projections about the industries in which we operate and the beliefs and assumptions of our management. Words
such as “expects,” “anticipates,” “predicts,” “projects,” “intends,” “plans,” “believes,” “seeks,” “estimates,”
“continues,” “endeavors,” “strives,” “may,” variations of such words and similar expressions are intended to identify
such forward-looking statements. In addition, any statements that refer to projections of our future financial
performance, our anticipated growth and trends in our businesses, and other characterizations of future events or
circumstances are forward-looking statements. Readers are cautioned these forward-looking statements are based
on current expectations and assumptions that are subject to risks and uncertainties, which could cause our actual
results to differ materially and adversely from those reflected in the forward-looking statements. Factors that could
cause or contribute to such differences include, but are not limited to, those discussed in this release and those
discussed in other documents we file with the Securities and Exchange Commission (SEC). More information on
potential risks and uncertainties is available in our recent filings with the SEC, including Cincinnati Bell’s Form 10-K
report, Form 10-Q reports and Form 8-K reports. Actual results may differ materially and adversely from those
expressed in any forward-looking statements. We undertake no obligation to revise or update any forward-looking
statements for any reason.
3

Non-GAAP Financial Measures
This presentation contains information about adjusted earnings before interest, taxes, depreciation and amortization
(Adjusted EBITDA), Adjusted EBITDA margin, net debt and free cash flow. These are non-GAAP financial measures
used by Cincinnati Bell management when evaluating results of operations and cash flow. Management believes
these measures also provide users of the financial statements with additional and useful comparisons of current
results of operations and cash flows with past and future periods. Non-GAAP financial measures should not be
construed as being more important than comparable GAAP measures. Detailed reconciliations of Adjusted EBITDA,
net debt and free cash flow (including the Company’s definition of these terms) to comparable GAAP financial
measures can be found in the earnings release on our website at www.cincinnatibell.com within the Investor
Relations section.
4

Ted Torbeck
President & Chief Executive Officer
5

Highlights and Financial Overview
$182
$70
$106
$10
$(5)$(2)
$192
$72
$110
$10
$(6)$(3)
6
Entertainment & Communications IT Services & Hardware Eliminations Corporate
Revenue RevenueAdjusted
EBITDA
(Non-GAAP)
Adjusted
EBITDA
(Non-GAAP)
$286 $299
$75 $76
Q2 2015 Q2 2016
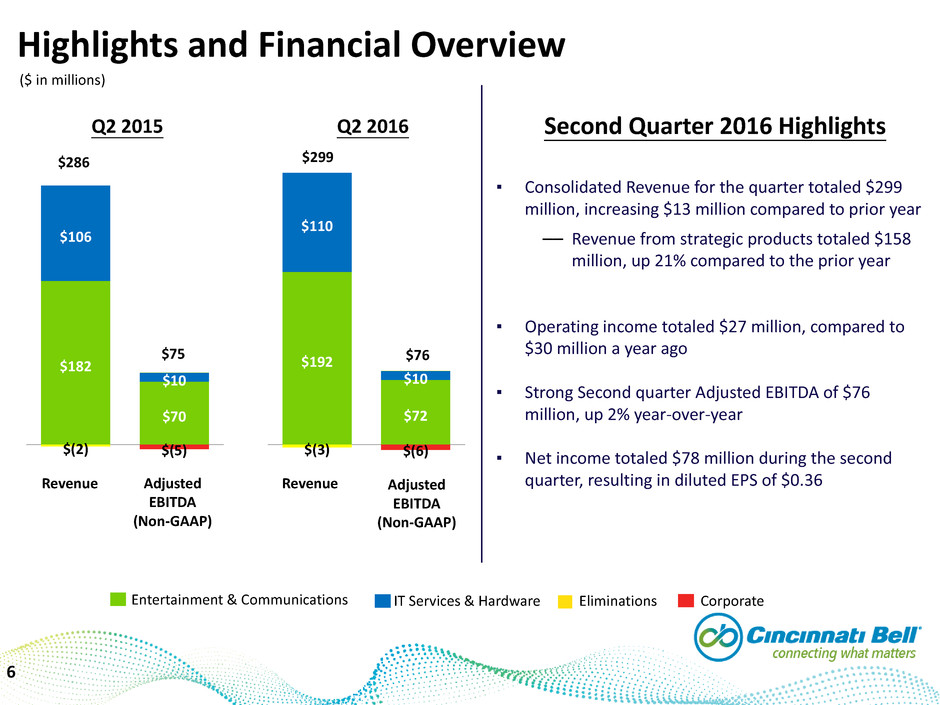
▪ Consolidated Revenue for the quarter totaled $299
million, increasing $13 million compared to prior year
Revenue from strategic products totaled $158
million, up 21% compared to the prior year
▪ Operating income totaled $27 million, compared to
$30 million a year ago
▪ Strong Second quarter Adjusted EBITDA of $76
million, up 2% year-over-year
▪ Net income totaled $78 million during the second
quarter, resulting in diluted EPS of $0.36
Second Quarter 2016 Highlights
($ in millions)
__

Revenue Adj. EBITDA (Non-GAAP) Adj. EBITDA Margin (Non-GAAP)
Q2 2015 Q3 2015 Q4 2015 Q1 2016 Q2 2016
$182 $185 $188 $190 $192
$70 $68 $69 $72 $72
39%
37% 37%
38% 38%
Entertainment & Communications Revenue and Adjusted EBITDA
7
▪ Strategic revenues for the quarter totaled $111
million, up 26% year-over-year
▪ Operating income totaled $27 million in the
quarter, compared to $30 million in the prior year
▪ Adjusted EBITDA totaled $72 million in the second
quarter, resulting in Adjusted EBITDA margins of
38%
▪ Total internet subscribers of 296,700 at the end of the
second quarter, up 21,600 subs compared to a year ago
▪ Voice line loss was 2% – improved from 5% in the prior year
Business lines increased 2%
Residential line decreased 7%
__
__
($ in millions)

Legacy IntegrationStrategic
[1]
8
Q2 2015 Q2 2016
$42 $49
$56 $48
Entertainment & Communications Business & Consumer Markets
$99 $97
Business & Carrier Market Revenue
Entertainment & Communications Business Integration revenue totaled $1 million in Q2 2015
Entertainment & Communications Consumer Integration revenue totaled $1 million in Q2 2015 and Q2 2016
[1]
Consumer Market Revenue
Q2 2015 Q2 2016
$46
$62
$36
$32
$83
$95
▪ Fioptics revenue growth continues to more than offset legacy
declines
▪ Business revenue totaled $71 million, consistent with the prior
year
▪ Carrier revenue was $26 million, down $2 million from 2015
due to lower switched access revenue and one-time projects
completed in the prior year
($ in millions)
Y/Y
(14)%
16%
Y/Y
(11)%
36%

9
Q2 2015 Q2 2016
$23
$31
$16
$24$6
$7
$45
$62
Fioptics Update
Fioptics Revenue Total Fioptics Subscribers
Video Internet Voice
▪ Fioptics monthly ARPU for the quarter was up approximately
6% from 2015. Q2 2016 ARPUs are as follows:
Video – $83, Internet – $47, Voice – $28
__
__
__
($ in millions)
Y/Y
17%
49%
35%
Q2 2015 Q2 2016
102
127132
175
69
87
▪ Fioptics is available to 479 thousand addresses, or 60% of
Greater Cincinnati
Passed 25 thousand new addresses in Q2 2016
▪ Fioptics Penetration:
Video – 27%, Internet – 37%, Voice – 18%
▪ Total video churn was 2.5% for the quarter
Single-family churn was 2.1%
Apartment churn was 4.9%

Strategic Revenue Integration Revenue Adj. EBITDA (Non-GAAP) Adj. EBITDA Margin (Non-GAAP)
Q2 2015 Q3 2015 Q4 2015 Q1 2016 Q2 2016
$45 $46 $48 $48 $49
$61 $71 $56 $55 $61
$10 $10 $9 $10 $10
9% 9% 9% 10% 9%
IT Services & Hardware Revenue and Adjusted EBITDA
10
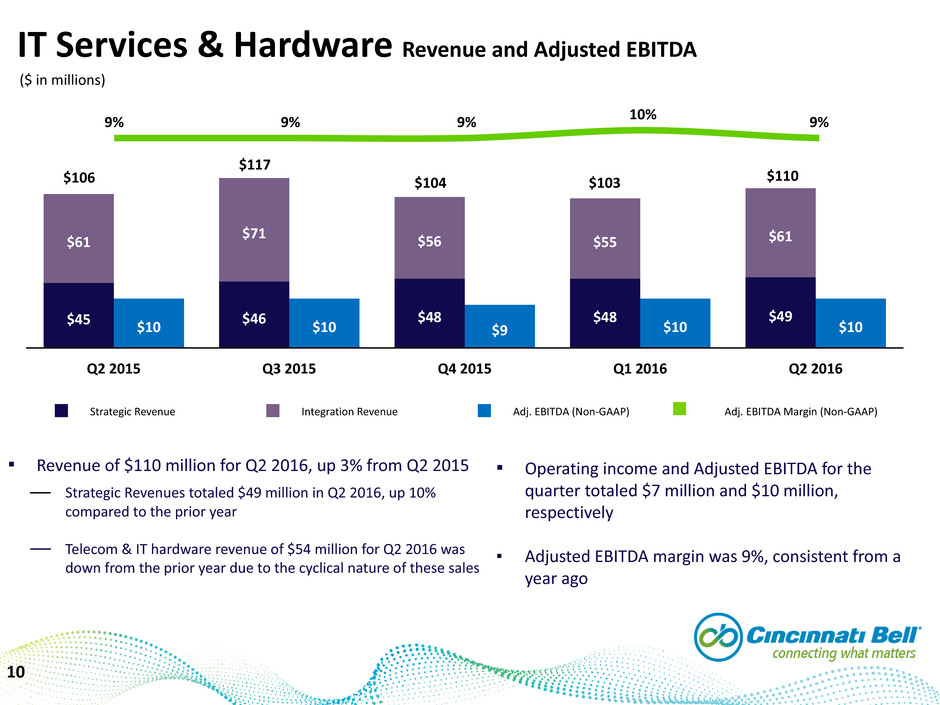
▪ Revenue of $110 million for Q2 2016, up 3% from Q2 2015
Strategic Revenues totaled $49 million in Q2 2016, up 10%
compared to the prior year
Telecom & IT hardware revenue of $54 million for Q2 2016 was
down from the prior year due to the cyclical nature of these sales
▪ Operating income and Adjusted EBITDA for the
quarter totaled $7 million and $10 million,
respectively
▪ Adjusted EBITDA margin was 9%, consistent from a
year ago
$106
$117
$104 $103 $110
__
__
($ in millions)

Q2 2016 Cash Flow and Capital Expenditures
Free Cash Flow (Non-GAAP)
Capital Expenditures
Q2 2016 YTD 2016
Adjusted EBITDA (Non-GAAP) $ 76 $ 153
Interest Payments (34) (42)
Capital Expenditures (60) (122)
Pension and OPEB Payments (2) (5)
Dividends from CyrusOne 3 5
Working Capital and Other (9) (7)
Free Cash Flow (Non-GAAP) $ (26) $ (18)
Selected 2016 Free Cash Flow Items
▪ CyrusOne dividends ~ $8 million
▪ Capital expenditures: $265 - $275 million
▪ Interest payments ~ $75 million
▪ Pension and OPEB payments ~ $12 million
Q2 2016 YTD 2016
Construction $ 20 $ 37
Installation 8 21
Value Added 4 11
Total Fioptics $ 32 $ 69
Other Strategic 15 32
Discretionary Investments 47 101
Maintenance 13 21
$ 60 $ 122
11
($ in millions)
Cash Flow
Q2 2016 YTD 2016
Operating Activities $ 32 $ 98
Investing Activities 86 25
Financing Activities (116) (121)
Change in Cash 2 2

2016 Guidance
2016 Guidance
Revenue $ 1.2 billion
Adjusted EBITDA $303 million*
* Plus or minus 2 percent
12

Appendix
13

Consolidated Results
($ in millions, except per share amounts)
Three Months Ended Six Months Ended
June 30, June 30,
2016 2015 2016 2015
Revenue $ 299.2 $ 285.8 $ 588.1 $ 578.7
Costs and expenses
Cost of services and products 170.8 162.2 333.5 328.4
Selling, general and administrative 56.2 57.0 109.4 109.2
Depreciation and amortization 44.8 34.0 88.2 66.6
Other — 2.9 — 7.7
Operating Income 27.4 29.7 57.0 66.8
Interest expense 19.9 28.0 40.2 60.7
Gain on extinguishment of debt 5.2 13.5 2.8 13.5
Gain on sale of CyrusOne investment (118.6) (295.2) (118.6) (295.2)
Other (income) expense, net (1.1) 1.3 (1.1) 4.8
Income from continuing operations before income taxes 122.0 282.1 133.7 283.0
Income tax expense 44.4 101.4 49.1 102.0
Income from continuing operations 77.6 180.7 84.6 181.0
Income from discontinued operations, net of tax — 10.9 — 59.8
Net income 77.6 191.6 84.6 240.8
Preferred stock dividends 2.6 2.6 5.2 5.2
Net income applicable to common shareholders $ 75.0 $ 189.0 $ 79.4 $ 235.6
Basic and diluted net earnings per common share
Earnings from continuing operations $ 0.36 $ 0.85 $ 0.38 $ 0.84
Earnings from discontinued operations — 0.05 — 0.29
Basic and diluted net earnings per common share $ 0.36 $ 0.90 $ 0.38 $ 1.13
.
14

Revenue Classifications - Entertainment and Communications
Strategic Legacy Integration
Data
Voice
Video
Services and Other
Fioptics Internet
DSL (1) (> 10 meg)
Ethernet
Private Line
MPLS (2)
SONET (3)
Dedicated Internet Access
Wavelength
Audio Conferencing
Fioptics Voice
VoIP (4)
Fioptics Video
Wiring Projects
DSL (< 10 meg)
DS0 (5), DS1, DS3
TDM (6)
Traditional Voice
Long Distance
Switched Access
Digital Trunking
Advertising
Directory Assistance
Maintenance
Information Services
Wireless Handsets and
Accessories
15
(1) Digital Subscriber Line
(2) Multi-Protocol Label Switching
(3) Synchronous Optical Network
(4) Voice of Internet Protocol
(5) Digital Signal
(6) Time Division Multiplexing

Revenue Classifications - IT Services and Hardware
Professional Services
Unified Communications
Cloud Services
Monitoring and Management
Telecom & IT Hardware
Strategic Integration
Consulting
Staff Augmentation
Voice Monitoring
Managed IP Telephony Solutions
Virtual Data Centers
Storage
Backup
Network Monitoring/Management
Security
Installation
Maintenance
Hardware
Software Licenses
16

Revenue – MD&A Strategic, Legacy and Integration
($ in millions) Q2 2016
Entertainment and
Communications
IT Services and
Hardware Total Eliminations Total
Strategic
Data $ 60.8 $ —
Voice 17.9 —
Video 30.9 —
Services and other 1.4 —
Professional services — 23.1
Management and monitoring — 7.9
Unified communications — 7.3
Cloud services — 10.8
Total Strategic 111.0 49.1 160.1 (2.4) 157.7
Legacy
Data $ 26.0 $ —
Voice 51.2 —
Services and other 2.8 —
Total Legacy 80.0 — 80.0 (0.1) 79.9
Integration
Services and other $ 1.5 $ —
Professional services — 4.1
Unified communications — 2.8
Telecom and IT hardware — 53.8
Total Integration 1.5 60.7 62.2 (0.6) 61.6
$ 192.5 $ 109.8 $ 302.3 $ (3.1) $ 299.2
Eliminations 0.2 2.9 3.1
Total Revenue $ 192.3 $ 106.9 $ 299.2
17

Revenue – MD&A Strategic, Legacy and Integration
($ in millions) Q2 2015
Entertainment and
Communications
IT Services and
Hardware Total Eliminations Total
Strategic
Data $ 47.9 $ —
Voice 15.5 —
Video 22.9 —
Services and other 1.5 —
Professional services — 23.5
Management and monitoring — 7.6
Unified communications — 6.5
Cloud services — 7.0
Total Strategic 87.8 44.6 132.4 (2.2) 130.2
Legacy
Data $ 30.9 $ —
Voice 58.0 —
Services and other 3.4 —
Total Legacy 92.3 — 92.3 (0.1) 92.2
Integration
Services and other $ 2.3 $ —
Professional services — 3.5
Unified communications — 2.6
Telecom and IT hardware — 55.6
Total Integration 2.3 61.7 64.0 (0.6) 63.4
$ 182.4 $ 106.3 $ 288.7 $ (2.9) $ 285.8
Eliminations 0.4 2.5 2.9
Total Revenue $ 182.0 $ 103.8 $ 285.8
18

Revenue – MD&A Strategic, Legacy and Integration
($ in millions) YTD Q2 2016
Entertainment and
Communications
IT Services and
Hardware Total Eliminations Total
Strategic
Data $ 118.9 $ —
Voice 35.1 —
Video 59.9 —
Services and other 2.7 —
Professional services — 45.4
Management and monitoring — 16.0
Unified communications — 14.8
Cloud services — 21.0
Total Strategic 216.6 97.2 313.8 (4.6) 309.2
Legacy
Data $ 53.1 $ —
Voice 104.2 —
Services and other 5.9 —
Total Legacy 163.2 — 163.2 (0.4) 162.8
Integration
Services and other $ 3.0 $ —
Professional services — 8.0
Unified communications — 5.4
Telecom and IT hardware — 101.7
Total Integration 3.0 115.1 118.1 (2.0) 116.1
$ 382.8 $ 212.3 $ 595.1 $ (7.0) $ 588.1
Eliminations 0.6 6.4 7.0
Total Revenue $ 382.2 $ 205.9 $ 588.1
19

Revenue – MD&A Strategic, Legacy and Integration
($ in millions) YTD Q2 2015
Entertainment and
Communications
IT Services and
Hardware Total Eliminations Total
Strategic
Data $ 96.3 $ —
Voice 30.2 —
Video 44.3 —
Services and other 3.2 —
Professional services — 44.1
Management and monitoring — 14.9
Unified communications — 13.2
Cloud services — 13.1
Total Strategic 174.0 85.3 259.3 (4.3) 255.0
Legacy
Data $ 63.7 $ —
Voice 119.0 —
Services and other 7.2 —
Total Legacy 189.9 — 189.9 (0.3) 189.6
Integration
Services and other $ 6.6 $ —
Professional services — 7.0
Unified communications — 5.5
Telecom and IT hardware — 116.1
Total Integration 6.6 128.6 135.2 (1.1) 134.1
$ 370.5 $ 213.9 $ 584.4 $ (5.7) $ 578.7
Eliminations 0.7 5.0 5.7
Total Revenue $ 369.8 $ 208.9 $ 578.7
20
